28
KENYA HIV ESTIMATES 2014
KENYA HIV ESTIMATES
2014

Acknowledgements:
Task force members for National HIV Estimates Taskforce1. Patrick Muriithi NACC2. Joyce Wamicwe NASCOP3. Gurumurthy Rangaiyan UNAIDS4. Joshua Gitonga NACC5. Davis Kimanga EGPAF6. Ruth Masha UNAIDS7. Brian Pazvakavambwa WHO8. Ulrike Gilbert UNICEF9. Jacob Odhiambo NASCOP (MoH)10. James Muttunga KEMRI11. Lucy Kiruri NACC12. Mercy Khasiani NACC13. Fridah Muinde NACC14. Parinita B UoN/TSU15. Shobha Vakil NASCOP16. Tom Oluoch CDC17. Andrea Kim CDC
Design and Layout: Peter Cheseret, Mercy Mwongeli
KENYA HIV ESTIMATESJune 2014

Kenya has a number of information sources on HIV prevalence levels and trends. Four national surveys, the Kenya Demographic and Health Survey of 20031 (KDHS 2003), the Kenya AIDS Indicator Survey 20072 (KAIS 2007), the Kenya Demographic and Health Survey of 2008/93 and the Kenya AIDS Indicator Survey 20124 provide good estimates of national prevalence for those four years and the trend between those years.
1 Central Bureau of Statistics (CBS) [Kenya], Ministry of Health (MOH) {Kenya], and ORC Macro. 2004. Kenya Demographic and Health Survey 2003. Calverton, Maryland” CBS, MOH and ORC Macro.
2 National AIDS and STD Control Programme, Ministry of Health, Kenya. July 2008. Kenya AIDS Indica-tor Survey 2007: Preliminary Report. Nairobi, Kenya.
3 KNBS [Kenya] 2009. Kenya Demographic and Health Survey 2008-09 Preliminary Report. Calverton, Maryland. KNBS, NACC, NASCOP, NPHLS, KMRI, NCAPD, ICF Macro, September 2009.
4 National AIDS and STI Control Programme, Kenya AIDS Indicator Survey 2012, Preliminary Report, September 2013
KENYA AIDS INDICATOR SURVEY 2012
PREL
IMIN
ARY
REP
OR
T
KENYA AIDS INDICATOR SURVEY 2012
Preliminary Report
Republic of Kenya
Demographic andHealth Survey
Kenya
2003
Kenya 2003 D
emographic and H
ealth Survey
Kenya
2008-09
Demographic and Health Survey
Kenya 2008-09
Dem
ographic and Health Survey
KAIS 2007 1

Kenya HIV Estimates Report, 2014 1
Table of Contents
Foreword ............................................................................................................................ 2Preface ............................................................................................................................... 3Executive Summary ............................................................................................................ 4Background ........................................................................................................................ 8Methods ............................................................................................................................. 9Results .............................................................................................................................. 10Anexes .............................................................................................................................. 21
List of Tables and Figures ....................................................................................................
TablesTable 1: National HIV estimates for 2014 .................................................................. 10Table 2. National HIV estimates with bounds (1990-2013) ........................................ 19Table 3: County HIV estimates for 2014 .................................................................... 20
Figures Figure 1: Sentinel Surveillance for Urban areas ......................................................... 10Figure 2: Prevalence Trend for Urban areas ............................................................... 11Figure 3: Sentinel Surveillance for Rural areas ........................................................... 11Figure 4: Prevalence Trend for Rural areas ................................................................ 12Figure 5: National Prevalence Trend ......................................................................... 12Figure 6: Spectrum estimate of all cause of Mortality compared to Vital statistics ... 13Figure 7: Spectrum estimates of prevalence by age compared to survey estimates 14Figure 8: Annual Number of HIV infections ............................................................... 15Figure 9: Distribution of HIV positive adults not on ART in 2007 .............................. 16Figure 10: HIV related deaths averted by ART .......................................................... 17Figure 11: Number of child infections averted by PMTCT ........................................ 17Figure 12: Adults HIV prevalence in counties ............................................................ 18
Kenya HIV Estimates Report, 20142
Foreword
The Ministry of Health has adopted an evidence-informed approach for advocacy, planning, and budgeting at the National and County levels for the HIV and AIDS response. Understanding trends in the HIV epidemic and the burden in different Counties is an important step in this approach. The successful implementation of the HIV prevention and treatment programme has shown positive results, with Kenya’s 2014 HIV estimates clearly indicating a decline in the trajectory of the HIV epidemic.
This 2014 HIV Estimates Report aims to provide an improved understanding of the HIV epidemic in Kenya, and offers important insights into the impact of various interventions. The estimates have been derived from many important data sources and benefit from National consultation and review with key stakeholders from the government, national and international organizations. The highlights of this report include a gradual decline in adult HIV incidence to an estimated 0.44% in 2013. When prevention programs achieve heightened awareness, significant changes in behaviour will occur. This is expected to lead to a significant reduction in the need for PMTCT services, as well as a reduction in the number of new HIV infections. There is therefore an urgent need to
scale up prevention programmes in an effort to continue reducing HIV incidence. A positive outcome of treatment scale up is the reduction in mortality, and a corresponding reduction in the number of AIDS orphans. Although prevalence still remains high at about 6%, a combination of increased awareness, scale up of prevention and treatment programs will lead to a sustained decline of HIV prevalence in Kenya. However, the wide geographic variation in HIV burden directs us to redouble our efforts and commitment to further reduce the burden of HIV and AIDS.
The Estimates Report process was coordinated by a Technical Working Group on HIV estimates with experts from NACC, NASCOP, KNBS, KEMRI, Future Institute, UNAIDS, CDC, and WHO under the overall coordination of National AIDS Control Council. I give particular thanks all the experts from these organizations.
John Stover from Futures Institute is thanked for his guidance and technical support, as well as UNAIDS for their financial and technical support during this process. My special appreciation goes to Dr Patrick Murethi and Dr Joyce Njeri for their contributions in coordinating the HIV estimates process and disseminating the results. I am sure that this report will be useful to programme managers, epidemiologists and researchers across the country.
Mr. James Macharia,Cabinet Secretary, Ministry of Health, Government of Kenya
Kenya has a number of information sources on HIV prevalence levels and trends, Understanding trends in the HIV epidemic and the burden in different Counties is important in management of the epidemic.

Kenya HIV Estimates Report, 2014 3
Preface
The National AIDS Control Council in consultation with the national and international epidemiologists, demographers, public health experts and monitoring and evaluation specialists undertakes estimation of HIV burden annually. Futures Institute and UNAIDS provide continuous technical support to this process. The estimates are based on data from Kenya Demographic Health Surveys, Kenya AIDs Indicator Surveys, HIV Sentinel Surveillance among pregnant women, data from programmes and census. The estimates use the Estimation and Projection Package and Spectrum tools as recommended by the UNAIDS Reference Group on Estimates, Modelling and Projections
The HIV Estimates bring forth a sound reflection on the existing nature of HIV burden and trajectory of the HIV epidemic in the form of prevalence, new infections, AIDS orphans and related deaths. With adult (15-49 years) HIV prevalence estimated at about 6% in 2013 and approximately 1.6 million people living with HIV, Kenya has succeeded in reducing the epidemic through focused interventions. However, nine Counties contribute 65% of the total national new HIV infections, and some Counties have hyper-endemic prevalence levels that compare to Southern African countries. The details of these and other indicators are provided in this report. The robust estimates generated for Kenya and the 47 Counties are a rich resource for county level planning, estimating the resource needs and for developing strategies for scaling up high impact interventions.
Although Kenya’s progression in the AIDS response is unambiguous, the gains need to be capitalised.
Kenya must sustain its efforts and move forward in achieving National and internationally committed targets. Considering the varied nature of the epidemic across the Counties, and endeavouring to implement a range of essential HIV programmes on a population wide scale based on a sound evidence base, can Kenya meet the challenge of realising zero new infections?
In order to achieve this goal and free future generations from AIDS, we require leadership, political commitment, civil society participation, knowledge capital generation, financial resources, innovations in developing new and affordable medicines and preventive technologies. We also need to tackle the fundamental drivers of the epidemic, particularly gender inequality, poverty, stigma and discrimination in family and health service settings. In doing so, we will achieve our goals.
Director,National AIDS Control Council
The HIV Estimates bring forth a sound reflection on the existing nature of HIV burden and trajectory of the HIV epidemic in the form of prevalence, new infections, AIDS orphans and related deaths.
Kenya HIV Estimates Report, 20144
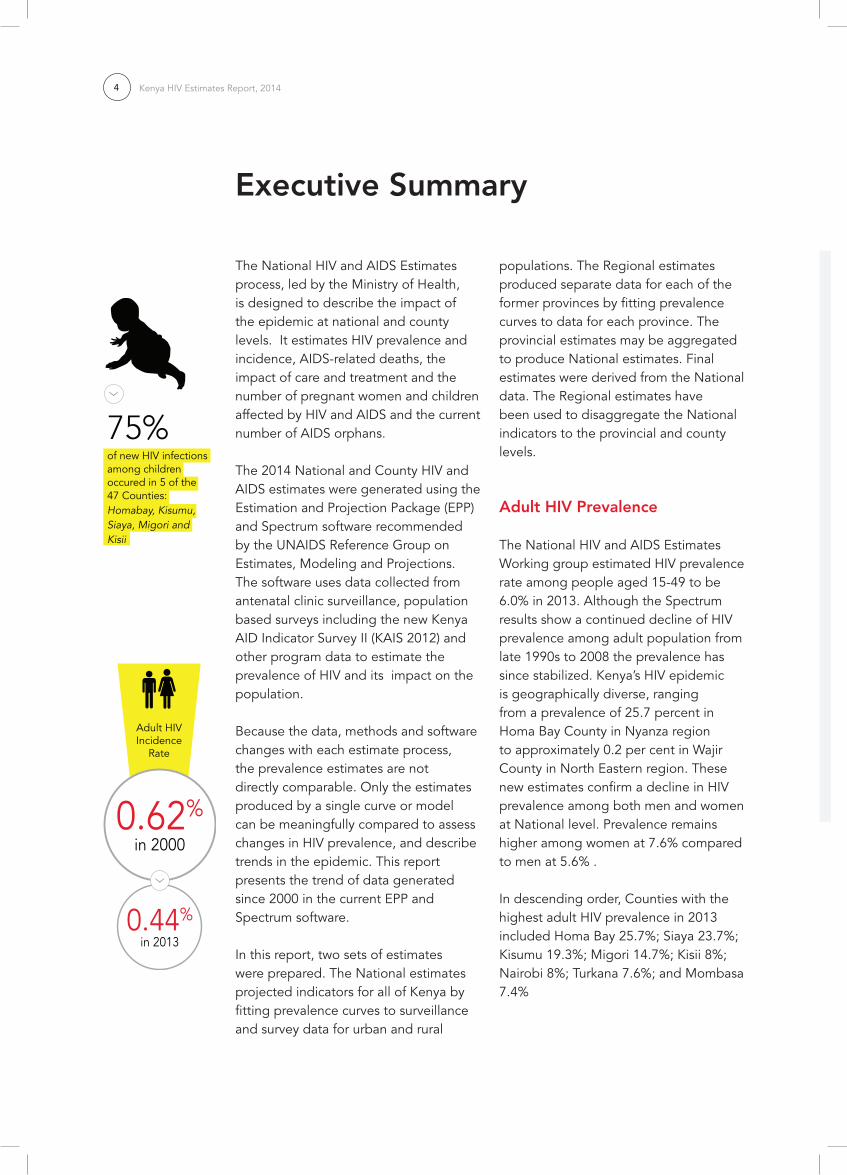
The National HIV and AIDS Estimates process, led by the Ministry of Health, is designed to describe the impact of the epidemic at national and county levels. It estimates HIV prevalence and incidence, AIDS-related deaths, the impact of care and treatment and the number of pregnant women and children affected by HIV and AIDS and the current number of AIDS orphans.
The 2014 National and County HIV and AIDS estimates were generated using the Estimation and Projection Package (EPP) and Spectrum software recommended by the UNAIDS Reference Group on Estimates, Modeling and Projections. The software uses data collected from antenatal clinic surveillance, population based surveys including the new Kenya AID Indicator Survey II (KAIS 2012) and other program data to estimate the prevalence of HIV and its impact on the population.
Because the data, methods and software changes with each estimate process, the prevalence estimates are not directly comparable. Only the estimates produced by a single curve or model can be meaningfully compared to assess changes in HIV prevalence, and describe trends in the epidemic. This report presents the trend of data generated since 2000 in the current EPP and Spectrum software.
In this report, two sets of estimates were prepared. The National estimates projected indicators for all of Kenya by fitting prevalence curves to surveillance and survey data for urban and rural
Executive Summary
populations. The Regional estimates produced separate data for each of the former provinces by fitting prevalence curves to data for each province. The provincial estimates may be aggregated to produce National estimates. Final estimates were derived from the National data. The Regional estimates have been used to disaggregate the National indicators to the provincial and county levels.
Adult HIV Prevalence
The National HIV and AIDS Estimates Working group estimated HIV prevalence rate among people aged 15-49 to be 6.0% in 2013. Although the Spectrum results show a continued decline of HIV prevalence among adult population from late 1990s to 2008 the prevalence has since stabilized. Kenya’s HIV epidemic is geographically diverse, ranging from a prevalence of 25.7 percent in Homa Bay County in Nyanza region to approximately 0.2 per cent in Wajir County in North Eastern region. These new estimates confirm a decline in HIV prevalence among both men and women at National level. Prevalence remains higher among women at 7.6% compared to men at 5.6% .
In descending order, Counties with the highest adult HIV prevalence in 2013 included Homa Bay 25.7%; Siaya 23.7%; Kisumu 19.3%; Migori 14.7%; Kisii 8%; Nairobi 8%; Turkana 7.6%; and Mombasa 7.4%
ANNUAL NEW HIV INFECTIONS 2013
12,940 50,530 38,090
AIDS RELATED DEATHS 2013
10,390 27,310 20,765
TREATMENT NEEDS
2005 (CD4 <200) 2013 (CD4 <350)
Children (0-14) 213,000 760,000Adults 15+ 103,000 141,610
HIV+ pregnant women 92,000 79,000
COUNTY PREVALENCE
(%)
HOMA BAY 25.7
SIAYA 23.7
KISUMU 19.3
MIGORI 14.7
NAIROBI 8.0
KISII 8.0
TURKANA 7.6
MOMBASA 7.4
BUSIA 6.8
TAITA TAVETA 6.1
KAKAMEGA 5.9
BOMET 5.8
NAKURU 5.3
MURANGA 5.2
TRANS NZOIA 5.1
NAROK 5.0
MACHAKOS 5.0
KIAMBU 3.8
BUNGOMA 3.2
UASIN GISHU 4.3
KILIFI 4.4
NYAMIRA 6.4
MAKUENI 5.6
MERU 3.0
COUNTY PREVALENCE
(%)
KAJIADO 4.4
KWALE 5.7
KITUI 4.3
NYERI 4.3
NANDI 3.7
KERICHO 3.4
NYANDARUA 3.8
KIRINYAGA 3.3
VIHIGA 3.8
EMBU 3.7
BARINGO 3.0
LAIKIPIA 3.7
THARAKA 4.3
WEST POKOT 2.8
SAMBURU 5.0
ELGEYO
MARAKWET
2.5
MANDERA 1.70
GARISSA 2.10
ISIOLO 4.20
MARSABIT 1.20
LAMU 2.30
TANA RIVER 1.00
WAJIR 0.20
5.6% | 7.6%National HIV Prevalence
6%
1.6 millionKenyans wereliving with HIVin 2013
1.4 millionAdults wereliving with HIVin 2013
191,840Children(0-14 years)were living withHIV in 2013
75%of new HIV infections among children occured in 5 of the47 Counties: Homabay, Kisumu, Siaya, Migori and Kisii
0.62%in 2000
0.44%in 2013
Adult HIVIncidence
Rate

Kenya HIV Estimates Report, 2014 5
ANNUAL NEW HIV INFECTIONS 2013
12,940 50,530 38,090
AIDS RELATED DEATHS 2013
10,390 27,310 20,765
TREATMENT NEEDS
2005 (CD4 <200) 2013 (CD4 <350)
Children (0-14) 213,000 760,000Adults 15+ 103,000 141,610
HIV+ pregnant women 92,000 79,000
COUNTY PREVALENCE
(%)
HOMA BAY 25.7
SIAYA 23.7
KISUMU 19.3
MIGORI 14.7
NAIROBI 8.0
KISII 8.0
TURKANA 7.6
MOMBASA 7.4
BUSIA 6.8
TAITA TAVETA 6.1
KAKAMEGA 5.9
BOMET 5.8
NAKURU 5.3
MURANGA 5.2
TRANS NZOIA 5.1
NAROK 5.0
MACHAKOS 5.0
KIAMBU 3.8
BUNGOMA 3.2
UASIN GISHU 4.3
KILIFI 4.4
NYAMIRA 6.4
MAKUENI 5.6
MERU 3.0
COUNTY PREVALENCE
(%)
KAJIADO 4.4
KWALE 5.7
KITUI 4.3
NYERI 4.3
NANDI 3.7
KERICHO 3.4
NYANDARUA 3.8
KIRINYAGA 3.3
VIHIGA 3.8
EMBU 3.7
BARINGO 3.0
LAIKIPIA 3.7
THARAKA 4.3
WEST POKOT 2.8
SAMBURU 5.0
ELGEYO
MARAKWET
2.5
MANDERA 1.70
GARISSA 2.10
ISIOLO 4.20
MARSABIT 1.20
LAMU 2.30
TANA RIVER 1.00
WAJIR 0.20
5.6% | 7.6%National HIV Prevalence
6%
1.6 millionKenyans wereliving with HIVin 2013
1.4 millionAdults wereliving with HIVin 2013
191,840Children(0-14 years)were living withHIV in 2013
HIV prevalence among males and females aged 15 to 24
HIV prevalence among young females aged 15-24 was higher than that of males in the same age group at 2.7% and 1.7% respectively. Overall HIV prevalence was 2.2% for the same age group. Notably young women in this age group account for 21% of all new HIV
infections in Kenya, a clear incidence marker.
Annual New HIV Infections
There were approximately 88,620 new HIV infections that occured among adults and 12,940 among children in 2013. Five counties: Homabay (12,280), Kisumu (10,350), Siaya (9870), Migori (6790) and Kisii (4890) contributed about 50% of the

Kenya HIV Estimates Report, 20146
total new adult infections and 75% of the new infections that occurred among children nationally.
Trends in New HIV Infections
Kenya has seen a decline in HIV incidence rates among adults aged 15-49 from 0.62% in 2000 to 0.44 in 2013 possibly due to the scale up of various prevention and treatment programmes. In terms of absolute numbers, the new HIV infections among all adults 15+ declined by 15% nationally from 105,000 in 2000 to 88,620 in 2013. Among children a declined was noted from 44,000 in 2000 to 12,940 in 2013.
Treatment Needs
If the country continues the scale up of prevention programmes, a positive outcome will be the reduction in need for prevention of mother to child transmission (PMTCT) and child treatment services. The number of HIV-positive pregnant women in need of PMTCT services in 2005 was 92,000. In 2013, approximately 79,000 HIV positive pregnant women required PMTCT services. The decrease in the number of HIV+ pregnant women is likely to be a function of several factors; reduced transmission (incidence) in the young women, reduced number of pregnancies in older women as a result of either reduced fertility or increased awareness hence better fertility choices.
The number of adults in need of ART reached 213,000 in 2005 and is estimated to have reached 760,000 in 2013 based on CD4 <350. During the same period the ART needs among children (0-14) rose from 103,000 to 141,610.
Deaths averted/Lives Saved Due to ART
It is estimated that the scale up of ART since 2009 has saved over 380,000 lives in the country by averting deaths due to AIDS-related causes.
People Living with HIV
While the decline in HIV prevalence is encouraging, the total number of people living with HIV (PLHIV) in Kenya was estimated to be 1.6 million in 2013. Children under 15 years of age account for 12% of all people living with HIV. An estimated 58% (815,630) of all adults aged 15+ living with HIV in Kenya are women.
760,000Estimated number of adults in need of Anti Rertroviral Treatment in 2013
Approximately 44% of all adults living with HIV in the country are in five counties; Nairobi (164,660); Homa Bay (140,600), Kisumu (118,500), Siaya (113,000) and Migori (77,700)

Kenya HIV Estimates Report, 2014 7
AIDS Related Deaths
Annual AIDS related deaths have declined since 2003. Approximately 58,465 people died of AIDS related causes in 2013 compared to 167,000 in 2003. The decline is directly attributable to the wider access to ART—made available with the roll out of free ART in 2003—and the ability of the National AIDS/STI Control Programme to cover treatment needs for HIV and AIDS, co-infections and provide care services.
AIDS deaths are estimated based on the latest global evidence on survival time, with and without treatment, and globally recognized methods and models are used to calculate this specific indicator. Estimates of adult AIDS related deaths are based on several assumptions and additional data sets that include: estimates of the number of adults and children who are living with HIV, and estimates of survival from the time of infection to the time of death for both adults and children living with HIV, with or without treatment.
Despite progress in advancing towards national targets much remains to be done to halt and reverse the spread of HIV in Kenya. In absolute terms, a large proportion of Kenya’s population is infected or affected by HIV. The spread of the epidemic must be halted; with zero new infections the principal target. The vision of eliminating the the AIDS epidemic can be realized through generation of strategic county level information and translation of this information into policy and practice by
planners, programme administrators and implementers. Data presented through Kenya HIV Estimates should act as a primary step to catalyze continued action.
Sustained Action Needed for ‘Getting to Zero’
The evidence presented above shows that Kenya is on track to achieve the global targets of ‘Zero New Infections, Zero AIDS-related deaths and Zero discrimination’. Sustaining prevention focus and intensity in the areas where significant declines in HIV incidence have been achieved is critical to consolidate these gains. Emerging epidemics must be addressed effectively and prevention efforts intensified in high prevalence areas. With increasing treatment coverage and a decline in AIDS-related deaths, a significant number of people are likely to require first and second line ART treatment in the coming years. A major challenge for the HIV programme will be to ensure that the treatment requirements of people living with HIV are fully met without sacrificing the needs of prevention.
The evidence presented above shows that Kenya is on track to achieve the global targets of ‘Zero New Infections, Zero AIDS-related deaths and Zero discrimination’. Sustaining prevention focus and intensity in the areas where significant declines in HIV incidence have been achieved is critical to consolidate these gains.

Kenya HIV Estimates Report, 20148
Kenya has a number of information sources on HIV prevalence levels and trends. Four national surveys; the Kenya Demographic and Health Survey of 20031 (KDHS 2003), the Kenya AIDS Indicator Survey 20072 (KAIS 2007), the Kenya Demographic and Health Survey of 2008/93 and the Kenya AIDS Indicator Survey 20124, provide good estimates of national prevalence and trends. Antenatal clinic surveillance has been conducted since 1990, starting with 13 sites and expanding to 44 sites today. ANC surveillance provides information on trends at surveillance sites particularly in the period before the first survey in 2003. The new estimates for 2013 are based on the four national surveys and surveillance data through 2011.
HIV testing among pregnant women at PMTCT sites has now reached high coverage and may be useful for tracking national trends in the future. This data has not been used in this report due to uncertainties about comparability with ANC estimates. We do expect this issue to be addressed so that prevalence estimates from PMTCT testing can be used in the future.
1 Central Bureau of Statistics (CBS) [Kenya], Ministry of Health (MOH) {Kenya], and ORC Macro. 2004. Kenya Demographic and Health Survey 2003. Calverton, Maryland” CBS, MOH and ORC Macro.
2 National AIDS and STD Control Programme, Ministry of Health, Kenya. July 2008. Kenya AIDS Indicator Survey 2007: Preliminary Report. Nairobi, Kenya.
3 KNBS [Kenya] 2009. Kenya Demographic and Health Survey 2008-09 Preliminary Report. Calverton, Maryland. KNBS, NACC, NASCOP, NPHLS, KMRI, NCAPD, ICF Macro, September 2009.
4 National AIDS and STI Control Programme, Kenya AIDS Indica-tor Survey 2012, Preliminary Report, September 2013
Kenya produces annual estimates of HIV prevalence and key indicators. The last estimates were prepared in 20115. This paper describes the process used to prepare the 2013 national estimates and the results for key indicators.
5 NACC and NASCOP. National HIV Indicators for Kenya: 2011. Nairobi, NACC and NASCOP, March 2012.
Background
HIV testing among pregnant women at PMTCT sites has now reached high coverage and may be useful for tracking National trends in the future.

Kenya HIV Estimates Report, 2014 9
The methods used to estimate national HIV prevalence in Kenya have changed over time in response to the data available. Before the first national survey, smooth prevalence curves were fit to individual surveillance sites to determine trends at those sites, and then these trends were aggregated by weighting them by the population represented by each site. When the first national survey became available the national trend was adjusted to match the survey findings in 20036. Now that four surveys are available they can be used to adjust not only the level but also the trend in prevalence from 2003 to 2012.
This curve fitting process smooths annual fluctuations in surveillance and survey data. Although the final curve may not be an exact match for the point estimates from any one survey, it should lie within the confidence bounds of all survey estimates.
UNAIDS has supported the development of a number of tools to make national estimates. For Kenya the relevant tools are the Estimation and Projection Package (EPP) and Spectrum7,8. EPP is used to fit smooth prevalence curves to surveillance and survey data separately for urban and rural areas. These curves are then combined into a single national curve. The incidence implied by the national
6 National AIDS Control Council (NACC) and National AIDS and STD Control Programme (NASCOP) 2007. National HIV Preva-lence in Kenya. Nairobi: NACC and NASCOP.
7 Stover J, Brown T, Marston M. Updates to the Spectrum/Estima-tion and Projection Package (EPP) model to estimate HIV trends for adults and children (2012) Sex Trans Infect 2012;88:i11-ii16. doi:10.1136/sextrans-2012-050640
8 Futures Institute, AIM: A Computer Program for Making HIV/AIDS Projections and Examining The Demographic and Social Impacts of AIDS, Glastonbury, CT: Futures Institute, January 2014.
prevalence curve is then transferred to Spectrum where it is combined with additional information on the age structure of incidence and program coverage (ART, PMTCT, cotrimoxazole for children) to estimate indicators of interest such as the number of people living with HIV, the number of new infections, AIDS deaths and the need for ART, PMTCT and cotrimoxazole.
For this round two sets of estimates were prepared. The National set projected indicators for all of Kenya on the basis of fitting prevalence curves to surveillance and survey data for urban and rural populations. The Regional set produced separate estimates for each of the former provinces by fitting prevalence curves just to data for each province. The provincial estimates may be aggregated to produce national estimates. The National file has been used for the final estimates. The Regional estimates have been used to disaggregate the national indicators to the provincial and county levels.
Methods
KENYA AIDS INDICATOR SURVEY 2012
PREL
IMIN
ARY
REP
OR
T
KENYA AIDS INDICATOR SURVEY 2012
Preliminary Report
Republic of Kenya
Demographic and
Health Survey
Kenya
2003
Kenya 2003 D
emographic and H
ealth Survey
Kenya
2008-09
Demographic and Health Survey
Kenya 2008-09
Dem
ographic and Health Survey
KAIS 2007 1
DATA FROM FOUR NATIONAL SURVEYS IS USED TO GENERATE GRAPHS THAT GIVE AN INDICATION OF HIV TREND IN KENYA 1 Kenya Demographic and Health Survey of 2003 (KDHS 2003) 2 Kenya AIDS Indicator Survey 2007 (KAIS 2007) 3 Kenya Demographic and Health Survey of 2008/9 4 Kenya AIDS Indicator Survey 2012
KENYA HIV ESTIMATES
2014
How the Estimates are Derived
SURVEILLANCE DATACollected from surveillance sites
PROCESSING TOOLSEstimation and ProjectionPackage (EPP) and Spectrum.• EPP is used to fit smooth prevalence curves to surveillance and survey data separately for urban and rural areas. These curves are then combined into a single National curve.• The incidence implied by the national prevalence curve is transferred to Spectrum where it is combined with additional information (age structure of incidence and program coverage) to estimate indicators of interest such as the number of people living with HIV, the number of new infections e.t.c
RESULTSKenya HIV Estimates.• The resulting information provides a riliable guide on HIV trend in Kenya
Kenya HIV Estimates Report, 201410
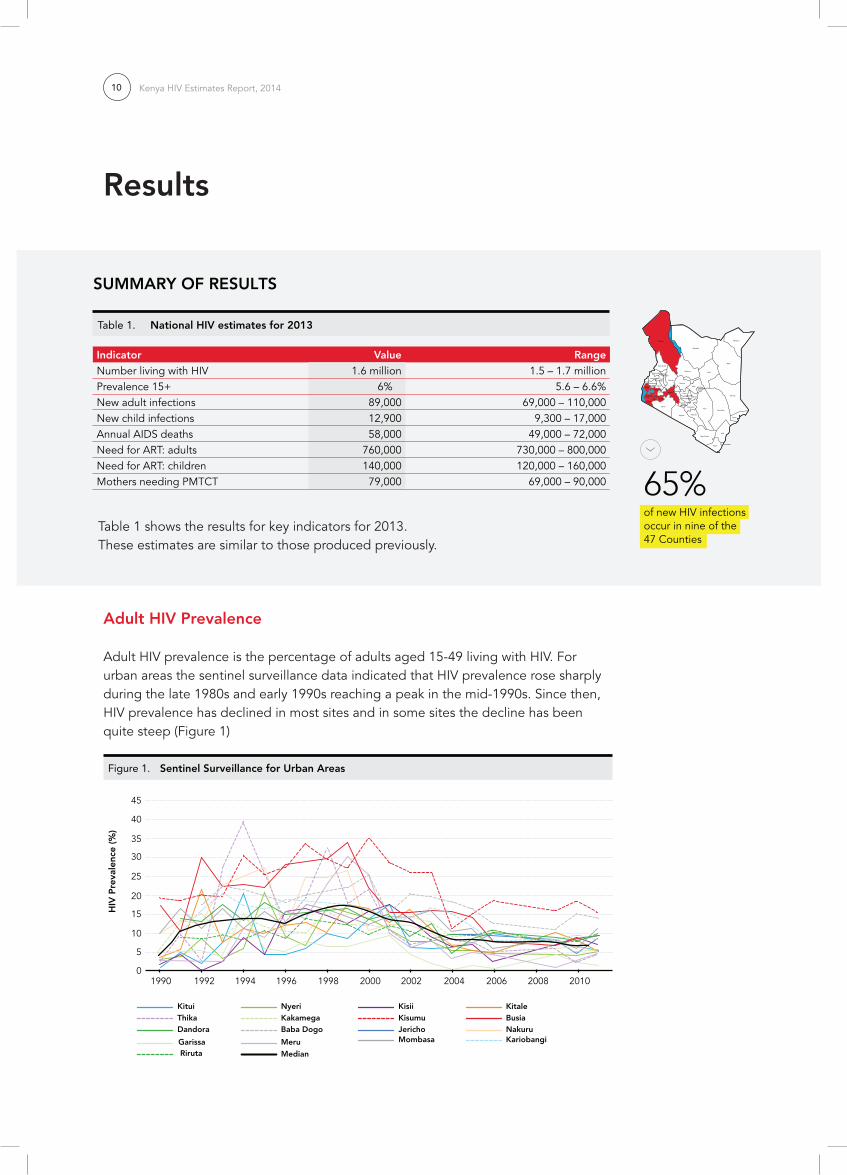
Results
Adult HIV Prevalence
Adult HIV prevalence is the percentage of adults aged 15-49 living with HIV. For urban areas the sentinel surveillance data indicated that HIV prevalence rose sharply during the late 1980s and early 1990s reaching a peak in the mid-1990s. Since then, HIV prevalence has declined in most sites and in some sites the decline has been quite steep (Figure 1)
Figure 1. Sentinel Surveillance for Urban Areas
HIV
Pre
vale
nce
(%)
KituiThikaDandora
NyeriKakamegaBaba Dogo Jericho
Median
KisiiKisumu Busia
Mombasa Kariobangi
Riruta
Kitale
Garissa Meru
Nakuru
1990 1992 1994 1996 1998 2000 2002 2004 2006 2008 20100
5
10
15
20
25
30
35
40
45
SUMMARY OF RESULTS
Table 1. National HIV estimates for 2013
Indicator Value RangeNumber living with HIV 1.6 million 1.5 – 1.7 millionPrevalence 15+ 6% 5.6 – 6.6%New adult infections 89,000 69,000 – 110,000New child infections 12,900 9,300 – 17,000Annual AIDS deaths 58,000 49,000 – 72,000Need for ART: adults 760,000 730,000 – 800,000Need for ART: children 140,000 120,000 – 160,000Mothers needing PMTCT 79,000 69,000 – 90,000 65%
of new HIV infections occur in nine of the47 Counties
Table 1 shows the results for key indicators for 2013.These estimates are similar to those produced previously.
Kenya HIV Estimates Report, 2014 11
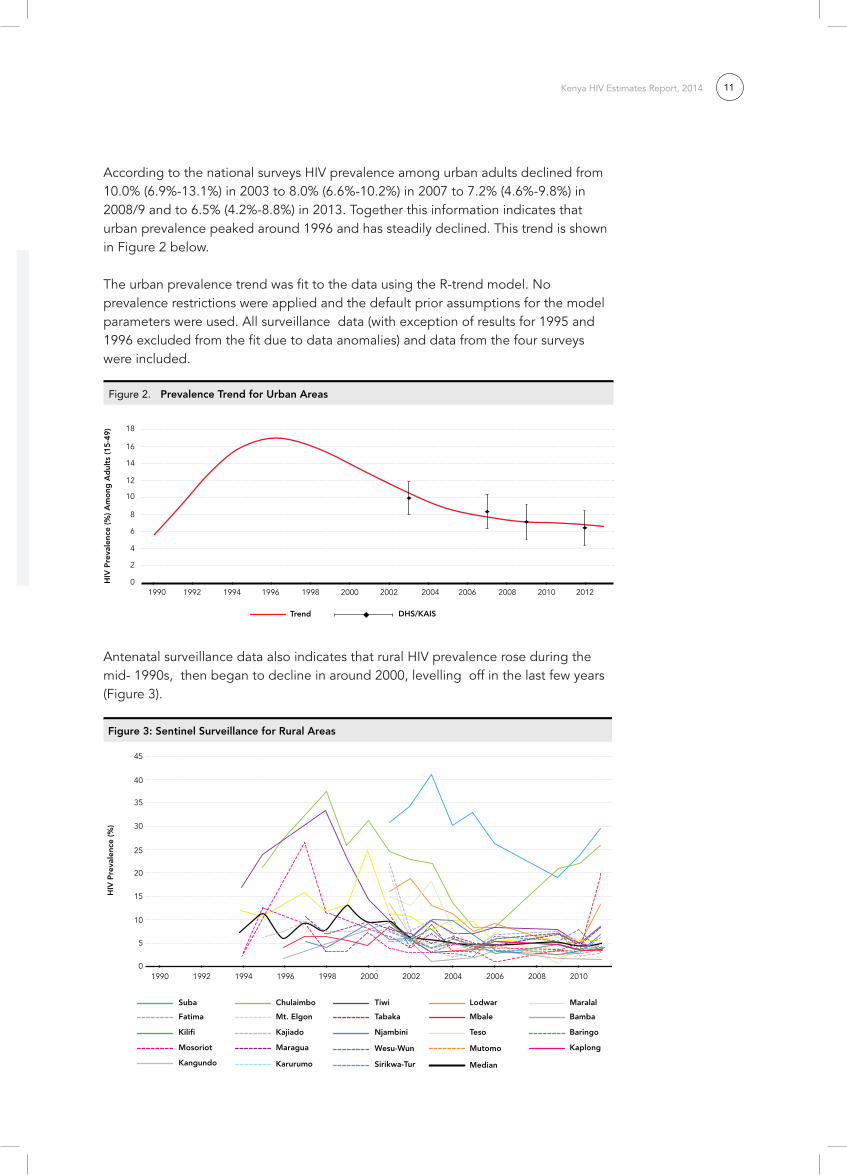
According to the national surveys HIV prevalence among urban adults declined from 10.0% (6.9%-13.1%) in 2003 to 8.0% (6.6%-10.2%) in 2007 to 7.2% (4.6%-9.8%) in 2008/9 and to 6.5% (4.2%-8.8%) in 2013. Together this information indicates that urban prevalence peaked around 1996 and has steadily declined. This trend is shown in Figure 2 below.
The urban prevalence trend was fit to the data using the R-trend model. No prevalence restrictions were applied and the default prior assumptions for the model parameters were used. All surveillance data (with exception of results for 1995 and 1996 excluded from the fit due to data anomalies) and data from the four surveys were included.
Figure 2. Prevalence Trend for Urban Areas
19900
2
4
6
8
10
12
14
16
18
1992 1994
HIV
Pre
vale
nce
(%) A
mo
ng A
dul
ts (1
5-49
)
1996 1998 2000 2002 2004 2006 2008 2010 2012
Trend DHS/KAIS
Antenatal surveillance data also indicates that rural HIV prevalence rose during the mid- 1990s, then began to decline in around 2000, levelling off in the last few years (Figure 3).
Figure 3: Sentinel Surveillance for Rural Areas
Suba
Fatima
Kilifi
Chulaimbo
Mt. Elgon
Kajiado Njambini
Wesu-Wun Mutomo
Median
Tiwi
MaraguaMosoriot Kaplong
Tabaka Mbale Bamba
Karurumo Sirikwa-Tur
Baringo
Lodwar Maralal
Kangundo
Teso
HIV
Pre
vale
nce
(%)
1990 1992 1994 1996 1998 2000 2002 2004 2006 2008 20100
5
10
15
20
25
30
35
40
45
SUMMARY OF RESULTS
Table 1. National HIV estimates for 2013
Indicator Value RangeNumber living with HIV 1.6 million 1.5 – 1.7 millionPrevalence 15+ 6% 5.6 – 6.6%New adult infections 89,000 69,000 – 110,000New child infections 12,900 9,300 – 17,000Annual AIDS deaths 58,000 49,000 – 72,000Need for ART: adults 760,000 730,000 – 800,000Need for ART: children 140,000 120,000 – 160,000Mothers needing PMTCT 79,000 69,000 – 90,000 65%
of new HIV infections occur in nine of the47 Counties
Kenya HIV Estimates Report, 201412
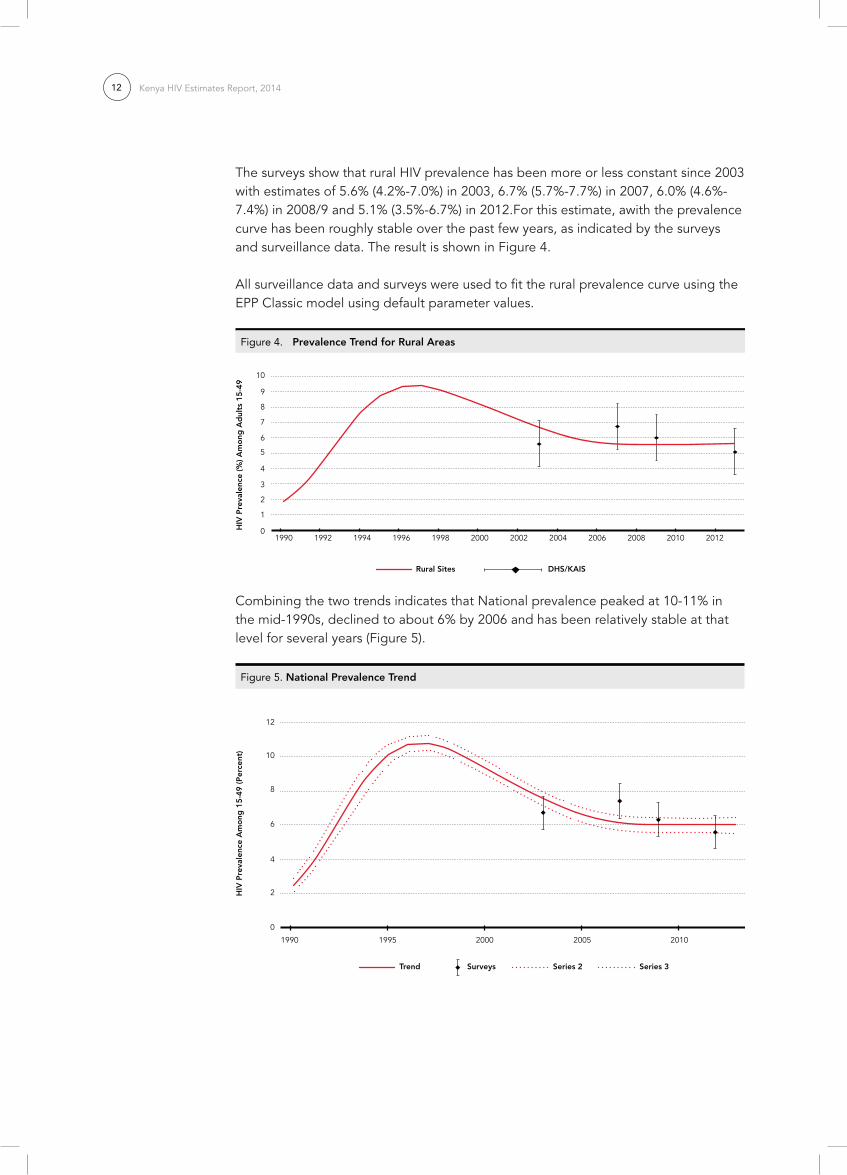
The surveys show that rural HIV prevalence has been more or less constant since 2003 with estimates of 5.6% (4.2%-7.0%) in 2003, 6.7% (5.7%-7.7%) in 2007, 6.0% (4.6%-7.4%) in 2008/9 and 5.1% (3.5%-6.7%) in 2012.For this estimate, awith the prevalence curve has been roughly stable over the past few years, as indicated by the surveys and surveillance data. The result is shown in Figure 4.
All surveillance data and surveys were used to fit the rural prevalence curve using the EPP Classic model using default parameter values.
Figure 4. Prevalence Trend for Rural Areas
2008 2010 201219900
1
2
4
3
5
6
7
8
9
10
1992 1994
HIV
Pre
vale
nce
(%) A
mo
ng A
dul
ts 1
5-49
Rural Sites DHS/KAIS
1996 1998 2000 2002 2004 2006
Combining the two trends indicates that National prevalence peaked at 10-11% in the mid-1990s, declined to about 6% by 2006 and has been relatively stable at that level for several years (Figure 5).
Figure 5. National Prevalence Trend
1990
0
2
4
6
8
10
12
1995
HIV
Pre
vale
nce
Am
ong
15-
49 (P
erce
nt)
2000 2005 2010
Trend Surveys Series 2 Series 3

Kenya HIV Estimates Report, 2014 13
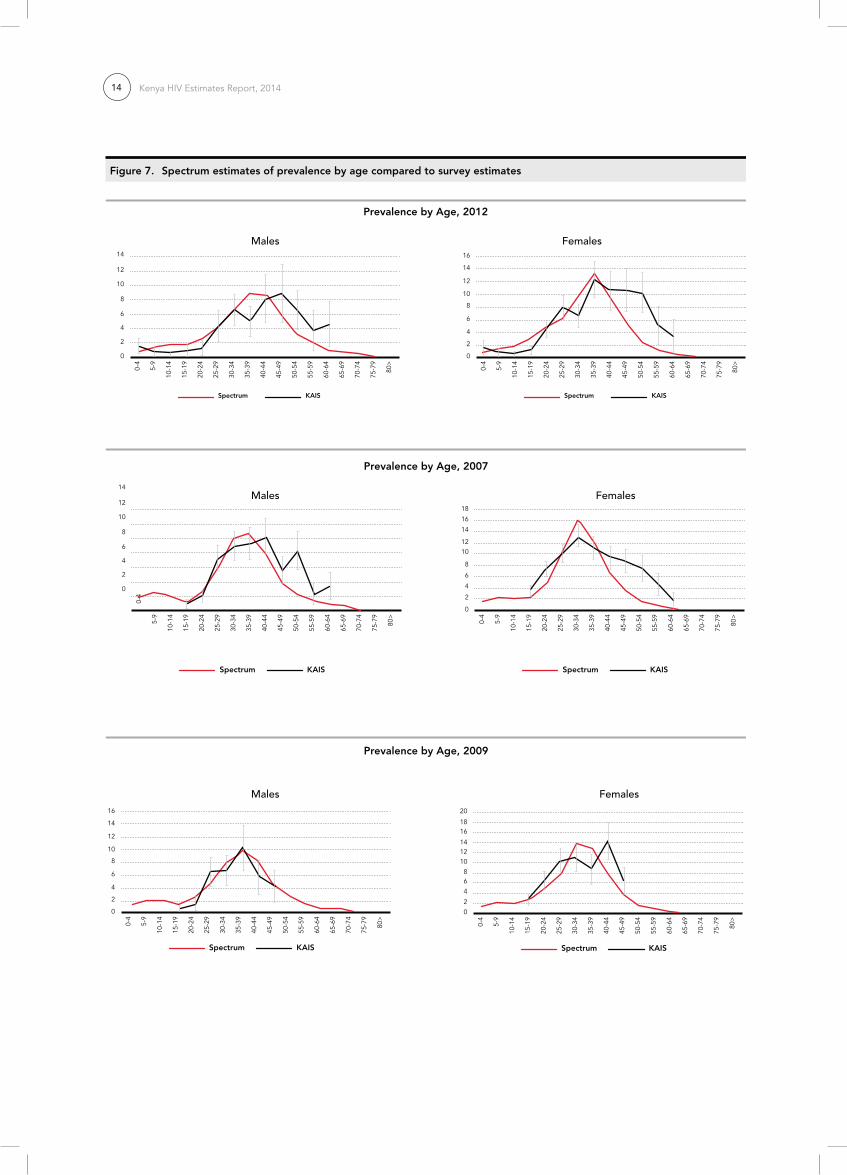
The national projection was validated by comparing the estimated total mortality with deaths estimates from vital statistics (adjusted for undercount) as shown in Figure 6 and by comparing the estimated age-specific prevalence with survey estimates as shown in Figure 7.
Figure 6. Spectrum Estimate of All Cause Mortality Compared to Vital Statistics
1980 1985 1990 1995 2000 2005 2010 2015 20200
600,000
500,000
400,000
300,000
200,000
100,000
Spectrum Vital Statistics
Kenya HIV Estimates Report, 201414
0 0
2 2
44
66
88
1010
12
12
14
14
16
0-4
0-4
5-9
5-9
10-1
4
10-1
4
15-1
9
15-1
9
20-2
4
20-2
4
25-2
9
25-2
9
30-3
4
30-3
4
35-3
9
35-3
9
40-4
4
40-4
4
45-4
9
45-4
9
50-5
4
50-5
4
55-5
9
55-5
9
60-6
4
60-6
4
65-6
9
65-6
9
70-7
4
70-7
4
75-7
9
75-7
9
80>
80>
Spectrum SpectrumKAIS KAIS
Figure 7. Spectrum estimates of prevalence by age compared to survey estimates
Prevalence by Age, 2012
Prevalence by Age, 2007
Prevalence by Age, 2009
Males Females
Males
0
2
4
6
8
10
12
14
0-4
5-9
10-1
4
15-1
9
20-2
4
25-2
9
30-3
4
35-3
9
40-4
4
45-4
9
50-5
4
55-5
9
60-6
4
65-6
9
70-7
4
75-7
9
80>
Spectrum KAIS
Males
0
2
4
6
8
10
12
14
16
0-4
5-9
10-1
4
15-1
9
20-2
4
25-2
9
30-3
4
35-3
9
40-4
4
45-4
9
50-5
4
55-5
9
60-6
4
65-6
9
70-7
4
75-7
9
80>
Spectrum KAIS
Females
0
2
4
68
101214
1618
20
0-4
5-9
10-1
4
15-1
9
20-2
4
25-2
9
30-3
4
35-3
9
40-4
4
45-4
9
50-5
4
55-5
9
60-6
4
65-6
9
70-7
4
75-7
9
80>
Spectrum KAIS
Females
0
2
4
6
8
1012
14
18
16
0-4
5-9
10-1
4
15-1
9
20-2
4
25-2
9
30-3
4
35-3
9
40-4
4
45-4
9
50-5
4
55-5
9
60-6
4
65-6
9
70-7
4
75-7
9
80>
Spectrum KAIS

Kenya HIV Estimates Report, 2014 15
New Adult HIV Infections
National adult HIV incidence is estimated over time by use of prevalence trends and incorporating the effects of AIDS mortality, non-AIDS mortality and population aging. These calculations indicate that the annual number of new HIV infections increased steadily to a peak in the mid-1990s before declining sharply to about 100,000 per year by 2004 and then declining again the last two years to a range of 85000-90,000 in 2013 (Figure 8).
This trend implies that HIV incidence rate has declined from 2003 at 0.62 (0.57-0.69) to about 0.44 (0.34-0.56) in 2013. Since 2004 new HIV infections stabilized at a level of about 90,000 per year.
Figure 8. Annual Number of Adult HIV Infections
1990198819861984198219800
50,000
100,000
150,000
200,000
250,000
300,000
350,000
1992 1994 1996 1998 2000 2002 2004 2006 2008 2010 2012
Need for Treatment
The estimated number of new adult HIV infections is combined with information about progression in CD4 counts, the mother-to-child transmission rate and service statistics to estimate the need for services. For adult ART, eligibility for treatment was a CD4 count of less than 200 cells/μl through 2006, less than 250 cells/μl from 2007-2009 and a CD4 count of less than 350 cells/μl in 2010 and later. Spectrum tracks adults living withn HIV by CD4 count based on assumed rates of progression to lower CD4 counts, AIDS mortality by CD4 count and initiation of ART1.The parameters of the model were set to reproduce the CD4 count distribution of the population living with HIV who were not on ART, asreported by the 2007 KAIS (Figure 9).
1 Futures Institute, AIM: A Computer Program for Making HIV/AIDS Projections and Examining The Demographic and Social Impacts of AIDS, Glastonbury, CT: Futures Institute, January 2014.

Kenya HIV Estimates Report, 201416
For children, eligibility for treatment is based on Kenyan guidelines as updated in 2008 which include all children living with HIV under the age of 18 months, children 19-59 months with CD4 percent under 25 and children older than 5 years with CD4 counts under 350. The child model in Spectrum follows children from HIV infection to death based on survival patterns, which are dependent on time of infection (peripartum, 6-12 months, 13-24 months, >24 months)2.
Spectrum calculates the number of children infected through mother-to-child transmission using program data on the number of women receiving PMTCT services by regimen and the latest estimates of the probability of transmission for each option3.
There are uncertainties inherent in these estimates based on the error of measuring HIV prevalence through population surveys and the uncertainty in the assumptions used for time of progression, the distribution of new
2 Futures Institute, AIM: A Computer Program for Making HIV/AIDS Projections and Examining The Demographic and Social Impacts of AIDS, Glastonbury, CT: Futures Institute, January 2014.
3 Rollins N, Mahy M, Becquet R, Kuhn L, Creek T, Mofenson L. Es-timates of peripartum and postnatal mother-to-child transmission probabilities of HIV for use in Spectrum and other popula-tion-based models Sex Trans Infect 2012;88:i44-i51.
Figure 9. Distribution of HIV Positive Adults not on ART in 2007
0
10%
20%
30%
40%
50%
60%
70%
80%
90%
100%
KA
IS 2
007
Spec
trum
200
7
>500
350-499
250-350
200-250
100-200
50-100
<50
infections by age and sex, mother-to-child transmission rates, and the effectiveness of treatment. In order to quantify this uncertainty we performed 1000 Monte Carlo projections using randomly selected values for these assumptions with ranges indicated by the sources. The results provide plausibility bounds around each estimate.

Kenya HIV Estimates Report, 2014 17
Impact
The Spectrum model is used to estimate the impact of treatment in terms of the number of lives saved. This scenario is compared to an hypothetical situation in which no one is placed on ART. The difference in the number of AIDS deaths between the two projections, is then estimated as impact of treatment. Figure 10 shows an estimated 380,000 AIDS deaths have been averted through 2013 due to the scale-up of ART.
Figure 10. HIV-related Deaths Averted by ART
19981996199419921990
0
20,000
40,000
60,000
80,000
100,000
120,000
140,000
160,000
180,000
2000 2002 2004 2006 2008 2010 2012
Without ART With ART
The program to prevent mother-to-child transmission of HIV has been scaled up rapidly in the past few years. In 2013 about 55,000 women living with HIV received ARV prophylaxis to prevent transmission to their new born children. This represents about 70% of need. As a result of the scale up of this program since 2004, about 73,000 child HIV infections have been averted as shown in Figure 11.
Figure 11. Number of Child Infections Averted by PMTCT
200420032002200120000
5,000
10,000
15,000
20,000
25,000
30,000
40,000
35,000
45,000
50,000
2005 2006 2007 2008 2009 2010 2011 2012 2013
Without PMTCT With PMTCT
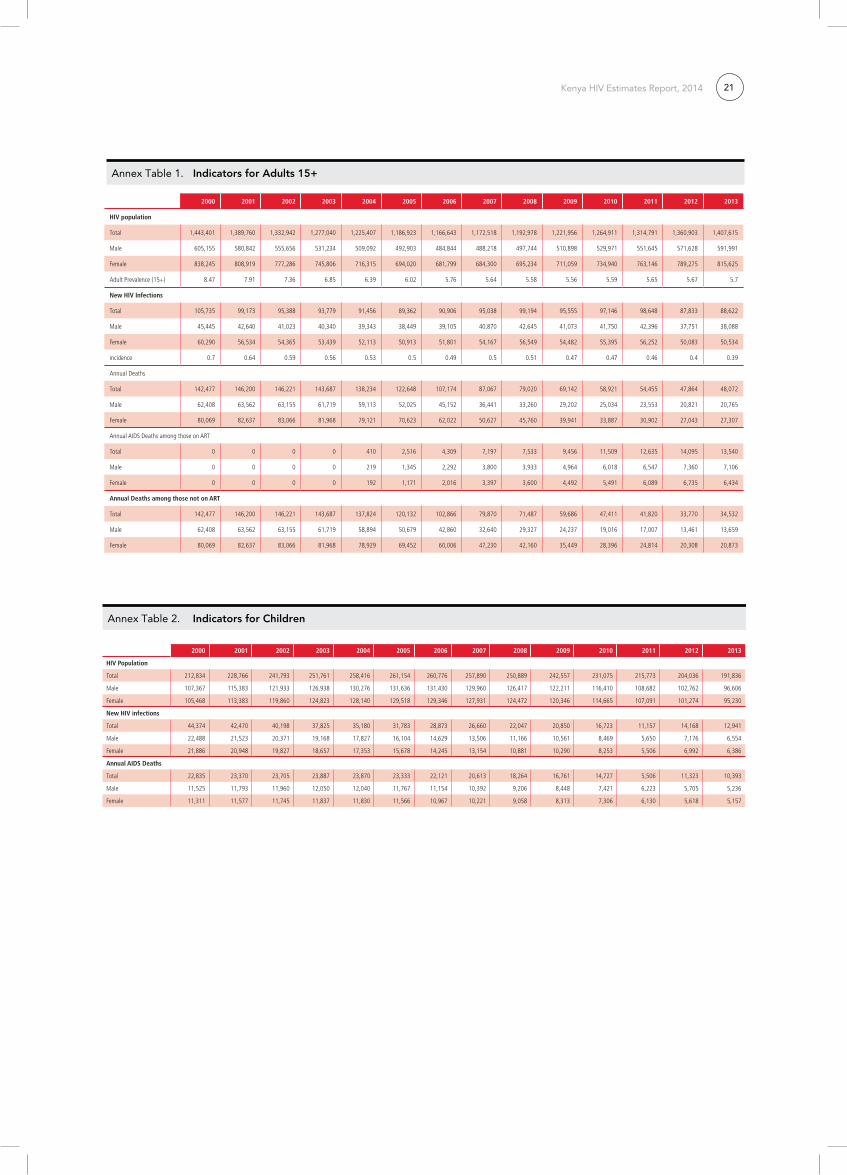
Annex Tables 1, 2 and 3 below show the full set of indicators.

Kenya HIV Estimates Report, 201418
County HIV Estimates
County HIV estimates of key indicators were prepared by disaggregating the National indicators, first to the province level, and then disaggregating the provincial total to the Counties within each province. Separate Spectrum files were prepared for each province and prevalence trends were fit to surveillance and survey data. Population projections for each province were based on total fertility rates and mortality indicators from KDHS and adjusted to match census estimates by county. The estimated prevalence trends for each province are shown in Figure 13.
Figure 12. Prevalence trends by province
Central Coast Eastern Nairobi
North Eastern Nyanza Rift Valley Western
0
5
10
15
20
25
200319991995199119871983 2007 2011 2015 2019
For each of the key indicators the National estimates were distributed to each province on the basis of that province’s proportion of the total.
Estimates of prevalence by County were prepared by examining surveillance and survey cluster data from 2003 to 2012. For each County the prevalence trend was determined by one of five options: 1) overall average across all data points, 2) a linear trend fit to all data points, 3) the most recent value, 4) the latest KAIS estimate or 5) the latest KDHS estimate. The prevalence estimate for 2013 for each County was multiplied by the population 15-49 in the County to estimate the number of adults living with HIV aged 15-49. The number of adults living with HIV aged 15+ in each County was adjusted so that the total across all Counties in a province would equal the provincial total. Values for other indicators were first distributed by County according to the number of HIV+ adults and then adjusted to match the county totals. The results are shown below.

Kenya HIV Estimates Report, 2014 19
Year
HIV
A
dult
s +
Child
ren
New
HIV
infe
ctio
ns
Ann
ual
AID
SD
eath
s
Prev
alen
ce
Adu
lt(%
)
Inci
denc
e (1
5-49
)(%
)
HIV
+
Adu
lts
(15+
)
HIV
+ A
dult
-Fem
ale
(15+
)
New
HIV
infe
ctio
ns- A
dult
s(1
5+)
Ann
ual
AID
S de
aths
- Adu
lts
(15+
)
Prev
alen
ce
Youn
g M
ale
(15-
24)
Prev
alen
ce
Youn
g Fe
mal
e(1
5-24
)
HIV
Child
ren
(0-1
4)
New
Infe
ctio
ns(0
-14)
Orp
hans
due
toA
IDS
Esti
mat
e(L
ow -H
igh)
Esti
mat
e(L
ow -H
igh)
Esti
mat
e(L
ow -H
igh)
Esti
mat
e(L
ow -H
igh)
Esti
mat
e(L
ow -H
igh)
Esti
mat
e(L
ow -H
igh)
Esti
mat
e(L
ow -H
igh)
Esti
mat
e(L
ow -H
igh)
Esti
mat
e(L
ow -H
igh)
Esti
mat
e(L
ow -H
igh)
Esti
mat
e(L
ow -H
igh)
Esti
mat
e(L
ow -H
igh)
Esti
mat
e(L
ow -H
igh)
Esti
mat
e(L
ow -H
igh)
1990
280
000
(240
000
-330
000
)12
0 00
0(1
10 0
00-1
50 0
00)
7600
6600
-930
02.
5(2
.2-2
.9)
1.15
(1.0
1-1.
35)
270
000
(230
000
-310
000
)15
0 00
0(1
30 0
00-1
70 0
00)
120
000
(100
000
-140
000
)53
00(4
500-
6600
)1.
3(0
.9-1
.7)
2.2
(1.9
-2.6
)14
000
(12
000-
17 0
00)
8700
(730
0-10
000
)19
000
(16
000-
24 0
00)
1991
460
000
(400
000
-530
000
)19
0 00
0(1
70 0
00-2
20 0
00)
13 0
0011
000
-16
000
3.9
(3.4
-4.5
)1.
69(1
.49-
1.95
)43
0 00
0(3
80 0
00-5
00 0
00)
240
000
(210
000
-280
000
)18
0 00
0(1
50 0
00-2
00 0
00)
9500
(800
0-12
000
)2.
0(1
.3-2
.6)
3.4
(2.9
-4.1
)23
000
(20
000-
28 0
00)
14 0
00(1
2 00
0-16
000
)35
000
(29
000-
42 0
00)
1992
690
000
(610
000
-790
000
)26
0 00
0(2
30 0
00-2
90 0
00)
22 0
0019
000
-27
000
5.6
(5.0
-6.4
)2.
24(2
.01-
2.51
)66
0 00
0(5
80 0
00-7
50 0
00)
370
000
(330
000
-430
000
)24
0 00
0(2
10 0
00-2
70 0
00)
16 0
00(1
4 00
0-20
000
)2.
7(1
.9-3
.7)
4.9
(4.1
-5.8
)37
000
(31
000-
44 0
00)
20 0
00(1
7 00
0-24
000
)60
000
(51
000-
74 0
00)
1993
970
000
(870
000
-1 1
00 0
00)
310
000
(290
000
-340
000
)35
000
31 0
00-4
2 00
07.
5(6
.8-8
.3)
2.60
(2.3
9-2.
77)
910
000
(820
000
-1 0
00 0
00)
520
000
(470
000
-580
000
)29
0 00
0(2
60 0
00-3
10 0
00)
27 0
00(2
3 00
0-33
000
)3.
5(2
.3-4
.7)
6.4
(5.5
-7.5
)55
000
(47
000-
65 0
00)
28 0
00(2
4 00
0-32
000
)10
0 00
0(8
6 00
0-13
0 00
0)
1994
1 20
0 00
0(1
100
000
-1 4
00 0
00)
330
000
(310
000
-350
000
)53
000
(46
000-
63 0
00)
9.1
(8.4
-9.9
)2.
59(2
.47-
2.69
)1
200
000
(1 1
00 0
00-1
300
000
)66
0 00
0(6
10 0
00-7
30 0
00)
290
000
(280
000
-310
000
)42
000
(36
000-
51 0
00)
4.1
(2.7
-5.4
)7.
5(6
.7-8
.8)
77 0
00(6
7 00
0-90
000
)35
000
(31
000-
40 0
00)
170
000
(140
000
-200
000
)
1995
1 50
0 00
0(1
400
000
-1 6
00 0
00)
300
000
(280
000
-320
000
)75
000
66 0
00-8
8 00
010
.3(9
.7-1
0.8)
2.24
(2.0
6-2.
38)
1 40
0 00
0(1
300
000
-1 4
00 0
00)
770
000
(720
000
-830
000
)26
0 00
0(2
30 0
00-2
80 0
00)
60 0
00(5
3 00
0-73
000
)4.
3(2
.8-5
.9)
8.1
(7.4
-9.5
)10
0 00
0(8
9 00
0-12
0 00
0)40
000
(36
000-
45 0
00)
260
000
(220
000
-310
000
)
1996
1 60
0 00
0(1
500
000
-1 7
00 0
00)
250
000
(230
000
-280
000
)99
000
88 0
00-1
10 0
0010
.8(1
0.3-
11.2
)1.
75(1
.56-
1.92
)1
500
000
(1 4
00 0
00-1
600
000
)85
0 00
0(8
00 0
00-9
00 0
00)
210
000
(180
000
-230
000
)82
000
(73
000-
96 0
00)
4.2
(2.7
-6.0
)8.
0(7
.4-9
.5)
130
000
(110
000
-140
000
)44
000
(39
000-
49 0
00)
380
000
(330
000
-460
000
)
1997
1 70
0 00
0(1
600
000
-1 8
00 0
00)
210
000
(190
000
-230
000
)12
0 00
011
0 00
0-14
0 00
010
.8(1
0.4-
11.2
)1.
33(1
.17-
1.48
)1
500
000
(1 5
00 0
00-1
600
000
)88
0 00
0(8
40 0
00-9
30 0
00)
160
000
(140
000
-190
000
)10
0 00
0(9
3 00
0-12
0 00
0)3.
8(2
.3-5
.8)
7.4
(6.8
-8.9
)15
0 00
0(1
30 0
00-1
70 0
00)
46 0
00(4
1 00
0-51
000
)53
0 00
0(4
60 0
00-6
30 0
00)
1998
1 70
0 00
0(1
600
000
-1 8
00 0
00)
180
000
(160
000
-200
000
)14
0 00
0(1
30 0
00-1
60 0
00)
10.4
(10.
1-10
.8)
1.02
(0.9
1-1.
15)
1 50
0 00
0(1
500
000
-1 6
00 0
00)
880
000
(840
000
-930
000
)13
0 00
0(1
10 0
00-1
50 0
00)
120
000
(110
000
-140
000
)3.
3(2
.0-5
.4)
6.5
(5.9
-8.1
)17
0 00
0(1
50 0
00-1
90 0
00)
46 0
00(4
2 00
0-51
000
)70
0 00
0(6
20 0
00-8
20 0
00)
1999
1 70
0 00
0(1
600
000
-1 8
00 0
00)
150
000
(140
000
-170
000
)16
0 00
0(1
50 0
00-1
70 0
00)
9.9
(9.5
-10.
3)0.
82(0
.75-
0.92
)1
500
000
(1 4
00 0
00-1
600
000
)86
0 00
0(8
20 0
00-9
20 0
00)
110
000
(97
000-
120
000)
130
000
(120
000
-150
000
)2.
8(1
.6-4
.8)
5.6
(5.1
-7.1
)19
0 00
0(1
70 0
00-2
20 0
00)
46 0
00(4
1 00
0-51
000
)89
0 00
0(7
90 0
00-1
000
000
)
2000
1 70
0 00
0(1
600
000
-1 7
00 0
00)
150
000
(140
000
-170
000
)17
0 00
0(1
60 0
00-1
80 0
00)
9.3
(9.0
-9.7
)0.
78(0
.72-
0.87
)1
400
000
(1 4
00 0
00-1
500
000
)84
0 00
0(7
90 0
00-8
90 0
00)
110
000
(97
000-
120
000)
140
000
(130
000
-160
000
)2.
4(1
.4-4
.3)
4.9
(4.3
-6.2
)21
0 00
0(1
90 0
00-2
40 0
00)
44 0
00(4
0 00
0-49
000
)1
100
000
(950
000
-1 2
00 0
00)
2001
1 60
0 00
0(1
500
000
-1 7
00 0
00)
140
000
(130
000
-160
000
)17
0 00
0(1
60 0
00-1
80 0
00)
8.7
(8.4
-9.1
)0.
71(0
.65-
0.78
)1
400
000
(1 3
00 0
00-1
500
000
)81
0 00
0(7
60 0
00-8
60 0
00)
99 0
00(9
1 00
0-11
0 00
0)15
0 00
0(1
40 0
00-1
60 0
00)
2.1
(1.2
-3.7
)4.
2(3
.8-5
.4)
230
000
(210
000
-250
000
)42
000
(38
000-
47 0
00)
1 20
0 00
0(1
100
000
-1 4
00 0
00)
2002
1 60
0 00
0(1
500
000
-1 7
00 0
00)
140
000
(120
000
-150
000
)17
0 00
0(1
60 0
00-1
80 0
00)
8.1
(7.7
-8.5
)0.
65(0
.60-
0.73
)1
300
000
(1 3
00 0
00-1
400
000
)78
0 00
0(7
30 0
00-8
30 0
00)
95 0
00(8
7 00
0-11
0 00
0)15
0 00
0(1
40 0
00-1
60 0
00)
1.8
(1.1
-3.1
)3.
7(3
.3-4
.7)
240
000
(220
000
-270
000
)40
000
(36
000-
45 0
00)
1 30
0 00
0(1
200
000
-1 5
00 0
00)
2003
1 50
0 00
0(1
500
000
-1 6
00 0
00)
130
000
(120
000
-150
000
)17
0 00
0(1
60 0
00-1
80 0
00)
7.5
(7.2
-7.9
)0.
62(0
.57-
0.69
)1
300
000
(1 2
00 0
00-1
400
000
)75
0 00
0(7
00 0
00-8
00 0
00)
94 0
00(8
5 00
0-11
0 00
0)14
0 00
0(1
40 0
00-1
60 0
00)
1.6
(1.0
-2.7
)3.
3(2
.9-4
.1)
250
000
(230
000
-280
000
)38
000
(34
000-
43 0
00)
1 40
0 00
0(1
300
000
-1 6
00 0
00)
2004
1 50
0 00
0(1
400
000
-1 6
00 0
00)
130
000
(120
000
-140
000
)16
0 00
0(1
50 0
00-1
80 0
00)
7.0
(6.7
-7.4
)0.
58(0
.53-
0.65
)1
200
000
(1 2
00 0
00-1
300
000
)72
0 00
0(6
70 0
00-7
70 0
00)
91 0
00(8
3 00
0-10
0 00
0)14
0 00
0(1
30 0
00-1
50 0
00)
1.5
(0.9
-2.4
)3.
0(2
.7-3
.7)
260
000
(230
000
-290
000
)35
000
(31
000-
40 0
00)
1 50
0 00
0(1
400
000
-1 7
00 0
00)
2005
1 40
0 00
0(1
400
000
-1 5
00 0
00)
120
000
(110
000
-140
000
)15
0 00
0(1
40 0
00-1
60 0
00)
6.6
(6.3
-7.0
)0.
55(0
.50-
0.62
)1
200
000
(1 1
00 0
00-1
300
000
)69
0 00
0(6
50 0
00-7
50 0
00)
89 0
00(8
0 00
0-10
0 00
0)12
0 00
0(1
20 0
00-1
30 0
00)
1.4
(0.9
-2.2
)2.
8(2
.5-3
.4)
260
000
(230
000
-290
000
)32
000
(28
000-
36 0
00)
1 60
0 00
0(1
400
000
-1 7
00 0
00)
2006
1 40
0 00
0(1
300
000
-1 5
00 0
00)
120
000
(110
000
-140
000
)13
0 00
0(1
20 0
00-1
40 0
00)
6.3
(6.0
-6.7
)0.
54(0
.49-
0.61
)1
200
000
(1 1
00 0
00-1
300
000
)68
0 00
0(6
40 0
00-7
30 0
00)
91 0
00(8
1 00
0-11
0 00
0)11
0 00
0(1
00 0
00-1
20 0
00)
1.4
(0.9
-2.1
)2.
7(2
.4-3
.3)
260
000
(230
000
-290
000
)29
000
(25
000-
33 0
00)
1 60
0 00
0(1
400
000
-1 7
00 0
00)
2007
1 40
0 00
0(1
300
000
-1 5
00 0
00)
120
000
(110
000
-140
000
)11
0 00
0(1
00 0
00-1
20 0
00)
6.2
(5.8
-6.5
)0.
55(0
.49-
0.62
)1
200
000
(1 1
00 0
00-1
300
000
)68
0 00
0(6
40 0
00-7
40 0
00)
95 0
00(8
5 00
0-11
0 00
0)87
000
(80
000-
97 0
00)
1.4
(0.9
-2.0
)2.
6(2
.3-3
.2)
260
000
(230
000
-290
000
)27
000
(23
000-
31 0
00)
1 60
0 00
0(1
400
000
-1 7
00 0
00)
2008
1 40
0 00
0(1
400
000
-1 5
00 0
00)
120
000
(110
000
-140
000
)97
000
(89
000-
110
000)
6.1
(5.7
-6.5
)0.
56(0
.50-
0.63
)1
200
000
(1 1
00 0
00-1
300
000
)70
0 00
0(6
50 0
00-7
50 0
00)
99 0
00(8
8 00
0-11
0 00
0)79
000
(72
000-
89 0
00)
1.4
(1.0
-2.1
)2.
6(2
.3-3
.2)
250
000
(220
000
-280
000
)22
000
(19
000-
26 0
00)
1 50
0 00
0(1
400
000
-1 6
00 0
00)
2009
1 50
0 00
01
400
000-
1 60
0 00
012
0 00
0(1
00 0
00-1
40 0
00)
86 0
00(7
8 00
0-97
000
)6.
0(5
.7-6
.4)
0.53
(0.4
6-0.
60)
1 20
0 00
0(1
100
000
-1 3
00 0
00)
710
000
(660
000
-770
000
)96
000
(83
000-
110
000)
69 0
00(6
2 00
0-79
000
)1.
5(1
.0-2
.1)
2.7
(2.4
-3.2
)24
0 00
0(2
20 0
00-2
70 0
00)
21 0
00(1
7 00
0-25
000
)1
500
000
(1 3
00 0
00-1
600
000
)
2010
1 50
0 00
0(1
400
000
-1 6
00 0
00)
110
000
(97
000-
130
000)
74 0
00(6
5 00
0-85
000
)6.
0(5
.7-6
.4)
0.52
(0.4
4-0.
60)
1 30
0 00
0(1
200
000
-1 4
00 0
00)
730
000
(680
000
-800
000
)97
000
(82
000-
110
000)
59 0
00(5
2 00
0-69
000
)1.
6(1
.1-2
.1)
2.7
(2.4
-3.3
)23
0 00
0(2
10 0
00-2
60 0
00)
17 0
00(1
3 00
0-20
000
)1
400
000
(1 3
00 0
00-1
500
000
)
2011
1 50
0 00
0(1
400
000
-1 6
00 0
00)
110
000
(90
000-
130
000)
67 0
00(5
8 00
0-79
000
)6.
1(5
.7-6
.5)
0.51
(0.4
2-0.
61)
1 30
0 00
0(1
200
000
-1 4
00 0
00)
760
000
(710
000
-830
000
)99
000
(81
000-
120
000)
54 0
00(4
7 00
0-65
000
)1.
6(1
.2-2
.2)
2.8
(2.4
-3.3
)22
0 00
0(1
90 0
00-2
50 0
00)
11 0
00(7
700
-15
000)
1 30
0 00
0(1
200
000
-1 4
00 0
00)
2012
1 60
0 00
0(1
400
000
-1 7
00 0
00)
100
000
(81
000-
130
000)
59 0
00(5
1 00
0-72
000
)6.
1(5
.6-6
.5)
0.45
(0.3
5-0.
55)
1 40
0 00
0(1
300
000
-1 5
00 0
00)
790
000
(730
000
-860
000
)88
000
(70
000-
110
000)
48 0
00(4
0 00
0-59
000
)1.
7(1
.2-2
.2)
2.8
(2.4
-3.3
)20
0 00
0(1
80 0
00-2
30 0
00)
14 0
00(1
1 00
0-18
000
)1
200
000
(1 1
00 0
00-1
300
000
)
2013
1 60
0 00
0(1
500
000
-1 7
00 0
00)
100
000
(79
000-
130
000)
58 0
00(4
9 00
0-72
000
)6.
0(5
.6-6
.6)
0.44
(0.3
4-0.
56)
1 40
0 00
0(1
300
000
-1 5
00 0
00)
820
000
(750
000
-890
000
)89
000
(69
000-
110
000)
48 0
00(4
0 00
0-60
000
)1.
7(1
.3-2
.3)
2.8
(2.4
-3.4
)19
0 00
0(1
70 0
00-2
20 0
00)
13 0
00(9
200-
17 0
00)
1 10
0 00
0(1
000
000
-1 3
00 0
00)
Tab
le 2
. Nat
iona
l HIV
est
imat
es w
ith
bo
und
s (1
990-
2013
)

TOTAL ADULTS (15+) CHILDREN (0-14) ART
ADULTS (15-64)PREVA-LENCE PROPHYLAXIS
Coun
ties
Popu
lati
on
Peop
le L
ivin
g W
ith
HIV
HIV
Pre
vale
nce
Livi
ng W
ith
HIV
New
HIV
infe
ctio
nsan
nual
ly
HIV
-Rel
ated
Dea
ths
Nee
d fo
r ART
NLi
ving
Wit
h H
IV
New
HIV
Infe
ctio
ns a
nnua
lly
HIV
-Rel
ated
Dea
ths
Nee
d fo
r ART
Nee
d fo
r PM
TCT
Adu
lts
rece
ivin
g A
RT
Adu
lt A
RT c
over
age
(%)
Child
ren
rece
ivin
g A
RT
cove
rage
am
ong
Child
ren
(%)
Mal
e
Fem
ale
Mat
erna
l Pro
phyl
axis
%
Kenya 41,792,563 1,599,451 6.04 1,407,615 88,622 48,072 760,694 191,836 12,941 10,393 141,608 79,036 596,228 79 60,141 42 5.6 7.6 55,543 70
Baringo 632,588 10,553 3.00 9,200 707 525 4,498 1,353 34 73 952 540 2,406 53 345 36 2.6 4.3 160 31
Bomet 824,347 27,989 5.80 24,400 1,875 1,393 11,930 3,589 90 195 2,525 1,433 4,511 38 407 16 4.9 8.2 474 36
Bungoma 1,750,634 31,186 3.20 26,100 83 864 17,164 5,086 93 249 3,578 1,500 10,982 64 1,140 32 2.4 4.0 1,083 53
Busia 523,875 19,238 6.80 16,100 51 533 10,588 3,138 58 153 2,207 925 19,398 183 1,657 75 5.1 8.4 938 52
Elgeyo Marakwet 421,282 5,965 2.50 5,200 400 297 2,542 765 19 42 538 305 978 38 89 17 2.1 3.5 124 28
Embu 543,158 11,065 3.70 9,600 518 326 5,540 1,465 28 63 1,046 446 5,132 93 513 49 2.2 5.0 371 61
Garissa 409,007 4,375 2.10 3,300 116 521 1,649 1,075 14 69 755 220 786 48 73 10 0.8 3.6 42 12
Homa Bay 1,053,465 159,970 25.70 140,600 12,279 3,395 70,837 19,370 2,724 1,234 15,235 9,674 49,738 70 6,331 42 23.7 27.4 5,515 62
Isiolo 150,817 3,227 4.20 2,800 151 95 1,616 427 8 18 305 130 969 60 92 30 2.5 5.7 124 77
Kajiado 782,409 23,056 4.40 20,100 1,545 1,147 9,827 2,956 74 161 2,080 1,181 5,219 53 372 18 3.8 6.3 846 51
Kakamega 1,782,152 57,952 5.90 48,500 154 1,605 31,896 9,452 173 462 6,648 2,788 21,014 66 2,224 33 4.4 7.3 2,005 60
Kericho 863,222 18,124 3.40 15,800 1,214 902 7,725 2,324 58 126 1,635 928 9,299 120 832 51 2.9 4.8 835 51
Kiambu 1,760,692 46,656 3.80 42,400 2,931 1,207 23,747 4,256 96 180 3,041 1,500 24,104 102 2,011 66 2.0 5.6 1,518 75
Kilifi 1,262,127 27,907 4.40 24,400 821 1,021 13,868 3,507 87 179 2,459 1,387 9,884 71 1,087 44 2.7 6.3 1,476 113
Kirinyaga 572,889 12,654 3.30 11,500 795 327 6,441 1,154 26 49 825 407 5,831 91 559 68 1.7 4.8 314 55
Kisii 1,259,489 63,715 8.00 56,000 4,891 1,352 28,214 7,715 1,085 492 6,068 3,853 13,629 48 1,169 19 7.3 8.5 1,240 33
Kisumu 1,059,053 134,826 19.30 118,500 10,349 2,861 59,703 16,326 2,296 1,040 12,840 8,153 62,280 104 6,881 54 17.8 20.6 5,917 86
Kitui 1,065,329 21,092 4.30 18,300 988 622 10,561 2,792 54 120 1,994 849 9,273 88 1,269 64 2.5 5.8 698 54
Kwale 739,435 21,159 5.70 18,500 623 774 10,515 2,659 66 136 1,864 1,052 3,227 31 292 16 3.5 8.1 855 67
Laikipia 454,412 10,324 3.70 9,000 692 514 4,400 1,324 33 72 931 529 2,391 54 161 17 3.2 5.3 183 48
Lamu 115,520 1,487 2.30 1,300 44 54 739 187 5 10 131 74 700 95 80 61 1.4 3.2 147 319
Machakos 1,155,957 31,235 5.00 27,100 1,463 921 15,640 4,135 80 177 2,953 1,258 11,542 74 1,609 54 2.9 6.8 1,085 68
Makueni 930,630 25,472 5.60 22,100 1,193 751 12,754 3,372 65 145 2,408 1,026 9,705 76 1,480 61 3.3 7.6 825 59
Mandera 673,356 5,171 1.70 3,900 137 615 1,948 1,271 17 81 892 260 77 4 27 3 0.6 2.9 11 3
Marsabit 306,471 1,729 1.20 1,500 81 51 866 229 4 10 163 70 746 86 93 57 0.7 1.6 100 205
Meru 1,427,135 23,282 3.00 20,200 1,090 686 11,658 3,082 59 132 2,201 937 9,615 82 1,052 48 1.8 4.1 526 37
Migori 1,002,499 88,405 14.70 77,700 6,786 1,876 39,147 10,705 1,506 682 8,419 5,346 34,927 89 3,136 37 13.6 15.7 3,732 88
Mombasa 1,068,307 54,670 7.40 47,800 1,609 2,000 27,168 6,870 171 351 4,817 2,717 26,490 98 1,995 41 4.5 10.5 1,764 38
Muranga 1,022,427 31,581 5.20 28,700 1,984 817 16,074 2,881 65 122 2,058 1,015 7,177 45 656 32 2.8 7.7 468 40
Nairobi 3,781,394 177,552 8.00 164,658 3,098 3,579 102,103 12,894 316 448 9,398 4,982 93,714 92 6,988 74 5.3 8.4 9,700 133
Nakuru 1,825,229 61,598 5.30 53,700 4,127 3,065 26,255 7,898 199 429 5,558 3,154 16,345 62 1,677 30 4.5 7.5 1,692 53
Nandi 857,207 18,697 3.70 16,300 1,253 930 7,969 2,397 60 130 1,687 958 6,507 82 664 39 3.1 5.2 546 46
Narok 968,390 26,956 5.00 23,500 1,806 1,341 11,490 3,456 87 188 2,432 1,380 4,351 38 296 12 4.3 7.1 445 34
Nyamira 653,914 26,738 6.40 23,500 2,052 567 11,840 3,238 455 206 2,546 1,617 6,886 58 972 38 5.8 6.8 785 51
Nyandarua 646,876 14,305 3.80 13,000 899 370 7,281 1,305 29 55 932 460 5,596 77 592 63 2.0 5.6 255 46
Nyeri 752,469 20,797 4.30 18,900 1,307 538 10,586 1,897 43 80 1,355 669 10,471 99 924 68 2.3 6.3 463 58
Samburu 254,997 6,883 5.00 6,000 461 342 2,934 883 22 48 621 352 700 24 55 9 4.3 7.1 50 15
Siaya 920,671 128,568 23.70 113,000 9,869 2,728 56,932 15,568 2,190 992 12,244 7,775 46,413 82 5,285 43 21.8 25.3 5,547 108
Taita Taveta 323,867 11,209 6.10 9,800 330 410 5,570 1,409 35 72 988 557 2,903 52 194 20 3.7 8.7 341 52
Tana River 273,205 1,372 1.00 1,200 40 50 682 172 4 9 121 68 660 97 31 26 0.6 1.5 61 42
Tharaka 384,379 8,760 4.30 7,600 410 258 4,386 1,160 22 50 828 353 4,177 95 538 65 2.5 5.8 172 31
Trans Nzoia 932,223 27,874 5.10 24,300 1,867 1,387 11,881 3,574 90 194 2,515 1,427 6,618 56 725 29 4.4 7.3 464 24
Turkana 973,742 44,736 7.60 39,000 2,997 2,226 19,068 5,736 144 311 4,036 2,291 3,791 20 778 19 6.5 10.8 409 14
Uasin Gishu 1,017,723 28,677 4.30 25,000 1,921 1,427 12,223 3,677 92 200 2,587 1,469 17,614 144 1,895 73 3.7 6.1 466 29
Vihiga 595,301 11,829 3.80 9,900 31 328 6,511 1,929 35 94 1,357 569 6,324 97 769 57 2.8 4.7 680 63
Wajir 434,524 663 0.20 500 18 79 250 163 2 10 114 33 66 26 5 4 0.1 0.3 0 0
West Pokot 583,767 8,603 2.80 7,500 576 428 3,667 1,103 28 60 776 441 1,062 29 121 16 2.4 4.0 92 25
Table 3. County HIV estimates for 2013
Kenya HIV Estimates Report, 2014 21
Annex Table 1. Indicators for Adults 15+
2000 2001 2002 2003 2004 2005 2006 2007 2008 2009 2010 2011 2012 2013
HIV population
Total 1,443,401 1,389,760 1,332,942 1,277,040 1,225,407 1,186,923 1,166,643 1,172,518 1,192,978 1,221,956 1,264,911 1,314,791 1,360,903 1,407,615
Male 605,155 580,842 555,656 531,234 509,092 492,903 484,844 488,218 497,744 510,898 529,971 551,645 571,628 591,991
Female 838,245 808,919 777,286 745,806 716,315 694,020 681,799 684,300 695,234 711,059 734,940 763,146 789,275 815,625
Adult Prevalence (15+) 8.47 7.91 7.36 6.85 6.39 6.02 5.76 5.64 5.58 5.56 5.59 5.65 5.67 5.7
New HIV Infections
Total 105,735 99,173 95,388 93,779 91,456 89,362 90,906 95,038 99,194 95,555 97,146 98,648 87,833 88,622
Male 45,445 42,640 41,023 40,340 39,343 38,449 39,105 40,870 42,645 41,073 41,750 42,396 37,751 38,088
Female 60,290 56,534 54,365 53,439 52,113 50,913 51,801 54,167 56,549 54,482 55,395 56,252 50,083 50,534
incidence 0.7 0.64 0.59 0.56 0.53 0.5 0.49 0.5 0.51 0.47 0.47 0.46 0.4 0.39
Annual Deaths
Total 142,477 146,200 146,221 143,687 138,234 122,648 107,174 87,067 79,020 69,142 58,921 54,455 47,864 48,072
Male 62,408 63,562 63,155 61,719 59,113 52,025 45,152 36,441 33,260 29,202 25,034 23,553 20,821 20,765
Female 80,069 82,637 83,066 81,968 79,121 70,623 62,022 50,627 45,760 39,941 33,887 30,902 27,043 27,307
Annual AIDS Deaths among those on ART
Total 0 0 0 0 410 2,516 4,309 7,197 7,533 9,456 11,509 12,635 14,095 13,540
Male 0 0 0 0 219 1,345 2,292 3,800 3,933 4,964 6,018 6,547 7,360 7,106
Female 0 0 0 0 192 1,171 2,016 3,397 3,600 4,492 5,491 6,089 6,735 6,434
Annual Deaths among those not on ART
Total 142,477 146,200 146,221 143,687 137,824 120,132 102,866 79,870 71,487 59,686 47,411 41,820 33,770 34,532
Male 62,408 63,562 63,155 61,719 58,894 50,679 42,860 32,640 29,327 24,237 19,016 17,007 13,461 13,659
Female 80,069 82,637 83,066 81,968 78,929 69,452 60,006 47,230 42,160 35,449 28,396 24,814 20,308 20,873
2000 2001 2002 2003 2004 2005 2006 2007 2008 2009 2010 2011 2012 2013
HIV Population
Total 212,834 228,766 241,793 251,761 258,416 261,154 260,776 257,890 250,889 242,557 231,075 215,773 204,036 191,836
Male 107,367 115,383 121,933 126,938 130,276 131,636 131,430 129,960 126,417 122,211 116,410 108,682 102,762 96,606
Female 105,468 113,383 119,860 124,823 128,140 129,518 129,346 127,931 124,472 120,346 114,665 107,091 101,274 95,230
New HIV infections
Total 44,374 42,470 40,198 37,825 35,180 31,783 28,873 26,660 22,047 20,850 16,723 11,157 14,168 12,941
Male 22,488 21,523 20,371 19,168 17,827 16,104 14,629 13,506 11,166 10,561 8,469 5,650 7,176 6,554
Female 21,886 20,948 19,827 18,657 17,353 15,678 14,245 13,154 10,881 10,290 8,253 5,506 6,992 6,386
Annual AIDS Deaths
Total 22,835 23,370 23,705 23,887 23,870 23,333 22,121 20,613 18,264 16,761 14,727 5,506 11,323 10,393
Male 11,525 11,793 11,960 12,050 12,040 11,767 11,154 10,392 9,206 8,448 7,421 6,223 5,705 5,236
Female 11,311 11,577 11,745 11,837 11,830 11,566 10,967 10,221 9,058 8,313 7,306 6,130 5,618 5,157
Annex Table 2. Indicators for Children

Kenya HIV Estimates Report, 201422
Annex Table 3. Treatment Indicators
2000 2001 2002 2003 2004 2005 2006 2007 2008 2009 2010 2011 2012 2013
Total need for ART (15+)
Total 227,311 227,658 223,359 216,237 209,470 213,207 228,283 325,340 360,875 405,430 581,860 638,198 700,790 760,694
Male 97,080 96,542 94,188 90,797 87,763 89,568 96,473 137,608 153,305 172,811 246,848 271,032 297,857 323,647
Female 130,231 131,116 129,172 125,440 121,707 123,639 131,810 187,732 207,571 232,618 335,012 367,158 402,933 437,047
Total receiving ART (15+) Male
Number 0 0 0 2840 11362 24416 53964 74218 102,202 138,541 172,208 212,910 238,017 258,700
Percent 0 0 0 3.1 12.9 27.3 55.9 53.9 66 80.2 69.8 78.6 79.9 79.9
Total receiving ART (15+) Female
Number 0 0 0 3400 13598 29677 66425 94016 128,857 177,017 224,317 277,527 310,544 337,528
Percent 0 0 0 2.7 11.2 24 50.4 50.1 62.1 76.1 67.0 75.6 77.1 77.2
ART coverage of eligible population (15+) (%)
Total 0 0 0 2.9 11.9 25.4 52.7 51.7 63.8 77.8 68.2 76.9 78.3 78.4
Male 0 0 0 3.1 13 27.3 55.9 53.9 66 80.2 69.8 78.6 79.9 79.9
Female 0 0 0 2.7 11.2 24 50.4 50.1 62.1 76.1 67 75.6 77.1 77.2
ART coverage of all HIV+ adults (15+) (%)
Total 0 0 0 0.5 2.1 4.6 10.3 14.2 19.1 25.4 30.7 36.7 39.6 41.7
Male 0 0 0 0.6 2.3 5 11.1 15.1 20.1 26.6 31.8 37.9 40.9 43
Female 0 0 0 0.5 1.9 4.3 9.7 13.6 18.3 24.5 30 35.8 38.7 40.8
Children in need of cotrimoxazole (0-14)
304,875 300,477 293,960 286,272 278,047 269,803 262,245 255,968 264,642 282,733 284,689 274,484 264,185 255,382
Number 0 0 0 0 0 0 0 18,396 36,000 47,354 98,337 132,406 116,788 130,016
Percent 0 0 0 0 0 0 0 7.1 14.2 17.2 34 47.3 43.4 50.1
Total coverage for cotrimoxazole (0-14)
0 0 0 0 0 0 0 7.19 13.6 16.8 34.5 48.2 44.2 50.9
Children needing ART (0-14) 86,073 91,301 95,781 99,406 101,834 102,903 103,005 102,154 128,828 162,667 162,911 154,064 148,343 141,608
Number 0 0 0 0 0 2,354 8,333 16,667 20,575 28,370 36,096 48,547 55,439 60,141
Percent 0 0 0 0 0 2.3 8.1 16.2 20.3 18.2 21.3 31 36.6 41.4
ART coverage of eligible popu-lation (0-14)
0 0 0 0 0 2.3 8.1 16.3 16 17.4 22.2 31.5 37.4 42.5
ART coverage of all HIV+ children (0-14)
0 0 0 0 0 0.9 3.2 6.6 8.3 12 16.2 23.1 28 32.4

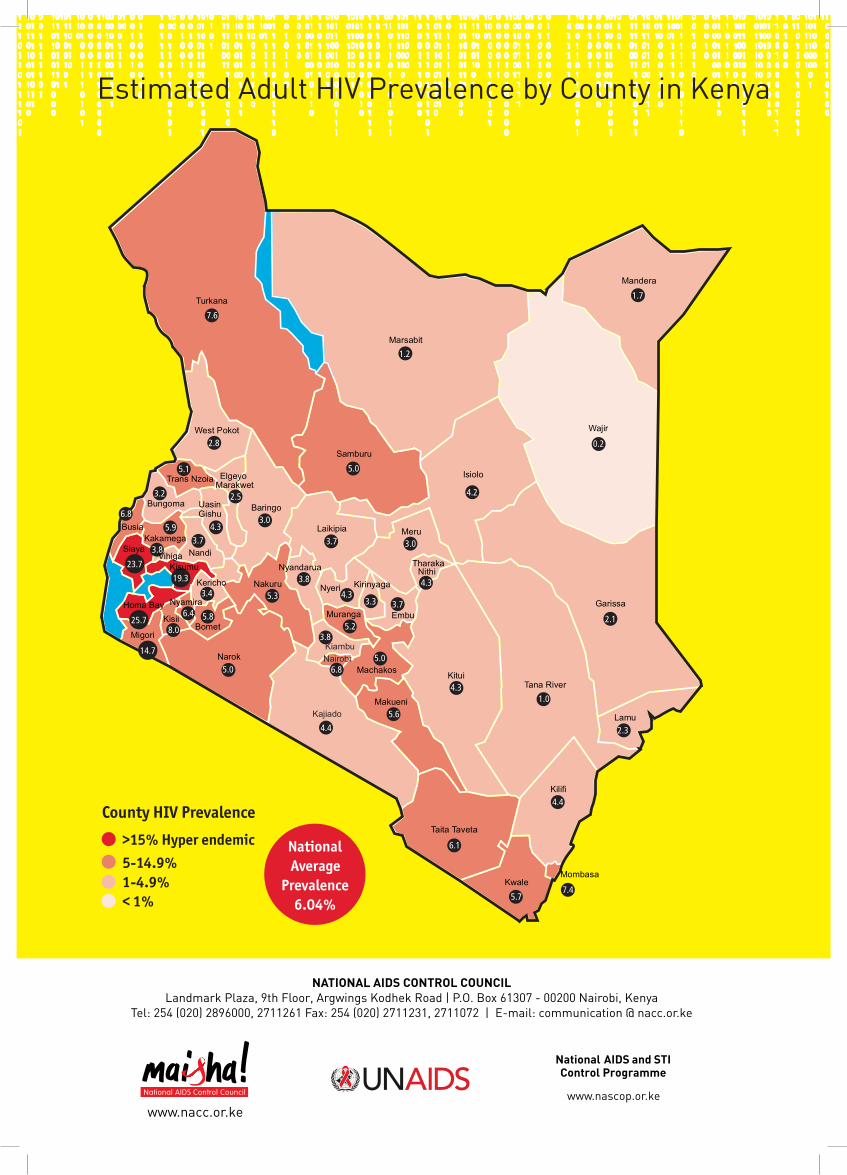
NATIONAL AIDS CONTROL COUNCIL Landmark Plaza, 9th Floor, Argwings Kodhek Road | P.O. Box 61307 - 00200 Nairobi, Kenya
Tel: 254 (020) 2896000, 2711261 Fax: 254 (020) 2711231, 2711072 | E-mail: communication @ nacc.or.ke
3.0
3.4
6.1
6.4
6.8
8.0
5.1
6.8
5.7
7.6
3.8
25.7
19.3
23.7
14.7
5.6
5.9
5.3
5.2
5.0
4.3
4.4
5.0
4.3
4.3
3.8
4.3
5.0
3.7 3.7
3.3
3.8
4.22.5
1.2
0.2
1.7
2.3
1.0
2.1
3.0
3.7
2.8
3.2
5.8
4.4
7.4
5-14.9%>15% Hyper endemic
1-4.9%< 1%
County HIV Prevalence
NationalAverage
6.04%Prevalence
Estimated Adult HIV Prevalence by County in Kenya


