42
| Date post: | 16-Apr-2018 |
| Category: |
Documents |
| Upload: | vuongnguyet |
| View: | 213 times |
| Download: | 1 times |


Kerry - 2004 Interim Results Presentation
• Introduction and Overview Hugh Friel
• Financial Review Brian Mehigan
• Business Review Hugh Friel
• Prospects and Future Development Hugh Friel
• Q&A

2004 Strategic Focus
• Continue to drive profitable growth
• Deliver innovation – fufilling consumer nutritional, lifestyle and
convenience expectations
• Continue to expand technological and research base
Ingredients - lead innovation and expand technology base
Consumer foods - continued brand investment
Flavours - broaden technology and geographical base

• Solid sales and profit growth across all businesses• High rate of innovation – all food and beverage categories• Record business development - €674m acquisition programme• Kerry Bio-Science – important science platform• Significant expansion of technological base:
– natural, sweet and beverage flavours– bio-ingredients and pharma-ingredients– speciality branded flavoured beverage applications– fragrance applications
• Branded consumer food categories – out-performing market growth rates
H1 2004: Good Results and Business Development

• Sales growth of 8.5% to €1,955m
• Operating profit* growth of 10.2% to €147m
• Operating margin* up 10bps
• Earnings per share* up 10.4% to 50.9 cent
• Interim dividend per share up 11.1% to 4.5 cent
• Good cash flow generation
2004 Performance Highlights
Note: * before goodwill and exceptional items

Food Industry Update
• ‘Wellness’ and dietary concerns – fuelling product re-formulations and new product introductions
• ‘Foods Minus’ positioning
– low fat, no additives, low calorie, low cholesterol, low-carb, low sodium
• ‘Foods Plus’ positioning
– organic, all-natural, high protein, functional, added fibre, quality convenient products, on-the-go foods and beverages, increased diversity and intensity of flavours
• 25% of low-carb product launches include soy protein

Financial Review 2004

2004 Financial Highlights
Note: * before goodwill and exceptional items
Turnover
Operating profit*
Earnings*
EPS*
Free Cash Flow
€1,955m +8.5%+3.8% like-for-like
€147m +10.2%+6.1% like-for-like
€95m +10.7%
50.9 cent +10.4%
€85m +€74m

Financial Comments
• Good organic trading performance
• Good management of financial resources
• Significant effort in acquisitions process - identification,
execution and integration
• Interest, taxation and insurance rates favourable
• Currencies, pensions and energy inputs more expensive

Euro - US Dollar Trend
0.90
0.95
1.00
1.05
1.10
1.15
1.20
1.25
1.30
1.35
1.40
Jan Feb Mar Apr May Jun Jul Aug Sep Oct Nov Dec
1.14
1.22
1.26
2004
2003
H1 H2
Avg Fx Rate H1
% Change +8.0

Euro - Sterling Trend
0.64
0.65
0.66
0.67
0.68
0.69
0.70
0.71
0.72
Jan Feb Mar Apr May Jun Jul Aug Sep Oct Nov Dec
0.67
0.68
H1 H2
Avg Fx Rate H1
% Change -2.9%
0.702003
2004

Turnover Analysis
H1 2003 H1 2004€1,802m €1,955m
+4%Like-for-like
+6%Acquisition/Disposal
-1%Currency
+9%

Geographic Analysis
Ireland34%
Rest of Europe36%
Americas26%
Asia Pacific
4%
Turnover : Geographical
Half Year Growth %
Like-for-like Reported
Ireland 1.6 2.2
Rest of Europe 3.5 11.6
Americas 6.1 11.2
Asia Pacific 11.0 22.0
Group 3.8 8.5

Like-for-like Acquisition / Currency ReportedGrowth Disposal Growth
Ireland 2% 0% 0% 2%
Rest of Europe 4% 6% 2% 12%
Americas 6% 14% (9%) 11%
Asia Pacific 11% 8% 3% 22%
Group 4% 6% (1%) 9%
Turnover : Like-for-like

Geographic Analysis
Operating Profit* Growth
Half Year Growth %
Like-for-like Reported
Ireland 0.1 1.7
Rest of Europe 6.1 10.9
Americas 9.0 13.0
Asia Pacific 16.7 28.3
Group 6.1 10.2
Note: * before goodwill and exceptional items
Ireland22%
Rest of Europe36%
Americas37%
Asia Pacific
5%

2003 margin reported 4.8% 7.6% 10.8% 7.5% 7.4%
Acquisitions / disposals 0.0% (0.2%) (0.1%) 0.1% (0.1%)
Currency 0.0% 0.0% 0.0% 0.0% 0.0%
Like-for-like 0.0% 0.2% 0.3% 0.3% 0.2%
2004 margin reported 4.8% 7.6% 11.0% 7.9% 7.5%
Ireland ROE Americas Asia Pacific Total
Operating Margin* % by Region
Note: * before goodwill and exceptional items

H1 2003 H1 2004
66% Debt : Equity 88%
26% Debt : EV 29%
2.3x Debt : EBITDA* 2.9x
8.6x EBITDA* : Net interest 12.0x
15.3% Return on average equity 15.0%
Financial Ratios
Note: * Prepared in accordance with the provisions of the banking covenants

H1 2004 FY 2003 FY 2002 FY 2001
ROAE 15.0% 15.2% 15.2% 14.8%
ROACE 10.7% 11.4% 11.6% 11.8%
CFROI 14.4% 12.5% 14.6% 9.6%
Return on Investment

Exceptional Items
• Plant rationalisation programme, particularly in the US costing €20m on track
• Related taxation and asset disposal programme to offset the financial impact
• Separate €15m to €20m integration programme relating to the Quest acquisition underway

Business Reviews

H1 2004 Kerry Strategy: Performance
• Organisational entrepreneurial culture delivering strongly
• Consistency of strategy - performance
• Clarity of focus
• Leveraging consumer awareness and technologies to meet
customer - consumer requirements
• Capability to consistently deliver innovation, business growth
and successful acquisition programmes

Business Review - Ireland
Ireland
Turnover €670m 2.2% +1.6%
Operating Margin 4.8% +0bps +0bps
2004 Total Growth Like for Like
• Speciality dairy and proteins – progress in functional and low-carb products
• Foods’ brands – excellent performance
• Denny, Cheestrings, Charleville out-performing market growth rates
• Launch of Dawn Omega Milk
• Further innovation in ‘food-to-go’ and snack convenience products
• Continued price / cost pressure in poultry sector

Business Review – Rest of Europe
Rest of Europe
Turnover €694m 11.6% +3.5%
Operating Margin 7.6% +0bps +20bps
2004 Total Growth Like for Like
• Good business development - particularly UK, Germany and EU accession countries
• Prepared meals and convenience sector sustained growth• Food coatings systems - advance in seafood, poultry and new
foodservice categories• Cross-divisional business development in functional bars and
sports / lifestyle products• Wall’s, Richmond brands solid growth• Encouraging performance in UK chilled desserts• Mastertaste Italy – strong performance

Business Review - Americas
Americas
Turnover €504m 11.2% +6.1%
Operating Margin 11.0% +20bps +30bps
2004 Total Growth Like for Like
• Significant increase in new product introductions and recipe development
• Sweet ingredients, specialty ingredients and Nutriant - progress through managed carb solutions
• Seasonings – progress through meat industry and regional snack processors
• Speciality beverages sector - excellent progress• Mexico / Central America - good progress through seasonings and
nutritional beverage applications• Brazil – continued progress in artisinal ice-cream and through
seasonings into meat sector

Business Review – Asia Pacific
Asia Pacific
Turnover €87m +22.0% +11.0%
Operating Margin 7.9% +40bps +30bps
2004 Total Growth Like for Like
• Strong performance in all regional markets
• Australia / New Zealand sustained growth in all core categories
• Asia - excellent growth through nutritional products and flavoured
beverage applications
- progressing planned investment strategy

Successful H1 Acquisition Programme
• Ingredients Businesses - Quest Food Ingredients- Cremo Ingredients
• Foodservice Businesses - Oregon Chai- Extreme Foods
• Flavour Businesses - Manheimer- Flavurence- Laboratorios Krauss- Fructamine
• Fragrance Business - Manheimer Fragrances
Total cost €674m
Business integration – progressing satisfactorily

Kerry Bio-Science Overview
• Extending Kerry’s technological and research base – new science foundation
– pharma-ingredients and bio-ingredients
• Technologies
– proteins, enzymes, fermented ingredients, yeast, emulsifiers and hydrocolloids
• Applications
– pharmaceutical, nutritional, beverage, bakery, culinary, snacks, dairy and confectionery
• Opportunity
– To leverage research and technology through Kerry’s complementary businesses
– Patented nutritional solutions
– Strong pipeline of development projects with leading pharma-companies –cell tissue culture, diagnostics and therapeutic drugs

Current Trading and Outlook
• All core businesses performing well
• Progressive business development and expansion driven by strong organisational innovation and entrepreneurial culture
• Continuing NPD and brand development
• Important new research and technology platforms
• Expect good results for full year 2004

Additional Information

Group
Ireland €670.0 €32.2 4.8% €655.6 €31.7 4.8%
Rest of Europe €693.6 €52.4 7.6% €621.4 €47.2 7.6%
Americas €504.4 €55.3 11.0% €453.5 €48.9 10.8%
Asia Pacific €87.3 €6.9 7.9% €71.6 €5.4 7.5%
Total €1,955.3 €146.8 7.5% €1,802.1 €133.2 7.4%
H1 2004 H1 2003Operating Operating
Turnover Profit* % Turnover Profit* %
Analysis of Results by Region (€m)
Note: * before goodwill and exceptional items

2002 2003 2004
Ireland 2% 9% 2%
Rest of Europe 5% 5% 4%
Americas 5% 3% 6%
Asia Pacific 6% 7% 11%
Group 5% 6% 4%
Turnover : Like-for-like % Growth

Geographic Analysis
Ireland22%
Rest of Europe36%
Americas37%
Asia Pacific
5%
Operating Profit* Margin
€m Margin% Margin%
Ireland 32 4.8 4.8
Rest of Europe 53 7.6 7.6
Americas 55 11.0 10.8
Asia Pacific 7 7.9 7.5
Group 147 7.5 7.4
Note: * before goodwill and exceptional items
H1 2004 H1 2003

50.9
112.1
46.1
101.8
41.8
87.9
36.4
79.2
32.8
68.0
28.2
57.4
23.2
46.7
19.7
38.7
16.5
35.8
14.8
0
20
40
60
80
100
120
1995 1996 1997 1998 1999 2000 2001 2002 2003 2004
Adjusted EPS* Growth (cent)
Half Year Full Year
Note: * before goodwill and exceptional items

EPS Reconciliation
2003 2004 Growth€ cent € cent %
46.1 Adjusted EPS* 50.9 10.4%
(13.3) Goodwill amortisation (16.3)
0.6 Exceptional items (net of tax) (1.5)
33.4 FRS3 EPS 33.1 -0.9%
Note: * before goodwill and exceptional items

Interim Cash Flow (€m)
Cash from operations 193 97Interest and taxation (44) (35)Capital expenditure (48) (36)Equity dividends (16) (15)Free cash flow 85 11Acquisitions and disposals
- Businesses acquired (698) (127) - Acquisitions restructuring (2) (9)
(700) (136)Financing - issue of share capital 5 1
(610) (124)Exchange adjustment (19) 36Increase in borrowings (629) (88)Opening net debt (705) (764)Closing net debt (1,334) (852)
2004 2003

Euro 463 463 -
Sterling 118 118 -
US Dollar 703 603 100
Others 50 50 -
1,334 1,234 100
93% 7%
Weighted average period for which rate is fixed: 2.3 years
Net @ Floating @ FixedBorrowings Rates Rates
Debt Profile (€m)

30 June 2004 31 Dec 2003€m €m
Cash deposits (51) (57)
Within one year 166 18
Between 1 and 2 years 7 142
Between 2 and 5 years 638 31
Between 5 and 10 years 316 321
After 10 years 258 250
1,334 705
Weighted average maturity in years: 6.2 7.8
Maturity Profile of Net Debt
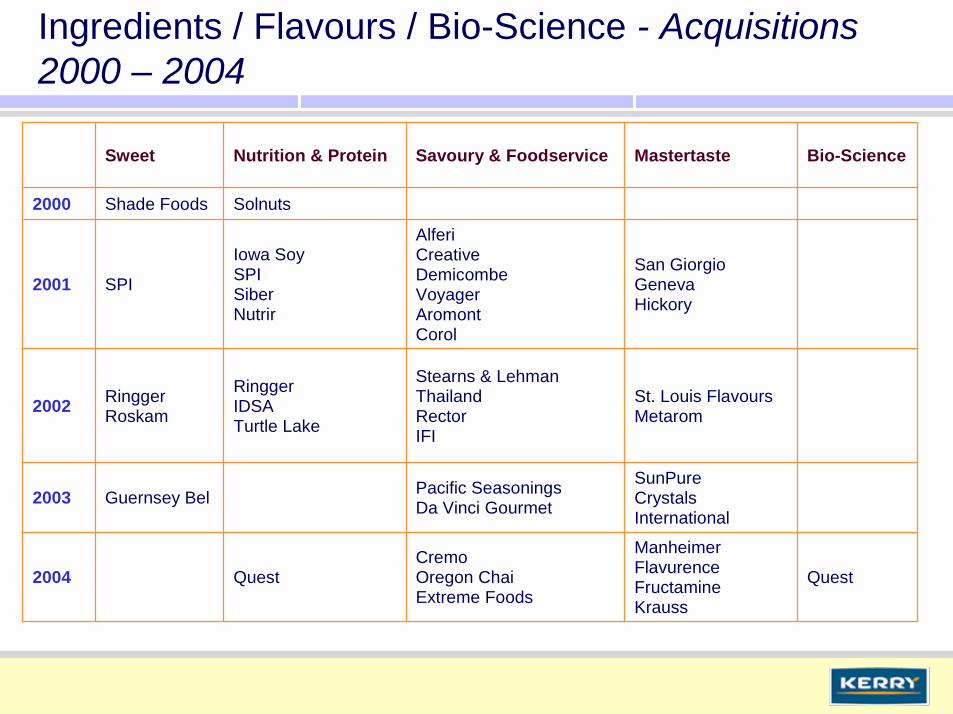
Quest
ManheimerFlavurenceFructamineKrauss
CremoOregon ChaiExtreme Foods
Quest2004
SunPureCrystals International
Pacific SeasoningsDa Vinci GourmetGuernsey Bel2003
St. Louis FlavoursMetarom
Stearns & LehmanThailandRectorIFI
RinggerIDSATurtle Lake
RinggerRoskam2002
San GiorgioGenevaHickory
AlferiCreativeDemicombeVoyagerAromontCorol
Iowa SoySPISiberNutrir
SPI2001
SolnutsShade Foods2000
Bio-ScienceMastertasteSavoury & FoodserviceNutrition & ProteinSweet
Ingredients / Flavours / Bio-Science - Acquisitions 2000 – 2004

Convenience Savoury Cheese & Ready Foodservice DirectSnacking Products Spreads Meals Sales
Golden Vale � � � �
Platters �
Deli Products � �
Northern Foods � � �
(Van Distribution)
Freshways � �
Hibernia / Diversity � � �
Consumer Foods Acquisitions 2000 - 2004

EPS Broker Estimates - Full Year 2004
2004 EPS %€ Cent Growth
Consensus 122.0 8.8
Davy 120.7 7.7
SSSB 120.8 7.8
ABN Amro 122.9 9.6
Goodbody 123.3 10.0
Merrion 123.6 10.3
NCB 122.8 9.5
Cazenove 119.6 6.7

Foreign Ownership27%
Irish Ownership73%
Kerry Co-op 31%
Irish Individuals 25%
Irish Institutions 17%
North American Institutions 19%
UK Institutions 5%
Continental Europe / Rest of World Institutions 3%
Shares in issue: 186 million
Shareholder Analysis
30 April 2004


![Kerry Group[1]](https://static.documents.pub/doc/80x56/577d24331a28ab4e1e9bda48/kerry-group1.jpg)


