99
Integrated Solutions for a Global Market Annual Report & Accounts 2009 Kerry Group

Integrated Solutions for a Global Market
Annual Report & Accounts 2009Kerry Group

Revenue(€ million)
20092008200720062005
4,52
0.7
4,79
0.8
4,78
7.8
4,64
5.9
4,42
9.8
Profit before taxation and non-trading items(€ million)
20092008200720062005
335.
8
316.
7
309.
4
294.
7
301.
5
Cash (EBITDA*) per share(cent)
20092008200720062005
296.
9
287.
9
279.
3
261.
7
257.
6
1
Contents
Financial Highlights 01
Chairman’s Statement 02
Chief Executive’s Review 04
Business Review: Ingredients & Flavours 08
Business Review: Consumer Foods 16
Financial Review 20
Corporate Social Responsibility 24
Financial History 29
Directors and Other Information 30
Report of the Directors 32
Independent Auditors’ Report 42
Statement of Accounting Policies 44
Group Financial Statements 51
Our mission
Kerry Group will be the world leader in food ingredients and flavours serving the food and beverage industry, and a leading supplier of added value brands and customer branded foods to the Irish and UK markets.
Through the skills and wholehearted commitment of our employees, we will be leaders in our selected markets – excelling in product quality, technical and marketing creativity and service to our customers.
We are committed to the highest standards of business and ethical behaviour, to fulfilling our responsibilities to the communities which we serve and to the creation of long-term value for all stakeholders on a socially and environmentally sustainable basis.
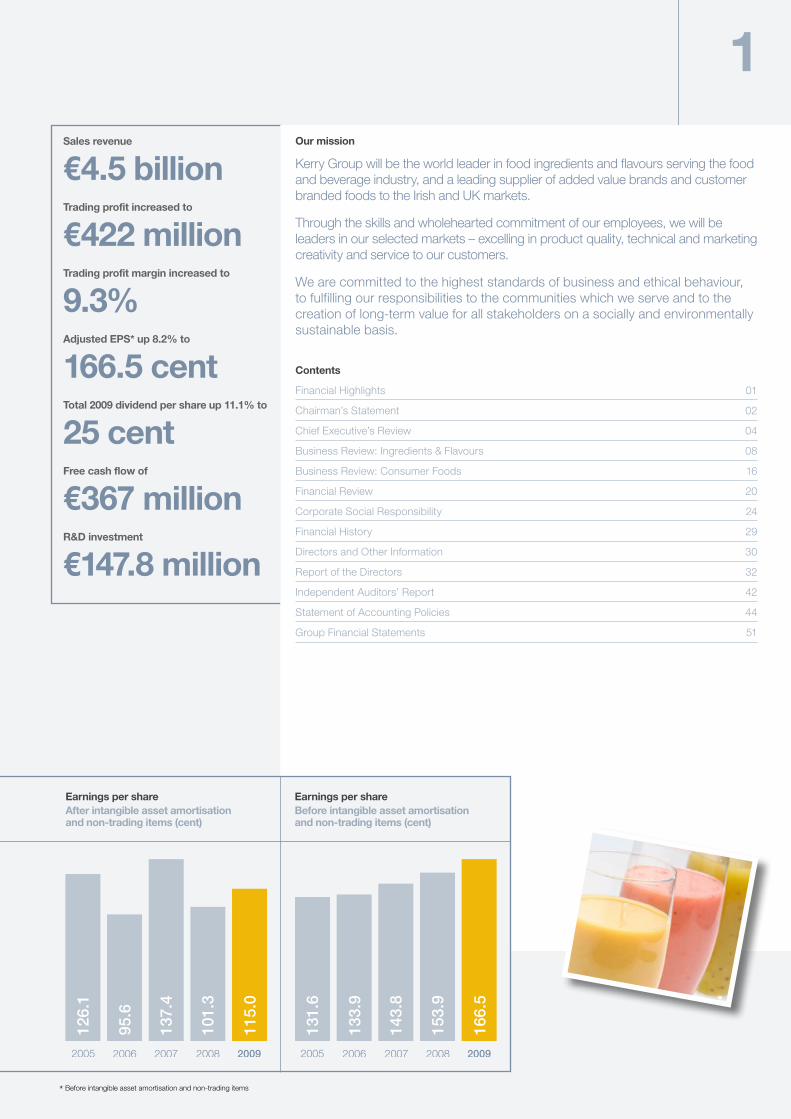
Sales revenue
€4.5 billionTrading profit increased to
€422 millionTrading profit margin increased to
9.3%Adjusted EPS* up 8.2% to
166.5 centTotal 2009 dividend per share up 11.1% to
25 centFree cash flow of
€367 millionR&D investment
€147.8 million
20092008200720062005
115.
0
101.
3
137.
4
95.6
126.
1
20092008200720062005
166.
5
153.
9
143.
8
133.
9
131.
6
Earnings per shareAfter intangible asset amortisation and non-trading items (cent)
Earnings per shareBefore intangible asset amortisation and non-trading items (cent)
* Before intangible asset amortisation and non-trading items

Chairman’s Statement
Chairman’s Statement
3In a year of considerable change, particularly at consumer level, I am pleased to report that Kerry achieved a good set of results and a strong operational performance in 2009. The Group made sustained progress, delivering on its strategic objectives despite the impact of the challenging economic conditions in all major economies on consumer purchasing. Our focus on building and strengthening Kerry’s core ingredients & flavours and consumer foods’ businesses contributed significantly to the robust operational and financial results for the year. I am confident that our achievements in 2009 augur well for the future profitable growth of the Group.
ResultsSales revenue reported at €4.5 billion reflects a 2.2% increase in continuing business volumes. Trading profit increased by 3.8% on a like-for-like basis to €422m which meant that the Group trading profit margin increased by 80 basis points to 9.3%. Adjusted earnings per share increased by 8.2% to 166.5 cent.
Strategic DevelopmentDetails of the performance of Group businesses in 2009 are presented in the Chief Executive’s Review and in the Business Reviews of the report. The Kerry organisation is well aligned to the economic and market challenges facing the global food and beverage industries. Our ingredients & flavours technologies and end-use-market focus have achieved excellent results and we continue to develop ever-stronger customer alliances as an integrated solutions provider to global and regional accounts. The Group’s consumer foods’ businesses in the UK and Ireland have withstood the challenges posed by the significant downturn in both economies and by the depreciation of the sterling/euro exchange rate. Kerry Foods’ investment plans and on-going efficiency programmes will enable
the division’s leading brands and its selected private label offerings to meet consumer requirements for everyday low pricing, while maintaining high product quality standards.
DividendThe Board recommends a final dividend of 17.3 cent per share, an increase of 10.9% on 2008. Together with the interim dividend of 7.7 cent per share, this raises the total dividend for the year to 25 cent per share, reflecting an increase of 11.1% on the total 2008 dividend. The final dividend will be paid on 14 May 2010 to shareholders registered on the record date 16 April 2010.
Board ChangesI would like to thank James O’Connell and Desmond O’Connor, who retired from the Board at year-end, for their individual contributions and service to the Kerry organisation over the years. James and Desmond were succeeded as non-executive Directors of the company by Michael Fleming and John Twomey who joined the Board in January 2010.
ProspectsManagement’s views regarding the prospects for the Group in 2010 are outlined in the Chief Executive’s Review. The Board is confident that the Group’s strong operating momentum coming into 2010 will continue to deliver good growth and value for all stakeholders into the foreseeable future.
Our people and management throughout the Kerry organisation are central to the Group’s sustained profitable growth and development. May I take this opportunity to record the appreciation of the Board to Stan McCarthy Chief Executive, to management at all levels, and to all employees for their individual contributions to the Group’s success in 2009.
Denis Buckley, Chairman22 February 2010
In a year of considerable change, particularly at consumer level, I am pleased to report that Kerry achieved a good set of results and a strong operational performance in 2009. The Group made sustained progress, delivering on its strategic objectives despite the impact of the challenging economic conditions in all major economies on consumer purchasing.

Chief Executive’s Review
Chief Executive’s Review
Revenue
Ingredients & Flavours 66%
Consumer Foods 34%
Trading Profit
Ingredients & Flavours 74%
Consumer Foods 26%
Group revenue by destination
EMEA 63%
Americas 28%
Asia-Pacific 9%
5The Kerry business model performed robustly in what was a challenging environment in 2009 – delivering excellent product and business development opportunities, good margin improvement and cash generation. Our Group trading profit margin increased by 80 basis points to 9.3%, with ingredients & flavours contributing a 90 basis points improvement and consumer foods achieving a 40 basis points margin improvement.
The slowdown in economic growth in all regions adversely affected consumer confidence which led to increased personal saving and reduced expenditure on food and beverages in most markets. Strong promotional programmes resulted in increased shopping in value channels and increased market shares for private-label offerings at the expense of premium branded lines. Out-of-home expenditure was reduced which impacted foodservice growth particularly in full-serve restaurants, while major quick-serve outlets saw good growth year-on-year. As a result new-product-development was slow during the year but improved considerably in Q4 as food and beverage manufacturers targeted new growth opportunities and increased market differentiation in response to consumer trends.
Business performance throughout Kerry’s end-use-markets continued to improve as the year progressed and the performance of all Group businesses in Q4 was particularly encouraging. The Group’s re-organised ingredients & flavours business model, implemented through the ‘go-to-market’ programme, delivered strong results – leveraging Kerry’s entire food and beverage technology base, end-use-market focus and applications expertise. The Group’s consumer foods division performed well despite the slump in consumer spending in the Irish and UK markets and the impact of the adverse sterling to euro exchange rate in exporting from Ireland to the UK. We are greatly encouraged by the underlying performance and margin improvement in all Group businesses. This improvement also reflects the on-going
efficiency programmes throughout the Group and synergies flowing from the business re-organisation programmes.
ResultsGroup sales revenue in 2009 reported at €4.5 billion reflects a 4.8% reduction on a like-for-like (LFL) basis. However; allowing for elimination of non-core activities as a result of the ‘go-to-market’ and business restructuring programmes, improvements to product mix, lower pricing and trading currency movements; continuing business volumes were 2.2% ahead on a Group-wide basis. Continuing business volumes improved by 2.9% in ingredients & flavours and recovered in consumer foods as the year progressed to equal the 2008 level. Business restructuring in the Group’s ingredients & flavours regional businesses was completed by year-end and was well advanced in the consumer foods division.
Trading profit increased to €422m, reflecting a 3.8% (LFL) increase and 80 basis points improvement in the Group trading profit margin to 9.3%. Ingredients & flavours achieved a 90 basis points improvement in trading profit margin to 10.4% and margins in consumer foods, driven by business efficiency programmes, increased by 40 basis points to 7.1%.
Profit before tax and non-trading items increased by 6% to €335.8m. Profit after tax before intangible asset amortisation and non-trading items increased by 8.4% to €291m. Adjusted earnings per share increased by 8.2% to 166.5 cent. Basic earnings per share increased from 101.3 cent to 115 cent.
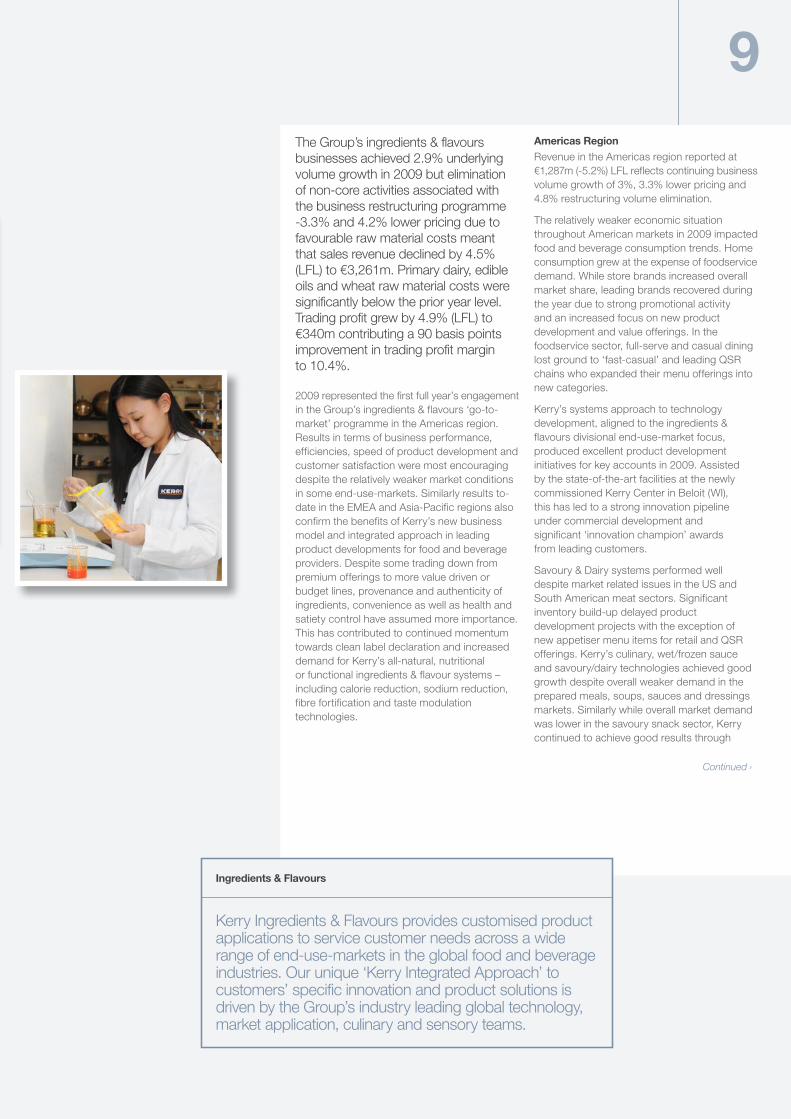
Business ReviewsIngredients & Flavours The Group’s ingredients & flavours businesses achieved 2.9% underlying volume growth in 2009 but elimination of non-core activities associated with the business restructuring programme -3.3% and 4.2% lower pricing due to favourable raw material costs meant that sales revenue declined by 4.5% (LFL) to €3,261m. Primary dairy, edible oils and wheat raw material costs were significantly below the prior year level. Trading profit grew by 4.9% (LFL) to €340m contributing a 90 basis points improvement in trading profit margin to 10.4%.
2009 represented the first full year’s engagement in the Group’s ingredients & flavours ‘go-to-market’ programme in the Americas region. Results in terms of business performance, efficiencies, speed of product development and customer satisfaction were most encouraging despite the relatively weaker market conditions in some end-use-markets. Similarly results to-date in the EMEA and Asia-Pacific regions also confirm the benefits of Kerry’s new business model and integrated approach in leading product developments for food and beverage providers. Despite some trading down from premium offerings to more value driven or budget lines, provenance and authenticity of ingredients, convenience as well as health and satiety control have assumed more importance. This has contributed to continued momentum towards clean label declaration and increased demand for Kerry’s all-natural, nutritional or functional ingredients & flavour systems – including calorie reduction, sodium reduction, fibre fortification and taste modulation technologies.
Revenue in the Americas region reported at €1,287m (-5.2%) LFL reflects continuing business volume growth of 3%, 3.3% lower pricing and 4.8% restructuring volume elimination.
In the EMEA region, revenue reported at €1,124m (-6.2% LFL) reflects continuing business volume growth of 2.3%, 5% lower pricing, favourable trading currency impact of 0.2% and 3.7% restructuring volume elimination.
Revenue in the Asia-Pacific region reported at €404m (+6.6% LFL) reflects continuing business volume growth of 9.1% and 2.5% lower pricing.
Consumer Foods The challenging economic environment in Ireland and the UK impacted all consumer food categories in 2009. Consumption trends changed significantly as shoppers traded down to more value offerings and responded to the increased level of promotional activity.
Against this background Kerry Foods’ brands in the UK market performed well but in Ireland Kerry’s brands underperformed versus private label offerings. In addition exports from Ireland to the UK were negatively impacted by the depreciation of the sterling/euro exchange
Analysis of revenue and trading profit
Revenue Ingredients & Flavours €3,261m
Consumer Foods €1,713m
Trading profit Ingredients & Flavours €340m
Consumer Foods €122m

7rate which caused significant restructuring of operations during the year. Strong investment plans were in place by year-end to reposition Kerry’s brands and meet ‘value focused’ consumer requirements for everyday low pricing.
While continuing business volumes recovered as the year progressed to equal the 2008 level, divisional sales revenue declined by 6.1% (LFL) to €1,713m. This reflects a 1.6% volume reduction due to business restructuring, 3.2% lower pricing and an adverse trading currency impact of 1.3%. On a reported basis divisional trading profit at €122m was down from €126m but was unchanged from the previous year on a like-for-like basis. Business efficiency programmes, including ‘lean manufacturing’, enabled the division to grow its trading profit margin by 40 basis points to 7.1%.
The performance of the Group’s ingredients & flavours and consumer foods’ businesses is reviewed in detail in the Business Review section of this report.
FinanceBusiness realignment relating to our ingredients & flavours ‘go-to-market’ programme is now complete. Consumer Foods progressed the value chain efficiency programme commenced in 2008 and following the acquisition of Breeo Foods in March the acquired business was integrated into Kerry Foods. The after tax impact of these restructuring activities, combined with the disposal of non-core businesses and assets, was a net expense of €73.3m. These activities resulted in a net cash outflow (after related tax) of €9.4m and a further €35.5m is expected to be paid in 2010 in relation to costs incurred in 2009.
The Group achieved a free cash flow of €367m (2008: €227m) which is stated after net capital expenditure of €108m (2008: €145m). This includes a €133m reduction in working capital – approximately €100m of which can be attributed to the Group’s restructuring programmes.
Finance costs for the year decreased by €7.9m to €69.8m (2008: €77.7m) as strong cash flows and lower interest rates more than offset the impact of acquisitions and capital investment. During 2009 the Group’s average interest rate decreased approximately 80 basis points to 5.0%.
The tax charge for the year, before non-trading items, decreased by 2.4% to €61.2m (2008: €62.7m) which represents an effective tax rate of 18.2% (2008: 19.8%). The decrease in the effective tax rate is primarily due to variations in the geographical split of profits earned, increased tax credits for research and development expenditure and changes in local statutory tax rates.
At 31 December 2009 net debt was €1,159m (2008: €1,164m). Net debt to EBITDA declined to 2.2 times (2008: 2.3 times). Since the year end the Group has completed the issuance of US$600m of senior notes across four tranches with maturities ranging from 7 to 15 years. These senior notes were raised in the US private placement market and will be used primarily for the repayment of near term debt at the balance sheet date.
Future ProspectsThe Kerry business model has performed robustly through the recent challenging economic environment in major consumer markets. Our ingredients & flavours technology platforms, working synergistically with our end-use-market product development teams, will continue to deliver innovative solutions for leading customers in global food and beverage markets. In the Group’s consumer foods UK and Irish marketplace, the brand strategies and investment programmes now in place will enable our leading brands to compete successfully and position our offers for the value focused consumer.
Our strategies will enable sustained business margin improvement and we are confident of delivering earnings growth in 2010 to a range of 182 to 185 cent per share (2009: 166.5 cent).
Stan McCarthy, Chief Executive22 February 2010
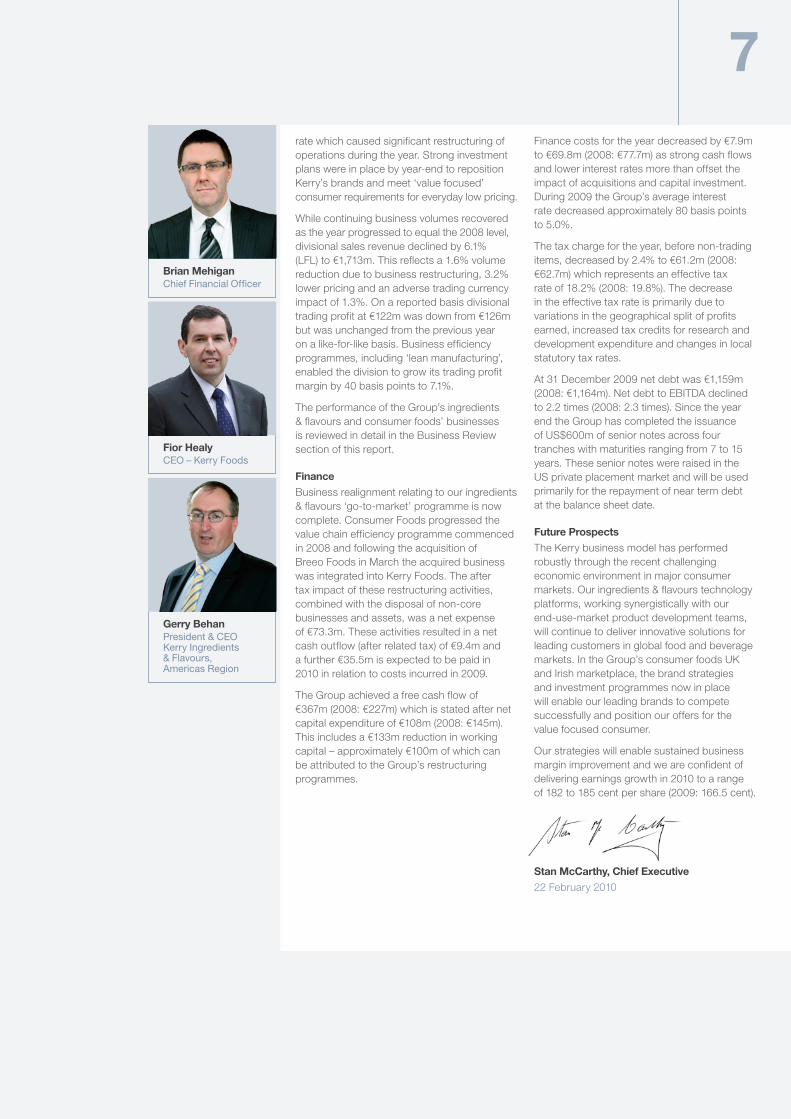
Fior HealyCEO – Kerry Foods
Gerry BehanPresident & CEO Kerry Ingredients & Flavours, Americas Region
Brian MehiganChief Financial Officer

Ingredients & Flavours
Ingredients & FlavoursBusiness Review
Revenue by destination
EMEA 39%
Americas 46%
Asia-Pacific 15%
Ingredients & Flavours 2009Like-for-like (LFL) growth
Revenue €3,261m -4.5%
Trading profit €340m 4.9%
9The Group’s ingredients & flavours businesses achieved 2.9% underlying volume growth in 2009 but elimination of non-core activities associated with the business restructuring programme -3.3% and 4.2% lower pricing due to favourable raw material costs meant that sales revenue declined by 4.5% (LFL) to €3,261m. Primary dairy, edible oils and wheat raw material costs were significantly below the prior year level. Trading profit grew by 4.9% (LFL) to €340m contributing a 90 basis points improvement in trading profit margin to 10.4%.
2009 represented the first full year’s engagement in the Group’s ingredients & flavours ‘go-to-market’ programme in the Americas region. Results in terms of business performance, efficiencies, speed of product development and customer satisfaction were most encouraging despite the relatively weaker market conditions in some end-use-markets. Similarly results to-date in the EMEA and Asia-Pacific regions also confirm the benefits of Kerry’s new business model and integrated approach in leading product developments for food and beverage providers. Despite some trading down from premium offerings to more value driven or budget lines, provenance and authenticity of ingredients, convenience as well as health and satiety control have assumed more importance. This has contributed to continued momentum towards clean label declaration and increased demand for Kerry’s all-natural, nutritional or functional ingredients & flavour systems – including calorie reduction, sodium reduction, fibre fortification and taste modulation technologies.
Americas RegionRevenue in the Americas region reported at €1,287m (-5.2%) LFL reflects continuing business volume growth of 3%, 3.3% lower pricing and 4.8% restructuring volume elimination.
The relatively weaker economic situation throughout American markets in 2009 impacted food and beverage consumption trends. Home consumption grew at the expense of foodservice demand. While store brands increased overall market share, leading brands recovered during the year due to strong promotional activity and an increased focus on new product development and value offerings. In the foodservice sector, full-serve and casual dining lost ground to ‘fast-casual’ and leading QSR chains who expanded their menu offerings into new categories.
Kerry’s systems approach to technology development, aligned to the ingredients & flavours divisional end-use-market focus, produced excellent product development initiatives for key accounts in 2009. Assisted by the state-of-the-art facilities at the newly commissioned Kerry Center in Beloit (WI), this has led to a strong innovation pipeline under commercial development and significant ‘innovation champion’ awards from leading customers.
Savoury & Dairy systems performed well despite market related issues in the US and South American meat sectors. Significant inventory build-up delayed product development projects with the exception of new appetiser menu items for retail and QSR offerings. Kerry’s culinary, wet/frozen sauce and savoury/dairy technologies achieved good growth despite overall weaker demand in the prepared meals, soups, sauces and dressings markets. Similarly while overall market demand was lower in the savoury snack sector, Kerry continued to achieve good results through
Kerry Ingredients & Flavours provides customised product applications to service customer needs across a wide range of end-use-markets in the global food and beverage industries. Our unique ‘Kerry Integrated Approach’ to customers’ specific innovation and product solutions is driven by the Group’s industry leading global technology, market application, culinary and sensory teams.
Ingredients & Flavours
Continued ›

Savoury & Dairy
Ingredients & FlavoursBusiness Review
11Prepared mealsConsumers are constantly seeking quality, varied and convenient meal solutions. Kerry offers its customers innovative solutions and development expertise across a wide range of prepared meal applications.
Soups sauces & dressingsOur technology expertise provides customers with a comprehensive line of customised soup, sauce and dressing applications.
Savoury snacksKerry Ingredients & Flavours has industry-leading expertise in supplying customers with customised savoury snack solutions in line with changing consumer tastes and dietary health requirements.
MeatsWe utilise our considerable experience in meat flavourings, coatings and functional savoury systems to provide customers with innovative product solutions, specifically customised for the meat processing industry.
Appetisers & side dishesMeal accompaniments and appetisers are a key component in consumer meal solutions. Kerry Ingredients & Flavours provides a broad range of specialised appetiser and side-dish concepts and applications to customers.
DairyOur positioning as a leading-edge developer of dairy ingredients places us in an unrivalled position to provide customers with a comprehensive range of dairy application solutions.
its integrated technology platforms enabling development of fusion flavours and ‘better-for-you’ lines. The acquisition of Prima S.A. – a Costa Rican based savoury ingredients & flavours business, strengthened the Group’s positioning in Central American markets.
Cereal & Sweet market segments proved challenging in 2009. The significant shift from premium to value offerings slowed market development in H1, but an increased focus on product differentiation led to good opportunities for Kerry technologies as the year progressed. Sales volumes were lower but Kerry’s offering of innovative, value and consumer preferred product concepts achieved above average industry growth. The ready-to-eat cereal sector saw increased development of high-fibre and life-stage, more complex cereal products. Prior to year-end, California based Nutritional Food Products was acquired to complement Kerry’s RTE cereal systems & flavours capability with the addition of puffed grain cereal technology. In the frozen desserts sector, the frozen novelties category recorded good growth. Demand for increased shelf-life and new ‘healthy’ product lines in the bakery sector provided solid growth opportunities for Kerry bakery technologies and functional ingredients.
Beverage systems & flavours performed well in 2009 driven by Kerry’s taste modulation and natural flavour technologies. Strong growth was achieved in the carbonated and non-carbonated soft drinks categories, in particular in South American markets. While coffee applications declined in 2009, Kerry continued to achieve favourable market development opportunities through nutritional beverages and aseptic lines.
In the Pharmaceutical sector, Kerry achieved satisfactory growth despite lower market volumes due to industry consolidation and health sector trends.
EMEA RegionMarket conditions were challenging in the EMEA region in 2009 as reduced consumer spending impacted trends in most food and beverage categories. Integration of Kerry’s ingredients & flavours regional businesses progressed as planned during the year but notwithstanding this realignment the business was well positioned to respond to the prevailing market pressures. In general pricing was lower due to reduced raw material costs (in particular primary dairy commodities) and a shift from premium or added value lines to budget or value offerings. Revenue in the region reported at €1,124m (-6.2% LFL) reflects continuing business volume growth of 2.3%, 5% lower pricing, favourable trading currency impact of 0.2% and 3.7% restructuring volume elimination.
In 2009 food and beverage providers in the EMEA region maintained critical focus on cost optimisation to counteract the recessionary impact and on innovation to increase product differentiation in the marketplace. This resulted in manufacturers de-stocking, rationalising the supplier base and reduced NPD investment – relying on the services of selected ingredients & flavour partners. Despite the shift to more economy offerings; provenance, naturalness, health and convenience of product lines assumed greater importance – with a clear trend towards clean label. As in American markets, the European QSR sector grew at the expense of full-serve restaurants as consumers responded to value meal options.
Savoury & Dairy systems & flavours achieved satisfactory underlying volume growth despite the recessionary impact on core end-use-markets. Market volumes in the processed meats sector increased slightly in Western and Eastern Europe and by 5% in Middle Eastern Markets. Volumes held up in the prepared meals sector despite the weakness of the premium segment. The downturn in
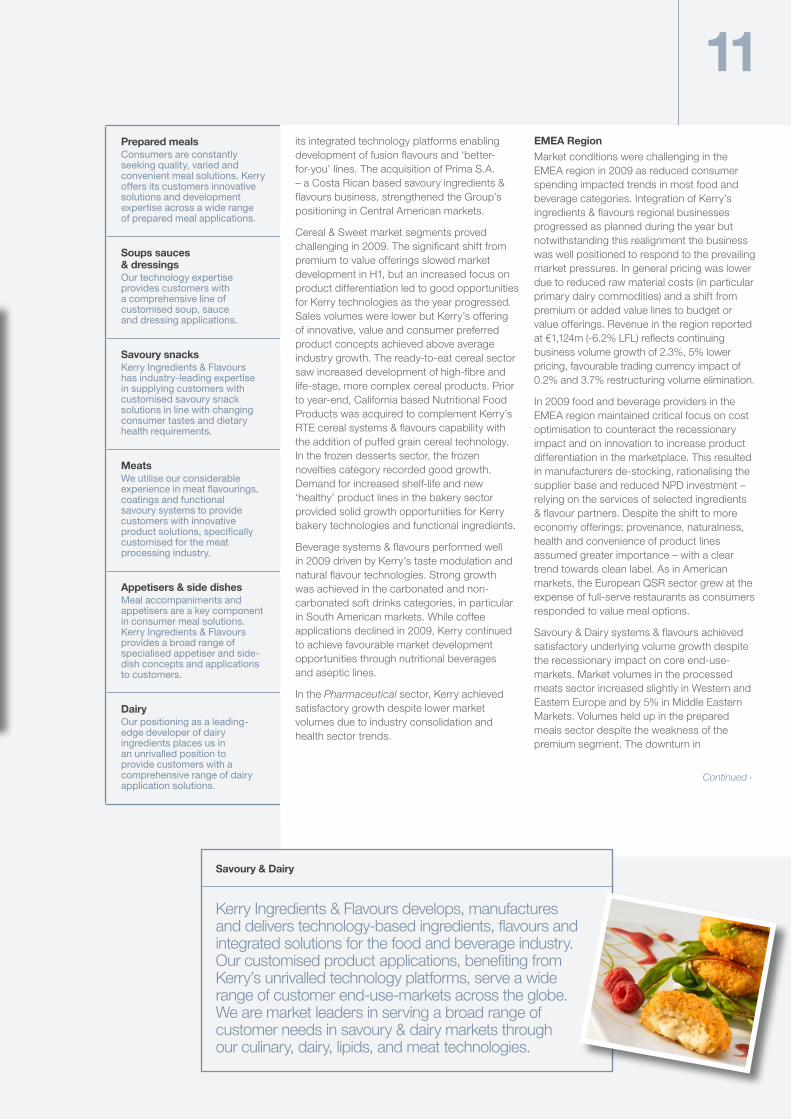
Kerry Ingredients & Flavours develops, manufactures and delivers technology-based ingredients, flavours and integrated solutions for the food and beverage industry. Our customised product applications, benefiting from Kerry’s unrivalled technology platforms, serve a wide range of customer end-use-markets across the globe. We are market leaders in serving a broad range of customer needs in savoury & dairy markets through our culinary, dairy, lipids, and meat technologies.
Savoury & Dairy
Continued ›

Cereal & Sweet
Ingredients & FlavoursBusiness Review
13Cereals & barsKerry Ingredients & Flavours cereal products technologies support our customers in providing a wide range of offerings to meet consumer needs from ready-to-eat breakfast cereals to convenience cereal bars.
Ice cream & frozen dessertsKerry’s cereal & sweet systems and flavours are utilised in a host of applications including: ice cream, frozen yoghurts, sherbets, impulse novelties, popsicles and shakes.
BakeryOur combination of cereal and sweet technologies, coupled with our expertise in functional ingredients, provides a full range of products to service customer needs in the bakery industry.
ConfectioneryInternational confectionery markets continue to grow as suppliers expand their geographical reach, whilst demand for low-fat, low-sugar or organic alternatives continues to increase in developed markets.
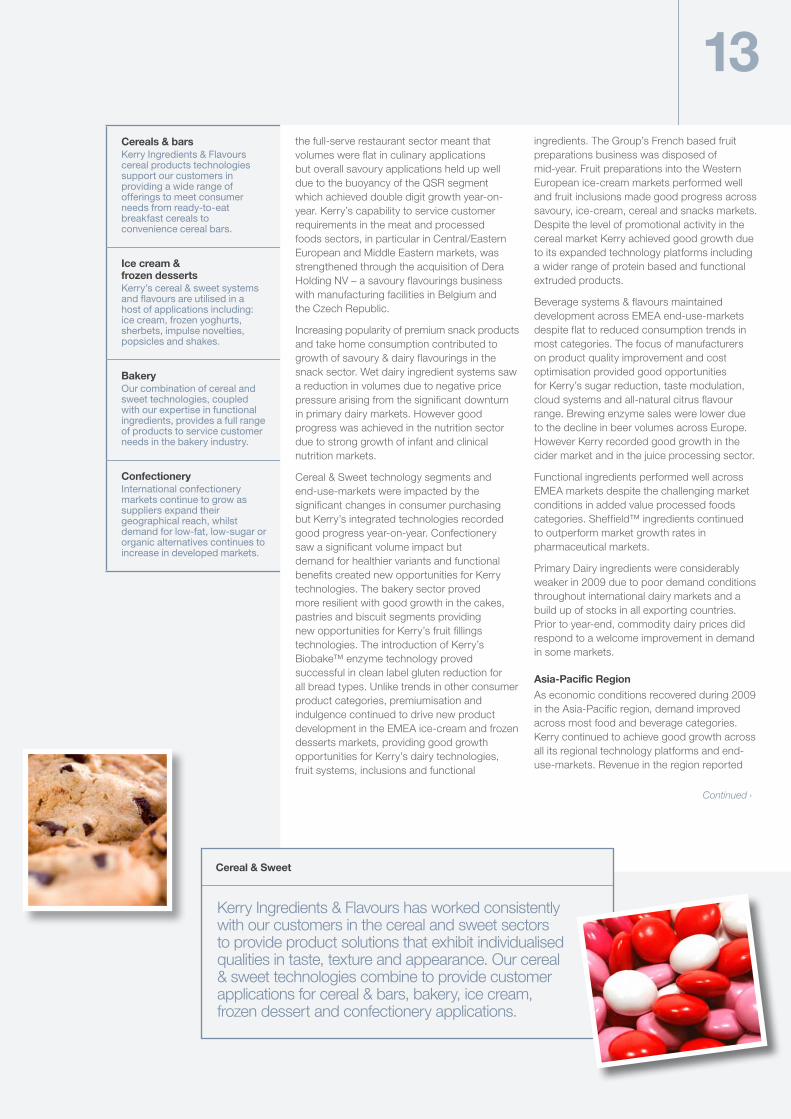
Kerry Ingredients & Flavours has worked consistently with our customers in the cereal and sweet sectors to provide product solutions that exhibit individualised qualities in taste, texture and appearance. Our cereal & sweet technologies combine to provide customer applications for cereal & bars, bakery, ice cream, frozen dessert and confectionery applications.
Cereal & Sweet
the full-serve restaurant sector meant that volumes were flat in culinary applications but overall savoury applications held up well due to the buoyancy of the QSR segment which achieved double digit growth year-on-year. Kerry’s capability to service customer requirements in the meat and processed foods sectors, in particular in Central/Eastern European and Middle Eastern markets, was strengthened through the acquisition of Dera Holding NV – a savoury flavourings business with manufacturing facilities in Belgium and the Czech Republic.
Increasing popularity of premium snack products and take home consumption contributed to growth of savoury & dairy flavourings in the snack sector. Wet dairy ingredient systems saw a reduction in volumes due to negative price pressure arising from the significant downturn in primary dairy markets. However good progress was achieved in the nutrition sector due to strong growth of infant and clinical nutrition markets.
Cereal & Sweet technology segments and end-use-markets were impacted by the significant changes in consumer purchasing but Kerry’s integrated technologies recorded good progress year-on-year. Confectionery saw a significant volume impact but demand for healthier variants and functional benefits created new opportunities for Kerry technologies. The bakery sector proved more resilient with good growth in the cakes, pastries and biscuit segments providing new opportunities for Kerry’s fruit fillings technologies. The introduction of Kerry’s Biobake™ enzyme technology proved successful in clean label gluten reduction for all bread types. Unlike trends in other consumer product categories, premiumisation and indulgence continued to drive new product development in the EMEA ice-cream and frozen desserts markets, providing good growth opportunities for Kerry’s dairy technologies, fruit systems, inclusions and functional
ingredients. The Group’s French based fruit preparations business was disposed of mid-year. Fruit preparations into the Western European ice-cream markets performed well and fruit inclusions made good progress across savoury, ice-cream, cereal and snacks markets. Despite the level of promotional activity in the cereal market Kerry achieved good growth due to its expanded technology platforms including a wider range of protein based and functional extruded products.
Beverage systems & flavours maintained development across EMEA end-use-markets despite flat to reduced consumption trends in most categories. The focus of manufacturers on product quality improvement and cost optimisation provided good opportunities for Kerry’s sugar reduction, taste modulation, cloud systems and all-natural citrus flavour range. Brewing enzyme sales were lower due to the decline in beer volumes across Europe. However Kerry recorded good growth in the cider market and in the juice processing sector.
Functional ingredients performed well across EMEA markets despite the challenging market conditions in added value processed foods categories. Sheffield™ ingredients continued to outperform market growth rates in pharmaceutical markets.
Primary Dairy ingredients were considerably weaker in 2009 due to poor demand conditions throughout international dairy markets and a build up of stocks in all exporting countries. Prior to year-end, commodity dairy prices did respond to a welcome improvement in demand in some markets.
Asia-Pacific RegionAs economic conditions recovered during 2009 in the Asia-Pacific region, demand improved across most food and beverage categories. Kerry continued to achieve good growth across all its regional technology platforms and end-use-markets. Revenue in the region reported
Continued ›

BeverageIngredients & FlavoursBusiness Review
15Soft drinksOur beverage systems and flavours portfolio includes carbonated beverages, energy / sport beverages, water & flavoured water, juices, fruit drinks, smoothies, dilutables, concentrates and cordiales.
Alcoholic beveragesKerry Ingredients & Flavours’ team of brewing & distilling specialists support a comprehensive ingredients range for all of the world’s major brewing and distilling markets.
Nutritional beveragesKerry has developed specialised ingredients and systems to enhance the nutritional value of beverage products including: infant nutritional, weight control beverages and clinical nutritional products.
Tea & coffeeKerry supports customer applications in the tea and coffee sector including: cold / iced tea, cold coffee drinks, hot coffee & tea, tea & coffee mixes, chocolate, cocoa & malt beverages, coffee syrups and creamers.
at €404m (+6.6% LFL) reflects continuing business volume growth of 9.1% and 2.5% lower pricing.
Savoury & Dairy systems & flavours achieved good growth. The rapidly developing regional QSR sector provided a wide range of opportunities for Kerry technologies, including sauce systems and coatings systems. Meat systems recorded strong growth in Thailand and New Zealand. Reduced volumes in the Australian red meat markets were offset by increased sales in the poultry sector. Culinary systems also recorded good growth.
Savoury snack markets also showed strong regional growth. Dairy systems & flavours achieved double digit growth in the Indonesian snack and bakery markets and also recorded satisfactory growth in other Asian markets. Kerry’s yeast extracts and culinary systems also performed well in the Indonesian and Philippines noodle markets. Lipid systems grew strongly throughout South East Asian markets, particularly in beverage applications. New healthier variants were introduced, especially in the infant nutrition sector, incorporating Kerry’s San-A-Créme range of nutritional lipid powders. The expanding foodservice market and nutritional market segments in China also provided strong growth for Kerry’s range of savoury & dairy technologies in 2009.
Beverage applications continue to achieve strong market growth particularly in China, North East Asia, Australia and Korea. Beverage systems and sauces achieved strong volume growth and Da Vinci branded flavoured beverage products increased sales through increased distribution in key chain accounts. With increased focus on health and well being, fruit based beverage lines achieved double digit market growth.
Functional ingredients benefited from Kerry’s ‘go-to-market’ programme and saw wider applications of emulsifier and enzyme product lines in the Group’s regional end-use-market focus areas.
Kerry Pinnacle maintained above average market growth rates in the Australian bakery sector and continued to progress market development in Asia. In Australia the lifestyle range of ready prepared bakery solutions again grew market share in the supermarket and shop chains segment. The Pinnacle lifestyle range was further diversified in 2009 through the acquisition of the Melbourne based Cookie Dough Co.
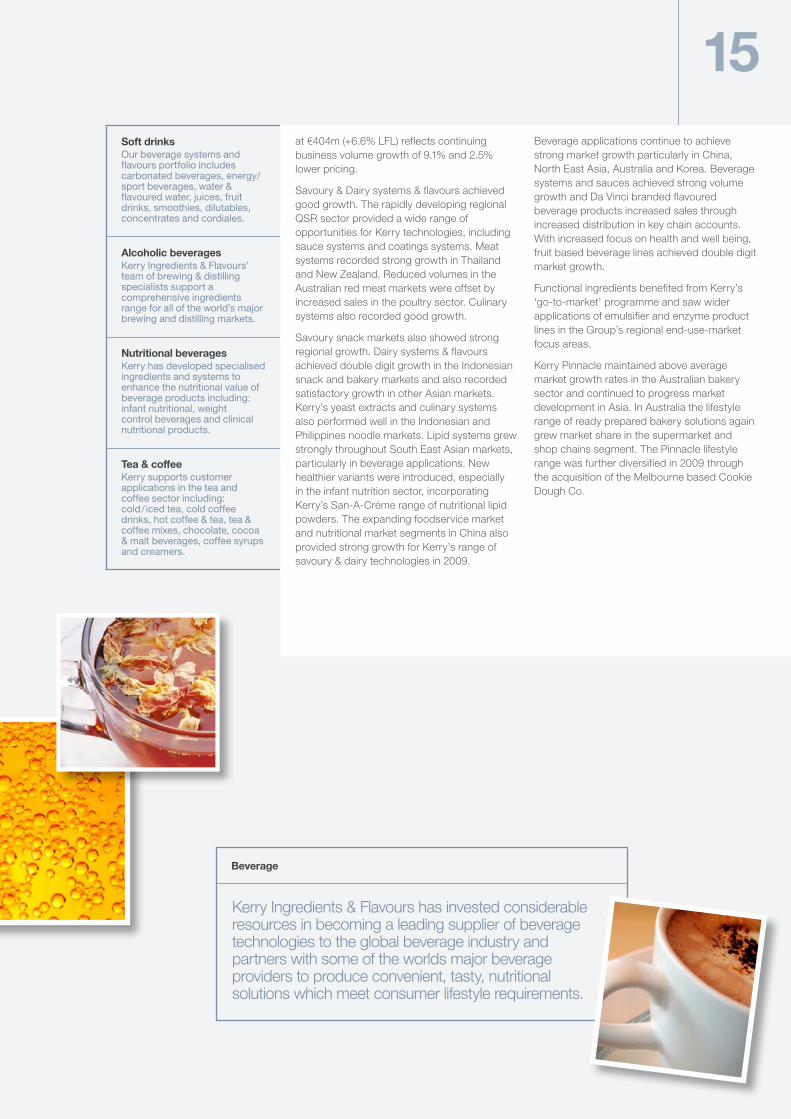
Kerry Ingredients & Flavours has invested considerable resources in becoming a leading supplier of beverage technologies to the global beverage industry and partners with some of the worlds major beverage providers to produce convenient, tasty, nutritional solutions which meet consumer lifestyle requirements.
Beverage

Consumer Foods
Business Review Consumer Foods

17Consumer spending was significantly influenced in Ireland and the UK in 2009 by the economic downturn which impacted all food categories and brand performance. In Ireland consumer spending fell by 7.5% in a deflationary marketplace with the Consumer Price Index falling by 5% and a more pronounced 8% in food. Thus the level of promotions increased dramatically and private label offerings grew at the expense of leading brands as consumers shopped the offers. Conversely, in the UK market, despite consumer spending falling by 4% in real terms, consumer spending on groceries rose slightly – much of the increase driven by increased promotional activity.
Against this background Kerry Foods’ brands in the UK market performed well but in Ireland Kerry’s brands underperformed versus private label offerings. In addition exports from Ireland to the UK were negatively impacted by the depreciation of the sterling/euro exchange rate which caused significant restructuring of operations during the year. Strong investment plans were in place by year-end to reposition Kerry’s brands and meet ‘value focused’ consumer requirements for everyday low pricing.
While continuing business volumes recovered as the year progressed to equal the 2008 level, divisional sales revenue declined by 6.1% (LFL) to €1,713m. This reflects a 1.6% volume reduction due to business restructuring, 3.2% lower pricing and an adverse trading currency impact of 1.3%. On a reported basis divisional trading profit at €122m was down from €126m but was unchanged from the previous year on a like-for-like basis. Business efficiency programmes, including ‘lean manufacturing’, enabled the division to grow its trading profit margin by 40 basis points to 7.1%.
In Kerry Foods’ UK Brands market segments, our leading brands performed well. Sausage grew strongly in value and volume terms as consumers bought-in to a value category. Richmond outperformed category growth benefiting from a highly successful TV advertising campaign. Wall’s maintained the number 2 brand positioning with a new range architecture supported by an award winning
advertising campaign. Meat snacking continues to show + 10% category growth. Mattessons Fridge Raiders is the main driver of growth in the sector – again achieving strong double digit growth year-on-year. As ‘in-home’ meal occasions grow in the current economic environment, Mattessons Smoked Pork Sausage also grew satisfactorily.
In the branded cheese snack sector, Cheestrings was relaunched with a new pack design – supported by a new advertising campaign. Q4 saw the launch of ‘Cheestrings Shots’ – an innovative cheese snack outside of the peelable format. As an appealing and nutritious element of children’s diets, Cheestrings Shots has already achieved encouraging distribution and sales. Mid-year Kerry’s Low Low brand was successfully launched in the growing UK low-fat cheese category. Made from semi-skimmed milk, the 100% natural cheese offers consumers a full-bodied taste and mature flavour with reduced fat.
In Kerry Foods’ selected UK Private Label categories business performance was mixed relative to 2008. Development of the division’s private label savoury pastry business was further advanced through the acquisition of G.Adams Pastry – a Spalding (UK) based cooked pastry products business. This has driven an expanded product offering and strengthened Kerry’s category positioning with leading retailers. In February, a range of pastry products was successfully launched under the Wall’s brand – initially with a range of on-the-go products through Kerry Foods Direct To Store into the convenience channel and later the range was extended to more main shop occasions through leading multiples.
The chilled ready meals category showed satisfactory volume and value growth in 2009. Kerry Foods outperformed category growth in the sector through the continued success of its ethnic meals range and ‘Innocent’ branded Vegetable Pots. Noon Products celebrated 20 years of successful development with leading retail customers. Kerry continued to grow its number 1 positioning in the ready-to-cook market through innovative new offerings and novel packaging formats.
Total sales in the frozen ready meals category were broadly flat relative to 2008. Exports from Ireland proved extremely challenging due to the sterling/euro exchange rate. While Kerry Foods
Consumer Foods 2009Like-for-like (LFL) growth
Revenue €1,713m (6.1%)
Trading profit €122m Unchanged

19
Kerry Foods’ brands are household names in the UK and Irish markets. The brand strategies and investment programmes now in place will enable our leading brands to compete successfully and position our offers for the value focused consumer.
Consumer Foods
remains the number 1 frozen ready meals supplier to the UK market, the business was forced to curtail its involvement in promotional activity and reduce its level of production. The lean programme at the Carrickmacross production facility led to increased efficiencies and the operating cost base was reduced in line with business volumes to maintain business margins. The business relaunched the Sharwood’s and Bisto frozen ready meals ranges which were acquired under licence.
The UK private label dairy and low-fat spreads offering failed to maintain market share due to an unprecedented level of promotional activity by the major brands in the category. The ready-to-eat cheese market grew satisfactorily in volume and value, with cheese spreads outperforming overall market growth rates. Kerry Foods achieved good success in private label cheese slices through ‘off-fixture-display-units’ in leading retail chains during the summer season.
Kerry Foods’ Brands Ireland had an extremely challenging year due to the deflationary recessional market environment which led to a fall-off in overall market demand and the growth of heavily promoted private label, discounter and tertiary brand offerings in most chilled food categories. The successful acquisition of Breeo Foods at the end of March 2009 brought a strategically important group of Irish food brands (including Dairygold, Galtee, and Shaws) which are significantly complementary to Kerry’s brand portfolio.
In the sausage, rasher and pre-packed sliced meats categories, Kerry’s brands under-performed in the marketplace due to intense competition from private label and discounter offers. Premium segments contracted due
to growth in demand for value offers. Major brand investment plans were launched in Q4 to reposition Denny, Galtee and Shaws strategic growth and by year-end encouraging results were achieved in consumer response.
Dairygold and Low Low held their positioning and household penetration in the broadly flat butter and spreads market. Golden Cow brand lost ground to heavily discounted offers but maintained its number 1 positioning in the Northern Ireland butter and spreads market.
The ROI cheese market declined slightly in volume and value with the Charleville brand maintaining its status as the number 1 cheese brand in the market. Low Low maintained its positioning in the natural cheese and ready-to-eat cheese segments.
Ficello continued to make excellent progress in France and Holland.
2009 proved to be a very difficult year for Freshways pre-packed sandwiches and food-to-go products across the retail, travel and foodservice sectors. During the year the brand was relaunched with a significant investment in new packaging. A more competitive pricing strategy was introduced in Q4 which has already yielded good growth in the retail channel.
Prior to year-end, the Group reached agreement on a Management Buy-Out of the Kerry Spring mineral water business.

Financial Review
Financial Review
21The Financial Review provides an overview of the key influences on the Group’s financial performance for the year ended 31 December 2009 and of the Group’s financial position at that date.
In addition, the following measures, which are considered key performance indicators of the Group’s underlying performance, are also discussed:
– Adjusted earnings per share (EPS) growth – Organic revenue growth – Trading profit margin – Free cash flow – Return on investment
Accounting policiesThe Group financial statements have been prepared in accordance with International Financial Reporting Standards (IFRSs), applicable Irish law and the Listing Rules of the Irish and London Stock Exchanges. Details of the basis of preparation and the significant accounting policies of the Group are included in pages 44 to 50.
Analysis of resultsGroup trading profit in the year increased by 3.2% to €422m (2008: €409m) despite a reduction in revenue to €4.5 billion (2008: €4.8 billion). On a like-for-like basis this represents trading profit growth of 3.8% and a decrease in revenue of 4.8% Trading profit margin improved by 80 basis points to 9.3% (2008: 8.5%). Adjusted EPS for the year was 166.5 cent, representing an increase of 8.2% on 2008 adjusted EPS of 153.9 cent. Basic earnings per share for the year was 115.0 cent (2008: 101.3 cent).
Revenue and operating profitA comprehensive review of the revenue and trading profit for the Group’s Ingredients & Flavours and Consumer Foods divisions is included in the Business Review on pages 8 to 19.
Foreign exchange ratesThe key foreign exchange rates impacting the retranslation of profit and loss items on non-euro denominated subsidiaries were the sterling rate of 89p (2008: 80p) and the US dollar rate of $1.40 (2008: $1.47). This represents a negative impact on operating
profits from the sterling zone of 11.3% offset by a positive impact from the dollar zone of 4.8%. The key balance sheet rates used where 89p (2008: 95p) for sterling and $1.44 (2008: $1.39) for the US dollar.
Non-trading itemsDuring 2009 Kerry Ingredients & Flavours continued to invest in its ‘go-to-market’ strategy. Business realignment relating to this programme is now complete. Consumer Foods progressed the value chain efficiency programme commenced in 2008 and, following the acquisition of Breeo Foods in March, integrated it with the existing business. The after tax impact of these restructuring activities, combined with the disposal of non-core businesses and assets, in the Consolidated Income Statement was a net cost of €73.3m. These activities resulted in a net cash outflow (after related tax) of €9.4m in 2009 but released approximately €100m of working capital investment. A further €35.5m is expected to be paid in 2010 in relation to costs incurred in 2009.
Finance costsFinance costs for the year decreased by €7.9m to €69.8m (2008: €77.7m) as strong cash flows and lower interest rates more than offset the impact of acquisitions and capital investment. During 2009 the Group’s average interest rate decreased approximately 80 basis points to 5.0% (2008: 5.8%).
TaxationThe tax charge for the year, before non-trading items, decreased by 2.4% to €61.2m (2008: €62.7m) which represents an effective tax rate of 18.2% (2008: 19.8%). The decrease in the effective tax rate is primarily due to variations in the geographical split of profits earned, increased tax credits for research and development expenditure and changes in local statutory tax rates.
DividendsThe Board has proposed a final dividend of 17.3 cent per A ordinary share payable on 14 May 2010 to shareholders registered on the record date 16 April 2010. When combined with the interim dividend of 7.7 cent per share, the total dividend for the year increased to 25 cent (2008: 22.5 cent) an increase of 11.1%.
Retirement benefitsAt the balance sheet date, the net deficit for all defined benefit schemes (after deferred tax) was €141m (2008: €116m). The increase year-on-year reflects an increase in liabilities caused by reduced corporate AA bond rates and an increase in long term inflation expectations partially offset by an increase in asset values.
The current service cost of pension scheme obligations reduced by €6m in the year to €25.6m (2008: €31.6m). The financing cost of the pension scheme deficit, net of the return from scheme assets, impacted trading profit adversely by €14.6m year on year.
Key performance indicatorsDespite a difficult economic environment throughout global markets in 2009 and the depreciation of sterling versus the euro, the Group delivered a robust performance with year-on-year improvement in almost all key performance indicators:
• Adjusted EPS growth is the year-on-year improvement in EPS before amortisation of intangible assets and non-trading items (net of related tax). In 2009 the Group’s adjusted EPS increased by 8.2% to 166.5 cent (2008: 153.9 cent) despite difficult trading conditions due to the weakened economic situation globally and adverse currency exchange rates. The benefits from the ‘go-to-market’ business restructuring programme and the lean manufacturing programme, coupled with the focus on business efficiency, more than offset the headwinds described above and helped to achieve another year of continued EPS growth.
• Organic revenue growth, which represents like-for-like growth after adjusting for acquisitions, disposals and the impact of foreign exchange translation, was negative 4.8% (2008: positive 6.3%) for the Group. The decrease is attributable to price reductions given to customers due to lower raw material prices and volume adjustments due to the business restructuring programmes. Allowing for the volume adjustments due to the business restructuring programmes, continuing volumes are up 2.2% year on year.
At a divisional level, organic revenue growth was negative in both Ingredients & Flavours, down 4.5% (2008: positive 7.5%), and Consumer Foods, down 6.1% (2008: positive 5.4%). Continuing volumes however were up 2.9% in Ingredients & Flavours and flat year on year in Consumer Foods.
On a geographical basis, organic revenue by destination declined by 5.2% (2008: positive 6.7%) in the Americas, declined by 6.1% (2008: positive 4.3%) in EMEA and increased by 6.6% (2008: 19.3%) in Asia Pacific.
• Trading profit margin at Group level increased by 80 basis points to 9.3% (2008: 8.5%). Trading margin benefited from the restructuring programmes and other cost saving initiatives delivered during the year. Lower overall revenue, resulting from lower selling prices, also had a positive impact on margin.
Kerry Ingredients & Flavours margin at 10.4% (2008: 9.5%) surpassed the 10% level for the first time. The Consumer Foods margin increased 40 basis points to 7.1% (2008: 6.7%) as the benefits of its value chain efficiency programme in particular came to fruition. The Consumer Foods margin is now back at a level last achieved in 2005.
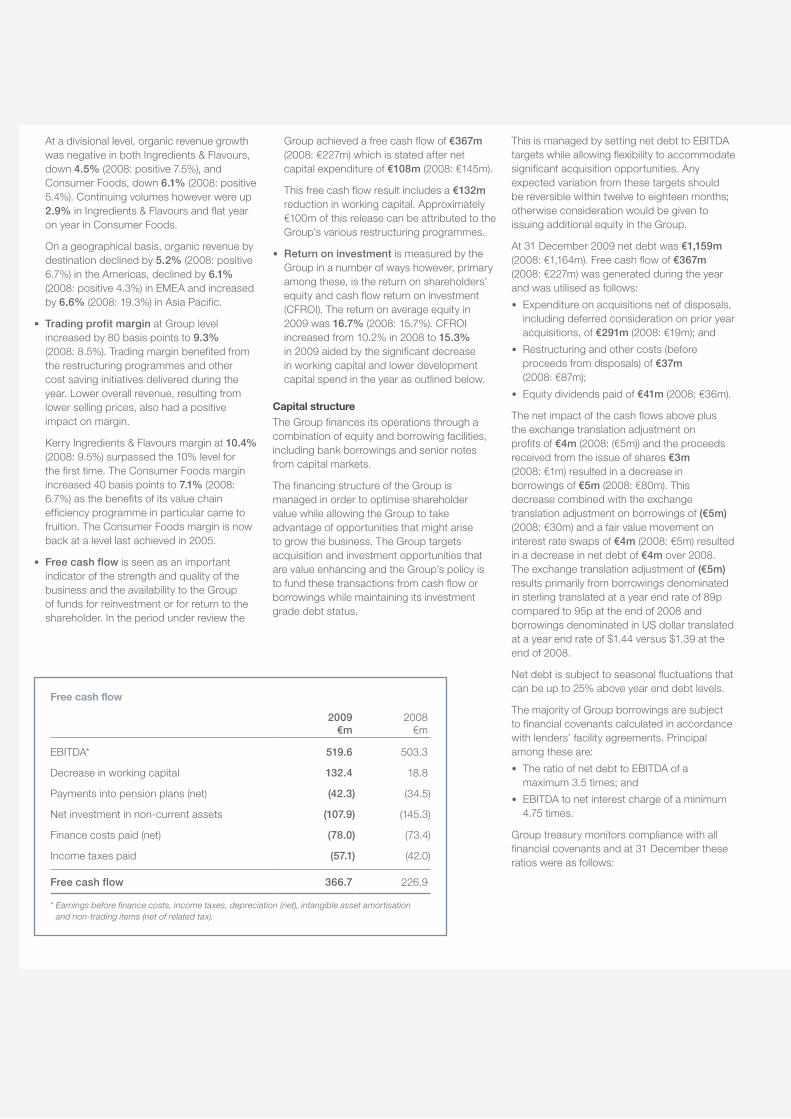
• Free cash flow is seen as an important indicator of the strength and quality of the business and the availability to the Group of funds for reinvestment or for return to the shareholder. In the period under review the
Group achieved a free cash flow of €367m (2008: €227m) which is stated after net capital expenditure of €108m (2008: €145m).
This free cash flow result includes a €132m reduction in working capital. Approximately €100m of this release can be attributed to the Group’s various restructuring programmes.
• Return on investment is measured by the Group in a number of ways however, primary among these, is the return on shareholders’ equity and cash flow return on investment (CFROI). The return on average equity in 2009 was 16.7% (2008: 15.7%). CFROI increased from 10.2% in 2008 to 15.3% in 2009 aided by the significant decrease in working capital and lower development capital spend in the year as outlined below.
Capital structure The Group finances its operations through a combination of equity and borrowing facilities, including bank borrowings and senior notes from capital markets.
The financing structure of the Group is managed in order to optimise shareholder value while allowing the Group to take advantage of opportunities that might arise to grow the business. The Group targets acquisition and investment opportunities that are value enhancing and the Group’s policy is to fund these transactions from cash flow or borrowings while maintaining its investment grade debt status.
This is managed by setting net debt to EBITDA targets while allowing flexibility to accommodate significant acquisition opportunities. Any expected variation from these targets should be reversible within twelve to eighteen months; otherwise consideration would be given to issuing additional equity in the Group.
At 31 December 2009 net debt was €1,159m (2008: €1,164m). Free cash flow of €367m (2008: €227m) was generated during the year and was utilised as follows:
• Expenditure on acquisitions net of disposals, including deferred consideration on prior year acquisitions, of €291m (2008: €19m); and
• Restructuring and other costs (before proceeds from disposals) of €37m (2008: €87m);
• Equity dividends paid of €41m (2008: €36m).
The net impact of the cash flows above plus the exchange translation adjustment on profits of €4m (2008: (€5m)) and the proceeds received from the issue of shares €3m (2008: €1m) resulted in a decrease in borrowings of €5m (2008: €80m). This decrease combined with the exchange translation adjustment on borrowings of (€5m) (2008: €30m) and a fair value movement on interest rate swaps of €4m (2008: €5m) resulted in a decrease in net debt of €4m over 2008. The exchange translation adjustment of (€5m) results primarily from borrowings denominated in sterling translated at a year end rate of 89p compared to 95p at the end of 2008 and borrowings denominated in US dollar translated at a year end rate of $1.44 versus $1.39 at the end of 2008.
Net debt is subject to seasonal fluctuations that can be up to 25% above year end debt levels.
The majority of Group borrowings are subject to financial covenants calculated in accordance with lenders’ facility agreements. Principal among these are:
• The ratio of net debt to EBITDA of a maximum 3.5 times; and
• EBITDA to net interest charge of a minimum 4.75 times.
Group treasury monitors compliance with all financial covenants and at 31 December these ratios were as follows:
Free cash flow
2009 €m
2008 €m
EBITDA* 519.6 503.3
Decrease in working capital 132.4 18.8
Payments into pension plans (net) (42.3) (34.5)
Net investment in non-current assets (107.9) (145.3)
Finance costs paid (net) (78.0) (73.4)
Income taxes paid (57.1) (42.0)
Free cash flow 366.7 226.9
* Earnings before finance costs, income taxes, depreciation (net), intangible asset amortisation and non-trading items (net of related tax).
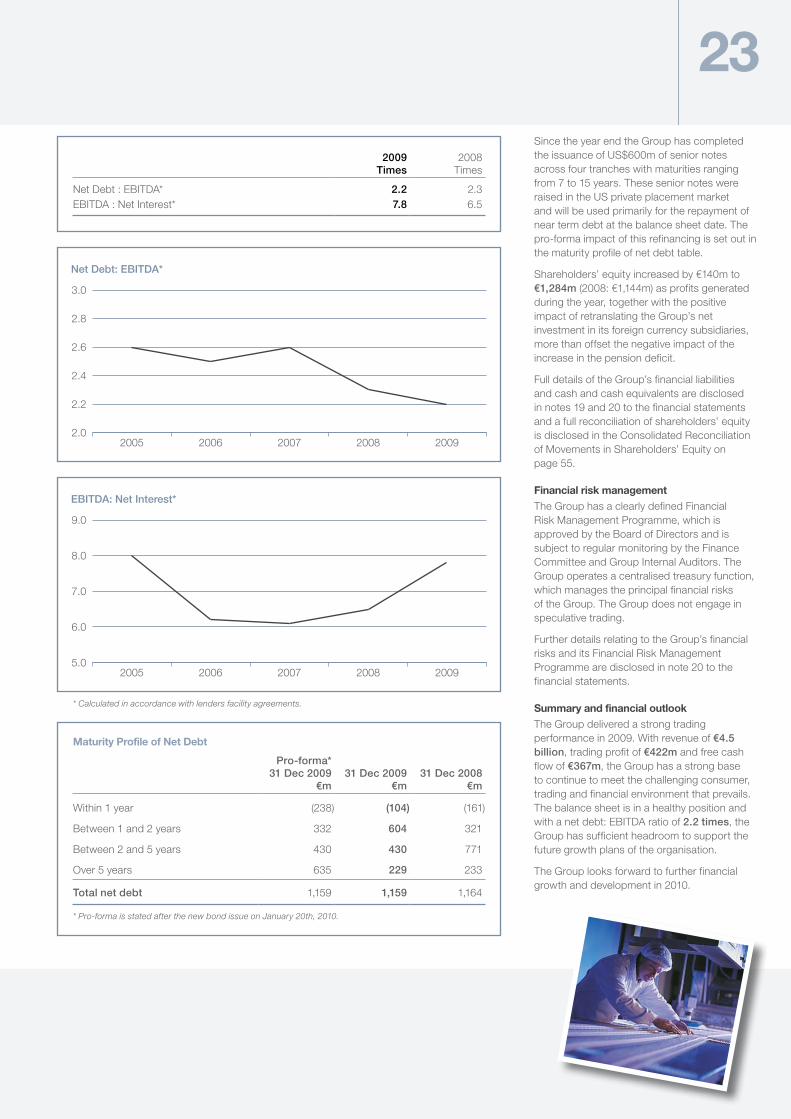
23Since the year end the Group has completed the issuance of US$600m of senior notes across four tranches with maturities ranging from 7 to 15 years. These senior notes were raised in the US private placement market and will be used primarily for the repayment of near term debt at the balance sheet date. The pro-forma impact of this refinancing is set out in the maturity profile of net debt table.
Shareholders’ equity increased by €140m to €1,284m (2008: €1,144m) as profits generated during the year, together with the positive impact of retranslating the Group’s net investment in its foreign currency subsidiaries, more than offset the negative impact of the increase in the pension deficit.
Full details of the Group’s financial liabilities and cash and cash equivalents are disclosed in notes 19 and 20 to the financial statements and a full reconciliation of shareholders’ equity is disclosed in the Consolidated Reconciliation of Movements in Shareholders’ Equity on page 55.
Financial risk managementThe Group has a clearly defined Financial Risk Management Programme, which is approved by the Board of Directors and is subject to regular monitoring by the Finance Committee and Group Internal Auditors. The Group operates a centralised treasury function, which manages the principal financial risks of the Group. The Group does not engage in speculative trading.
Further details relating to the Group’s financial risks and its Financial Risk Management Programme are disclosed in note 20 to the financial statements.
Summary and financial outlookThe Group delivered a strong trading performance in 2009. With revenue of €4.5 billion, trading profit of €422m and free cash flow of €367m, the Group has a strong base to continue to meet the challenging consumer, trading and financial environment that prevails. The balance sheet is in a healthy position and with a net debt: EBITDA ratio of 2.2 times, the Group has sufficient headroom to support the future growth plans of the organisation.
The Group looks forward to further financial growth and development in 2010.
2009 Times
2008 Times
Net Debt : EBITDA* 2.2 2.3EBITDA : Net Interest* 7.8 6.5
2.0
2.2
2.4
2.6
2.8
3.0
20092008200720062005
Net Debt: EBITDA*
5.0
6.0
7.0
8.0
9.0
20092008200720062005
EBITDA: Net Interest*
* Calculated in accordance with lenders facility agreements.
Maturity Profile of Net Debt
Pro-forma* 31 Dec 2009
€m
31 Dec 2009
€m
31 Dec 2008
€m
Within 1 year (238) (104) (161)
Between 1 and 2 years 332 604 321
Between 2 and 5 years 430 430 771
Over 5 years 635 229 233
Total net debt 1,159 1,159 1,164
* Pro-forma is stated after the new bond issue on January 20th, 2010.
Corporate Social Responsibility
Corporate Social Responsibility
25
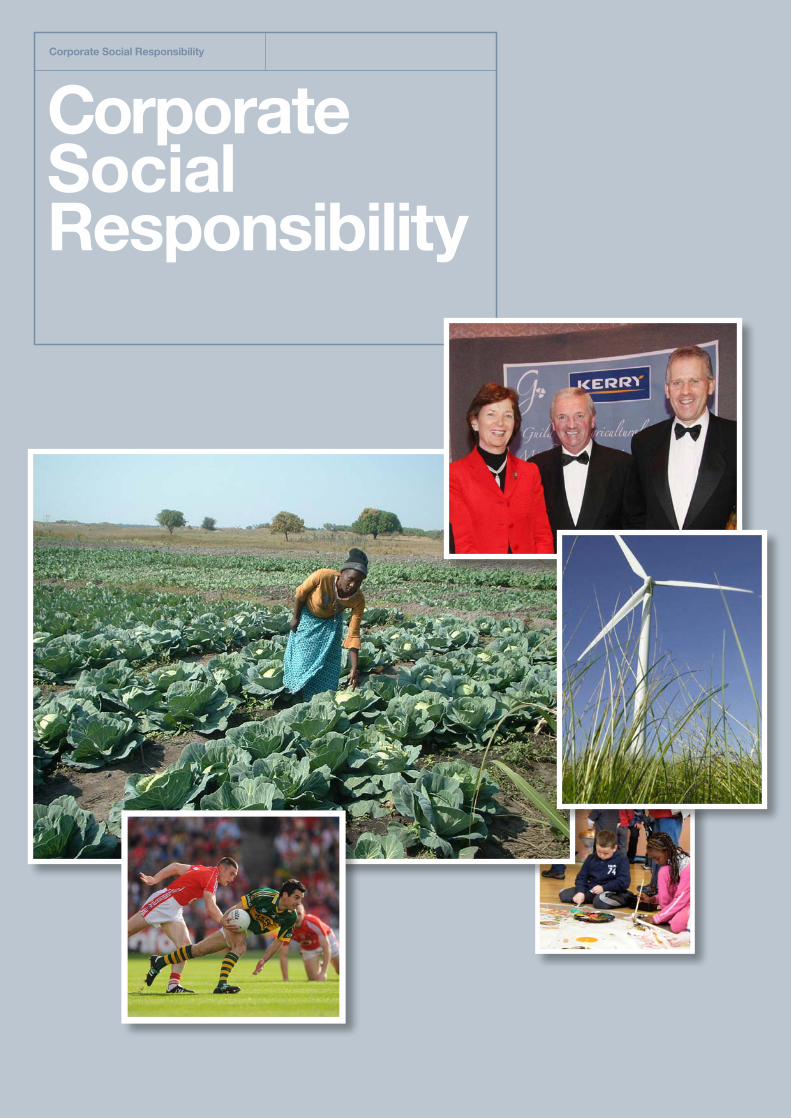
We are committed to the highest standards of business and ethical behaviour, to fulfilling our responsibilities to the communities which we serve and to the creation of long-term value for all stakeholders on a socially and environmentally sustainable basis.
Kerry social responsibility
As a world leader in ingredients & flavours and as a major consumer foods organisation in Europe, Kerry aims to conduct its business in a responsible and sustainable manner. This requires a holistic approach to Group activities involving close liaison with our customers, suppliers, regulatory authorities, employees and other relevant stakeholders.
Therefore central to Kerry’s mission and values is to be a responsible leader in the international food industry. The Group has worked systematically since its establishment to recognise its corporate social responsibilities. Our Corporate Mission statement provides a guiding framework for management and all employees in delivering Group Policy across all operations and worldwide activities and we are increasingly embedding sustainability thinking and positive action into the activities of all our businesses.
This Corporate Social Responsibility review outlines Group policies and programmes regarding the marketplace, environment, workplace and the community.
Standards of business practice Employees at all levels in the Group must adhere to Kerry’s Standards of Business Practice and protect the Group’s high reputation and integrity. It is the responsibility of Directors and senior management to ensure that all employees who directly or indirectly report to them are fully aware of Kerry’s policies and procedures regarding the conduct of Group businesses. It is also the responsibility of Directors and senior management to lead by example and to demonstrate the highest standards of integrity in carrying out their duties on behalf of the Company.
MarketplaceEveryday millions of people throughout the world consume food or beverage products produced by Kerry or by our customers using our ingredients and flavours. Innovation to enhance the nutritional quality of our ingredients and products is a core value of the Group. We fully recognise our role in making a positive contribution to healthy diets and lifestyles.
Food safety Kerry aims to be the leader in our selected markets, excelling in product quality, product safety, technical and marketing creativity and service to our customers. This will be achieved through the skills and wholehearted commitment of all our employees. As food safety is of paramount importance to Kerry, we work closely with our customers and with industry and regulatory agencies to ensure we operate to the highest industry standards and levels of accreditation.
Group quality policy Kerry is committed to producing high quality food ingredients and consumer food products that consistently satisfy customer needs while complying with all applicable regulatory requirements. Each business unit has established exacting product and service standards in support of these goals and put in place resources and programmes to assure superior manufacturing practices that reflect continuous improvement through our people, practices, processes and products. All employees in Kerry are responsible for understanding their internal and external customer’s needs and developing work processes that achieve enhanced consumer value.
Nutrition / wellbeing As a leading manufacturer and supplier of food ingredients and consumer food products, Kerry recognises the importance of nutrition for the health and wellbeing of consumers.
We are committed to ensuring that our products can be consumed with confidence as part of a well-balanced diet. To this effect we have established four areas of priority which underline our commitment to consumers and support the key principles of a balanced diet, namely; – Nutritional expertise and positive nutrition. – Consumer information. – Marketing. – Collaboration.
Nutritional expertise and positive nutrition Kerry continues to improve the nutritional content and the product ranges of all our ingredients and brands, in line with established up to date research, without compromise on taste or quality. The Kerry Group Nutritional Research Centre provides clinical research and expertise that enables the development of new products to meet consumers’ changing health and nutritional needs. Our nutritionists also collaborate with external scientific and nutrition experts to assist in product innovation. Kerry has fostered a commitment to food research since its inception through experienced on-site technical and new product development personnel. In addition, industry-leading regional technical centres staffed by food science specialists have been established in all major geographical markets. In 2009, Group expenditure on research, development and application increased to €147.8m.
The Group is committed to a positive nutrition programme which ensures our consumers are consistently receiving healthier products in line with their changing health and nutrition needs. Independent experts evaluate this programme ensuring its objectives are achieved such as reductions in overall fat, salt and sugar, whilst also addressing the area of portion control.
Marketplace
Environment
Workplace
Community
Focus areas

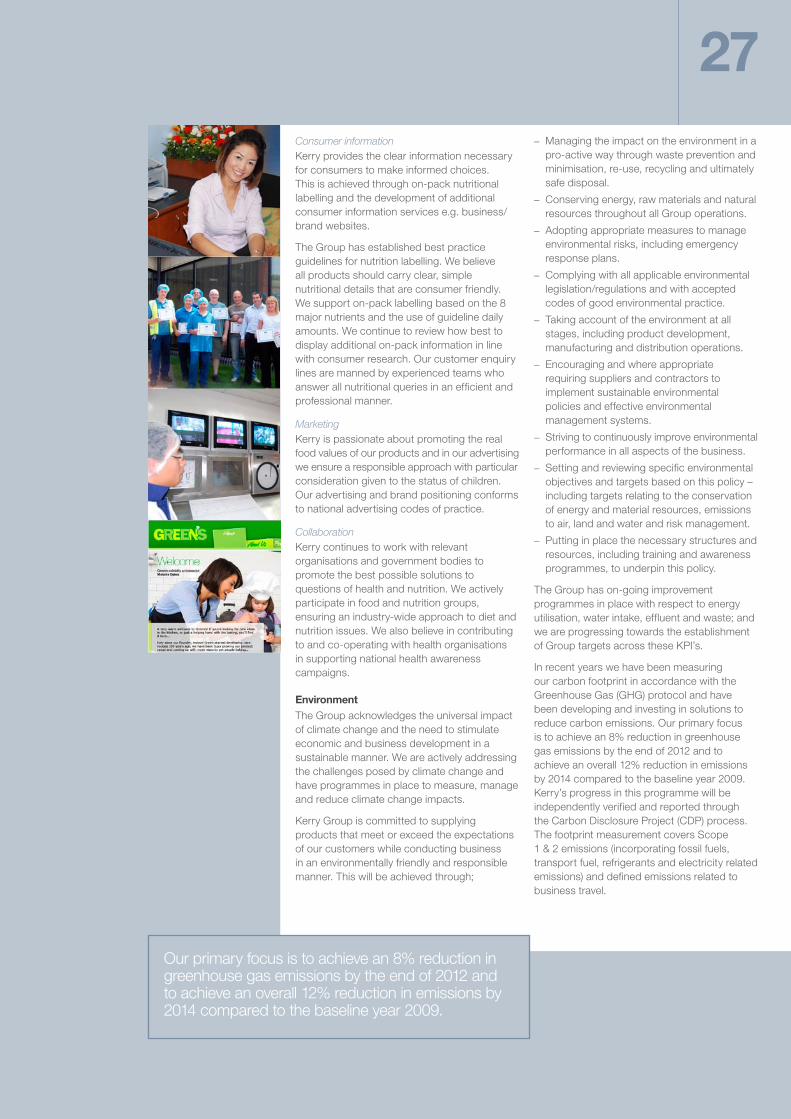
27Consumer informationKerry provides the clear information necessary for consumers to make informed choices. This is achieved through on-pack nutritional labelling and the development of additional consumer information services e.g. business/brand websites.
The Group has established best practice guidelines for nutrition labelling. We believe all products should carry clear, simple nutritional details that are consumer friendly. We support on-pack labelling based on the 8 major nutrients and the use of guideline daily amounts. We continue to review how best to display additional on-pack information in line with consumer research. Our customer enquiry lines are manned by experienced teams who answer all nutritional queries in an efficient and professional manner.
Marketing Kerry is passionate about promoting the real food values of our products and in our advertising we ensure a responsible approach with particular consideration given to the status of children. Our advertising and brand positioning conforms to national advertising codes of practice.
Collaboration Kerry continues to work with relevant organisations and government bodies to promote the best possible solutions to questions of health and nutrition. We actively participate in food and nutrition groups, ensuring an industry-wide approach to diet and nutrition issues. We also believe in contributing to and co-operating with health organisations in supporting national health awareness campaigns.
Environment The Group acknowledges the universal impact of climate change and the need to stimulate economic and business development in a sustainable manner. We are actively addressing the challenges posed by climate change and have programmes in place to measure, manage and reduce climate change impacts.
Kerry Group is committed to supplying products that meet or exceed the expectations of our customers while conducting business in an environmentally friendly and responsible manner. This will be achieved through;
– Managing the impact on the environment in a pro-active way through waste prevention and minimisation, re-use, recycling and ultimately safe disposal.
– Conserving energy, raw materials and natural resources throughout all Group operations.
– Adopting appropriate measures to manage environmental risks, including emergency response plans.
– Complying with all applicable environmental legislation/regulations and with accepted codes of good environmental practice.
– Taking account of the environment at all stages, including product development, manufacturing and distribution operations.
– Encouraging and where appropriate requiring suppliers and contractors to implement sustainable environmental policies and effective environmental management systems.
– Striving to continuously improve environmental performance in all aspects of the business.
– Setting and reviewing specific environmental objectives and targets based on this policy – including targets relating to the conservation of energy and material resources, emissions to air, land and water and risk management.
– Putting in place the necessary structures and resources, including training and awareness programmes, to underpin this policy.
The Group has on-going improvement programmes in place with respect to energy utilisation, water intake, effluent and waste; and we are progressing towards the establishment of Group targets across these KPI’s.
In recent years we have been measuring our carbon footprint in accordance with the Greenhouse Gas (GHG) protocol and have been developing and investing in solutions to reduce carbon emissions. Our primary focus is to achieve an 8% reduction in greenhouse gas emissions by the end of 2012 and to achieve an overall 12% reduction in emissions by 2014 compared to the baseline year 2009. Kerry’s progress in this programme will be independently verified and reported through the Carbon Disclosure Project (CDP) process. The footprint measurement covers Scope 1 & 2 emissions (incorporating fossil fuels, transport fuel, refrigerants and electricity related emissions) and defined emissions related to business travel.
Our primary focus is to achieve an 8% reduction in greenhouse gas emissions by the end of 2012 and to achieve an overall 12% reduction in emissions by 2014 compared to the baseline year 2009.
Workplace Kerry Group’s success has been built around the commitment, skills and creativity of the Group’s employees. Retaining and developing their enthusiasm and determination to succeed is central to the Group’s strategy for growth and development.
The diverse international structures within the Group require a dedication to communication and the exchange of ideas to facilitate creativity and effective knowledge management. We recognise our responsibilities in respect of the multicultural environments in which we operate. The Group is committed to the principle of equality and complies with all relevant equality and anti-discrimination legislation.
Kerry will continue to ensure excellence in management practice through the ongoing development of business aligned human resource systems and initiatives. The Group provides structured training and development programmes for employees through which they can enhance the skills, knowledge and capability necessary for further growth within the organisation.
Health and safety Effective management of health and safety is given the utmost priority by the Group. Our health and safety policy applied across all Kerry operations is targeted to develop shared attitudes, beliefs and workplace behavioural practices which instill in all employees a culture of best practice in health and safety.
Community Kerry has a proud record of supporting community initiatives and charitable causes. Right through its history from its origins in the co-operative sector in Ireland, the Group has committed significant financial resources and considerable management/employee time in assisting development of facilities, amenities and charitable projects in the communities where it operates. This philosophy continues to be a core value of the Kerry organisation and on an annual basis the Group sponsors a wide range of education, healthcare, sporting, leisure, arts, amenity, community development and charitable causes.
Community focus areas In our communities our primary areas of focus and support are; (a) health, hunger and nutrition, (b) entrepreneurship, (c) amenity/
community development, (d) education, arts and sport. These areas are of critical importance to our customers, consumers, employees, shareholders and the communities in which we operate.
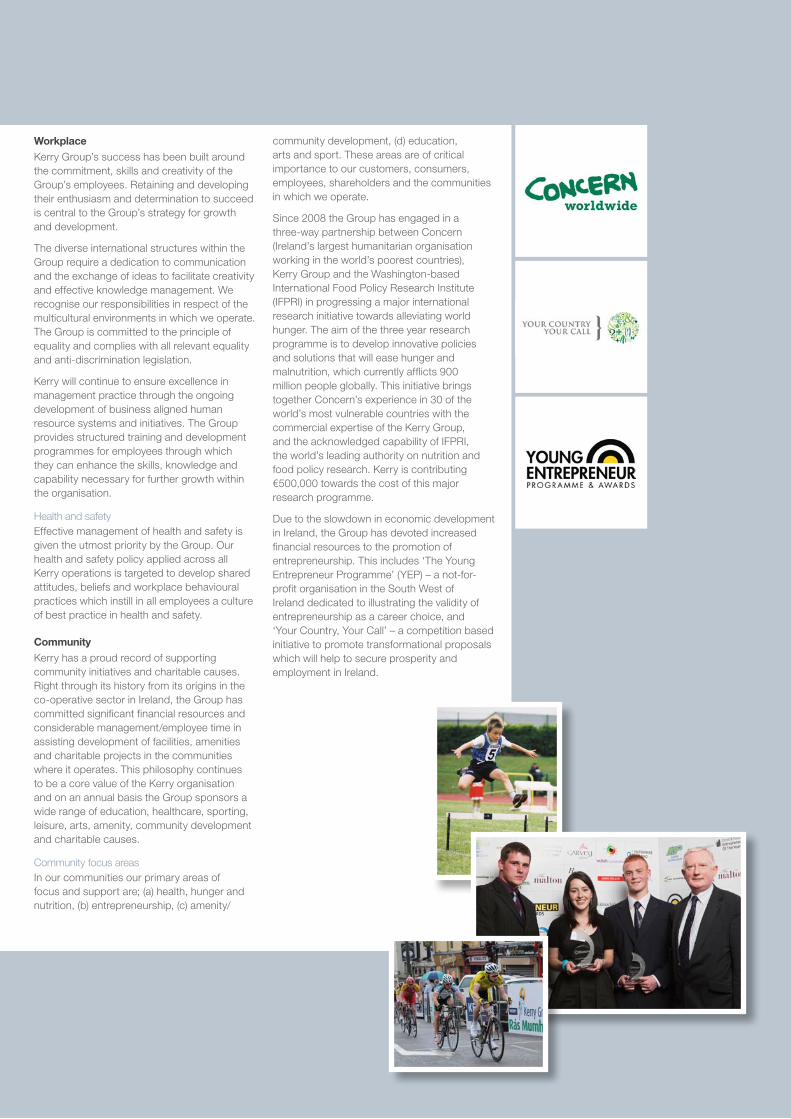
Since 2008 the Group has engaged in a three-way partnership between Concern (Ireland’s largest humanitarian organisation working in the world’s poorest countries), Kerry Group and the Washington-based International Food Policy Research Institute (IFPRI) in progressing a major international research initiative towards alleviating world hunger. The aim of the three year research programme is to develop innovative policies and solutions that will ease hunger and malnutrition, which currently afflicts 900 million people globally. This initiative brings together Concern’s experience in 30 of the world’s most vulnerable countries with the commercial expertise of the Kerry Group, and the acknowledged capability of IFPRI, the world’s leading authority on nutrition and food policy research. Kerry is contributing €500,000 towards the cost of this major research programme.
Due to the slowdown in economic development in Ireland, the Group has devoted increased financial resources to the promotion of entrepreneurship. This includes ‘The Young Entrepreneur Programme’ (YEP) – a not-for-profit organisation in the South West of Ireland dedicated to illustrating the validity of entrepreneurship as a career choice, and ‘Your Country, Your Call’ – a competition based initiative to promote transformational proposals which will help to secure prosperity and employment in Ireland.
29
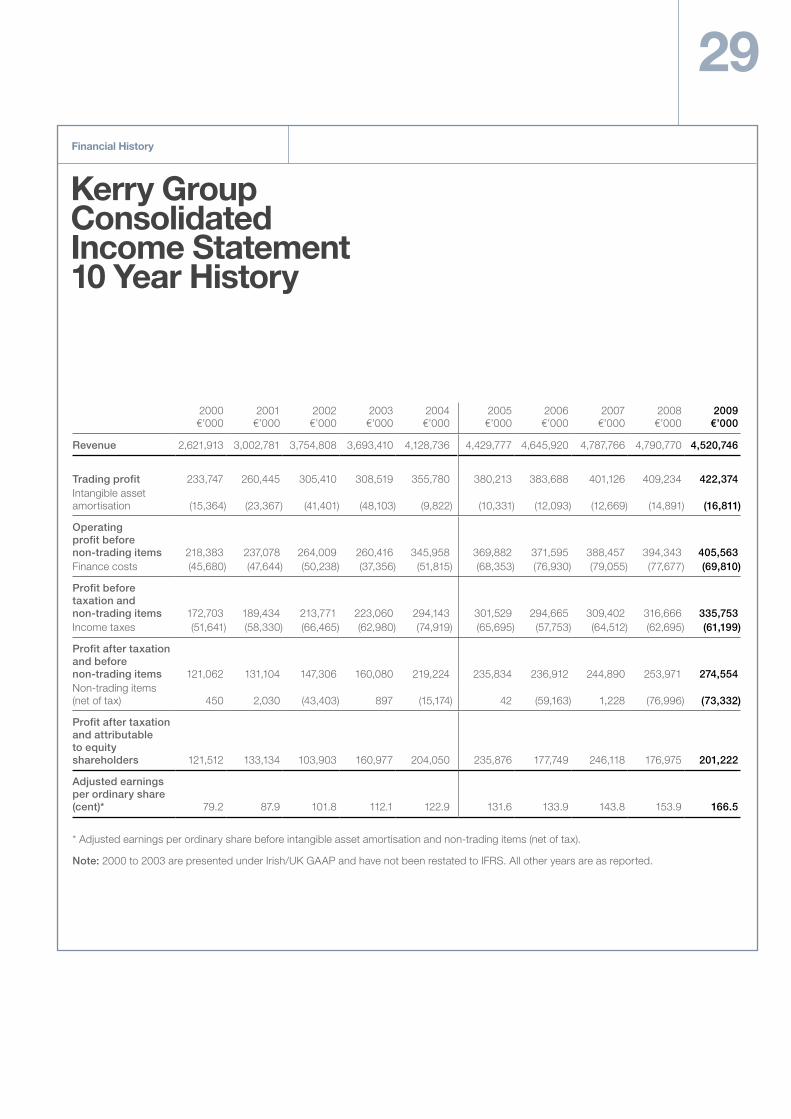
Kerry Group Consolidated Income Statement 10 Year History
Financial History
2000 €’000
2001 €’000
2002 €’000
2003 €’000
2004 €’000
2005 €’000
2006 €’000
2007 €’000
2008 €’000
2009 €’000
Revenue 2,621,913 3,002,781 3,754,808 3,693,410 4,128,736 4,429,777 4,645,920 4,787,766 4,790,770 4,520,746
Trading profit 233,747 260,445 305,410 308,519 355,780 380,213 383,688 401,126 409,234 422,374Intangible asset amortisation (15,364) (23,367) (41,401) (48,103) (9,822) (10,331) (12,093) (12,669) (14,891) (16,811)
Operating profit before non-trading items 218,383 237,078 264,009 260,416 345,958 369,882 371,595 388,457 394,343 405,563Finance costs (45,680) (47,644) (50,238) (37,356) (51,815) (68,353) (76,930) (79,055) (77,677) (69,810)
Profit before taxation and non-trading items 172,703 189,434 213,771 223,060 294,143 301,529 294,665 309,402 316,666 335,753Income taxes (51,641) (58,330) (66,465) (62,980) (74,919) (65,695) (57,753) (64,512) (62,695) (61,199)
Profit after taxation and before non-trading items 121,062 131,104 147,306 160,080 219,224 235,834 236,912 244,890 253,971 274,554Non-trading items (net of tax) 450 2,030 (43,403) 897 (15,174) 42 (59,163) 1,228 (76,996) (73,332)
Profit after taxation and attributable to equity shareholders 121,512 133,134 103,903 160,977 204,050 235,876 177,749 246,118 176,975 201,222
Adjusted earnings per ordinary share (cent)* 79.2 87.9 101.8 112.1 122.9 131.6 133.9 143.8 153.9 166.5
* Adjusted earnings per ordinary share before intangible asset amortisation and non-trading items (net of tax).
Note: 2000 to 2003 are presented under Irish/UK GAAP and have not been restated to IFRS. All other years are as reported.

Directors & other information
Kerry Group
01 02 03
060504
07 08 09
121110
13 14 15
Directors01. Denis Buckley, Chairman02. Stan McCarthy, Chief Executive*03. Brian Mehigan, Chief Financial Officer*04. Flor Healy, CEO Kerry Foods*05. Gerry Behan,
President & CEO Kerry Ingredients & Flavours Americas*
06 Denis Carroll07. Michael Dowling08. Michael J. Fleming09. Noel Greene10. Kevin Kelly11. Donal O’Donoghue12. Gerard O’Hanlon13. Michael J. Sullivan14. John Twomey15. Denis Wallisall of Prince’s Street, Tralee, Co. Kerry, Ireland* Executive
Secretary and Registered OfficeBrian Durran Prince’s Street Tralee Co. Kerry Ireland
Registrar and Share Transfer OfficeBrian Durran Registrar’s Department Kerry Group plc Prince’s Street Tralee Co. Kerry Ireland
Websitewww.kerrygroup.com

3131AccountsKerry Group
Report of the Directors
The Directors submit their Annual Report together with the audited financial statements for the year ended 31 December 2009.
Principal activities Kerry Group is a major international food corporation. The Group is a world leader in food ingredients and flavour technologies serving the food and beverage industries and is also a leading consumer foods processor and supplier in selected EU markets.
Listed on the Irish and London Stock Exchanges and operating a Level 1 American Depositary Receipt (ADR) Programme through the Bank of New York, USA, Kerry has 140 manufacturing facilities across five continents and provides over 15,000 food and ingredient products via its network of international sales and technical centres to a wide customer base in 140 countries.
Through a commitment to excellence, technological creativity, total quality, superior customer service and the wholehearted commitment of all employees, Kerry aims to continue to enhance its leadership position as a global food ingredients and flavours supplier and to further develop its consumer foods business in Ireland and the United Kingdom.
Results and dividends The Directors are pleased to report profit attributable to equity shareholders of €201m for the year. Earnings per share (EPS) before intangible asset amortisation and non-trading items (net of related tax) increased 8.2% over 2008 to 166.5 cent. Basic EPS for the year is reported at 115.0 cent (2008: 101.3 cent). Revenue for the year amounted to €4.5 billion (2008: €4.8 billion). Further details of the results for the year are set out in the Consolidated Income Statement, in the related notes forming part of the financial statements and in the Business Review. The Group’s key performance indicators are outlined in the Financial Review.
On 22 February 2010, the Directors recommended a final dividend totalling €30.3m in respect of the year ended 31 December 2009 (see note 9 to the financial statements). This dividend is in addition to the interim dividend paid to shareholders on 20 November 2009, which amounted to €13.5m.
The payment date for the final dividend will be 14 May 2010 to shareholders registered on the record date 16 April 2010. This dividend per share is an increase of 10.9% over the final dividend paid on 22 May 2009.
Share capitalDetails of the share capital are shown in note 23 of the financial statements. The authorised share capital of the Company is €35,000,000 divided into 280,000,000 A ordinary shares of 12.5 cent each, of which 175,164,051 shares were in issue at 31 December 2009.
The A ordinary shares rank equally in all respects. There are no limitations on the holding of securities in the Company.
There are no restrictions on the transfer of fully paid shares in the Company but the Directors have the power to refuse the transfer of shares that are not fully paid. There are no deadlines for exercising voting rights other than proxy votes, which must be received by the Company at least 48 hours before the time of the meeting at which a vote will take place. There are no restrictions on voting rights except:
– where the holder or holders of shares have failed to pay any call or instalment in the manner and at the time appointed for payment; or
– the failure of any shareholder to comply with the terms of Article 14 of the Company’s Articles of Association (disclosure of beneficial interest).
The Company is not aware of any agreements between shareholders which may result in restrictions on the transfer of securities or on voting rights.
The Directors have the authority to issue new shares in the Company up to the authorised but unissued share capital of the Company but may only allot shares for cash on a non pro-rata basis up to a maximum of 5% of the issued share capital. This authority will expire on 12 August 2010 and it is intended to seek shareholder approval for its renewal at the Annual General Meeting (AGM) to be held on 5 May 2010.
During the year, 307,070 share options were exercised under the Group’s Executive Share Option Scheme. Further details are shown in note 23 to the financial statements.
In September 2009 the Board, upon the recommendation of the Remuneration and Nomination Committee, allotted 54,847 shares in the Company and 166,600 share options to 565 executives, including executive Directors and the Company Secretary under the terms of the Group’s Long Term Incentive Plan (LTIP). The allocations of both shares and options were made at nominal value. Since their issue in September 2009, 40,449 options have been exercised. Further details are shown in note 23 to the financial statements. Details of the allocations made to the executive Directors and Company Secretary are set out on page 34.
The Company may purchase its own shares in accordance with the Companies Acts and the Company’s Articles of Association. At the 2009 AGM, shareholders passed a resolution authorising the Company to purchase up to 5% of its own issued share capital but the authority was not exercised. This authority is due to expire on 5 May 2010 and it is intended to seek shareholder approval for its renewal at the AGM.
Articles of AssociationThe Articles of Association empower the Board to appoint Directors but also require Directors to retire and submit themselves for re-election at the first AGM following their appointment. Specific rules regarding the re-election of Directors are referred to in the Corporate Governance Report on pages 35 to 37.
The regulations contained in the Articles of Association of the Company may be amended by special resolution with the sanction of shareholders in a general meeting.
Significant agreementsThe Company’s financing arrangements include ‘Change of Control’ provisions which give its lending institutions the right to withdraw their facilities in the event of a change of control occurring unless they agree otherwise in writing. Other than change of control provisions in those arrangements, the Company is not a party to any other significant agreements which contain such a provision.
AcquisitionsThe Group completed a number of acquisitions during the year. The businesses acquired are described in the Chief Executive’s Review and in note 27 to the financial statements.
33Report of the Directors
Research and developmentThe Group is fully committed to ongoing technological innovation in all sectors of its business, providing integrated customer-focused product development. To facilitate this development the Group has, and will continue, to invest in highly focused research, development and application centres of excellence. It is by leveraging these global resources and sharing industry, academic and Group-wide scientific developments and knowledge, that Kerry will continue to lead in its chosen sectors and proactively meet customer and market needs. The Group recognises the need to evaluate market trends, stay at the forefront of technological development and bring these together to deliver commercially successful solutions in the dynamic and competitive food and beverage marketplace.
Expenditure on research and development amounted to €147.8m in 2009 (2008: €147.5m).
Employees Kerry Group’s success is built around the commitment, skills and creativity of the Group’s employees. Retaining and developing their enthusiasm and determination to succeed is central to the Group’s growth strategy in the years ahead.
The diverse international structures within the Group require a dedication to communication and the exchange of ideas to facilitate creativity and effective knowledge management.
Kerry will continue to ensure excellence in management practice through the ongoing development of business aligned human resource systems and initiatives. The Group provides structured training and development programmes for employees through which they can enhance the skills, knowledge and capability necessary for further growth within the organisation.
The Group is committed to the principle of equality and complies with all relevant equality and anti-discrimination legislation.
The average employment of the Group worldwide in 2009 was 21,997 (2008: 22,312).
Corporate social responsibility Kerry Group is committed to the highest standards of business and ethical behaviour, to fulfil its responsibilities to the communities it serves and to the creation of long term value for all stakeholders on a socially and environmentally sustainable basis. This commitment is borne out by its continued investment in facilities, systems and processes that manage waste emissions, energy consumption and materials/packaging conservation. Through the adoption of best practice procurement policies, the Group recognises the requirement to source sustainable raw materials as it continuously seeks to enhance its role as a leading international food company and supplier of quality products to its valued customers. The Group is fully committed to environmental protection as a fundamental part of all business activities and continues to develop employees’ knowledge regarding environmental responsibilities and best practice.
Future developments Kerry Group is well positioned across global growth markets and its strong technology platforms will continue to lead innovation and category growth. The Group is confident that good growth rates are achievable through application of its ingredients and flavours technologies in global food and beverage markets. In addition, in consumer foods categories the underlying strength of Kerry Foods’ brands, its focus on product innovation and positioning in convenience growth categories, will ensure that the Consumer Foods division continues to outperform market growth rates. The Group is well positioned to actively pursue strategic
acquisition opportunities which will support top-line and earnings growth into the future.
Board of Directors The Board consists of four executive and eleven non-executive Directors. The current Directors are as listed on page 30.
ChairmanMr. Denis Buckley (64) is Chairman of the Company and a member of the Remuneration and Nomination Committee. He is also Chairman of Irish Agricultural Wholesale Society Limited, Chairman of One Fifty One plc and is a director of Aryzta AG.
Executive DirectorsMr. Stan McCarthy (52) is the Group’s Chief Executive.
Mr. Brian Mehigan, FCA, (48) is the Group’s Chief Financial Officer.
Mr. Flor Healy (47) is CEO of Kerry Foods, the Group’s Consumer Foods Division.
Mr. Gerry Behan (45) is President & CEO of Kerry Ingredients & Flavours Americas.
Non-executive DirectorsMr. Denis Carroll (59) is a director of Kerry Co-operative Creameries Limited. He was appointed to the Audit Committee on 14 January 2010 to fill the vacancy following Mr. Desmond O’Connor’s retirement.
Mr. Michael Dowling (65) is a director of a number of private companies. He is a former Secretary General of the Department of Agriculture and Food in Ireland and is a visiting professor in the Faculty of Food Science and Technology at National University of Ireland, Cork. He is head of Agri Strategy in Allied Irish Banks plc. He is Chairman of the Audit Committee and a member of the Remuneration and Nomination Committee.
Mr. Michael J. Fleming (46) was appointed to the Board on 14 January 2010. He is a director of Kerry Co-operative Creameries Limited.
Mr. Noel Greene (53) is a director of Kerry Co-operative Creameries Limited.
Mr. Kevin Kelly, FCA, (68) is Chairman of Schroeder Private Equity Funds plc, Project Management Limited and is a director of a number of other private companies. He was formerly managing director of AIB Bank. He is Chairman of the Remuneration and Nomination Committee and a member of the Audit Committee.
Mr. Donal O’Donoghue (65) is a director of Kerry Co-operative Creameries Limited.
Mr. Gerard O’Hanlon (61) is a director of Kerry Co-operative Creameries Limited.
Mr. Michael J. Sullivan, JD, (70) served as the US Ambassador to Ireland from January 1999 to June 2001 and as Governor of the State of Wyoming between January 1987 and January 1995. He is a non-executive director of Sletten Construction Inc. and Cimarex Energy Inc. He is a member of the Bar, State of Wyoming.
Mr. John Twomey (65), a director of Kerry Co-operative Creameries Limited, was appointed to the Board on 14 January 2010. He is a director of the Irish Co-operative Society Limited and National Cattle Breeding Centre Limited.
Mr. Denis Wallis (60) is a director of Kerry Co-operative Creameries Limited and is a member of the Audit Committee.
Report of the Directors
Board changesMr. Michael J. Fleming and Mr. John Twomey were appointed to the Board on 14 January 2010 to fill the vacancies caused by the retirement of Mr. James O’Connell and Mr. Desmond O’Connor. On the same date, Mr. Denis Carroll replaced Mr. Desmond O’Connor on the Audit Committee.
Election of DirectorsIn accordance with the provisions of the Combined Code on Corporate Governance the Chairman, Mr. Denis Buckley and Mr. Michael Dowling being Directors who have each served a period in excess of nine years on the Board will retire at the 2010 AGM and are seeking re-election at that meeting.
Under Article 102 of the Company’s Articles of Association, Mr. Michael J. Fleming and Mr. John Twomey who were appointed to the Board since the previous AGM will retire at the next AGM and, being eligible, are seeking re-election.
Mr. Denis Carroll, Mr. Stan McCarthy, Mr. Donal O’Donoghue and Mr. Gerard O’Hanlon will retire by rotation at the same meeting and, being eligible, are offering themselves for re-election.
The Board recommends the re-election of all Directors seeking re-election.
Directors’ and Company Secretary’s interests There has not been any contract or arrangement with the Company or any subsidiary during the year in which a Director of the Company was materially interested and which was significant in relation to the Group’s business.
The interests of the Directors and Company Secretary of the Company and their spouses and minor children in the share capital of the Company, all of which were beneficial, were as follows:
31 December 2009
Number
31 December 2008
Number
DirectorsGerry Behan 8,913 4,582Denis Buckley 169,775 169,775Denis Carroll 4,236 4,236Michael Dowling 4,200 4,200Noel Greene 4,299 4,299Flor Healy 46,342 46,342Kevin Kelly 23,200 23,200Stan McCarthy 40,679 36,279Brian Mehigan 40,334 40,334Donal O’Donoghue 4,948 4,948Gerard O’Hanlon 40,558 40,558Michael J. Sullivan – –Denis Wallis 3,567 3,567
Company SecretaryBrian Durran 10,000 10,000
The above holdings in A ordinary shares have not changed between 31 December 2009 and the date of this report.
Directors’ and Company Secretary’s interest in Long Term Incentive Plan The criteria under which the Long Term Incentive Plan (LTIP) awards vest in full are explained on page 37, and in note 24 to the financial statements. The following table shows the executive Directors’ interests under the LTIP.
Conditional Awards at 1 January
2009
Awards Lapsed/
Cancelled during
the year
Share Awards Vested
during the year
Share Option Awards Vested
during the year
Conditional Awards made
during the year
Conditional Awards at
31 December 2009
Share Options Outstanding at
31 December 2009
DirectorsStan McCarthy 20,000 15,600 4,400 – 55,441 55,441 –Brian Mehigan 20,000 15,600 – 4,400 28,336 28,336 4,400Flor Healy 20,000 15,600 – 4,400 30,800 30,800 4,400Gerry Behan 12,000 9,360 2,640 – 30,800 30,800 –
Company SecretaryBrian Durran 3,000 2,343 – 660 8,230 8,230 660
No share options were exercised during the year.
Conditional awards at 1 January 2009 relate to awards made in 2006. The performance period for these awards expired on 31 December 2008 and a proportion of awards vested at nominal cost. The closing mid-market share price on the vesting date, 21 September 2009 was €19.45.
Conditional awards made during the year relate to a three year performance period from 2009 to 2011. Share options vested during 2009 are exercisable in the period up until 20 September 2016.
35Report of the Directors
Directors’ and Company Secretary’s interest in Executive Share Option Scheme No Director currently holds executive share options in the Company under this scheme. The Company Secretary, Brian Durran, held 10,900 share options through the year 2009 at an Option Price of €8.00 which are exercisable not later than 1 October 2010.
Substantial interestsThe Directors have been notified of the following shareholdings of 3% or more in the issued share capital of the Company:
Shareholder Number Held %
Kerry Co-operative Creameries Limited (KCC) 41,567,612 23.7%Capital Research and Management Company 8,965,824 5.1%Prudential plc Group of Companies 7,777,713 4.4%
Apart from the aforementioned, the Company has not been notified of any interest of 3% or more in the issued share capital of the Company.
Statement of Directors’ responsibilities Irish company law requires the Directors to prepare financial statements for each financial year, which give a true and fair view of the state of affairs of the Company and the Group and of the profit or loss of the Group for that period. In preparing those financial statements, the Directors are required to:
– select suitable accounting policies and then apply them consistently;
– make judgements and estimates that are reasonable and prudent; and
– prepare the financial statements on the going concern basis unless it is inappropriate to presume that the Company will continue in business.
The Directors are responsible for keeping proper books of account which disclose with reasonable accuracy at any time the financial position of the Company and to enable them to ensure that the financial statements are prepared in accordance with International Financial Reporting Standards as adopted by the European Union and comply with Irish statute comprising the Companies Acts, 1963 to 2009, Article 4 of the IAS Regulations and the Listing Rules of the Irish and London Stock Exchanges. They are also responsible for safeguarding the assets of the Company and the Group and hence for taking reasonable steps for the prevention and detection of fraud and other irregularities. The Directors are responsible for the maintenance and integrity of the corporate and financial information included in the company website.
The Directors of Kerry Group plc acknowledge these responsibilities and accordingly have prepared this consolidated Annual Report for the year ended 31 December 2009 in compliance with the provisions of Regulation (EC) No. 1606/2002, regulations 4 and 5 of Statutory Instrument 277 of 2007 of Ireland, the Transparency Rules of the Irish Financial Services Regulatory Authority and the applicable International Financial Reporting Standards as adopted by the European Union.
The Directors also confirm that to the best of their knowledge:
– the Group consolidated financial statements for the year ended 31 December 2009 have been prepared in accordance with the applicable International Financial Reporting Standards and give a true and fair view of the assets, liabilities, financial position and profit or loss of the Group and the undertakings included in the consolidation taken as a whole as at that date;
– the Business Review includes a fair review of the development and performance of the business for the year ended 31 December 2009 and the position of the Group and the undertakings included in the consolidation taken as a whole at the year end; and
– the Report of the Directors provides a description of the principal risks and uncertainties which may impact the future performance of the Group and the undertakings included in the consolidation taken as a whole.
Corporate governance Kerry Group plc is committed to achieving high standards of corporate governance throughout the Group. The Board considers that it has complied throughout the period with the provisions of the Combined Code on Corporate Governance, except in relation to the requirement to appoint a senior independent Director, the reasons for which are detailed below.
The Board of DirectorsThe Board leads and maintains effective control over the Group’s activities and comprises a non-executive Chairman, a Chief Executive, three other executive Directors and ten non-executive Directors.
The Directors are responsible for managing the business of the Company and may exercise all the powers of the Company subject to the provisions of relevant statutes, to any directions given by shareholders in General Meeting and to the Company’s Memorandum and Articles of Association.
The Board has a formal schedule of matters specifically reserved to it for decision which includes approval of the overall Group strategic plan, annual budgets (revenue and capital), acquisitions and divestitures, financial risk management, treasury policy and major corporate activities. The division of duties between the Chairman and the Chief Executive is formally established, set out in writing and agreed by the Board. The Chairman ensures that all Directors have full and timely access to such information as they require to discharge their responsibilities fully and effectively – they receive monthly Group management financial statements and reports. Board papers are sent to each member in sufficient time before Board meetings. Each Director has access to the advice and services of the Company Secretary, whose responsibility it is to ensure that Board procedures are followed and that applicable rules and regulations are complied with. In accordance with an agreed procedure, in the furtherance of their duties, each Director is, in addition, able to take independent professional advice at the Company’s expense. Appropriate training and briefing is available to all Directors on appointment to the Board, with further training available subsequently as required.
The Board is of the opinion that the non-executive Directors as a group are of sufficient calibre and number to bring strength and independence to the Board and hence has not nominated a non-executive Director to be a senior independent Director.
The non-executive Directors meet, at least annually, as a group without the executive Directors present. During such meetings, the non-executive Directors have the opportunity to discuss any issues and, at least annually, appraise the Chairman’s performance.
Seven of the non-executive Directors of the Company are directors of KCC, which at the date of this report is the holder of 23.7% of the issued share capital of the Company. The shareholding of KCC in Kerry Group plc is a financial investment based on the expectation, similar to other shareholders, of dividend income and capital appreciation. These non-executive Directors, in their ordinary course of business, have traded on standard commercial terms with the Group’s Agribusiness Division, the details of which are disclosed in note 30 to the financial statements. Notwithstanding the above, the Board has determined that these non-executive Directors are independent in character and judgement.
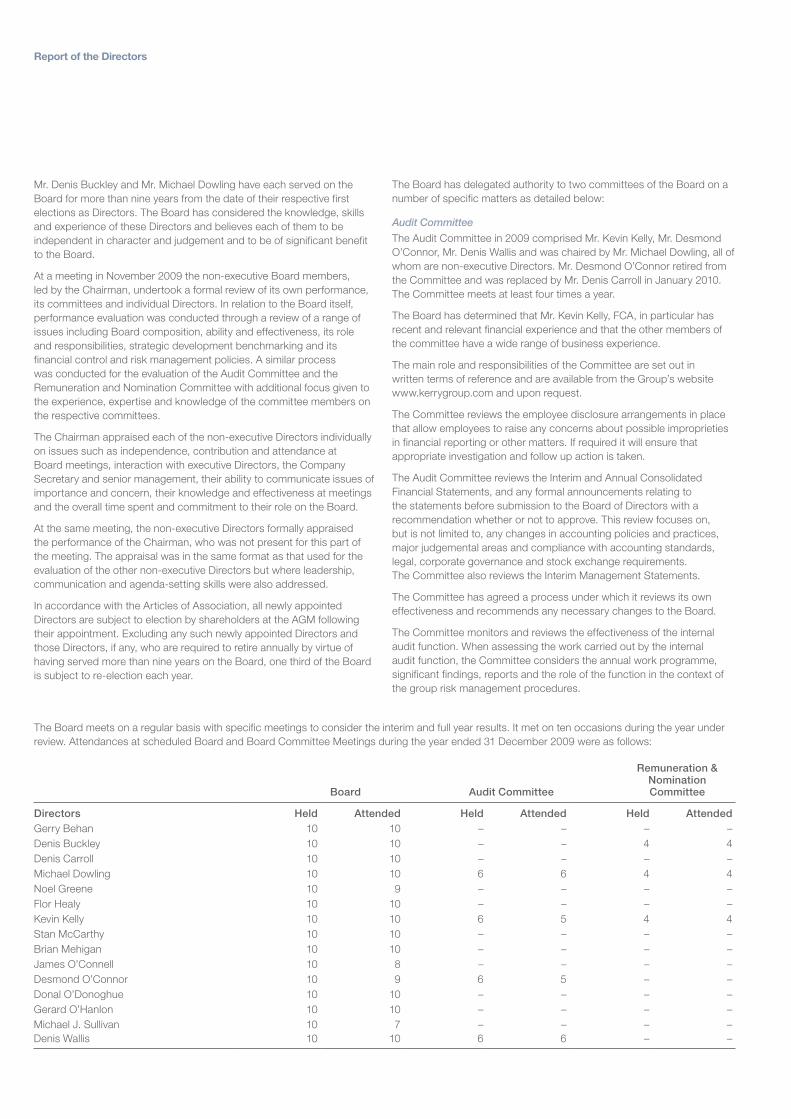
Report of the Directors
Mr. Denis Buckley and Mr. Michael Dowling have each served on the Board for more than nine years from the date of their respective first elections as Directors. The Board has considered the knowledge, skills and experience of these Directors and believes each of them to be independent in character and judgement and to be of significant benefit to the Board.
At a meeting in November 2009 the non-executive Board members, led by the Chairman, undertook a formal review of its own performance, its committees and individual Directors. In relation to the Board itself, performance evaluation was conducted through a review of a range of issues including Board composition, ability and effectiveness, its role and responsibilities, strategic development benchmarking and its financial control and risk management policies. A similar process was conducted for the evaluation of the Audit Committee and the Remuneration and Nomination Committee with additional focus given to the experience, expertise and knowledge of the committee members on the respective committees.
The Chairman appraised each of the non-executive Directors individually on issues such as independence, contribution and attendance at Board meetings, interaction with executive Directors, the Company Secretary and senior management, their ability to communicate issues of importance and concern, their knowledge and effectiveness at meetings and the overall time spent and commitment to their role on the Board.
At the same meeting, the non-executive Directors formally appraised the performance of the Chairman, who was not present for this part of the meeting. The appraisal was in the same format as that used for the evaluation of the other non-executive Directors but where leadership, communication and agenda-setting skills were also addressed.
In accordance with the Articles of Association, all newly appointed Directors are subject to election by shareholders at the AGM following their appointment. Excluding any such newly appointed Directors and those Directors, if any, who are required to retire annually by virtue of having served more than nine years on the Board, one third of the Board is subject to re-election each year.
The Board has delegated authority to two committees of the Board on a number of specific matters as detailed below:
Audit Committee
The Audit Committee in 2009 comprised Mr. Kevin Kelly, Mr. Desmond O’Connor, Mr. Denis Wallis and was chaired by Mr. Michael Dowling, all of whom are non-executive Directors. Mr. Desmond O’Connor retired from the Committee and was replaced by Mr. Denis Carroll in January 2010. The Committee meets at least four times a year.
The Board has determined that Mr. Kevin Kelly, FCA, in particular has recent and relevant financial experience and that the other members of the committee have a wide range of business experience.
The main role and responsibilities of the Committee are set out in written terms of reference and are available from the Group’s website www.kerrygroup.com and upon request.
The Committee reviews the employee disclosure arrangements in place that allow employees to raise any concerns about possible improprieties in financial reporting or other matters. If required it will ensure that appropriate investigation and follow up action is taken.
The Audit Committee reviews the Interim and Annual Consolidated Financial Statements, and any formal announcements relating to the statements before submission to the Board of Directors with a recommendation whether or not to approve. This review focuses on, but is not limited to, any changes in accounting policies and practices, major judgemental areas and compliance with accounting standards, legal, corporate governance and stock exchange requirements. The Committee also reviews the Interim Management Statements.
The Committee has agreed a process under which it reviews its own effectiveness and recommends any necessary changes to the Board.
The Committee monitors and reviews the effectiveness of the internal audit function. When assessing the work carried out by the internal audit function, the Committee considers the annual work programme, significant findings, reports and the role of the function in the context of the group risk management procedures.
The Board meets on a regular basis with specific meetings to consider the interim and full year results. It met on ten occasions during the year under review. Attendances at scheduled Board and Board Committee Meetings during the year ended 31 December 2009 were as follows:
Board Audit Committee
Remuneration & Nomination Committee
Directors Held Attended Held Attended Held AttendedGerry Behan 10 10 – – – –Denis Buckley 10 10 – – 4 4Denis Carroll 10 10 – – – –Michael Dowling 10 10 6 6 4 4Noel Greene 10 9 – – – –Flor Healy 10 10 – – – –Kevin Kelly 10 10 6 5 4 4Stan McCarthy 10 10 – – – –Brian Mehigan 10 10 – – – –James O’Connell 10 8 – – – –Desmond O’Connor 10 9 6 5 – –Donal O’Donoghue 10 10 – – – –Gerard O’Hanlon 10 10 – – – –Michael J. Sullivan 10 7 – – – –Denis Wallis 10 10 6 6 – –
37Report of the Directors
The Audit Committee makes recommendations to the Board in relation to the appointment of the external auditors. Each year the Audit Committee meets with the external auditors and reviews their report on quality control procedures and on the safeguards which they have put in place to ensure their objectivity and independence in accordance with regulatory and professional requirements. The Audit Committee also reviews the external audit plan and the findings from the audit of the financial statements.
The Audit Committee is responsible for the policies and procedures on the use of the external auditor for non-audit services. These policies are kept under strict review to meet the objective of ensuring that the Group benefits in a cost effective manner from the knowledge and experience of its auditor whilst also ensuring that the auditor maintains the necessary degree of independence and objectivity. Non-audit services provided by the external auditor are approved by the Audit Committee.
The Board, through the Audit Committee, completes an annual assessment of risk and controls. The internal audit function facilitates the Board in this assessment by preparing a consolidated Group Risk and Control Report for their review. Where necessary, the Audit Committee will convene to deal with any significant control weaknesses reported by internal audit and management.
Remuneration and Nomination Committee
During the year, the Remuneration and Nomination Committee comprised Mr. Kevin Kelly (Chairman), Mr. Denis Buckley and Mr. Michael Dowling, all of whom are non-executive Directors. The Committee met on four occasions during the year.
The Remuneration and Nomination Committee has written terms of reference covering the authority delegated to it by the Board. The role of the Remuneration and Nomination Committee is two-fold. The first role is to determine executive Directors’ remuneration, which is reviewed annually. The Committee consults with the Group’s Chief Executive in relation to executive Directors’ remuneration and has access to internal and external professional advice as required. Decisions are made within agreed reference terms, with meetings held as required. Members of the Committee have no personal interest in the outcome of their decisions and give due regard to the interests of shareholders and the performance of the Company.
The second role of the Committee relates to nomination responsibilities, which include considering the need for and the making of Board appointments, both executive and non-executive. When appropriate external search consultants are used in the appointment of Directors.
The full terms of reference of the Remuneration and Nomination Committee are available on the Group’s website.
Remuneration Remuneration policy
The Group’s remuneration policy is to ensure that executive Directors’ remuneration properly reflects their duties and responsibilities, and is sufficient to attract, retain and motivate people of the highest quality worldwide. Remuneration includes performance related elements designed to align Directors’ interests with those of shareholders and to encourage performance at the highest levels. In setting remuneration levels, the Remuneration and Nomination Committee has regard to comparable companies in terms of both the size of the Group and the geographical spread and complexity of its business. It also considers pay and employment conditions elsewhere in the Group. Full details of the Directors’ remuneration are given on pages 38 and 39.
Executive Directors’ remuneration comprises basic salary, participation in pension schemes, performance related incentive awards, share-based incentives and other benefits.
Executive Directors’ basic salary The Remuneration and Nomination Committee sets the basic salary and other benefits of each executive Director by reference to individual performance and external market data.
PensionsThe executive Directors participate in the Group’s general pension scheme with contributions and pension benefits based on basic salary (performance related incentive awards are excluded).
Performance related incentive awardsExecutive Directors participate in performance related annual bonus schemes, which are based on achieving predetermined earnings growth and other targets set by the Remuneration and Nomination Committee. The structure of the scheme is reviewed regularly to ensure that it develops in line with the Group’s strategic goals.
Share-based incentivesa) Executive Share Option SchemeThe Remuneration and Nomination Committee approves the terms, conditions and allocation of share options under the Executive Share Option Scheme to executive Directors and senior executives. No share options are currently held by executive Directors under this scheme.
b) Long Term Incentive PlanThe Remuneration and Nomination Committee approves the terms, conditions and allocation of awards under the Group’s LTIP to executive Directors, the Company Secretary and senior executives. Further information on the rules of the scheme is given on page 39. Details of executive Directors’ and Company Secretary’s LTIP interests are shown on page 34.
Other benefitsOther benefits relate primarily to motor vehicles.
Non-executive Directors’ remuneration
Non-executive Directors’ fees, which are determined by the Board as a whole, fairly reflect the responsibilities and time spent by the directors on the Group’s affairs. In determining the fees, which are set within the limits approved by shareholders, consideration is given to both the complexity of the Group and the level of fees paid to non-executive Directors in comparable companies. Non-executive Directors do not participate in the Group’s incentive plans, pension/superannuation arrangements or other elements of remuneration provided to the executive Directors.
Service contracts
The Group does not have any service contracts with its Directors which extend beyond one year.
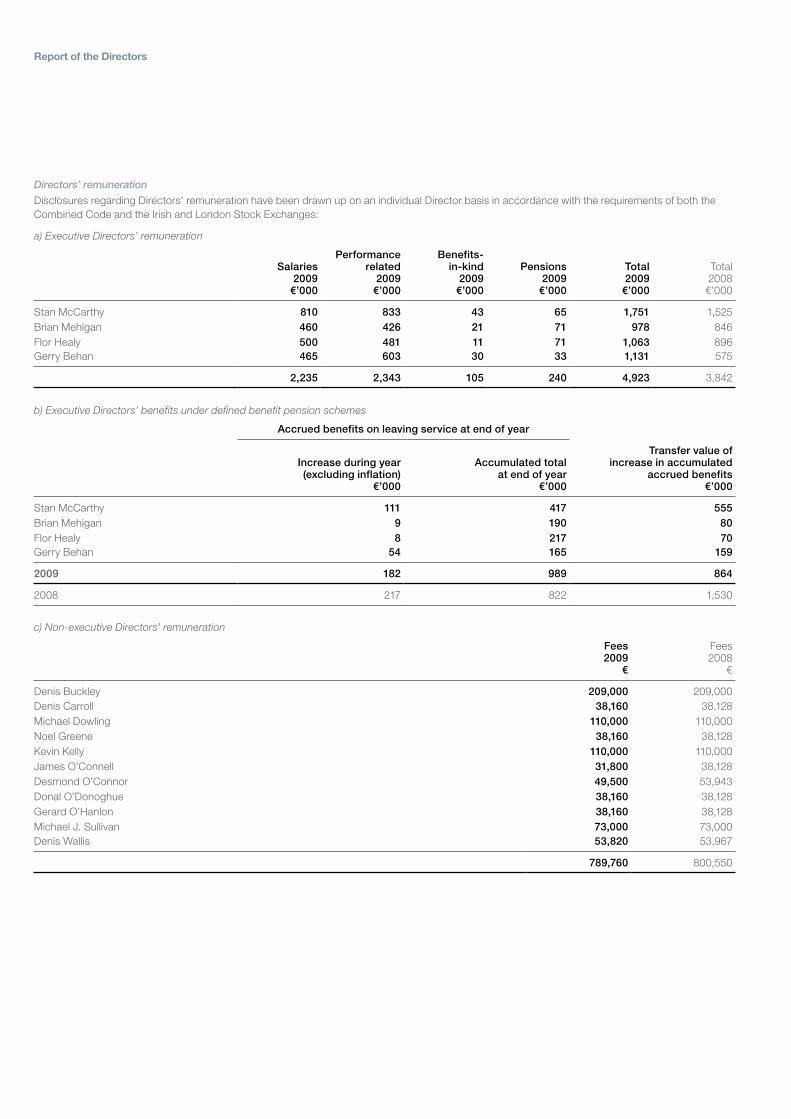
Report of the Directors
Directors’ remuneration
Disclosures regarding Directors’ remuneration have been drawn up on an individual Director basis in accordance with the requirements of both the Combined Code and the Irish and London Stock Exchanges:
a) Executive Directors’ remuneration
Salaries 2009
€’000
Performance related
2009€’000
Benefits- in-kind
2009€’000
Pensions 2009
€’000
Total 2009
€’000
Total 2008€’000
Stan McCarthy 810 833 43 65 1,751 1,525Brian Mehigan 460 426 21 71 978 846Flor Healy 500 481 11 71 1,063 896Gerry Behan 465 603 30 33 1,131 575
2,235 2,343 105 240 4,923 3,842
b) Executive Directors’ benefits under defined benefit pension schemes
Accrued benefits on leaving service at end of year
Increase during year (excluding inflation)
€’000
Accumulated total at end of year
€’000
Transfer value of increase in accumulated
accrued benefits€’000
Stan McCarthy 111 417 555Brian Mehigan 9 190 80Flor Healy 8 217 70Gerry Behan 54 165 159
2009 182 989 864
2008 217 822 1,530
c) Non-executive Directors’ remuneration
Fees 2009
€
Fees 2008
€
Denis Buckley 209,000 209,000Denis Carroll 38,160 38,128Michael Dowling 110,000 110,000Noel Greene 38,160 38,128Kevin Kelly 110,000 110,000James O’Connell 31,800 38,128Desmond O’Connor 49,500 53,943Donal O’Donoghue 38,160 38,128Gerard O’Hanlon 38,160 38,128Michael J. Sullivan 73,000 73,000Denis Wallis 53,820 53,967
789,760 800,550
39Report of the Directors
Non-executive Directors’ remuneration consists of fees only. The total remuneration for all Directors in 2009 amounted to €5,712,760 (2008: €5,224,262). There were no other emoluments paid to the executive or non-executive Directors other than as disclosed above.
d) Payments to former Directors Payments made to former Directors in relation to consultancy and other accrued fees amounted to €976,000 in 2009 (2008: €595,000).
Executive Share Option Scheme The Group has an Executive Share Option Scheme, the terms and conditions of which were approved by shareholders. In the past it was used to grant options under the scheme to key executives including executive Directors across the Group to encourage identification with shareholder interests. No options have been granted by the Company under this scheme since 2000. Currently, approximately 63 executives worldwide still hold outstanding options. This scheme will terminate on 1 October 2010. Details of the options outstanding are presented in note 24 to the financial statements. Currently none of the executive Directors hold share options under this scheme.
Long Term Incentive PlanThe Group also operates a Long Term Incentive Plan (LTIP), the terms and conditions of which were approved by shareholders in 2006. Under this plan, senior executives (including executive Directors) are invited to participate in conditional awards over shares or share options in the Company. The proportion of each award which vests depends on the performance of the Group.
Up to 50% of the award vests according to the Group’s adjusted TSR performance over the period measured against the TSR performance of a peer group of listed companies.
The remaining 50% of the award vests according to the Group’s adjusted EPS growth over the performance period compared with the increase in the Irish Consumer Price Index over the same period.
The first conditional awards were made in 2006 and these awards partially vested in September 2009. New conditional awards were granted during the year and these awards potentially vest in 2012.
The Remuneration and Nomination Committee administer the LTIP.
Relations with shareholdersCommunication with shareholders is of significant importance and the Company undertakes this principally through its Annual and Interim Reports, Interim Management Statements, at the AGM and through the processes described below.
Although most shareholder contact is with the Chief Executive and the Chief Financial Officer, supported by management specialising in investor relations, it is the responsibility of the Board as a whole to ensure that a satisfactory channel of communication with shareholders exists. The Board strongly supports a programme of regular ongoing communication with the Company’s shareholders. The programme, which is formalised within an investor relations framework, includes presentations of interim and full year results and regular meetings of senior management with the Company’s institutional investors. The Group’s website enables a significant amount of published material, including results and presentations, to be readily accessible to all shareholders on demand. Regular communication is also entered into with individual shareholders on a wide range of issues through this medium.
The AGM provides an opportunity for the Directors to deliver presentations on the business and for shareholders, both institutional and private, to question the Directors directly. The Chairman of the Board, together with the Chairmen of the Audit Committee and the Remuneration and Nomination Committee, are available to answer
questions as required. Notice of the AGM, proxy statement and the Annual Report and Accounts, are sent to shareholders at least 20 working days before the meeting. A separate resolution is proposed at the AGM on each substantially separate issue including a particular resolution relating to the report and accounts. Details of the proxy votes for and against each resolution, together with details of votes withheld are announced after the result of the votes by hand. These details are published on the Group’s website following the conclusion of the AGM.
Accountability and auditA statement relating to the Directors’ responsibilities in respect of the preparation of the financial statements is set out on page 35 with the responsibilities of the Company’s Independent Auditors outlined on page 42.
Going concernThe financial statements have been prepared on the going concern basis and, as required by the Combined Code, the Directors report that they have satisfied themselves that the Group is a going concern, having adequate resources to continue in operational existence for the foreseeable future. In forming this view the Directors have reviewed the Group’s budget for 2010, the medium term plans as set out in the rolling five year plan, and have taken into account the cash flow implications of the plans, including proposed capital expenditure, and compared these with the Group’s committed borrowing facilities and projected gearing ratios.
The Group’s business activities, together with the main trends and factors that are likely to affect the future development, performance and position of the Group are outlined in the Business Review on pages 8 to 19 and the Financial Review on pages 20 to 23. The principal risks and uncertainties facing the Group are identified and described on pages 39 and 40. The financial position of the Group, its cash flows, liquidity position, borrowing facilities and financial risk management are discussed in the Financial Review on pages 20 to 23. In addition note 20 to the financial statements includes details of the Group’s borrowings, financial instruments and its exposures to credit and liquidity risk.
Principal risks and uncertainties The Group operates in the dynamic and global food ingredients and flavours industry and in the consumer food industry in the UK and Ireland. As is the case with competitors in these industries the Group is exposed to many and varied risks and uncertainties which are managed in order to make a profitable return for shareholders. The risks are managed, both in the short and long term, utilising the standard management processes adopted in the businesses along with the Group’s internal control and risk management processes described in the next section.
The principal risks and uncertainties facing the Group are discussed below:
Commercial risksThe Group may experience loss of revenue growth momentum due to unforeseen events that impact brands, customers’ brands, consumer dietary changes or food consumption patterns. The spread of the Group’s business and experience in numerous territories limits the concentration of these risks and allows mitigation through management actions.
Fluctuating raw material costs, competition between customers, unusual competitive actions by competitors and the resultant difficulties in adjusting prices appropriately can have a detrimental impact on operating margins. The Group deploys senior managers and subject matter experts in such areas to manage and mitigate such risks and adopt strategies over time to improve the positioning of the businesses in this regard.
Report of the Directors
A sudden acceleration or slow down in the rate of innovation in significant markets can impact both ingredients and flavours and consumer foods businesses if the Group is not appropriately aligned. Investing a significant level of resources ensures the right technological response to each market.
In a given market, a slow rate of innovation or stagnation of consumer trends can lead to commoditisation of a particular category of ingredients. The Group supports customers drive for choice and market stimulation through new product development. Where this dynamic is absent for a period of time the impact on margins can be negative. Kerry Group works closely with customers and consumers to ensure awareness of trends occurring in the market place both positive and negative.
Other commercial risks can be considered under the heading of operational and technical compliance. These risks include such matters as managing compliance in an ever changing regulatory environment, specifically in the areas of health and safety, emissions and effluent and indeed in relation to the potential outbreak of disease in an animal population or contamination in any particular food category. The products and raw materials the Group employs in its operations are substantially all natural in make up and where disease or contamination could potentially occur the Group employs strict quality policies and disciplines to reduce the level of risk encountered to a minimal level.
Possibly the largest commercial risk is the Group executing a value destroying acquisition or large capital project. The Group has significant experience in this area within its management team and employs a thorough and disciplined approach to pre-acquisition due diligence and post-acquisition integration and restructuring. However the risk inherent in this area is very much to the fore in contemplating and managing such projects.
To support our One Kerry Strategy and to facilitate future business growth and expansion, in 2009 the Board approved our Kerryconnect programme which will establish a common Information Communication and Technology (ICT) strategic development approach and integrated systems throughout the Group. The Kerryconnect programme is a major undertaking and investment by the Group. The Group has a professional governance structure, program development and implementation teams in place led by two executive Directors of the Group.
Financial risksThe geographic spread of the Group’s business (across 23 countries of manufacture and 140 in terms of revenue) provides a number of challenges in relation to financial and market risks and uncertainties. These risks include, ensuring finance is available to the Group to carry out its mission, treasury risks, foreign exchange risks, interest rate risks, credit rating risk and market risk in relation to employee retirement obligations. Specifically, currency volatility and credit availability have become more significant than in the past. In addition risks such as inaccurate or delayed stock market reporting, internal control systems failure and IT systems failure could be considered under this heading. These risks and the Group’s response to managing these risks are set out in detail in note 20 to the financial statements.
Human resourcesThe Group is critically aware that its performance in the short or longer term is only as good as the people that manage and run its operations. To this extent every effort is made to ensure optimal procedures and policies are in place to attract, train and retain the capabilities and skill levels appropriate to succeed in the Group’s mission and business objectives.
Internal control The Company, as required by the Irish and London Stock Exchanges, has complied with the Combined Code provisions on internal control, having established the procedures necessary to implement the guidance issued in the Turnbull Committee Report, and by reporting in accordance with that guidance.
The Board of Directors has overall responsibility for the Group’s systems of internal control and risk management. It is also responsible for monitoring the effectiveness of these systems on an ongoing basis. The system of internal control provides reasonable, but not absolute, assurance of:
– The safeguarding of assets against unauthorised use or disposition; and
– The maintenance of proper accounting records and the reliability of the financial information it produces, for both internal use and for publication.
The key elements of the system are as follows:
– The Board of Directors reviews and approves a detailed annual budget each year which is used for comparison with monthly management accounts throughout the year. The Board also approves the Interim and Annual Consolidated Financial Statements;
– The Board of Directors also approves all major strategic decisions. Responsibility for each business unit is passed to local management and is overseen by the respective business manager in line with Group responsibility structures;
– Written policies and procedures are issued centrally for all material functional areas and are approved by the executive Directors. Specific responsibility is allocated to individual managers to monitor compliance with these policies;
– The Group operates a centralised treasury function which manages the financial risks of the Group;
– The Group has a clearly defined process and information system for controlling capital expenditure including the use of appropriate authorisation levels. The overall capital expenditure programme for the year is reviewed by the Board of Directors on an ongoing basis with specific projects being approved by the Board at each meeting;
– Business acquisition and disposal decisions are taken exclusively by the Board of Directors;
– The Group Finance Committee has responsibility for raising finance, reviewing foreign currency risk, making decisions on foreign currency and interest rate hedging and managing the Group’s relationship with its finance providers;
– The Group uses a standardised consolidation system for the preparation of the Group’s monthly management accounts, Interim and Annual Consolidated Financial Statements;
– The Group has a central financial reporting department which facilitates training and financial standards updates for the maintenance of expertise in the Group’s finance personnel; and
– A procedure is in place across the Group for the submission of periodic risk and control reports from management, through the Audit Committee, to the Board. These reports emanate from the Group’s Risk Assessment and Reporting System which covers financial, operational, business and compliance risks.
41Report of the Directors
The Directors have procedures in place to enable them to continually monitor the effectiveness of the system of internal controls. These procedures include:
– The operations of the Audit Committee whose function it is to approve audit plans and deal with significant control issues raised by the internal and external auditors;
– The Group’s internal audit function which continually reviews the internal controls and systems in all businesses and makes recommendations for improvement and reports to the Audit Committee;
– The Group has a Corporate Compliance function to establish compliance policy and monitor compliance across the Group’s countries of operation, carry out compliance reviews and share best practice among the compliance functions in these countries;
– The Group has successfully rolled out a self assessment system covering the key controls for the finance and treasury functions of the Group. The system facilitates a self assessment at a local level and consolidation to a group level. The internal audit function independently verifies a number of these assessments each year and all scores, issues and areas for improvement are reported to the Audit Committee as part of our overall governance program;
– As part of their normal audit procedures, the external auditors test the systems of internal control and report material weaknesses, if any, to the Audit Committee;
– The Board, through the Audit Committee, completes an annual assessment of risk and controls. The internal audit function facilitates the Board in this assessment by preparing a consolidated Group Risk and Control Report for their review. Where necessary, the Audit Committee will convene to deal with any significant control weaknesses reported by internal audit and management;
– Adherence to the policies outlined in the Group’s procedures manual ensures all the key controls in the internal control system are complied with; and
– Any significant variance between the budget and the detailed monthly management accounts is investigated by management and remedial action is taken as necessary.
The Directors confirm that they have reviewed the effectiveness of the system of internal control operated during the period covered by these accounts and up to the date of this report. No significant failings or weaknesses were identified from the internal controls review. The procedures adopted comply with the guidance contained in Internal Control: Guidance for Directors on the Combined Code.
Finally, to ensure that proper books of account are kept for the Company in accordance with section 202 of the Companies Act, 1990, the Directors employ appropriately qualified accounting personnel and maintain appropriate computerised accounting systems. The books of account are located at the Company’s registered office.
SubsidiariesThe principal subsidiaries are listed in note 33 to the financial statements.
AuditorsThe Auditors, Deloitte & Touche, Chartered Accountants, continue in office in accordance with section 160(2) of the Companies Act, 1963.
Retirement benefitsInformation in relation to the Group’s retirement benefit schemes is given in note 22 to the financial statements.
TaxationSo far as the Directors are aware, the Company is not a close company within the definition of the Taxes Consolidation Act, 1997. There has been no change in this respect since 31 December 2009.
Signed on behalf of the Board:
Denis Buckley, Chairman
Stan McCarthy, Chief Executive
22 February 2010
Independent Auditors’ Report to the Members of Kerry Group plc
We have audited the financial statements of Kerry Group plc for the year ended 31 December 2009 which comprise the Group Financial Statements including the Statement of Accounting Policies, the Consolidated Income Statement, the Consolidated Balance Sheet, the Consolidated Statement of Recognised Income and Expense, the Consolidated Reconciliation of Changes in Shareholders’ Equity, the Consolidated Cash Flow Statement, the Company Financial Statements including the Company Balance Sheet, the Company Reconciliation of Changes in Shareholders’ Equity, the Company Cash Flow Statement and the related notes 1 to 33. These financial statements have been prepared under the accounting policies set out in the Statement of Accounting Policies.
This report is made solely to the company’s members, as a body, in accordance with Section 193 of the Companies Act 1990. Our audit work has been undertaken so that we might state to the company’s members those matters we are required to state to them in an auditors’ report and for no other purpose. To the fullest extent permitted by law, we do not accept or assume responsibility to anyone other than the company and the company’s members as a body, for our audit work, for this report, or for the opinions we have formed.
Respective responsibilities of directors and auditorsThe directors are responsible, as set out in the Statement of Directors’ Responsibilities, for preparing the Annual Report, including the preparation of the Group Financial Statements and the Parent Company Financial Statements in accordance with applicable law and International Financial Reporting Standards (IFRSs) as adopted by the European Union.
Our responsibility, as independent auditor, is to audit the financial statements in accordance with relevant legal and regulatory requirements and International Standards on Auditing (UK and Ireland).
We report to you our opinion as to whether the Group Financial Statements and the Parent Company Financial Statements give a true and fair view, in accordance with IFRSs as adopted by the European Union and are properly prepared in accordance with Irish statute comprising the Companies Acts, 1963 to 2009, and Article 4 of the IAS Regulation. We also report to you whether in our opinion: proper books of account have been kept by the company; and whether, at the balance sheet date, there exists a financial situation requiring the convening of an extraordinary general meeting of the company; and whether the information given in the Report of the Directors is consistent with the financial statements. In addition, we state whether we have obtained all information and explanations necessary for the purpose of our audit and whether the company’s balance sheet is in agreement with the books of account.
We also report to you if, in our opinion, any information specified by law or the Listing Rules of the Irish Stock Exchange regarding directors’ remuneration and directors’ transactions is not given and, where practicable, include such information in our report.
We are required by law to establish that the company has produced an annual corporate governance statement and whether such statement contains the information required by law. We review whether the Corporate Governance Statement reflects the company’s compliance with the nine provisions of the 2008 FRC Combined Code specified for our review by the Listing Rules of the Irish Stock Exchange and we report if it does not. We also consider and report to you whether the description in the annual corporate governance statement of the main features of the internal control and risk management systems in relation to the process for preparing the parent and group financial statements is consistent with our evaluation and testing of the relevant systems which we considered necessary for the purpose of this audit report. We also consider and report to you whether the information required under Section 158 (6D) (d) of the Companies Act 1963 given in the annual corporate governance statement is consistent. We are not required to consider whether the board’s statements on internal control cover all risks and controls, or form an opinion on the effectiveness of the group’s corporate governance procedures or its internal controls.
We read the other information contained in the Annual Report and consider whether it is consistent with the financial statements. The other information comprises only the Chairman’s Statement, the Chief Executive’s Review, the Business Review, the Financial Review, the Corporate Social Responsibility Report and the Report of the Directors. Our responsibilities do not extend to other information.
Basis of audit opinionWe conducted our audit in accordance with International Standards on Auditing (UK and Ireland) issued by the Auditing Practices Board. An audit includes examination, on a test basis, of evidence relevant to the amounts and disclosures in the financial statements. It also includes an assessment of the significant estimates and judgements made by the directors in the preparation of the financial statements and of whether the accounting policies are appropriate to the company’s and the group’s circumstances consistently applied and adequately disclosed.
We planned and performed our audit so as to obtain all the information and explanations which we considered necessary in order to provide us with sufficient evidence to give reasonable assurance that the financial statements are free from material misstatement, whether caused by fraud or other irregularity or error. In forming our opinion we evaluated the overall adequacy of the presentation of information in the financial statements.
43Independent Auditors’ Report to the Members of Kerry Group plc
OpinionIn our opinion;
– the Group Financial Statements give a true and fair view, in accordance with IFRSs as adopted by the European Union, of the state of the affairs of the Group as at 31 December 2009 and of its profit for the year then ended;
– the Group Financial Statements have been properly prepared in accordance with the Companies Acts, 1963 to 2009 and Article 4 of the IAS Regulations;
– the Parent Company Financial Statements give a true and fair view, in accordance with IFRSs, as adopted by the European Union as applied in accordance with the provisions of the Companies Acts 1963 to 2009, of the state of the parent company affairs as at 31 December 2009; and
– the Parent Company Financial Statements have been properly prepared in accordance with the Companies Acts, 1963 to 2009.
We have obtained all the information and explanations we considered necessary for the purpose of our audit. In our opinion proper books of account have been kept by the company. The company’s balance sheet is in agreement with the books of account.
In our opinion the information given in the Report of the Directors is consistent with the financial statements.
In our opinion the description given in the annual corporate governance statement of the main features of the internal control and risk management systems in relation to the process for preparing the parent and group financial statements is consistent with our evaluation and testing of the relevant systems which we considered necessary for the purposes of this audit report.
In our opinion the information required under section 158 (6D)(d) of the Companies Act 1963 given in the annual corporate governance statement is consistent.
The net assets of the company, as stated in the balance sheet are more than half the amount of its called-up share capital and, in our opinion, on that basis there did not exist at 31 December 2009 a financial situation which, under Section 40(1) of the Companies (Amendment) Act, 1983, would require the convening of an extraordinary general meeting of the company.
Deloitte & Touche Chartered Accountants & Registered Auditors Dublin
22 February 2010
Statement of Accounting Policies
General informationKerry Group plc is a public limited company incorporated in the Republic of Ireland. The address of its registered office is Prince’s Street, Tralee, Co. Kerry. The principal activities of the Company and its subsidiaries are described in the Business Review.
Basis of preparationThe Group’s financial statements have been prepared in accordance with International Financial Reporting Standards (IFRSs), applicable Irish law and the Listing Rules of the Irish and London Stock Exchanges. The Group’s financial statements have also been prepared in accordance with IFRSs adopted by the European Union and therefore comply with Article 4 of the EU IAS Regulation.
The consolidated financial statements have been prepared under the historical cost convention, as modified by the revaluation of available-for-sale financial assets, financial asset investments and financial liabilities (including derivative financial instruments), which are held at fair value.
The financial statements have been prepared on a going concern basis and further details can be found on page 39 of the Director’s Report.
The consolidated financial statements contained herein are presented in Euro, which is the functional currency of the parent company, Kerry Group plc. The functional currencies of the Group’s main subsidiaries are Euro, US Dollar and Sterling.
IFRS does not define certain Income Statement headings. For clarity, the following are the definitions as applied by the Group:
– ‘Trading profit’ refers to the operating profit generated by the businesses before intangible asset amortisation and gains or losses generated from non-trading items.
– ‘Non-trading items’ refers to gains or losses on the disposal of non-current assets or businesses, material restructuring and other one off costs. It is determined by management that each of these items relate to events or circumstances that are non-recurring in nature.
– ‘Operating profit’ is profit before taxation and finance costs.
The Group makes this distinction to give a better understanding of the financial performance of the business.
Basis of consolidation The consolidated financial statements incorporate the financial statements of the Company and the entities controlled by the Company (its subsidiaries) all of which prepare financial statements up to 31 December. Accounting policies of subsidiaries are consistent with the policies adopted by the Group. Control is achieved where the Company has the power to govern the financial and operating policies of an entity.
The results of subsidiaries acquired or disposed of during the year are included in the Consolidated Income Statement from the date of their acquisition or up to the effective date of their disposal. All inter-group transactions and balances are eliminated on consolidation.
The purchase method of accounting is used for the acquisition of subsidiaries. The acquiree’s identifiable assets, liabilities and contingent liabilities that meet the conditions for recognition under IFRS 3 ‘Business Combinations’ are recognised at their fair value at the acquisition date, which is fair value less costs to sell. The cost of the acquisition is measured at the aggregate fair value of the consideration given and any directly attributable acquisition costs.
RevenueRevenue represents the fair value of the consideration received or receivable, for ingredients and flavours applications and consumer foods branded and non-branded products, from third party customers. Revenue is recorded at invoice value, net of discounts, allowances, volume and promotional rebates and excludes VAT. Revenue is recognised when the significant risks and rewards of ownership of the goods have been transferred to the customer, which is usually upon shipment, or in line with terms agreed with individual customers and when the amount of revenue and costs incurred can be measured reliably. Revenue is recorded when the collection of the amount due is reasonably assured. An estimate is made on the basis of historical sales returns and is recorded to allocate these returns to the same period as the original revenue is recorded. Rebate and discount accruals are established based on best estimates of the amounts necessary to meet claims by the Group’s customers. An accrual is created at the time of sale and released, if unutilised, after assessment that the likelihood of such a claim being made is remote.
Segmental analysisThe Group’s operating segments are identified on the basis of the Group’s management structure, the components of which engage in revenue and expense generating activities. The operating segments present their results and financial information to be regularly reviewed by the Group’s Chief Operating Decision Maker, which the Group has defined as the executive Directors. Trading profit is the key measure utilised in assessing the performance of operating segments within the Group.
The Group has two operating segments: Ingredients & Flavours and Consumer Foods. The Ingredients & Flavours operating segment manufactures and distributes application specific ingredients and flavours spanning a number of technology platforms while the Consumer Foods segment supplies added value brands and customer branded foods to the Irish and UK markets. Corporate activities, such as the cost of corporate stewardship, are reported along with the elimination of inter-group activities under the heading ‘Group Eliminations and Unallocated’. Inter-segment pricing is determined on an arm’s length basis.
Property, plant and equipmentProperty, plant and equipment, other than freehold land, are stated at cost less accumulated depreciation and any accumulated impairment losses. Cost comprises purchase price and other directly attributable costs. Freehold land is stated at cost and is not depreciated. Depreciation on the remaining property, plant and equipment is calculated by charging equal annual instalments, to the Consolidated Income Statement at the following annual rates:
– Buildings 2% – 5%
– Plant, machinery and equipment 7% – 25%
– Motor vehicles 20%
The charge in respect of periodic depreciation is calculated after establishing an estimate of the asset’s useful life and the expected residual value at the end of its life. Increasing/(decreasing) an asset’s expected life or its residual value would result in a (decreased)/increased depreciation charge to the Consolidated Income Statement.
The useful lives of Group assets are determined by management at the time the assets are acquired and reviewed annually for appropriateness. The lives are based on historical experience with similar assets as well as anticipation of future events, which may impact their life, such as changes in technology. Historically, changes in useful lives or residual values have not resulted in material changes to the Group’s depreciation charge.
45Statement of Accounting Policies
Assets in the course of construction for production or administrative purposes, are carried at cost, less any recognised impairment loss. Cost includes professional fees and other directly attributable costs. Depreciation of these assets commences when the assets are ready for their intended use, on the same basis as other property assets.
Non-current assets classified as held for saleNon-current assets are classified as held for sale if their carrying value will be recovered through a sale transaction rather than through continuing use. This condition is regarded as met if the sale is highly probable, the asset is available for immediate sale in its present condition, management is committed to the sale and the sale is expected to be completed within one year from the date of classification.
Non-current assets, including related liabilities, classified as held for sale are measured at the lower of carrying value and fair value less costs to sell.
Intangible assets(a) GoodwillGoodwill only arises on business combinations and represents the difference between the cost of businesses acquired and the aggregate fair values of their identifiable net assets at the date of acquisition. The fair value of the assets and liabilities are based on valuations using assumptions deemed by management to be appropriate. Professional valuers are engaged when it is deemed appropriate to do so.
Goodwill arising on acquisitions before the date of transition to IFRS has been retained at the previous Irish/UK GAAP amounts subject to impairment testing. Goodwill written off to reserves under Irish/UK GAAP prior to 1998 has not been reinstated and is not included in determining any subsequent profit or loss on disposal.
At the date of acquisition, goodwill is allocated, for the purpose of impairment testing, to one or more cash generating units (CGU). Goodwill is tested for impairment at least annually and is carried at cost less accumulated impairment losses, where identified. Impairment is recognised immediately in the Consolidated Income Statement and is not subsequently reversed. On disposal of a subsidiary, the attributable amount of goodwill (not previously written off to reserves) is included in the determination of the profit or loss on disposal.
(b) Brand related intangiblesBrand related intangibles acquired as part of a business combination are valued at their fair value at the date of acquisition. Intangible assets determined to have an indefinite useful life are not amortised and are tested for impairment at least annually. Indefinite life intangible assets are those for which there is no foreseeable limit to their expected useful life. In arriving at the conclusion that these brand related intangibles have an indefinite life, management considers that the Group is a technology business and expects to acquire, hold and support technology for an indefinite period. The Group supports this through spending on research and development. The classification of intangible assets as indefinite is reviewed annually.
Finite life brand related intangible assets are amortised over the period of their expected useful lives, which range from 2 to 20 years, by charging equal annual instalments to the Consolidated Income Statement. The useful life used to amortise finite intangible assets relates to the future performance of the assets acquired and management’s judgement of the period over which economic benefit will be derived from the asset. Historically, changes in useful lives has not resulted in material changes to the Group’s amortisation charge.
(c) Computer softwareIntangible assets separately acquired, including computer software which is not an integral part of an item of computer hardware, are stated at cost less any accumulated amortisation and any accumulated impairment losses. Cost comprises purchase price and other directly attributable costs. These intangible assets are amortised over their expected useful lives, which range from 3 to 7 years, by charging equal annual instalments to the Consolidated Income Statement.
Costs associated with the development of internally generated computer software, including external direct costs of materials and services consumed in developing or obtaining the software and payroll and payroll-related costs for employees who are directly involved with the project are capitalised once they meet the recognition criteria in IAS 38 ‘Intangible Assets’.
These costs are amortised over their expected useful lives on a straight-line basis. Amortisation commences when the assets are ready for their intended use.
Impairment of non-financial assetsGoodwill and other intangible assets that have an indefinite useful life are not subject to amortisation. They are tested annually in the last quarter of the year for impairment and whenever there is an indication that the asset may be impaired. For the purpose of assessing impairment, assets are grouped at the lowest levels for which there are separately identifiable cash flows (CGU) which is by region within operating segment. An impairment loss is recognised immediately in the Consolidated Income Statement for the amount by which the asset’s carrying value exceeds its recoverable amount. The recoverable amount is the higher of an asset’s fair value less costs to sell or its value in use. Value in use is determined as the discounted future cash flows of the CGU. The key assumptions for the value in use calculations are discount rates, growth rates and expected changes in selling price and direct costs during the year. These assumptions reflect management’s best estimates but these estimates involve inherent uncertainties which may not be controlled by management.
When an impairment loss (other than on goodwill) subsequently reverses, the carrying amount of the asset is increased to the revised estimate of its recoverable amount, not exceeding its carrying amount that would have been determined had no impairment loss been recognised for the asset in prior years. Assets that are subject to amortisation are reviewed for impairment whenever events or changes in circumstances indicate the carrying amount may not be recoverable. Impairment is reviewed by assessing the asset’s value-in-use when compared to its carrying value.
InventoriesInventories are valued at the lower of their weighted average cost or estimated net realisable value. Cost includes all expenditure incurred in the normal course of business in bringing the products to their present location and condition. Net realisable value is the estimated selling price of inventory on hand less all further costs to completion and all costs expected to be incurred in marketing, distribution and selling.
Income taxesIncome taxes include both current and deferred taxes. Income taxes are charged or credited to the Consolidated Income Statement except when they relate to items charged or credited directly to shareholders’ equity. In this instance the income taxes are also charged or credited to shareholders’ equity.
Statement of Accounting Policies
The current tax charge is calculated as the amount payable based on taxable profit and the tax rates applying to those profits in the year together with adjustments relating to prior years. Deferred taxes are calculated using the tax rates that are expected to apply in the period when the liability is settled or the asset is realised, based on tax rates that have been enacted or substantively enacted at the balance sheet date.
The calculation of the income tax charge involves a degree of estimation and judgement as the Group operates in many jurisdictions and the tax treatment of certain items cannot be fully determined at the time of the original transaction. The Group can also be subject to tax audits in any of the jurisdictions in which it operates, which by their nature are often complex and can require several years to conclude. Amounts accrued in respect of tax audits are determined based on management’s interpretation of the relevant tax laws and likelihood of a successful conclusion. When the final tax outcome for these items is different from amounts initially recorded, such differences will impact the income tax and deferred tax in the period in which such a determination is made, as well as the Group’s cash position.
Deferred taxes are calculated based on the temporary differences that arise between the tax base of the asset or liability and its carrying value in the Consolidated Balance Sheet. Deferred taxes are recognised on all temporary differences in existence at the balance sheet date except for:
– temporary differences which arise from the initial recognition of an asset or liability in a transaction other than a business combination that at the time of the transaction does not affect accounting or taxable profit or loss, or on the initial recognition of goodwill for which a tax deduction is not available; and
– temporary differences which arise on investments in subsidiaries where the timing of the reversal is controlled by the Group and it is probable that the temporary difference will not reverse in the foreseeable future.
The recognition of a deferred tax asset is based upon whether it is probable that sufficient and suitable taxable profits will be available in the future, against which the reversal of temporary differences can be deducted. Recognition, therefore, involves judgement regarding the future financial performance of the particular legal entity or tax group in which the deferred tax asset exists. Deferred tax assets are reviewed at each reporting date.
Current and deferred income tax assets and liabilities are offset where taxes are levied by the same taxation authority, there is a legal right of offset between the assets and liabilities and the Group intends to settle on a net basis.
Retirement benefits Payments to defined contribution plans are recognised in the Consolidated Income Statement as they fall due and any contributions outstanding at the year end are included as an accrual in the Consolidated Balance Sheet.
Actuarial valuations for accounting purposes are carried out at each balance sheet date in relation to defined benefit plans, using the projected unit credit method, to determine the schemes’ liabilities and the related cost of providing benefits.
Current service cost, expected return on pension schemes’ assets and interest on schemes’ liabilities are recognised in the Consolidated Income Statement as they arise. Actuarial gains and losses are recognised in full in the period in which they occur in the Consolidated Statement of Recognised Income and Expense. Past service cost, which can be positive or negative, is recognised immediately in the Consolidated Income Statement to the extent the change in benefits is already vested. Otherwise, past service cost is recognised on a straight line basis over
the average period until the benefits become vested. Gains or losses on the curtailment or settlement of a plan are recognised in the Consolidated Income Statement when the curtailment or settlement occurs.
The defined benefit liability recognised in the Consolidated Balance Sheet represents the present value of the defined benefit obligation less any past service cost not yet recognised and less the fair value of any plan assets. Defined benefit assets are also recognised in the Consolidated Balance Sheet but are limited to the total of unrecognised past service cost and the present value of available refunds from, and reductions in future contributions, to the plan.
ProvisionsProvisions can be distinguished from other types of liability by considering the events that give rise to the obligation and the degree of uncertainty as to the amount of the liability. These are recognised in the Consolidated Balance Sheet when:
– the Group has a present obligation (legal or constructive) as a result of a past event;
– it is probable that the Group will be required to settle the obligation; and
– a reliable estimate can be made of the amount of the obligation.
The amount recognised as a provision is the best estimate of the amount required to settle the present obligation at the balance sheet date, taking account of the risks and uncertainties surrounding the obligation.
Research and development expenditureExpenditure on research activities is recognised as an expense in the financial year it is incurred.
Development expenditure is assessed and capitalised as an internally generated intangible asset only if it meets all of the following criteria:
– it is technically feasible to complete the asset for use or sale;
– it is intended to complete the asset for use or sale;
– the Group has the ability to use or sell the intangible asset;
– it is probable that the asset created will generate future economic benefits;
– adequate resources are available to complete the asset for sale or use; and
– the development cost of the asset can be measured reliably.
Capitalised development costs are amortised over their expected economic lives. Where no internally generated intangible asset can be recognised, development expenditure is recognised as an expense in the financial year it is incurred. The Group has not capitalised development expenditure to date.
GrantsGrants of a capital nature are accounted for as deferred income in the Consolidated Balance Sheet and are released to the Consolidated Income Statement at the same rates as the related assets are depreciated. Grants of a revenue nature are credited to the Consolidated Income Statement to offset the matching expenditure.
DividendsDividends are accounted for when they are approved, through the retained earnings reserve. Dividends proposed do not meet the definition of a liability until such time as they have been approved.
47Statement of Accounting Policies
Operating leasesAnnual rentals payable under operating leases are charged to the Consolidated Income Statement on a straight line basis over the period of the lease.
Share-based paymentsThe Group has granted share-based payments to employees under an Executive Share Option Scheme and a Long Term Incentive Plan.
(a) Executive Share Option Scheme In accordance with IFRS 2 ‘Share-based Payment’, there is no requirement to recognise any compensation expense in the consolidated financial statements, as no new options have been granted under the Executive Share Option Scheme since 7 November 2002.
(b) Long Term Incentive PlanThe equity-settled share-based awards granted under this plan are measured at the fair value of the equity instruments at the date of grant. The fair value is measured using the Monte Carlo Pricing Model. It is charged to the Consolidated Income Statement over the vesting period of the awards based on the probable number of awards that will eventually vest, with a corresponding credit to shareholders’ equity. At the balance sheet date, the estimate of the level of vesting is reviewed and any adjustment necessary is recognised in the Consolidated Income Statement and in shareholders’ equity.
Foreign currencyForeign currency transactions are translated into functional currency at the rate of exchange ruling at the date of the transaction. Exchange differences arising from either the retranslation of the resulting monetary assets or liabilities at the exchange rate at the balance sheet date or from the settlement of the balance at a different rate are recognised in the Consolidated Income Statement when they occur.
On consolidation the income statements of foreign currency subsidiaries are translated into Euro at the average exchange rate, which approximates to the actual exchange rates for the year. The balance sheets of such subsidiaries are translated at the rate of exchange at the balance sheet date. Resulting exchange differences arising on the translation of foreign currency subsidiaries are taken directly to a separate component of shareholders’ equity.
Goodwill and fair value adjustments arising on the acquisition of foreign subsidiaries are treated as assets and liabilities of the foreign subsidiaries and are translated at the closing rate.
On disposal of a foreign currency subsidiary, the cumulative translation difference for that foreign subsidiary is transferred to the Consolidated Income Statement as part of the gain or loss on disposal.
Borrowing costsBorrowing costs incurred for assets, which take a substantial period of time to construct, are added to the cost of the asset during the period of time required to complete and prepare the asset for its intended use. Other borrowing costs are expensed to the Consolidated Income Statement in the period in which they are incurred.
Financial instrumentsFinancial assets and financial liabilities are recognised on the Consolidated Balance Sheet when the Group becomes party to the contractual provisions of the instrument.
Financial assets and liabilities are initially measured at fair value, plus transaction costs, except for those classified as fair value through profit or loss, which are initially measured at fair value.
All financial assets are recognised and derecognised on a trade date basis, where the purchase or sale of a financial asset is under a contract whose terms require delivery of the financial asset within the timeframe of the market concerned.
Financial assets and liabilities are classified into specified categories in accordance with IAS 39 ‘Financial Instruments: Recognition & Measurement’. These categories are as follows:
– loans and receivables;
– available-for-sale financial assets;
– financial assets at fair value through profit or loss (FVTPL);
– held to maturity investments;
– financial liabilities measured at amortised cost; and
– financial liabilities at fair value through profit or loss (FVTPL).
The classification is determined at the time of initial recognition of the financial asset or liability and is based upon its nature and purpose.
Loans and receivablesTrade and other receivables that have fixed or determinable payments that are not quoted in an active market are classified as ‘loans and receivables’.
Trade and other receivables are stated at amortised cost, which approximates fair value given the short term nature of these assets. A provision for doubtful trade receivables is created based on incurred loss experience or where there is objective evidence that amounts are irrecoverable. Movements in this provision are recorded in general overheads in the Consolidated Income Statement.
Available-for-sale financial assetsGroup financial asset investments, classified as available-for-sale, are stated at their fair value at the balance sheet date. Movements in fair value are recorded in shareholders’ equity until the asset is disposed of unless there is deemed to be an impairment on the original cost in which case the loss is taken directly to the Consolidated Income Statement. Upon disposal the fair value movement in shareholders’ equity is transferred to the Consolidated Income Statement. Quoted market prices are used to determine the fair value of listed shares. Income from investments is recognised in the Consolidated Income Statement in the period in which it is received.
Financial assets at fair value through profit or loss (FVTPL)Financial assets are classified as FVTPL when the financial assets are either held for trading or they are designated upon initial recognition as FVTPL.
Certain derivatives that are not designated and effective as a hedging instrument are classified as held for trading. The Group does not have any other financial assets classified as held for trading.
Held to maturity investments The Group currently does not have any held to maturity investments.
Statement of Accounting Policies
Financial liabilities at amortised costOther non-derivative financial liabilities consist primarily of trade and other payables and borrowings.
Financial liabilities at fair value through profit or loss (FVTPL)Financial liabilities at FVTPL arise when the financial liabilities are either held for trading or they are designated upon initial recognition as FVTPL.
The Group classifies as held for trading certain derivatives that are not designated and effective as a hedging instrument. The Group does not have any other financial liabilities classified as held for trading.
Investments in subsidiariesInvestments in subsidiaries held by the Company are carried at cost less accumulated impairment losses.
Impairment of financial assetsFinancial assets, other than those at FVTPL, are assessed for indicators of impairment at the end of each reporting period. Financial assets are impaired when objective evidence highlights that the estimated future cash flows from the investment have been affected.
For quoted and unquoted equity investments classified as available-for-sale, a significant and prolonged decline in the fair value of the asset below its cost is considered to be objective evidence of impairment.
For trade receivables, unusual or increasingly delayed payments, increase in average credit period taken or known financial difficulties of a customer, in addition to observable changes in national or local economic conditions in the country of the customer are considered indicators that the trade receivable balance may be impaired. The carrying amount of the asset is reduced through the use of a provision account and the amount of the loss is recognised in the Consolidated Income Statement. When a trade receivable is uncollectable, it is written off against the provision account for trade receivables. Subsequent recoveries of amounts previously written off are credited to general overheads in the Consolidated Income Statement.
For all other financial assets, objective evidence of impairment could include:
– significant financial difficulty of the counterparty, indicated through unusual or increasingly delayed payments or increase in average credit period taken;
– evidence that they are entering bankruptcy or financial re-organisation; and
– observable changes in local or economic conditions.
Cash and cash equivalentsCash and cash equivalents consists of cash at bank held by the Group and short term bank deposits with a maturity of three months or less and are shown under current assets on the Consolidated Balance Sheet. Bank overdrafts are shown within ‘Borrowings and overdrafts’ in current liabilities on the Consolidated Balance Sheet. The carrying amount of these assets and liabilities approximates to their fair value.
Trade and other payablesTrade and other payables are stated at amortised cost, which approximates to their fair value given the short term nature of these liabilities. Trade payables are non interest bearing.
BorrowingsDebt instruments are initially recorded at the value of proceeds received, net of transaction costs. Subsequently they are reported at amortised cost, except for hedged debt. Discounts between the net proceeds received and the principal value due on redemption are recognised as a finance cost in the Consolidated Income Statement. To the extent that debt instruments are hedged under qualifying fair value hedges, the hedged item is adjusted for changes in the fair value of the hedging instruments with changes arising recognised in the Consolidated Income Statement. The fair value of the hedged debt is primarily determined using the discounted cash flow basis.
Derecognition of financial liabilitiesThe Group derecognises financial liabilities only when the Group’s obligations are discharged, cancelled or when they expire.
Derivative financial instruments and hedge accountingThe Group’s activities expose it to risks of changes in foreign currency exchange rates and interest rates in relation to international trading and long-term debt. The Group uses foreign exchange forward contracts, interest rate swaps and forward rate agreements to hedge these exposures. The Group does not use derivative financial instruments for speculative purposes.
Hedge accounting is applied to the derivative instruments where they are effective in offsetting the changes in fair value or cash flows of the hedged item. The relevant criteria required in order to apply hedge accounting is as follows:
– the hedged item and the hedging instrument are specifically identified;
– the hedging relationship is formally documented to identify the hedged risk and how the effectiveness is assessed;
– the effectiveness of the hedge can be reliably measured;
– the hedge must be expected to be highly effective and this is tested regularly throughout its life; and
– a forecast transaction that is the subject of the hedge must be highly probable.
Fair value of financial instrument derivativesThe fair values of financial assets and financial instrument derivatives are determined as follows:
– the fair value of financial assets with standard terms and conditions, and traded on active liquid markets is determined with reference to quoted market prices, which are observable; and
– the fair value of derivative instruments is calculated using discounted cash flow analysis based on the applicable yield curve for the duration and currency of the instrument, which are observable:
– foreign currency forward contracts are measured using quoted forward exchange rates to match the maturities of these contracts; and
– interest rate swaps are measured at the present value of future cash flows estimated and discounted based on the applicable yield curves.
The carrying values of financial assets and financial liabilities recorded at amortised cost in the financial statements approximate to their fair values. In the case of derivative financial instruments their fair value has been recognised on the face of the Consolidated Balance Sheet.
49Statement of Accounting Policies
Cash flow hedgesWhere derivatives, including forward foreign currency, forward commodity contracts and floating to fixed interest rate swaps are used, they are primarily treated as cash flow hedges. Changes in the fair value of derivative financial instruments that are designated, and are effective, as hedges of future cash flows are recognised directly in shareholders’ equity. Any ineffective portion of the hedge is recognised in the Consolidated Income Statement. When a firm commitment or forecasted transaction occurs and results in the recognition of an asset or a liability, then, at that time the associated gains or losses on the hedging instrument that had previously been recognised in shareholders’ equity are recognised in the Consolidated Income Statement.
If a hedge is no longer effective or a hedging relationship ceases to exist, hedge accounting is discontinued prospectively and any cumulative gain or loss on the instrument previously recognised in shareholders’ equity is retained in shareholders’ equity until the forecasted transaction occurs, at which time it is released to the Consolidated Income Statement. If the hedged transaction is no longer expected to occur, the net cumulative gain or loss in shareholders’ equity is transferred to the Consolidated Income Statement immediately.
Cash flow hedge accounting is applied to foreign exchange forward contracts which are expected to be effective in offsetting the changes in fair value or cash flows of expected future cash flows. In order to achieve and maintain cash flow hedge accounting, it is necessary for management to determine, at inception and on an ongoing basis, whether a forecast transaction is highly probable and whether the hedge is effective.
Fair value hedgesWhere fixed to floating interest rate swaps are used they are treated as fair value hedges. Changes in the fair value of derivatives that are designated as fair value hedges are recognised directly in the Consolidated Income Statement, together with any changes in the fair value of the hedged asset or liability that are attributable to the hedged risk.
Hedge accounting is discontinued prospectively when the hedging relationship ceases to exist or the Group revokes the designation. The fair value adjustment to the carrying amount of the hedged item arising from the hedged risk is amortised through the Consolidated Income Statement from that date.
Trading DerivativesCertain derivatives which comply with the Group’s financial risk management policies either; a) do not qualify for hedge accounting or b) management have decided not to apply hedge accounting to and are therefore classified as trading derivatives. In these cases the instrument is reported independently at fair value with any changes recognised in the Consolidated Income Statement. In all other instances, cash flow or fair value hedge accounting is applied.
Critical accounting estimates and judgementsPreparation of the consolidated financial statements requires management to make certain estimates and assumptions that affect the reported profits, assets and liabilities. The significant estimates and assumptions used in the preparation of the Group’s financial statements are outlined in the relevant accounting policies and notes to the financial statements and include:
– Property, plant and equipment;
– Intangibles assets;
– Impairment of intangible assets and property, plant & equipment;
– Income taxes;
– Retirement benefits obligation;
– Provisions for liabilities and charges;
– Non-trading items.
New standards and interpretationsCertain new and revised accounting standards and new IFRIC interpretations are mandatory for the Group for accounting periods beginning on or after 1 January 2009. The Group’s assessment of the impact of these new standards and interpretations is set out as follows:
Statement of Accounting Policies
Standards and Interpretations effective in 2009 but not material to the Group: Effective Date– IFRS 1 (amendment) First-time adoption of International Financial Reporting Standards 1 July 2009– IFRS 2 (amendment) Share Based Payments 1 January 2009– IFRS 5 (amendment) Non-current Assets Held for Sale and Discontinued Operations 1 July 2009– IFRS 7 (amendment) Financial Instruments: Disclosures – Improving Disclosures about Financial Instruments 1 January 2009– IFRS 8 Operating Segments 1 January 2009– IAS 1 (amendment) Presentation of Financial Statements 1 January 2009– IAS 16 (amendment) Property, Plant and Equipment 1 January 2009– IAS 19 (amendment) Employee Benefits 1 January 2009– IAS 20 (amendment) Accounting for Government Grants and Disclosure of Government Assistance 1 January 2009– IAS 23 (amendment) Borrowing Costs 1 January 2009– IAS 27 (amendment) Consolidated and Separate Financial Statements 1 January 2009– IAS 27 (revised) Consolidated and Separate Financial Statements 1 July 2009– IAS 28 (amendment) Investments in Associates 1 January 2009– IAS 29 (amendment) Financial Reporting in Hyperinflation Economies 1 January 2009– IAS 31 (amendment) Interests in Joint Ventures 1 January 2009– IAS 32 (amendment) Financial Instruments: Presentation 1 January 2009– IAS 36 (amendment) Impairment of Assets 1 January 2009– IAS 38 (amendment) Intangible Assets 1 January 2009– IAS 39 (amendment) Financial Instruments: Recognition and Measurement 1 July 2009– IAS 40 (amendment) Investment Property 1 January 2009– IAS 41 (amendment) Agriculture 1 January 2009– IFRIC 9 (amendment) Reassessment of Embedded Derivatives 1 July 2009– IFRIC 13 Customer Loyalty Programmes 1 July 2008– IFRIC 15 Agreements for the Construction of Real Estate 1 January 2009– IFRIC 16 Hedges of a Net Investment in a Foreign Operation 1 October 2008– IFRIC 16 (amendment) Hedges of a Net Investment in a Foreign Operation 1 July 2009– IFRIC 17 Distributions of Non-cash Assets to Owners 1 July 2009– IFRIC 18 Transfers of Assets from Customers 1 July 2009
Standards and Interpretations which are not yet effective and not expected to have a material effect: Effective Date– IFRS 1 (amendment) First-time adoption of International Financial Reporting Standards 1 January 2010– IFRS 2 (amendment) Share Based Payments 1 July 2009– IFRS 5 (amendment) Non-current Assets Held for Sale and Discontinued Operations 1 January 2010– IFRS 8 (amendment) Operating Segments 1 January 2010– IFRS 9 Financial Instruments 1 January 2013– IAS 1 (amendment) Presentation of Financial Statements 1 January 2010– IAS 7 (amendment) Statement of Cash Flows 1 January 2010– IAS 17 (amendment) Leases 1 January 2010– IAS 24 (amendment) Related Party Transactions 1 January 2011– IAS 32 (amendment) Financial Instruments: Presentation 1 February 2010– IAS 36 (amendment) Impairment of Assets 1 January 2010– IAS 38 (amendment) Intangible Assets 1 July 2009– IAS 39 (amendment) Financial Instruments: Recognition and Measurement 1 January 2010– IFRIC 14 (amendment) IAS 19 – The Limit on a Defined Benefit Asset, Minimum Funding Requirements and
their Interaction
1 January 2011– IFRIC 19 Extinguishing Financial Liabilities with Equity Instruments 1 July 2010
The following revised standard is not yet effective and may have a material effect on the results or financial position of the Group and is currently under review: Effective Date– IFRS 3 (revised) Business Combinations 1 July 2009
The standard continues to apply the acquisition method to business combinations, with some significant changes. These changes include a requirement that all payments to purchase a business be recorded at fair value at the acquisition date, with some contingent payments subsequently re-measured through income. Goodwill may be calculated based on the parent’s share of net assets or it may include goodwill related to minority interest. All transaction costs will be expensed. However this revised standard will only have a material affect on the Group’s financial position if a material acquistion is undertaken in the future.
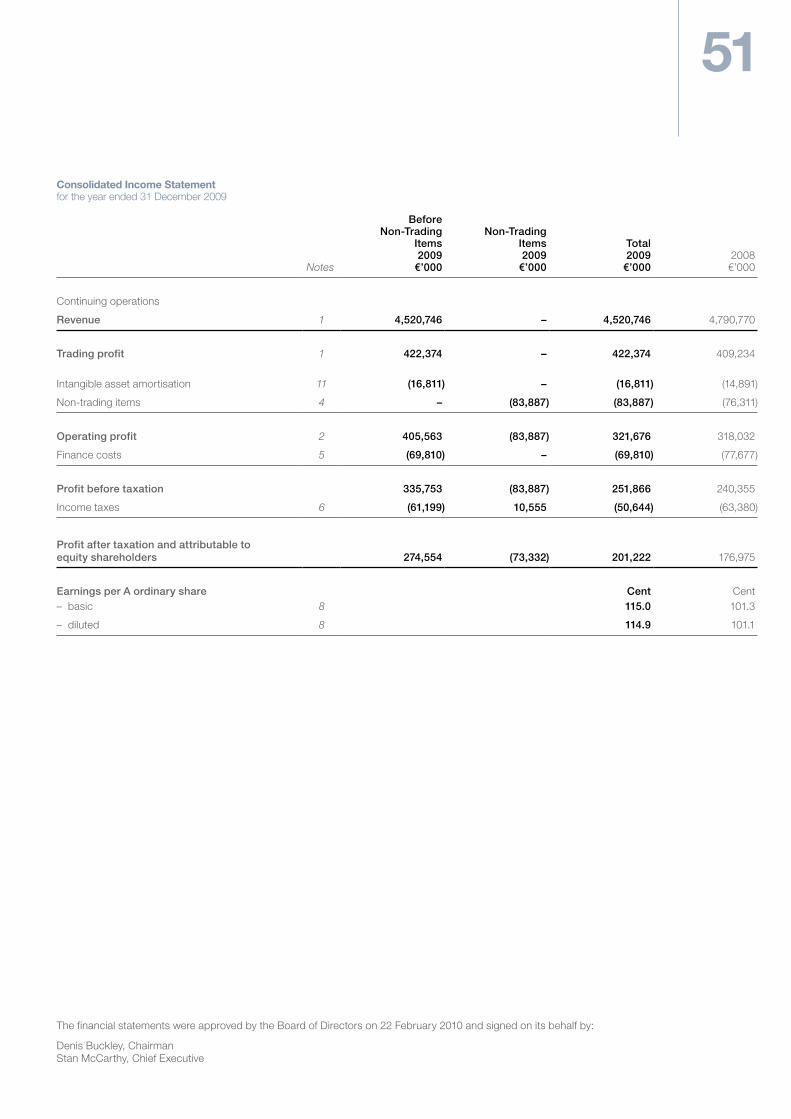
51
Consolidated Income Statement for the year ended 31 December 2009
Notes
Before Non-Trading
Items 2009
€’000
Non-Trading Items 2009
€’000
Total 2009
€’0002008€’000
Continuing operations
Revenue 1 4,520,746 – 4,520,746 4,790,770
Trading profit 1 422,374 – 422,374 409,234
Intangible asset amortisation 11 (16,811) – (16,811) (14,891)
Non-trading items 4 – (83,887) (83,887) (76,311)
Operating profit 2 405,563 (83,887) 321,676 318,032
Finance costs 5 (69,810) – (69,810) (77,677)
Profit before taxation 335,753 (83,887) 251,866 240,355
Income taxes 6 (61,199) 10,555 (50,644) (63,380)
Profit after taxation and attributable to equity shareholders 274,554 (73,332) 201,222 176,975
Earnings per A ordinary share Cent Cent– basic 8 115.0 101.3
– diluted 8 114.9 101.1
The financial statements were approved by the Board of Directors on 22 February 2010 and signed on its behalf by:
Denis Buckley, Chairman Stan McCarthy, Chief Executive
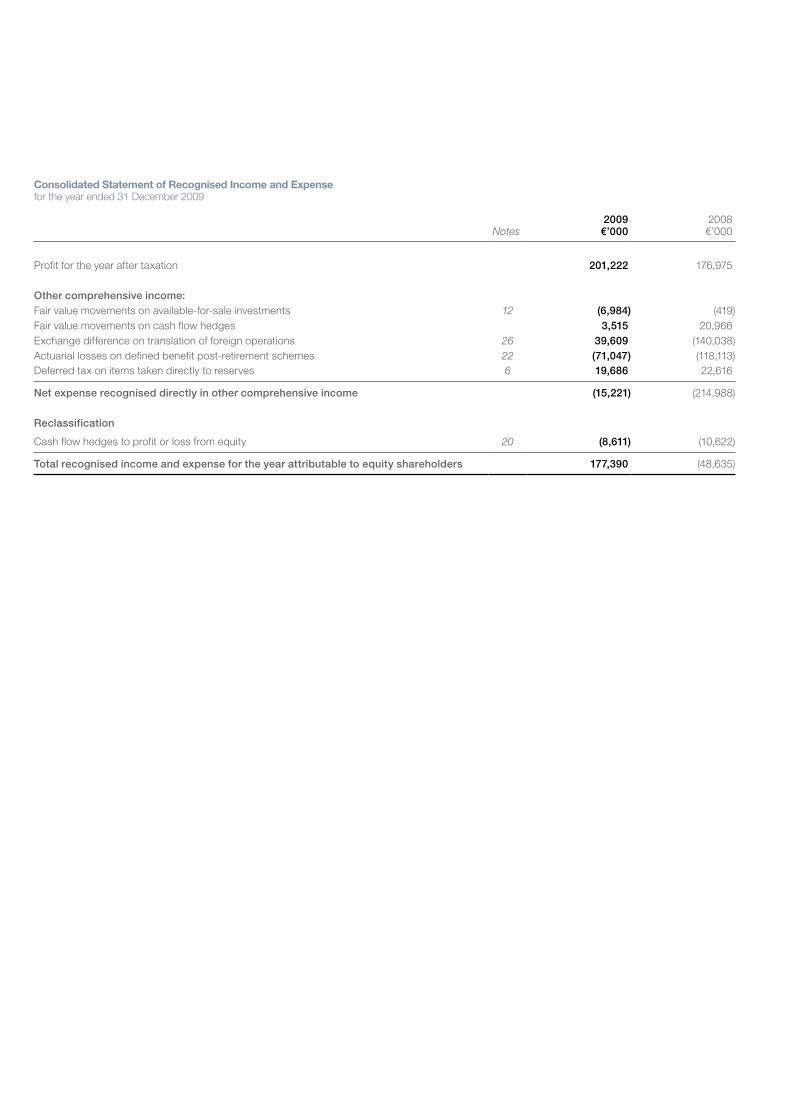
Consolidated Statement of Recognised Income and Expense for the year ended 31 December 2009
Notes2009
€’0002008€’000
Profit for the year after taxation 201,222 176,975
Other comprehensive income: Fair value movements on available-for-sale investments 12 (6,984) (419)Fair value movements on cash flow hedges 3,515 20,966Exchange difference on translation of foreign operations 26 39,609 (140,038)Actuarial losses on defined benefit post-retirement schemes 22 (71,047) (118,113)Deferred tax on items taken directly to reserves 6 19,686 22,616
Net expense recognised directly in other comprehensive income (15,221) (214,988)
Reclassification
Cash flow hedges to profit or loss from equity 20 (8,611) (10,622)
Total recognised income and expense for the year attributable to equity shareholders 177,390 (48,635)
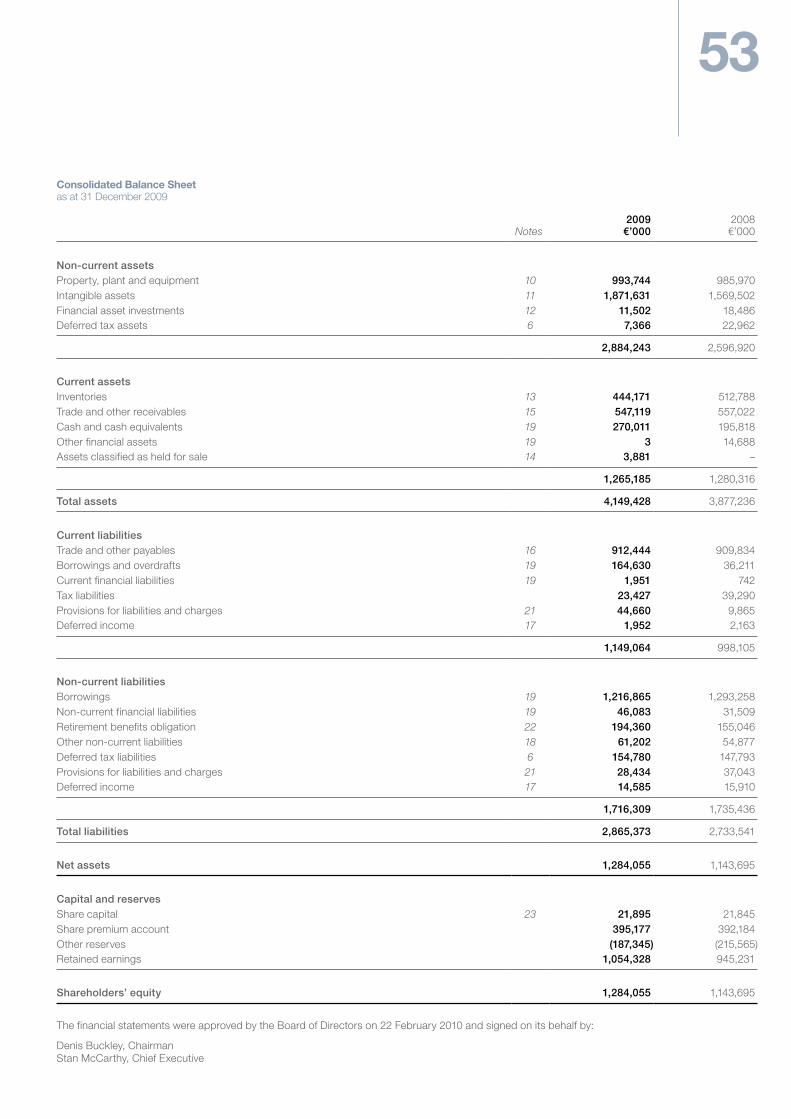
53
Consolidated Balance Sheet as at 31 December 2009
Notes2009
€’0002008€’000
Non-current assetsProperty, plant and equipment 10 993,744 985,970Intangible assets 11 1,871,631 1,569,502Financial asset investments 12 11,502 18,486Deferred tax assets 6 7,366 22,962
2,884,243 2,596,920
Current assetsInventories 13 444,171 512,788Trade and other receivables 15 547,119 557,022Cash and cash equivalents 19 270,011 195,818Other financial assets 19 3 14,688Assets classified as held for sale 14 3,881 –
1,265,185 1,280,316
Total assets 4,149,428 3,877,236
Current liabilitiesTrade and other payables 16 912,444 909,834Borrowings and overdrafts 19 164,630 36,211Current financial liabilities 19 1,951 742Tax liabilities 23,427 39,290Provisions for liabilities and charges 21 44,660 9,865Deferred income 17 1,952 2,163
1,149,064 998,105
Non-current liabilitiesBorrowings 19 1,216,865 1,293,258Non-current financial liabilities 19 46,083 31,509Retirement benefits obligation 22 194,360 155,046Other non-current liabilities 18 61,202 54,877Deferred tax liabilities 6 154,780 147,793Provisions for liabilities and charges 21 28,434 37,043Deferred income 17 14,585 15,910
1,716,309 1,735,436
Total liabilities 2,865,373 2,733,541
Net assets 1,284,055 1,143,695
Capital and reservesShare capital 23 21,895 21,845Share premium account 395,177 392,184Other reserves (187,345) (215,565)Retained earnings 1,054,328 945,231
Shareholders’ equity 1,284,055 1,143,695
The financial statements were approved by the Board of Directors on 22 February 2010 and signed on its behalf by:
Denis Buckley, Chairman Stan McCarthy, Chief Executive
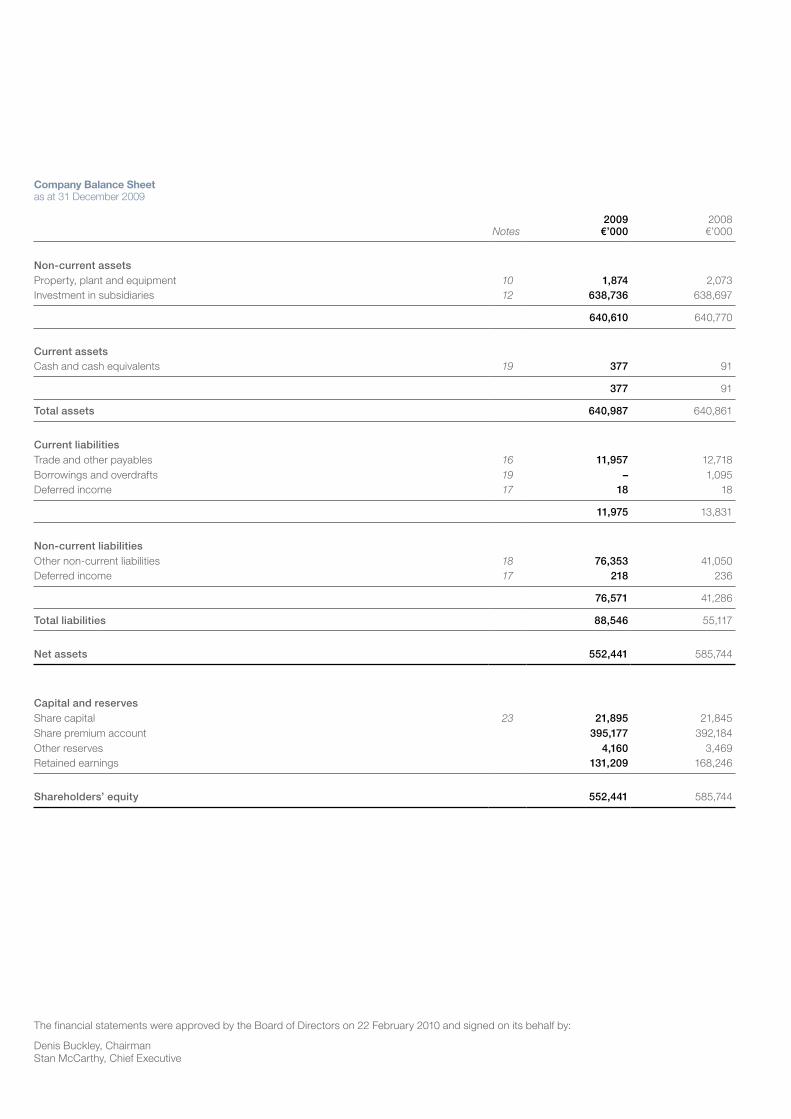
Company Balance Sheet as at 31 December 2009
Notes2009
€’0002008€’000
Non-current assetsProperty, plant and equipment 10 1,874 2,073Investment in subsidiaries 12 638,736 638,697
640,610 640,770
Current assetsCash and cash equivalents 19 377 91
377 91
Total assets 640,987 640,861
Current liabilitiesTrade and other payables 16 11,957 12,718Borrowings and overdrafts 19 – 1,095Deferred income 17 18 18
11,975 13,831
Non-current liabilitiesOther non-current liabilities 18 76,353 41,050Deferred income 17 218 236
76,571 41,286
Total liabilities 88,546 55,117
Net assets 552,441 585,744
Capital and reservesShare capital 23 21,895 21,845Share premium account 395,177 392,184Other reserves 4,160 3,469Retained earnings 131,209 168,246
Shareholders’ equity 552,441 585,744
The financial statements were approved by the Board of Directors on 22 February 2010 and signed on its behalf by:
Denis Buckley, Chairman Stan McCarthy, Chief Executive
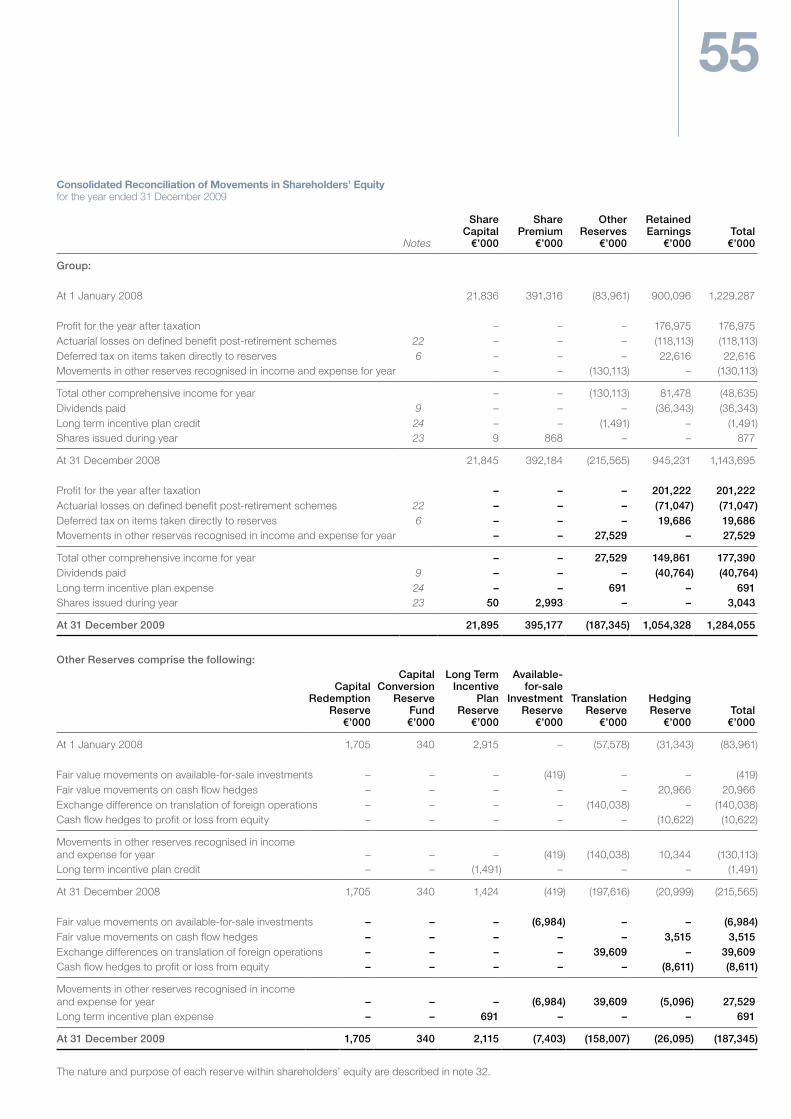
55
Consolidated Reconciliation of Movements in Shareholders’ Equity for the year ended 31 December 2009
Notes
Share Capital
€’000
Share Premium
€’000
Other Reserves
€’000
Retained Earnings
€’000Total€’000
Group:
At 1 January 2008 21,836 391,316 (83,961) 900,096 1,229,287
Profit for the year after taxation – – – 176,975 176,975Actuarial losses on defined benefit post-retirement schemes 22 – – – (118,113) (118,113)Deferred tax on items taken directly to reserves 6 – – – 22,616 22,616Movements in other reserves recognised in income and expense for year – – (130,113) – (130,113)
Total other comprehensive income for year – – (130,113) 81,478 (48,635)Dividends paid 9 – – – (36,343) (36,343)Long term incentive plan credit 24 – – (1,491) – (1,491)Shares issued during year 23 9 868 – – 877
At 31 December 2008 21,845 392,184 (215,565) 945,231 1,143,695
Profit for the year after taxation – – – 201,222 201,222Actuarial losses on defined benefit post-retirement schemes 22 – – – (71,047) (71,047)Deferred tax on items taken directly to reserves 6 – – – 19,686 19,686Movements in other reserves recognised in income and expense for year – – 27,529 – 27,529
Total other comprehensive income for year – – 27,529 149,861 177,390Dividends paid 9 – – – (40,764) (40,764)Long term incentive plan expense 24 – – 691 – 691Shares issued during year 23 50 2,993 – – 3,043
At 31 December 2009 21,895 395,177 (187,345) 1,054,328 1,284,055
Other Reserves comprise the following:
Capital Redemption
Reserve€’000
Capital Conversion
Reserve Fund€’000
Long Term Incentive
Plan Reserve
€’000
Available- for-sale
Investment Reserve
€’000
Translation Reserve
€’000
Hedging Reserve
€’000Total€’000
At 1 January 2008 1,705 340 2,915 – (57,578) (31,343) (83,961)
Fair value movements on available-for-sale investments – – – (419) – – (419)Fair value movements on cash flow hedges – – – – – 20,966 20,966Exchange difference on translation of foreign operations – – – – (140,038) – (140,038)Cash flow hedges to profit or loss from equity – – – – – (10,622) (10,622)
Movements in other reserves recognised in income and expense for year – – – (419) (140,038) 10,344 (130,113)Long term incentive plan credit – – (1,491) – – – (1,491)
At 31 December 2008 1,705 340 1,424 (419) (197,616) (20,999) (215,565)
Fair value movements on available-for-sale investments – – – (6,984) – – (6,984)Fair value movements on cash flow hedges – – – – – 3,515 3,515Exchange differences on translation of foreign operations – – – – 39,609 – 39,609Cash flow hedges to profit or loss from equity – – – – – (8,611) (8,611)
Movements in other reserves recognised in income and expense for year – – – (6,984) 39,609 (5,096) 27,529Long term incentive plan expense – – 691 – – – 691
At 31 December 2009 1,705 340 2,115 (7,403) (158,007) (26,095) (187,345)
The nature and purpose of each reserve within shareholders’ equity are described in note 32.
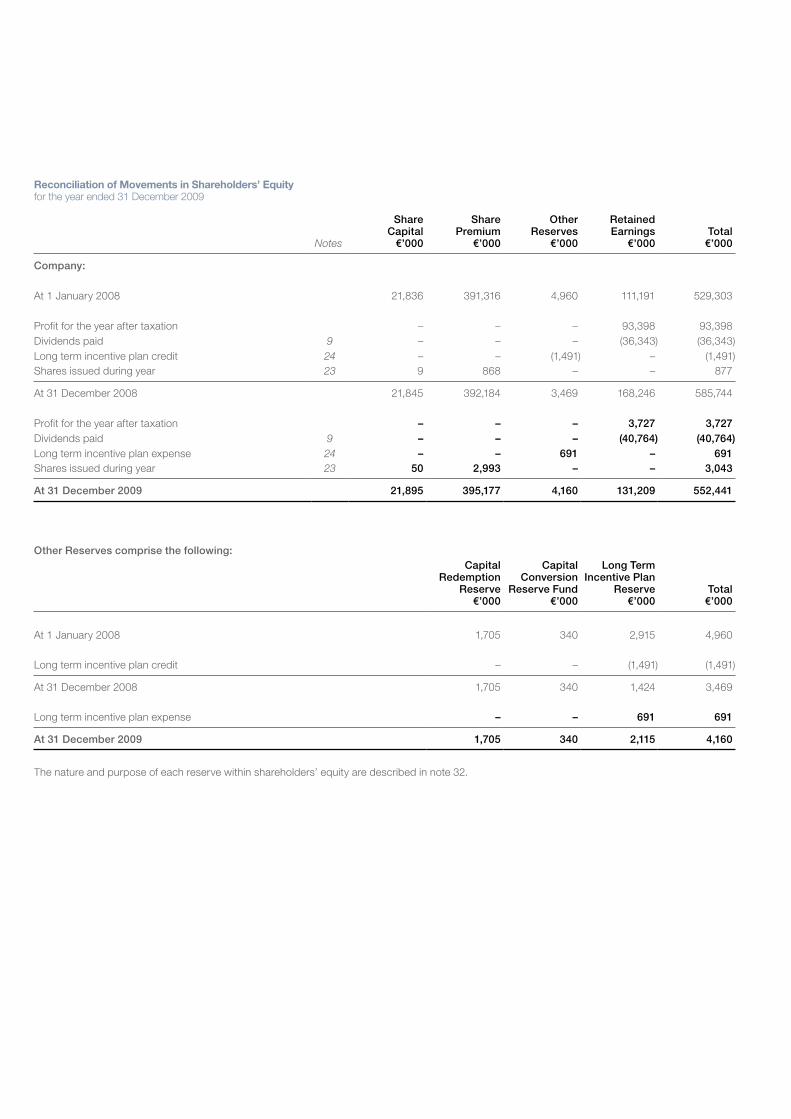
Reconciliation of Movements in Shareholders’ Equity for the year ended 31 December 2009
Notes
Share Capital
€’000
Share Premium
€’000
Other Reserves
€’000
Retained Earnings
€’000Total€’000
Company:
At 1 January 2008 21,836 391,316 4,960 111,191 529,303
Profit for the year after taxation – – – 93,398 93,398Dividends paid 9 – – – (36,343) (36,343)Long term incentive plan credit 24 – – (1,491) – (1,491)Shares issued during year 23 9 868 – – 877
At 31 December 2008 21,845 392,184 3,469 168,246 585,744
Profit for the year after taxation – – – 3,727 3,727Dividends paid 9 – – – (40,764) (40,764)Long term incentive plan expense 24 – – 691 – 691Shares issued during year 23 50 2,993 – – 3,043
At 31 December 2009 21,895 395,177 4,160 131,209 552,441
Other Reserves comprise the following: Capital
Redemption Reserve
€’000
Capital Conversion
Reserve Fund€’000
Long Term Incentive Plan
Reserve€’000
Total€’000
At 1 January 2008 1,705 340 2,915 4,960
Long term incentive plan credit – – (1,491) (1,491)
At 31 December 2008 1,705 340 1,424 3,469
Long term incentive plan expense – – 691 691
At 31 December 2009 1,705 340 2,115 4,160
The nature and purpose of each reserve within shareholders’ equity are described in note 32.
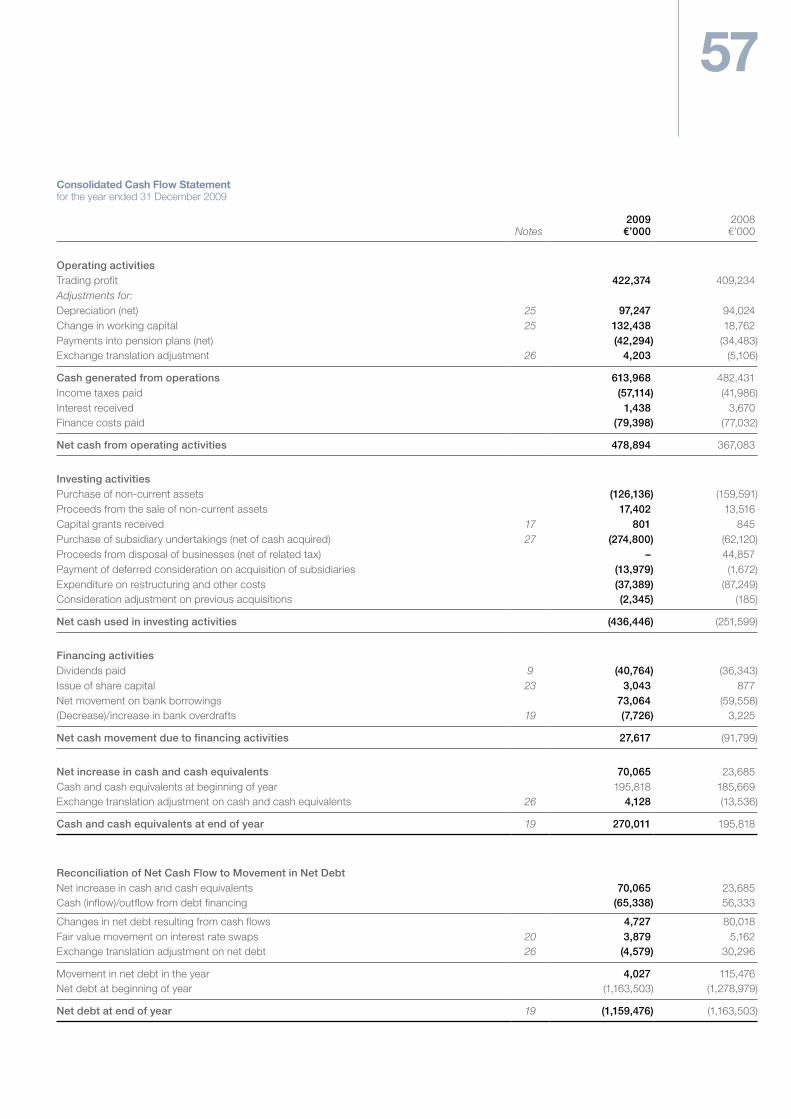
57
Consolidated Cash Flow Statement for the year ended 31 December 2009
Notes2009
€’0002008€’000
Operating activitiesTrading profit 422,374 409,234Adjustments for:Depreciation (net) 25 97,247 94,024Change in working capital 25 132,438 18,762Payments into pension plans (net) (42,294) (34,483)Exchange translation adjustment 26 4,203 (5,106)
Cash generated from operations 613,968 482,431Income taxes paid (57,114) (41,986)Interest received 1,438 3,670Finance costs paid (79,398) (77,032)
Net cash from operating activities 478,894 367,083
Investing activitiesPurchase of non-current assets (126,136) (159,591)Proceeds from the sale of non-current assets 17,402 13,516Capital grants received 17 801 845Purchase of subsidiary undertakings (net of cash acquired) 27 (274,800) (62,120)Proceeds from disposal of businesses (net of related tax) – 44,857Payment of deferred consideration on acquisition of subsidiaries (13,979) (1,672)Expenditure on restructuring and other costs (37,389) (87,249)Consideration adjustment on previous acquisitions (2,345) (185)
Net cash used in investing activities (436,446) (251,599)
Financing activitiesDividends paid 9 (40,764) (36,343)Issue of share capital 23 3,043 877Net movement on bank borrowings 73,064 (59,558)(Decrease)/increase in bank overdrafts 19 (7,726) 3,225
Net cash movement due to financing activities 27,617 (91,799)
Net increase in cash and cash equivalents 70,065 23,685Cash and cash equivalents at beginning of year 195,818 185,669Exchange translation adjustment on cash and cash equivalents 26 4,128 (13,536)
Cash and cash equivalents at end of year 19 270,011 195,818
Reconciliation of Net Cash Flow to Movement in Net DebtNet increase in cash and cash equivalents 70,065 23,685Cash (inflow)/outflow from debt financing (65,338) 56,333
Changes in net debt resulting from cash flows 4,727 80,018Fair value movement on interest rate swaps 20 3,879 5,162Exchange translation adjustment on net debt 26 (4,579) 30,296
Movement in net debt in the year 4,027 115,476Net debt at beginning of year (1,163,503) (1,278,979)
Net debt at end of year 19 (1,159,476) (1,163,503)
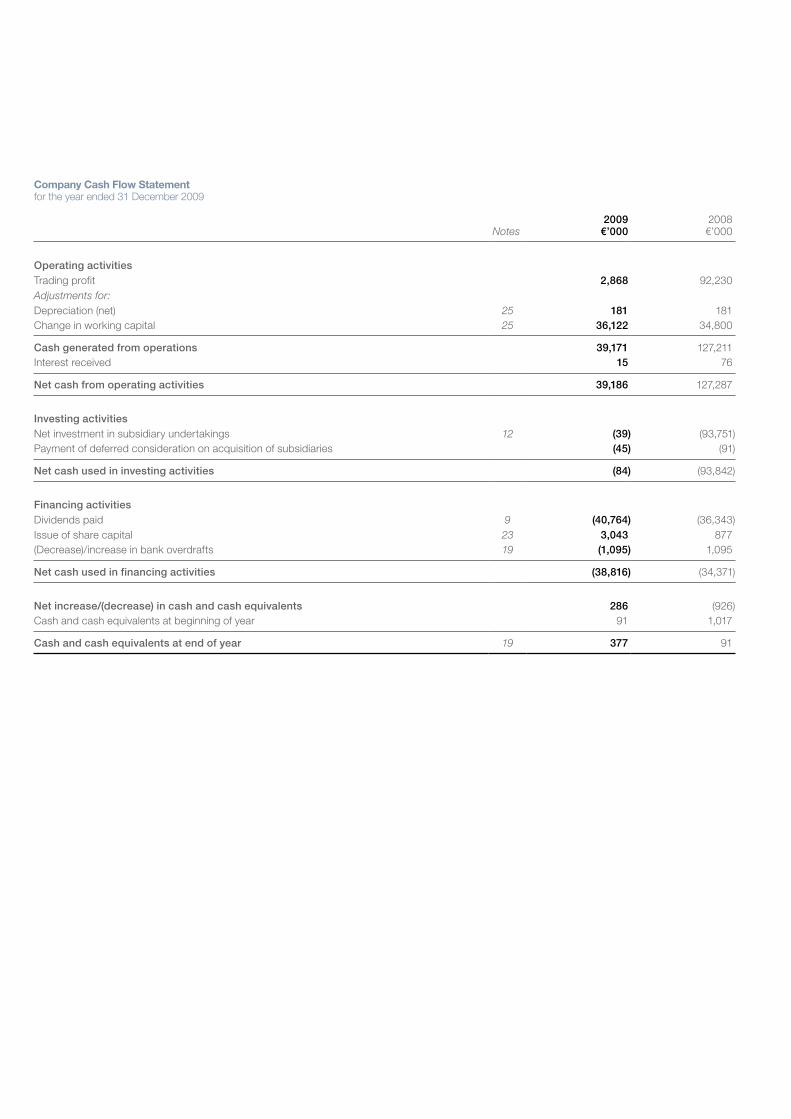
Company Cash Flow Statement for the year ended 31 December 2009
Notes2009
€’0002008€’000
Operating activitiesTrading profit 2,868 92,230Adjustments for:Depreciation (net) 25 181 181Change in working capital 25 36,122 34,800
Cash generated from operations 39,171 127,211Interest received 15 76
Net cash from operating activities 39,186 127,287
Investing activitiesNet investment in subsidiary undertakings 12 (39) (93,751)Payment of deferred consideration on acquisition of subsidiaries (45) (91)
Net cash used in investing activities (84) (93,842)
Financing activitiesDividends paid 9 (40,764) (36,343)Issue of share capital 23 3,043 877(Decrease)/increase in bank overdrafts 19 (1,095) 1,095
Net cash used in financing activities (38,816) (34,371)
Net increase/(decrease) in cash and cash equivalents 286 (926)Cash and cash equivalents at beginning of year 91 1,017
Cash and cash equivalents at end of year 19 377 91
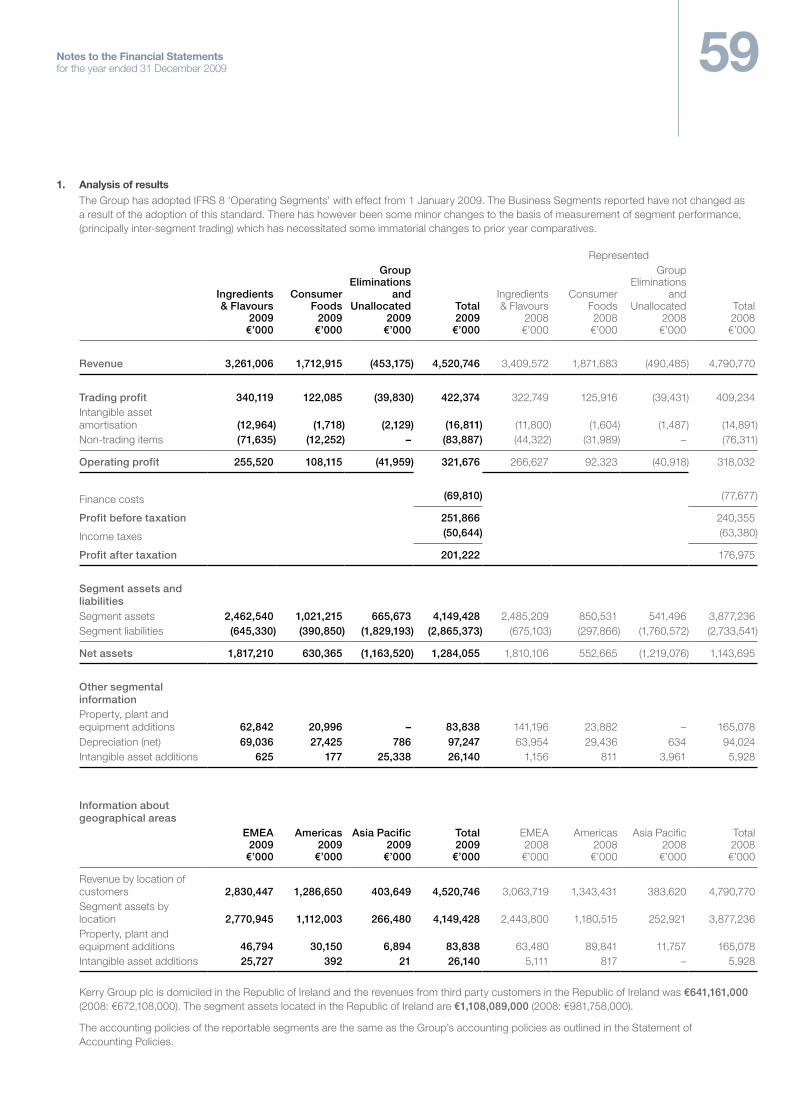
59Notes to the Financial Statements for the year ended 31 December 2009
1. Analysis of resultsThe Group has adopted IFRS 8 ‘Operating Segments’ with effect from 1 January 2009. The Business Segments reported have not changed as a result of the adoption of this standard. There has however been some minor changes to the basis of measurement of segment performance, (principally inter-segment trading) which has necessitated some immaterial changes to prior year comparatives.
Represented
Ingredients & Flavours
2009€’000
Consumer Foods
2009€’000
Group Eliminations
and Unallocated
2009€’000
Total 2009
€’000
Ingredients & Flavours
2008€’000
Consumer Foods 2008€’000
Group Eliminations
and Unallocated
2008€’000
Total 2008€’000
Revenue 3,261,006 1,712,915 (453,175) 4,520,746 3,409,572 1,871,683 (490,485) 4,790,770
Trading profit 340,119 122,085 (39,830) 422,374 322,749 125,916 (39,431) 409,234Intangible asset amortisation (12,964) (1,718) (2,129) (16,811) (11,800) (1,604) (1,487) (14,891)Non-trading items (71,635) (12,252) – (83,887) (44,322) (31,989) – (76,311)
Operating profit 255,520 108,115 (41,959) 321,676 266,627 92,323 (40,918) 318,032
Finance costs (69,810) (77,677)
Profit before taxation 251,866 240,355
Income taxes (50,644) (63,380)
Profit after taxation 201,222 176,975
Segment assets and liabilitiesSegment assets 2,462,540 1,021,215 665,673 4,149,428 2,485,209 850,531 541,496 3,877,236Segment liabilities (645,330) (390,850) (1,829,193) (2,865,373) (675,103) (297,866) (1,760,572) (2,733,541)
Net assets 1,817,210 630,365 (1,163,520) 1,284,055 1,810,106 552,665 (1,219,076) 1,143,695
Other segmental informationProperty, plant and equipment additions 62,842 20,996 – 83,838 141,196 23,882 – 165,078Depreciation (net) 69,036 27,425 786 97,247 63,954 29,436 634 94,024Intangible asset additions 625 177 25,338 26,140 1,156 811 3,961 5,928
Information about geographical areas
EMEA 2009
€’000
Americas 2009
€’000
Asia Pacific 2009
€’000
Total 2009
€’000
EMEA 2008€’000
Americas 2008€’000
Asia Pacific 2008€’000
Total 2008€’000
Revenue by location of customers 2,830,447 1,286,650 403,649 4,520,746 3,063,719 1,343,431 383,620 4,790,770Segment assets by location 2,770,945 1,112,003 266,480 4,149,428 2,443,800 1,180,515 252,921 3,877,236Property, plant and equipment additions 46,794 30,150 6,894 83,838 63,480 89,841 11,757 165,078Intangible asset additions 25,727 392 21 26,140 5,111 817 – 5,928
Kerry Group plc is domiciled in the Republic of Ireland and the revenues from third party customers in the Republic of Ireland was €641,161,000 (2008: €672,108,000). The segment assets located in the Republic of Ireland are €1,108,089,000 (2008: €981,758,000).
The accounting policies of the reportable segments are the same as the Group’s accounting policies as outlined in the Statement of Accounting Policies.
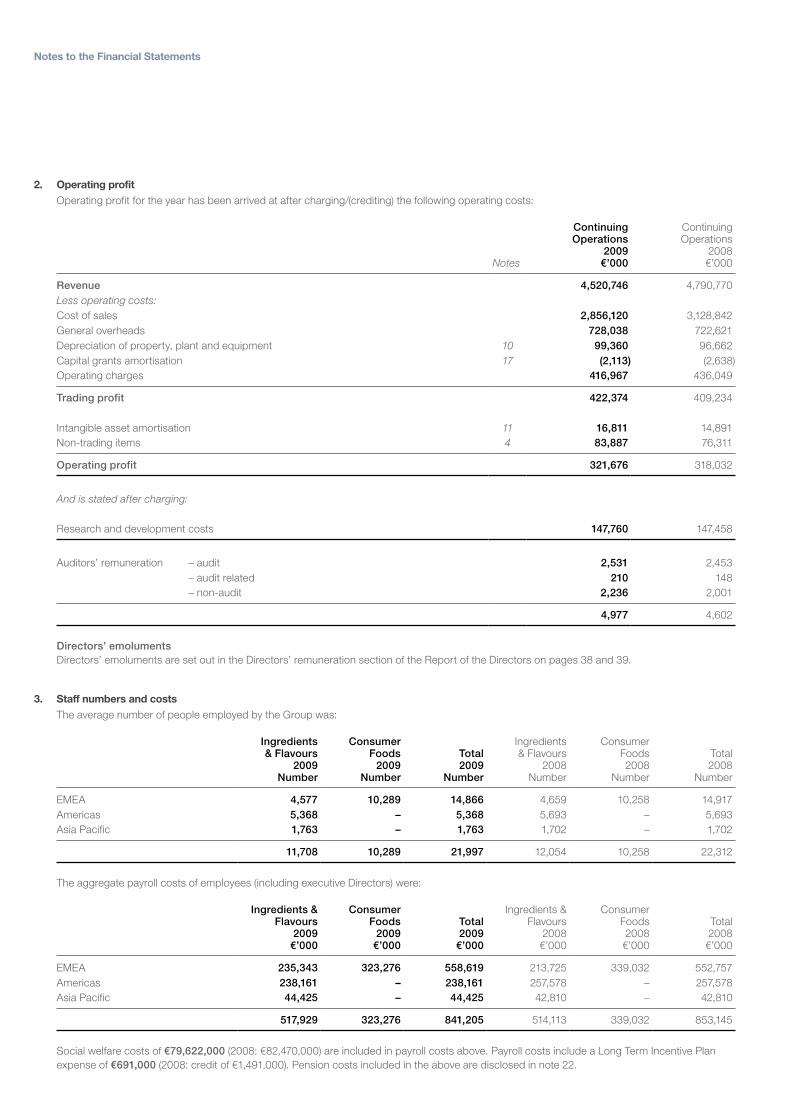
Notes to the Financial Statements
2. Operating profit Operating profit for the year has been arrived at after charging/(crediting) the following operating costs:
Notes
Continuing Operations
2009€’000
Continuing Operations
2008€’000
Revenue 4,520,746 4,790,770Less operating costs:Cost of sales 2,856,120 3,128,842General overheads 728,038 722,621Depreciation of property, plant and equipment 10 99,360 96,662Capital grants amortisation 17 (2,113) (2,638)Operating charges 416,967 436,049
Trading profit 422,374 409,234
Intangible asset amortisation 11 16,811 14,891Non-trading items 4 83,887 76,311
Operating profit 321,676 318,032
And is stated after charging:
Research and development costs 147,760 147,458
Auditors’ remuneration – audit 2,531 2,453 – audit related 210 148 – non-audit 2,236 2,001
4,977 4,602
Directors’ emoluments Directors’ emoluments are set out in the Directors’ remuneration section of the Report of the Directors on pages 38 and 39.
3. Staff numbers and costs
The average number of people employed by the Group was:
Ingredients & Flavours
2009Number
Consumer Foods
2009Number
Total 2009
Number
Ingredients & Flavours
2008Number
Consumer Foods 2008
Number
Total 2008
Number
EMEA 4,577 10,289 14,866 4,659 10,258 14,917Americas 5,368 – 5,368 5,693 – 5,693Asia Pacific 1,763 – 1,763 1,702 – 1,702
11,708 10,289 21,997 12,054 10,258 22,312
The aggregate payroll costs of employees (including executive Directors) were:
Ingredients & Flavours
2009€’000
Consumer Foods
2009€’000
Total 2009
€’000
Ingredients & Flavours
2008€’000
Consumer Foods 2008€’000
Total 2008€’000
EMEA 235,343 323,276 558,619 213,725 339,032 552,757Americas 238,161 – 238,161 257,578 – 257,578Asia Pacific 44,425 – 44,425 42,810 – 42,810
517,929 323,276 841,205 514,113 339,032 853,145
Social welfare costs of €79,622,000 (2008: €82,470,000) are included in payroll costs above. Payroll costs include a Long Term Incentive Plan expense of €691,000 (2008: credit of €1,491,000). Pension costs included in the above are disclosed in note 22.
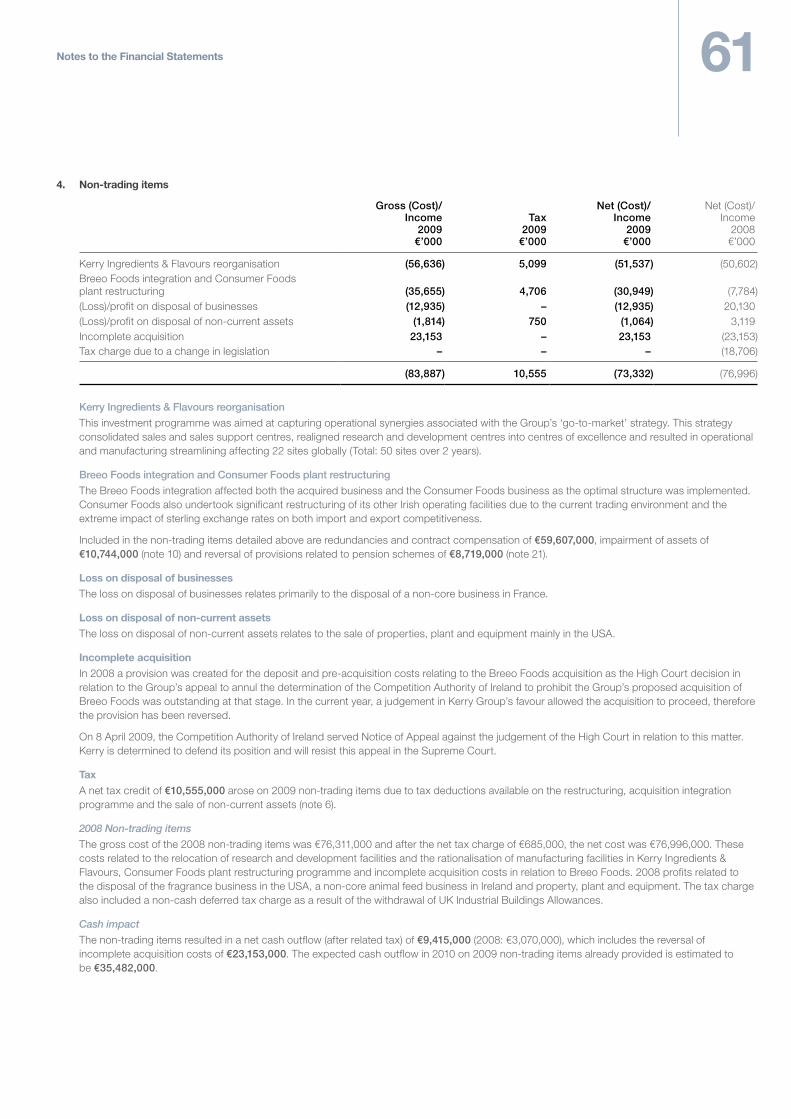
61Notes to the Financial Statements
4. Non-trading items
Gross (Cost)/Income
2009€’000
Tax 2009
€’000
Net (Cost)/ Income
2009€’000
Net (Cost)/ Income
2008€’000
Kerry Ingredients & Flavours reorganisation (56,636) 5,099 (51,537) (50,602)Breeo Foods integration and Consumer Foods plant restructuring (35,655) 4,706 (30,949) (7,784)(Loss)/profit on disposal of businesses (12,935) – (12,935) 20,130(Loss)/profit on disposal of non-current assets (1,814) 750 (1,064) 3,119Incomplete acquisition 23,153 – 23,153 (23,153)Tax charge due to a change in legislation – – – (18,706)
(83,887) 10,555 (73,332) (76,996)
Kerry Ingredients & Flavours reorganisation
This investment programme was aimed at capturing operational synergies associated with the Group’s ‘go-to-market’ strategy. This strategy consolidated sales and sales support centres, realigned research and development centres into centres of excellence and resulted in operational and manufacturing streamlining affecting 22 sites globally (Total: 50 sites over 2 years).
Breeo Foods integration and Consumer Foods plant restructuring
The Breeo Foods integration affected both the acquired business and the Consumer Foods business as the optimal structure was implemented. Consumer Foods also undertook significant restructuring of its other Irish operating facilities due to the current trading environment and the extreme impact of sterling exchange rates on both import and export competitiveness.
Included in the non-trading items detailed above are redundancies and contract compensation of €59,607,000, impairment of assets of €10,744,000 (note 10) and reversal of provisions related to pension schemes of €8,719,000 (note 21).
Loss on disposal of businessesThe loss on disposal of businesses relates primarily to the disposal of a non-core business in France.
Loss on disposal of non-current assetsThe loss on disposal of non-current assets relates to the sale of properties, plant and equipment mainly in the USA.
Incomplete acquisitionIn 2008 a provision was created for the deposit and pre-acquisition costs relating to the Breeo Foods acquisition as the High Court decision in relation to the Group’s appeal to annul the determination of the Competition Authority of Ireland to prohibit the Group’s proposed acquisition of Breeo Foods was outstanding at that stage. In the current year, a judgement in Kerry Group’s favour allowed the acquisition to proceed, therefore the provision has been reversed.
On 8 April 2009, the Competition Authority of Ireland served Notice of Appeal against the judgement of the High Court in relation to this matter. Kerry is determined to defend its position and will resist this appeal in the Supreme Court.
TaxA net tax credit of €10,555,000 arose on 2009 non-trading items due to tax deductions available on the restructuring, acquisition integration programme and the sale of non-current assets (note 6).
2008 Non-trading items
The gross cost of the 2008 non-trading items was €76,311,000 and after the net tax charge of €685,000, the net cost was €76,996,000. These costs related to the relocation of research and development facilities and the rationalisation of manufacturing facilities in Kerry Ingredients & Flavours, Consumer Foods plant restructuring programme and incomplete acquisition costs in relation to Breeo Foods. 2008 profits related to the disposal of the fragrance business in the USA, a non-core animal feed business in Ireland and property, plant and equipment. The tax charge also included a non-cash deferred tax charge as a result of the withdrawal of UK Industrial Buildings Allowances.
Cash impact
The non-trading items resulted in a net cash outflow (after related tax) of €9,415,000 (2008: €3,070,000), which includes the reversal of incomplete acquisition costs of €23,153,000. The expected cash outflow in 2010 on 2009 non-trading items already provided is estimated to be €35,482,000.
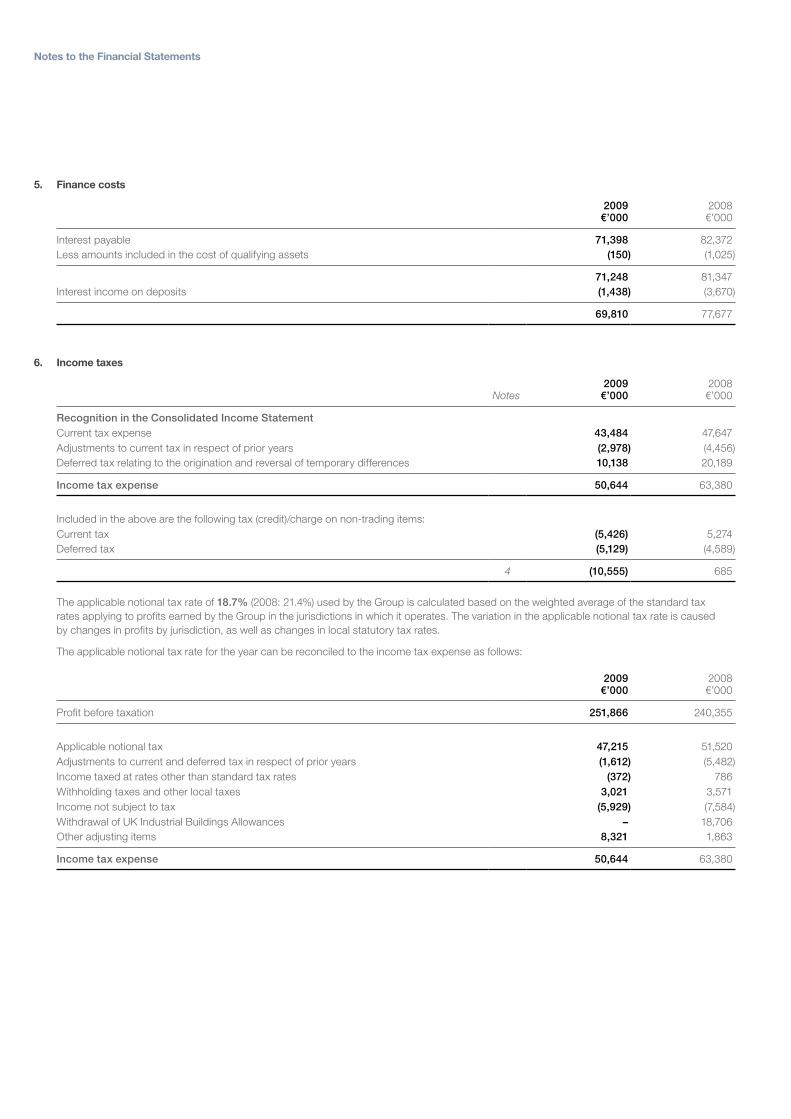
Notes to the Financial Statements
5. Finance costs
2009€’000
2008€’000
Interest payable 71,398 82,372Less amounts included in the cost of qualifying assets (150) (1,025)
71,248 81,347Interest income on deposits (1,438) (3,670)
69,810 77,677
6. Income taxes
Notes2009
€’0002008€’000
Recognition in the Consolidated Income StatementCurrent tax expense 43,484 47,647Adjustments to current tax in respect of prior years (2,978) (4,456)Deferred tax relating to the origination and reversal of temporary differences 10,138 20,189
Income tax expense 50,644 63,380
Included in the above are the following tax (credit)/charge on non-trading items:Current tax (5,426) 5,274Deferred tax (5,129) (4,589)
4 (10,555) 685
The applicable notional tax rate of 18.7% (2008: 21.4%) used by the Group is calculated based on the weighted average of the standard tax rates applying to profits earned by the Group in the jurisdictions in which it operates. The variation in the applicable notional tax rate is caused by changes in profits by jurisdiction, as well as changes in local statutory tax rates.
The applicable notional tax rate for the year can be reconciled to the income tax expense as follows:
2009€’000
2008€’000
Profit before taxation 251,866 240,355
Applicable notional tax 47,215 51,520Adjustments to current and deferred tax in respect of prior years (1,612) (5,482)Income taxed at rates other than standard tax rates (372) 786Withholding taxes and other local taxes 3,021 3,571Income not subject to tax (5,929) (7,584)Withdrawal of UK Industrial Buildings Allowances – 18,706Other adjusting items 8,321 1,863
Income tax expense 50,644 63,380
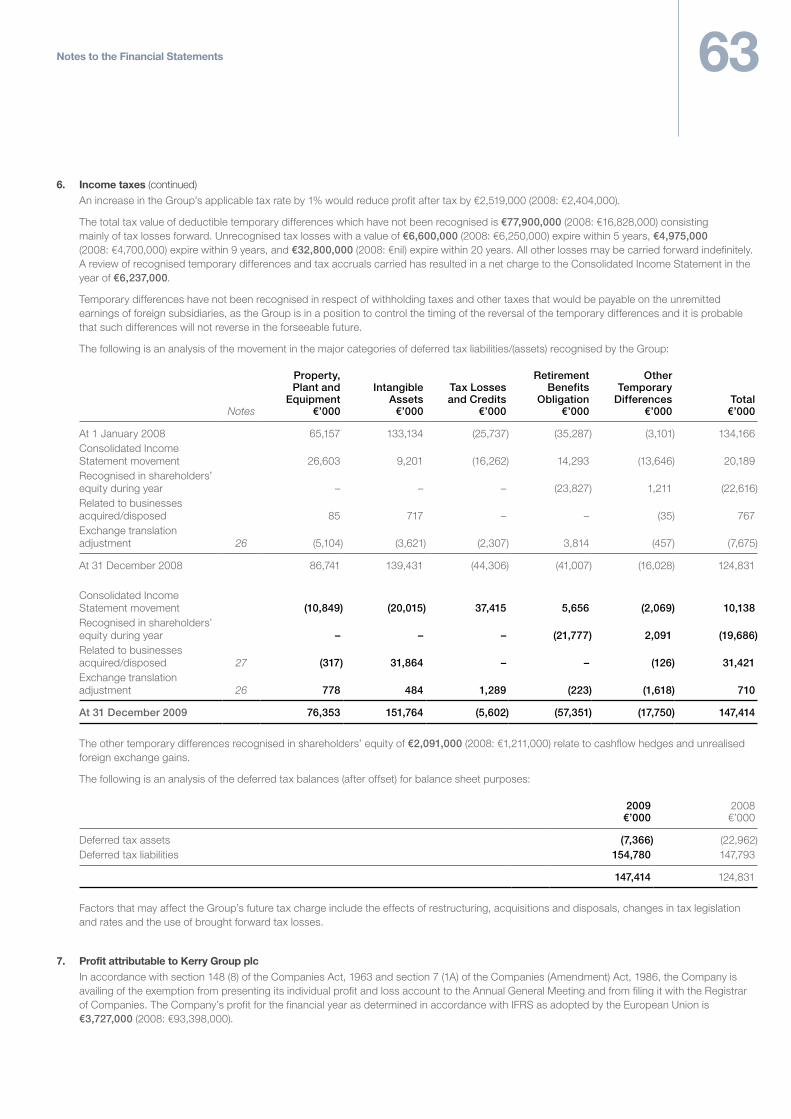
63Notes to the Financial Statements
6. Income taxes (continued)
An increase in the Group’s applicable tax rate by 1% would reduce profit after tax by €2,519,000 (2008: €2,404,000).
The total tax value of deductible temporary differences which have not been recognised is €77,900,000 (2008: €16,828,000) consisting mainly of tax losses forward. Unrecognised tax losses with a value of €6,600,000 (2008: €6,250,000) expire within 5 years, €4,975,000 (2008: €4,700,000) expire within 9 years, and €32,800,000 (2008: €nil) expire within 20 years. All other losses may be carried forward indefinitely. A review of recognised temporary differences and tax accruals carried has resulted in a net charge to the Consolidated Income Statement in the year of €6,237,000.
Temporary differences have not been recognised in respect of withholding taxes and other taxes that would be payable on the unremitted earnings of foreign subsidiaries, as the Group is in a position to control the timing of the reversal of the temporary differences and it is probable that such differences will not reverse in the forseeable future.
The following is an analysis of the movement in the major categories of deferred tax liabilities/(assets) recognised by the Group:
Notes
Property, Plant and
Equipment€’000
Intangible Assets
€’000
Tax Losses and Credits
€’000
Retirement Benefits
Obligation€’000
Other Temporary
Differences€’000
Total €’000
At 1 January 2008 65,157 133,134 (25,737) (35,287) (3,101) 134,166Consolidated Income Statement movement 26,603 9,201 (16,262) 14,293 (13,646) 20,189Recognised in shareholders’ equity during year – – – (23,827) 1,211 (22,616)Related to businesses acquired/disposed 85 717 – – (35) 767Exchange translation adjustment 26 (5,104) (3,621) (2,307) 3,814 (457) (7,675)
At 31 December 2008 86,741 139,431 (44,306) (41,007) (16,028) 124,831
Consolidated Income Statement movement (10,849) (20,015) 37,415 5,656 (2,069) 10,138Recognised in shareholders’ equity during year – – – (21,777) 2,091 (19,686)Related to businesses acquired/disposed 27 (317) 31,864 – – (126) 31,421Exchange translation adjustment 26 778 484 1,289 (223) (1,618) 710
At 31 December 2009 76,353 151,764 (5,602) (57,351) (17,750) 147,414
The other temporary differences recognised in shareholders’ equity of €2,091,000 (2008: €1,211,000) relate to cashflow hedges and unrealised foreign exchange gains.
The following is an analysis of the deferred tax balances (after offset) for balance sheet purposes:
2009€’000
2008€’000
Deferred tax assets (7,366) (22,962)Deferred tax liabilities 154,780 147,793
147,414 124,831
Factors that may affect the Group’s future tax charge include the effects of restructuring, acquisitions and disposals, changes in tax legislation and rates and the use of brought forward tax losses.
7. Profit attributable to Kerry Group plc
In accordance with section 148 (8) of the Companies Act, 1963 and section 7 (1A) of the Companies (Amendment) Act, 1986, the Company is availing of the exemption from presenting its individual profit and loss account to the Annual General Meeting and from filing it with the Registrar of Companies. The Company’s profit for the financial year as determined in accordance with IFRS as adopted by the European Union is €3,727,000 (2008: €93,398,000).
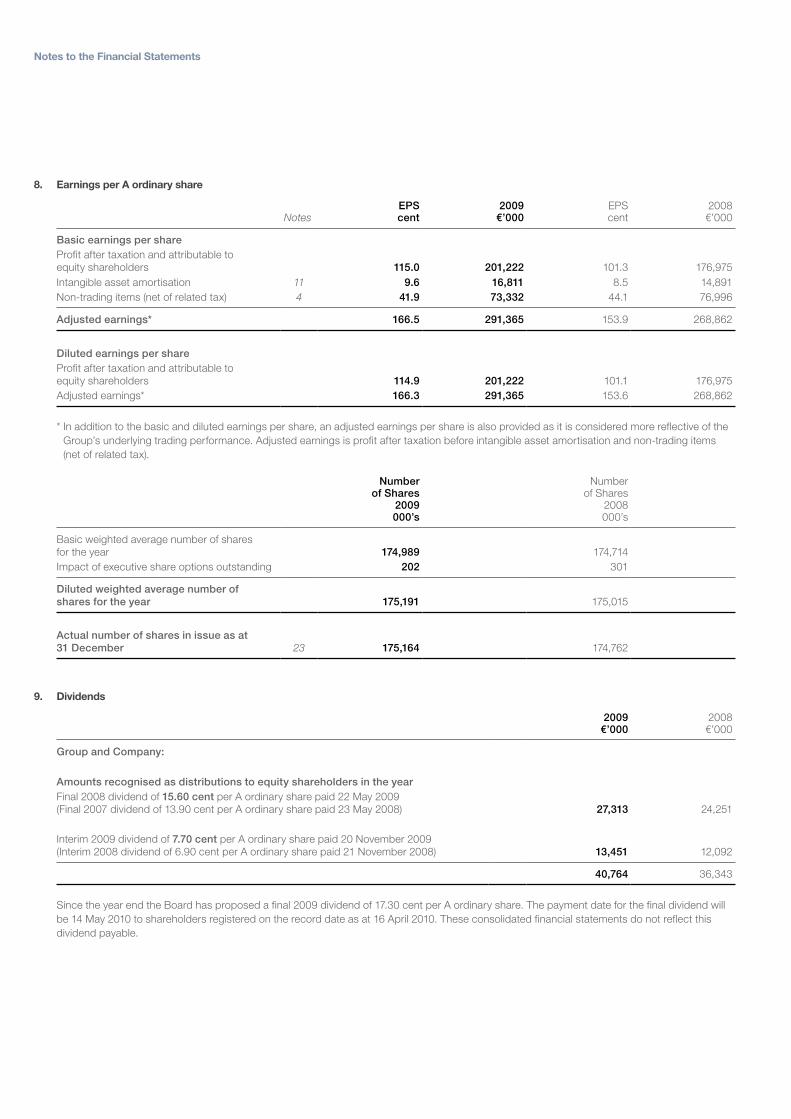
Notes to the Financial Statements
8. Earnings per A ordinary share
NotesEPScent
2009€’000
EPScent
2008€’000
Basic earnings per shareProfit after taxation and attributable to equity shareholders 115.0 201,222 101.3 176,975Intangible asset amortisation 11 9.6 16,811 8.5 14,891Non-trading items (net of related tax) 4 41.9 73,332 44.1 76,996
Adjusted earnings* 166.5 291,365 153.9 268,862
Diluted earnings per shareProfit after taxation and attributable to equity shareholders 114.9 201,222 101.1 176,975Adjusted earnings* 166.3 291,365 153.6 268,862
* In addition to the basic and diluted earnings per share, an adjusted earnings per share is also provided as it is considered more reflective of the Group’s underlying trading performance. Adjusted earnings is profit after taxation before intangible asset amortisation and non-trading items (net of related tax).
Number of Shares
2009000’s
Number of Shares
2008000’s
Basic weighted average number of shares for the year 174,989 174,714Impact of executive share options outstanding 202 301
Diluted weighted average number of shares for the year 175,191 175,015
Actual number of shares in issue as at 31 December 23 175,164 174,762
9. Dividends
2009€’000
2008€’000
Group and Company:
Amounts recognised as distributions to equity shareholders in the yearFinal 2008 dividend of 15.60 cent per A ordinary share paid 22 May 2009(Final 2007 dividend of 13.90 cent per A ordinary share paid 23 May 2008) 27,313 24,251
Interim 2009 dividend of 7.70 cent per A ordinary share paid 20 November 2009(Interim 2008 dividend of 6.90 cent per A ordinary share paid 21 November 2008) 13,451 12,092
40,764 36,343
Since the year end the Board has proposed a final 2009 dividend of 17.30 cent per A ordinary share. The payment date for the final dividend will be 14 May 2010 to shareholders registered on the record date as at 16 April 2010. These consolidated financial statements do not reflect this dividend payable.
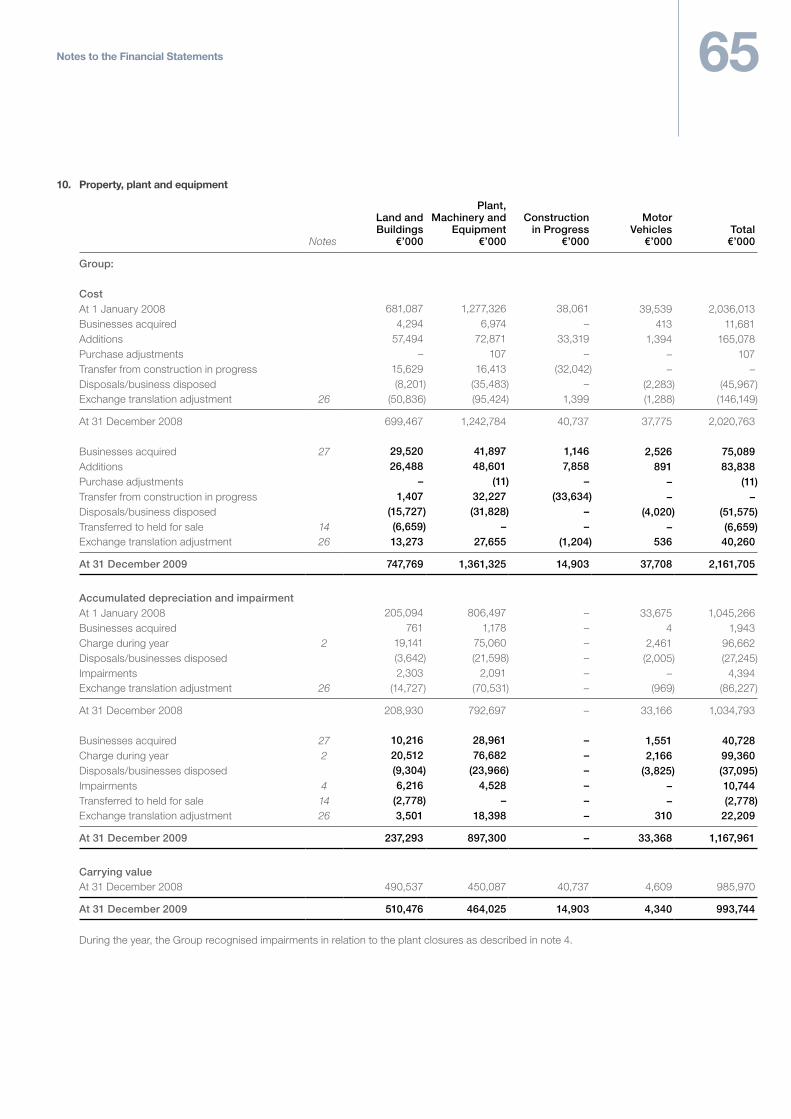
65Notes to the Financial Statements
10. Property, plant and equipment
Notes
Land and Buildings
€’000
Plant, Machinery and
Equipment€’000
Construction in Progress
€’000
Motor Vehicles
€’000Total€’000
Group:
CostAt 1 January 2008 681,087 1,277,326 38,061 39,539 2,036,013Businesses acquired 4,294 6,974 – 413 11,681Additions 57,494 72,871 33,319 1,394 165,078Purchase adjustments – 107 – – 107Transfer from construction in progress 15,629 16,413 (32,042) – –Disposals/business disposed (8,201) (35,483) – (2,283) (45,967)Exchange translation adjustment 26 (50,836) (95,424) 1,399 (1,288) (146,149)
At 31 December 2008 699,467 1,242,784 40,737 37,775 2,020,763
Businesses acquired 27 29,520 41,897 1,146 2,526 75,089Additions 26,488 48,601 7,858 891 83,838Purchase adjustments – (11) – – (11)Transfer from construction in progress 1,407 32,227 (33,634) – –Disposals/business disposed (15,727) (31,828) – (4,020) (51,575)Transferred to held for sale 14 (6,659) – – – (6,659)Exchange translation adjustment 26 13,273 27,655 (1,204) 536 40,260
At 31 December 2009 747,769 1,361,325 14,903 37,708 2,161,705
Accumulated depreciation and impairmentAt 1 January 2008 205,094 806,497 – 33,675 1,045,266Businesses acquired 761 1,178 – 4 1,943Charge during year 2 19,141 75,060 – 2,461 96,662Disposals/businesses disposed (3,642) (21,598) – (2,005) (27,245)Impairments 2,303 2,091 – – 4,394Exchange translation adjustment 26 (14,727) (70,531) – (969) (86,227)
At 31 December 2008 208,930 792,697 – 33,166 1,034,793
Businesses acquired 27 10,216 28,961 – 1,551 40,728Charge during year 2 20,512 76,682 – 2,166 99,360Disposals/businesses disposed (9,304) (23,966) – (3,825) (37,095)Impairments 4 6,216 4,528 – – 10,744Transferred to held for sale 14 (2,778) – – – (2,778)Exchange translation adjustment 26 3,501 18,398 – 310 22,209
At 31 December 2009 237,293 897,300 – 33,368 1,167,961
Carrying valueAt 31 December 2008 490,537 450,087 40,737 4,609 985,970
At 31 December 2009 510,476 464,025 14,903 4,340 993,744
During the year, the Group recognised impairments in relation to the plant closures as described in note 4.
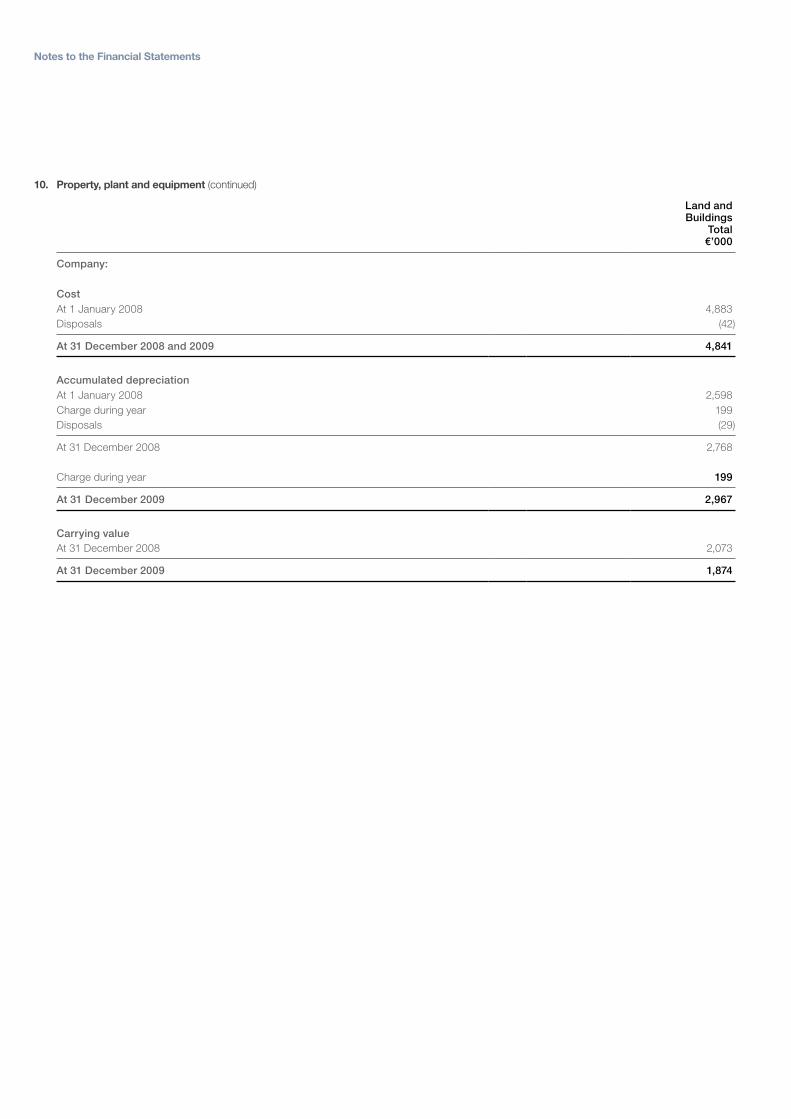
Notes to the Financial Statements
10. Property, plant and equipment (continued)
Land and Buildings
Total€’000
Company:
CostAt 1 January 2008 4,883Disposals (42)
At 31 December 2008 and 2009 4,841
Accumulated depreciationAt 1 January 2008 2,598Charge during year 199Disposals (29)
At 31 December 2008 2,768
Charge during year 199
At 31 December 2009 2,967
Carrying valueAt 31 December 2008 2,073
At 31 December 2009 1,874
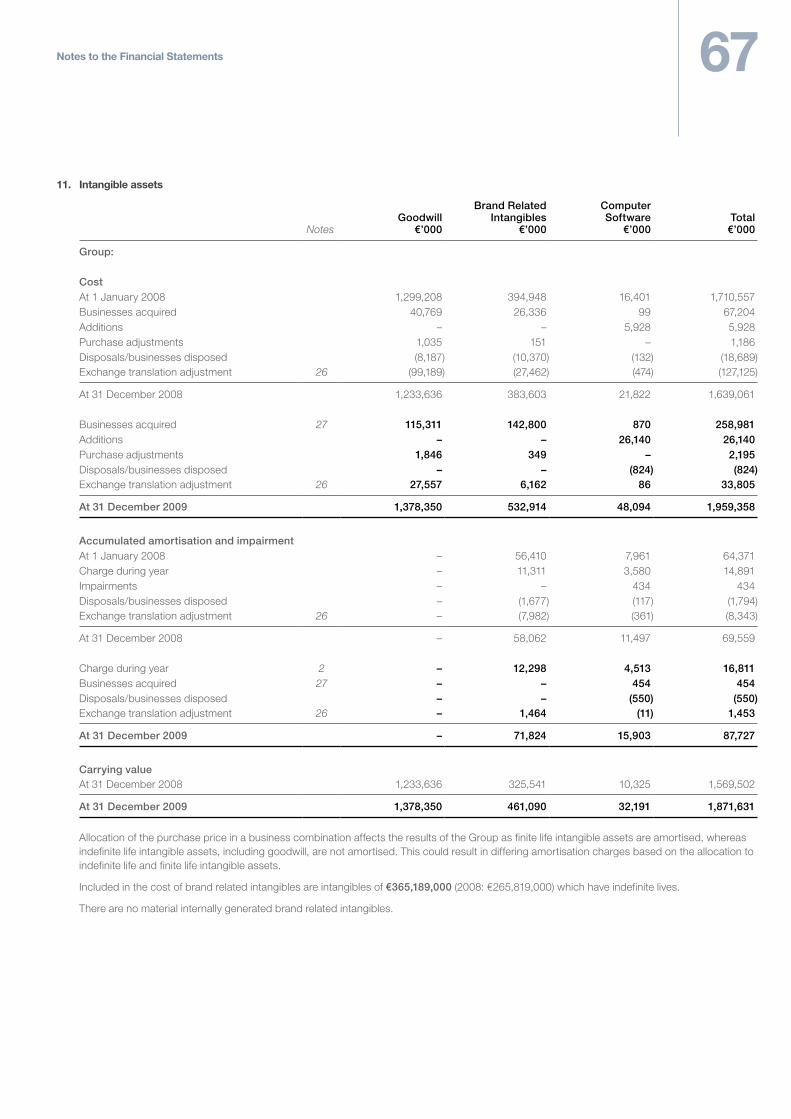
67Notes to the Financial Statements
11. Intangible assets
NotesGoodwill
€’000
Brand Related Intangibles
€’000
Computer Software
€’000Total€’000
Group:
Cost At 1 January 2008 1,299,208 394,948 16,401 1,710,557Businesses acquired 40,769 26,336 99 67,204Additions – – 5,928 5,928Purchase adjustments 1,035 151 – 1,186Disposals/businesses disposed (8,187) (10,370) (132) (18,689)Exchange translation adjustment 26 (99,189) (27,462) (474) (127,125)
At 31 December 2008 1,233,636 383,603 21,822 1,639,061
Businesses acquired 27 115,311 142,800 870 258,981Additions – – 26,140 26,140Purchase adjustments 1,846 349 – 2,195Disposals/businesses disposed – – (824) (824)Exchange translation adjustment 26 27,557 6,162 86 33,805
At 31 December 2009 1,378,350 532,914 48,094 1,959,358
Accumulated amortisation and impairmentAt 1 January 2008 – 56,410 7,961 64,371Charge during year – 11,311 3,580 14,891Impairments – – 434 434Disposals/businesses disposed – (1,677) (117) (1,794)Exchange translation adjustment 26 – (7,982) (361) (8,343)
At 31 December 2008 – 58,062 11,497 69,559
Charge during year 2 – 12,298 4,513 16,811Businesses acquired 27 – – 454 454Disposals/businesses disposed – – (550) (550)Exchange translation adjustment 26 – 1,464 (11) 1,453
At 31 December 2009 – 71,824 15,903 87,727
Carrying valueAt 31 December 2008 1,233,636 325,541 10,325 1,569,502
At 31 December 2009 1,378,350 461,090 32,191 1,871,631
Allocation of the purchase price in a business combination affects the results of the Group as finite life intangible assets are amortised, whereas indefinite life intangible assets, including goodwill, are not amortised. This could result in differing amortisation charges based on the allocation to indefinite life and finite life intangible assets.
Included in the cost of brand related intangibles are intangibles of €365,189,000 (2008: €265,819,000) which have indefinite lives.
There are no material internally generated brand related intangibles.
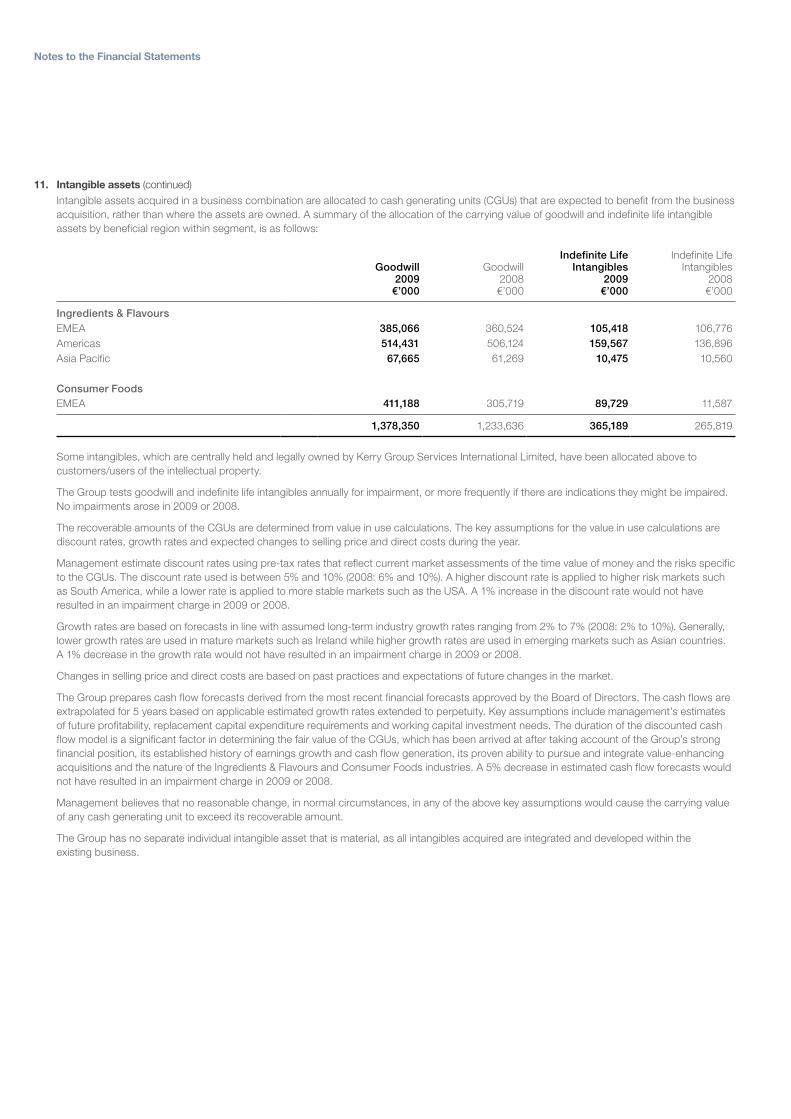
Notes to the Financial Statements
11. Intangible assets (continued)
Intangible assets acquired in a business combination are allocated to cash generating units (CGUs) that are expected to benefit from the business acquisition, rather than where the assets are owned. A summary of the allocation of the carrying value of goodwill and indefinite life intangible assets by beneficial region within segment, is as follows:
Goodwill 2009
€’000
Goodwill 2008€’000
Indefinite Life Intangibles
2009€’000
Indefinite Life Intangibles
2008€’000
Ingredients & FlavoursEMEA 385,066 360,524 105,418 106,776 Americas 514,431 506,124 159,567 136,896 Asia Pacific 67,665 61,269 10,475 10,560
Consumer FoodsEMEA 411,188 305,719 89,729 11,587
1,378,350 1,233,636 365,189 265,819
Some intangibles, which are centrally held and legally owned by Kerry Group Services International Limited, have been allocated above to customers/users of the intellectual property.
The Group tests goodwill and indefinite life intangibles annually for impairment, or more frequently if there are indications they might be impaired. No impairments arose in 2009 or 2008.
The recoverable amounts of the CGUs are determined from value in use calculations. The key assumptions for the value in use calculations are discount rates, growth rates and expected changes to selling price and direct costs during the year.
Management estimate discount rates using pre-tax rates that reflect current market assessments of the time value of money and the risks specific to the CGUs. The discount rate used is between 5% and 10% (2008: 6% and 10%). A higher discount rate is applied to higher risk markets such as South America, while a lower rate is applied to more stable markets such as the USA. A 1% increase in the discount rate would not have resulted in an impairment charge in 2009 or 2008.
Growth rates are based on forecasts in line with assumed long-term industry growth rates ranging from 2% to 7% (2008: 2% to 10%). Generally, lower growth rates are used in mature markets such as Ireland while higher growth rates are used in emerging markets such as Asian countries. A 1% decrease in the growth rate would not have resulted in an impairment charge in 2009 or 2008.
Changes in selling price and direct costs are based on past practices and expectations of future changes in the market.
The Group prepares cash flow forecasts derived from the most recent financial forecasts approved by the Board of Directors. The cash flows are extrapolated for 5 years based on applicable estimated growth rates extended to perpetuity. Key assumptions include management’s estimates of future profitability, replacement capital expenditure requirements and working capital investment needs. The duration of the discounted cash flow model is a significant factor in determining the fair value of the CGUs, which has been arrived at after taking account of the Group’s strong financial position, its established history of earnings growth and cash flow generation, its proven ability to pursue and integrate value-enhancing acquisitions and the nature of the Ingredients & Flavours and Consumer Foods industries. A 5% decrease in estimated cash flow forecasts would not have resulted in an impairment charge in 2009 or 2008.
Management believes that no reasonable change, in normal circumstances, in any of the above key assumptions would cause the carrying value of any cash generating unit to exceed its recoverable amount.
The Group has no separate individual intangible asset that is material, as all intangibles acquired are integrated and developed within the existing business.
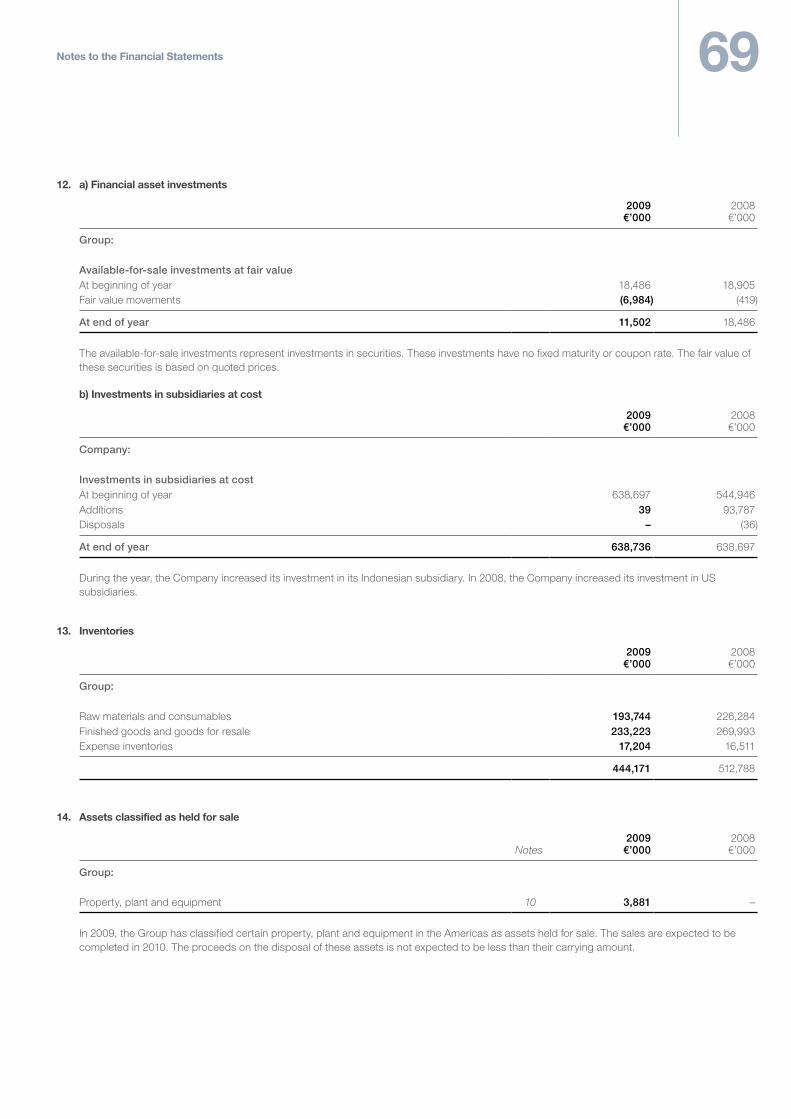
69Notes to the Financial Statements
12. a) Financial asset investments
2009€’000
2008€’000
Group:
Available-for-sale investments at fair valueAt beginning of year 18,486 18,905Fair value movements (6,984) (419)
At end of year 11,502 18,486
The available-for-sale investments represent investments in securities. These investments have no fixed maturity or coupon rate. The fair value of these securities is based on quoted prices.
b) Investments in subsidiaries at cost
2009€’000
2008€’000
Company:
Investments in subsidiaries at costAt beginning of year 638,697 544,946Additions 39 93,787Disposals – (36)
At end of year 638,736 638,697
During the year, the Company increased its investment in its Indonesian subsidiary. In 2008, the Company increased its investment in US subsidiaries.
13. Inventories
2009€’000
2008€’000
Group:
Raw materials and consumables 193,744 226,284Finished goods and goods for resale 233,223 269,993Expense inventories 17,204 16,511
444,171 512,788
14. Assets classified as held for sale
Notes2009
€’0002008€’000
Group:
Property, plant and equipment 10 3,881 –
In 2009, the Group has classified certain property, plant and equipment in the Americas as assets held for sale. The sales are expected to be completed in 2010. The proceeds on the disposal of these assets is not expected to be less than their carrying amount.
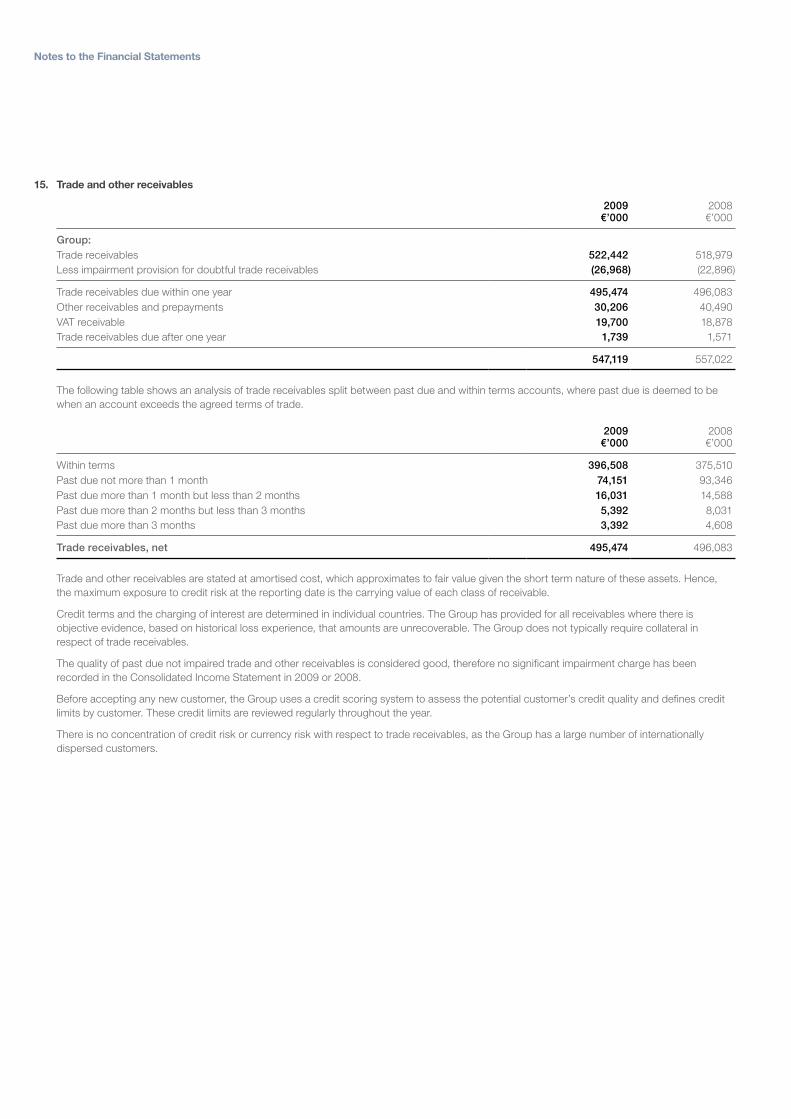
Notes to the Financial Statements
15. Trade and other receivables
2009€’000
2008€’000
Group:Trade receivables 522,442 518,979Less impairment provision for doubtful trade receivables (26,968) (22,896)
Trade receivables due within one year 495,474 496,083Other receivables and prepayments 30,206 40,490VAT receivable 19,700 18,878Trade receivables due after one year 1,739 1,571
547,119 557,022
The following table shows an analysis of trade receivables split between past due and within terms accounts, where past due is deemed to be when an account exceeds the agreed terms of trade.
2009€’000
2008€’000
Within terms 396,508 375,510Past due not more than 1 month 74,151 93,346Past due more than 1 month but less than 2 months 16,031 14,588Past due more than 2 months but less than 3 months 5,392 8,031Past due more than 3 months 3,392 4,608
Trade receivables, net 495,474 496,083
Trade and other receivables are stated at amortised cost, which approximates to fair value given the short term nature of these assets. Hence, the maximum exposure to credit risk at the reporting date is the carrying value of each class of receivable.
Credit terms and the charging of interest are determined in individual countries. The Group has provided for all receivables where there is objective evidence, based on historical loss experience, that amounts are unrecoverable. The Group does not typically require collateral in respect of trade receivables.
The quality of past due not impaired trade and other receivables is considered good, therefore no significant impairment charge has been recorded in the Consolidated Income Statement in 2009 or 2008.
Before accepting any new customer, the Group uses a credit scoring system to assess the potential customer’s credit quality and defines credit limits by customer. These credit limits are reviewed regularly throughout the year.
There is no concentration of credit risk or currency risk with respect to trade receivables, as the Group has a large number of internationally dispersed customers.
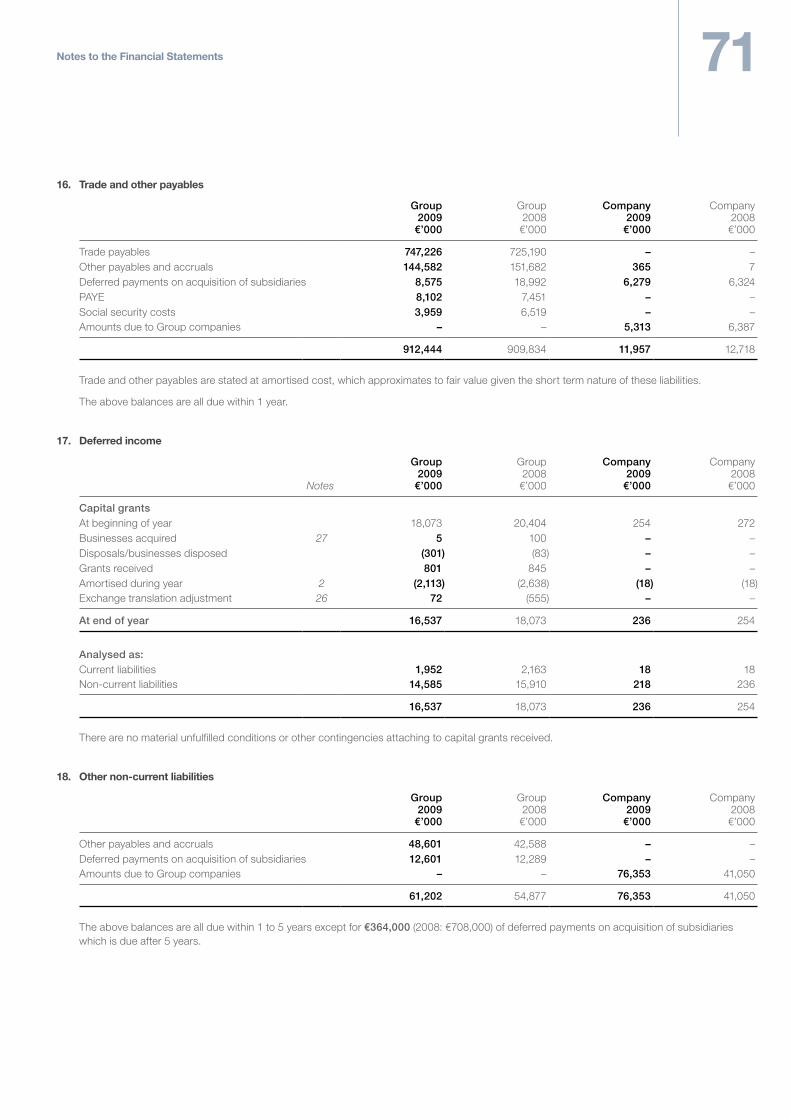
71Notes to the Financial Statements
16. Trade and other payables
Group 2009
€’000
Group 2008€’000
Company 2009
€’000
Company 2008€’000
Trade payables 747,226 725,190 – –Other payables and accruals 144,582 151,682 365 7Deferred payments on acquisition of subsidiaries 8,575 18,992 6,279 6,324PAYE 8,102 7,451 – –Social security costs 3,959 6,519 – –Amounts due to Group companies – – 5,313 6,387
912,444 909,834 11,957 12,718
Trade and other payables are stated at amortised cost, which approximates to fair value given the short term nature of these liabilities.
The above balances are all due within 1 year.
17. Deferred income
Notes
Group 2009
€’000
Group 2008€’000
Company 2009
€’000
Company 2008€’000
Capital grantsAt beginning of year 18,073 20,404 254 272Businesses acquired 27 5 100 – –Disposals/businesses disposed (301) (83) – –Grants received 801 845 – –Amortised during year 2 (2,113) (2,638) (18) (18)Exchange translation adjustment 26 72 (555) – –
At end of year 16,537 18,073 236 254
Analysed as:Current liabilities 1,952 2,163 18 18Non-current liabilities 14,585 15,910 218 236
16,537 18,073 236 254
There are no material unfulfilled conditions or other contingencies attaching to capital grants received.
18. Other non-current liabilities
Group 2009
€’000
Group 2008€’000
Company 2009
€’000
Company 2008€’000
Other payables and accruals 48,601 42,588 – –Deferred payments on acquisition of subsidiaries 12,601 12,289 – –Amounts due to Group companies – – 76,353 41,050
61,202 54,877 76,353 41,050
The above balances are all due within 1 to 5 years except for €364,000 (2008: €708,000) of deferred payments on acquisition of subsidiaries which is due after 5 years.
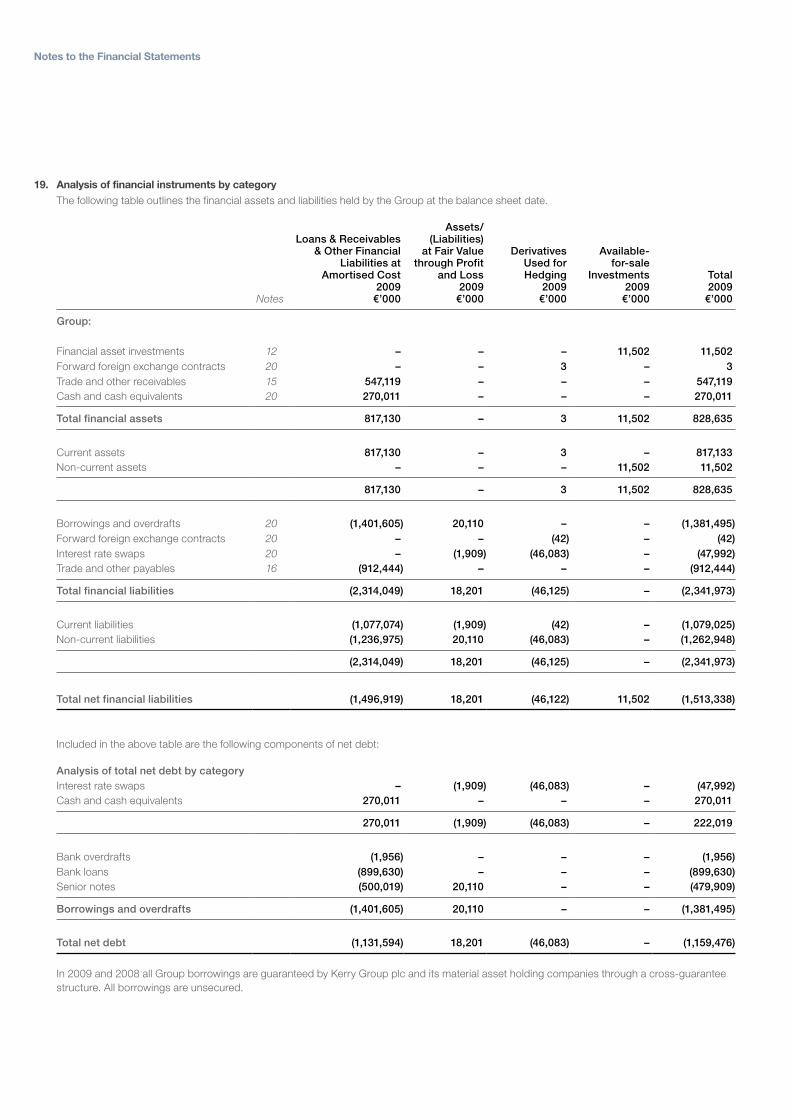
Notes to the Financial Statements
19. Analysis of financial instruments by categoryThe following table outlines the financial assets and liabilities held by the Group at the balance sheet date.
Notes
Loans & Receivables & Other Financial
Liabilities at Amortised Cost
2009€’000
Assets/(Liabilities)
at Fair Value through Profit
and Loss 2009
€’000
Derivatives Used for Hedging
2009€’000
Available-for-sale
Investments 2009
€’000
Total 2009
€’000
Group:
Financial asset investments 12 – – – 11,502 11,502Forward foreign exchange contracts 20 – – 3 – 3Trade and other receivables 15 547,119 – – – 547,119Cash and cash equivalents 20 270,011 – – – 270,011
Total financial assets 817,130 – 3 11,502 828,635
Current assets 817,130 – 3 – 817,133Non-current assets – – – 11,502 11,502
817,130 – 3 11,502 828,635
Borrowings and overdrafts 20 (1,401,605) 20,110 – – (1,381,495)Forward foreign exchange contracts 20 – – (42) – (42)Interest rate swaps 20 – (1,909) (46,083) – (47,992)Trade and other payables 16 (912,444) – – – (912,444)
Total financial liabilities (2,314,049) 18,201 (46,125) – (2,341,973)
Current liabilities (1,077,074) (1,909) (42) – (1,079,025)Non-current liabilities (1,236,975) 20,110 (46,083) – (1,262,948)
(2,314,049) 18,201 (46,125) – (2,341,973)
Total net financial liabilities (1,496,919) 18,201 (46,122) 11,502 (1,513,338)
Included in the above table are the following components of net debt:
Analysis of total net debt by categoryInterest rate swaps – (1,909) (46,083) – (47,992)Cash and cash equivalents 270,011 – – – 270,011
270,011 (1,909) (46,083) – 222,019
Bank overdrafts (1,956) – – – (1,956)Bank loans (899,630) – – – (899,630)Senior notes (500,019) 20,110 – – (479,909)
Borrowings and overdrafts (1,401,605) 20,110 – – (1,381,495)
Total net debt (1,131,594) 18,201 (46,083) – (1,159,476)
In 2009 and 2008 all Group borrowings are guaranteed by Kerry Group plc and its material asset holding companies through a cross-guarantee structure. All borrowings are unsecured.
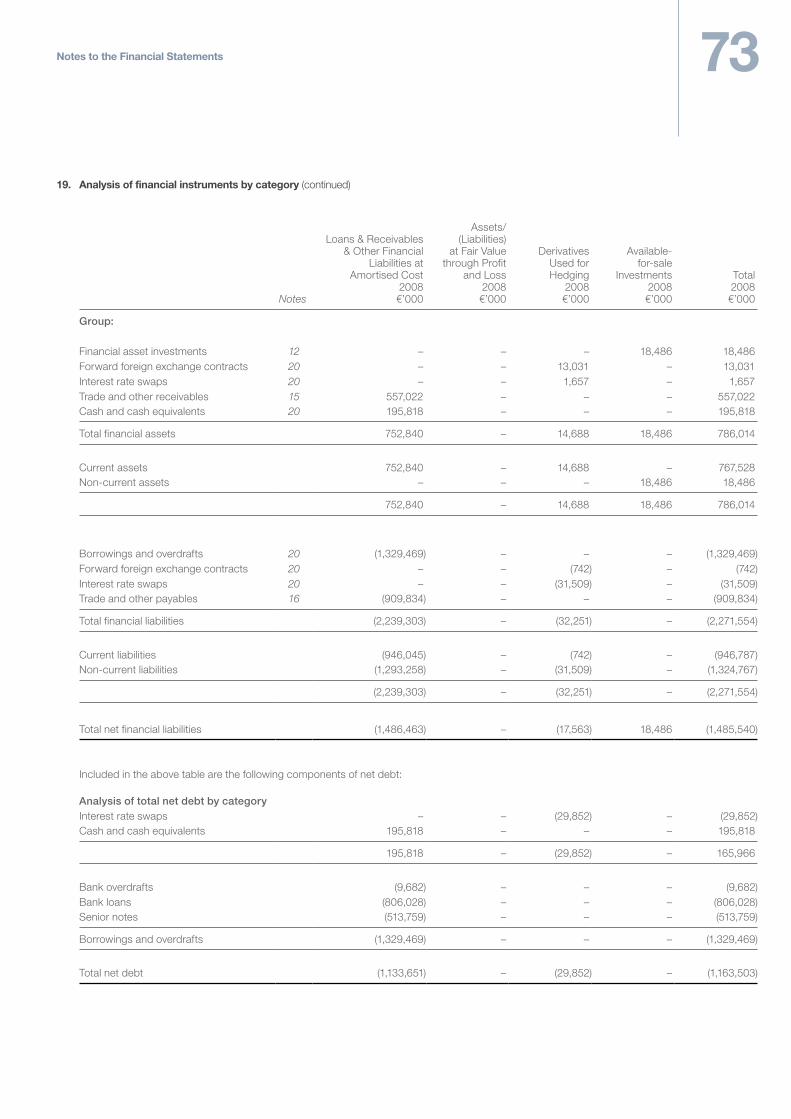
73Notes to the Financial Statements
19. Analysis of financial instruments by category (continued)
Notes
Loans & Receivables & Other Financial
Liabilities at Amortised Cost
2008€’000
Assets/(Liabilities)
at Fair Value through Profit
and Loss2008€’000
Derivatives Used for Hedging
2008€’000
Available- for-sale
Investments2008€’000
Total2008€’000
Group:
Financial asset investments 12 – – – 18,486 18,486Forward foreign exchange contracts 20 – – 13,031 – 13,031Interest rate swaps 20 – – 1,657 – 1,657Trade and other receivables 15 557,022 – – – 557,022Cash and cash equivalents 20 195,818 – – – 195,818
Total financial assets 752,840 – 14,688 18,486 786,014
Current assets 752,840 – 14,688 – 767,528 Non-current assets – – – 18,486 18,486
752,840 – 14,688 18,486 786,014
Borrowings and overdrafts 20 (1,329,469) – – – (1,329,469)Forward foreign exchange contracts 20 – – (742) – (742)Interest rate swaps 20 – – (31,509) – (31,509)Trade and other payables 16 (909,834) – – – (909,834)
Total financial liabilities (2,239,303) – (32,251) – (2,271,554)
Current liabilities (946,045) – (742) – (946,787)Non-current liabilities (1,293,258) – (31,509) – (1,324,767)
(2,239,303) – (32,251) – (2,271,554)
Total net financial liabilities (1,486,463) – (17,563) 18,486 (1,485,540)
Included in the above table are the following components of net debt:
Analysis of total net debt by categoryInterest rate swaps – – (29,852) – (29,852)Cash and cash equivalents 195,818 – – – 195,818
195,818 – (29,852) – 165,966
Bank overdrafts (9,682) – – – (9,682)Bank loans (806,028) – – – (806,028)Senior notes (513,759) – – – (513,759)
Borrowings and overdrafts (1,329,469) – – – (1,329,469)
Total net debt (1,133,651) – (29,852) – (1,163,503)
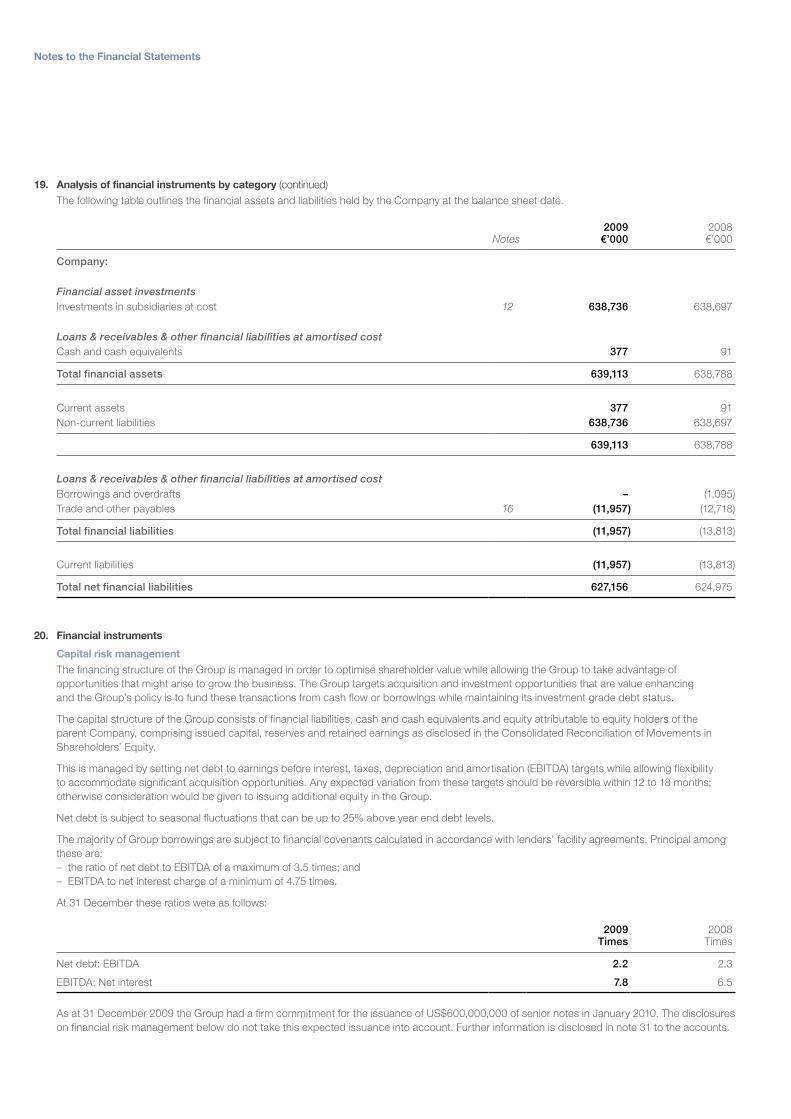
Notes to the Financial Statements
19. Analysis of financial instruments by category (continued)
The following table outlines the financial assets and liabilities held by the Company at the balance sheet date.
Notes2009
€’0002008€’000
Company:
Financial asset investmentsInvestments in subsidiaries at cost 12 638,736 638,697
Loans & receivables & other financial liabilities at amortised costCash and cash equivalents 377 91
Total financial assets 639,113 638,788
Current assets 377 91Non-current liabilities 638,736 638,697
639,113 638,788
Loans & receivables & other financial liabilities at amortised costBorrowings and overdrafts – (1,095)Trade and other payables 16 (11,957) (12,718)
Total financial liabilities (11,957) (13,813)
Current liabilities (11,957) (13,813)
Total net financial liabilities 627,156 624,975
20. Financial instruments
Capital risk managementThe financing structure of the Group is managed in order to optimise shareholder value while allowing the Group to take advantage of opportunities that might arise to grow the business. The Group targets acquisition and investment opportunities that are value enhancing and the Group’s policy is to fund these transactions from cash flow or borrowings while maintaining its investment grade debt status.
The capital structure of the Group consists of financial liabilities, cash and cash equivalents and equity attributable to equity holders of the parent Company, comprising issued capital, reserves and retained earnings as disclosed in the Consolidated Reconciliation of Movements in Shareholders’ Equity.
This is managed by setting net debt to earnings before interest, taxes, depreciation and amortisation (EBITDA) targets while allowing flexibility to accommodate significant acquisition opportunities. Any expected variation from these targets should be reversible within 12 to 18 months; otherwise consideration would be given to issuing additional equity in the Group.
Net debt is subject to seasonal fluctuations that can be up to 25% above year end debt levels.
The majority of Group borrowings are subject to financial covenants calculated in accordance with lenders’ facility agreements. Principal among these are:– the ratio of net debt to EBITDA of a maximum of 3.5 times; and– EBITDA to net interest charge of a minimum of 4.75 times.
At 31 December these ratios were as follows:
2009Times
2008Times
Net debt: EBITDA 2.2 2.3
EBITDA: Net interest 7.8 6.5
As at 31 December 2009 the Group had a firm commitment for the issuance of US$600,000,000 of senior notes in January 2010. The disclosures on financial risk management below do not take this expected issuance into account. Further information is disclosed in note 31 to the accounts.
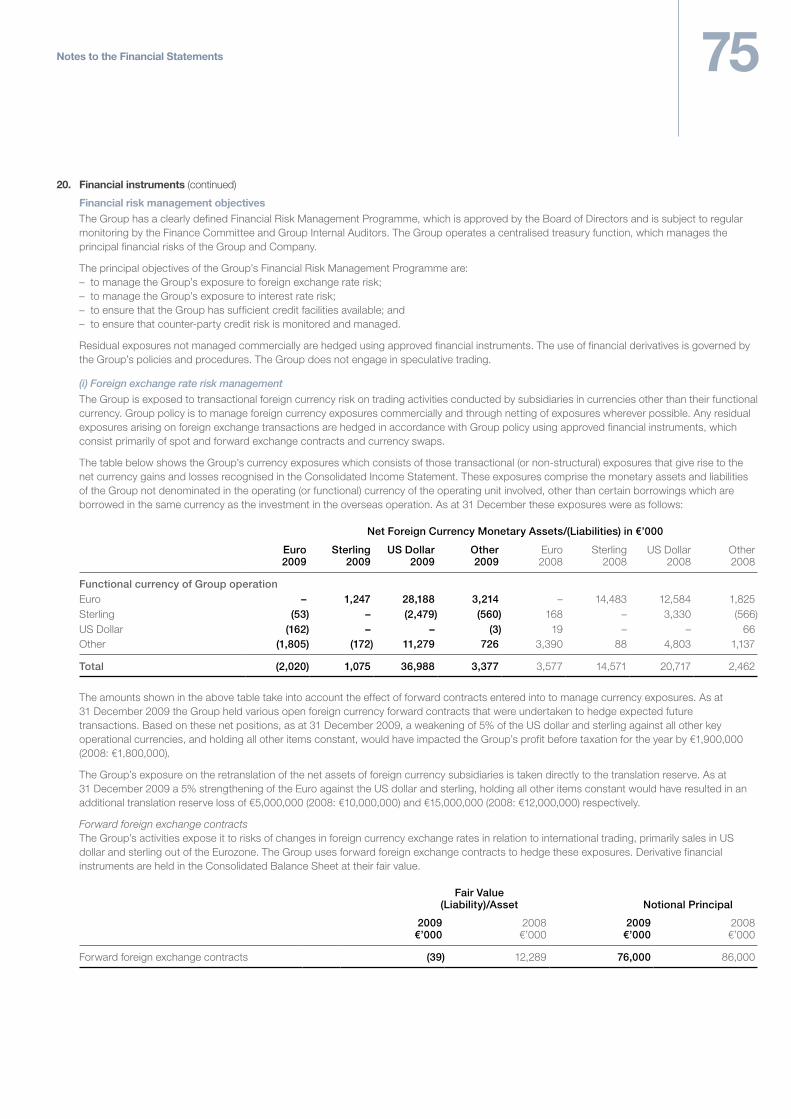
75Notes to the Financial Statements
20. Financial instruments (continued)
Financial risk management objectivesThe Group has a clearly defined Financial Risk Management Programme, which is approved by the Board of Directors and is subject to regular monitoring by the Finance Committee and Group Internal Auditors. The Group operates a centralised treasury function, which manages the principal financial risks of the Group and Company.
The principal objectives of the Group’s Financial Risk Management Programme are:– to manage the Group’s exposure to foreign exchange rate risk;– to manage the Group’s exposure to interest rate risk;– to ensure that the Group has sufficient credit facilities available; and– to ensure that counter-party credit risk is monitored and managed.
Residual exposures not managed commercially are hedged using approved financial instruments. The use of financial derivatives is governed by the Group’s policies and procedures. The Group does not engage in speculative trading.
(i) Foreign exchange rate risk management
The Group is exposed to transactional foreign currency risk on trading activities conducted by subsidiaries in currencies other than their functional currency. Group policy is to manage foreign currency exposures commercially and through netting of exposures wherever possible. Any residual exposures arising on foreign exchange transactions are hedged in accordance with Group policy using approved financial instruments, which consist primarily of spot and forward exchange contracts and currency swaps.
The table below shows the Group’s currency exposures which consists of those transactional (or non-structural) exposures that give rise to the net currency gains and losses recognised in the Consolidated Income Statement. These exposures comprise the monetary assets and liabilities of the Group not denominated in the operating (or functional) currency of the operating unit involved, other than certain borrowings which are borrowed in the same currency as the investment in the overseas operation. As at 31 December these exposures were as follows:
Net Foreign Currency Monetary Assets/(Liabilities) in €’000
Euro 2009
Sterling 2009
US Dollar 2009
Other 2009
Euro 2008
Sterling 2008
US Dollar 2008
Other 2008
Functional currency of Group operationEuro – 1,247 28,188 3,214 – 14,483 12,584 1,825Sterling (53) – (2,479) (560) 168 – 3,330 (566)US Dollar (162) – – (3) 19 – – 66Other (1,805) (172) 11,279 726 3,390 88 4,803 1,137
Total (2,020) 1,075 36,988 3,377 3,577 14,571 20,717 2,462
The amounts shown in the above table take into account the effect of forward contracts entered into to manage currency exposures. As at 31 December 2009 the Group held various open foreign currency forward contracts that were undertaken to hedge expected future transactions. Based on these net positions, as at 31 December 2009, a weakening of 5% of the US dollar and sterling against all other key operational currencies, and holding all other items constant, would have impacted the Group’s profit before taxation for the year by €1,900,000 (2008: €1,800,000).
The Group’s exposure on the retranslation of the net assets of foreign currency subsidiaries is taken directly to the translation reserve. As at 31 December 2009 a 5% strengthening of the Euro against the US dollar and sterling, holding all other items constant would have resulted in an additional translation reserve loss of €5,000,000 (2008: €10,000,000) and €15,000,000 (2008: €12,000,000) respectively.
Forward foreign exchange contractsThe Group’s activities expose it to risks of changes in foreign currency exchange rates in relation to international trading, primarily sales in US dollar and sterling out of the Eurozone. The Group uses forward foreign exchange contracts to hedge these exposures. Derivative financial instruments are held in the Consolidated Balance Sheet at their fair value.
Fair Value (Liability)/Asset Notional Principal
2009€’000
2008€’000
2009€’000
2008€’000
Forward foreign exchange contracts (39) 12,289 76,000 86,000
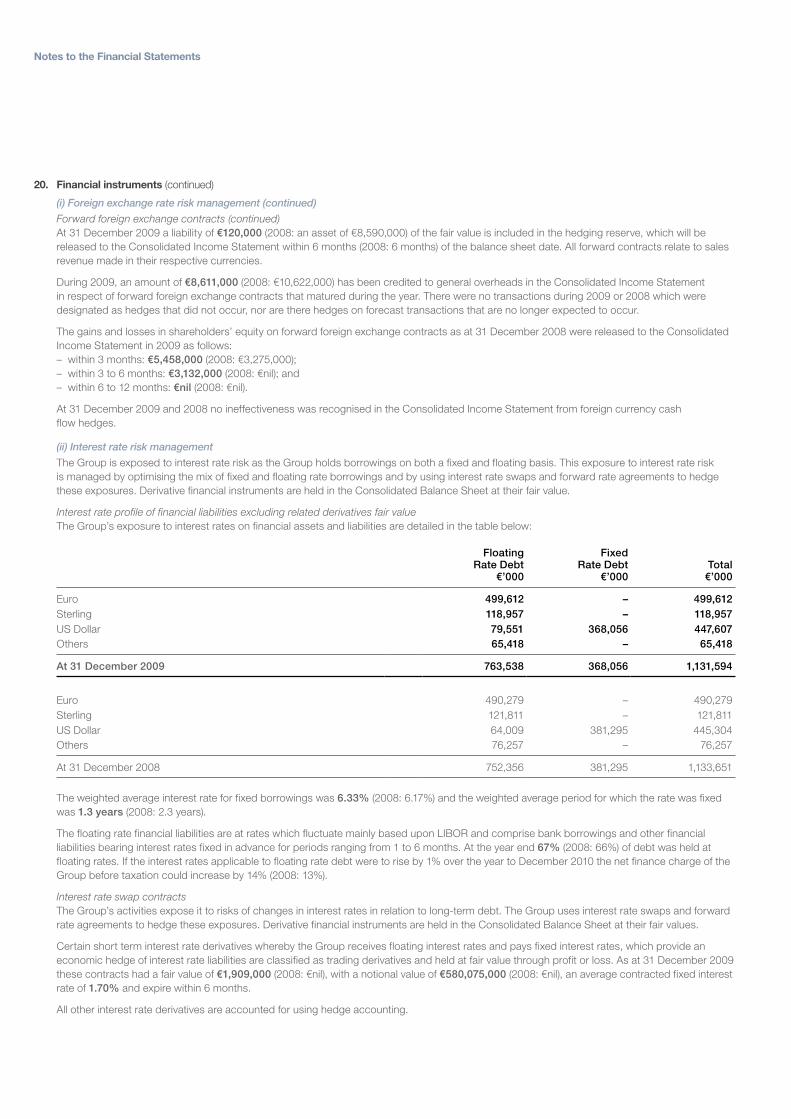
Notes to the Financial Statements
20. Financial instruments (continued)
(i) Foreign exchange rate risk management (continued)
Forward foreign exchange contracts (continued)At 31 December 2009 a liability of €120,000 (2008: an asset of €8,590,000) of the fair value is included in the hedging reserve, which will be released to the Consolidated Income Statement within 6 months (2008: 6 months) of the balance sheet date. All forward contracts relate to sales revenue made in their respective currencies.
During 2009, an amount of €8,611,000 (2008: €10,622,000) has been credited to general overheads in the Consolidated Income Statement in respect of forward foreign exchange contracts that matured during the year. There were no transactions during 2009 or 2008 which were designated as hedges that did not occur, nor are there hedges on forecast transactions that are no longer expected to occur.
The gains and losses in shareholders’ equity on forward foreign exchange contracts as at 31 December 2008 were released to the Consolidated Income Statement in 2009 as follows: – within 3 months: €5,458,000 (2008: €3,275,000);– within 3 to 6 months: €3,132,000 (2008: €nil); and – within 6 to 12 months: €nil (2008: €nil).
At 31 December 2009 and 2008 no ineffectiveness was recognised in the Consolidated Income Statement from foreign currency cash flow hedges.
(ii) Interest rate risk management
The Group is exposed to interest rate risk as the Group holds borrowings on both a fixed and floating basis. This exposure to interest rate risk is managed by optimising the mix of fixed and floating rate borrowings and by using interest rate swaps and forward rate agreements to hedge these exposures. Derivative financial instruments are held in the Consolidated Balance Sheet at their fair value.
Interest rate profile of financial liabilities excluding related derivatives fair valueThe Group’s exposure to interest rates on financial assets and liabilities are detailed in the table below:
Floating Rate Debt
€’000
Fixed Rate Debt
€’000Total€’000
Euro 499,612 – 499,612Sterling 118,957 – 118,957US Dollar 79,551 368,056 447,607Others 65,418 – 65,418
At 31 December 2009 763,538 368,056 1,131,594
Euro 490,279 – 490,279Sterling 121,811 – 121,811US Dollar 64,009 381,295 445,304Others 76,257 – 76,257
At 31 December 2008 752,356 381,295 1,133,651
The weighted average interest rate for fixed borrowings was 6.33% (2008: 6.17%) and the weighted average period for which the rate was fixed was 1.3 years (2008: 2.3 years).
The floating rate financial liabilities are at rates which fluctuate mainly based upon LIBOR and comprise bank borrowings and other financial liabilities bearing interest rates fixed in advance for periods ranging from 1 to 6 months. At the year end 67% (2008: 66%) of debt was held at floating rates. If the interest rates applicable to floating rate debt were to rise by 1% over the year to December 2010 the net finance charge of the Group before taxation could increase by 14% (2008: 13%).
Interest rate swap contractsThe Group’s activities expose it to risks of changes in interest rates in relation to long-term debt. The Group uses interest rate swaps and forward rate agreements to hedge these exposures. Derivative financial instruments are held in the Consolidated Balance Sheet at their fair values.
Certain short term interest rate derivatives whereby the Group receives floating interest rates and pays fixed interest rates, which provide an economic hedge of interest rate liabilities are classified as trading derivatives and held at fair value through profit or loss. As at 31 December 2009 these contracts had a fair value of €1,909,000 (2008: €nil), with a notional value of €580,075,000 (2008: €nil), an average contracted fixed interest rate of 1.70% and expire within 6 months.
All other interest rate derivatives are accounted for using hedge accounting.
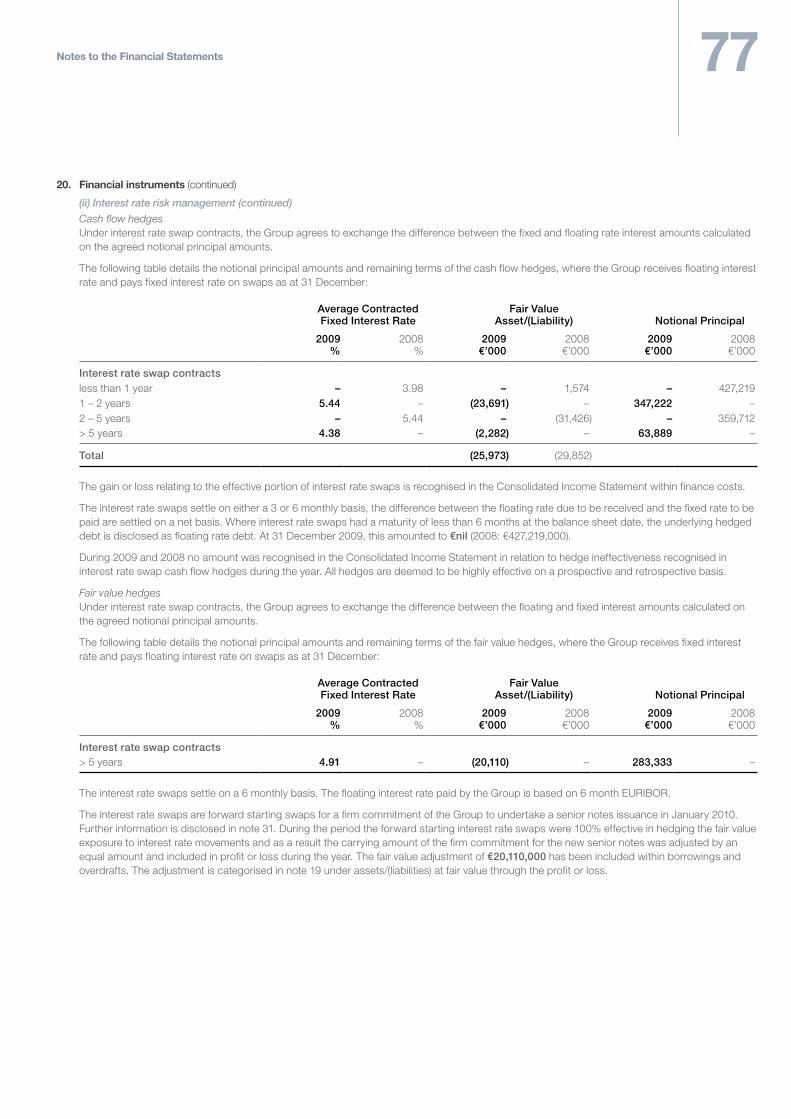
77Notes to the Financial Statements
20. Financial instruments (continued)
(ii) Interest rate risk management (continued)
Cash flow hedgesUnder interest rate swap contracts, the Group agrees to exchange the difference between the fixed and floating rate interest amounts calculated on the agreed notional principal amounts.
The following table details the notional principal amounts and remaining terms of the cash flow hedges, where the Group receives floating interest rate and pays fixed interest rate on swaps as at 31 December:
Average Contracted Fixed Interest Rate
Fair Value Asset/(Liability) Notional Principal
2009%
2008%
2009€’000
2008€’000
2009€’000
2008€’000
Interest rate swap contractsless than 1 year – 3.98 – 1,574 – 427,2191 – 2 years 5.44 – (23,691) – 347,222 –2 – 5 years – 5.44 – (31,426) – 359,712> 5 years 4.38 – (2,282) – 63,889 –
Total (25,973) (29,852)
The gain or loss relating to the effective portion of interest rate swaps is recognised in the Consolidated Income Statement within finance costs.
The interest rate swaps settle on either a 3 or 6 monthly basis, the difference between the floating rate due to be received and the fixed rate to be paid are settled on a net basis. Where interest rate swaps had a maturity of less than 6 months at the balance sheet date, the underlying hedged debt is disclosed as floating rate debt. At 31 December 2009, this amounted to €nil (2008: €427,219,000).
During 2009 and 2008 no amount was recognised in the Consolidated Income Statement in relation to hedge ineffectiveness recognised in interest rate swap cash flow hedges during the year. All hedges are deemed to be highly effective on a prospective and retrospective basis.
Fair value hedgesUnder interest rate swap contracts, the Group agrees to exchange the difference between the floating and fixed interest amounts calculated on the agreed notional principal amounts.
The following table details the notional principal amounts and remaining terms of the fair value hedges, where the Group receives fixed interest rate and pays floating interest rate on swaps as at 31 December:
Average Contracted Fixed Interest Rate
Fair Value Asset/(Liability) Notional Principal
2009%
2008%
2009€’000
2008€’000
2009€’000
2008€’000
Interest rate swap contracts> 5 years 4.91 – (20,110) – 283,333 –
The interest rate swaps settle on a 6 monthly basis. The floating interest rate paid by the Group is based on 6 month EURIBOR.
The interest rate swaps are forward starting swaps for a firm commitment of the Group to undertake a senior notes issuance in January 2010. Further information is disclosed in note 31. During the period the forward starting interest rate swaps were 100% effective in hedging the fair value exposure to interest rate movements and as a result the carrying amount of the firm commitment for the new senior notes was adjusted by an equal amount and included in profit or loss during the year. The fair value adjustment of €20,110,000 has been included within borrowings and overdrafts. The adjustment is categorised in note 19 under assets/(liabilities) at fair value through the profit or loss.
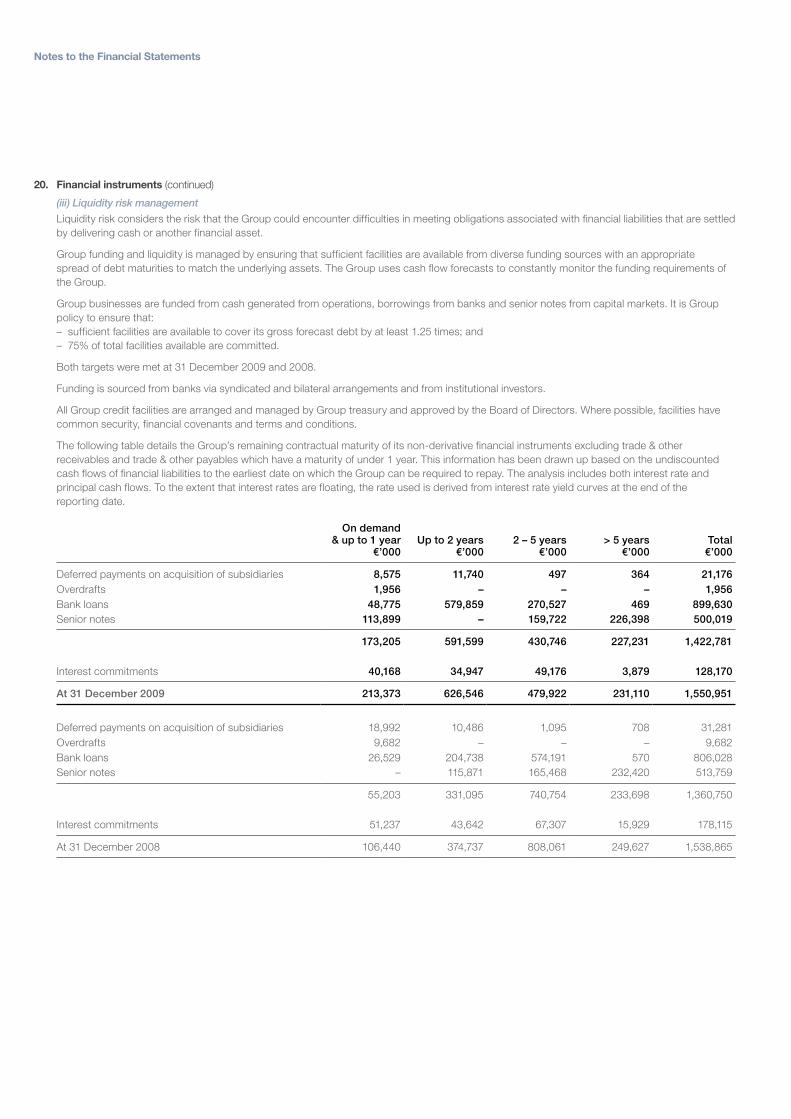
Notes to the Financial Statements
20. Financial instruments (continued)
(iii) Liquidity risk management
Liquidity risk considers the risk that the Group could encounter difficulties in meeting obligations associated with financial liabilities that are settled by delivering cash or another financial asset.
Group funding and liquidity is managed by ensuring that sufficient facilities are available from diverse funding sources with an appropriate spread of debt maturities to match the underlying assets. The Group uses cash flow forecasts to constantly monitor the funding requirements of the Group.
Group businesses are funded from cash generated from operations, borrowings from banks and senior notes from capital markets. It is Group policy to ensure that:– sufficient facilities are available to cover its gross forecast debt by at least 1.25 times; and– 75% of total facilities available are committed.
Both targets were met at 31 December 2009 and 2008.
Funding is sourced from banks via syndicated and bilateral arrangements and from institutional investors.
All Group credit facilities are arranged and managed by Group treasury and approved by the Board of Directors. Where possible, facilities have common security, financial covenants and terms and conditions.
The following table details the Group’s remaining contractual maturity of its non-derivative financial instruments excluding trade & other receivables and trade & other payables which have a maturity of under 1 year. This information has been drawn up based on the undiscounted cash flows of financial liabilities to the earliest date on which the Group can be required to repay. The analysis includes both interest rate and principal cash flows. To the extent that interest rates are floating, the rate used is derived from interest rate yield curves at the end of the reporting date.
On demand & up to 1 year
€’000Up to 2 years
€’0002 – 5 years
€’000> 5 years
€’000Total€’000
Deferred payments on acquisition of subsidiaries 8,575 11,740 497 364 21,176Overdrafts 1,956 – – – 1,956Bank loans 48,775 579,859 270,527 469 899,630Senior notes 113,899 – 159,722 226,398 500,019
173,205 591,599 430,746 227,231 1,422,781
Interest commitments 40,168 34,947 49,176 3,879 128,170
At 31 December 2009 213,373 626,546 479,922 231,110 1,550,951
Deferred payments on acquisition of subsidiaries 18,992 10,486 1,095 708 31,281Overdrafts 9,682 – – – 9,682Bank loans 26,529 204,738 574,191 570 806,028Senior notes – 115,871 165,468 232,420 513,759
55,203 331,095 740,754 233,698 1,360,750
Interest commitments 51,237 43,642 67,307 15,929 178,115
At 31 December 2008 106,440 374,737 808,061 249,627 1,538,865
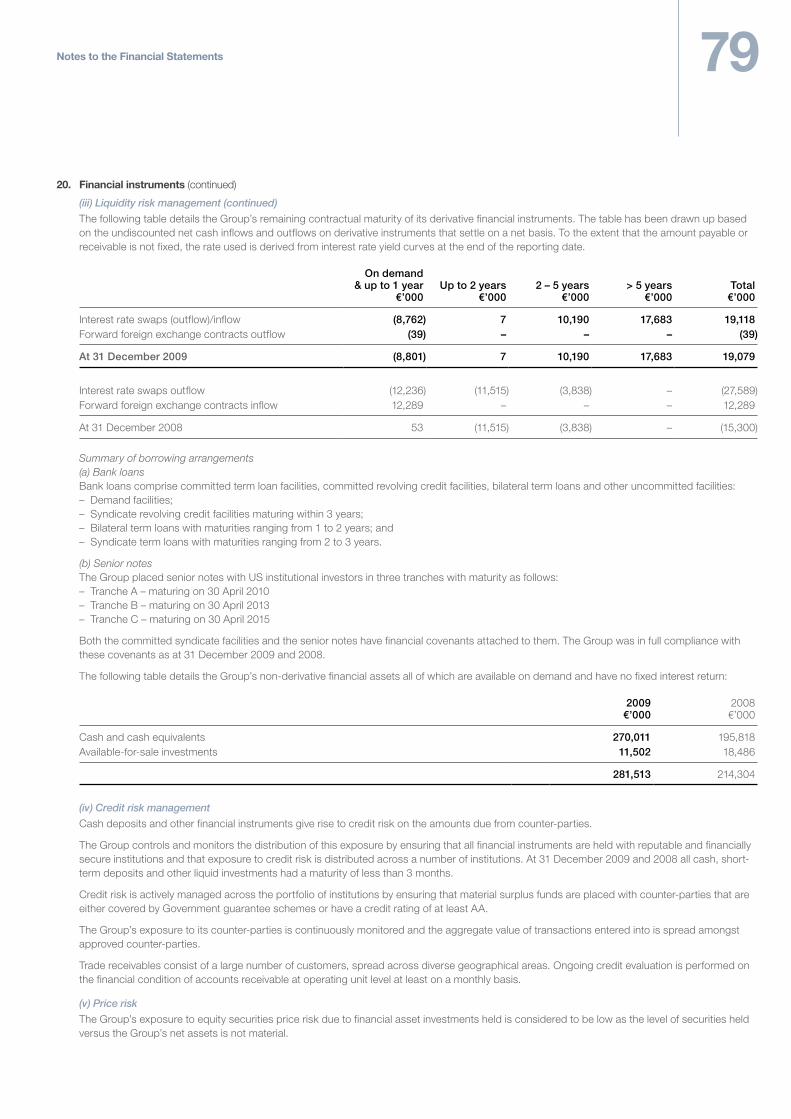
79Notes to the Financial Statements
20. Financial instruments (continued)
(iii) Liquidity risk management (continued)
The following table details the Group’s remaining contractual maturity of its derivative financial instruments. The table has been drawn up based on the undiscounted net cash inflows and outflows on derivative instruments that settle on a net basis. To the extent that the amount payable or receivable is not fixed, the rate used is derived from interest rate yield curves at the end of the reporting date.
On demand & up to 1 year
€’000Up to 2 years
€’0002 – 5 years
€’000> 5 years
€’000Total€’000
Interest rate swaps (outflow)/inflow (8,762) 7 10,190 17,683 19,118Forward foreign exchange contracts outflow (39) – – – (39)
At 31 December 2009 (8,801) 7 10,190 17,683 19,079
Interest rate swaps outflow (12,236) (11,515) (3,838) – (27,589)Forward foreign exchange contracts inflow 12,289 – – – 12,289
At 31 December 2008 53 (11,515) (3,838) – (15,300)
Summary of borrowing arrangements (a) Bank loans
Bank loans comprise committed term loan facilities, committed revolving credit facilities, bilateral term loans and other uncommitted facilities:– Demand facilities;– Syndicate revolving credit facilities maturing within 3 years;– Bilateral term loans with maturities ranging from 1 to 2 years; and– Syndicate term loans with maturities ranging from 2 to 3 years.
(b) Senior notesThe Group placed senior notes with US institutional investors in three tranches with maturity as follows:– Tranche A – maturing on 30 April 2010– Tranche B – maturing on 30 April 2013– Tranche C – maturing on 30 April 2015
Both the committed syndicate facilities and the senior notes have financial covenants attached to them. The Group was in full compliance with these covenants as at 31 December 2009 and 2008.
The following table details the Group’s non-derivative financial assets all of which are available on demand and have no fixed interest return:
2009€’000
2008€’000
Cash and cash equivalents 270,011 195,818Available-for-sale investments 11,502 18,486
281,513 214,304
(iv) Credit risk management
Cash deposits and other financial instruments give rise to credit risk on the amounts due from counter-parties.
The Group controls and monitors the distribution of this exposure by ensuring that all financial instruments are held with reputable and financially secure institutions and that exposure to credit risk is distributed across a number of institutions. At 31 December 2009 and 2008 all cash, short-term deposits and other liquid investments had a maturity of less than 3 months.
Credit risk is actively managed across the portfolio of institutions by ensuring that material surplus funds are placed with counter-parties that are either covered by Government guarantee schemes or have a credit rating of at least AA.
The Group’s exposure to its counter-parties is continuously monitored and the aggregate value of transactions entered into is spread amongst approved counter-parties.
Trade receivables consist of a large number of customers, spread across diverse geographical areas. Ongoing credit evaluation is performed on the financial condition of accounts receivable at operating unit level at least on a monthly basis.
(v) Price risk
The Group’s exposure to equity securities price risk due to financial asset investments held is considered to be low as the level of securities held versus the Group’s net assets is not material.
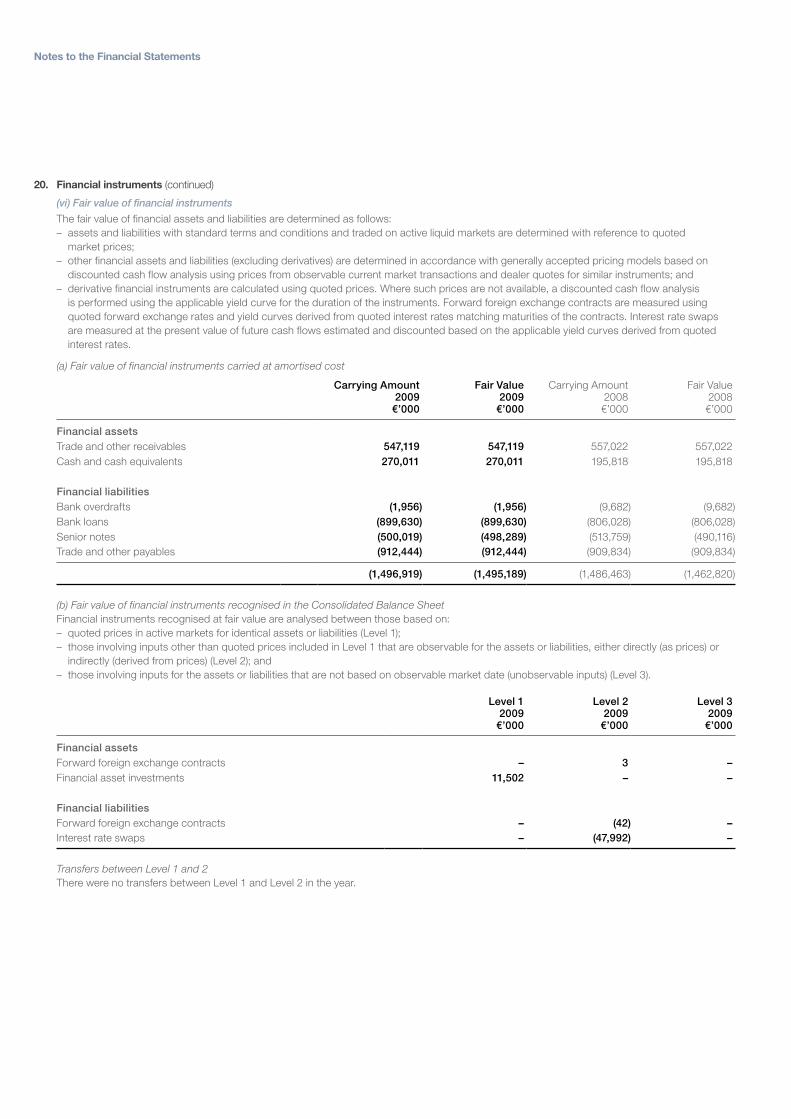
Notes to the Financial Statements
20. Financial instruments (continued)
(vi) Fair value of financial instruments
The fair value of financial assets and liabilities are determined as follows:– assets and liabilities with standard terms and conditions and traded on active liquid markets are determined with reference to quoted
market prices;– other financial assets and liabilities (excluding derivatives) are determined in accordance with generally accepted pricing models based on
discounted cash flow analysis using prices from observable current market transactions and dealer quotes for similar instruments; and– derivative financial instruments are calculated using quoted prices. Where such prices are not available, a discounted cash flow analysis
is performed using the applicable yield curve for the duration of the instruments. Forward foreign exchange contracts are measured using quoted forward exchange rates and yield curves derived from quoted interest rates matching maturities of the contracts. Interest rate swaps are measured at the present value of future cash flows estimated and discounted based on the applicable yield curves derived from quoted interest rates.
(a) Fair value of financial instruments carried at amortised cost
Carrying Amount 2009
€’000
Fair Value 2009
€’000
Carrying Amount 2008€’000
Fair Value 2008€’000
Financial assetsTrade and other receivables 547,119 547,119 557,022 557,022Cash and cash equivalents 270,011 270,011 195,818 195,818
Financial liabilitiesBank overdrafts (1,956) (1,956) (9,682) (9,682)Bank loans (899,630) (899,630) (806,028) (806,028)Senior notes (500,019) (498,289) (513,759) (490,116)Trade and other payables (912,444) (912,444) (909,834) (909,834)
(1,496,919) (1,495,189) (1,486,463) (1,462,820)
(b) Fair value of financial instruments recognised in the Consolidated Balance SheetFinancial instruments recognised at fair value are analysed between those based on:– quoted prices in active markets for identical assets or liabilities (Level 1);– those involving inputs other than quoted prices included in Level 1 that are observable for the assets or liabilities, either directly (as prices) or
indirectly (derived from prices) (Level 2); and– those involving inputs for the assets or liabilities that are not based on observable market date (unobservable inputs) (Level 3).
Level 1 2009
€’000
Level 2 2009
€’000
Level 3 2009
€’000
Financial assetsForward foreign exchange contracts – 3 –Financial asset investments 11,502 – –
Financial liabilitiesForward foreign exchange contracts – (42) –Interest rate swaps – (47,992) –
Transfers between Level 1 and 2There were no transfers between Level 1 and Level 2 in the year.
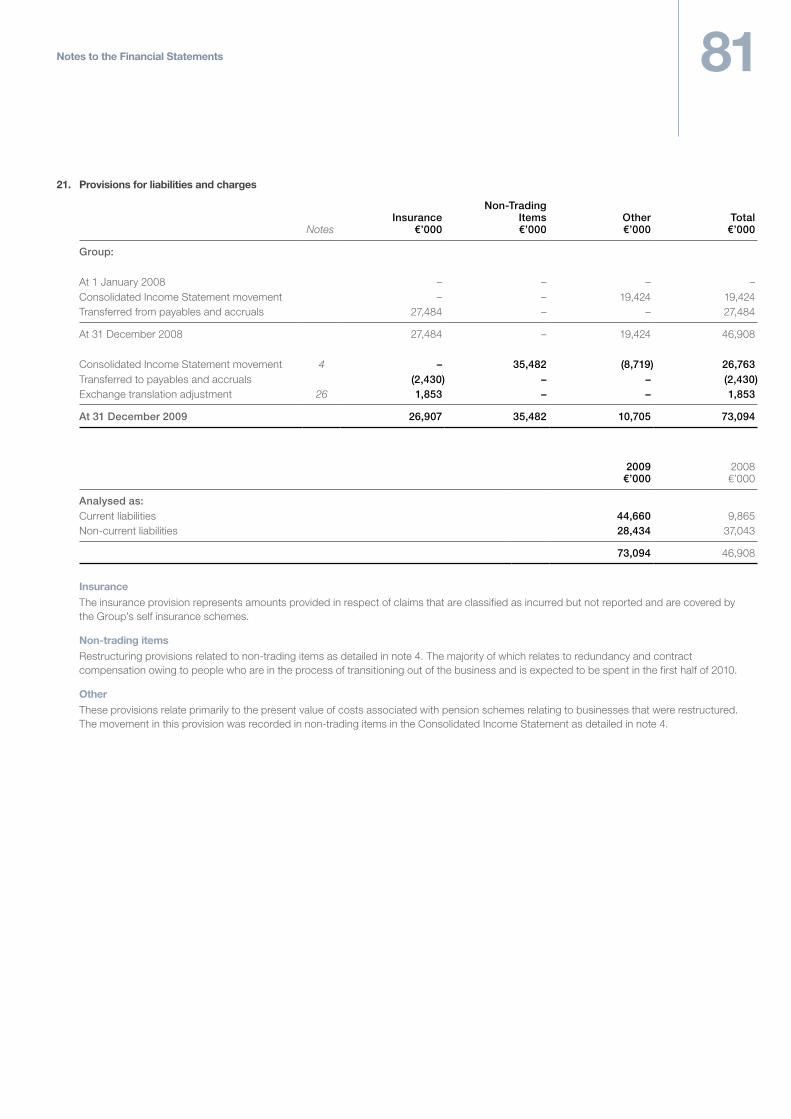
81Notes to the Financial Statements
21. Provisions for liabilities and charges
NotesInsurance
€’000
Non-Trading Items€’000
Other€’000
Total€’000
Group:
At 1 January 2008 – – – –Consolidated Income Statement movement – – 19,424 19,424Transferred from payables and accruals 27,484 – – 27,484
At 31 December 2008 27,484 – 19,424 46,908
Consolidated Income Statement movement 4 – 35,482 (8,719) 26,763Transferred to payables and accruals (2,430) – – (2,430)Exchange translation adjustment 26 1,853 – – 1,853
At 31 December 2009 26,907 35,482 10,705 73,094
2009€’000
2008€’000
Analysed as:Current liabilities 44,660 9,865Non-current liabilities 28,434 37,043
73,094 46,908
InsuranceThe insurance provision represents amounts provided in respect of claims that are classified as incurred but not reported and are covered by the Group’s self insurance schemes.
Non-trading itemsRestructuring provisions related to non-trading items as detailed in note 4. The majority of which relates to redundancy and contract compensation owing to people who are in the process of transitioning out of the business and is expected to be spent in the first half of 2010.
OtherThese provisions relate primarily to the present value of costs associated with pension schemes relating to businesses that were restructured. The movement in this provision was recorded in non-trading items in the Consolidated Income Statement as detailed in note 4.
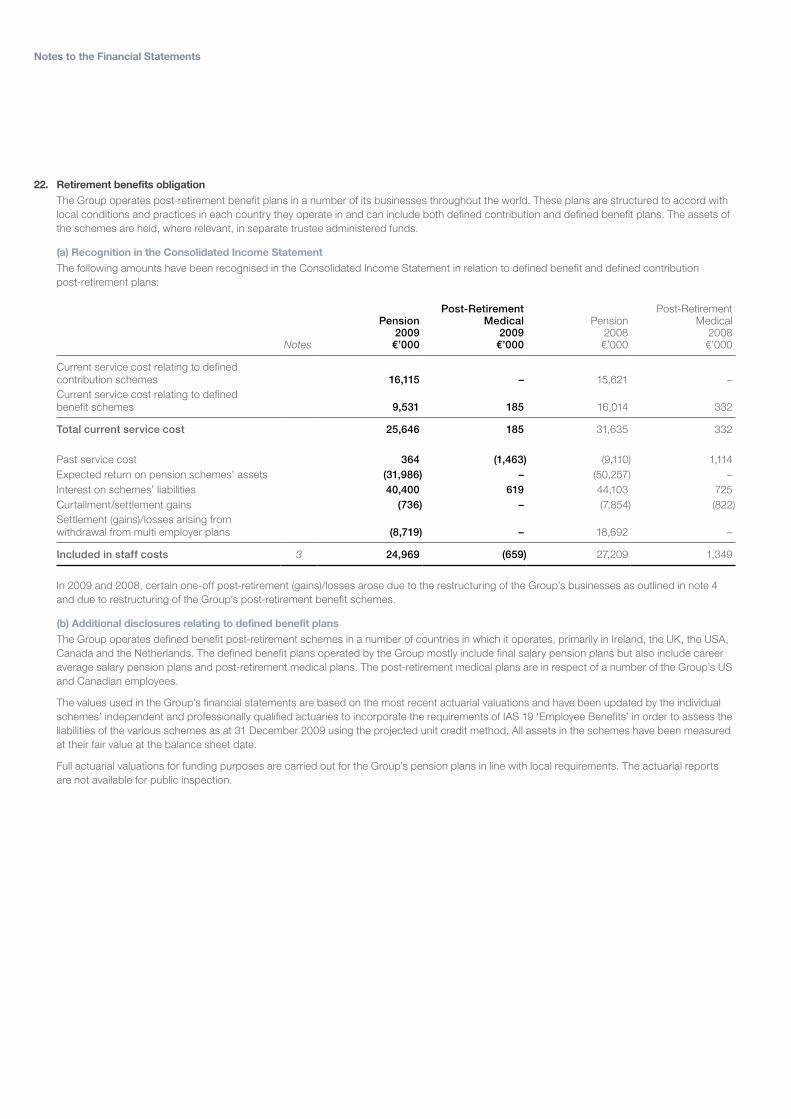
Notes to the Financial Statements
22. Retirement benefits obligationThe Group operates post-retirement benefit plans in a number of its businesses throughout the world. These plans are structured to accord with local conditions and practices in each country they operate in and can include both defined contribution and defined benefit plans. The assets of the schemes are held, where relevant, in separate trustee administered funds.
(a) Recognition in the Consolidated Income StatementThe following amounts have been recognised in the Consolidated Income Statement in relation to defined benefit and defined contribution post-retirement plans:
Notes
Pension 2009
€’000
Post-Retirement Medical
2009€’000
Pension 2008€’000
Post-Retirement Medical
2008€’000
Current service cost relating to defined contribution schemes 16,115 – 15,621 –Current service cost relating to defined benefit schemes 9,531 185 16,014 332
Total current service cost 25,646 185 31,635 332
Past service cost 364 (1,463) (9,110) 1,114Expected return on pension schemes’ assets (31,986) – (50,257) –Interest on schemes’ liabilities 40,400 619 44,103 725Curtailment/settlement gains (736) – (7,854) (822)Settlement (gains)/losses arising from withdrawal from multi employer plans (8,719) – 18,692 –
Included in staff costs 3 24,969 (659) 27,209 1,349
In 2009 and 2008, certain one-off post-retirement (gains)/losses arose due to the restructuring of the Group’s businesses as outlined in note 4 and due to restructuring of the Group’s post-retirement benefit schemes.
(b) Additional disclosures relating to defined benefit plansThe Group operates defined benefit post-retirement schemes in a number of countries in which it operates, primarily in Ireland, the UK, the USA, Canada and the Netherlands. The defined benefit plans operated by the Group mostly include final salary pension plans but also include career average salary pension plans and post-retirement medical plans. The post-retirement medical plans are in respect of a number of the Group’s US and Canadian employees.
The values used in the Group’s financial statements are based on the most recent actuarial valuations and have been updated by the individual schemes’ independent and professionally qualified actuaries to incorporate the requirements of IAS 19 ‘Employee Benefits’ in order to assess the liabilities of the various schemes as at 31 December 2009 using the projected unit credit method. All assets in the schemes have been measured at their fair value at the balance sheet date.
Full actuarial valuations for funding purposes are carried out for the Group’s pension plans in line with local requirements. The actuarial reports are not available for public inspection.
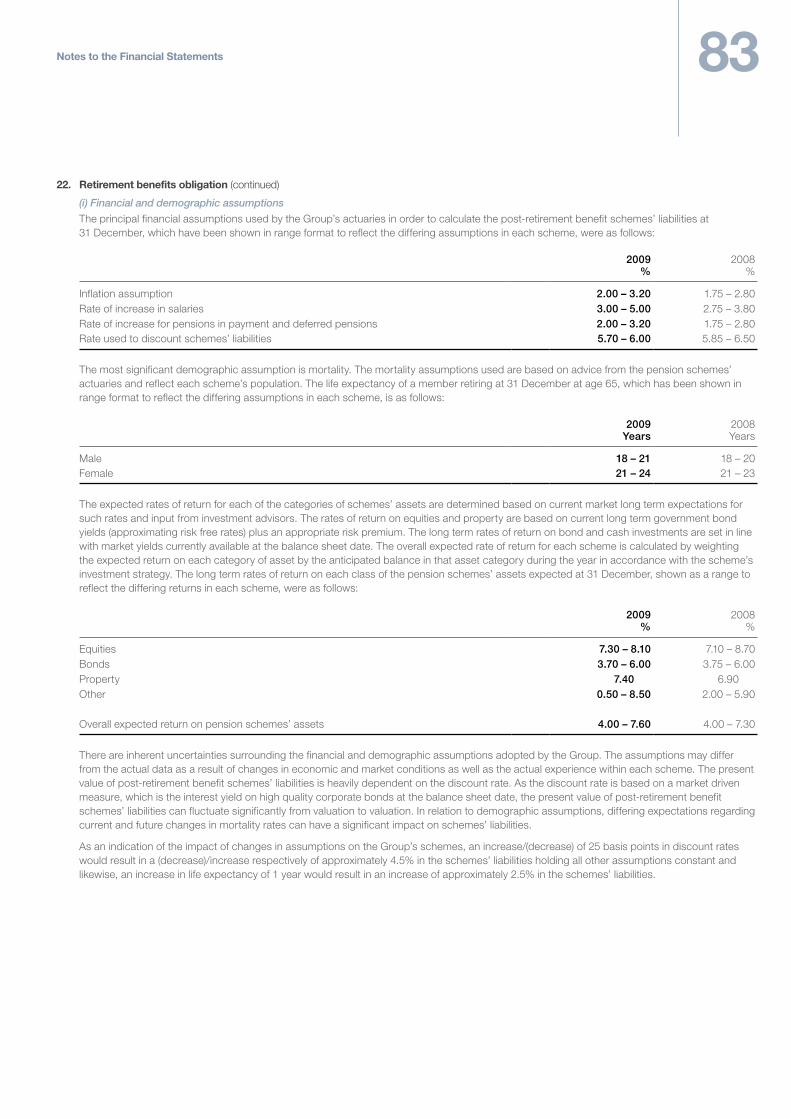
83Notes to the Financial Statements
22. Retirement benefits obligation (continued)
(i) Financial and demographic assumptions
The principal financial assumptions used by the Group’s actuaries in order to calculate the post-retirement benefit schemes’ liabilities at 31 December, which have been shown in range format to reflect the differing assumptions in each scheme, were as follows:
2009%
2008%
Inflation assumption 2.00 – 3.20 1.75 – 2.80Rate of increase in salaries 3.00 – 5.00 2.75 – 3.80Rate of increase for pensions in payment and deferred pensions 2.00 – 3.20 1.75 – 2.80Rate used to discount schemes’ liabilities 5.70 – 6.00 5.85 – 6.50
The most significant demographic assumption is mortality. The mortality assumptions used are based on advice from the pension schemes’ actuaries and reflect each scheme’s population. The life expectancy of a member retiring at 31 December at age 65, which has been shown in range format to reflect the differing assumptions in each scheme, is as follows:
2009Years
2008Years
Male 18 – 21 18 – 20Female 21 – 24 21 – 23
The expected rates of return for each of the categories of schemes’ assets are determined based on current market long term expectations for such rates and input from investment advisors. The rates of return on equities and property are based on current long term government bond yields (approximating risk free rates) plus an appropriate risk premium. The long term rates of return on bond and cash investments are set in line with market yields currently available at the balance sheet date. The overall expected rate of return for each scheme is calculated by weighting the expected return on each category of asset by the anticipated balance in that asset category during the year in accordance with the scheme’s investment strategy. The long term rates of return on each class of the pension schemes’ assets expected at 31 December, shown as a range to reflect the differing returns in each scheme, were as follows:
2009%
2008%
Equities 7.30 – 8.10 7.10 – 8.70Bonds 3.70 – 6.00 3.75 – 6.00Property 7.40 6.90Other 0.50 – 8.50 2.00 – 5.90
Overall expected return on pension schemes’ assets 4.00 – 7.60 4.00 – 7.30
There are inherent uncertainties surrounding the financial and demographic assumptions adopted by the Group. The assumptions may differ from the actual data as a result of changes in economic and market conditions as well as the actual experience within each scheme. The present value of post-retirement benefit schemes’ liabilities is heavily dependent on the discount rate. As the discount rate is based on a market driven measure, which is the interest yield on high quality corporate bonds at the balance sheet date, the present value of post-retirement benefit schemes’ liabilities can fluctuate significantly from valuation to valuation. In relation to demographic assumptions, differing expectations regarding current and future changes in mortality rates can have a significant impact on schemes’ liabilities.
As an indication of the impact of changes in assumptions on the Group’s schemes, an increase/(decrease) of 25 basis points in discount rates would result in a (decrease)/increase respectively of approximately 4.5% in the schemes’ liabilities holding all other assumptions constant and likewise, an increase in life expectancy of 1 year would result in an increase of approximately 2.5% in the schemes’ liabilities.
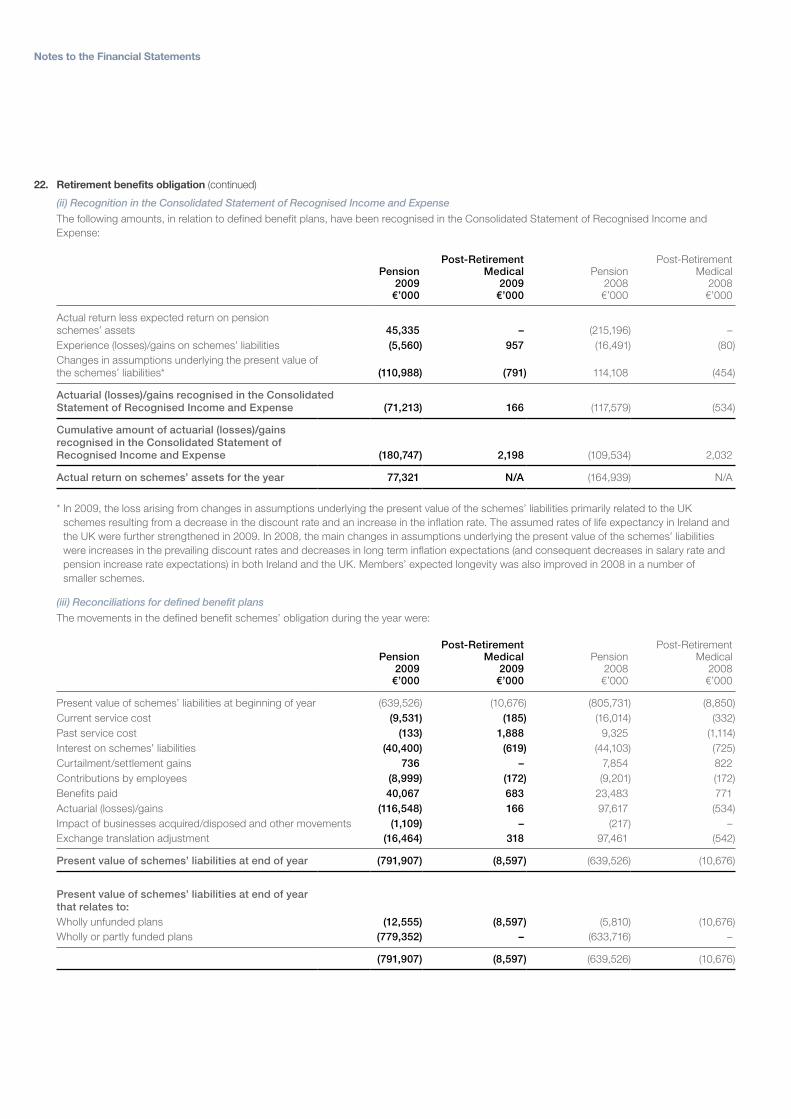
Notes to the Financial Statements
22. Retirement benefits obligation (continued)
(ii) Recognition in the Consolidated Statement of Recognised Income and Expense
The following amounts, in relation to defined benefit plans, have been recognised in the Consolidated Statement of Recognised Income and Expense:
Pension 2009
€’000
Post-Retirement Medical
2009€’000
Pension 2008€’000
Post-Retirement Medical
2008€’000
Actual return less expected return on pension schemes’ assets 45,335 – (215,196) –Experience (losses)/gains on schemes’ liabilities (5,560) 957 (16,491) (80)Changes in assumptions underlying the present value of the schemes’ liabilities* (110,988) (791) 114,108 (454)
Actuarial (losses)/gains recognised in the Consolidated Statement of Recognised Income and Expense (71,213) 166 (117,579) (534)
Cumulative amount of actuarial (losses)/gains recognised in the Consolidated Statement of Recognised Income and Expense (180,747) 2,198 (109,534) 2,032
Actual return on schemes’ assets for the year 77,321 N/A (164,939) N/A
* In 2009, the loss arising from changes in assumptions underlying the present value of the schemes’ liabilities primarily related to the UK schemes resulting from a decrease in the discount rate and an increase in the inflation rate. The assumed rates of life expectancy in Ireland and the UK were further strengthened in 2009. In 2008, the main changes in assumptions underlying the present value of the schemes’ liabilities were increases in the prevailing discount rates and decreases in long term inflation expectations (and consequent decreases in salary rate and pension increase rate expectations) in both Ireland and the UK. Members’ expected longevity was also improved in 2008 in a number of smaller schemes.
(iii) Reconciliations for defined benefit plans
The movements in the defined benefit schemes’ obligation during the year were:
Pension 2009
€’000
Post-Retirement Medical
2009€’000
Pension 2008€’000
Post-Retirement Medical
2008€’000
Present value of schemes’ liabilities at beginning of year (639,526) (10,676) (805,731) (8,850)Current service cost (9,531) (185) (16,014) (332)Past service cost (133) 1,888 9,325 (1,114)Interest on schemes’ liabilities (40,400) (619) (44,103) (725)Curtailment/settlement gains 736 – 7,854 822Contributions by employees (8,999) (172) (9,201) (172)Benefits paid 40,067 683 23,483 771Actuarial (losses)/gains (116,548) 166 97,617 (534)Impact of businesses acquired/disposed and other movements (1,109) – (217) –Exchange translation adjustment (16,464) 318 97,461 (542)
Present value of schemes’ liabilities at end of year (791,907) (8,597) (639,526) (10,676)
Present value of schemes’ liabilities at end of year that relates to:Wholly unfunded plans (12,555) (8,597) (5,810) (10,676)Wholly or partly funded plans (779,352) – (633,716) –
(791,907) (8,597) (639,526) (10,676)
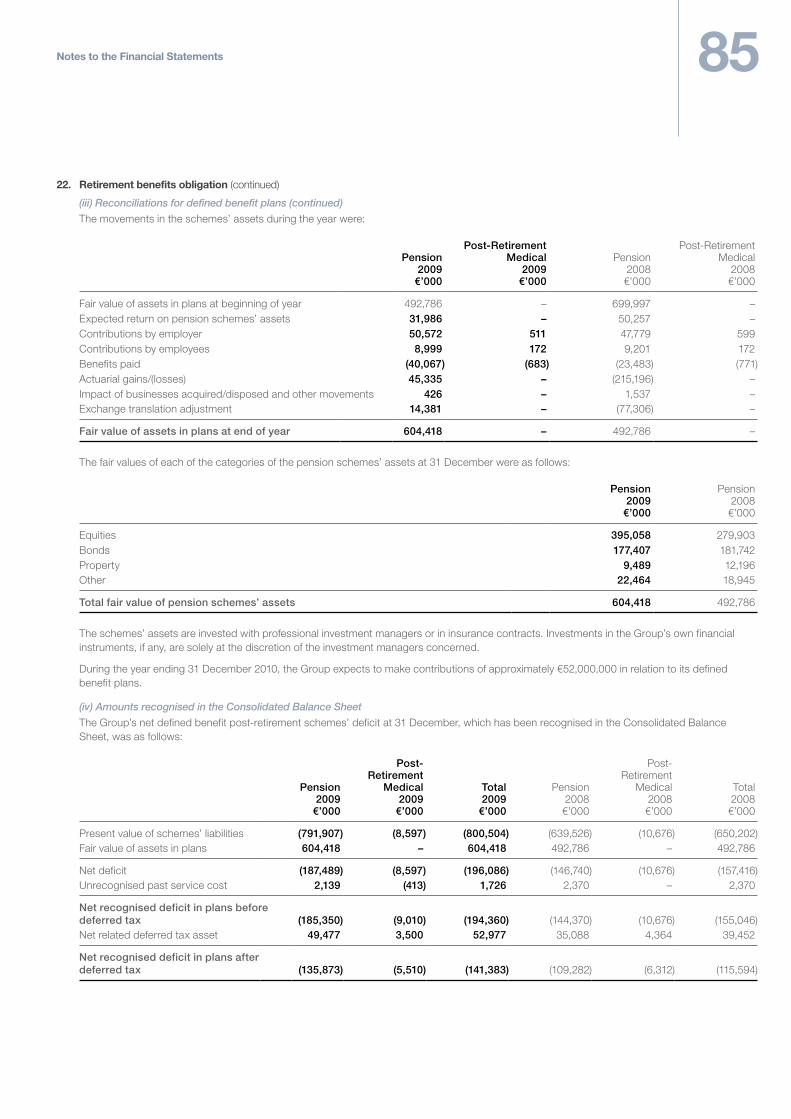
85Notes to the Financial Statements
22. Retirement benefits obligation (continued)
(iii) Reconciliations for defined benefit plans (continued)
The movements in the schemes’ assets during the year were:
Pension 2009
€’000
Post-Retirement Medical
2009€’000
Pension 2008€’000
Post-Retirement Medical
2008€’000
Fair value of assets in plans at beginning of year 492,786 – 699,997 –Expected return on pension schemes’ assets 31,986 – 50,257 –Contributions by employer 50,572 511 47,779 599Contributions by employees 8,999 172 9,201 172Benefits paid (40,067) (683) (23,483) (771)Actuarial gains/(losses) 45,335 – (215,196) –Impact of businesses acquired/disposed and other movements 426 – 1,537 –Exchange translation adjustment 14,381 – (77,306) –
Fair value of assets in plans at end of year 604,418 – 492,786 –
The fair values of each of the categories of the pension schemes’ assets at 31 December were as follows:
Pension 2009
€’000
Pension 2008€’000
Equities 395,058 279,903Bonds 177,407 181,742Property 9,489 12,196Other 22,464 18,945
Total fair value of pension schemes’ assets 604,418 492,786
The schemes’ assets are invested with professional investment managers or in insurance contracts. Investments in the Group’s own financial instruments, if any, are solely at the discretion of the investment managers concerned.
During the year ending 31 December 2010, the Group expects to make contributions of approximately €52,000,000 in relation to its defined benefit plans.
(iv) Amounts recognised in the Consolidated Balance Sheet
The Group’s net defined benefit post-retirement schemes’ deficit at 31 December, which has been recognised in the Consolidated Balance Sheet, was as follows:
Pension 2009
€’000
Post-Retirement
Medical 2009
€’000
Total 2009
€’000
Pension 2008€’000
Post- Retirement
Medical 2008€’000
Total 2008€’000
Present value of schemes’ liabilities (791,907) (8,597) (800,504) (639,526) (10,676) (650,202)Fair value of assets in plans 604,418 – 604,418 492,786 – 492,786
Net deficit (187,489) (8,597) (196,086) (146,740) (10,676) (157,416)Unrecognised past service cost 2,139 (413) 1,726 2,370 – 2,370
Net recognised deficit in plans before deferred tax (185,350) (9,010) (194,360) (144,370) (10,676) (155,046)Net related deferred tax asset 49,477 3,500 52,977 35,088 4,364 39,452
Net recognised deficit in plans after deferred tax (135,873) (5,510) (141,383) (109,282) (6,312) (115,594)
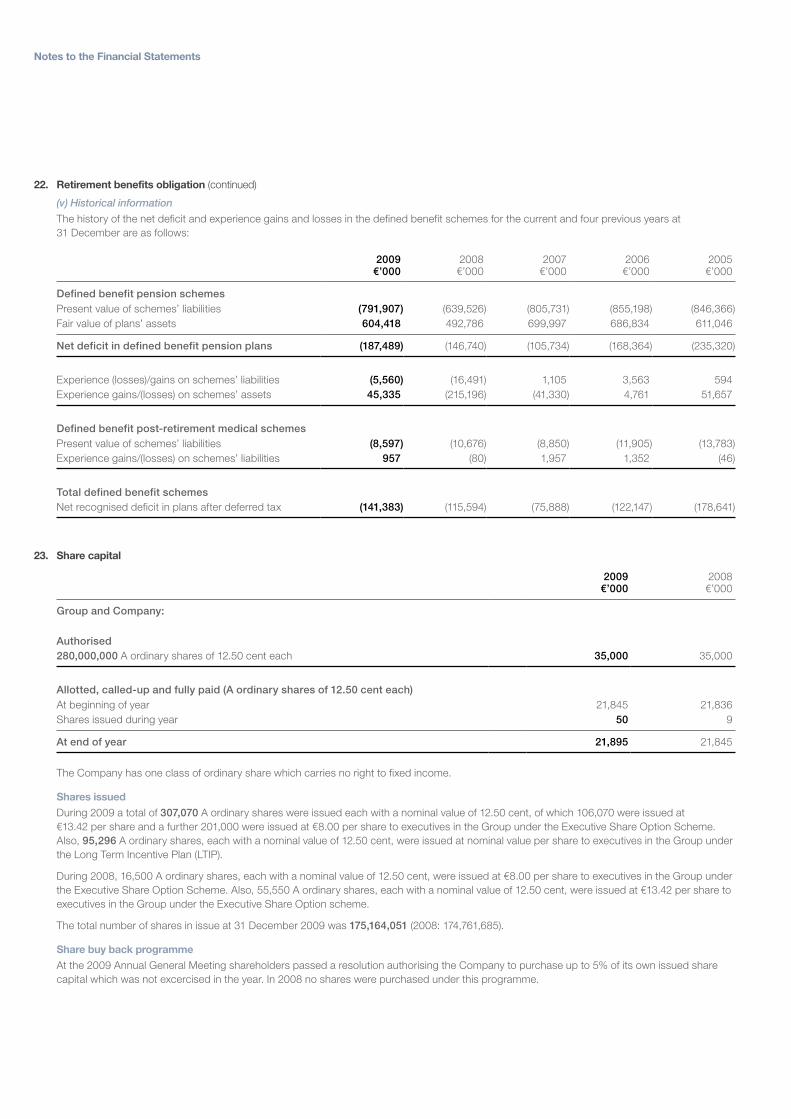
Notes to the Financial Statements
22. Retirement benefits obligation (continued)
(v) Historical information
The history of the net deficit and experience gains and losses in the defined benefit schemes for the current and four previous years at 31 December are as follows:
2009€’000
2008€’000
2007€’000
2006€’000
2005€’000
Defined benefit pension schemesPresent value of schemes’ liabilities (791,907) (639,526) (805,731) (855,198) (846,366)Fair value of plans’ assets 604,418 492,786 699,997 686,834 611,046
Net deficit in defined benefit pension plans (187,489) (146,740) (105,734) (168,364) (235,320)
Experience (losses)/gains on schemes’ liabilities (5,560) (16,491) 1,105 3,563 594Experience gains/(losses) on schemes’ assets 45,335 (215,196) (41,330) 4,761 51,657
Defined benefit post-retirement medical schemesPresent value of schemes’ liabilities (8,597) (10,676) (8,850) (11,905) (13,783)Experience gains/(losses) on schemes’ liabilities 957 (80) 1,957 1,352 (46)
Total defined benefit schemesNet recognised deficit in plans after deferred tax (141,383) (115,594) (75,888) (122,147) (178,641)
23. Share capital
2009
€’0002008€’000
Group and Company:
Authorised280,000,000 A ordinary shares of 12.50 cent each 35,000 35,000
Allotted, called-up and fully paid (A ordinary shares of 12.50 cent each)At beginning of year 21,845 21,836Shares issued during year 50 9
At end of year 21,895 21,845
The Company has one class of ordinary share which carries no right to fixed income.
Shares issuedDuring 2009 a total of 307,070 A ordinary shares were issued each with a nominal value of 12.50 cent, of which 106,070 were issued at €13.42 per share and a further 201,000 were issued at €8.00 per share to executives in the Group under the Executive Share Option Scheme. Also, 95,296 A ordinary shares, each with a nominal value of 12.50 cent, were issued at nominal value per share to executives in the Group under the Long Term Incentive Plan (LTIP).
During 2008, 16,500 A ordinary shares, each with a nominal value of 12.50 cent, were issued at €8.00 per share to executives in the Group under the Executive Share Option Scheme. Also, 55,550 A ordinary shares, each with a nominal value of 12.50 cent, were issued at €13.42 per share to executives in the Group under the Executive Share Option scheme.
The total number of shares in issue at 31 December 2009 was 175,164,051 (2008: 174,761,685).
Share buy back programmeAt the 2009 Annual General Meeting shareholders passed a resolution authorising the Company to purchase up to 5% of its own issued share capital which was not excercised in the year. In 2008 no shares were purchased under this programme.
87Notes to the Financial Statements
24. Share-based payments
(a) Executive Share Option Scheme
Notes
Number of Share Options
2009
Weighted Average Exercise Price
2009€
Number of Share Options
2008
Weighted Average Exercise Price
2008€
Outstanding at beginning of year 656,760 10.58 731,810 10.75Exercised 23 (307,070) 9.87 (72,050) 12.18Forfeited – – (3,000) 13.42
Outstanding and exercisable at end of year 349,690 11.20 656,760 10.58
Details of the Executive Share Option Scheme are given in the Report of the Directors. Options are equity settled and are exercisable at a price equal to the average quoted market price of the Company’s shares at the date of grant. The earliest exercisable date for all share options was 30 June 2000 and the latest exercisable date is 1 October 2010.
The exercise price range for options outstanding at the end of the year is €8.00 – €13.42 (2008: €8.00 – €13.42). The remaining weighted average contractual life of the options is 0.75 years (2008: 1.25 years).
(b) Long Term Incentive PlanThe Group operates an equity settled Long Term Incentive Plan (LTIP), under which an invitation to participate was made to executive Directors and senior executives. These invitations were made on two occasions to date, once in July 2006 and again in March 2009. The proportion of each invitation which vests will depend on the Total Shareholder Return (TSR) and Earnings Per Share (EPS) performance of the Group during a three year period (“the performance period”). A proportion of invitations made in 2006 vested during 2009 and the invitations made in 2009 will potentially vest in 2012 if the targets set are achieved.
Up to 50% of the shares subject to an invitation will vest according to the Group’s TSR performance during the performance period measured against the TSR performance of a peer group of listed companies. The remaining 50% of the shares subject to an invitation will vest according to the Group’s adjusted EPS growth compared with the increase in the Irish Consumer Price Index during the performance period. An invitation may lapse if a participant ceases to be employed within the Group before the vesting date.
A summary of the status of the LTIP as at 31 December and the changes during the year is presented below:
Number of Conditional
Awards 2009
Number of Conditional
Awards 2008
Outstanding at beginning of year 1,076,792 1,135,500Forfeited (69,621) (58,708)Lapsed (785,724) –Shares vested (54,847) –Share options (166,600) –New conditional awards 200,793 –
Outstanding at end of year 200,793 1,076,792
Exercisable at end of year – –
Notes to the Financial Statements
24. Share-based payments (continued)
Number of Share Options
2009
Number of Share Options
2008
Share options arising under the LTIPOutstanding at beginning of year – –Vested under the LTIP scheme 166,600 –Exercised (40,449) –
Outstanding and excercisable at end of year 126,151 –
Share options awarded under the LTIP scheme have an exercise price of 12.5 cent.
The remaining life for share options outstanding is 6.75 years (2008: nil).
The fair value per award and the assumptions used in the calculations are as follows:
2009 Conditional Award
at Grant Date
2006 Conditional Award
at Grant Date
Share price at grant date €14.30 €15.90Exercise price per share €0.125 €0.125Expected volatility 31.1% 16.3%Expected life 3 years 3 yearsRisk free rate 2.0% 3.6%Expected dividend yield 1.0% 1.0%Expected forfeiture rate 5.0% 5.0%Weighted average fair value at grant date €12.16 €6.24Valuation model Monte Carlo
PricingMonte Carlo
Pricing
Expected volatility was determined by calculating the historical volatility of the Group’s share price over the previous 3 years. Market based vesting conditions, such as the TSR condition, have been taken into account in establishing the fair value of equity instruments granted. Non-market based performance conditions, such as the EPS condition, were not taken into account in establishing the fair value of equity instruments granted, however the number of equity instruments included in the measurement of the transaction is adjusted so that the amount recognised is based on the number of equity instruments that eventually vest.
The Group recognised an expense of €691,000 (2008: credit of €1,491,000) related to equity-settled share-based payment transactions in the Consolidated Income Statement during the year. The expectation of meeting performance criteria was taken into account when calculating this expense/(credit).
89Notes to the Financial Statements
25. Analysis of cash flow componentsThe components of net cash flow from operating activities can be analysed as follows:
Notes
Group 2009
€’000
Group 2008€’000
Company 2009
€’000
Company 2008€’000
Depreciation (net)Depreciation 10 99,360 96,662 199 199Capital grants amortisation 17 (2,113) (2,638) (18) (18)
97,247 94,024 181 181
Change in working capitalDecrease/(increase) in inventories 95,831 (11,459) – –Decrease/(increase) in trade and other receivables 66,395 (1,545) – 20,410(Decrease)/increase in trade and other payables (30,479) 33,257 35,431 15,881Long term incentive plan expense/(credit) 24 691 (1,491) 691 (1,491)
132,438 18,762 36,122 34,800
26. Effect of exchange translation adjustments
Notes2009
€’0002008€’000
Group:
Decrease/(increase) in assetsProperty, plant and equipment 10 18,051 (59,922)Intangible assets 11 32,352 (118,782)Inventories 9,381 (25,840)Trade and other receivables 16,847 (52,143)Cash and cash equivalents 4,128 (13,536)
(Increase)/decrease in liabilitiesTrade and other payables (23,967) 57,401Tax liabilities (1,551) 5,154Financial liabilities (8,707) 43,832Retirement benefits obligation (1,753) 19,613Other non-current liabilities (6,740) 1,061Deferred tax liabilities 6 (710) 7,675Provisions for liabilities and charges 21 (1,853) –Deferred income 17 (72) 555
Retained earnings 4,203 (5,106)
39,609 (140,038)
The above exchange translation adjustments arise primarily on the retranslation of the Group’s opening net investment in its foreign currency subsidiaries.
Notes to the Financial Statements
27. Business combinationsDuring 2009, the Group completed eight bolt on acquisitions, all of which were 100% acquired. The total consideration for acquisitions amounted to €276,890,000 analysed as follows:
Fair Value Adjustment
Notes
Acquiree’s Carrying
Amount Before Combination
2009€000
Revaluations 2009€000
Alignment of Accounting
Policies 2009€000
Fair Value 2009€000
Net assets acquired:Non-current assets
Property, plant and equipment 10/17 39,743 (5,387) – 34,356Brand related intangibles 11 5,004 137,796 – 142,800Computer software 11 – 416 – 416
Current assetsInventories 19,698 – (1,515) 18,183Trade and other receivables 52,980 – (1,575) 51,405
Current liabilitiesTrade and other payables (43,630) – (8,708) (52,338)
Non-current liabilitiesDeferred tax liabilities – (31,421) – (31,421)Other non-current liabilities (1,822) – – (1,822)
71,973 101,404 (11,798) 161,579
Goodwill 11 115,311
276,890
Purchase consideration:Cash 268,305Deferred payments 2,090Acquisition expenses 6,495
276,890
The acquisition method of accounting has been used to consolidate the businesses acquired in the Group’s financial statements. Since the valuation of the fair value of assets and liabilities recently acquired is still in progress, the above values are determined provisionally. Historically adjustments to prior year fair values are not material. The cash discharged figure above includes €1,003,000 of net cash taken over at the date of acquisition.
The goodwill is attributable to the expected profitability, revenue growth, future market development and assembled workforce of the acquired businesses and the synergies expected to arise within the Group after the acquisition.
The principal acquisitions completed during 2009 are summarised as follows:
The acquisition of Breeo Foods from Reox Holdings plc was completed in March 2009 following the High Court’s decision to annul the Determination of the Competition Authority of Ireland to prohibit the Group’s proposed acquisition of Breeo Foods. The acquired business includes a portfolio of leading added-value dairy and meat product brands which are household names in Ireland, including Dairygold, Galtee, Shaws and Roscrea.
In March 2009, the Group acquired Dera Holding NV. Dera is a savoury ingredients business serving meat, convenience foods and snack markets in Europe. The business, headquartered in Bornem, Belgium, has manufacturing facilities in Belgium, the UK and the Czech Republic and also has sales offices in Russia, Ukraine, Turkey and France with a growing presence in Middle Eastern markets.
In January 2009, the Group acquired Prima S.A. Located in San Jose, Costa Rica, Prima is a leading supplier of meat and culinary ingredients in Central America.
In February 2009, the Group acquired the business and assets of George Adams Pastry business. Based in Spalding, UK, the acquired business manufactures pastry products for large retailers.
In December 2009, the Group acquired Nutritional Food Products (NFP). Located in California, USA, NFP manufactures ready-to-eat cereal products and ingredients.
During the year, the Group also completed other smaller acquisitions in Australia and the USA.
91Notes to the Financial Statements
27. Business combinations (continued)
The Breeo and Dera acquisitions in 2009 contributed approximately €143,000,000 to revenue and a marginal operating loss after applicable restructuring costs between their respective dates of acquisition and the balance sheet date.
The identifiable net assets acquired as part of the Breeo Foods and Dera Holding NV acquisitions were not material to the Group, therefore were not disclosed separately in this note.
28. Contingent liabilities
2009€’000
2008€’000
Company:
(a) Guarantees in respect of borrowings of subsidiaries 1,401,605 1,329,469
(b) For the purposes of Section 17 of the Companies (Amendment) Act, 1986, the Company has undertaken by Board resolution to indemnify the creditors of its subsidiaries incorporated in the Republic of Ireland, as set out in note 33, in respect of all losses and liabilities as referred to in Section 5(c) of the Companies (Amendment) Act, 1986 for the financial year ending on 31 December 2009 or any amended financial period incorporating the said financial year. The Company has given similar indemnities in relation to its subsidiaries in the Netherlands, as set out in note 33.
The Company does not expect any material loss to arise from these guarantees.
29. Other financial commitments
(a) Commitments for the acquisition of property, plant and equipment at 31 December for which no provision has been made in the accounts are as follows:
2009€’000
2008€’000
Group:
Commitments for the acquisition of property, plant and equipment in respect of contracts placed 23,293 13,105Expenditure for the acquisition of property, plant and equipment authorised by the Directors but not contracted for at the year end 33,252 37,263
56,545 50,368
(b) At the balance sheet date the Group had commitments under non-cancellable operating leases which fall due as follows:
2009€’000
2008€’000
Within 1 year 23,807 24,840Within 2 to 5 years 44,676 44,631After 5 years 25,507 24,621
93,990 94,092
The operating lease charges during 2009 amounted to €27,767,000 (2008: €26,447,000).
The Group leases various buildings, plant and machinery and motor vehicles under non-cancellable lease arrangements. The leases have various terms, escalation clauses and renewal rights. The leases typically range from less than 1 year to 66 years.
Notes to the Financial Statements
30. Related party transactions
(a) Transactions with key management personnelThe Board of Directors are deemed to be key management personnel of Kerry Group plc as they are responsible for planning, directing and controlling the activities of the Group. The Report of the Directors includes details of remuneration of Directors.
(b) Trading with DirectorsIn their ordinary course of business as farmers, certain Directors have traded on standard commercial terms with the Group’s Agribusiness Division. Aggregate purchases from, and sales to, these Directors amounted to €821,000 (2008: €1,488,000) and €311,000 (2008: €454,000) respectively. The trading balance outstanding to the Group at the year end was €18,000 (2008: €20,000).
All transactions with Directors were on standard commercial terms. The amounts outstanding are unsecured and will be settled in cash. No expense has been recognised in the year for bad or doubtful debts in respect of amounts owed by Directors.
(c) Trading with Parent CompanyOther than as disclosed in earlier notes, transactions in the year between the Company and its subsidiaries included dividends received of €8,246,000 (2008: €97,875,000) and cost recharges of €3,560,000 (2008: €3,664,000).
(d) Trading with other related partiesKerry Co-operative Creameries Limited is considered to be a related party of the Group as a result of its significant shareholding in the Parent Company, and the number of Directors in common as detailed in the Report of the Directors. During 2009 dividends of €9,685,000 (2008: €8,646,000) were paid to Kerry Co-operative Creameries Limited.
31. Events after the balance sheet date
Since the year end, the Group has:– completed the issuance of US$600,000,000 of senior notes across four tranches with maturities ranging from 7 to 15 years. These senior
notes were raised in the US private placement market and will primarily be used for the prepayment of near term debt at the balance sheet date.
– proposed a final dividend of 17.30 cent per A ordinary share (see note 9).
There have been no other significant events, outside the ordinary course of business, affecting the Group since 31 December 2009.
32. Reserves
Capital redemption reserveCapital redemption reserve represents the nominal cost of the cancelled shares in 2007.
Capital conversion reserve fundThis reserve represents the amount transferred to reserves as a result of renominalising the share capital of the parent company due to the euro conversion in 2002.
Long term incentive plan reserveThis reserve relates to invitations made to employees to participate in the Group’s Long Term Incentive Plan. Further information in relation to this share based payment is set out in note 24.
Available-for-sale investment reserveAccumulated gains and losses arising on the revaluation of available-for-sale financial assets that have been recognised in other comprehensive income. Net amounts are reclassified to profit or loss when those assets have been disposed of or are determined to be impaired.
Translation reserveExchange differences relating to the translation of the balance sheets of the Group’s foreign currency operations from their functional currencies to the Group’s presentation currency (i.e. euros) are recognised directly in other comprehensive income and accumulated in the translation reserve.
Hedging reserveThe hedging reserve represents the cumulative portion of gains and losses on hedging instruments deemed effective in hedging. The cumulative deferred gain or loss on the hedging instrument is reclassified to profit or loss only when the hedged transaction affects the profit or loss.
Retained earningsRetained earnings refers to the portion of net income which is retained by the Group rather than distributed to shareholders as dividends.
93Notes to the Financial Statements
33. Principal subsidiaries
Company Name Nature of Business CountryRegistered Office
Ballysimon Warehousing Limited Ingredients & Flavours Ireland 1Breeo Brands Limited Consumer Foods Ireland 1Breeo Enterprises Limited Consumer Foods Ireland 1Breeo Foods Limited Consumer Foods Ireland 1Charleville Research Limited Services Ireland 1Cuarto Limited Ingredients & Flavours Ireland 1Dawn Dairies Limited Consumer Foods Ireland 1Duffy Meats Limited Consumer Foods Ireland 1Dynaboo Limited Consumer Foods Ireland 1Fambee Limited Consumer Foods Ireland 1Freshways Limited Consumer Foods Ireland 1Glenealy Farm (Turkeys) Limited Consumer Foods Ireland 1Golden Vale Clare Limited Investment Ireland 1Golden Vale Dairies Limited Agribusiness Ireland 1Golden Vale Farms Limited Agribusiness Ireland 1Golden Vale Food Products Limited Ingredients & Flavours Ireland 1Golden Vale Holdings Limited Investment Ireland 1Golden Vale Investments Limited Investment Ireland 1Golden Vale Limerick Limited Consumer Foods Ireland 1Golden Vale Limited Investment Ireland 1Henry Denny & Sons (Ireland) Limited Consumer Foods Ireland 1Irish Cold Stores Limited Consumer Foods Ireland 1Jarbah Limited Ingredients & Flavours Ireland 1Kerry Agribusiness Holdings Limited Investment Ireland 1Kerry Agribusiness Trading Limited Agribusiness Ireland 1Kerry Creameries Limited Agribusiness Ireland 1Kerry Farm Supplies Limited Agribusiness Ireland 1Kerry Food Ingredients (Cork) Limited Ingredients & Flavours Ireland 1Kerry Group Business Services Limited Services Ireland 1Kerry Group Financial Services Services Ireland 1Kerry Group Services International Limited Services Ireland 1Kerry Group Services Limited Services Ireland 1Kerry Holdings (Ireland) Limited Investment Ireland 1Kerry Ingredients (Ireland) Limited Ingredients & Flavours Ireland 1Kerry Ingredients Holdings (Ireland) Limited Investment Ireland 1Kerry Ingredients Trading Limited Ingredients & Flavours Ireland 1Kerry Treasury Services Limited Services Ireland 1Kerrykreem Limited Consumer Foods Ireland 1Lifesource Foods Research Limited Consumer Foods Ireland 1National Food Ingredients Limited Ingredients & Flavours Ireland 1National Rusks Limited Ingredients & Flavours Ireland 1Pixundo Limited Consumer Foods Ireland 1Plassey Holdings Limited Investment Ireland 1Platters Food Company Limited Consumer Foods Ireland 1Princemark Holdings Limited Services Ireland 1Quandu Limited Consumer Foods Ireland 1Rye Developments Limited Services Ireland 1Rye Investments Limited Consumer Foods Ireland 1Rye Valley Foods Limited Consumer Foods Ireland 1Snowcream (Midlands) Limited Consumer Foods Ireland 1Trundu Limited Consumer Foods Ireland 1William Blake Limited Ingredients & Flavours Ireland 1Breeo Food Products (Northern Ireland) Limited Consumer Foods UK 1Henry Denny & Sons (NI) Limited Consumer Foods UK 2Dairy Produce Packers Limited Ingredients & Flavours UK 3Golden Cow Dairies Limited Consumer Foods UK 3Golden Vale (NI) Limited Investment UK 3
Notes to the Financial Statements
33. Principal subsidiaries (continued)
Company Name Nature of Business CountryRegistered Office
Leckpatrick Dairies Limited Consumer Foods UK 3Leckpatrick Holdings Limited Investment UK 3Diversity Foods Limited Consumer Foods UK 4Kerry Foods Limited Consumer Foods UK 4Kerry Foods Distribution Limited Consumer Foods UK 4Kerry Holdings (U.K.) Limited Investment UK 4Kerry Savoury Foods Limited Consumer Foods UK 4Noon Group Limited Consumer Foods UK 4Dairyborn Foods Limited Consumer Foods UK 5Cereal Innovations Limited Ingredients & Flavours UK 6Dale Country Foods Limited Ingredients & Flavours UK 6E B I Foods Limited Ingredients & Flavours UK 6Gordon Jopling (Foods) Limited Ingredients & Flavours UK 6Kerry Ingredients (UK) Limited Ingredients & Flavours UK 6Kerry Ingredients Holdings (U.K.) Limited Investment UK 6Titusfield Limited Ingredients & Flavours UK 6Spicemanns Limited Ingredients & Flavours UK 7Dera Food Technology Limited Ingredients & Flavours UK 8Dera Holding NV Ingredients & Flavours Belgium 9Kerry Bio-Science B.V. Ingredients & Flavours Netherlands 10Kerry Group B.V. Investment Netherlands 10Dera Nederland B.V. Ingredients & Flavours Netherlands 11Dera Food Technology CZ SRO Ingredients & Flavours Czech Republic 12Kerry Foods France Sarl Ingredients & Flavours France 13Kerry Ingredients France S.A.S. Ingredients & Flavours France 14Kerry Ingredients Holdings (France) S.A. Investment France 14Kerry Savoury Ingredients France S.A.S. Ingredients & Flavours France 15Kerry Foods GmbH. Ingredients & Flavours Germany 16Kerry Ingredients GmbH. Ingredients & Flavours Germany 16Cremo Ingredients A/S Ingredients & Flavours Denmark 17Kerry Ingredients Italia S.p.A. Ingredients & Flavours Italy 18Kerry Polska Sp. z.o.o. Ingredients & Flavours Poland 19Kerry Hungaria KFT. Ingredients & Flavours Hungary 20Dera Food Technology ROM SRL Ingredients & Flavours Romania 21Kerry Limited Liability Company Ingredients & Flavours Russia 22Kerry Bio-Science Egypt Misr L.L. Co Ingredients & Flavours Egypt 23Kerry Ingredients South Africa (Pty) Limited Ingredients & Flavours South Africa 24Dera SK SRO Ingredients & Flavours Slovakia 25Dera Limited Ingredients & Flavours Ukraine 26Flavurence Corporation Ingredients & Flavours USA 27GB Seasonings Inc. Ingredients & Flavours USA 27Geneva Flavors Inc. Ingredients & Flavours USA 27Guernsey Bel, Inc. Ingredients & Flavours USA 27Kerry Biofunctional Ingredients Inc. Ingredients & Flavours USA 27Kerry Holding Co. Investment USA 27Kerry Inc. Ingredients & Flavours USA 27Mastertaste Holding Co. Investment USA 27Nuvex Ingredients Inc. Ingredients & Flavours USA 27X-Café LLC Ingredients & Flavours USA 27Hickory Specialties Inc. Ingredients & Flavours USA 28Oregon Chai, Inc. Ingredients & Flavours USA 29Stearns & Lehman, Inc. Ingredients & Flavours USA 30Presco Food Seasonings Inc. Ingredients & Flavours USA 31Can-Pan Candy Inc. Ingredients & Flavours Canada 32Kerry (Canada) Inc. Ingredients & Flavours Canada 33Kerry (Quebec) Inc. Ingredients & Flavours Canada 34Nutrisens Inc. Ingredients & Flavours Canada 35
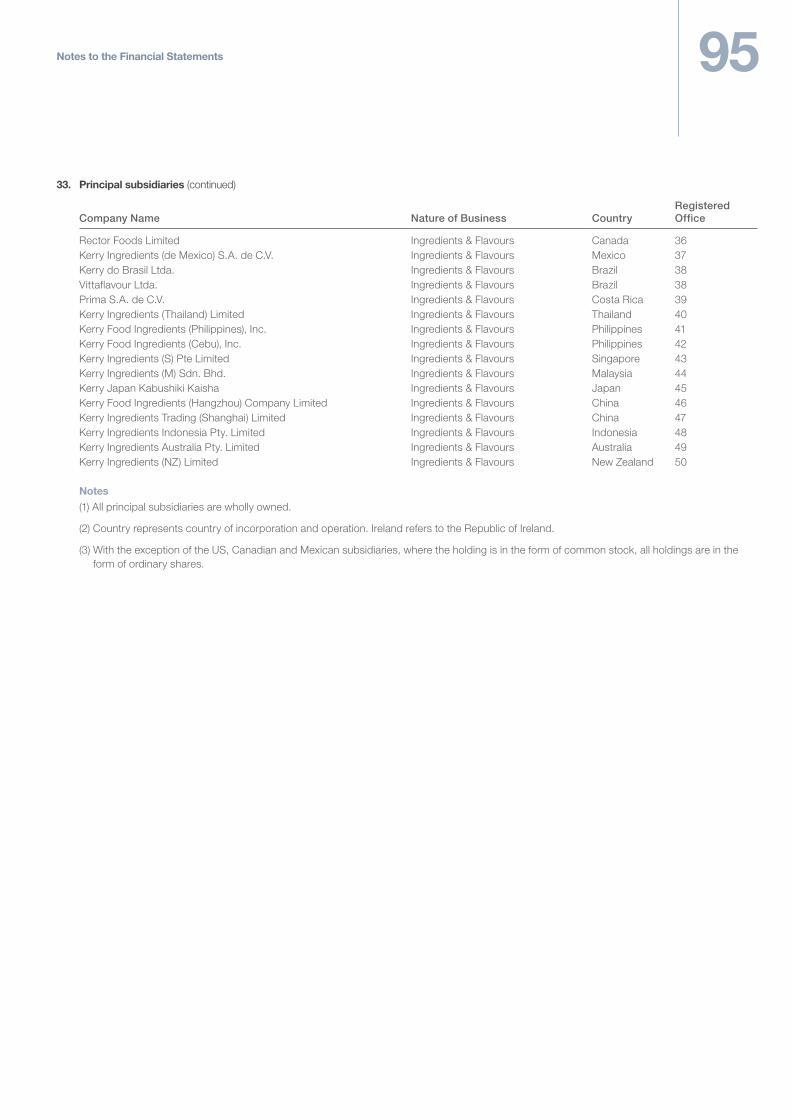
95Notes to the Financial Statements
33. Principal subsidiaries (continued)
Company Name Nature of Business CountryRegistered Office
Rector Foods Limited Ingredients & Flavours Canada 36Kerry Ingredients (de Mexico) S.A. de C.V. Ingredients & Flavours Mexico 37Kerry do Brasil Ltda. Ingredients & Flavours Brazil 38Vittaflavour Ltda. Ingredients & Flavours Brazil 38Prima S.A. de C.V. Ingredients & Flavours Costa Rica 39Kerry Ingredients (Thailand) Limited Ingredients & Flavours Thailand 40Kerry Food Ingredients (Philippines), Inc. Ingredients & Flavours Philippines 41Kerry Food Ingredients (Cebu), Inc. Ingredients & Flavours Philippines 42Kerry Ingredients (S) Pte Limited Ingredients & Flavours Singapore 43Kerry Ingredients (M) Sdn. Bhd. Ingredients & Flavours Malaysia 44Kerry Japan Kabushiki Kaisha Ingredients & Flavours Japan 45Kerry Food Ingredients (Hangzhou) Company Limited Ingredients & Flavours China 46Kerry Ingredients Trading (Shanghai) Limited Ingredients & Flavours China 47Kerry Ingredients Indonesia Pty. Limited Ingredients & Flavours Indonesia 48Kerry Ingredients Australia Pty. Limited Ingredients & Flavours Australia 49Kerry Ingredients (NZ) Limited Ingredients & Flavours New Zealand 50
Notes(1) All principal subsidiaries are wholly owned.
(2) Country represents country of incorporation and operation. Ireland refers to the Republic of Ireland.
(3) With the exception of the US, Canadian and Mexican subsidiaries, where the holding is in the form of common stock, all holdings are in the form of ordinary shares.
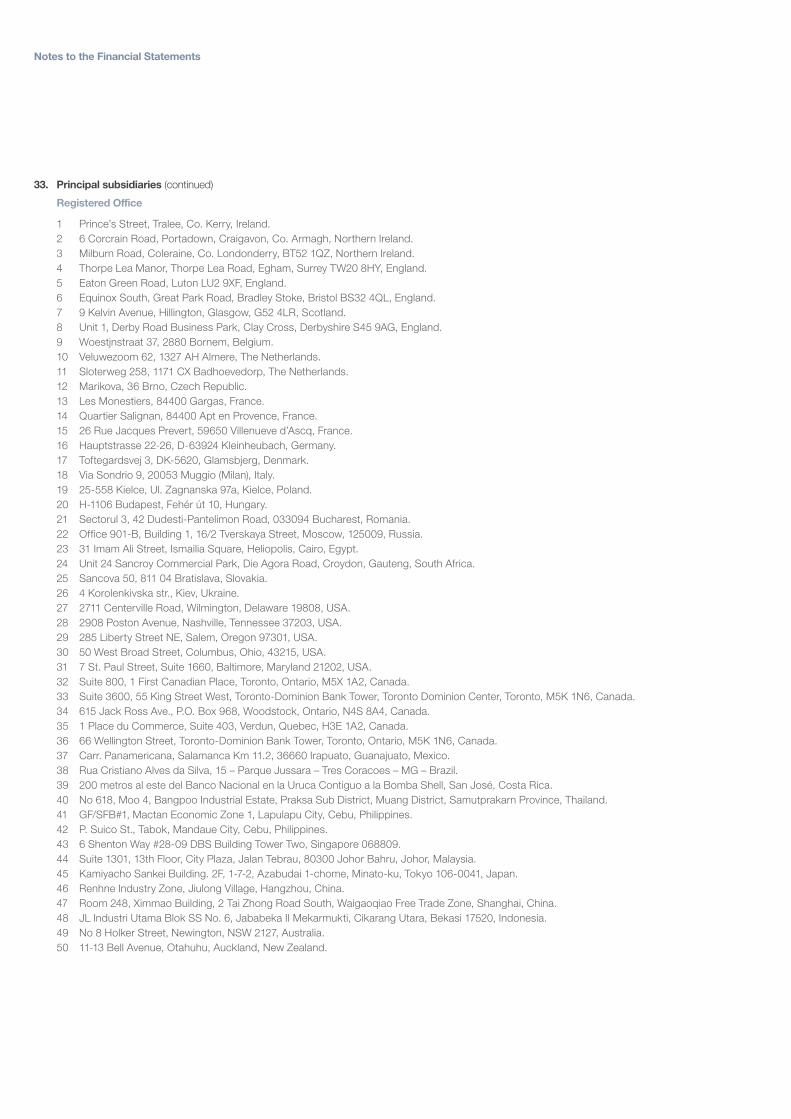
Notes to the Financial Statements
33. Principal subsidiaries (continued)
Registered Office
1 Prince’s Street, Tralee, Co. Kerry, Ireland.2 6 Corcrain Road, Portadown, Craigavon, Co. Armagh, Northern Ireland.3 Milburn Road, Coleraine, Co. Londonderry, BT52 1QZ, Northern Ireland.4 Thorpe Lea Manor, Thorpe Lea Road, Egham, Surrey TW20 8HY, England.5 Eaton Green Road, Luton LU2 9XF, England.6 Equinox South, Great Park Road, Bradley Stoke, Bristol BS32 4QL, England.7 9 Kelvin Avenue, Hillington, Glasgow, G52 4LR, Scotland.8 Unit 1, Derby Road Business Park, Clay Cross, Derbyshire S45 9AG, England.9 Woestjnstraat 37, 2880 Bornem, Belgium.10 Veluwezoom 62, 1327 AH Almere, The Netherlands.11 Sloterweg 258, 1171 CX Badhoevedorp, The Netherlands.12 Marikova, 36 Brno, Czech Republic.13 Les Monestiers, 84400 Gargas, France.14 Quartier Salignan, 84400 Apt en Provence, France.15 26 Rue Jacques Prevert, 59650 Villenueve d’Ascq, France.16 Hauptstrasse 22-26, D-63924 Kleinheubach, Germany.17 Toftegardsvej 3, DK-5620, Glamsbjerg, Denmark.18 Via Sondrio 9, 20053 Muggio (Milan), Italy.19 25-558 Kielce, Ul. Zagnanska 97a, Kielce, Poland.20 H-1106 Budapest, Fehér út 10, Hungary.21 Sectorul 3, 42 Dudesti-Pantelimon Road, 033094 Bucharest, Romania.22 Office 901-B, Building 1, 16/2 Tverskaya Street, Moscow, 125009, Russia.23 31 Imam Ali Street, Ismailia Square, Heliopolis, Cairo, Egypt.24 Unit 24 Sancroy Commercial Park, Die Agora Road, Croydon, Gauteng, South Africa.25 Sancova 50, 811 04 Bratislava, Slovakia.26 4 Korolenkivska str., Kiev, Ukraine.27 2711 Centerville Road, Wilmington, Delaware 19808, USA.28 2908 Poston Avenue, Nashville, Tennessee 37203, USA.29 285 Liberty Street NE, Salem, Oregon 97301, USA.30 50 West Broad Street, Columbus, Ohio, 43215, USA.31 7 St. Paul Street, Suite 1660, Baltimore, Maryland 21202, USA.32 Suite 800, 1 First Canadian Place, Toronto, Ontario, M5X 1A2, Canada.33 Suite 3600, 55 King Street West, Toronto-Dominion Bank Tower, Toronto Dominion Center, Toronto, M5K 1N6, Canada.34 615 Jack Ross Ave., P.O. Box 968, Woodstock, Ontario, N4S 8A4, Canada.35 1 Place du Commerce, Suite 403, Verdun, Quebec, H3E 1A2, Canada. 36 66 Wellington Street, Toronto-Dominion Bank Tower, Toronto, Ontario, M5K 1N6, Canada.37 Carr. Panamericana, Salamanca Km 11.2, 36660 Irapuato, Guanajuato, Mexico.38 Rua Cristiano Alves da Silva, 15 – Parque Jussara – Tres Coracoes – MG – Brazil.39 200 metros al este del Banco Nacional en la Uruca Contiguo a la Bomba Shell, San José, Costa Rica. 40 No 618, Moo 4, Bangpoo Industrial Estate, Praksa Sub District, Muang District, Samutprakarn Province, Thailand.41 GF/SFB#1, Mactan Economic Zone 1, Lapulapu City, Cebu, Philippines.42 P. Suico St., Tabok, Mandaue City, Cebu, Philippines.43 6 Shenton Way #28-09 DBS Building Tower Two, Singapore 068809.44 Suite 1301, 13th Floor, City Plaza, Jalan Tebrau, 80300 Johor Bahru, Johor, Malaysia.45 Kamiyacho Sankei Building. 2F, 1-7-2, Azabudai 1-chome, Minato-ku, Tokyo 106-0041, Japan.46 Renhne Industry Zone, Jiulong Village, Hangzhou, China.47 Room 248, Ximmao Building, 2 Tai Zhong Road South, Waigaoqiao Free Trade Zone, Shanghai, China.48 JL Industri Utama Blok SS No. 6, Jababeka II Mekarmukti, Cikarang Utara, Bekasi 17520, Indonesia.49 No 8 Holker Street, Newington, NSW 2127, Australia.50 11-13 Bell Avenue, Otahuhu, Auckland, New Zealand.

Kerry Group Prince’s Street Tralee Co. Kerry Ireland
T +353 66 718 2000 F +353 66 718 2961
www.kerrygroup.com


