ECO-INNOVATION IN THE CHEMICAL MANUFACTURING INDUSTRY: STATUS AND ITS DETERMINANTS KESHMINDER SINGH A/L JIT SINGH FACULTY OF ECONOMICS AND ADMINISTRATION UNIVERSITY OF MALAYA KUALA LUMPUR 2017
Transcript
ECO-INNOVATION IN THE CHEMICAL MANUFACTURING
INDUSTRY: STATUS AND ITS DETERMINANTS
KESHMINDER SINGH A/L JIT SINGH
FACULTY OF ECONOMICS AND ADMINISTRATION
UNIVERSITY OF MALAYA
KUALA LUMPUR
2017
ECO-INNOVATION IN THE CHEMICAL
MANUFACTURING INDUSTRY: STATUS
AND ITS DETERMINANTS
KESHMINDER SINGH A/L JIT SINGH
THESIS SUBMITTED IN FULFILMENT OF THE
REQUIREMENTS FOR THE DEGREE OF DOCTOR OF
PHILOSOPHY
FACULTY OF ECONOMICS AND ADMINISTRATION
UNIVERSITY OF MALAYA
KUALA LUMPUR
2017
ii
UNIVERSITI MALAYA
ORIGINAL LITERARY WORK DECLARATION
Name of Candidate: Keshminder Singh A/L Jit Singh (I.C No: )
Registration/Matric No: EHA130004
Name of Degree: Doctor of Philosophy
Thesis: Eco-Innovation in The Chemical Manufacturing Industry: Status and Its
Determinants
Field of Study: Environmental Economics
I do solemnly and sincerely declare that:
(1) I am the sole author / write of this Work;
(2) This Work is original;
(3) Any use of any work in which copyright exist was done by way of fair dealing
and for permitted purposes and any excerpt or extract from, or reference to or
reproduction of any copyright work has been disclosed expressly and
sufficiently and the title of the Work and its authorship have been
acknowledged in this Work;
(4) I do not have any actual knowledge nor do I ought reasonably to know that the
making of this work constitutes an infringement of any copyright work;
(5) I hereby assign all and every rights in the copyright to this Work to the
University of Malaya (“UM”), who henceforth shall be owner of all the
copyright in this Work and that any reproduction or use in any form or by any
means whatsoever is prohibited without the written consent of UM having been
first had and obtained;
(6) I am fully aware that if in the course of making this Work I have infringed any
copyright whether intentionally or otherwise, I may be subject to legal action
or any other action as may be determined by UM.
Candidate’s Signature Date
Subscribed and solemnly declared before,
Witness’s signature Date
Name:
Designation:
iii
ABSTRACT
Eco-innovation has emerged as an imperative technological paradigm for governments
and firms seeking to promote sustainable manufacturing practices propelling towards
the green growth path. This study aims to identify the state of eco-innovation of the
chemical industries. The study further develops a holistic eco-innovation framework
and empirically examines the determinants of eco-innovation in the Malaysian
chemical-manufacturing firms. A sequential exploratory design was used for the
purpose of this study. The qualitative analysis deploys a case study approach where
semi-structured interviews with six chemical firms were conducted to gauge the state of
eco-innovation practices and to validate the holistic eco-innovation framework, based
especially on the nine eco-innovation drivers identified from the literature. Survey
questionnaires were then distributed to the chemical firms located in the state of
Selangor and the data was used to empirically examine the relationship between the
eco-innovation drivers and eco-innovation. For this purpose, the Partial Least Square
(PLS) technique was used. The results show that in terms of state of eco-innovation,
firms are largely net adopters. However, the level of creation of eco-innovation taking
place indicated that firms have embraced advanced sustainable manufacturing practices
and concepts. Firms are moving away from eco-innovations that merely treat pollutants
at the end of manufacturing process to eco-innovations that manage these pollutants at
the initial stage of production. Credit for the success of eco-innovation and sustainable
manufacturing practices that firms have achieved thus far is due to high top
management commitment and strong corporate environmentalism culture. Meanwhile,
the eco-innovations framework structured based on the interviews, exhibited a merger
of three sub-models, namely; resources, strategy and eco-innovation models that link
the eco-innovation drivers through direct and indirect linkages. Eco-innovation in the
chemical firms was mainly driven by the firms’ environmental strategies and
iv
environmental regulations. Environmental strategies display a central tendency to
connect with other eco-innovation drivers within the eco-innovation framework. Export
behaviour and environmental collaboration, meanwhile exhibited strong indirect effect
on eco-innovation through environmental strategies. The implications of the study are
as follows. Although governmental actions through command and control policies have
in the past promoted eco-innovation among firms, however, it was increasing demand
for green products and emerging environmental issues that thrusted firms into their
environmental strategies entailing for more flexible policy options such as informational
measures, voluntary agreements and credible price signal. Firms also had an urgent
need to strengthen their absorptive capacity due to huge amounts of practical and tacit
knowledge involved during environmental strategy formulation but with no proper
mechanism in place to capture this knowledge. On the theoretical front, the study
confirms that the mix of theories and knowledge from the field of environmental
economics, innovation economics and management are imperative to effectively
develop a holistic eco-innovation framework and to provide practical solutions to
problems related to eco-innovation. The study and its findings are still largely
exploratory and sector specific, which limits generalization of the results. Therefore, a
similar study in other manufacturing sectors is required to validate the eco-innovation
framework and results.
v
ABSTRAK
Ekoinovasi muncul sebagai paradigma teknologi penting bagi kerajaan dan syarikat
yang berusaha untuk menggalakkan amalan pembuatan lestari demi memacu ke arah
pembangunan hijau. Kajian ini bertujuan untuk mengenal pasti keadaan ekoinovasi
industri kimia. Selanjutnya, kajian ini membangunkan rangka kerja ekoinovasi holistik
dan mengkaji secara empirik penentu ekoinovasi dalam syarikat kimia pembuatan
Malaysia. Satu reka bentuk eksploratori berurutan digunakan untuk tujuan kajian ini.
Analisis kualitatif menggunakan pendekatan kajian kes yang melibatkan temu bual
separa berstruktur terhadap enam syarikat kimia dijalankan untuk mengukur keadaan
amalan ekoinovasi dan untuk mengesahkan rangka kerja ekoinovasi holistik,
terutamanya berdasarkan kepada sembilan pemacu ekoinovasi yang dikenal pasti
daripada maklumat kepustakaan. Soal selidik tinjauan kemudiannya diedarkan kepada
syarikat-syarikat kimia tersebut yang terletak di negeri Selangor dan data berkenaan
digunakan untuk mengkaji hubungan antara pemacu ekoinovasi dan ekoinovasi secara
empirik. Bagi tujuan ini, teknik Kuasa Dua Terkecil Separa (PLS) digunakan. Hasil
kajian menunjukkan dari segi keadaan ekoinovasi, syarikat terbabit adalah penerima
pakai utama. Walau bagaimanapun, tahap penciptaan ekoinovasi menunjukkan syarikat-
syarikat terbabit telah menerapkan amalan dan konsep pembuatan lestari termaju.
Syarikat-syarikat itu beralih daripada ekoinovasi yang hanya merawat bahan pencemar
pada akhir proses pembuatan kepada ekoinovasi yang menguruskan bahan pencemar ini
pada peringkat awal pengeluaran. Kredit untuk kejayaan ekoinovasi dan amalan
pembuatan lestari yang dicapai oleh syarikat-syarikat tersebut setakat ini adalah kerana
komitmen pengurusan atasan yang tinggi dan budaya persekitaran hidup korporat yang
kukuh. Sementara itu, rangka kerja ekoinovasi berstruktur berdasarkan temu bual,
menunjukkan penggabungan tiga sub-model, iaitu sumber, model strategi, dan
ekoinovasi yang menghubungkan pemacu ekoinovasi melalui hubungan langsung dan
vi
tidak langsung. Ekoinovasi dalam syarikat kimia dipacu terutamanya oleh strategi
persekitaran dan peraturan persekitaran syarikat. Strategi persekitaran memaparkan
kecenderungan memusat untuk menghubungkan pemacu-pemacu ekoinovasi lain dalam
rangka kerja ekoinovasi tersebut. Sementara itu, tingkah laku eksport dan kerjasama
persekitaran pula memperlihatkan kesan tidak langsung yang kukuh bagi ekoinovasi
melalui strategi persekitaran. Implikasi kajian ini adalah seperti berikut. Walaupun
tindakan kerajaan melalui dasar arahan dan kawalan pada masa lalu menggalakkan
ekoinovasi dalam kalangan syarikat, namun permintaan untuk produk hijau dan isu-isu
persekitaran baharu yang semakin meningkat melonjakkan syarikat ini kepada strategi
persekitaran yang memerlukan lebih banyak pilihan dasar yang fleksibel seperti
langkah-langkah bermaklumat, perjanjian sukarela, dan isyarat harga yang boleh
dipercayai. Syarikat-syarikat ini juga mempunyai keperluan mendesak untuk
mengukuhkan keupayaan penyerapan mereka kerana sejumlah besar pengetahuan
praktikal dan tersirat terlibat semasa penggubalan strategi persekitaran, tetapi tiada
mekanisme yang sesuai untuk menguasai pengetahuan ini. Berdasarkan teori, kajian ini
mengesahkan bahawa gabungan teori dan pengetahuan daripada bidang ekonomi
persekitaran, ekonomi inovasi, dan pengurusan adalah penting untuk membangunkan
rangka kerja ekoinovasi holistik secara berkesan dan untuk menyediakan penyelesaian
praktikal kepada masalah yang berkaitan dengan ekoinovasi. Kajian ini dan dapatannya
masih sebahagian besarnya bersifat eksploratori dan untuk sektor tertentu, yang
menghadkan generalisasi keputusan. Oleh itu, kajian yang sama dalam sektor
pembuatan lain diperlukan untuk mengesahkan rangka kerja ekoinovasi dan keputusan
tersebut.
vii
ACKNOWLEDGEMENTS
First and foremost my heartiest gratitude to my supervisors, Associate Professor Dr.
VGR Chandaran and Dr. Santha Chenayah@Ramu without whom it was impossible for
me to embark on my PhD journey. They have not only shared their vast experience and
knowledge but also provided sheer motivation during my PhD journey. The love and
care showered upon is undoubtedly the primary reason that kept me moving along my
PhD journey. I was able to connect with important individuals and agencies to access
information imperative to my study. They provided relevant skills essential to embark
on scholarly journey after PhD. Therefore, their guidance has benefited beyond
completing my thesis; I have learned how to professionally engage with international
and local community especially among government agencies and scholars from diverse
fields. I also acquired skills to engage in consultancy work. Lastly, I have learned to be
an ethical and responsible scholar.
Next, I would like to express my gratitude to University Teknologi MARA and The
Ministry of Higher Education for providing me the platform and scholarship to further
my studies. My sincere appreciation to the Ministry of Energy, Green Technology and
Water (KeTTHA) for recognizing the importance of this research and lending their
support to engage with the chemical industries. I also thank environmental personnel,
Mr. Azmi Sofah, Mr. Mohd Rashid Gelamdin and Mr. Mohd Fauzi Bashir for their kind
assistance to connect me with the chemical firms. My appreciation also to Dr. Hj. Mohd
Sobhi Ishak, Professor T. Ramayah and Mr. Wafiy Anwary Mustafa for providing
academic materials and comments pertaining to my thesis writing
Lastly, my gratitude to those who provided emotional support during my PhD
journey mainly when my endurance and perseverance was tested. Among them are my
PhD comrade’s especially Aslam, Pendram and Shawn, my students, relatives and
UiTM colleagues. Last, but certainly not least, I want to dedicate this research to my
family. They were my pillar of strength, without them, my entire PhD journey would
not have been possible.
All errors and shortcomings remain my own.
Keshminder Singh Jit Singh
Selangor, Malaysia
viii
TABLE OF CONTENTS
ORIGINAL LITERARY WORK DECLARATION ii
ABSTRACT iii
ABSTRAK v
ACKNOWLEDGEMENTS vii
TABLE OF CONTENTS viii
LIST OF TABLES xiii
LIST OF FIGURES xvi
LIST OF ABBREVIATIONS xix
: INTRODUCTION 1 CHAPTER 1
Background 1 1.1
Environmental Developments in Malaysia 4 1.2
Climate Condition in Malaysia 4 1.2.1
1.2.1.1 Anthropogenic Forcing 7
1.2.1.2 Emissions in the Energy Sector 9 1.2.1.3 Emissions in the Industrial Processes Sector 12
Action Taken by Malaysia- Policy Evaluation 13 1.2.2
1.2.2.1 Policies for the Energy Sector 13
1.2.2.2 Policies for the Industrial Processes Sector 16 1.2.2.3 Policy Transformation: Opportunities and Challenges 18
Problem Statement 23 1.3
Research Questions 25 1.4
Objectives of the Study 26 1.5
Research Philosophy 26 1.6
Research Strategy 28 1.7
Contribution 29 1.8
Organization of the Study 32 1.9
CHAPTER 2 : LITERATURE REVIEW, THEORIES, PRELIMINARY
HYPOTHESIS AND FRAMEWORK 34
Introduction 34 2.1
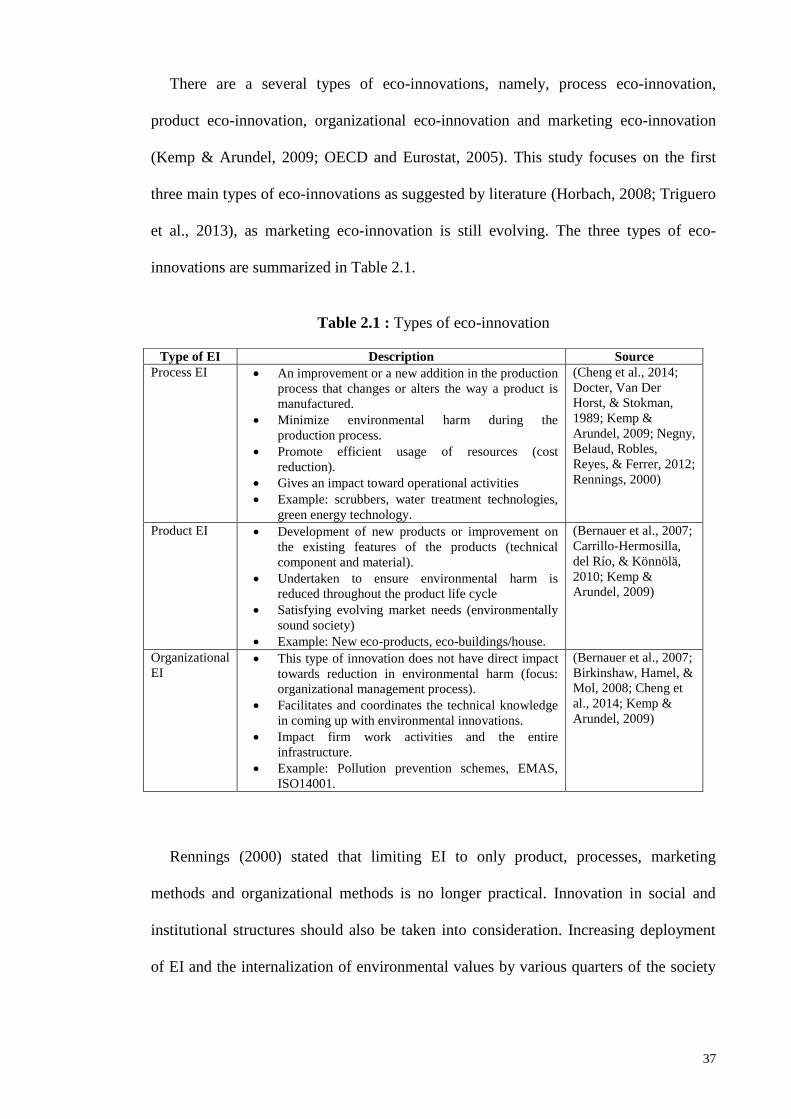
Eco-Innovation 34 2.2
Importance of Eco-Innovation 38 2.2.1
Reasons to Measure Eco-Innovation 41 2.2.2
Theories 43 2.3
Theory of Induced Innovation 46 2.3.1
Porter Hypothesis 46 2.3.2
Evolutionary Economic Theory 47 2.3.3
Resource Based Theory (RBT) & Natural Resource Based View 2.3.4
(NRBV) 48 Dynamic Capabilities Theory 50 2.3.5
ix
Stakeholder Theory 51 2.3.6
Bridging Theories for Eco-Innovation Framework 51 2.3.7
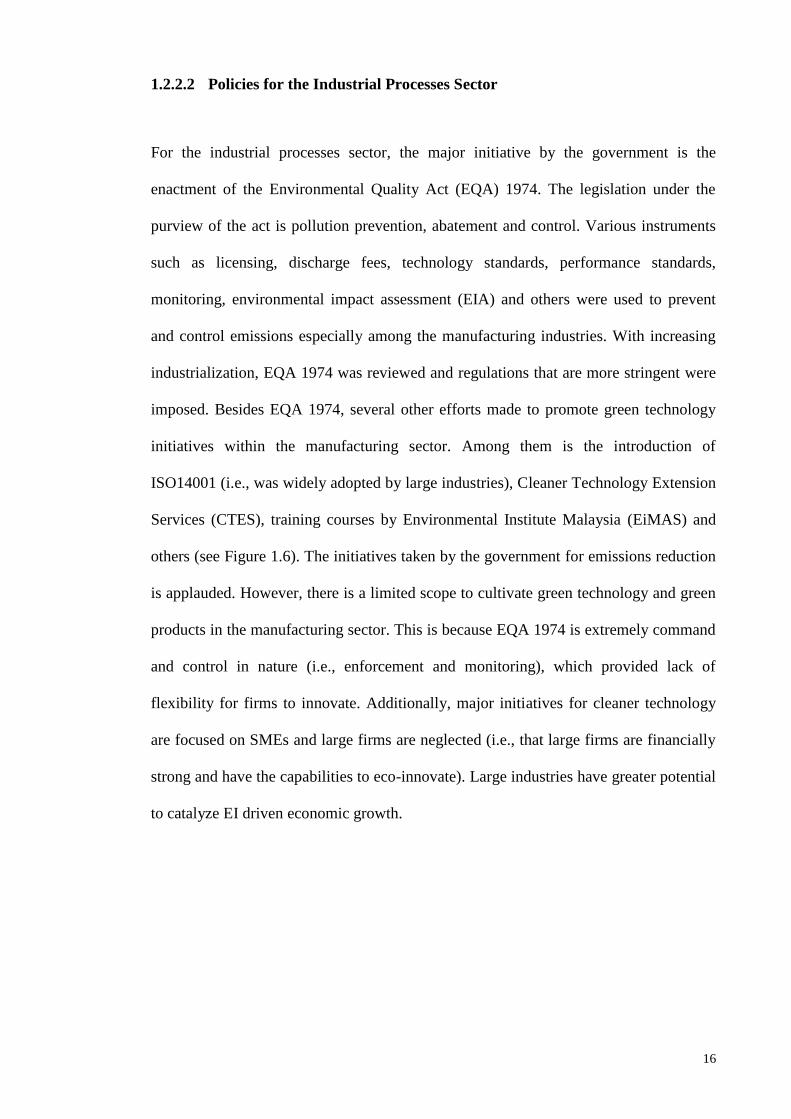
drawback of CAC approach is that once the prescribed technology is adopted, firms
have no further tendency to improve or invest in better technology (Lee et al., 2011).
2.4.1.2 Government Subsidies
Government subsidies provide incentives to firms to embark in EI projects and to
promote energy conservation. Examples of government subsidies are R&D subsidies,
innovation subsidies, tax reductions and energy conservation credits. Research
conducted to examine the positive relationship between subsidy and EI have either
supported (Horbach, 2008; Veugelers, 2012) or the rejected (Horbach et al., 2012;
58
Triguero et al., 2013) this relationship. Reasons for studies that rejected this relationship
is justified by issues highlighted by Popp (2006b) in his paper, which thoroughly
investigated issues related to R&D subsidy. He pointed out that subsidies have the
capability to correct market failures especially related to knowledge market. However,
they are unable to substantially tackle environmental market failures, which
automatically will not influence the adoption of EI. Interestingly, Popp (2006b) showed
that subsidies have the capability to uplift the effects of other policies. Similarly
Veugelers (2012) found that mixing regulation and taxes with subsidies promotes
greater adoption of EI.
2.4.1.3 Regulation Stringency
Environmental regulations that have the strength to circumvent pollution to an optimal
level with the aid of eco-innovations, are embedded with a certain level stringency
(Johnstone et al., 2010). Stringency refers to “how ambitious is the environmental
policy target, relative to the ‘baseline’ trajectory of emission” (Johnstone et al., 2010, p.
6). Using a duration model, Kerr & Newell (2003) investigate the adoption of
technology by 378 U.S oil refineries. Their results indicated that isomerization adoption
(lead phase down in U.S) increases about 40% if stringency of environmental regulation
is raised through tougher performance based standard. Utilizing data from 2008
executive opinion survey as a proxy for stringency and patent to measure eco-
innovation, Johnstone et al. (2012) found that greater regulation stringency has a
positive effect on EI. Researches also found that R&D expenditures for eco-innovations
are intensifies under stringent environmental regulations (Jaffe & Palmer, 1997). In
contrast, the study by Leiter, Parolini, & Winner (2011) indicated that the positive
relationship between environmental regulation and EI diminishes as the regulations gets
stricter. The argument that they put forward is that stringency works in favor of EI as
59
long as the expenditure incurred to comply with the regulation is lower that the
endowed benefits linked to the imposed regulation stringency.
Besides encouraging EI, scholars claimed that stringent environmental regulation
spur several other benefits. Firms under stringent environmental regulation domain have
an absolute advantage over foreign firms who are not constrained by similar
environmental regulations (Porter & Linde, 1995b). Next, countries with stringent
environmental regulations are ahead of others in encouraging environmentally friendly
technology and products. Lastly, stringent environmental regulation are expected to
fasten the process of knowledge spill over, and encourage greater comparative
advantage (Costantini & Crespi, 2008).
2.4.1.4 Environmental Regulation Related Issues
Another two emerging issues related environmental policies that needs attention is the
flexibility and predictability of environmental regulation. Both this issues are discussed
in this section.
2.4.1.4.1 Environmental Regulation Flexibility
Flexibility in environmental regulation has been an important topic of discussion. The
fast changing economic environment makes it very difficult for the government and
firms to project the future direction of EI. Thus, it is demanding for firms to have
greater pollution reduction options. Flexibility in environmental regulation allows firms
to carefully choose the best available EI that is cost effective in reducing optimal level
of pollution (Johnstone et al., 2010; Porter & Linde, 1995b). Lanoie, Laurent-Lucchetti,
Johnstone, & Ambec (2011) investigated the relationship between environmental
60
regulation and EI in seven OECD countries. They found, flexible performance based
standards induced greater EIs, as compared to prescriptive technology based standards.
The finding supports the narrow version of porter hypothesis, i.e. firms innovate when
environmental policies are more flexible as compared to meeting performance
standards.
2.4.1.4.2 Environmental Regulation Predictability
Increasing EI is subjected to a well-planned and designed environmental regulation.
Any uncertainty associated to it causes the firms to postpone their investment into EIs
(Porter & Linde, 1995b; Magat, 1979). An ideal environmental policy should not only
be sufficiently stringent and flexible, but also predictable. Predictability of
environmental regulation is evident when it has the following three features. First, it
should be stable so that it gives investors sufficient time to plan their risky EI
investments. Second, it should be targeted in order to avoid any misallocation of
resources. Third, it should endlessly give incentives for firms to bring down pollution
levels to zero. To induce great EI, government must ensure that environmental polices
are predictable (Johnstone et al., 2010).
2.4.1.5 Summary of Environmental Regulation in Malaysia
Since the implementation of the Environmental Quality Act (EQA) 1974, Malaysia has
being giving a serious consideration on environmental issues. Environmental actions
taken by the government were initiated through various avenues such as specific
environmental policies, during every five years Malaysia Plans and government annual
budgets plans. Over the years, actions to solve environmental issues have revolved
around specific aspects. During the earlier years the focus has been on strengthening of
61
the EQA 1974 and reducing the high dependence on non-renewable resources for
electricity generation. Later the attention shifted to promoting green energy sources,
which was catalyzed by green energy technologies. In more recent years, while focusing
on promoting RE and EE other sectors such as the construction, automotive and
agriculture were given attention in terms of sustainable production. Currently, the
government is in the verge promoting green technology among a wider spectrum of
sectors and in tends to catalyze green technology driven economy growth in the future.
The environmental polices and actions undertaken in Malaysia right from 1974 till date
is summarized in Table 2.3.
61
Table 2.3: Summary of environmental policies and initiatives in Malaysia Policy/Initiatives
Environmental Quality Act (EQA) (1974)
- Legislation under the purview of the Act is prevention, abatement and control of pollution. The Department of Environment Malaysia (DOE) handles the
enforcement of this act.
- Main area of the regulations: Agro-based water pollution, municipal and industrial wastewater pollution, industrial emissions, motor vehicle emissions, toxic and
hazardous waste management and environmental impact assessment (EIA).
Third Malaysia Plan (1976-1980)
- Government acknowledged that environmental issues needs serious attention.
- Progressively environmental concerns incorporated into development plans
National Petroleum Policy (NPP) (1975)
- Petroleum Regulation 1974 used to regulate the downstream oil and gas activity. This policy intends to promote greater nation control over the petroleum industry
and increase the efficient utilization of petroleum resources.
National Forestry Policy (NFP) (1992)
- NFP is in accordance to the call from the global community for the sustainable utilization and conservation of biological diversity. The four main functional forest
themes of the policy are protection, production, amenity and research and education.
- NFP initiatives are under the preview of Forestry Department Peninsular Malaysia.
National Energy Policy (NEP) (1979)
- Supply, utilization and environmental are three main pillars of NEP. Under the first pillar, indigenous energy resources from non-renewable and renewal energy
resources developed with the best cost-effective options are supplied, which it both adequate and secure for the nation. The second pillar aims to promote efficient
utilization of energy resource and eliminate wasteful energy consumption. Lastly, the environmental pillar deals with minimizing the adverse impact of energy
usage towards the environment.
National Depletion Policy (NDP)(1980)
- Increasing exploitation of domestic oil and gas reserves evoked the introduction of the NDP to extend the lifespan these reserves. Under the policy, a cap of
6500,000 barrel per day on oil production was imposed (except condensates and natural gas liquids).
- Several years later, this policy avenue was used to impose a cap of 2 billion standards cubic feet per day on natural gas reserves.
Fourth Malaysia Plan (1981-1985)
- Environmental awareness through greater access to information.
- Large R&D investments in palm oil and rubber processing industries promoted indigenous technology treatment technology and increase compliance with
increasing stringent standards.
- Environmental Quality (Sewage and Industrial Effluent) Regulation, 1979 came into force in 1981. The manufacturing industries manage to reduce Biochemical
Oxygen Demand (BOD) by 60% (i.e., through licensing system).
- The responsibility to handle solid waste disposal and toxic and hazardous waste management was given to the local authorities.
- Industries installed pollution control devices (technology standards) with the enforcement of Environmental Quality (Clean Air) Regulation, 1978.
- ASEAN Environmental Programme (ASEP) II (1983-1985).
62
Table 2.3 : Summary of environmental policies and initiatives in Malaysia-continue Policy/Initiatives
Four Fuel Diversification Policy (FFDP) (1981)
- FFDP is an addition to the NEP to reduce over dependence on oil, primarily in the electricity generation sector. The strategy was to promote energy supply mix,
which consists of hydropower, natural gas, coal and oil.
- The diversification was necessary to ensure reliability and security of energy supply in the long run by balancing the usage of oil, gas, hydro and coal. This policy is
revised periodically to avoid the countries over dependence one particular energy source, especially due to 1973 and 1979 oil crisis.
Fifth Malaysian Plan (1986-1990)
- Six types of facilities that required licensing was identified under the Environmental Quality (Scheduled Wastes) Regulations, 1989 (i.e., off-site storage, off site
recovery facility, treatment facilities, schedule waste incinerators, secured landfills and land treatment facilities).
- Government provided tax and other forms of incentives to encourage companies to built facilities for the storage, treatment and disposal of waste.
- Formal environmental education and awareness-UPM & UTM introducing degree courses such as pollution control, environmental management, and environmental
control technology.
- ASEAN Environmental Programme (ASEP) III (1988-1991).
Sixth Malaysia Plan (1991-1995)
- The Malaysian Institute for Nuclear Technology Research (MINT) development techniques for radioactive waste disposal.
- $40.35 million allocated to DOE to carry out research as well as implement projects for the betterment of the environment.
- Town and Country Planning Department (TCPD)-provide advisory service to improve the environment through landscaping
- Initiation of the National Biodiversity Committee in 1994 to protect the biological resources.
- Standards and Industrial research Institute of Malaysia (SIRIM) conducted cleaner technology programmes for SMEs.
- Business Council for Sustainable Development Malaysia (BCSDM) was set up to promote environment-friendly businesses.
- Commission of Sustainable Development (CSD) monitored Agenda 21 (i.e., voluntary action plan, which is an outcome of United Nations Conference on
Environment and Development (UNCED) held in Rio, Brazil, in 1992).
- Malaysia committed to several international conventions: (1) the Framework Convention on Climate Change (FCCC), (2) the Convention of Decertification (3) the
Convention on Biological Diversity, (4) the Hazardous Waste and Their Disposal Basil Convention on Transboundary Movement of Toxic and, and (5) the
RAMSAR Convention.
- In line with Montreal Protocol, strategy for the reduction of Ozone Depleting Substances was structured.
63
Table 2.3 : Summary of environmental policies and initiatives in Malaysia-continue Policy/Initiatives
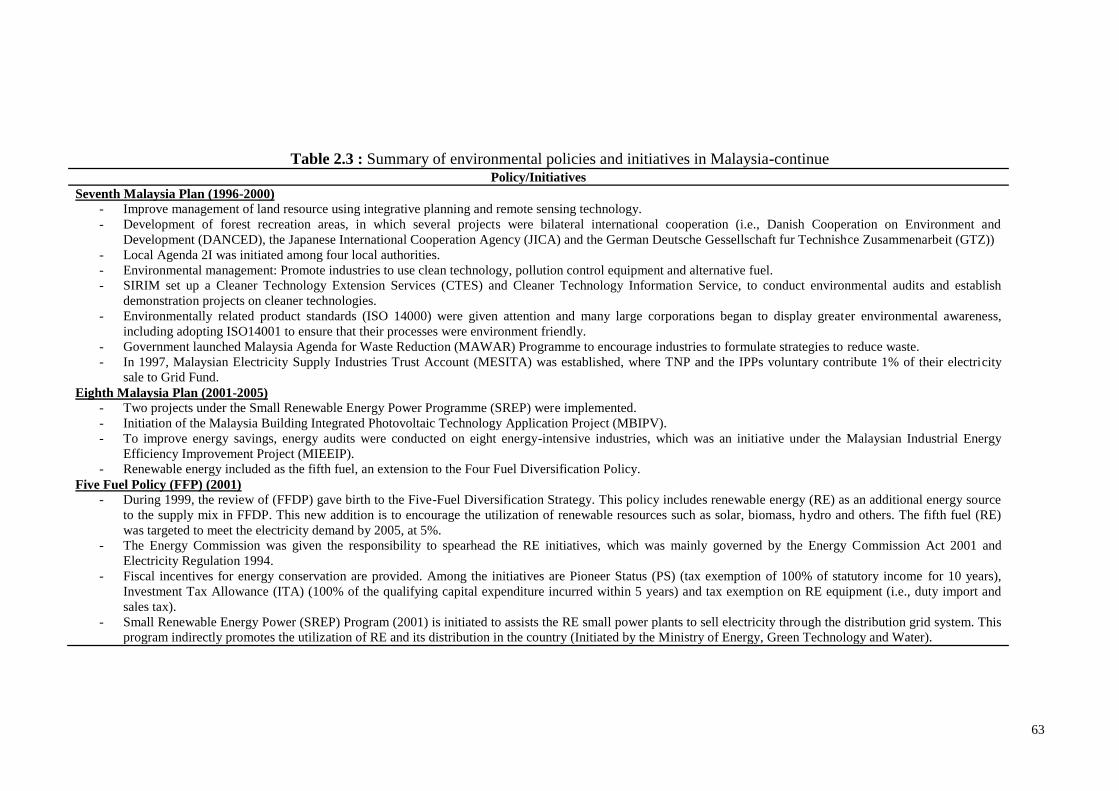
Seventh Malaysia Plan (1996-2000)
- Improve management of land resource using integrative planning and remote sensing technology.
- Development of forest recreation areas, in which several projects were bilateral international cooperation (i.e., Danish Cooperation on Environment and
Development (DANCED), the Japanese International Cooperation Agency (JICA) and the German Deutsche Gessellschaft fur Technishce Zusammenarbeit (GTZ))
- Local Agenda 2I was initiated among four local authorities.
- Environmental management: Promote industries to use clean technology, pollution control equipment and alternative fuel.
- SIRIM set up a Cleaner Technology Extension Services (CTES) and Cleaner Technology Information Service, to conduct environmental audits and establish
demonstration projects on cleaner technologies.
- Environmentally related product standards (ISO 14000) were given attention and many large corporations began to display greater environmental awareness,
including adopting ISO14001 to ensure that their processes were environment friendly.
- Government launched Malaysia Agenda for Waste Reduction (MAWAR) Programme to encourage industries to formulate strategies to reduce waste.
- In 1997, Malaysian Electricity Supply Industries Trust Account (MESITA) was established, where TNP and the IPPs voluntary contribute 1% of their electricity
sale to Grid Fund.
Eighth Malaysia Plan (2001-2005)
- Two projects under the Small Renewable Energy Power Programme (SREP) were implemented.
- Initiation of the Malaysia Building Integrated Photovoltaic Technology Application Project (MBIPV).
- To improve energy savings, energy audits were conducted on eight energy-intensive industries, which was an initiative under the Malaysian Industrial Energy
Efficiency Improvement Project (MIEEIP).
- Renewable energy included as the fifth fuel, an extension to the Four Fuel Diversification Policy.
Five Fuel Policy (FFP) (2001)
- During 1999, the review of (FFDP) gave birth to the Five-Fuel Diversification Strategy. This policy includes renewable energy (RE) as an additional energy source
to the supply mix in FFDP. This new addition is to encourage the utilization of renewable resources such as solar, biomass, hydro and others. The fifth fuel (RE)
was targeted to meet the electricity demand by 2005, at 5%.
- The Energy Commission was given the responsibility to spearhead the RE initiatives, which was mainly governed by the Energy Commission Act 2001 and
Electricity Regulation 1994.
- Fiscal incentives for energy conservation are provided. Among the initiatives are Pioneer Status (PS) (tax exemption of 100% of statutory income for 10 years),
Investment Tax Allowance (ITA) (100% of the qualifying capital expenditure incurred within 5 years) and tax exemption on RE equipment (i.e., duty import and
sales tax).
- Small Renewable Energy Power (SREP) Program (2001) is initiated to assists the RE small power plants to sell electricity through the distribution grid system. This
program indirectly promotes the utilization of RE and its distribution in the country (Initiated by the Ministry of Energy, Green Technology and Water).
64
Table 2.3 : Summary of environmental policies and initiatives in Malaysia-continue Policy/Initiatives
National Environmental Policy (NEP) (2002)
- NEP is in accordance to eight principles to coordinate economic development with environmental concerns. The principles are (1) stewardship of the
environment, (2) conservation of nature’s vitality and diversity, (3) continuous improvement in the quality of the environment, (4) sustainable use of natural
resources, (5) integrated decision-making, (6) the role of the private sector, (7) commitment and accountability and (8) active participation in the international
community.
- The Division of Environmental Management and Climate Change (BPASPI) under the Ministry of Natural Resources is accountable for initiatives executed under
the NEP and NCCP.
Ninth Malaysia Plan (2006-2010)
- Greater weight on RE initiatives to ensure the country is in line with the sustainable development agenda.
- In government procurement, green products and services that meets the green standards a given priority.
- Develop Cyberjaya and Putrajaya and the pioneer green technology townships.
- Launch of Green Building Index (GBI) and certification.
- Increase participation in CDM projects and income generated from CER trading will be tax exempted.
- The structuring of Ministry of Energy, Green Technology and Water.
- The setting of Green Technology Corporation to oversee the financing of green technology initiatives. National Biofuel Policy (NBP) (2006)
- The main objective of NBP is to cultivate RE as perpetuated by other energy policies. The strategic thrusts of the policy are (1) biofuel for transport sector, (2)
biofuel for industrial sector, (3) biofuel technologies, (4) biofuel for export sector, and (5) biofuel for cleaner environment.
- B5 diesel, which is a Mix of 5% processed palm oil with petroleum diesel, is used in the transport and industrial sector.
- The National Biofuel Industry Act 2007 regulates the biofuel industry in Malaysia.
National Green Technology Policy (NGTP) (2009)
- NGTP was laid with the quest to promote growth with sound environmental consideration, as proposed by National Outline Perspective Plan. Among the four pillars
of the policy are (1) seek to attain energy independence and promote efficient utilization; (2) conserve and minimize the impact on the environment; (3) enhance
the national economic development through the use of technology; and (4) improve the quality of life for all.
- Biomass-based Power Generation and Cogeneration the Palm Oil Industry (BioGEN) (2002): Biomass-based power generation biomass and biogas waste from palm
oil mill (project executed by Ministry of Energy, Green Technology and Water (KeTTHA)).
- The formation of various labeling and certification: Eco Labeling, MyHIJAU Mark, Energy Efficient Labeling Scheme and Water Efficient Product Labeling
Scheme
- Centre for Education and Training in Renewable Energy and Energy Efficiency (CETREE) is an initiative to provide RE and EE awareness to the public especially
in schools, universities and through textbooks and competitions.
- In 2009, Green Technology Financing Scheme was established with an initial budget of 1.5 billion.
- Establishment of the National Green Technology and Climate Change Council.
65
Table 2.3 : Summary of environmental policies and initiatives in Malaysia-continue Policy/Initiatives
National Climate Change Policy (NCCP) (2009)
- NCCP is based on the following principles: (1) development on a sustainable path, (2) conservation of environment and natural resources, (3) coordinated
implementation, (4) effective participation, and (5) common but differentiated responsibilities and respective capabilities.
New Economic Model (NEM) and Transformation Programme (2010)
- NEM is executed to transform Malaysia into a high-income country by year 2020.
- The mission of NEM is to embrace development that is sustainable both in terms of economy and environment.
National Renewable Energy Policy and Action Plan (NREPAP) (2010)
- NREPAP was introduced to proliferate the utilization of indigenous RE resources through effective management of RE resources and human capital, and active
institutional involvement.
- The five thrust of NREPAP are (1) introduce appropriate regulatory framework, (2) provide conducive environments for RE businesses, (3) intensify human capital
development, (4) enhance RE research and development and design, and (5) implement an RE advocacy programme.
- Two important nexus related to NREPAP are Renewable Energy Act legislated in 2011 and the Sustainable Energy Development Authority (SEDA).
- SEDA is given the mandate to implement the Feed-in Tariff mechanism (FiT) in the country. The initial impetus of FiT started when Malaysian Building Integrated
Photovoltaic Project (MBIPV) (2005) project was introduced.
Tenth Malaysia Plan (2011-2015)
- The Tenth Malaysia Plan focuses on advancing the utilization of RE in the country. The climate resilient strategy was two-dimensional: firstly, adjustment
techniques to shield the country from the effects of environmental change; and also, relief methodologies to diminish GHG outflows.
- The Renewable Energy Act 2011 assisted the Feed-in Tariff (FiT) implementation. Under the Act, Sustainable Energy Development Authority (SEDA) was set up
to spearhead the FiT projects.
- In 2013, Increase EE by imposing Minimum Energy Performance Standards (MEPS) for domestic appliances
- Entry Point Projects (EPP) to increasing the solar power capacity and to tap hydroelectricity was executed.
- To reduce emission from the transport sector two major projects were implemented, Kuala Lumpur Light Rail Transit (LRT) and Mass Rapid Transit (MRT)
system.
- The implementation of the Reduce, Reuse, Recycle (3R) programme for better waste management.
- In 2011, National Steering Committee on REDD+* (NSCREDD) was initiated to structure directions and strategies for REDD+ establishment. *REED+: Reducing
Emissions from Deforestation and Forest Degradation, and the Role of Conservation, Sustainable Management of Forests and Enhancement of Forest Carbon Stocks
in Developing Countries
Eleventh Malaysia Plan (2016-2020)
- The pursuit of environmental protection is at a greater scale under the Eleventh Malaysia Plan, which aims to foster green growth for sustainability and resilience.
- The aim is to be achieved through a framework that takes into account resource-efficiency, low-carbon and social-inclusion for every aspect of investment incurred
to develop the country. RE and EE is definitely the core of the framework for long-term sustainability.
- There are four key areas
66
Table 2.3 : Summary of environmental policies and initiatives in Malaysia-continue Policy/Initiatives
National Agro-Food Policy (NAFP) 2011
- NAFP is a 10-year policy plan that effectively replaced the National Agriculture policy on 28 September 2011. Among the main objectives of the policy are to (1)
ensure adequate food supply and food safety, (2) develop the agro-food industry into a competitive and sustainable industry, and (3) increase the income level of
agricultural entrepreneurs. The new policy emphasizes on sustainable agriculture development as the main key thrust.
- The Malaysian Organic Scheme (MyOrganic) (2007): Certification for organic farms.
- Malaysian Good Agricultural Practices (MyGAP) (2013): Certification scheme for agricultural, aquaculture and livestock sector (i.e., the product should be of good
quality and save and aspect of environment is taken into consideration).
National Policy on Biological Diversity (NPBD) (2016-2015)
- The first NPBD was formulated in 1998. However, increasing population and economic activity over the years have imposed a huge threat to the biodiversity.
- In 2016, NPBD (2016-2025) was introduced with a better biodiversity protection framework and a detail action plan. The five revised principles are (1) biological
diversity is national heritage-managed wisely, (2) precautionary-measures to significantly minimize loss of biodiversity, (3) shared responsibility-conservation and
sustainability of biodiversity is a shred responsibility, (4) participatory-planning and management of biodiversity in participatory manner, and (5) good governance-
transparency in biodiversity conservation.
Note: The information is based on author’s own readings and collection of information from various resources. Information under the Malaysia Plan is according to the initiative that
were conducted during the tenure of the plan rather that the proposed initiatives during the tenure. Initiatives that had incomplete information (i.e., responsible ministry or agency)
were placed according to the most related policy or Malaysia Plan.
Source: Compiled from various reports and articles (Aldover & Hun-Yang, 2010; EPU, 2006, 2011b; GOM, UNDP, & GEF, 2011; a. a. Hezri & Nordin, 2006; Hezri & Hasan,
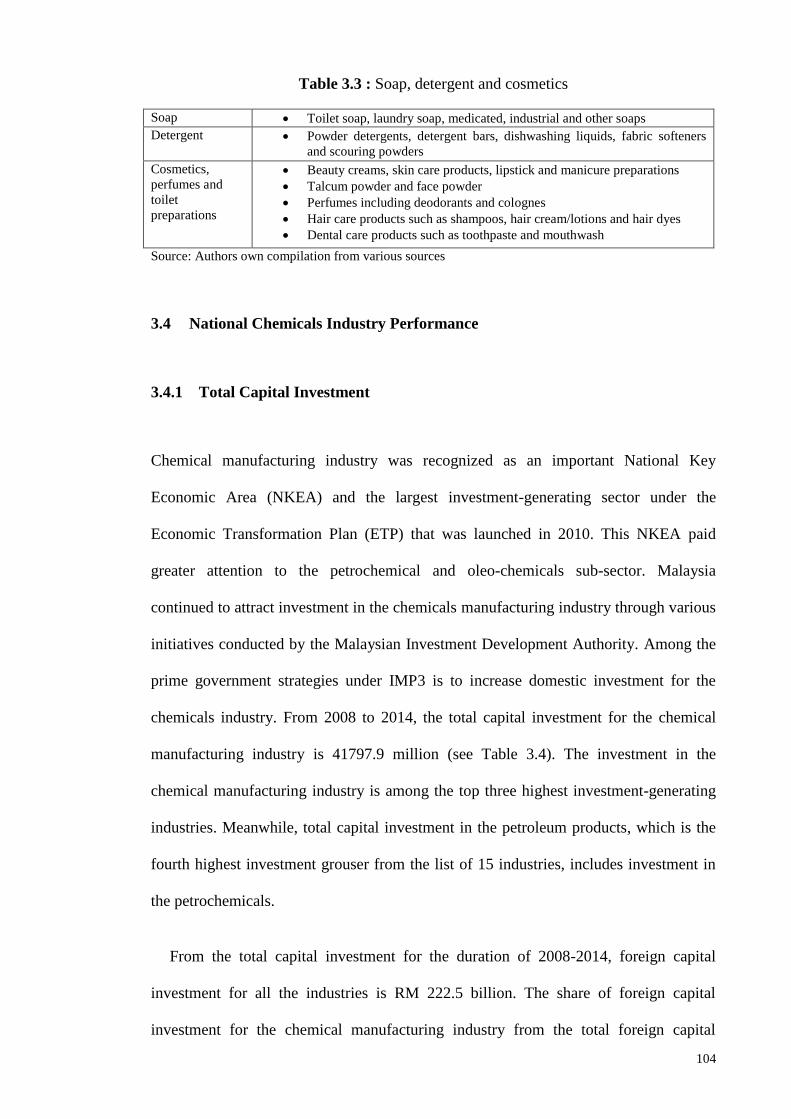
In similar years, the share of ole-chemicals exports was around 20%, which included
major ole-chemicals such as industry fatty alcohols, palm fatty acids distillates, stearic
acid, soap noodles and acetic acid. Furthermore, the exports of all major petrochemicals
and ole-chemicals increased from 2013 to 2014 (see Figure 3.9). The main demand for
petrochemicals is from China, India and Indonesia. While the major demand for oleo-
chemicals is from China, United States of America, India, Netherland and Singapore.
For the chemicals and chemical product export as a whole, the main export market is
China, Singapore, Indonesia, Thailand and India. The primary import market is China,
Singapore, United States of America, Japan and Indonesia.
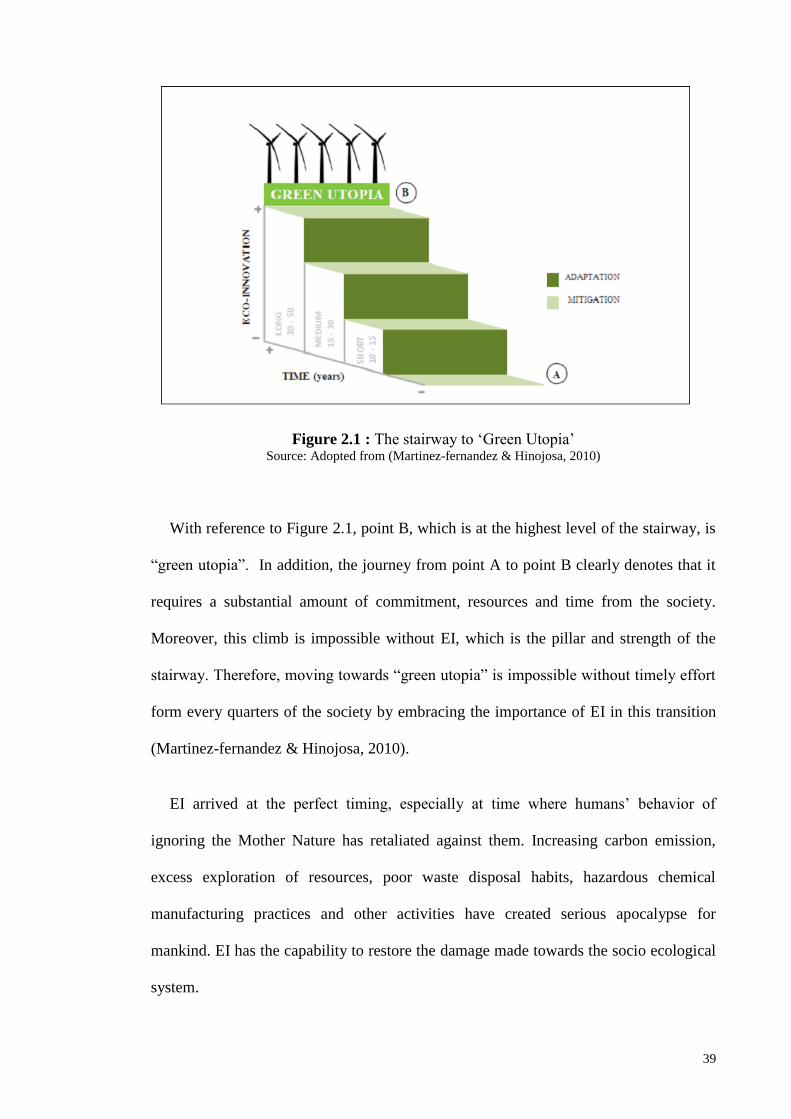
Figure 3.9 : Major exports of petrochemicals and oleo-chemicals (2013-2014) Source: Adopted from MATRADE (2014)
1416.4
1176.4 1219.9
962.6
484.2
1644.2
1334.8 1303.1
1097.3
740.2
Industy fatty
alcohols
Palm fatty acid
distillates
Stearic acid Soap noodels Acetic acid
Major exports of Oleochemical products (RM
Million)
2013 2014
156.3
1042.4
565.1
1749
1306
626.4
Polymers of ethylene in
other forms
Methanol Saturated polyesters, in
primary forms
Major exports of Petrochemical products (RM
Million)
2013 2014
110
Gross Output, Value Added, Employment and Income 3.4.3
In the Malaysian economy, the manufacturing sector remains the second largest sector,
with a total GDP contribution of RM 205 billion in 2014. The sector recorded a GDP
growth of 6.2% in 2014 as compared to 3.5% in 2013. Among the manufacturing sub-
sectors, chemicals and chemical products were the third largest contributor to an added
value of 10.9%, headed by the electronics & electrical and refined petroleum products
with a contribution of 25.7% and 12.7% respectively (see Figure 3.10).
Figure 3.10 : Added value contribution of selected manufacturing sub-sectors, 2014
Source: Adopted from MPC (2015)
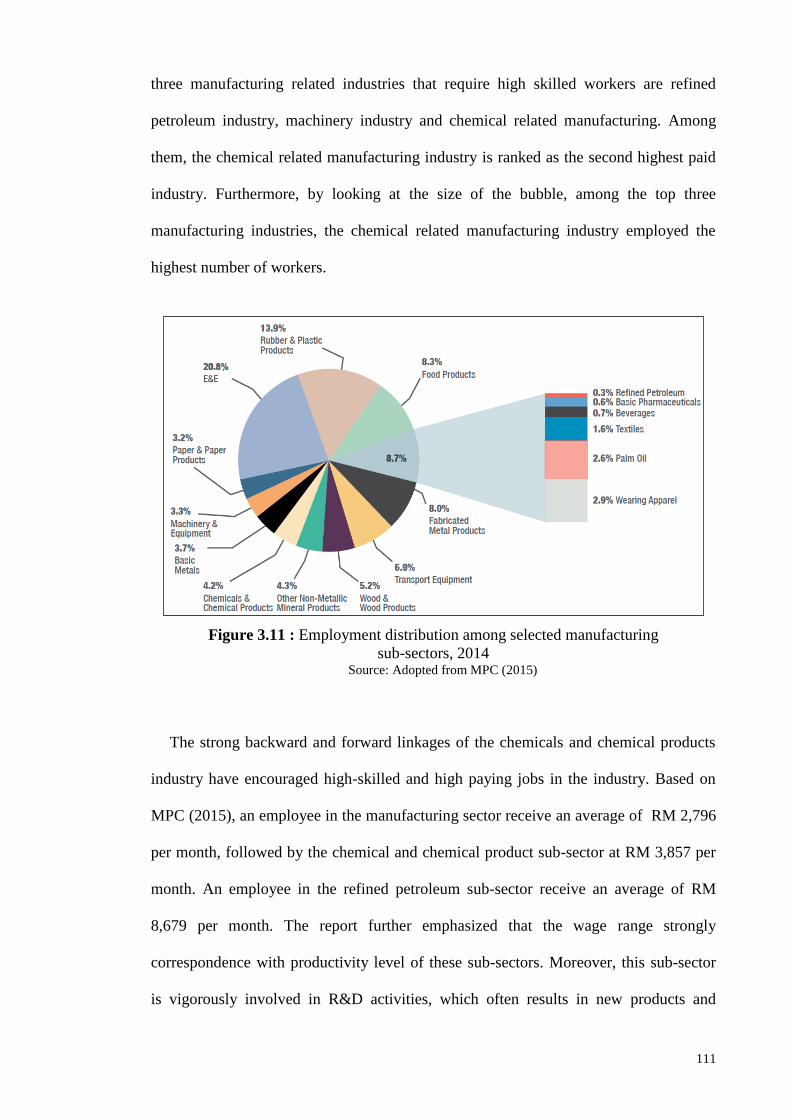
On the employment frontier, in 2014, the total manufacturing employment was 2.3
million, which accounted for 16.5% of the total Malaysian workforce. The employment
in the chemicals and chemical products sub-sector was 4.2% of the total employment in
the manufacturing sector (see figure 3.11). Even though the sub-sector has a small share
of employment, but it is among the highest paid sub-sectors. Figure 3.12 provides a
snapshot of the relationship between the share of high-skilled jobs and average wage
across industries in Malaysia. By looking carefully at the manufacturing cluster, the top
111
three manufacturing related industries that require high skilled workers are refined
petroleum industry, machinery industry and chemical related manufacturing. Among
them, the chemical related manufacturing industry is ranked as the second highest paid
industry. Furthermore, by looking at the size of the bubble, among the top three
manufacturing industries, the chemical related manufacturing industry employed the
highest number of workers.
Figure 3.11 : Employment distribution among selected manufacturing
sub-sectors, 2014 Source: Adopted from MPC (2015)
The strong backward and forward linkages of the chemicals and chemical products
industry have encouraged high-skilled and high paying jobs in the industry. Based on
MPC (2015), an employee in the manufacturing sector receive an average of RM 2,796
per month, followed by the chemical and chemical product sub-sector at RM 3,857 per
month. An employee in the refined petroleum sub-sector receive an average of RM
8,679 per month. The report further emphasized that the wage range strongly
correspondence with productivity level of these sub-sectors. Moreover, this sub-sector
is vigorously involved in R&D activities, which often results in new products and
112
production technology, thus contributing to higher wage demand. Employment in the
chemicals and chemicals products sub-sector is centered on highly skilled workforce
comprising of technical professionals, such as scientist, engineers and specialized
technicians.
Figure 3.12 : Positive relationship between share of high-skilled jobs and average
wage per worker Source: Adopted from BNM (2015)
Chemical Manufacturing Industry in Selangor 3.5
Investment in the Chemical Manufacturing Industry 3.5.1
The state of Selangor is the top investment destination in Malaysia primarily due to its
strategic location, which is within the central area of the Klang Valley region. This
strategic positioning provides industries a favorable access to every region and
industrial areas/parks in Malaysia. Additionally, with reference to Figure 3.13, there are
several other key benefits that Selangor has to offer such as excellent infrastructure and
connectivity, access to wide supply of industrial property, large pool of skilled
workforce, established data centers and technology parks. Furthermore, to ease the
113
process of investment in Selangor, a premier investment agency known as Invest
Selangor Berhad (ISB) was established. The purpose of this agency is to assists
potential and existing investor, by providing firsthand information and advisory services
to conduct businesses in Selangor.
Figure 3.13 : Key benefits to invest in Selangor Source: Adopted from ISB (2013)
In 2015, the total capital investment in the chemical manufacturing industry for the
Selangor region was RM 652.8 million (see Figure 3.14). This sub-sector is among the
top ten total capital investment-grossing sub-sectors in Selangor. Malaysia is the next
destination for investment in chemicals in ASEAN after Europe and The United States
due to its strong distribution network and continuous development in the sub-sector.
Understanding the future potential of the chemicals sector, the ISB is in the stage of
completing the Selangor Industrial Master Plan (SIMP). The SIMP is expected to
provide more comprehensive plan for the chemical industry. Under the SIMP, special
attention is given to specialty chemicals, as other industries are also dependent.
Additionally, based on the global demand, there is a vast scope for specialty chemicals
114
industry to expand in the future (S. Schneider, personal communication, October 8,
2015)6
Figure 3.14 : Top 10 Approved Investments in Manufacturing Projects by Industry,
Selangor, 2015 Note: C&C=Chemical and chemical, E&E=Electrical and electronics
Source: Adopted from ISB (2015)
Landscape of Chemical Manufacturing Firms 3.5.2
Chemicals and chemical products manufacturing firms are widely located across
Malaysia. Figure 3.15 presents the state distribution of chemical firms according to their
share of sales revenue. From the total sales revenue of RM58420 billion, Selangor has
the largest share at 35.8%, followed by Johor and Pulau Pinang with a share of 13.1%
and 12.5% respectively. In comparison between the aforementioned three states, there is
a huge difference between the percentages of sales revenue held by Selangor as
compared to the other two states. Besides, the abovementioned states, other
states/federal territories have relatively much smaller shares. Therefore, based on the
6To obtain better insights of the chemical manufacturing industry in Selangor an interview was conducted
with Sven Schneider, the Head of Corporate Communication and Strategic Planning Division from Invest
Selangor Berhad (ISB). The interview was conducted on the 8 October 2015 at 10.30am in ISB Shah
Alam, Selangor.
115
share of total sales revenue, Selangor is the largest chemical manufacturing state in
Malaysia.
Figure 3.15 : Distribution of chemical and chemical product manufacturing firms
according to state based on their total sales revenue Note: The statistics are based on author’s own computation. Sales revenue figure were obtained from the
Companies Commission of Malaysia in 2014. Total number of chemicals and chemical products
manufacturing firms = 573. Others include federal territory of Labuan, Perlis, Kelantan and Melaka.
Source: Authors own computation using data obtained from Companies Commission of Malaysia
To further understand the distribution of chemical manufacturing firms within the
chemicals industry, firms in each states/territories were divided according to the 10
chemicals industry sub-sectors (see Figure 3.16). Based of the figures, majority of the
specialty chemicals manufacturing firms are located in Selangor. The firms are from the
“The stock of knowledge is used by managers and technical teams to expedite their
projects…for example, increasing the energy efficiency” (Respondent A4)
The interaction with the responds in exploring the determinant environmental
knowledge did not indicate any direct relationship with EI. The environmental knowledge
from firm’s perspective is resources that enable them to train their employees, boost firms
environmental awareness and generate strategies to solve environmental problems.
5.3.1.1.1 Environmental Knowledge Channels
Firms indicated that there are several channels used to access environmental knowledge.
The leading channel is their group8 (See Figure 5.1). The group has a structured and robust
database, which provides both paramount technical and non-technical information to the
firms.
“The information here is centralized. Professional and technical expertise is
available in the group.” (Respondent A2)
8 The group centralized by the headquarters, consists of business units, subsidiaries, joint ventures, global partners and important
affiliates.
157
“All the information obtained from the group, which has a structured system to
collect and store information. All the technical information is from the group.”
(Respondent A5)
“Group provides all the critical information.” (Respondent A4)
Research, conferences, exhibitions, peers and suppliers are another set of key avenues
where firms obtain their environmental information. It is important to note that suppliers
are the main external party that firms frequently interact. Moreover, said the external
parties have the relevant information that the firms need especially technology related.
“We always deal with suppliers. These people are very important for us because
they provide us information on the latest technology available.” (Respondent A3)
“Suppliers have all the information. When it comes to business, we cannot run away
from them. They always bring their booklets and brochure…mostly technology
related information. From them we get to know exhibitions that are taking place.”
(Respondent A4)
Other active channel is the DOE/DOSH, which provides more regulatory and
environmental compliance information and followed by experts, who provide professional
advice through casual discussions or consultancy services. The last medium is through
online search carried out independently.
158
Figure 5.1 : Information channels Note: Total number of firms interviewed = 6 (6 respondents). Data generated from the interviews.
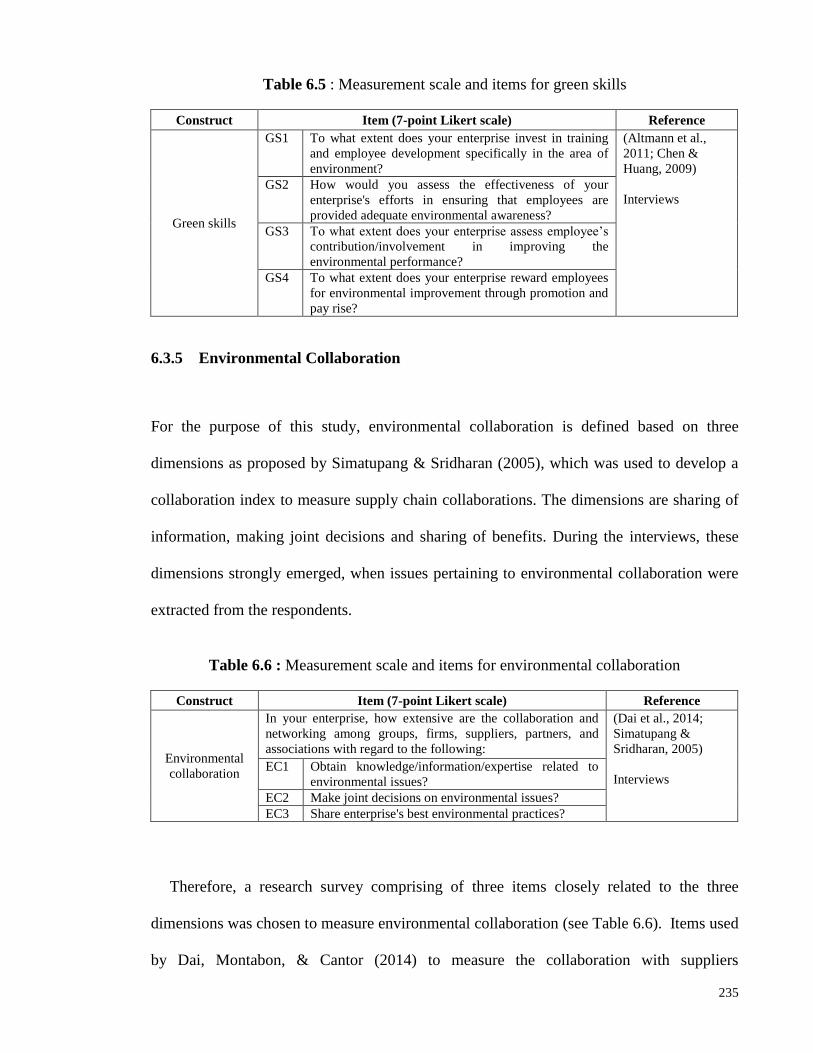
5.3.1.2 Environmental Collaboration
Firms recognize collaboration as an important channel to groom employees and formulate
environmental strategy. This is possible because collaboration creates opportunities for
firms to venture into training employees and to structure environmental strategy. Among
the opportunities created are wider network, which allows better understanding of
environmental issues that are taking place globally and solutions to tackle these
environmental issues. Next, it provides an easy route for firms to find immediate solution
through best practices and meaningful information shared by others, which saves time and
money. Furthermore, collaborations allow benchmarking among peers, through which firms
gauge their current environmental commitments to improve their competitive position.
“Networking/collaboration widens our horizon because firms either from local or
international platform have a different way of solving their environmental issues.
Sharing best practices among organizations is trending nowadays, which, is a noble
deed. This initiative can bridge the gap between know-what and know-how.”
(Respondent A3)
0 1 2 3 4
Internet
Experts
DOE/DOSH
Suppliers
Peers
Research
Conference/Exhibition
Group
Number of firms responded
Info
rma
tio
n c
ha
nn
els
159
“Through collaboration we benchmark ourselves, to see where we stand and what
can we do to improve. The information that we obtain helps us to strategize.
Organizations cannot side line the environment anymore, it has to be part of their
main goals, especially to survive in the current business settings.”(Respondent A4)
“To build trust, collaboration and networking is very important. This trust in
return, eases the process of sharing resourceful knowledge and expertise. Solving
environmental problem has to be through a collaborative effort as we are able to
influence as many parties as possible to adopt sustainable manufacturing
practices.” (Respondent A1)
Table 5.6 : Reasons and outcomes of collaboration
Reason for collaboration Number of firms
responded
Outcome
Information/Knowledge √√√√√√ -Training modules
-Technology updates
Expertise √√√√ -Impetus of green products
-Strategic environmental planning
Sharing best practices √√√ -Fast solution (save cost, time & resources)
-Being socially responsible
Benchmarking √ -Keep up with recent green changes & progress
-Self-evaluation compared to peers
Influence √ -Increase in power of persuasion. Convincing top
management to undertake environmental projects
Note: Total number of firms interviewed = 6 (6 respondents). Data generated from the interviews.
The opportunities discussed above assisted firms to create training modules for
employees. There is a lot of rigor in these modules as it is the outcome of resourceful
knowledge accumulated from the sharing of best practices, expert opinions and
benchmarking with peers. Next, these opportunities provided avenues for firms to design
their environmental strategies with reference to the current scenario of environmental
issues. Designing these strategies was much easier as there are ample solutions to mitigate
environmental problems and information on the latest eco-innovations. Finally,
collaboration increased the motivation of the firms to be environmentally responsible.
Table 5.6 summarizes five main reasons for firms to collaborate, including the outcome of
those collaborations.
160
In addressing the environmental problem, environmental collaboration proved to be an
essential resource provider for green skills development and environmental strategy
formulation. The interview data did not provide any clue on the direct link between
environmental collaboration and EI.
5.3.1.2.1 Collaborating Parties
Figure 5.2 encapsulates main parties that firms are collaborating/networking. The largest
collaboration/networking is within the firm’s groups, which are their subsidiaries, joint
ventures, global partners and affiliates. The other collaboration is with associations, such as
CICM9, FMM
10 and IPIECA
11, and followed by government and suppliers. Lastly, one
organization acknowledged that they work with NGO, which is Blue Earth.
Figure 5.2 : Firms collaboration and networking parties
Note: Total number of firms interviewed = 6 (6 respondents). Data generated from the interviews.
9 Chemical Industries Council of Malaysia (CICM) 10 Federation of Malaysian Manufacturers (FMM) 11 The global oil and gas industry association for environmental and social issues (IPIECA)
0 1 2 3 4 5 6
NGO
Suppliers
Government
Associations
Group
Number of firms responded
Co
lla
bo
rati
on
/n
etw
ork
ing
p
art
ies
161
5.3.1.3 Green Skills
In the context of achieving environmental agenda, firms have given a lot of attention in
providing green skills to their employees. Creating awareness and providing trainings, have
been the gateway for firms in providing green skills to their employees. Firms use the
interaction of three mechanisms to create awareness and provide green skills to their
employees, which are collective effort, self-realization, and continuous awareness.
Collective effort mechanism transpires when top management, department heads and
employees are engaged together through several avenues such as workshops and
environmental meetings. During this workshops and meetings, all three parties make
decisions and conduct activities collectively. This mechanism strengthens the bonding and
increases the trust among the member of the firm, which accelerates the firm’s
environmental commitment level. At the same time, environmental issues that require
urgent attention enforcement is swiftly done through this collective mechanism.
Self-realization mechanism was used to instill the need for green skills and environment
commitment voluntarily. Community engagement programs and problems based tasks were
used to inculcate responsibility towards the society. Problem based task was used to place
employees in actual situations where there are constrained by environmental issues and are
required to search for solution to those problems. This mechanism automatically keeps the
employees alert at all time.
Finally, constant information sharing via info TV (i.e., information sharing on television
within the firms compound) and environmental programs especially ‘Responsible care’
campaigns was initiated under the continuous awareness mechanism.
162
“We create awareness mainly by sharing information and continuously updating
the employees with the latest changes that are taking place. Our motto here is ‘eco-
together’, so anything that we do in our organization is a collective effort.”
(Respondent A4)
“Under ‘Responsible Care’, promoting awareness is one of the important code. We
believe that once employees understand their responsibility towards the
environment then everything will automatically fall into place. Yearly, employees
have to identify 12 problems in the plant that are hazardous and must write a report
with solutions to those problems. We do this to educate and keep them alert.”
(Respondent A5)
“The learning and development department is responsible in organizing activities
and programs to promote awareness. There are often awareness activities where we
engage the staff with the society. It is more of a self-realization that caring for the
environment is important for the society as a whole.” (Respondent A2)
“Create awareness by sharing simple slides on info TV every day, which is part of
‘Responsible Care’ campaign.” (Respondent A3)
Besides the three mechanisms mentioned above, firms use many training platforms to
equip their employees with green skills. From the interview data, list of trainings that are
provided to employees was grouped into seven categories (see Table 5.7). The top three
forms of trainings popular among firms are: on the job trainings, environmental compliance
trainings and environmental regulation workshops. Based on the top three training
platforms it is evident that firms emphasized on trainings that enable them to comply with
environmental regulations and standards.
Some firms have gone to greater lengths to provide green skills to employees. They have
developed their own module, comprising structured assessment system to grade their
employee’s achievements. Furthermore, there are firms offering online training courses.
163
Table 5.7 : Types of trainings provided
Type of trainings Number of firms
resp0nded Details Conducted by
On the job trainings √√√√√√ -Focus on areas where firms have
comparative advantage
-Senior staff
Environmental
compliance trainings √√√√√
-Routinely conducted
-ISO14001 & competency related
trainings.
-External trainers
-Senior staff
Environmental
regulation workshops √√√√√
-EQA 1972
-Updates on new regulations
-DOE officers
-Senior staff
Engage with experts √√√
-Sharing best environmental
practices especially in the area of
waste & chemical management
-External experts
Awareness trainings √√√
-In-house or outside the firm (by
associations)
-Attending talks, seminars
&conference
-Senior staff
-External facilitators
Environmental
courses √√
-Own environmental syllabus
-Exclusive training system
-A structured assessment system
- Senior staff
-External trainers
Online √ -Online training system -Self engagement
Note: Total number of firms interviewed = 6 (6 respondents). Data generated from the interviews.
5.3.1.3.1 Assessment of Employees Green Skills
To increase employee’s participation and seriousness in obtaining green skills, an
evaluation system is structured. Employees are assessed through causal learning,
monitoring and fulfillment of key performance indicators (KPIs). At the same time,
promotion and pay rise is linked to the evaluation system, as a motivation for employees to
acquire those skills effectively.
“There is a promotion system in place, where at every stage there is trainings,
exams and interviews. Environmental trainings are a substantial portion of the
system and assessment. Employees need to work hard to get through all the stages.”
(Respondent A1)
“There are certain KPIs that the employees need to achieve. There is causal
learning to assess on how they do their work.” (Respondent A2)
164
“Employees are assessed through audit results and routine site visits.” (Respondent
A4)
“Employees are provided with a list of trainings that they need to attend. Fulfilling
these training hours is part of their KPI, which will later be taken into
consideration for pay rise and promotion.” (Respondent A5)
Based on the skills and assessment system coined by the firms, it is evident that firms
are committed towards sustainable manufacturing practices. However, the trainings
implemented by the firms emphasizes on the compliance with the environmental
regulations. There could be instances that the skills contribute to eco-innovations that assist
firms to achieve minimum regulations requirements. Moreover, the interview results did
not provide any lead showing strong linkages between green skills and EI. With reference
to the earlier two determinants, environmental knowledge and collaboration clearly indicate
that green skills are imperative to formulate firm’s environmental strategies.
5.3.1.3.2 Challenge to Create Awareness
Creating environmental awareness and sustaining the awareness has been a challenge for
some firms. Academic qualification/background hugely influences employee’s acceptance
and understanding towards the need to care for the environment. Respondents purported
that generally employees with lower level of academic qualification exhibit lack of
environmental commitment, which are mostly among the general assembly workers.
“There is different level of acceptance towards awareness. Employee’s academic
background determined the awareness that they are able to absorb. It is always
challenging to spread the awareness among employees at the operational level.”
(Respondent A3)
165
“Academic qualification influences their level of awareness. Constant awareness is
required to remind those with lower academic qualification.”(Respondent A4)
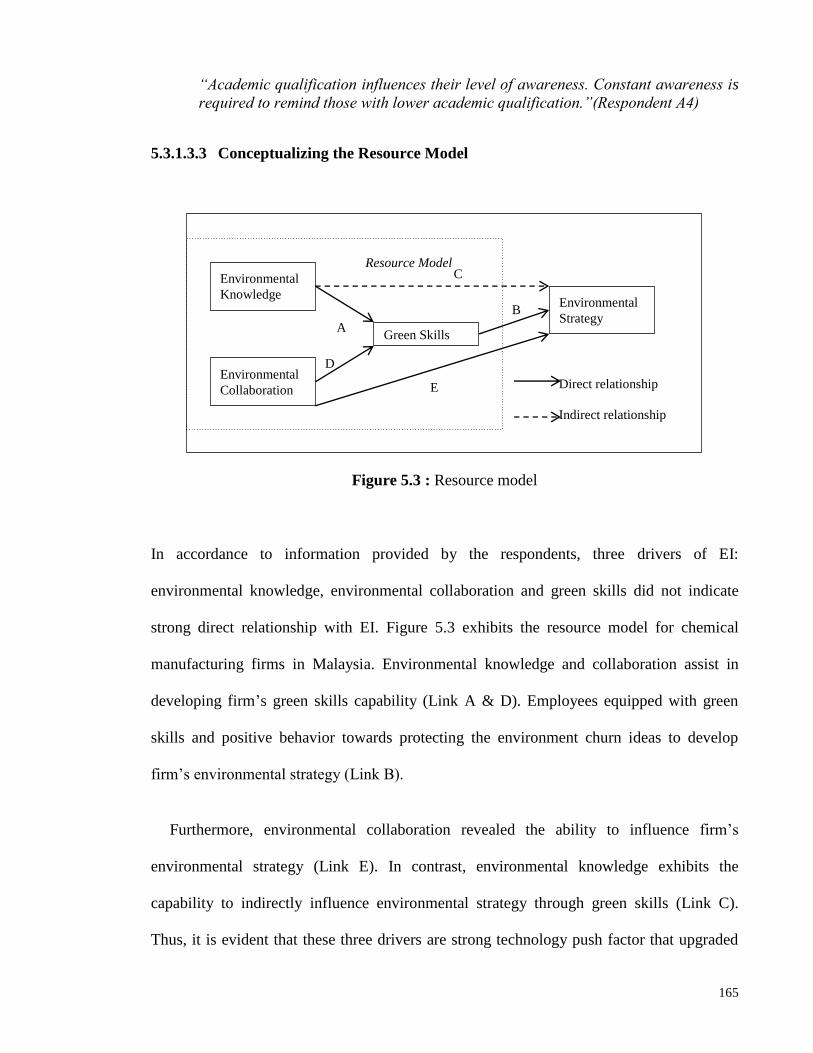
5.3.1.3.3 Conceptualizing the Resource Model
Figure 5.3 : Resource model
In accordance to information provided by the respondents, three drivers of EI:
environmental knowledge, environmental collaboration and green skills did not indicate
strong direct relationship with EI. Figure 5.3 exhibits the resource model for chemical
manufacturing firms in Malaysia. Environmental knowledge and collaboration assist in
developing firm’s green skills capability (Link A & D). Employees equipped with green
skills and positive behavior towards protecting the environment churn ideas to develop
firm’s environmental strategy (Link B).
Furthermore, environmental collaboration revealed the ability to influence firm’s
environmental strategy (Link E). In contrast, environmental knowledge exhibits the
capability to indirectly influence environmental strategy through green skills (Link C).
Thus, it is evident that these three drivers are strong technology push factor that upgraded
Environmental
Strategy
Environmental
Knowledge
Environmental
Collaboration
Green Skills
Resource Model
Direct relationship
Indirect relationship
A
B
C
D
E
166
employee’s general skills to green skills. These skills guide firm’s environmental strategy
(i.e., material usage and technical aspects for sustainable manufacturing).
The Strategy Model (Model 2) 5.3.2
This section brings forward the discussion on how two technology-push (i.e.,
environmental collaboration and green skills) and demand-pull factors (i.e., market pressure
and export behavior) mechanize a chain effect that contributes to the formulation of
environmental strategy and directs firms EI initiatives. The influence of these factors on the
organizational culture, and the dynamics of firms to withstand the challenging
environmental issues are also elaborated in this section.
5.3.2.1 Market Pressure
The responses from the interview firmly indicated that firms responded to pressure from
consumers and competitors. However, from both these pressure, consumer pressure was
given greater consideration. Respondents indicated that increasing environmental
awareness, since the last two or three decades, have globally promoted green consumerism.
The responses further indicated that environmental awareness among Malaysian consumer
might not be obvious but change has actually taken place and educated consumers are
making smart choices these days. Malaysian consumers’ environmental awareness will
eventually be on par with those from the developed countries. As a result, demand for
environmentally friendly products are increasing in Malaysia at a slow pace.
In response to budding consumer pressure, firms have incorporated strategies to respond
to their green consumers’ needs; and started to strategies themselves to handle stiff
167
consumer pressure in the future. Informants acknowledged that when there is consumer
pressure, firms frequently place greater attention to the product. Product
reengineering/redesigning is the common strategy employed to address this pressure. From
the analysis, it is clear that the current rate of pressure that firms are facing is largely
international.
“Consumer pressure internationally has been there for a long time now. In the case
of Malaysia we cannot ignore the fact that educated consumer are looking for green
products. We project that in the near future, Malaysian consumers will demand for
green products, similar to western countries. When it comes to consumer pressure,
it is the product that receives greater attention by us and reengineering is the way
out.” (Respondent A2)
“Consumers/clients demand for environmentally friendly products. This is the trend
lately. Understanding consumer needs and acting accordingly is one of our
organization mission. There is a carefully designed action plan to tackle this
problem.” (Respondent A6)
“Nowadays consumers are smart, they care for the environment. They require
products that are safe for them and the environment…product redesigning is the
solution to this pressure” (Respondent A4)
Next is pressure from the competitors. From the response, it was visible that large firms
are on par with their competitors. These large firms have created their own niche market
and some of them are dominant market players. It was noticeable that they do benchmark
themselves with the main market players, and with those who have obtained a certain level
of recognition in their participation and contribute in promoting sound environmental
practices globally. The pressure from competitors was not proven as intense as the pressure
from the consumers.
“Benchmarking is done with international companies, mainly with our global
competitors who have been in the market for many years.”(Respondent A1)
168
“We have created our own brand and niche. We do monitor competitors but we are
always ahead of them…it is our philosophy ‘striving for the best’.” (Respondent A2)
“Many firms are going green nowadays and there is tough competition out there, so
anyone who intends to remain competitive has to strategize.” (Respondent A3)
In response to which pressure is greater for them to eco-innovate, market or non-market,
all the respondents agreed that market pressure was more influential. Since, there is societal
awareness in Malaysia; it is still not strong to the extent that local NGOs and pressure
groups are able to pressure the firms. If there is any non-market pressure that firms respond
to, it is the regulatory pressure.
Firms have come into terms that to remain competitive, they have to respond to their
customers’ needs rather that following what their competitors are doing. The reason could
be that customers in different regions are composed with different level of awareness.
Firms are serving diverse segment of customs from different regions. Thus, following their
competitors might not seem to be a suitable strategy. Action plans to respond to their
customers’ needs seems to be more practical. Finally, there was no indication of a direct
relationship between the market pressure and EI. Market pressure had commanding
influence on the strategy that firms embark to provide environment friendly products.
Therefore, it was found that firm’s market pressure influenced EI indirectly through
environmental strategy.
5.3.2.2 Export Behavior
Foreign regulatory settings have a direct and commanding influence in the
creation/adoption of EI. This is because, when informants were asked on the need to
169
comply with certain environmental requirements on their exports, their instant feedbacks
were “Yes”, “Certainly”, “Of course”, ‘We have to” and “Definitely”. These responses show
obligatory compliance to foreign environmental requirements. A few informants even
regarded the requirements as “Very strict”. Firms have varying strategies in response to
their export orientations. Some firms had comprehensive strategy, which enables them to
address all their importers environmental requirements. Meanwhile, those addressing
specific needs used multiple strategy approach to solve this issue.
“Responsible Care Management System (RCMS) is a holistic system that manages
and solves major environmental related issues. The deployment of this system
automatically enables us to meet all the requirements set by the foreign firms.”
(Respondent A5)
“Different countries have different requirements, it is like their own version of
REACH, so different strategies are used to comply with their standards.”
(Respondent A1)
Table 5.8 contains the list of standard set by foreign countries for compliance by the
local firms. The ISO14001 is the main and the minimum requirement that each exporting
countries need to meet. Then, followed by REACH and EHS, which are specific standards
designed for chemical related manufacturing. Finally, ISO/TS 16949 and RSPO, these are
more product specific requirement imposed only on firms that are producing such products.
Firms’ active actions in meeting these requirements are seen to potentially influence the
formulation of their environmental strategy. With varying strategies employed by firms to
meet their importers environmental requirements, it is a clear that firms export behavior
influences their environmental strategy, which later drives their behavior to eco-innovate.
Regulation/ requirements Number of firms responded
ISO 1400112
√√√√
REACH13
√√√
EHS14
√√√
RoHS15
√√
ISO/TS 1694916
√
RSPO17
√
Note: Total number of firms interviewed = 6 (6 respondents). Data generated from the interviews.
5.3.2.3 Environmental Strategy
In the process of synthesizing and understanding the inter play between the determinants of
EI, the most striking finding is that there is no perfect direct link between the majority of
the determinants and EI. The findings revealed that the determinants are more critical for
the development of firm’s environmental strategies. Based on the interview, informants
often link the EI determinants to a stream of activity that promoted the EI. Terms frequently
used in reference to this activity were plans, strategies, goals, actions and initiatives. Even
though the terms were different but from their responses, it was apparent that they were
refereeing to the same context which is environmental strategies.
The EI determinants altered organizational culture and provided the dynamics under
which environmental strategies are developed. Organizational culture is referred as ‘a
12 ISO 14001 is no longer alien to the environment community and it has become common or a mandatory
requirement for all exporting firms to have the certification. 13 Registration, Evaluation, Authorization & restriction of Chemicals (REACH) is a list of criteria formulated
by European union to protect the ecosystem from threats posed by chemicals and to promote innovation and
competitiveness in the chemical industry. 14 Environment, Health and Safety (EHS) requirements are the ones set under OSHA. 15 Restriction of Hazardous Substances (RoHS), which are requirements developed by EU to regulate the use
of toxic substances in products. 16 ISO/TS 16949 is a quality management system that looks into chemical substances that are used in the
manufacturing of automotive related products, for example, polymer that is used in the manufacturing of car
cushions/seats. 17 Roundtable Sustainable Palm Oil (RSPO) is a non-profit organization. RSPO has formulated social and
environmental requirements that firms need to comply in order to produce Certified Sustainable Palm Oil
(CSPO). RSPO has an integrated mechanism that looks into the total palm oil supply chain.
171
pattern of shared basic assumptions that was learned by a group as it solved its problems of
external adaptation and internal integration, that has worked well enough to be considered
valid, and, therefore, to be taught to new members as the correct way to perceive, think, and
feel in relation to those problems’ (Schein, 2004). With reference to dynamic capability
theory, dynamics are the agility and ability of the firm to rapidly respond to the continuous
change and progress occurring in the firms.
The interview data affirms that firm’s organizational culture is infused with new
assumptions that have changed the nomenclature of managing organizational issues. Firm’s
initiative in providing solutions to green consumerism and other forms of environmental
pressure indicates that they have adopted new beliefs and values. Environmental
commitment and realization on the importance of long-term sustainability portrayed by
firms, further confirms the change in organizational culture. Firm’s dynamism was
reflected as they responded to emerging environmental issue. They developed capabilities
to absorb new environmental knowledge through collaborations and upgraded their green
skills using better information channels. These capabilities enabled them to reduce waste
generation and increase energy efficiency.
Therefore, EI determinants namely environmental knowledge, environmental
collaboration, green skills, market pressure and export behavior was found to strongly
influence environmental strategy. The interview data demonstrated that these determinants
are fused with the changes in organizational culture and firm dynamism to formulate
strategies to solve environmental problems. Mechanics that shaped firms environmental
strategies are presented in section 5.3.4.
172
5.3.2.4 Conceptualizing the Strategy Model
Market pressure and export behavior provided the firms with the information on transitions
that is taking place in their product market. Meanwhile, environmental collaboration and
green skills equipped the firms with global environmental knowledge and technical ‘know
how’ that is required to respond to the transitions. One stream of significant activity
emerging from these determinants is changes in the organizational culture and resistance in
firm dynamics to tackle demanding environmental issues.
Figure 5.4 : Strategy Model
The interference between the determinants and shift in organizational culture leads to the
development of environmental strategies, represented by the direct link in Figure 5.4 (Link
A, B, C and D). Later, these strategies influence the EI (Link E). However, besides the
direct link, an indirect link was also apparent where the four determinants influence EI
through environmental strategy (Link A1, B1, C1 and D1).
A
B
C
D
Eco-Innovation
Strategy Model
Direct relationship
Indirect relationship Environmental
Strategy
Green Skills
Environmental
Collaboration
Market pressure
Export Behavior
A1
B1
C1
D1
E
173
The Eco-Innovation Model (Model 3) 5.3.3
Environmental regulation was found to be a delicate determinant to be explored. Each firm
has different perspective towards the environmental regulation. Their response towards
environmental regulation is always based on the preference of these regulations. This
section sheds some light on these issues and explores how environmental regulation and
firm’s financial resources influence EI.
5.3.3.1 Financial Resources
The firms indicated that there is an allocation for environmental R&D. The R&D activities
are financed internally and no external funding involved. Based on the responses, it was
evident that firms are not financially constrained. However, when asked the percentage of
allocation for environmental R&D, they were unable to provide an accurate figure. This is
because the environmental R&D expenditure is aggregated together with other forms of
environmental compliance expenditure. The expenditure was roughly estimated that for
environmental purposes the allocation is one to two percent, and a large portion is devoted
to product related R&D.
“It is around 1% and mostly product related R&D.” (Respondent A3)
“Around 1% to 2%...R&D labs focus on product research, especially improving the
product life cycle.” (Respondent A4)
174
5.3.3.1.1 Barriers to Environmental R&D
Respondents highlighted that there are several barriers encountered by firms to
environmental R&D. The major barrier was convincing the top management to approve the
R&D budget. A detailed and credible financial presentation of the R&D projects is required
to obtain the approval form the top management. The aspect that needs further detailing is
the return on investment. The external benefits that accrue from these projects need to be
presented in terms of dollar and cents.
“For new projects the problem is always getting people’s perception, on the
importance of the project. Selling the projects to the top management and getting
their approval can be tough.” (Respondent A5)
“Setting the priorities and convincing the top management can be difficult. Cost
benefits analysis need to be properly done to convince them as we are competing
for the funds between various projects.” (Respondent A1)
Besides convincing the top management on the importance of this R&D projects,
outdated R&D technology is also a barrier especially for old firms. A change of the
facilities/technologies entirely imposes a high cost. Another barrier that firms are dealing
with is customer’s rejection of the new product. Green products are evolving extremely
fast. Firms need to consider the relevance of the current R&D outcomes in the future.
“We have been in the industry for many years and our R&D facilities were built
since then. Upgrading has been done but it is not sufficient. Changing this machines
and equipment’s entirely is going to be very costly” (Respondent A6)
“The new products are sometimes rejected by customers. We need to be mindful on
the type of R&D that we do.” (Respondent A4)
175
Other constrains highlighted during the interview are cost and time related to R&D.
However, these barriers seem to impose the least constrained firms to expedite their R&D
projects. Since, large firms are not financially constrained, they have established R&D
capacities, consists of sophisticated labs and skilled researchers.
“Large organizations are not financial constrained. They are capable of doing
extensive R&D”(Respondent A3)
“We have so many engineers working on environmental R&D, I think we are the
biggest.” (Respondent A1)
5.3.3.2 Environmental Regulation
When respondents were asked about aspects related to environmental regulations, majority
of the respondents expressed their satisfaction with the enforcement of the new system. The
new system was regarded user friendly and provided firms ample of room for firms to
incorporate their own ideas in order to improve their environmental performance. This is
because the new system comes with a built-in self-compliance mechanism, where DOE
outlines the bigger scope of pollution mitigation plan and the firms are given the liberty to
determine the specific elements related to the bigger scope. Respondents referred to the
new system as better and effective because they understand their production process and
organization structure better. Thus, the new system allows them to fit their own unique
features into the pollution mitigation plan.
“Compared to 10 years ago we are better. DOE has a new system, where they want
the firms to be more independent. They give us the broad scope and we fill in the
detail scope according to our own production mechanics and organization system.”
(Respondent A1)
176
“Their mechanism has changed over the years. Now is more on self-compliance.
The change that they have done is good and effective to a certain extent.”
(Respondent A3)
According to the responses provided by the firms, it was evident that large firms did not
encounter any problems from the regulators. This is because they complied with all the
pollution mitigation requirements and submitted their environmental reports on time.
Furthermore, if there were any emerging environmental issues in the plant and required
serious attention, DOE was immediately informed. Taking into consideration the proactive
behavior portrayed by the firms, DOE has developed a certain level of trust and faith
towards large firms. Thus, not frequently monitoring them and ready for negotiation if any
unexpected issues takes place.
“DOE have faith in large organizations like us. We immediately report to them if
there are any issues. We submit all our reports to them on time.” (Respondent A2)
“The regulators are informed about any changes that take place. Because we are
sincere to them, they understand us and an effective negotiation frequently
transpires between us. So far DOE is efficient and competent.” (Respondent A4)
“The enforcement of environmental regulation has improved with the new system.
As there are new chemical regulations it will take time for them to develop the
capability to improve the system further.” (Respondent A5)
From the above discussion, there is strong basis that environmental regulations do
influence eco-innovation. Initiatives taken by firms to comply with environmental
regulations set by DOE leads to eco-innovation. When asked whether is there any
environmental innovation predominantly because of existing environmental regulation, four
out of the six firms that were interviewed acknowledged, that environmental regulation
177
considerably influence eco-innovation. The exact extent of the effect on eco-innovation is
unclear.
Some respondents stated that they are doing a lot more to protect the environment as
compared what is required by the environmental regulation; and the regulation do not
impose a significant impact of their eco-innovation initiatives. However, the findings affirm
that environmental regulation definitely provides the initial force to eco-innovate. The
continuous assessment carried out by regulators through reporting and monitoring provide
positive outcome for the eco-innovation initiatives among firms. A direct relationship
between environmental regulation and eco-innovation was observed
Regulation has no great impact on us. RCMS that we have require us to comply
more as compared to what DOE require, so we are ahead.” (Respondent A5)
“We are doing a lot more.”(Respondent A1)
Among the environmental regulation regimes, command and control regulation has been
the force behind the eco-innovation. Respondents indicated that environmental standards
under the command and control regime were mainly influential. Based on the interview
findings, for the Malaysian command and control regulation, it is necessary to stimulate the
basic types of EI, which enables the firms to meet minimum pollution abatement
requirements set by the authorities.
“In the case of Malaysia we need command and control regulation to influence
environmental innovation.”(Respondent A5)
“Command and control is important especially for basic environmental innovation
to meet at least the minimum mitigation requirements.” (Respondent A1)
178
Despite their satisfaction with the new system, respondents did express their
dissatisfaction. There is no consistency in the enforcement of system. The element of
flexibility and negotiation embedded in the new system contribute to different enforcement
treatment across firms. The enforcement is different from one organization to the other,
which is regarded as unfair.
“Messy enforcement, the enforcement differs from one company to another.”
(Respondent A6)
“They are flexible and open for negotiations when dealing with issues that they
have to be strict. And during situations where they have to allow flexibility and
negotiations they are strict…it is unfair at times.” (Respondent A4)
5.3.3.3 Regulation Stringency
Discussion in the prior section indicated that the enforcement of environmental regulations
in Malaysia has increased. The command and control regulations that influenced the EIs
have transpired. This information provides positive platform to suggest that environmental
regulation stringency has increased over the years. However, when respondents were
questioned on the stringency of the environmental regulation, they gave a very standard
answer which is “it depends”. Denoting that certain aspect of the environmental regulation
is stringent, and certain are not.
There are a few factors behind this situation. First, the penalties that are being imposed
are low and need to be revised. Second, the regulation is outdated and considered more lax
compared to other countries. Third, stems from the regulators themselves. DOE officers
were regarded as inexperienced. The newly appointed officers are young and still in the
learning process. Thus, their action and interpretation of the regulation is not consistent.
179
The authorities keep changing the person is in-charge of the regulation and handling of a
particular firm, which further complicates the situations. These factors diluted the
stringency of the environmental regulation.
“There are some areas that we are stringent and some areas need to be given more
attention.” (Respondent A1)
“It is stringent but certain aspects only…penalties need to be revised” (Respondent
A4)
“Malaysia’s chemical regulation is old and outdated compared to other countries.
DOE officers have lack of experience as most of them are in the learning process.”
(Respondent A5)
“DOE officer’s lack of knowledge and experience. Their action and interpretation
are both different.” (Respondents A2)
“The officers are young and inexperience and the person in charge of the
regulation keep changing.” (Respondent A6)
Respondent shared their experience and knowledge dealing with foreign environmental
regulation. Figure 5.5 provides the list of countries that have lax and stringent
environmental regulation as compared to Malaysia. In comparison to Malaysia, the
environmental regulation of the ASEAN countries is more lax, except for Singapore and
South Korea. Malaysia was claimed to be doing a lot better to protect the environment as
compared to their ASEAN counterparts in the area of waste management and air pollution.
However, in comparison to EUROPE and Australia Malaysian environmental regulation is
lax.
“In Southeast, Malaysia is better than others when it comes to the enforcement of
environmental regulation in manufacturing industry. But when compared to EU,
Japan and Australia we are not that stringent” (Respondent A6)
180
“In the ASEAN region we are better, as specially in the area of waste management
and air pollution.” (Respondent A5)
“We benchmark EU and Australia when it comes to environmental standards.”
(Respondent A1)
Figure 5.5 : Foreign countries with stringent and lax environmental regulation as compared
to Malaysia.
It was a challenging task to gauge the environmental regulation stringency. The
stringency of environmental regulation has increased over the years. However, based on the
responses, the level of stringency is not up to the level that it forces firms to eco-innovate.
Issues like low penalties and inexperienced regulators could reduce the level of stringency.
Concisely, stringency was not seen as significant factor that influence EI, but a weak direct
relationship between eco-innovation was observed.
5.3.3.4 Conceptualizing the Eco-Innovation Model
The EI model is an extension of the strategy model. Financial resources, environmental
regulation and regulation stringency are the additional determinants included in the model.
These three determinants display a direct relationship with EI (Link F, G and H). Among
the three drivers, environmental regulation proved to be a strong determinant of EI. Since,
Indonesia
Thailand
Vietnam
Myanmar
Philippines
India
China
Sri Lanka
East African Countries
Malaysia
EUROPE
Australia
U.S. (some parts)
Singapore
Japan
Korea
Lax environmental regulation
Stringent environmental
regulation
181
firms are proactively complying with all the regulations set by the authorities, largely this
compliance has led to EI.
Figure 5.6 : Eco-Innovation model
For financial resources and regulation stringency, besides showing direct relationship,
prove to be weak determinants of EI. Large firms are not financially constrained and
decisions to eco-innovate are not largely influenced by their financial endowments. On the
other hand, regulation stringency has increased over the years but does not seem to be
sufficient to stimulate expected level of EI to mitigate pollution. Finally, environmental
collaboration, green skills, market pressure and export behavior exhibit an indirect
relationship with eco-innovation through environmental strategy.
From the interviews, environmental strategies play a crucial role in bringing together firm
resources and capabilities for eco-innovations. The rapidly increasing and complex
environmental issues have challenged these firms to formulate superior environmental
strategies to sustain their competitive advantage (Chen, Ong, &Hsu, 2016; Journeault, De
Ronge, & Henri 2016). For firms especially in developing countries, this process gets even
tougher as they need to invigorate their existing capabilities while integrating new ones to
handle unfamiliar and demanding actions. Considerable efforts are placed by the firms in
order strengthen capabilities that are able to effectively shape their environmental strategy.
We found through our interviews that there are certain important mechanics that are
involved to translate firms’ environmental concerns and issues into environmental
strategies. These mechanics are referred as mechanics behind environmental strategy
(MBES), which are the forces involved in the formulation, design and implementation of
environmental strategies18
. Through the interviews, this strategy involves seven important
mechanics.
From a literature search, it was found that Mårtensson & Westerberg (2014) and Epstein
& Roy (2007) have explored some of the requirements of effective environmental strategies
which strongly related to the MBES that was found in this study. Mårtensson & Westerberg
(2014) explored five vital requirements to design an effective environmental strategy. This
includes building employee skills and experience, strengthening the relationships between
internal and external stakeholders, enhancing communication channels, promoting
cooperation and control and finally, restructuring the firm’s material flow. Epstein & Roy
18 In this study, the concept of MBES was coined by reviewing meager amounts of studies in this area (Epstein & Roy, 2007; Mårtensson
& Westerberg, 2014).
183
(2007), on the other hand, investigated the coordination and control within multinationals
on the facet of environmental strategies. Their findings indicated that the headquarters exert
greater control over issues pertaining to setting environmental standards, initiatives and
strategies evaluation as opposed to business units to ensure consistency.
In this regard, MBES itself can be considered as one of the dynamic capabilities of the
firms whereby the accomplishment of enterprises is through the convergence of
heterogeneous resources endowed to them and their unique capabilities, which can serve as
the foundation for the mechanics behind the environmental strategies. Additionally, the
concept of complementary assets (Teece, 1986) serves as an important substance in this
study. Complementary assets refer to the capabilities and infrastructure that support an
innovation to be successful. From the environmental strategies viewpoint, the notion of
complementary assets refers to the assets needed to gain competitive advantage with the
implementation of environmental strategies (Christmann, 2000). Therefore, a successful
MBES that constructs an award-winning strategy is definitely a valuable asset to raise the
competitive advantage of a firm.
In this section, seven mechanics of the environmental strategy that emerged during the
interviews are presented. The seven mechanics consists of central system, internal system,
specific environmental management unit, quantifiable measurement, strategy alignment,
collaboration and collective involvement. These mechanics are grouped into two categories
based on their nature of behavior. Finally, the discussion on the importance of top
management commitment to integrate these seven mechanics is explained.
184
5.3.4.1 Central System
All the respondents stated that a central system at the headquarters formulates the primary
environmental strategies of the entire organization. This system consists of a selective
group/team from the headquarters, which is purposely assigned to manage the primary
strategy formulation process, by taking into consideration the organization’s environmental
vision and mission. The headquarters additionally, have determined a specific set of
guidelines/framework19
to administer the entire formulation of the process strategy. Finally,
the actions of the business units are based on these primary environmental strategies. This
is clearly stated by some respondents:
“Global team formulates the strategies. We have a ‘control framework’, which are
guidelines for us to follow. Everything is specified in the guidelines, so this makes
the process much easier and structured.” (Respondent A2)
“Environment team formulates the strategies. For every environmental issue, there
is a group in charge of it.” (Respondent A1)
Given the fact that the chemical industry is a highly risky and polluting industry, the
headquarters seem to obtain certain control in the formulation of the environmental
strategies. These centralized mechanics safeguard the firm’s corporate image as claimed by
scholars (Walley & Whitehead, 1994) and control the complexity to be dealt with as they
operate at multiple locations (Baligh, Burton, & Obel, 1996).
19 The headquarters have developed a standard guideline/framework that provides a detailed set of instructions and procedures, which is
mandatory for every department, unit or employee to follow during the course of environmental strategy formulation. These guidelines/frameworks encapsulate several important aspects such as budgeting, resource usage, chain of command, safety standards,
performance standards and others.
185
5.3.4.2 Internal System
Besides the central system, the interview results revealed that there is an internal system
within the firms. The purpose of the internal system is to localize the primary
environmental strategy in response to local regulatory needs and firm’s capabilities. In
addition, under the internal system, the top management identifies firm level environmental
issues through feedbacks from every department. These issues are addressed through more
firm specific environmental strategies, which are formulated using similar
guidelines/framework set by the headquarters. These strategies tend to be short term in
nature compared to the primary strategies.
Interestingly, in most cases, the firm level strategies are executed through environmental
projects, which are collaboratively planned by the top management and the respective
divisions. These projects take into consideration the current organizational and regulatory
needs as well, while staying intact with the firm’s environmental vision and mission. In this
aspect, proximity is also important, as some of the environmental issues are location-based.
Therefore, the projects are designed to address the current environmental issues faced by
the firms and to fulfill the regulatory requirements.
“We have both long-term and short-term strategies. The managing director
formulates the short-term strategies and looks into the practical side of the
strategies. These strategies take into account the local organizational and
regulatory needs.” (Respondent A4)
“At the local level, the environment department with the consultation of top
management formulates the strategies that are in accordance to the organization’s
vision and mission.” (Respondent A5)
186
“Based on the ‘Control Framework’ provided by the headquarters, we set our
projects and these projects involve other divisions as well. These projects are
planned to achieve the group’s main objectives.” (Respondent A2)
Formalization was observed within the internal system, where the formulation of firm
level strategies is based upon a set of guidelines/framework provided by the
group/headquarters. It was evident that the final decisions on environmental initiatives were
decided by top management decisions and guidelines by group/ or the headquarters. The
findings of this study validate past evidences that the formalization process is an important
aspect within the internal system. For corporate greening to advance, formalization is
necessary (Takahashi & Nakamura, 2005). It reduces headquarters’ involvement (Roth,
Schweiger, & Morrison, 1991) and gives a little autonomy to the firms to incorporate ideas
into strategies (Hales, 1999), thus allowing firms to leverage on it and earn competitive
advantage.
5.3.4.3 Specific Environmental Management Unit
Decision-making regarding environmental strategies involves various divisions and
personnel within the organization (Torre-Ruiz et al., 2015). Thus, coordination is of
paramount importance. Indeed, communication is crucial (Mårtensson & Westerberg, 2014)
to streamline the entire system. Addressing solutions to coordination and communication
issues, every informant acknowledged that there is a requirement for specific environmental
management unit to oversee all environmental-related issues. This unit is responsible for
synchronizing feedbacks between top management and the departments, and various
divisions. In addition, this unit also initiates and facilitates as well as monitors the approved
187
environmental projects. Lastly, this unit is also deemed as a one-stop resource center for
everyone to obtain environmental-related information.
“Global Environment (GE) team takes charge of all environmental issues. There
are many units under GE and each unit is designated to manage a specific
environmental issue.” (Respondent A1)
“HSED monitors all the green strategies and projects. They will coordinate the top
management and the departments.” (Respondent A4)
“HSED initiates and facilitates environmental projects. HSED is basically the one
stop center to get all the information.” (Respondent A3)
From the responses, it was evident that this unit is multifunctional. This study believes
that a proper organizational structure and environmental resources within this unit may
speed up the implementation process of the strategies. The setting of a specific
environmental management unit, therefore, reflects a high level of importance that the top
management gives towards environmental issues (Del Brío, Fernández, Junquera, & José
Vázquez, 2001).
5.3.4.4 Quantifiable measurement
The interviews, on the other hand, also disclosed that the majority of the firms use
quantifiable measurements to gauge the success of the environmental strategies.
Apparently, this quantifiable measure itself is a detailed and planned document to ensure
consistency. Electricity cost reduction, energy intensity index, carbon reporting and
percentage of waste reduction, for example, is some of the main targets in their
environmental key performance indicators that are frequently assessed. However, some
188
respondents acknowledged that as a measure of their strategy’s success, they must at least
meet environmental requirements set by the Department of Environment, Malaysia (DOE).
Firms raise the expectation bar higher upon achieving current targets to further reduce their
carbon footprints. In other words, all the firms undertook continuous improvement.
“There are key performance indicators (KPIs) for every environmental initiative.
The KPIs itself is a huge document; we call it the ‘A1 Technical Standard’…goals
that we set are frequently measured. For example, operation level goals are
measured quarterly.” (Respondent A1)
“Annually, reviewing our environmental projects, setting energy intensity index and
at the least, meeting the requirements set by DOE. In our organization, we are
always raising the bar to be better.” (Respondent A2)
“There are targets, which are time bound…reduce the electricity bill by 1% every
year. SMART system is also used…there is tough competition out there...everyone is
going green.” (Respondent A3)
The firms’ initiative to review frequently their environmental actions and targets provide
an avenue for improvement. The assessment of their strategies enabled them to raise the bar
higher once targets are achieved, especially in the context to be recognized as the most
environmentally friendly enterprise among their competitors. Therefore, firms believe that a
proper evaluation system warrants the success of their environmental strategies (Ilinitch et
al., 1999; Lober, 1996).
5.3.4.5 Strategy Alignment
Strategy alignment is another mechanics of the environmental strategy. Firms often aim for
desiring cutting-edge and innovative solutions to their environmental problems. In addition,
firms seek to obtain advanced green knowledge, to stay ahead of their competitors, who are
189
enthusiastically involved in the green transformation. Therefore, firms revise and review
their strategies within a period of three to five years to align strategies with globally
emerging environmental issues.
“There are absolute goals and relative goals, which are revised
periodically…always looking for new innovative solutions to solve environmental
problems. Even currently, we are not satisfied with what we are doing.”
(Respondent A1)
“We have a 5-year environmental improvement plan. This plan is constantly viewed
so that we keep abreast with the changes that are taking place…it’s a competitive
world out there.” (Respondent A2)
“Our targets are revised every three years…market study is conducted to introduce
new plans.” (Respondent A6)
5.3.4.6 Collaboration
Collaboration between top management, department and employees is the backbone of
environmental strategy formulation and design, based on indicators provided by
respondents. To understand this collaboration, it is important to observe the path that firms
use to structure their internal strategies.
A common practice among firms is to request their staff to state the environmental-
related problems in their departments followed by solutions to those problems. Their
environmental management unit then uses this information to structure environmental
projects and propose them to the top management. The selection of the ideas and solutions
is based on the cost-benefit analysis. Usually, the chosen solutions to solve environmental
problems should justify the investments and the benefits the firms obtain. Once approved,
the ownership of these projects is handed over to the departments, and the success of these
190
projects is the responsibility of the departments. These projects, therefore, are the firm’s
environmental activities under their internal strategies.
“HSED will go around asking every department on the problems that they face…list
down the problems and the proposed solutions. These proposed solutions are then
converted into projects…HSED writes a proposal to the top management to
approve the projects.” (Respondent A3)
“Every year, we have a project turnaround…to identify projects…involves other
divisions as well. Then we propose to the management for approval and budget.
Once approved, the departments will take charge of the projects.” (Respondent A2)
“Everyone is involved in the strategy making…over here, every individual is
responsible in protecting the environment…eco-together.”(Respondent A4)
After examining the responses from all the firms, this study inferred that every
individual in the firm plays a significant role in planning the environmental strategies. The
intensity of the collaboration as seen by these firms has the possibility to increase the
success rate of their environmental initiatives, since encouraging the participation of
organizational members in strategy development automatically place them in a learning
process and creative process (Cacciolatti & Lee, 2016). As a result, these processes can
help them to achieve organizational, environmental goals, technical skills and knowledge
required to mitigate pollution (Mårtensson & Westerberg, 2014).
Figure 5.7 presents the main departments that firms consider during their strategy
formulation process. Mainly, six key departments are involved in the strategy formulation
process. The most important is the production and operation department followed by the
maintenance, technology and emission reduction department with similar levels of
involvement. The finance department is shown as the last key department to be involved.
191
Figure 5.7 : Departments that are primarily involved in environmental strategy formulation Note: Total number of firms interviewed = 6 (6 respondents). Each firm indicated more than one department.
Data generated from the interviews.
5.3.4.7 Collective Involvement
While collaborative effort is involved during the formulation and designing of
environmental strategies, collective involvement among employees however, is found in
the implementation of these policies. For most of the firms, the involvement was voluntary,
because caring for the environment has become a part of their corporate culture. However,
a few firms also used guidelines, directives and campaigns to encourage their employees’
participation.
“Every staff is involved…top to bottom and left to right, we even involve our
contractors. Over here, we manage their entire supply chain. It is ‘eco-together’.”
(Respondent A4)
“Everyone in the organization is involved in the implementation. Taking care of the
environment is basically a culture here.” (Respondent A2)
0
1
2
3
4
5
Production Operation Maintenance Technology EmissionReduction
Finance
Nu
md
er
of
firm
s
192
“There is a detailed policy guideline, which requires everyone in the organization
to be involved.” (Respondent A1)
Two informants reported that directive measures were used to mainly increase the
participation of employees at the bottom level. Their lower level of education hindered
them from grasping environmental awareness, which later transpires into a poor level of
involvement.
“The bottom level follows procedures and instructions set by the safety committee.
It is difficult to get full commitment from the bottom level, maybe due to their
educational level.” (Respondent A6)
“Employees at the operation level have a lower level of education and they always
show lack of interest and awareness.” (Respondents A3)
The use of voluntarism and directives mainly involves a different level of employment
status. The most important seems to be creating environmental awareness and incorporating
that awareness as part of the corporate culture.
5.3.4.8 Categorizing the Mechanics and Top Management Commitment
Observation provided some basis to divide the mechanics into two categories: system and
commitment. System is a well-structured and guided system that governs the
transformation of environmental objectives into initiatives that the firms follow. Effective
environmental strategies, moreover, depend on a robust system and structure (Christmann,
2000; Epstein & Roy, 2007). Five mechanics that qualified in the system category are
central system, internal system, specific environmental management unit, quantifiable
measurement and strategy alignment (see Figure 5.8). From the findings, also it is noted
193
that over the years, firms have been investing in relationship-building among the members
of the organization (Mårtensson & Westerberg, 2014) to increase their commitment. Hence,
the second category is known as commitment, which consists of collaboration and
collective involvement. Systems and commitment are the two most important mechanics
behind the environmental strategy.
One significant finding from the interview, which needs utmost attention is that, the
governing of the MBES requires the top management’s commitment. If the environmental
management unit is unable to obtain the commitment of the top management, its entire
environmental strategy implementation will be impossible. It is the top management’s
commitment that serves as the key driving force of the MBES. Due to the pressure from
the group/headquarters (Boiral et al., 2012), strong and influential top management
commitment (Banerjee et al., 2003) were seen present in the organization that was
interviewed. The top management has put in a lot of effort and commitment in organizing
the MBES into a formal structure.
The top management has invested important strength in promoting active interaction
within the organization, which potentially builds trust and enhances commitment (Ring &
Van de Ven, 1994) among organizational members. The returns on this investment have
been rewarding, such as the development of a collaborative mechanism in planning the
environmental strategies, and provision of a dynamic on-the-job learning experience for
communicate that addressing environmental issues is
critical?
(Menguc et al.,
2009)
Interviews ES2 Who primarily handles environmental related issues in
your enterprise?
ES3 How would you assess the effort of your enterprise in
eliminating the release of any substances that cause
environmental damage?
ES4 How would you assess the effort of your enterprise to
eliminate the use of products that cause environmental
damage?
ES5 To what extent does your enterprise dispose physical
waste through environmentally safe methods?
Consumer Pressure 6.3.8
Table 6.9 exhibits the measurement scale and the two items that was adapted from Sarkis et
al. (2010) and Dai et al., (2014) to measure consumer pressure. Interview findings
suggested that firms are highly responsive to consumer pressure. Therefore, item CP1 was
constructed to strengthen the measurement by requesting the respondents to rate the level of
environmental awareness among their customers, which indirectly indicates the pressure
encountered.
Table 6.9 : Measurement scale and items for consumer pressure
Construct Item (7-point Likert scale) Reference
Consumer
pressure
CP1 How do you rate your customers' awareness towards
environmentally friendly products?
(Dai et al., 2014;
Sarkis et al., 2010)
Interviews CP2 How would you rate the pressure that your enterprise
encounters to generate environmental benefits
stemming from consumers?
239
Financial Resources 6.3.9
Items used to measure financial resource through a research survey was adapted from
Savignac (2008) and Stoneman & Canepa (2002) (see Table 6.10).
Table 6.10 : Measurement scale and items for financial resources
Construct Item (7-point Likert scale) Reference
Financial
resources
FR1 To what extent slowness in setting up financing is a
barrier for your enterprise to execute environmental
projects/activities/ innovations?
(Savignac, 2008;
Stoneman &
Canepa, 2002)
FR2 To what extent high cost is a barrier for your enterprise
to execute environmental projects/activities
/innovations?
FR3 To what extent is the no financing source a barrier for
your enterprise to execute environmental projects/
activities/ innovations?
Export Behavior 6.3.10
Majority of the empirical research that suggested exporting firms to be more
environmentally concern used a dummy variable as a proxy for export, which takes the
value of one if a firm is exporting or with a higher export share (Ghisetti et al., 2015b;
Horbach, 2008). However, for the purpose of this study, dummy variable was not a suitable
measure of export behavior for two main reasons. First, the data was analyzed using PLS,
thus a single binary variable is not suitable under PLS conditions. Second, through the
interview, export behavior was found to eminently affect firm’s environmental strategies.
Hence, items that could capture international influence on firms export behavior are more
suitable. To measure export behavior, a research survey was used. Based on the interviews,
two items were developed to measure export behavior (see Table 6.11).
240
Table 6.11 : Measurement scale and items for export behavior
Construct Item (7-point Likert scale) Reference
Export Behavior
EB1 To what extent does your enterprise's foreign buyers
require you to comply with their environmental
regulation/requirement (for example: ISO14001,
REACH, RoHS, chemical labeling and others)?
Interviews
EB2 To what extent does your foreign buyers'
environmental regulations influence your enterprise's
environmental and business decision-making?
Construct reliability and validity 6.4
The measurement instrument is developed depending on multiple sources of information.
Therefore, to ensure that the instrument provides consistent results and measures what it is
intended to measure, both the reliability and validity of the instrument need to be assessed
(Carmines & Zeller, 1979). This section explains the reliability analysis, content validity
and face validity that was performed to strengthen the instrument.
Reliability test 6.4.1
Reliability analysis was executed to gauge the inter-item consistency for the nine variables
that used Likert-scale measures namely regulation stringency, environmental regulation,
green skills, environmental collaboration, environmental knowledge, environmental
strategies, consumer pressure, financial resources and export behavior. In order to execute
reliability analysis, a pilot survey was conducted. A sample of 30 respondents were
identified for the pilot test (Johanson & Brooks, 2010). Engaging with the respondents at
this stage was easier because during the interviews, a good reputation was established with
the respondents and environmental consultants.
241
The preliminary questionnaire was distributed to the respondents that were interviewed and
a snowballing technique was employed to identify the respondents of the study through
interviewees and environmental consultations. Web survey was used to collect the data.
The Cronbach’s alpha obtained from the reliability analysis for each of the variable is
reported in Table 6.12. For all the variables, the Cronbach’s alpha was between 0.820 and
0.930, which is within the cutoff point of 0.7 and above (Nunnally, 1978). Therefore, all the
items were deemed reliable and none was deleted.
Table 6.12 : Items reliability-Alpha (α)
Variables Number of items Alpha (α)
Regulation stringency 3 0.870
Environmental regulation 3 0.871
Green skills 4 0.924
Environmental collaboration 3 0.930
Environmental knowledge 4 0.913
Environmental strategies 5 0.858
Consumer pressure 2 0.827
Financial resources 3 0.852
Export Behavior 2 0.820
Content and face validity 6.4.2
The reliability analysis provided an assurance that the measurement instrument is able to
yield consistent and stable results. The researcher then was able to verify the second issue;
the extent the instrument measures the needed measurement. At the beginning stage of
questionnaire development, an in-depth literature search was conducted to determine the
key dimensions that are required to capture the variables. Next, during the course of the
interview, the ability of these dimensions to measure the constructs were further explored
and verified through industry participants. Thus, attention was given to the content of the
instrument. Once the questionnaire was ready, two sets of experts were identified. The first
242
set of experts consists of six individuals who were the subject matter experts. Among them,
two are research supervisors, where one is an expert in the field of EI and the other is an
expert in the field of environmental management. The other four are external experts
comprising of two environment consultants, two senior chemical industry personnel and an
academia with chemical engineering background. The questionnaires were given to the
experts for validation within seven days. A face-to-face meeting was arranged with the
experts after the seventh day to obtain feedback and for clarification of issues that remain in
the black box.
The second set of experts was well versed with questionnaire development knowledge.
Two experts from this field assisted in improving the structure, language, scale and
wording of the items in the questionnaire. The questionnaires were also given to PhD
students embarking on their research in this related area for constructive comments.
Engaging the questionnaire with industry personnel during the process of content validation
indirectly contributed to face validity. Two main problems solved from the process were
the reduction of overlap of content and improvement in the accuracy of the items.
Population, Sample and Data 6.5
Population and Sampling 6.5.1
Three main states (Selangor, Johor and Pulau Pinang) provide substantial coverage to
chemical manufacturing firms in Malaysia. For the scope of this study, firms from the
Selangor region were considered for the following four reasons:
243
1. Strong industrial linkages and supporting other industries to move up the value chain:
Looking into the complex nature of chemical manufacturing industry and buoyant
linkages of its sub-sectors within the industry and with other industries, Selangor proves
to be the most vibrant cluster that moved the chemical industry up the value chain.
Selangor contributes the lion share of manufacturing production in Malaysia with most
of the industries strongly contributing to the total output. Besides the chemical
manufacturing industry, automotive, electrical and electronics, construction, food
manufacturing and metal industries are also among the high performing industries in
Selangor. These industries are highly dependent on the chemical industry, which is a
resource-based industry that caters raw and intermediate input to all these industries.
The chemical industry cluster in Selangor produces a large volume of specialty
chemicals for all this industries and strongly assists all these industries to move up the
value chain.
2. Pioneering the chemical industry: The exuberant role played by the chemicals industries
could be traced back to the 1980’s, when Selangor was identified as the top region for
chemical industry cluster under IMP2. Since then, many pioneer chemical
manufacturing firms were established in Selangor such as Southern Acids, Henkel,
Malaysian Adhesive and Chemicals (MAC), Sissons, ICI, Nylex, CCM Chemicals and
others. These firms later became the major chemical players in Malaysia. Moreover, at
the initial stage, the chemical firms concentrated on a selected product segments in their
respective chemical domain, but now they are manufacturing a more diverse range of
products. This is due to the increasing demand for chemical and chemical products by
other industries and due to colossal demand from the overseas market.
244
3. Coverage of both upstream and downstream chemical manufacturing activity and with
the highest sales revenue: Prior 1980s, the chemical manufacturing industry focused on
the upstream segment, giving greater attention to limited list of petrochemicals. A small
scale of other chemical products was produced through high dependence on imported
intermediates. This scenario changed with the first innings of the industrial master plan
(Malaysia, 1986). The government formulated various strategies to promote the
downstream segment of the chemical industry. This in return inflated the number of
chemical manufacturing firms in Malaysia, primarily those focusing on the downstream
activities. Based on statistic derived from the Companies Commission of Malaysia
(SSM) for the year 2013, out of the 573 C&CPM establishments, 48.2% of firms are
located in the Selangor cluster. Furthermore, the Selangor cluster accounted for the
largest share of chemical manufacturing firm’s total sales revenue, which is 35.8% of
RM 58,420 billion. Furthermore, the establishment of chemical manufacturing firms
follows a certain pattern. The upstream segment of the firms consists both foreign and
domestically owned multinational corporations that manufacture mainly basic
petrochemicals and oleo-chemicals. In addition, these firms largely fall under the large
industry classification. Meanwhile, the downstream segment consists of high value
added range of chemical products, which are dominated by domestically owned firms.
Moreover, these firms fall under the small and medium industry classification. For all
the industry classification (large, small and medium), Selangor exhibits the highest sales
revenue, as shown in Figure 6.2. For the large industry classification, the total sales
revenue is RM 18082 billion and the Selangor cluster accounts for 33.7%.
245
Figure 6.2 : Distribution of total sales revenue of chemical manufacturing firms by state
and industry classification Source: Author’s own computation using data obtained from Companies Commission of Malaysia
Amalgamation of a diverse range of chemical sub-sectors: Based on the broad
classification, there are ten pertinent sub-sectors within the chemical industry. The list
of chemical firms provided by SSM was carefully scrutinized to only select staunch
chemical manufacturing firms. From the list 573 firms was finalized and the
information provided by SSM on the nature of their business activities was mapped into
the ten chemical sub-sectors. Figure 6.3 shows that chemical firms in the Selangor
cluster manufacture products related to all the ten sub-sectors. The firms in Selangor
dominate the manufacturing activities in the each sub-sector. This shows that the
chemical industry in Selangor is a vibrant industry.
To examine the distribution of manufacturing activities within the Selangor cluster, the
manufacturing activities within the ten sub-sectors were further divided according to the
relevant firm’s industry classification (large, medium and small). It is evident that
establishments within the sub-sectors consist of large, medium and small business
classification (see Figure 6.4).
0 10 20 30 40 50 60 70 80 90 100
Large
Medium
Small
Percentage
Industry classification
Selangor Johor Pulau Pinang W.P Kuala Lumpur Pahang Terengganu Others
246
Figure 6.3 : Classification of chemical manufacturing activities into sub-sectors by states Source: Author’s own computation using data obtained from Companies Commission of Malaysia and
Federation of Malaysian Manufacturers (FMM) directory
The distribution is logical because establishments from the petrochemicals and oleo-
chemicals sub-sector dominate the large business classification, as they are the prime
providers of raw material and resources to other sub-sectors within the industry and
other industries. Next, establishment that produces intermediate chemicals fall into the
large and medium classifications, such as industrial chemicals and plastic in the primary
sub-sector. Lastly, establishment for specialty chemical based sub-sectors (agriculture
chemicals, industrial gases, adhesive and sealants, paint and coatings, printing ink and
dye, soap, detergent and cosmetics) that provide greater downstream value added
chemical products are concentrated in the small and medium business classification.
Therefore, it can be concluded that the chemical manufacturing firms are strategically
distributed within the chemical value chain and contribute to employment and sales
revenue for all the business classifications for the state of Selangor.
0 10 20 30 40 50 60 70 80 90 100
Industrial Chemicals
Agriculture Chemicals
Plastic in Primary Form
Adhesives & Sealants
Paint & Coatings
Printing Ink & Dye
Industrial Gases
Soap, Detergent,…
Petrochemicals
Oleochemicals
Percentage
Industry
Selangor Johor Pulau Pinang Others
247
Figure 6.4 : Distribution of Selangor’s chemical manufacturing firms according to sub-
sectors and within larger, medium and small business classification. Source: Author’s own computation using data obtained from Companies Commission of Malaysia FMM
directory
4. Employment creation: The discussion above provided supporting basis to remark that
chemical manufacturing firms in Selangor create employment not only within the
chemical industry but also other industries due to their strong linkages. The employees
in the chemical industry are well-paid, where the manufacture of basic chemicals,
fertilizers and nitrogen compound, plastic and synthetic rubber in primary forms was
ranked at the second position as the highest average salaries and wages providers
(DOSM, 2013).
Besides the dominance reflected by the state of Selangor over Johor and Penang in terms
largest share of total revenue (see Figure 3.15) (i.e., both collectively and by business
categories - small, medium and large), highest coverage of both upstream and downstream
chemical activities and having the biggest number of firms in each 10 chemical clusters. All
the three states reflected similar traits from the aspects of foreign capital flow and
0
10
20
30
40
50
60
70
80
Percentage
Sub-sectors
Large Medium Small
248
production of diversified chemical products and strong forward and backward linkages (i.e.,
within and outside the chemical industry) (see Figure 6.3). The three states had the largest
share of total capital investment in approved manufacturing projects and number of
manufacturing projects approved by state from 2008-2014 (see Figure 3.7). Therefore,
looking into the similarities and also the dominance reflected by the state of Selangor, the
selection of sample from the state of Selangor was practical as it effectively represents the
total population.
Based on the list obtained from the Companies Commission of Malaysia, there was a
total 573 establishment under the chemical manufacturing industry category in Malaysia.
Approximately 276 establishments are based in Selangor. The establishments were then
categorized into large, medium and small business classifications using the total sales
revenue information. Among the 275 firms, 55 firms are classified as large firms, 77 firms
as medium and 144 as small. For the purpose of this study, only large and medium sized
firms were selected as past studies have showed that larger firms present greater eco-
innovative behavior (Przychodzen & Przychodzen, 2015). Therefore, it was a great deal to
focus only on the large and medium classifications, which consists of 132 firms. The Web
survey questionnaire was emailed to all the 132 C&CPM firms in Selangor. The data
collection method is discussed in depth in the following section.
6.5.1.1 Sample Size Test
Prior to the data collection, once the EI Framework was finalized, Gpower software version
3.1 (Faul, Erdfelder, Lang, & Buchner, 2007) was used to compute the minimum sample
size required to analyze the data using PLS-SEM. Since the conceptual model consists of
249
three sub models, the model with the maximum number of predictors (4 predictors) was
used to calculate the sample size. At the power of 0.80 and effect size of 0.15, the minimum
number of sample size required to perform the analysis is 85. From the sampling frame of
132 firms, 85 responses were required (65%) to meet the initial requirements before data is
analyzed using PLS-SEM.
Data Collection Method 6.5.2
The second stage of data collection is similar to the first stage, where a primary data
collection method was employed. A Web based survey questionnaire was used for the data
collection purpose. The Web based data collection was assisted by SurveyMonkey-
Audience (1999), this online platform is accessed via
www.surveymonkey.com/mp/audience. Web survey was primarily selected as it could
preferably increase the response rate, as conventional methods such as mail survey is
deemed inefficient due to low response rate (Harbaugh, 2002, p. 70).
Web survey managed to tackle the main issue to increase response rate, which is the key
informant. The respondents for this study are required to have certain information regarding
pollution mitigation in their organizations. This was a challenge as key informants are
highly occupied with organizational responsibility (Hunt & Chonko, 1987). Therefore,
there are high chances that they might not reply the mailed questionnaire or reject it
outright. By using a Web survey this chances was reduced based on several techniques
suggested by Kanuk & Berenson (1975) to increase response rate. Techniques such as
preliminary notification, follow-up techniques and survey sponsorship were adopted in this
study.
250
Preliminary notification: The list of companies was obtained from the Companies
Commission of Malaysia. Contact details of firms were searched form the Federation of
Malaysian Manufacturers directory and online databases. The corporations were first
contacted through a telephone call and brief information was provided regarding the
survey, then the contact details of the specific person in charge of environmental issues in
their organization was requested. For firms whose contact details were difficult to obtain,
support from personal industrial contacts and linkages was used to acquire their details. The
key respondent was contacted through either telephone or email before the web survey was
directed to them. This action developed a personal level of commitment between the
respondents to answer the survey.
Follow-up: The Web survey allowed a strategic monitoring of the respondents, as it
provided the counts of those who have responded, not responded and provided partial
responses. Respondents who did not reply within one week, reminder via email was sent,
and followed by a phone call if there was no feedback after two weeks. Majority of the
respondents answered after the first reminder. Obtaining feedback from the respondents
was easy as majority of the sampling frame consists of large and medium sized firms. Most
of the large firms are responsible towards the environment and responded quickly to the
survey. It was convenient as these large and medium sized firms had a specific department
that managed their environmental issues.
Survey sponsorship: To increase the level of confidence and sense of urgency to answer
the survey a supporting letter from the Ministry of Energy, Green Technology and Water
Malaysia (KeTTHA) was obtained. The information obtained from this this study is used to
prepare a policy prescription paper for the ministry this was clearly mentioned in the letter
(see Appendix A), which helped ease the process of data collection and to increase
251
response rate. With all the precautions taken to reduce the response bias, the Web survey
questionnaire link was emailed to 132 chemical manufacturing firms.
Final Survey 6.6
Questionnaire Format and Administration 6.6.1
The study adopted a web based questionnaire survey; the survey consists of three main
sections (see Appendix B). The first section provides a brief description on the purpose of
the study and introduction to eco-innovation. This section provided information on how to
answer the 7-point Likert-scale questions. The second section (Section A) was structured to
collect firm’s demographic information, which included among other, the county where
their global headquarters is situated, firm ownership, number of employees, export revenue
and list of export destinations.
Section C was aimed to collect information related to firm’s EI initiatives. The final
section was designed to obtain information associated to their EI determinants. In section
C, a binary scale was used to collect the information and a Likert scale was used for section
D. For the 7-point Likert scale questions, the answers were placed at the scales and
respondent were required to choose the answer in the following manner:
1. Circling 1: completely agree with the answer on the left-hand side
2. Circling 2: largely agree with the left-hand side
3. Circling 3: somewhat agree with the left-hand side
4. Circling 4: opinion is indifferent between the two answers
5. Circling 5: somewhat agree with the right-hand side
252
6. Circling 6: largely agree with the right-hand side
7. Circling 7: completely agree with the answer on the right-hand side
The data collection process continued for approximately four months, within September
2015 and January 2016.
Data Preparation 6.6.2
In the process of data preparation, the data was organized into a spreadsheet, through a
series of manual coding and missing values were identified. However, by using the Web
survey, this process was not conducted. The Web based database was automatically
transported to a spreadsheet. It was then immediately scrutinized for incomplete response
and missing values. A total of 102 respondents participated in the Web survey. However,
only 97 responses completed. The remaining five responses was rejected as the participants
only provided answers for approximately 10 to 20 percent of the questions.
Once the data was cleaned, the information was transferred to SPSS version 22.0. The
purpose of this action was to generate exploratory analysis to detect missing values and to
ensure data consistency between the amount of data collected from the Web survey and the
data transported to the spreadsheet. Next, the missing values were detected and treatment
was provided to the missing values using expectation maximization technique. Third, the
data was assessed for common method bias and normality. Finally, descriptive statistic was
generated and the data was converted to CSV format to support Smart PLS version 3.2.2
for data analysis.
253
Descriptive Statistics of Firms 6.6.3
This section provides the demographic background of the firms responded to the Web
survey (see Table 6.13). The response rate was 73.5% (97 responses /132 views). From the
responses, 68% of the firms, their headquarters are based in Malaysia. For rest of the 32%
of firms, headquarters of 11% of the respondents is based in Europe, followed by Japan
(7.2%) and United States (5.2%). The higher percentage of firms with headquarters in
Malaysia could be due to the share of domestic and foreign ownership. Meanwhile, 48.5%
of the firms acknowledged that their share of domestic ownership is between 76 – 100%,
which implies that almost half of the firms are largely domestically owned. This is further
supported by 45.4% of firms indicating that they do not have any share of foreign
ownership. However, the fact that there is a potential foreign influence in the firms cannot
be discarded as 44.3% of the firms informed that foreign ownership between 26 – 75% does
exist. On the other hand, state ownership was apparent in ten firms, and among them 50%
indicated a state ownership between 76 – 100%.
For employment figures, two range that dominated the responses are, 100 employees
and below and between 151 – 500 employees, where 38.1% or firms falls under the first
range and 28.9% in the latter range. Additionally, almost 14 % of the firms denoted that
they have employees more than 1000. For the purpose of this study, it was important for the
responses to be from exporting firms, as export is one of the EI determinant examined.
Based on the feedback, all the responses indicated they are exporting firms as export
revenue is generated. Firms with export revenue of less than 10% were among the majority
(34%). However, it is important to acknowledge that a large sum of firms have also
generated export revenue in the higher range. Where 24% of firms generated export
254
revenue in each of the range, 11 – 25 % and over 50%. Lastly, firms export destination was
also explored. Each firm was required to list two of their main export destinations. From
the Web survey, 17 countries was identified as main export destinations. The statistical
figures showed that the top three export destinations are China (39.2%), Indonesia (36.1%)
and Singapore (20.6%). Among the top ten export destinations are dominated by Asian
countries. However, 14.4% firms exported to European Union and 9.3% exported to Unites
States. Other bottom seven interesting export destinations are India (8.2%), Middle East
(7.2%) and South Africa (3.2%). The export destinations are mix of both countries that
impose stringent and lax environmental standards.
Table 6.13 : Firms demographic information
Demographic Frequency
(n=97)
Percentage
(%)
Headquarters
Malaysia 66 68.0%
Europe 11 11.3%
Japan 7 7.2%
United States 5 5.2%
Singapore 2 2.1%
Korea 2 2.1%
Australia 1 1.0%
China 1 1.0%
Taiwan 1 1.0%
U.A.E 1 1.0%
Ownership
- Domestic ownership
None 16 16.5%
25% or less 5 5.2%
26 – 50% 15 15.5%
51 – 75% 14 14.4%
76 – 100% 47 48.5%
- Foreign ownership
None 44 45.4%
25% or less 10 10.3%
26 – 50% 12 12.4%
51 – 75% 15 15.5%
76 – 100% 16 16.5%
- State ownership
None 87 89.6%
25% or less 3 3.1%
26 – 50% 2 2.1%
51 – 75% 0 0.0%
76 – 100% 5 5.2%
255
Table 6.13 : Firms demographic information - continue
Demographic Frequency
(n=97)
Percentage
(%)
Employment
< 100 37 38.1%
101 – 150 6 6.2%
151 – 500 28 28.9%
501 – 1,000 12 12.4%
1,001 – 5,000 6 6.2%
> 5,000 8 8.2%
Export revenue
None 0 0.0%
10% or less 34 35.1%
11 – 25% 24 24.7%
25 – 50% 15 15.5%
Over 50% 24 24.7%
Major export destination
China 38 39.2%
Indonesia 35 36.1%
Singapore 20 20.6%
Thailand 14 14.4%
European Union (Including UK) 14 14.4%
Japan 13 13.4%
United States 9 9.3%
India 8 8.2%
Korea 8 8.2%
Australia 7 7.2%
Vietnam 6 6.2%
Taiwan 5 5.2%
South Africa 3 3.1%
Myanmar 2 2.1%
Sri Lanka 1 1.0%
Brunei 1 1.0%
*Information not provided 3 3.1%
Descriptive Statistic of Instrument 6.6.4
Table 6.14 outlines the mean, standard deviation, minimum value and maximum value for
all the indicators that were analyzed in this study. The descriptive statistics was obtained
using Smart PLS version 3.2.2.
256
Table 6.14 : Descriptive statistics
Construct Indicator N Minimum Maximum Mean Standard
deviation
Eco-Process EP 97 0 6 3.00 1.732
Eco-Organizational EO 97 0 3 1.66 1.073
Eco-Product EPR 97 0 3 1.45 1.149
Regulation stringency RS1 97 1 7 4.10 1.576
RS2 97 1 7 3.74 1.424
RS3 97 1 7 4.10 1.550
Environmental
regulation
ER1 97 1 7 3.41 1.511
ER2 97 1 7 3.27 1.477
ER3 97 1 7 3.19 1.481
Green skills GS1 97 1 7 4.57 1.617
GS2 97 1 7 4.61 1.366
GS3 97 1 7 4.43 1.435
GS4 97 1 7 3.78 1.581
Environmental
collaboration
EC1 97 1 7 4.60 1.493
EC2 97 1 7 4.15 1.409
EC3 97 1 7 4.41 1.497
Environmental
knowledge
EK1 97 1 7 5.11 1.406
EK2 97 1 7 5.03 1.418
EK3 97 1 7 4.81 1.501
EK4 97 1 7 4.68 1.389
Environmental strategies ES1 97 1 7 4.55 1.464
ES2 97 1 7 5.07 1.772
ES3 97 1 7 4.83 1.310
ES4 97 1 7 4.81 1.292
ES5 97 1 7 5.13 1.449
Consumer pressure CP1 97 1 7 4.27 1.353
CP2 97 1 7 4.07 1.326
Financial resources FR1 97 1 7 3.72 1.494
FR2 97 1 7 3.90 1.520
FR3 97 1 7 3.79 1.533
Export behavior EB1 97 1 7 5.10 1.602
EB2 97 1 7 4.87 1.620
Verifying Data Characteristics 6.6.5
This section describes the methods used to verify the data prior an advanced level of
analysis was carried out. The main testing executed to the check for data normality, missing
value and common method bias.
257
6.6.5.1 Missing Data
Missing values were present in the data. Twelve items were detected to have missing values
but the percentage was small, between 1 to 2% for each item. To rectify this problem, at the
first stage, Little’s MCAR test was executed to determine whether the data is missing
completely at random. The chi-square statistics value was computed to determine whether
data missing completely at random is denoted as Little’s MCAR. If the value is not
significant, i.e. p. > 0.05, then the null hypothesis is failed to be rejected and the data is said
to be missing completely at random. The test results for this study indicated chi-square =
229.852 (df = 283; Sig. = 0.921), which signifies that the data is missing at random. Thus,
in the second stage, expectation maximization (EM) technique was used to replace the
missing values. EM uses an iterative processing method, where all the variables that are
related to the construct are used to forecast the missing values. EM is touted to be a highly
accurate and consistent technique for missing data imputation as compared to mean
replacement and list-wise techniques (Graham, Hofer, Donaldson, MacKinnon, & Schafer,
1997).
6.6.5.2 Data Normality
The data normality for the study was inspected first by using Shapiro-Wilk’s test (p-value >
0.05) (Razali & Wah, 2011). The test indicated that all the variables have a significant
value of zero, which implies that the data is not normally distributed. Next, the histograms
were visually examined and the skewness and kurtosis was calculated. From the test, the
skewness and kurtosis values deviated from zero, providing evidence that the data is not
normally distributed. However, a little departure from zero is acceptable with conditions
258
that the values are not extremely large than their standard errors (SE). The skewness and
kurtosis values was divided with the SE to obtain the z-values (Cramer, 1998; Doane &
Seward, 2011) . More than 85% of the z-values were within the accepted range of ± 1.96
(Cramer & Howitt, 2004) (see Table 6.15). The skewness and kurtosis are still within the
recommended range of ± 3 (Klien, 2011). The data is a little skewed and kurtotic but do not
extremely deviate from the normality. Nevertheless, the fact that the data is non-normal
cannot be disregarded. The non-normal nature of data supported the use PLS-SEM for data
analysis.
Table 6.15 : Skewness and Kurtosis
Construct Indicator Skewness (S) z-value
(S/SE)
Kurtosis (K) z-value
(K/SE)
Regulation
stringency
RS1 -0.237 -0.97 -0.774 -1.60
RS2 0.162 0.66 -0.424 -0.87
RS3 -0.107 -0.44 -0.666 -1.37
Environmental
regulation
ER1 -0.075 -0.31 -0.892 -1.84
ER2 0.131 0.53 -0.566 -1.17
ER3 0.109 0.44 -0.902 -1.86
Green skills GS1 -0.490 -2.00 -0.566 -1.17
GS2 -0.340 -1.41 -0.120 -0.25
GS3 -0.437 -1.78 -0.271 -0.56
GS4 -0.001 -0.01 -0.930 -1.92
Environmental
collaboration
EC1 -0.353 -1.44 -0.385 -0.79
EC2 0.080 0.33 -0.490 -1.01
EC3 -0.081 -0.33 -0.621 -1.28
Environmental
knowledge
EK1 -0.499 -2.04 -0.533 -1.10
EK2 -0.607 -2.48 0.160 0.34
EK3 -0.178 -0.73 -1.091 -2.25
EK4 -0.441 -1.80 -0.404 -0.83
Environmental
strategies
ES1 -0.554 -2.26 -0.384 -0.79
ES2 -0.826 -3.37 -0.208 -0.43
ES3 -0.360 -1.47 -0.457 -0.94
ES4 -0.440 -1.80 -0.199 -0.41
ES5 -0.653 -2.67 0.036 0.07
Consumer
pressure
CP1 -0.344 -1.40 -0.097 -0.20
CP2 0.191 0.78 -0.447 -0.92
Financial
resources
FR1 0.072 0.29 -0.566 -1.17
FR2 0.038 0.16 -0.481 -0.99
FR3 -0.117 -0.48 -0.670 -1.38
Export behavior EB1 -0.843 -3.44 0.087 0.18
EB2 -0.462 -0.585 -1.21
Note: SE=Standard error, Skewness SE = 0.245, Kurtosis SE = 0.485
259
6.6.5.3 Common Method Bias
Common methods bias is inherent when self-reported instruments are used to measure more
than one construct. The instrument consists of numerous item scales inside a single survey,
which is responded by a key informant. This leads to spurious effect not because of the
construct being measured but due to the measurement instrument itself (Podsakoff,
MacKenzie, Lee, & Podsakoff, 2003). For most of the constructs in this study, respondents
are required to report their perception in the same survey. The respondent’s own view on
the environmental protection and preparedness to answer the questionnaire, which is
independent from the actual correlation between the constructs that are measured, is likely
to cause spurious correlation.
To reduce the comment method bias, items that were adapted were carefully screened
during the development stage. The items were worded carefully to avoid social desirability.
Items developed from the interview findings was structured as technical items rather than
directly wording them based on the outcomes of the interviews. A psychological separation
(Podsakoff, MacKenzie, & Podsakoff, 2012) was executed between the items, where the
information on the scales was changed when moving from one construct to another and
between the items to inhibit previous memory to influence the items being reported. With
regard to all the precautions, the potential common method variance may not be entirely
removed.
Finally, the widely applied method to assess the common method variance, Harman's
(1976) one factor-test was applied once the data was collected. For the purpose of the test,
all the variables were subjected to exploratory factor analysis. The aim of this analysis is to
assess the results of the un-rotated factor solutions (Andersson & Bateman, 1997; Aulakh
260
& Gencturk, 2000). A single factor is expected to emerge from the analysis or one main
factor that accounts for the majority of the covariance in independent and criterion
variables is expected to appear if common method variance is a critical problem (Podsakoff
& Organ, 1986). The results extracted seven factors that had Eigen values greater than one.
The un-rotated factor structure did not reveal any main factor, with factor 1 accounting for
32.21% of the variance. Therefore, common method variance is not an issue for this
questionnaire design.
Data Analysis Method 6.7
Partial Least Squares (PLS) 6.7.1
PLS-SEM was selected primarily due to four reasons. First, the study is exploratory in
nature. The determinants of EI are yet to be extensively explored in the context of
developing country. Second, once the data was collected, it exhibited non-normality. Next,
the sample size was small as targeted group of firms were selected. Lastly, the conceptual
model that emerged from the literature and interview findings consists of three sub-models,
which required a more robust analysis method. All the issues highlighted are entertained by
PLS-SEM (Hair, Hult, Ringle, & Sarstedt, 2014; Peng & Lai, 2012), thus making it the
most appropriate method for this research.
6.7.1.1 Construct Type
Multiple items were used to measure the entire latent variable in this research model. All
latent variables were reflective. It is essential to determine whether the measurement model
261
is formative or reflective, because misspecification leads to measurement error and affects
the validity of the structural model (Jarvis, MacKenzie, & Podsakoff, 2003). For a long
time, reflective latent variables are commonly used in the management and social science
research (Hair, Hult, Ringle, & Sarstedt, 2014).
Reflective indicators are a set of all possible items that belongs to a related latent
variable and are correlated among each other. Therefore, the items of a reflective latent
variable could be used interchangeably and an item can be eliminated without changing the
meaning of the latent variable, as long as the latent variable achieves adequate reliability.
The direction of causality is from the latent variable to the measure. As the indicators for a
particular latent variable is highly correlated, a reflective latent variable should be
consistent internally. Therefore, it is important to assess this constructs for reliability and
validity (Petter, Straub, & Rai, 2007). To assess reliability and validity of the measurement,
model certain criterion and test was conducted, which is described in the following section.
6.7.1.2 Measurement Model (Reliability and Validity)
The measurement models represent the properties of the path model that illustrates the
relationship between the indicators and the latent variable. In PLS-SEM, this model is
commonly referred as the outer model. To ascertain the reliability and validity of the
measurement model; the model is assessed for convergent validity and discriminant
validity. Factor loading (internal consistency), average variance extracted and composite
reliability are used to inspect convergent validity. The discriminant validity is detected
using Fornell-Larcker criterion, cross-loadings and HTMT criterion. The following sub-
sections explain the standards used to assess the measurement model.
262
6.7.1.2.1 Internal Consistency
For PLS-SEM, composite reliability (CR) measure is used to evaluate the internal
consistency as compared to the traditional method, which is Cronbach’s alpha (CA) (Chin,
1998). The strength of internal consistency measure in PLS-SEM is applauded because it
ranks the indicator based on their individual reliability, while CA assumes that all the
indicators are uniformly reliable. Therefore, CR is more robust as it counts for the
dissimilar outer loadings of the indicator variable, making it a more preferable option to
measure internal consistency compared to CA (Hair, Hult, Ringle, & Sarstedt, 2014, p.
101). Composite reliability is computed by dividing square of the summation of the factor
loadings with the total of square of the summation of the factor loadings plus squared
summation of the error variances. CR takes the value between 0 and 1. To indicate
sufficient internal consistency or convergence, CR should be 0.7 or greater (Gefen, Straub,
& Boudreau, 2000; Segars, 1997).
6.7.1.2.2 Indicator Reliability
Assessment of the indicator reliability allows the researcher to determine the amount of
indicator variance that is described by the latent variable. If a construct has higher outer
loadings, it reflects that both the item and construct are in common i.e. the item contributes
to a large portion of the constructs meaning. According to Chin (1998), the indicators outer
loadings should be a minimum of 0.7 and statistically significant. This rule of thumb is
used because the communality of an item, which is the square of a standardized indicators’
outer loading should be equal to 0.5. This value implies that 50% of the indicator variance
is explained by the latent variable. Therefore, to have 50% of indicator variance explained,
263
the outer loadings should be 0.708 (0.7082
= 0.50). On that note, 0.7 is an accepted level as
it is adequately close to 0.708. Figure 6.5 is used to clarify this matter further. Values
shown on the arrows pointing to X1, X2 and X3 are factor loadings. The square of these
values provides the variance extracted (VE), for example, VE for X1 is 0.7252
= 0.526. This
value indicates that 52% of variance in X1 is explained by the latent variable.
Figure 6.5 : Measurement model example
Weaker loadings are given due attention is social science studies especially when the
scales are newly developed. Before an item with outer loading of below 0.7 is eliminated,
the change that this elimination causes on composite reliability and construct content
validity is observed. If content validity is not affected and the value of composite reliability
is not inflated, the deletion of the item can be aborted (Hair et al., 2014). However, it is
suggested that items with an outer loadings 0.4 should be removed (Hair, Ringle, &
Sarstedt, 2011; Hulland, 1999).
6.7.1.2.3 Convergent Validity
Convergent validity is the degree to which items for a single construct correlates positively
with each other. For convergent validity to exist the outer loadings should contribute to a
0.725
X1
X2
X3
Latent
Variable
0.821
0.755
Factor loading
264
high portion of variance, which is referred as indicator reliability (discussed in the earlier
section). Additionally, average variance extracted (AVE), which is commonly identified as
the grand mean value of the squared loadings should be more than 0.5 (Hair et al., 2014).
AVE is calculated by dividing summation of squared factor loadings with the total of
summation of squared factor loadings multiplied with summation of error variances. Values
depicted in Figure 6.5, in the previous section are transferred to Table 6.16 to illustrate how
AVE is roughly computed. AVE is obtained by dividing total VE with the number of items
for the latent variable. Therefore, it can be purported that on average the latent variable
explains 59% of the variance of its indicators. Fornell & Larcker (1981) and Bagozzi, Yi, &
Phillips (1991) suggested that for sufficient convergent validity to exist, AVE should
exceed 0.5.
Table 6.16 : Convergent validity– Average Variance Extracted (AVE)
Item Factor Loadings
(FL)
Variance Extracted (VE) = FL2
X1 0.725 0.526
X2 0.821 0.674
X3 0.755 0.570
Total (VE) 1.77
Average Variance Extracted (AVE) 1.77/3=0.59
6.7.1.2.4 Discriminant Validity
Discriminant validity accentuates the uniqueness of a particular latent variable, by
indicating its capability to apprehend a phenomenon that is not characterized by other latent
variable in the model (Hair et al., 2014). The items of a particular latent variable should
constitute to strongly measuring that latent variable and do not unintentionally correlate
with other latent variables (Urbach & Ahlemann, 2010). Commonly used method is the
PLS to assess that discriminant validity are cross-loadings and Fornell-Larcker’s criterion.
265
Testing discriminant validity under Fornell-Larcker’s criterion requires the comparison
among the square root of average variance extracted (AVE) and the correlations
coefficients among the latent variables. The square root value of AVE has to be greater than
the value of correlation coefficient between the latent variables (Chin, 2010; Fornell &
Larcker, 1981). Technically, this method describes that a latent variable should share more
variance with its connected indicators that with any other latent variable (Hair et al., 2014).
The next method is cross-loadings; this method is labeled more liberal as compared to
Fornell-Larcker’s criterion (Hair et al., 2011). Discriminant validity under this method is
not a problem, when an indicator’s outer loadings on the designated later variable is higher
than all of its loadings on the other latent variables in the model (Hair et al., 2014). If this
condition is satisfied, then it can be concluded that specific indicators belonging to a latent
variable are not substitutable.
Recently, from both the methods, Fornell-Larcker criterion was criticized to exhibit lack
of reliability to detect discriminant validity (Henseler, Ringle, & Sarstedt, 2015). Henseler
et al. (2015) proposed a new solution and executed a Monte Carlo simulation to prove the
command of this method. The suggested approach to assess discriminant validity is built
upon multitrait-multimethod matrix, which is referred as heterotrait-monotrait (HTMT)
ratio of correlations. Discriminant validity is assessed through two modes as following:
1. Criterion method: The HTMT value should not be greater than 0.85 or 0.90, where
each of this HTMT’s are denoted as HTMT.85 (Klien, 2011) and HTMT.90 (Gold,
Malhotra, & Segars, 2001).
2. Statistical testing method: Hypothesis testing is executed, where the null (H0) is
HTMT ≥ 1 and the alternative (H1) is HTMT < 1. Discriminant validity is not
266
established if the confidence interval consists of the value 1. This testing is denoted
as HTMT inference (Henseler et al., 2015).
However, even though discriminant validity is assessed using three deferent assessment
types, HTMT.85 is found to be the most conservative and reliable method. HTMT.85 has the
capability to detect lack of discriminant validity under circumstances where HTMT.90 and
HTMT inference has confirmed existence of discriminant validity (Henseler et al., 2015).
Summary 6.8
This chapter exhibited the refined EI framework by taking into account the literature and
interview findings. Then by understanding the linkages between the constructs, testable
hypotheses were set forth. Additionally, the constructs were also reframed based on the
information obtained from the literature and interviews. Furthermore, in this chapter,
detailed description is provided on how issues pertaining to measurement, sampling and
data collection were handled. Lastly, the data analysis method employed to assess the
hypothesis was also discussed, which is further elaborated in the next chapter.
267
CHAPTER 7 : QUANTITATIVE FINDINGS
Introduction 7.1
This chapter intends to achieve the third and last objective of the study, which is to examine
the determinants of eco-innovation in the chemical manufacturing industry. A Partial Least
Squares (PLS) technique was used to test the hypothesis of the study using SmartPLS 3.0
software (Ringle, Wende, & Becker, 2015). First, an analysis to ascertain the validity and
reliability of the measurement was conducted, followed by the examination of the structural
model as suggested by Anderson & Gerbing (1988).
Assessment of the Measurement Model 7.2
This study employed the two phase approach recommended by Anderson & Gerbing
(1988). The first phase involves the assessment of the measurement model to confirm the
reliability and validity of the model. The criteria used to assess the reliability and validity,
as explained in section 6.7.1.2 is summarized in Table 7.1. In this phase, these criteria are
used to assess the convergent and discriminant validity.
Table 7.1 : Criteria’s to assess the measurement model Validity/
Reliability
Criterion Standards
1. Internal
Consistency
Composite
reliability (CR)
CR > 0.7
2. Indicator
reliability
Indicator loadings Item’s loadings > 0.7, < 0.7, check for CR and AVE before
removing the item. > 0.4 advisable to remove.
3. Convergent
validity
AVE AVE > 0.5
4. Discriminant
validity
Cross Loading
Fornell-Larcker
HTMT
-All the indicators outer loadings belonging to a specific
construct should be the highest as compared to the outer
loadings of other indicators on the construct.
-Square root AVE of a construct should be greater than the
correlation between the construct and other constructs
-HTMT.85 < 0.85
268
Convergent Validity 7.2.1
Based on Table 7.2, the models outer loadings are all fairly above 0.7, the composite
reliabilities and AVE values for all the constructs are above the recommended threshold
value, where CR is > 0.7 and AVE is > 0.5. However, one item (FR3) was removed, as the
value of its outer loading was 0.532. The removal was supported as it increases the value of
CR from 0.860 to 0.942 and the value of AVE from 0.685 to 0.890. The item did not
impose any constrain on the meaning of the construct as all the items for the constructs
belong to the same dimension i.e. financial barriers. In totality, the assessment of the
measurement models loadings, composite reliability, AVE provide adequate evident to
establish convergent validity. This indicated that the measures of constructs that were
determined through the literature and interview findings are in fact related.
Table 7.2 : Convergent validity of measurement model
Construct Item Loadings AVEa
CRb
Eco-Innovation EP 0.800 0.654 0.850
EO 0.806
EPR 0.820
Regulation stringency RS1 0.813 0.683 0.865
RS2 0.728
RS3 0.926
Environmental regulation ER1 0.948 0.775 0.911
ER2 0.946
ER3 0.730
Green skills GS1 0.776 0.698 0.902
GS2 0.922
GS3 0.868
GS4 0.766
Environmental collaboration EC1 0.860 0.723 0.887
EC2 0.802
EC3 0.887
269
Table 7.2 : Convergent validity of measurement model - continue
Construct Item Loadings AVEa
CRb
Environmental knowledge EK1 0.864 0.760 0.927
EK2 0.891
EK3 0.901
EK4 0.828
Environmental strategies ES1 0.729 0.639 0.898
ES2 0.779
ES3 0.877
ES4 0.860
ES5 0.740
Consumer pressure CP1 0.894 0.799 0.888
CP2 0.894
Financial resources FR1 0.923 0.890 0.942
FR2 0.959
Export behavior EB1 0.953 0.895 0.945
EB2 0.939
aAVE = (summation of squared factor loadings)/(summation of squared factor loadings) (summation of error
variances) bComposite reliability = (square of the summation of the factor loadings)/[(square of the summation of the
factor loadings) + (square of the summation of the error variances)]
Discriminant Validity 7.2.2
For discriminant validity, all three criteria suggested by the researcher were used to prove a
solid grounding of the measurement model. The first criterion is Fornell-Larcker as shown
in Table 7.3. The values that represent the square root of AVE are on the diagonal (bolded),
while the correlation between the construct are placed right below the square root of the
AVE. From the table it is evident that the discriminant validity criteria are met, where the
square root of every construct AVE is larger than the construct correlation with other
Thank you for participating in this survey. Your contribution is highly appreciated.
339
Section A: Company Background
i In which country is your enterprise global headquarters?
Country
:
ii Please indicate (roughly) the percentage of your company that is:
Owned by domestic
private sector:
%
Foreign-owned: %
State-owned (if any): %
iii What is the approximate total number of employees in the enterprise that
you work in?
Number of employees:
vi How much of your enterprise revenue is
generated by exports?
v Please list two main export
destination (countries) of
your enterprise. None 26 - 50%
10% or
less
Over 50%
11 -
25%
a.
b
.
Important information to assists you in answering the survey i Eco- innovation is a new or significantly improved product (good or service),
process, organizational method that creates environmental benefits. For example, reduce pollution and promote sustainable use of materials and resources.
ii The eco-innovation must be new to your enterprise, but they do not need to be new to your market.
iii The eco-innovation could have been originally developed by your enterprise or by other enterprises.
iv The environmental benefits can be the primary objective of the innovation or the result of other innovation objectives.
v The environmental benefits of an innovation can occur during the production of a good or service, or during the after sales use of a good or service by the end user.
340
Section B: Eco-Innovation
During the five years, from 2010 to 2015, did your
enterprise introduce any new or significantly
improved of the following:
Please
tick
(✓)
If yes, please
tick (✓)
whether the
environmental
innovation is
MAINLY
through
enterprise own
creation or
adoption:
Ye
s
N
o
Develope
d by our enterprise
(OWN
Creation)
Adoption
EP1 Cleaning technology that treat pollution released into
the environmnet: Pollution control technologies for air,
water & soil (Scrubbers/dust collection system/waste
water treatment)
EP2 Cleaner process technologies: New manufacturing
processes that are less polluting and/or more resource
efficient than relevant alternatives
EP3 Waste management technologies/equipment's
(Incinerators/recycling equipment)
EP4 Environmental monitoring technologies and
instrumentations
EP5 Noise and vibration control technologies
EP6 Green energy technologies (solar/wind/bioenergy)
EO1 Pollution reduction/prevention schemes that address
resource reduction, reuse and recycling, and energy
consumption: Which eliminates wasteful management
practices
EO2 Formal systems of environmental management
involving measurement and reporting. For example ISO
14001, EMAS and other
EO3 Chain management: cooperation between companies so
as to close material loops and to prevent environmental
damage across the value chain
EPR
1
New environmentally improved products or services for
end users
341
EPR
2 Products that will have lower emissions when used
EPR
3 Products that are more energy efficient
Section C: Drivers of Environmental Innovation
RS1 How would you assess the stringency of the environmental regulations in
Malaysia?
Very Lax 1 2 3 4 5 6 7 Extremely stringent
RS2 How would you assess the enforcement of the environmental regulations in
Malaysia?
Very Lax 1 2 3 4 5 6 7 Extremely rigorous
RS3 How would you assess the level of monitoring on your environmental activities
by regulators (for example plant inspection and environmental report
submission requirement)?
Very poor 1 2 3 4 5 6 7 Excellent
ER1 To what extent does your enterprise generate innovation with environmental
benefits in response to the existing environmental regulations or taxes on
pollution?
Not at all 1 2 3 4 5 6 7 Heavily
ER2 To what extent does your enterprise generate innovation with environmental
benefits in response to the environmental regulations or taxes that are
expected to be introduced in the future?
Not at all 1 2 3 4 5 6 7 Heavily
ER3 To what extent does your enterprise generate innovation with environmental
benefits in response to the availability of government grants, subsidies or
other financial incentives?
Not at all 1 2 3 4 5 6 7 Heavily
GS1 To what extent does your enterprise invest in training and employee
development specifically in the area of environment?
Hardly at all 1 2 3 4 5 6 7 To a great extent
GS2 How would you assess the effectiveness of your enterprise's efforts in ensuring
that employees are provided adequate environmental awareness?
Very ineffective 1 2 3 4 5 6 7 Very effective
GS3 To what extent does your enterprise assess employees
contribution/involvement in improving the environmental performance?
Not at all 1 2 3 4 5 6 7 Heavily
342
GS4 To what extent does your enterprise reward employees for environmental
improvement through promotion and pay rise?
Not at all 1 2 3 4 5 6 7 Heavily
In your enterprise, how extensive are the collaboration and networking among
groups, firms, suppliers, partners, and associations with regard to the
following:
EC1 Obtain knowledge/information/expertise related to environmental issues?
Collaboration/networking is
non-existent
1 2 3 4 5 6 7 Collaboration/networkin
g is extensive
EC2 Make joint decisions on environmental issues?
Collaboration/networking is
non-existent
1 2 3 4 5 6 7 Collaboration/networkin
g is extensive
EC3 Share enterprise's best environmental practices?
Collaboration/networking is
non-existent
1 2 3 4 5 6 7 Collaboration/networkin
g is extensive
EK1 How would you assess the effort of your enterprise to continuously update its
environmental knowledge/information (for example volatile organic
compound (VOC), list of hazardous chemicals, technical information,
procedures, environmental regulations and etc.)?
Very Poor 1 2 3 4 5 6 7 Excellent
EK2 Does you enterprise have an environmental information management system
to store environmental information (for example an internal server system,
soft copy, manual filing and etc.)?
Hardly at all 1 2 3 4 5 6 7 To a great extent
EK3 How easy is it to access the environmental information management system in
your enterprise?
Very difficult 1 2 3 4 5 6 7 Very easy
EK4 How would you assess the quality of the flow of environmental information
between every managerial level in your organization?
Very poor 1 2 3 4 5 6 7 Excellent
CP1 How do you rate your customers' awareness towards environmentally friendly
products?
Very low 1 2 3 4 5 6 7 Very high
343
CP2 How would you rate the pressure that your enterprise encounters to generate
environmental benefits stemming from consumers?
Very weak 1 2 3 4 5 6 7 Very strong
FR1 To what extent slowness in setting up financing is a barrier for your enterprise
to execute environmental projects/ activities/innovations?
Not a barrier 1 2 3 4 5 6 7 High barrier
FR2 To what extent high cost is a barrier for your enterprise to execute
environmental projects/activities /innovations?
Not a barrier 1 2 3 4 5 6 7 High barrier
FR3
To what extent no financing source is a barrier for your enterprise to execute
environmental projects/activities/ innovations?
Not a barrier 1 2 3 4 5 6 7 High barrier
ES1 To what extent does your top management communicate that addressing
environmental issues is critical?
Not at all 1 2 3 4 5 6 7 Extremely well
ES2 Who primarily handles environmental related issues in your enterprise?
No specific environmental
management department/
division/group/unit/team
1 2 3 4 5 6 7 A specific environmental
management department/
division/group/unit/ team
ES3 How would you assess the effort of your enterprise in eliminating the release
of any substances that cause environmental damage?
Poor 1 2 3 4 5 6 7 Excellent
ES4 How would you assess the effort of your enterprise to eliminate the use of
products that cause environmental damage?
Poor 1 2 3 4 5 6 7 Excellent
ES5 To what extent does your enterprise dispose physical waste through
environmentally safe methods?
Hardly at all 1 2 3 4 5 6 7 To a great extent
EB1 To what extent does your enterprise's foreign buyers require you to comply
with their environmental regulation/requirement (for example: ISO14001,
REACH, RoHS, chemical labeling and others)?
Not at all 1 2 3 4 5 6 7 To a great extent-
depending on the export
destination
344
EB2 To what extent does your foreign buyers' environmental regulations influence
your enterprise's environmental and business decision-making?