96
KESKO CMD 9 JUNE 2015

KESKO CMD9 JUNE 2015

PROGRAM
Our Strategy and Direction Mikko Helander
Changing the Scene: Back to Growth Path Jorma Rauhala
Profitable Growth from Customer Oriented Solutions Terho Kalliokoski
Combining Global Brands With Local Customer Insight Pekka Lahti
What Do You Find When You Google Kesko… Anni Ronkainen
Measuring Success – Kesko’s Financial Targets Jukka Erlund
2

3
OUR STRATEGY AND DIRECTION
MIKKO HELANDER
3

KESKO KEY FIGURES 2014
4
Net sales
Operating profit*
Equity ratio
Liquid assets
Return on capital employed*
Personnel (FTE)
* excl. non-recurring items
€9,071m
€233m
54.5%
€598m
9.9%
19,976

• K-Group’s sales €11.3bn
• 2,000 stores in eight countries
• Over 1.3 million customer visits
every day
• Personnel 45,000
FOR SHOPPING TO BE FUN
5
K-GROUP

KESKO NET SALESBY LINE OF BUSINESS 2014
6
Machinery trade 3%
Car trade 9%
Agricultural trade 4%
Sports trade 2%
Furniture trade 2%
Building and home
improvement trade 25%
Kespro 9%Grocery trade
Russia 1%
Grocery trade
Finland 44%
Grocery trade €4,754m
Home improvement and speciality goods trade €3,000m
Car and machinery trade €1,011m

KESKO NET SALES BY COUNTRY 2014
Russia 4%
Lithuania 4%
Latvia 1%
Finland 82%
Belarus 1%
Estonia 1%
Sweden 2%
Norway 5%
Over 80% of net sales
comes from Finland
7

STABLE PROFITABILITY, POTENTIAL TO IMPROVE
8
0%
1%
2%
3%
4%
5%
0
1
2
3
4
5
6
7
8
9
10
2.9
2010
8.8
3.1
2009
8.4
1.8
2008
9.6
2.3
2007
9.3
3.4
2006
8.5
3.2
2005
7.6
2.8
9.5
2014
9.1
2.6
2013
9.3
2.6
2012
9.7
2.4
2011
Net sales Operating margin, excl. non-rec. items
Net sales, € bn

STRONG OPERATIONAL CASH FLOW
0
50
100
150
200
250
300
350
400
450
500
2005 2006 2007 2008 2009 2010 2011 2012 2013 2014
9
€m

VERY STRONG CASH POSITION
• Cash position €598 million at the end of 2014
• Expected cash flow €405 million from real estate arrangement
• Strong cash position enables growth and good dividend yield
10

11
OPERATING ENVIRONMENT AND
MEGATRENDS
11

“BIG PICTURE” IN MACRO
12
• Growth of the world economy slower than before
• USA and China continue as growth drivers
• Slow economic growth in the EU area
• Inflation and interest rates remain low

BUSINESS ENVIRONMENT SLOWLY RECOVERING
Finland
• Decline of purchasing power will level off, but is not expected to improve significantly in the next few years
Skandinavia and the Baltic countries
• Steady economic growth is expected to continue
Belarus
• Consumers’ purchasing power is expected to strengthen, hyperinflation is expected to ease
13

14
OPPORTUNITIES AND RISKS IN RUSSIA
• The world’s richest country in terms of raw
material reserves
• Around 150 million consumers and 13
metropolitan cities
• As yet, political and economical risks are
greater than normal
• The economy has potential for strong growth
as soon as the political situation is normalised

15
RETAIL SALES IN RUSSIA, 2000-2014
Source: PMR Online
0
5000
10000
15000
20000
25000
30000
2000 2001 2002 2003 2004 2005 2006 2007 2008 2009 2010 2011 2012 2013 2014
Non-food products Food, beverages and tobacco
RUB, bn
MEGATRENDS
16
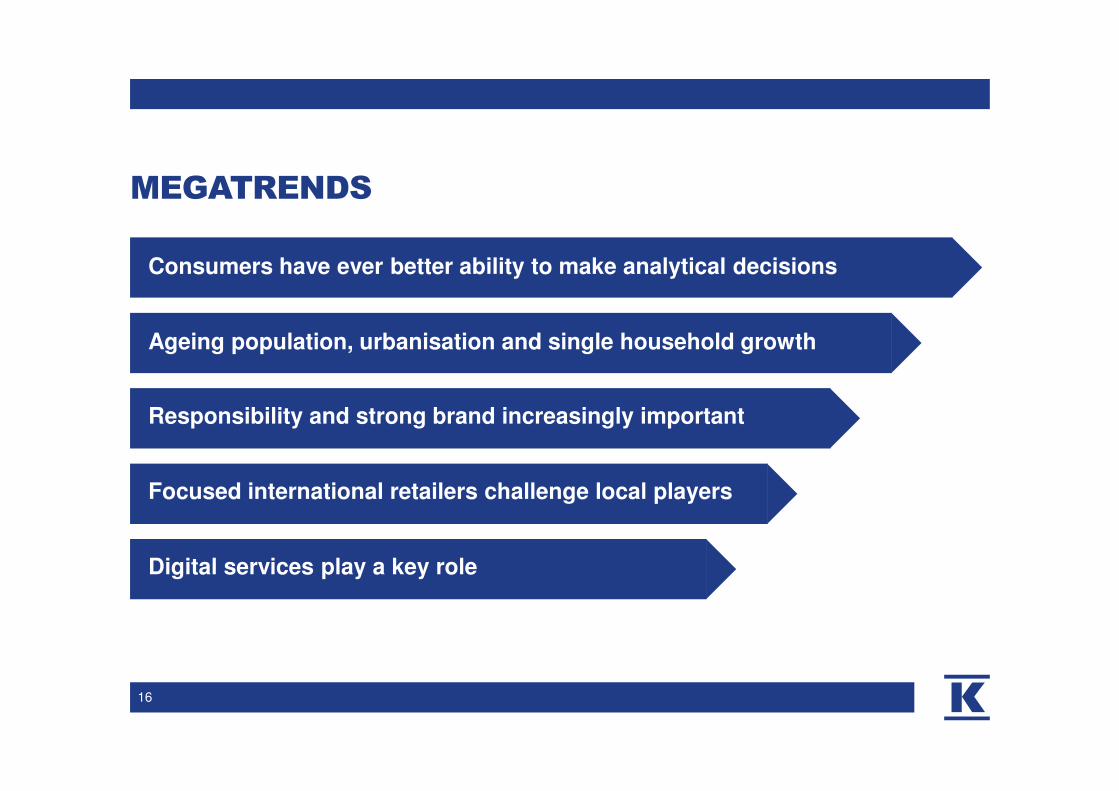
MEGATRENDS
Focused international retailers challenge local players
Consumers have ever better ability to make analytical decisions
Digital services play a key role
Ageing population, urbanisation and single household growth
Responsibility and strong brand increasingly important

17
PORTFOLIO STRATEGY

Grocery trade
• Finland
• Russia
• Kespro, horeca business
Building and home improvement trade
• Europe
Car trade
• Finland
• The Baltic countries, primarily Estonia
18
KESKO STRATEGIC GROWTH AREAS

• Good profitability achieved in all strategic growth areas
• Investments in range of €300 million / year, excluding
potential acquisitions
• Also acquisitions are considered in all three strategic
growth areas
19
INVESTING IN STRATEGICGROWTH AREAS

KEY STRATEGIC OBJECTIVES
20
• Turning the market share in the Finnish grocery trade around
• Increasing the building and home improvement trade in Europe
• Strengthening the market leadership in the Finnish car trade
• The best omni-channel customer experience in the trading sector
• One unified Kesko, harvesting synergies

21
ALL BUSINESSES WILL BE DEVELOPED FURTHER
Shoe trade
• Finland
Sports trade
• Finland and Russia
Furniture trade
• Finland and Estonia
Agricultural trade
• Finland
Machinery trade
• Finland and the Baltic countries

MAXIMISING VALUE CREATION ALSO IN OTHERBUSINESSES
• Important to have the best platform for Kesko’s small and medium sized businesses to succeed in tight competition
• All options which improve competitiveness of other businesses and retailer entrepreneurs are possible
22

REAL ESTATE ARRANGEMENT TO BE CLOSED
• Kesko has agreed to set up a joint real estate investment company with AMF
Pensionsförsäkring and Ilmarinen
• The combined fair value is €652 million and the properties owned by Kesko
Group companies account for €485 million
• Cash flow to Kesko will be around €405 million
• Closing expected to take place in June
23

24
CUSTOMER AND QUALITY –
IN EVERYTHING WE DO
24
25
GROCERY TRADE
CHANGING THE SCENE: BACK TO GROWTH PATH
JORMA RAUHALA

KESKO – QUALITY LEADER IN GROCERY
• High market share of 33% in Finland
• New customer focused strategy clearly differentiates
Kesko in the market
• already improving market share development
• Steady and strong operating profit and cash flow
• Successful business concept in Russia
• Kesko is the most responsible food retailer in the world
26

KESKO GROCERY TRADE KEY FIGURES IN 2014
27
Kespro 17%
Grocery trade
Finland 81%
Grocery trade
Russia 2%Net sales €4,754m
Operating profit €223m
Operating margin 4.7%
ROCE 22.2%

28
FINNISH GROCERY
TRADE MARKET
K-group 33.1%
Others 6.8%Suomen
Lähikauppa
6.8%
Lidl 7.6%
S-group 45.7%
Source: Nielsen

NO MAJOR CHANGES IN K-FOOD STORES’ MARKET SHARE IN 2005 – 2014
33.9 33.4 33.9 33.7 34.2 35.0 35.3 34.7 34.0 33.1
0
5
10
15
20
25
30
35
40
2005 2006 2007 2008 2009 2010 2011 2012 2013 2014
29
%
Source: Nielsen

CHANGES IN THE FINNISHGROCERY TRADE MARKET
30
Quality and responsibility matters
Value for money due to weakenedpurchasing power
Servicing customers digitally
30

CUSTOMER AND QUALITY –
IN EVERYTHING WE DO
3131
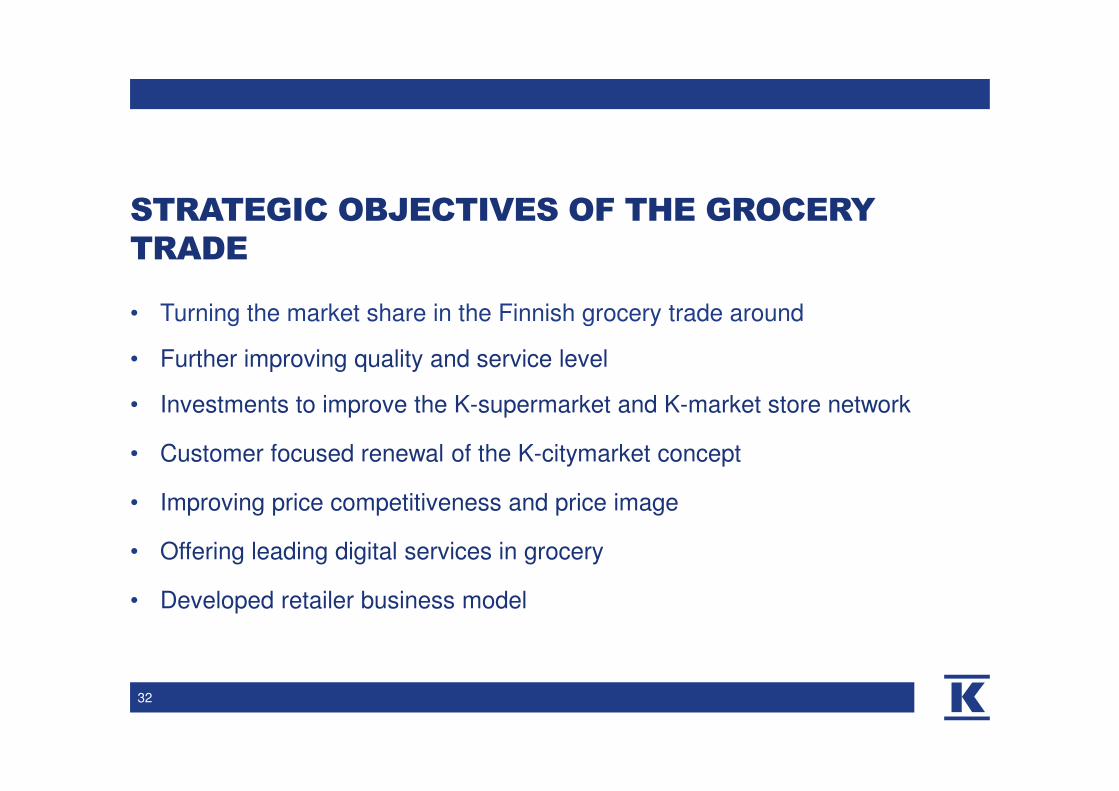
STRATEGIC OBJECTIVES OF THE GROCERY TRADE
• Turning the market share in the Finnish grocery trade around
• Further improving quality and service level
• Investments to improve the K-supermarket and K-market store network
• Customer focused renewal of the K-citymarket concept
• Improving price competitiveness and price image
• Offering leading digital services in grocery
• Developed retailer business model
32

K-CITYMARKET
• The whole K-citymarket concept will be renewed and the
stores will be tailored to meet local customer needs
• In food, superiority factors are freshness, quality and
Finnish products
• Focused selection in the home and speciality goods
• Attractive partnerships including
Starbucks, Posti and K-rauta Express…
33
”Best store for the family”

K-SUPERMARKET
• ”Best in food” – tailored offering based on local customer
demand
• Opening 30 new K-supermarkets
• Focus in quality – freshness, Finnish origin, local
products, service, diversification of food culture
34
”Best in food”

K-MARKET
• Three different formats:
”Express”, ”City” and ”Province”
• Comprehensive renewal of the existing network
• Opening 100 new neighbourhood stores
• Expansion of new service station store concept jointly
with Neste
35
”Most service oriented neighbourhood store”

3636
• Will be based on international benchmark and best practices
• Totally different compared to current food stores in Finland
• Ease of shopping, freshness and quality are at the core of the new concept
LAUNCH OF A NEW STORE CONCEPT TO THE FINNISH GROCERY MARKET

• Changing pricing models
• Enhancing sourcing
• Increasing the share of private labels
IMPROVING OUR PRICE COMPETITIVENESS AND PRICE IMAGE
37

NUMBER ONE IN DIGITAL SERVICESIN THE GROCERY TRADE
• Targeted and personalised marketing
• Customer oriented mobile services
• Our target is a 40% market share in the online
food trade
• Already now Click & Collect service and
home delivery
• Continuously looking for new
innovative solutions
3838

39
RETAILER BUSINESS MODEL IS OUR SUCCESS FACTOR
• Retailers to develop selections and services
based on local needs
• Successful retailers to run more than one
store in the future
• New retailer model for smaller stores

STRATEGY FOR RUSSIA
• Increasing operations and improving profitability
in the St. Petersburg area
• Active in acquiring store sites
• K-ruoka is the best food store in the St. Petersburg area
• Identifying new growth possibilities in the Moscow area
and possibly in other metropolitan cities in Russia
40

41
INCREASING THEHORECA BUSINESS
• Organic growth through strong international cooperation
• Differentiating the selection with private label products
• Supporting the service counter offering of the K-food stores
• Searching for expansion alternatives in Finland and the
neighbouring areas

WE WANT TO OFFER OUR CUSTOMERS FOOD THAT IS BOTH AFFORDABLE
AND OF GOOD QUALITY
#SEKÄETTÄ
42

43
BUILDING AND HOME IMPROVEMENT TRADE
PROFITABLE GROWTH FROM CUSTOMER ORIENTED
SOLUTIONS
TERHO KALLIOKOSKI

PROFITABLE GROWTH IN BUILDING AND HOME IMPROVEMENT TRADE
• Market share in Finland over 40%
• Market #1 or #2 in Finland, Norway,
Estonia, Latvia, Lithuania and
Belarus
• Eight consecutive quarters of
improving profitability
• Strong position in B-2-B trade –
#1 in Finland, Norway and Estonia
44
0
10
20
30
40
50
60
70
2012 2013 2014
Operating profit, € million

45
300 STORES IN EIGHTCOUNTRIES
Finland€1,190m138 stores
Sweden€197m
20 stores
Norway€671m
82 stores
Russia€250m
13 stores
Belarus€125m
11 stores
Lithuania€317m
19 stores
Latvia€53m
8 stores
Estonia78 M€
8 stores
TOTAL RETAIL SALES€2,881m

46
MARKET SHARES %Belarus
€125m 6%
Russia
€250m 11%Finland
€791m 35%
Scandinavia
€625m 28%
Baltics
€443m 20%
65% OF THE BUILDING AND HOME IMPROVEMENTNET SALES COMES FROM OUTSIDE OF FINLAND
6
17
23
14
30
7
10
40
%

STRATEGIC OBJECTIVES OF THE BUILDING AND HOME IMPROVEMENT TRADE
47
• Kesko #5 in Europe – strong potential for further growth organically or
through acquisitions
• Providing excellent services from the same store network to the three
different customer segments
• A common core for all countries to ensure efficient operations
• Offering the best omni-channel digital services

ALL THREE CUSTOMER SEGMENTS ARE SERVED THROUGH THE SAME STORE NETWORK
48
Easy solutions and wide product range for each customer segments
Consumer customers
Project customers
Business customers

A COMMON CORE FOR ALL COUNTRIES TO ENSURE EFFICIENT OPERATIONS
• A common core selection at stores, which is complemented according local
customer needs
• Common operating processes, store operating models and management
practices
• Closer collaboration with international suppliers
• Increasing the proportion of own brands
• Utilizing Kesko’s entire purchasing power
49

NUMBER ONE IN DIGITAL SERVICES
• The best digital services for each customer group
• Easy to find products, extensive planning features and easy omni-channel shopping
• All stores will offer Click&Collect service
• 82 K-rauta and Rautia stores already implemented in Finland
• 20 K-rauta stores in Sweden
• Kesko's building and home improvement online store
50

51
NEW CUSTOMER ORIENTED CONCEPTS
51

NEW K-RAUTA EXPRESS CONCEPT
• A concept for locations with large flows of customers to offer fast and
easy shopping
• Satellite store in a shopping centre, city centre or in connection with a
K-citymarket
• The first store to open in August at the Forum shopping centre in
Helsinki
52

NEW CELLO HOME & SEASONCONCEPT
• Increasing the attractiveness of the K-rauta chain
• The concept will offer inspiring home
improvement and seasonal products
• The concept is built around the Cello brand
53

KESKO BUILDING AND HOME IMPROVEMENT ONLINE STORE
54
• The changing market situation demands also a pure play online store
• Comprehensive assortment for home and family needs across chain
boundaries. Kesko's product offering as well as partnerships
• The cornerstones are
• the building and home improvement trade product lines
• the store network as collection points

FOR SHOPPINGTO BE FUN
55

56
CAR TRADE
COMBINING GLOBAL BRANDS WITH LOCAL CUSTOMER INSIGHT
PEKKA LAHTI

THE CAR TRADE IS ONE OF KESKO’S THREESTRATEGIC GROWTH AREAS
• VV-Auto’s market share in the Finnish passenger car and van trade
has risen from 15% to 21% within ten years
• Throughout recent years, Volkswagen has been the best selling car
brand in Finland and Audi has been number one in its competitive
segment
• VV-Auto’s retail net sales have quadrupled within ten years from 100
million to 400 million
• VV-Auto’s profitability has remained at a good level despite the
difficult market situation
5757

CAR AND MACHINERY TRADE 2014
58
Konekesko
Baltics €96m 9%
VV-Auto
€756m 75%
Konekesko
Finland €161m 16%Net sales €1,011m
Operating profit €30m
Operating margin 2.9%
ROCE 18.3%
Car trade operating profit €30 million, 4.0%

Volkswagen 12.3%
Toyota 11.9%
Skoda 9.2%
Volvo 7.3%
Ford 7.0%
Nissan 6.1%
Audi 6.0%
Kia 5.7%
Seat 1.7%
Others 32.8%
PASSENGER CAR MARKET IN FINLAND
59
• Average CO2 emissions of passengercars in 2014: 128 g/km
• Diesel cars 40%, petrol cars 60%
• Only 200 electric cars
• Golf segment 50% of total market
• Increasing segment, SUV 20%of total market
• Average age of registered carsin Finland 13.5 years
Market Share in 2014
Source: TraFi (Finnish Transport Safety Agency)

PASSENGER CARS, FIRST REGISTRATIONS
0
20000
40000
60000
80000
100000
120000
140000
160000
2001 2002 2003 2004 2005 2006 2007 2008 2009 2010 2011 2012 2013 2014
60
Source: TraFi (Finnish Transport Safety Agency)

61
STRATEGIC OBJECTIVES OF THE CAR TRADE
• Co-operation with Volkswagen AG: Volkswagen aims to be the biggest car
manufacturer by 2018. Volkswagen is the biggest R&D investor in the world
• VV-Auto will focus on Volkswagen Group's car brands
• Sales growth and growing market share in Finland and in the Baltics
• Increasing retail sales by investing in new sales and service channels
• Developing customer loyalty with new finance and service models
• The best omnichannel customer experience in car trade

62
LOCAL CUSTOMERINSIGHT CASES
62

CASE AUDI: LOCAL INSIGHT AND CUSTOMER LOYALTY PROGRAMS BRING RESULTS
63
• CRM marketing increases customer loyalty
and brings more sales
• CRM marketing is automated and
systematised messages sent to customers
during customer life cycle
• Customers that were targeted by Audi CRM
marketing had substantially higher repurchase
likelihood
87% higher
repurchase
likelihood

CASE: SERVICE ONLINE BOOKING CREATINGCUSTOMER VALUE
64
• Online vehicle authentication produces matching
service packages and prices according to the
vehicle’s service history, maintenance program
and kilometers
• Results after beta phase:
• 15% of the bookings coming online
• 20% of the sales is upselling additional services

65
GREAT SUCCESS IN TWO DIFFERENTU.S. BASED CRM AWARDS
September 2014: Infor Excellence in Action Awards – Customer Excellence
November 2014: Loyalty 360 CX Awards – 360 degree Award

THANK YOU
66

What do you find when you Google Kesko?
Anni Ronkainen

“EVERYTHING THAT CAN BE DIGITAL WILL BE.”
Jeff Dachis, Razorfish

THE CHANGED CONSUMER

THE WORLD IS CHANGING AT AN INCREASING SPEEDThe average age of S&P 500 companies has gone from67 to 15 years since 1920

DIGITAL TECHNOLOGYDRIVESTHE CHANGE

10 DEVICESCONNECTED TO THE INTERNET

COMPANIES HAVE TWO OPTIONS:• Make digital technology a competitive advantage
• Make digital technology a competitive disadvatage

IT WILL BE MOREAND MOREDIFFICULT TO REACH YOURCUSTOMERS

CONSUMERS AREABLE TO MAKE VERYANALYTICAL BUYINGDECISIONS

WEBROOMING
VS. SHOWROOMING

360°360°

KESKO’S OBJECTIVE IS TO OFFER BEST CLASSDIGITAL SERVICES
78
OMNI-CHANNEL
CUSTOMER
INTERACTION
INNOVATIVE
E-COMMERCE
SOLUTIONS
TARGETED AND PERSONALISED MARKETING
CUSTOMER
ORIENTED MOBILE
SERVICES

79
CUSTOMER LOYALTY SYSTEM WILL BE REVISED TO MAKE IT EVEN MORE ATTRACTIVE

80
THANK YOU!80

81
MEASURING SUCCESS –FINANCIAL TARGETS
JUKKA ERLUND
81

NET SALES – BACK TO GROWTH
82
0
2000
4000
6000
8000
10000
2005 2006 2007 2008 2009 2010 2011 2012 2013 2014
Finland Other countries
+5.8%+11.1%
+9.3%+3.3%
-11.9%+3.9%
+7.8% +2.4%-3.8%
€m
-2.6%
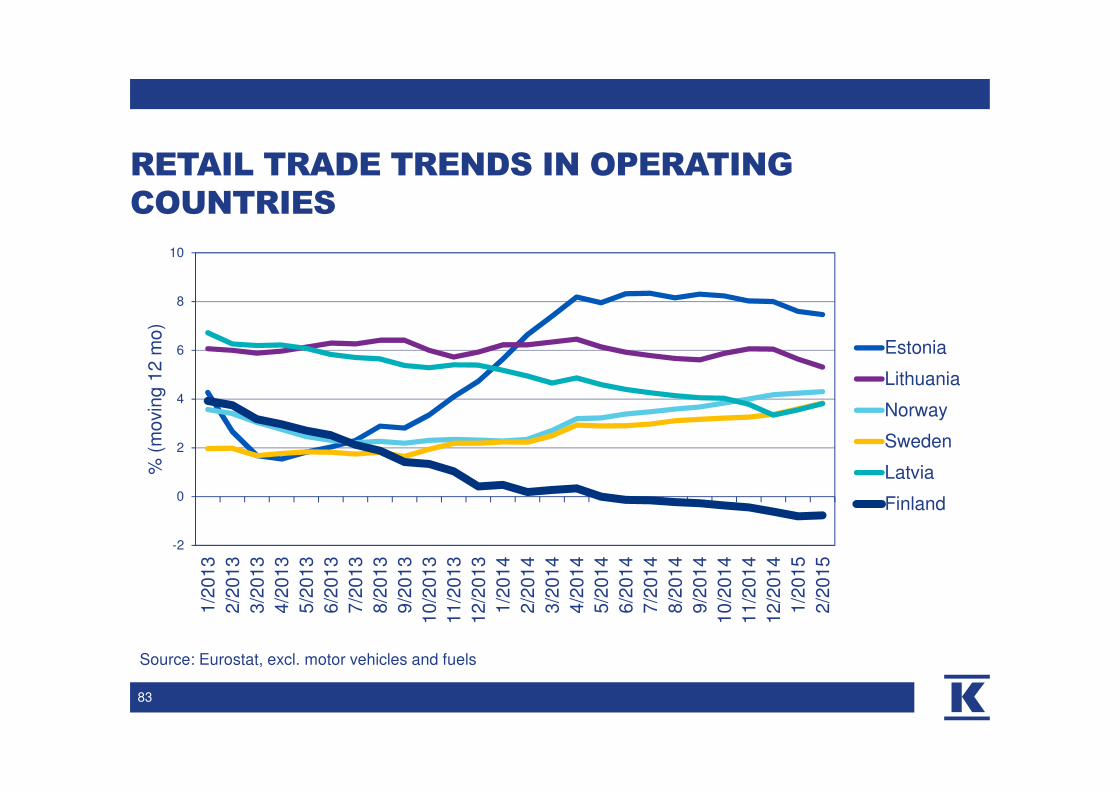
RETAIL TRADE TRENDS IN OPERATING COUNTRIES
5/2015 Jukka Erlund
83
Source: Eurostat, excl. motor vehicles and fuels
-2
0
2
4
6
8
10
1/2
013
2/2
013
3/2
013
4/2
013
5/2
013
6/2
013
7/2
013
8/2
013
9/2
013
10/2
013
11/2
013
12/2
013
1/2
014
2/2
014
3/2
014
4/2
014
5/2
014
6/2
014
7/2
014
8/2
014
9/2
014
10/2
014
11/2
014
12/2
014
1/2
015
2/2
015
% (
movin
g 1
2 m
o)
Estonia
Lithuania
Norway
Sweden
Latvia
Finland

CONSUMER CONFIDENCE IN FINLAND
84
0
2
4
6
8
10
12
14
16
1/0
0
7/0
0
1/0
1
7/0
1
1/0
2
7/0
2
1/0
3
7/0
3
1/0
4
7/0
4
1/0
5
7/0
5
1/0
6
7/0
6
1/0
7
7/0
7
1/0
8
7/0
8
1/0
9
7/0
9
1/1
0
7/1
0
1/1
1
7/1
1
1/1
2
7/1
2
1/1
3
7/1
3
1/1
4
7/1
4
1/1
5
Expectations for own finances
Expectation, 21st century average
Source: Statistics Finland

NET SALES – GROWTH DRIVERS
• Customer focused strategies and concept renewals
• Investments to new store openings
• Customer oriented omni-channel services
• Potential acquisitions in three strategic growth areas
85

213273
315
217155
268 279230 239 233
-100
0
100
200
300
400
2005 2006 2007 2008 2009 2010 2011 2012 2013 2014
Operating profit excl. non-recurring items Non-recurring items
TARGETING PROFIT IMPROVEMENT
86
€m
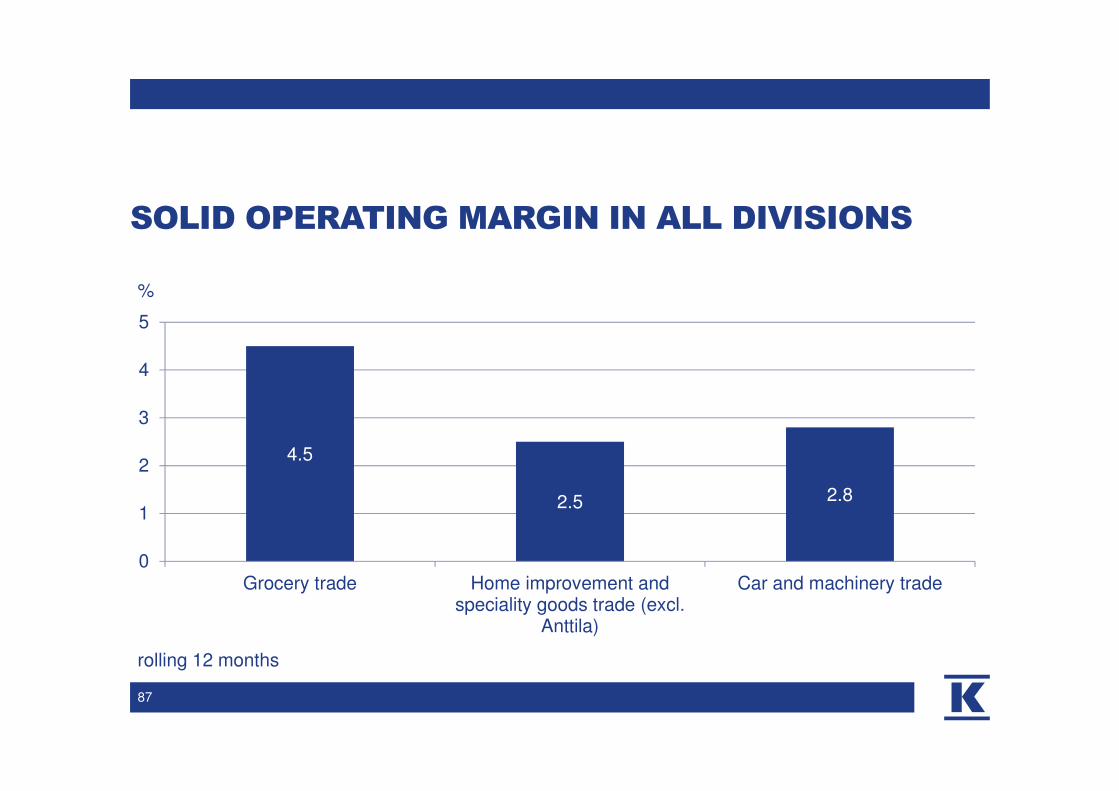
SOLID OPERATING MARGIN IN ALL DIVISIONS
4.5
2.5 2.8
0
1
2
3
4
5
Grocery trade Home improvement andspeciality goods trade (excl.
Anttila)
Car and machinery trade
87
%
rolling 12 months

IMPROVING PROFITABILITY
• Profitable growth in three strategic areas
• Divestment of Anttila
• Improving cost efficiency
• Enhanced sourcing operations
• Efficient support functions and synergies in core processes
• The objective is to achieve cost savings of at least €50 million in
fixed costs by the end of 2016
88

FIXED COSTS, € MILLION
536
494
73
219
125
Personnel costs
Rents and store site costs
ICT-costs
Marketing and loyalty costs
Other costs
89
Total €1,449 million, excl. Anttila
Rolling 12 months, € million

ROCE AND ROEEXCL. NON-RECURRING ITEMS
9.6
12.4
14.7
10.2
7.4
14.013.1
9.09.8 9.9
14.0
10.510.0
14.6
8.1
3.8
8.7 8.8
6.97.7 7.6
12.0
0
2
4
6
8
10
12
14
16
2005 2006 2007 2008 2009 2010 2011 2012 2013 2014 target
ROCE ROE
90

0
50
100
150
200
250
300
350
400
450
2005 2006 2007 2008 2009 2010 2011 2012 2013 2014
Capital expenditure in store sites Acquisitions Other capital expenditure
average
CAPITAL EXPENDITURE BACK TO NORMAL LEVEL
91
€m

• Capex approximately €300 million per annum excluding acquisitions
• Majority of capital expenditure for grocery trade growth
• Itäkeskus shopping centre, €100 million
• Growth investments also in building and home improvement trade
and car trade
92
CAPITAL EXPENDITURE

FINANCIAL TARGETS
• Return on capital employed 14%
• Return on equity 12%
• Interest bearing net liabilities / EBITDA < 2.5
93

DIVIDEND HISTORY
1.10
1.501.60
1.00 0.90
1.301.20 1.20
1.401.50
0
1
2
2005 2006 2007 2008 2009 2010 2011 2012 2013 2014
94
€

DIVIDEND POLICY UNCHANGED
5/2015
95
• Kesko Corporation distributes at least 50% of its earnings per share
excluding non-recurring items as dividends, taking however the
company's financial position and operating strategy into account
• Currently balance sheet is overly strong and is targeted to be more
efficient
• BoD’s will make the dividend proposal for the AGM taking into account
the progress of strategy implementation

96


