54
SUOMEN OSUUSKAUPPOJEN KESKUSKUNTA SOK CORPORATION 1997 ANNUAL REPORT

SUOMEN OSUUSKAUPPOJEN
KESKUSKUNTA
SOK CORPORATION
1997
ANNUAL
REPORT
CONTENTS
3
Purpose of the S Group.....................................................................4Description of the S Group................................................................5SOK Corporation in brief....................................................................6CEO´s Review......................................................................................7
Financial Statements for the year 1997Report of the Executive Board ......................................................8Consolidated Income Statement ................................................11Consolidated Balance Sheet.......................................................12Consolidated Cash Flow Statement...........................................14SOK Income Statement...............................................................15SOK Balance Sheet......................................................................16SOK Cash Flow Statement .........................................................18Accounting Principles...................................................................19Notes to the Consolidated Income Statementand Balance Sheet .......................................................................21Key ratios and their method of calculation ................................29Proposal of the Executive Board concerningthe use of SOK´s profit for the year ............................................30Auditors´ Report ............................................................................31Statement of the Supervisory Board..........................................31
Field Division......................................................................................32Specialty Stores Division .................................................................38Administrative Division .....................................................................40Corporate Development and Planning ..........................................41Personnel and Communications ....................................................43SOK Corporation´s personnel in 1997 ......................................44Associated Companies....................................................................45The S Group in 1997 .......................................................................47The S Group and the environment.................................................48SOK Supervisory Board, Executive Boardand Auditors......................................................................................50SOK Organisation 1.1.1998............................................................51S Group Key Figures........................................................................52Statistics ............................................................................................53Events of the year.............................................................................54
Timo Sarpaneva’s glass sculpture ”Sun Fell”, 1985.Ässäkeskus lobby.

PURPOSE OF THE S GROUP
4
SUOMEN OSUUSKAUPPOJEN KESKUSKUNTA (SOK)Established 1904
THE PURPOSEOF THE S GROUP IS
TO PROVIDE BENEFITS FORCOMMITTED CUSTOMER-
OWNERS.
THE S GROUP CONSISTSOF THE COOPERATIVE SOCIETIES
AND SOK WITH THEIRSUBSIDIARIES.
THE SOK CORPORATIONCONSISTS OF SOK AND
ITS SUBSIDIARIES.
Bb
Bb

DESCRIPTION OF THE S GROUP
5
The S Group operates through region-al structures, the basic units of whichare the regional cooperatives and theSOK Corporation.The regional cooperatives are owned bytheir members, the customer-owners.The purpose of a regional society is toproduce the services that meet the ba-sic needs of customer-owners throughlocally managed chains in its area of op-
erations. These are primarily the Pris-ma, S Market, Sale and Alepa chains,service stations and restaurants.The SOK Corporation consists of thesecondary cooperative SOK, owned bythe cooperatives, and its subsidiaries.Its purpose is to produce the supportfunctions and services required by theregional societies. Through its own busi-ness operations, the Corporation further
strengthens the competitiveness of theS Group. It provides the services thatmeet the special needs of the societies’customer-owners through nationallymanaged chains. These are primarilythe Sokos department stores, special-ty stores, Sokos hotels and Agrimar-kets.
Regional Co-ops (23) Local co-ops (21)
Supervisory Board (25)
Customer-OwnersCustomers
Pris
ma
Hyp
erm
arke
ts
S M
arke
t S
uper
mar
kets
Ale
pa/S
ale
Dis
coun
t Sto
res
Oth
er S
tore
s
Res
taur
ants
Ser
vice
Sta
tions
Aut
o D
eale
rshi
ps
Oth
ers
Dep
artm
ent S
tore
s
Sok
os H
otel
s
Agr
i Bus
ines
s
Regionally managed chains
Executive Board (8)
Support services Commercialservices
Sourcing services• Inex Partners Oy
• Intrade Partners Oy• Oy Maan Auto Ab
Chain boards
Chain management
Dep
artm
ent S
tore
s•
Oy
Sok
os A
b•
Spe
cial
ty S
tore
s
Hot
els
• O
y S
okot
eria
Ab
• H
elsi
nki H
otel
s O
y•
Roy
al H
otel
s O
y
Aut
o D
eale
rshi
ps•
Aut
omaa
Oy
Agr
i Bus
ines
s•
Han
kkija
Agr
icul
ture
Ltd
Nationally managed chains
SOK Corporation
SOK CORPORATION IN BRIEF
6
1997 1996
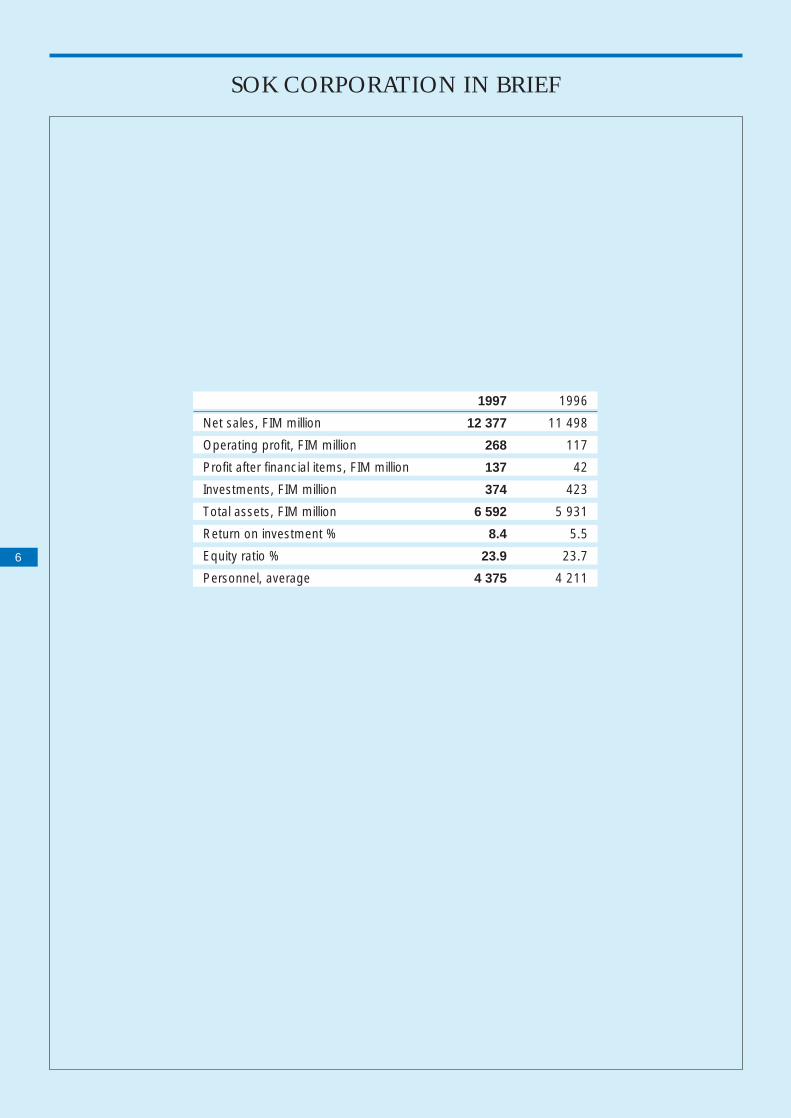
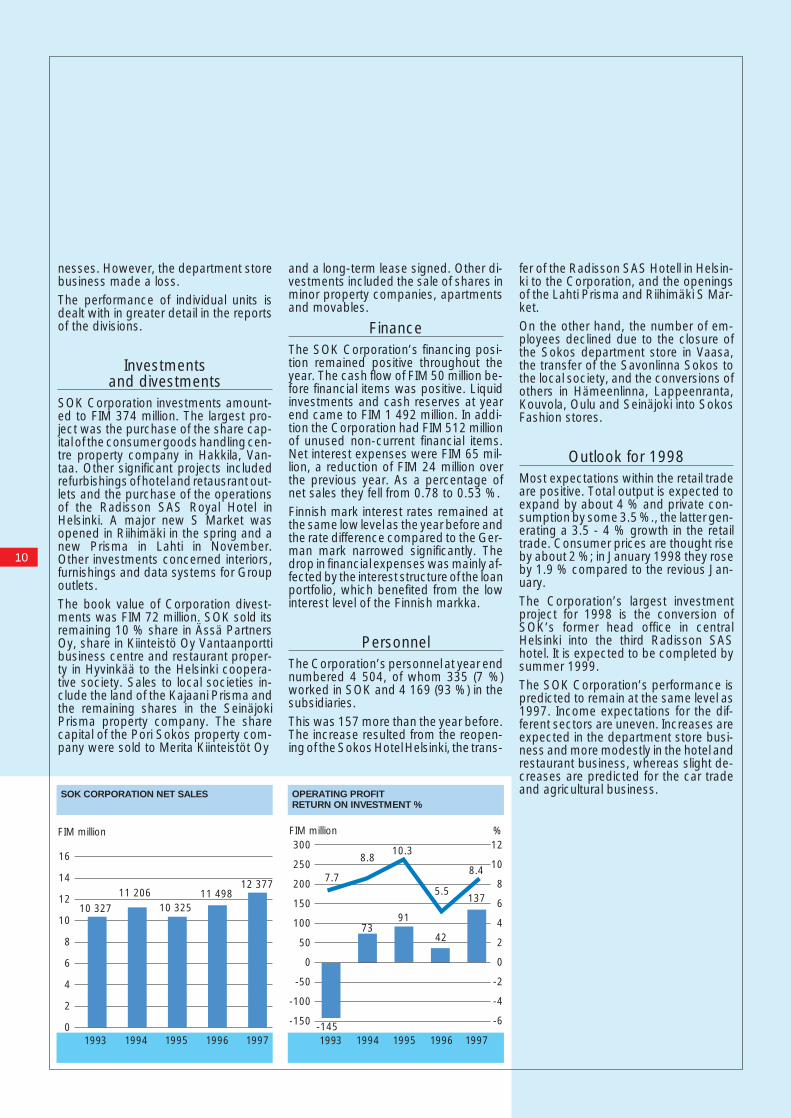
Net sales, FIM million 12 377 11 498
Operating profit, FIM million 268 117
Profit after financial items, FIM million 137 42
Investments, FIM million 374 423
Total assets, FIM million 6 592 5 931
Return on investment % 8.4 5.5
Equity ratio % 23.9 23.7
Personnel, average 4 375 4 211
CEO’S REVIEW
The operating environment of the retail trade was favourable in1997. Exports continued to growstrongly and even the buildingindustry emerged from the deeptrough of the recession. Thenational wage settlement in thepreceding year kept the labourmarket peaceful. Inflationincreased slightly towards the end of the year, but interest ratesremained rather low. Finland pre-pared itself to be among the firstgroup to join the EuropeanEconomic and Monetary Union;the political decisions and othersolutions concerning the imple-mentation of the third stage ofEMU will be taken during thespring of 1998.
The growth in total output inFinland remained constant at overfour per cent through the year andthe annual average rose to almostsix per cent. The volume of privateconsumption grew by about threeper cent, but the retail trade byalmost four per cent. However, the retail trade is not expected toregain its pre-recessional peakuntil after the year 2000. The aver-age rate of inflation was slightlyover one per cent, but prices inthe retail trade increased by onlyhalf of this.
For the S Group, 1997 was arecord-breaking year both in salesand profits. Its retail sales amount-ed to FIM 29 billion, a growth of10 per cent over the previous year.Once again this growth was morethan twice the national average.The anticipated growth in marketshare was realised and theapproximately 1.5 percentagepoint increase gave the Group aquarter of the national grocerytrade. During the 1990s the mar-ket share has grown by almost
10 percentage points. The SOKCorporation’s net sales came toFIM 12.4 billion, which was 7.6 per cent up on the year before.
The S Group’s profit after financialitems, but before extraordinaryitems, voluntary provisions andincome taxes, improved consider-ably over the previous year andwas about FIM 800 million. This isan all-time record for the Group.The same figure for the coopera-tive societies was FIM 660 million,an increase of almost FIM 200 mil-lion, and for the SOK Corporation,FIM 137 million. S Group invest-ments amounted to FIM 1 000 mil-lion, of which the SOK Corporationaccounted for FIM 374 million.
The outlook for the Finnish econ-omy and the retail trade in 1998continues to look good. Althoughthe rate of growth in the economyis expected to slow down, lowinflation and interest rates and thehistorically strong balance of pay-ments support continued healthyeconomic performance. Thanks to the new collective bargainingagreement, no surprises areexpected from the labour market.Strikes by certain key groups,however, indicate that pressure ismounting to reform the system ofcentralised agreements. Despitegrowth conditions, no balance hasyet been achieved in the country’sfinancial affairs and high unem-ployment has become a perma-
nent problem. The Asian econ-omic crisis has introduced a noteof uncertainty into internationaldevelopments which may result inreduced demand for exports. Nowis the time for the domestic marketto assume the role of economicengine. Improving operating con-ditions in the service sector is thegreatest single challenge to com-panies in the field, organisationand the public sector.
There was again a notableincrease in the number of cus-tomer-owners and their usage of S Group services. This growth incustomer satisfaction is shown bythe fact that bonus purchasesincreased by over a fifth andbonus payments rose by 22 percent to FIM 258 million. This is noinsignificant contribution to thehouseholds concerned, especiallyconsidering that S Group productsand services are already highlycompetitive in price before thebonus. I wish to thank the customer-own-ers for their confidence in the SGroup, as well as the elected offi-cials, cooperative societies and allour interest groups for their coop-eration. Likewise my many thanksgo to the personnel of the so-cieties and the corporation fortheir efficient and effective work in the interests of our customer-owners.
7
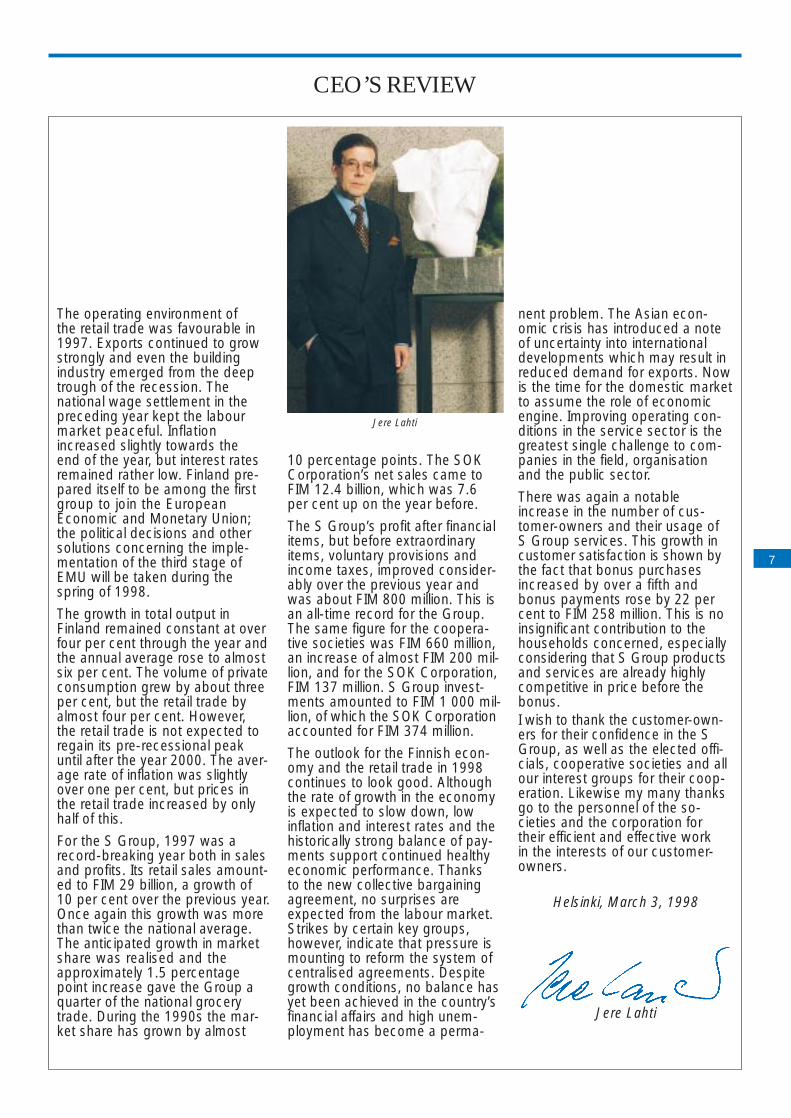
Jere Lahti
Helsinki, March 3, 1998
Jere Lahti

The trading environmentThe national economy developedstrongly and evenly throughout the year.Once again there was a powerful growthin total output. During the last four yearsproduction has expanded by a fifth, thusmaking up for the losses incurred dur-ing the recession. Although the globaleconomy also strengthened, the FarEastern crisis has somewhat prunedgrowth predictions. The Finnish econ-omy fulfilled the EMU convergence criteria in respect to interest and inflationrates, as well as budget deficit and pub-lic debt.The growth in total output exceeded ex-pectations and was almost 6 %. The mo-mentum increased after the first quarterthanks mainly to strong exports, but alsobecause domestic investment demandcontinued to grow healthily. Forestry, in-dustry and construction increased by 10to 15 %, transport by also 10 % and eventrade and other services recorded clearsigns of growth.The powerful expansion in foreign tradecontinued to produce a surplus in boththe balance of trade and the balance ofpayments. In recent years exports havefunctioned as the engine of economicgrowth, with export quantities growingby over 70 % during the same period asdomestic demand has only now returnedto its pre-recessional level.Although private consumer expendituregrew by 3.1 % over the previous year, itwas still less than predicted. Even thoughthere was a slight fall in unemployment,a modest expansion in incomes withprices rising only very slowly, the rate ofprivate saving rose and consumer be-haviour was still cautious. The con-sumption of groceries and other non-durables increased by about 2 %, where-as that for semidurables steadied atabout 6 %.The retail trade grew faster than privateconsumption; increasing by about 4.3 invalue and 3.7 % in volume. Retail pricescontinued to rise very slowly. The gro-
cery trade increased by 2.5 % in valueand 1.5 % in volume. The departmentstore business and textile trade grew byabout the average for the retail trade, withthe footwear trade growing slightlyfaster, by about 4.5 %. The car trade ex-panded by almost 10 % in volume.Consumer prices continued to increasemodestly for the fourth year running, byan average of 1.4 %. Developmentswere fairly even in all groups. The pricesfor food and non-alcoholic beverages in-creased by an average of 1.2 %, hoteland restaurant prices by about 2 %. Onthe other hand, those for clothing andfootwear fell by an average of 0.6 %.The hotel and restaurant business ex-panded faster than the retail trade. Li-censed restaurant sales increased bysome 7 % in value and 5 % in volume.Hotel room sales grew much faster andthe occupancy rate has higher than inthe previous year. Sales in the GreaterHelsinki area expanded more quicklythan elsewhere in the country.
Changes in the administrativestructure of SOK
In the autumn, SOK’s Supervisory Boardapproved the proposal of its workinggroup concerning the management sys-tem for the S Group and SOK Corpora-tion as from January 1st 1998. Accord-ingly, the Supervisory Board concen-trates on management supervision andstrategic decision-making, and the tasksand role of the Executive Board becomethose of a Board of Directors responsi-ble for the overall management of theSOK Corporation and drawing-upstrategies for the whole S Group. At thesame time, the structure of the Board ofDirectors became cooperative societypredominant. As from the beginning of1998, the Executive Board will establisha Management Team. The main objec-tive of the management system is totighten decision making and operationswithin the S Group thereby increasing itscompetitiveness.
Structural changes in the Corporation
All the shares in the Pori Sokos real es-tate company were sold and the prem-ises leased back under a long-termagreement. In addition the shares in onereal estate subsidiary were sold outsidethe S Group.Internal sales and leasings between ho-tel companies during the year aimed atcreating a new corporate structure in thissector. The process will continue in1998.In order to achieve a more straightf-orward real estate company structure,seven SOK-owned companies weremerged with others.Shareholdings in three real estate com-panies, two subsidiaries and one asso-ciated company, were sold to the localsocieties with the objective of clarifyingthe S Group’s outlet structure.Through transactions of shares and realestate with the Helsinki society HOK,business operations and the outlet struc-ture in Greater Helsinki were clarified atthe end of the year and in early 1998. Atthe end of the year other minor owner-ship arrangements were made to clarifythe Corporation’s structure.At the end of the year the stock of thereal estate company owning the Hakki-la logistics centre was acquired in orderto improve the S Group’s logistic ser-vices.At the beginning of the year SOK ac-quired from Inex Partners Oy all theshares in Rainex Partners Oy. The dealalso included Rainex Partners Oy’s sub-sidiary Rainex Yrityspalvelu Oy.
SalesThe SOK Corporation’s net sales totalledFIM 12 377 million, up 7.6 % over theprevious year. Sales within the hotel andrestaurant business and agriculturaltrade were better than anticipated. An-
REPORT OF THE EXECUTIVE BOARD
8
other reason for the increase was theopening of new retail outlets in the so-cieties and Corporation.Net sales of the Corporation’s agricul-ture and hardware company HankkijaAgriculture Ltd expanded by 6.9 %.Growth was particularly strong in thegrain trade, likewise in purchases of ma-chines and building materials by farm-ers. The only significant product groupsto experience falling sales were feedsand fertilizers.Hotel and restaurant company sales in-creased powerfully by no less than 18.1%. This was largely due to the sectorgenerally growing more strongly than theretail trade, particularly in hotels. TheCorporation’s hotels’ occupancy ratewas much higher than the average,which is evidence that the considerableeffort made in recent years to moderniseoutlets and develop concepts has pro-duced the desired result.The Corporation’s car business grew by13.9 % which was slightly higher thanthe average. Net sales for the car im-porting company Oy Maan Auto Ab in-creased by 13.7 %.Net sales for the Corporation’s depart-ment stores contracted by 10.7 % dueto the closure of the Vaasa outlet, thetranfer of the Savonlinna store to the lo-cal society and the transfer to the gro-cery departments in three other storesto the S Market chain. In addition, Sokosstores in smaller towns were convertedinto Sokos Fashion stores. Comparablesales for the remaining stores increasedby more than the national average. This was the first complete year of op-erating for the supermarket companyHämeenmaan Automarket Oy. The com-pany bought two S Market outlets andopened a new one in Riihimäki in Mayand a new Prisma in Lahti in Noveme-ber.Net sales for the S Group’s sourcingcompany Intrade Partners Oy expand-ed by 17.7 % as a result of favourabledevelopments in the consumer goods
business and the contract to supply theSokos department stores in the secondhalf of the year.SOK’s net sales totalled FIM 5 361 mil-lion, down 10 % over the year before,due to the hiving off of Sokos depart-ment store operations into a separatecompany on September 1st 1996. Therewas an increase of 9.5 % in the invoic-ing of goods delivered direct to chain out-lets by domestic manufacturers (EDI in-voicing).Retail sales for the S Group came to FIM29 011 million, up 10 % over the yearbefore. The cooperatives’ retail sales ex-panded by 10.4 % to FIM 22 223 mil-lion, which was about 77 % of total Groupretail sales.
SOK’s operationsSOK is the parent company of the SOKCorporation. Its net sales consist of in-voices for goods delivered direct to chainunits by domestic manufacturers (EDI in-voicing), income from renting, chain-management services, and supplying SGroup and Corporation services to oth-er S Group companies. The gross margin, fixed expenses anddepreciation declined in value and rela-tively compared to the previous yearwhen the figures included deliveries tothe department stores during the eightmonths prior to the formation of OySokos Ab on September 1st 1996.The loss before extraordinary items, vol-untary provisions and income taxes con-tracted to FIM 49.7 million. The resultwas, however, an improvement as, un-like the year before, it was no longer bur-dened by the loss of the departmentstore business. On the other hand, de-preciation on investments was far high-er than in the previous year.
Financial resultsThe SOK Corporation showed a profitbefore extradordinary items, voluntaryprovisions and income taxes of FIM 137million. The figure for the previous yearwas FIM 42 million. This included otheroperating income and expenses, theshare of associated companies’ profits,one-time depreciation, depreciation oninvestments, and changes in obligatoryprovisions.The gross margin grew both in value andrelatively. The increase over the previousyear in other operating income includedordinary profits on sales. Fixed expens-es grew in value by 4.2 %, but their rel-ative share contracted by 0.5 percent-age points. The value of the gross mar-gin grew in nearly all sectors. The par-ticularly large expansion in the hotel andrestaurant business increased the rela-tive gross margin. Fixed expenses grewmodestly in the powerfully expandingsectors and contracted substantially inthe department store business.One-time depreciation included depre-ciation on buildings, machinery andequipment, intangible rights and othercapitalised expenditure. Depreciation oninvestments included devaluations onshares in the Polar Group of FIM 22.3million, loan receivables from associat-ed companies of FIM 20.0 million and onother shares and liabilities of FIM 30.2million.The net growth in financial income andexpenses was FIM 56 million. Depreci-ation on investments grew by FIM 68 mil-lion, so the net contraction in other itemswas FIM 12 million. The prevailing lowlevel of interest rates proved of benefitto the interest structure of the loan port-folio.All business groups achieved theirplanned goals and improved their per-formance. There were, however, signsof weakness at the corporate and unitlevel. The greatest improvements in per-formance were recorded by the hotel,restaurant and department store busi-
9
10
19951993 1994 1996 1997
16
14
12
10
8
6
4
2
0
10 32711 206
10 32511 498
12 377
FIM million
SOK CORPORATION NET SALES
19951993 1994 1996 1997
300
250
200
150
100
50
0
-50
-100
-150
12
10
8
6
4
2
0
-2
-4
-6
7391
42
137
7.7
8.810.3
8.4
OPERATING PROFITRETURN ON INVESTMENT %
FIM million %
-145
5.5
nesses. However, the department storebusiness made a loss.The performance of individual units isdealt with in greater detail in the reportsof the divisions.
Investments and divestments
SOK Corporation investments amount-ed to FIM 374 million. The largest pro-ject was the purchase of the share cap-ital of the consumer goods handling cen-tre property company in Hakkila, Van-taa. Other significant projects includedrefurbishings of hotel and retausrant out-lets and the purchase of the operationsof the Radisson SAS Royal Hotel inHelsinki. A major new S Market wasopened in Riihimäki in the spring and anew Prisma in Lahti in November. Other investments concerned interiors,furnishings and data systems for Groupoutlets.The book value of Corporation divest-ments was FIM 72 million. SOK sold itsremaining 10 % share in Ässä PartnersOy, share in Kiinteistö Oy Vantaanporttibusiness centre and restaurant proper-ty in Hyvinkää to the Helsinki coopera-tive society. Sales to local societies in-clude the land of the Kajaani Prisma andthe remaining shares in the SeinäjokiPrisma property company. The sharecapital of the Pori Sokos property com-pany were sold to Merita Kiinteistöt Oy
and a long-term lease signed. Other di-vestments included the sale of shares inminor property companies, apartmentsand movables.
FinanceThe SOK Corporation’s financing posi-tion remained positive throughout theyear. The cash flow of FIM 50 million be-fore financial items was positive. Liquidinvestments and cash reserves at yearend came to FIM 1 492 million. In addi-tion the Corporation had FIM 512 millionof unused non-current financial items.Net interest expenses were FIM 65 mil-lion, a reduction of FIM 24 million overthe previous year. As a percentage ofnet sales they fell from 0.78 to 0.53 %.Finnish mark interest rates remained atthe same low level as the year before andthe rate difference compared to the Ger-man mark narrowed significantly. Thedrop in financial expenses was mainly af-fected by the interest structure of the loanportfolio, which benefited from the lowinterest level of the Finnish markka.
PersonnelThe Corporation’s personnel at year endnumbered 4 504, of whom 335 (7 %)worked in SOK and 4 169 (93 %) in thesubsidiaries.This was 157 more than the year before.The increase resulted from the reopen-ing of the Sokos Hotel Helsinki, the trans-
fer of the Radisson SAS Hotell in Helsin-ki to the Corporation, and the openingsof the Lahti Prisma and Riihimäki S Mar-ket.On the other hand, the number of em-ployees declined due to the closure ofthe Sokos department store in Vaasa,the transfer of the Savonlinna Sokos tothe local society, and the conversions ofothers in Hämeenlinna, Lappeenranta,Kouvola, Oulu and Seinäjoki into SokosFashion stores.
Outlook for 1998Most expectations within the retail tradeare positive. Total output is expected toexpand by about 4 % and private con-sumption by some 3.5 %., the latter gen-erating a 3.5 - 4 % growth in the retailtrade. Consumer prices are thought riseby about 2 %; in January 1998 they roseby 1.9 % compared to the revious Jan-uary.The Corporation’s largest investmentproject for 1998 is the conversion ofSOK’s former head office in centralHelsinki into the third Radisson SAS hotel. It is expected to be completed bysummer 1999.The SOK Corporation’s performance ispredicted to remain at the same level as1997. Income expectations for the dif-ferent sectors are uneven. Increases areexpected in the department store busi-ness and more modestly in the hotel andrestaurant business, whereas slight de-creases are predicted for the car tradeand agricultural business.

CONSOLIDATED INCOME STATEMENT
11
FIM million
Net sales (1)Other operating income (2)
Variable costsMaterials, supplies and products
Purchases during the periodIncrease in inventories
Staff costs (3)Other variable costs
Gross margin
Fixed costsStaff costs (3)RentsOther fixed costsOther operating costs (2)
Operating profit before depreciation
Depreciation on fixed assets andother capitalised expenditure (4)
Depreciation according to planOne-time depreciationDepreciation on consolidated goodwill
Operating profit
Financial income and expenses (5)Dividend incomeInterest income from non-current investmentsOther interest incomeOther financial incomeExchange rate gains and lossesShare of associated companies’ profitsInterest expensesOther financial expensesValue adjustment on investments
Profit before extraordinary items,voluntary provisions and income taxes
Extraordinary income and expenses (6)Extraordinary incomeExtraordinary expenses
Profit before voluntary provisions and income taxes
Increase in accelerated depreciation (4)Decrease in voluntary provisions (8)Income taxes (9)Minority interest
Profit for the period
1.1.-31.12.1997 % 1.1.-31.12.1996 %
12 377.2 100.0 11 498.2 100.0106.5 0.9 60.6 0.5
10 338.5 9 610.0-94.1 -46.718.9 17.944.0 -10 307.3 83.3 34.3 -9 615.5 83.6
2 176.4 17.6 1 943.3 16.9
736.4 730.4274.3 265.1701.8 656.1
9.0 -1 721.5 13.9 0.7 -1 652.3 14.4
454.9 3.7 291.0 2.5
176.0 157.08.6 13.92.0 -186.6 1.5 2.8 -173.7 1.5
268.3 2.2 117.3 1.0
7.8 6.614.0 14.549.9 67.59.9 1.54.2 1.75.6 22.8
129.2 171.421.2 14.872.5 -131.5 1.1 4.1 -75.7 0.6
136.8 1.1 41.6 0.4
3.3 1.21.9 1.4 0.0 9.6 -8.4 0.1
138.2 1.1 33.2 0.3
-15.0 0.1 -7.5 0.154.5 0.4 5.9 0.1-3.3 -3.1-0.2 -0.1
174.2 1.4 28.4 0.2

ASSETS (FIM million)
FIXED ASSETS AND OTHERNON-CURRENT INVESTMENTS
Intangible assets (10)Intangible rightsGoodwillConsolidated goodwillOther capitalised expenditureAdvance payments and construction in progress
Tangible assets (10)Land and waterBuildings and constructionsMachinery and equipmentOther tangible assetsAdvance payments and construction in progress
Financial assetsShares in associated companies (11-12)Shares and holdings (11-12)Loan receivables
CURRENT ASSETS
StocksFinished goodsOther stocksAdvance payments
ReceivablesTrade receivablesLoan receivablesPrepaid expenses and accrued incomeOther receivables
InvestmentsShares and holdingsOther investments
Other current investments
Cash in hand and at banks
31.12.1997 31.12.1996
42.9 34.140.2 15.717.9 22.4
100.3 107.014.8 216.1 20.5 199.7
510.6 485.71 502.5 1 478.6
258.5 185.520.6 4.37.7 2 299.9 36.5 2 190.6
377.6 336.9101.1 153.5
75.6 554.3 87.4 577.8
799.8 704.612.4 13.49.6 821.8 12.2 730.2
1 020.9 881.69.3 0.4
164.4 158.113.0 1 207.6 9.7 1 049.8
0.71 389.2 1 389.9 1 103.3 1 103.3
2.6 8.4
99.6 71.5
6 591.8 5 931.3
CONSOLIDATED BALANCE SHEET
12
19948.8%
19937.7%
199510.3%
19965.5%
400
300
200
100
0
229
307 316
117
FIM million
OPERATING PROFIT 1993-1997(Return on investment,%)
NET INTEREST EXPENSES 1993-1997(% of net sales)
2000
1500
1000
500
0
FIM million
199317.6%
199521.9%
199623.7%
CAPITAL AND RESERVES + PROVISIONSAT 31.12. 1993-1997 (Equity ratio, %)
19941.4%
19932.4%
19951.3%
19960.8%
350
300
250
200
150
100
50
0
253
155
131
89
1132 1230 13191365
FIM million
19978.4%
268
19970.5%
65
199723.9%
1525
199419.6%

13
LIABILITIES (FIM million)
CAPITAL AND RESERVES (16)
Restricted equityShare capitalAdditional share capitalReserve fundRevaluation fund
Non-restricted equityRetained earningsProfit for the period
TOTAL CAPITAL AND RESERVES
MINORITY INTEREST
PROVISIONS (17)
Accelerated depreciation*)Voluntary provisions*)
Other provisions
Obligatory provisions
CREDITORS (18)
Non-currentCapital loanDebenturesLoans from credit institutionsPension loansTrade payablesDeferred tax liabilityOther non-current liabilities
CurrentLoans from credit institutionsPension loansAdvances receivedTrade payablesAccrued liabilities and deferred incomeOther current liabilities
*) Divided between capital and reserves and a deferred tax liability for 1997
31.12.1997 31.12.1996
226.9 194.915.065.1 65.1
621.7 928.8 621.7 881.7
330.5 220.1174.2 504.7 28.4 248.5
1 433.5 1 130.2
91.6 91.0
89.0
54.9
107.6 93.0
120.0 120.0135.5503.9 510.5541.4 600.3
1.137.9
175.0 1 514.8 224.7 1 455.5
224.2 140.240.8 45.4
208.5 166.11 251.1 1 130.7
455.1 417.91 264.6 3 444.3 1 117.4 3 017.7
6 591.8 5 931.3
INCREASE IN FIXED ASSETS 1993-1997
8000
6000
4000
2000
01993 1994 1995 1996
PERSONNEL AT 31.12.1993-1997
5179 48644061 4347
3000
2500
2000
1500
1000
500
0
FIM million
1993 1994 1995 1996
NET INTEREST-BEARING LIABILITIES AT 31.12.1993-1997
2359
17501382 1531
600
500
400
300
200
100
0
FIM million
1993 1994 1995 1996
491
254 245
382
1997
1514
1997
275
1997
4504

FIM million
Business operations
From operationsOperating profit before depreciationFinancial income and expensesExtraordinary itemsTaxes
Total
Change in working capitalIncrease in stocksIncrease(-)/decrease(+) in current trade receivablesIncrease in interest-free current liabilities*
Total
Total cash flow from operations
InvestmentsIncrease in fixed assetsDecrease in fixed assets
Total
Cash flow before financing
FinancingIncrease in non-current receivablesIncrease in non-current liabilitiesDecrease in non-current liabilitiesIncrease(-)/decrease(+) in current receivablesIncrease(+)/decrease(-) in current liabilitiesInterest paid on share capitalIncrease in share capital and additional share capitalDecrease in capital and reserves (donations)Increase(+)/decrease(-) in minority interest
Total
Subsidiary company purchasesWorking capitalFixed assetsFinancingLiquid funds
Increase(+)/decrease(-) in liquid funds
Increase(+)/decrease(-) in liquid fundsLiquid funds at end of yearof which liquid funds of companies acquired during the yearLiquid funds at beginning of year
*Includes change in obligatory provisions
1.1.-31.12.1997 1.1.-31.12.1996
454.9 291.1-64.6 -92.5
1.4 -4.7-3.2 -3.6
388.5 190.3
-91.5 -49.2
-145.7 0.1199.6 14.5-37.6 -34.6
350.9 155.7
274.7 381.971.6 136.8
-203.1 -245.1
147.8 -89.4
-8.1 -41.0163.2 297.1206.0 641.5-12.1 25.0192.0 -48.9
13.3 12.847.0 28.70.1 0.1
-1.4 -0.9161.2 -394.4
6.6-98.9 -40.698.8 15.8
-0.1 -12.1 -30.3
308.9 -514.1
1 492.1 1 183.2
0.0 1 492.1 -12.1 1 171.2-1 183.2 -1 685.3
308.9 -514.1
CONSOLIDATED CASH FLOW STATEMENT
14

SOK INCOME STATEMENT
FIM million
Net sales (1)Other operating income (2)
Variable costsMaterials, supplies and products
Purchases during the periodDecrease in inventories
Staff costs (3)Rents
Gross margin
Fixed costsStaff costs (3)RentsOther fixed costsOther operating costs (2)
Operating profit before depreciation
Depreciation on fixed assets and other capitalised expenditure (4)
Depreciation according to planOne-time depreciation
Operating loss
Financial income and expenses (5)Dividend incomeInterest income from non-current investmentsOther interest incomeOther financial incomeExchange rate gains and lossesInterest expensesOther financial expensesValue adjustment on investments
Loss before extraordinary items,voluntary provisions and income taxes
Extraordinary income and expenses (6)Extraordinary incomeExtraordinary expenses
Profit before voluntary provisions and income taxes
Decrease in accelerated depreciation (4)Income taxes (9)
Profit for the period
1.1.-31.12.1997 % 1.1.-31.12.1996 %
5 361.2 100.0 5 957.0 100.069.3 1.3 42.3 0.7
4 894.8 5 070.46.2 279.2
1.7202.6 -5 103.6 95.2 195.3 -5 546.6 93.1
326.9 6.1 452.7 7.6
89.1 243.231.3 75.4
185.1 245.25.0 -310.5 5.8 0.4 -564.2 9.5
16.4 0.3 -111.5 1.9
19.4 31.8-19.4 0.4 2.1 -33.9 0.5
-3.0 0.1 -145.4 2.4
7.8 8.6122.9 129.6
45.5 64.910.9 4.4
0.8124.8 162.4
16.4 9.9104.7 -58.8 1.1 2.1 33.9 0.5
-61.8 1.2 -111.5 1.9
231.9 125.81.9 230.0 4.3 5.9 119.9 2.0
168.2 3.1 8.4 0.1
3.1 0.1 13.6 0.30.2 0.1
171.5 3.2 22.1 0.4
15
ASSETS (FIM million)
FIXED ASSETS AND OTHERNON-CURRENT INVESTMENTS
Intangible assets (10)Intangible rightsOther capitalised expenditureAdvance payments and construction in progress
Tangible assets (10)Land and waterBuildings and constructionsMachinery and equipmentOther tangible assetsAdvance payments and construction in progress
Financial assetsShares and holdings (11-12)Loan receivables
CURRENT ASSETS
StocksOther stocksAdvance payments
ReceivablesTrade receivablesLoan receivablesPrepaid expenses and accrued incomeOther receivables
InvestmentsShares and investmentsOther investments
Other current investments
Cash in hand and at banks
31.12.1997 31.12.1996
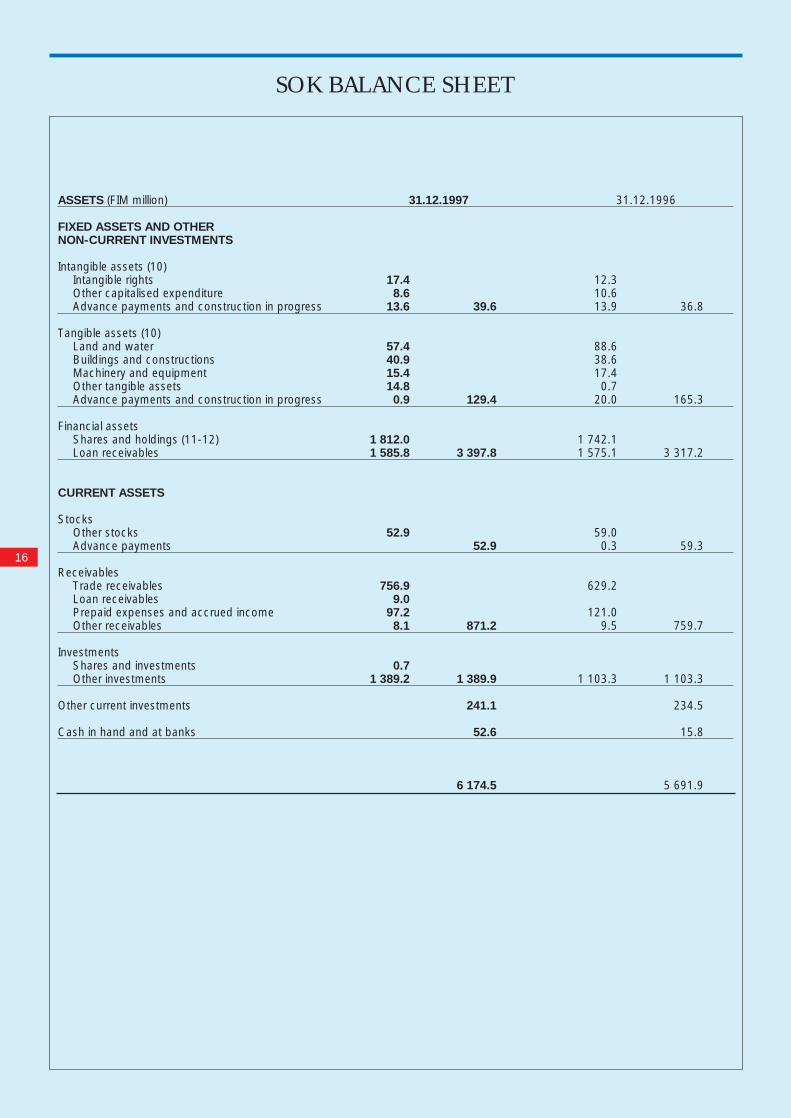
17.4 12.38.6 10.6
13.6 39.6 13.9 36.8
57.4 88.640.9 38.615.4 17.414.8 0.70.9 129.4 20.0 165.3
1 812.0 1 742.11 585.8 3 397.8 1 575.1 3 317.2
52.9 59.052.9 0.3 59.3
756.9 629.29.0
97.2 121.08.1 871.2 9.5 759.7
0.71 389.2 1 389.9 1 103.3 1 103.3
241.1 234.5
52.6 15.8
6 174.5 5 691.9
SOK BALANCE SHEET
16

17
LIABILITIES (FIM million)
CAPITAL AND RESERVES (16)
Restricted equityShare capitalAdditional share capitalReserve fundRevaluation fund
Non-restricted equityOther fundsRetained earningsProfit for the period
TOTAL CAPITAL AND RESERVES
PROVISIONS (17)
Accelerated depreciation
Obligatory provisions
CREDITORS (18)
Non-currentCapital loanDebenturesLoans from credit institutionsPension loansOther non-current liabilities
CurrentLoans from credit institutionsPension loansAdvances receivedTrade payablesAccrued liabilities and deferred incomeOther current liabilities
31.12.1997 31.12.1996
226.9 194.915.065.1 65.141.2 348.2 71.2 331.2
1 254.4 1 254.558.5 49.7
171.5 1 484.4 22.1 1 326.3
1 832.6 1 657.5
16.1 19.3
88.8 71.1
120.0 120.0135.5380.6 383.2479.1 515.4174.9 1 290.1 229.8 1 248.4
160.9 86.436.1 38.815.2 13.4
788.7 672.5141.2 153.5
1 804.8 2 946.9 1 731.0 2 695.6
6 174.5 5 691.9

FIM million
Business operations
From operationsOperating profit before depreciationFinancial income and expensesExtraordinary itemsTaxes
Total
Change in working capitalDecrease in stocksIncrease(-)/decrease(+) in current trade receivablesIncrease(+)/decrease(-) in interest-free current liabilities*
Total
Total cash flow from operations
InvestmentsIncrease in fixed assetsDecrease in fixed assets
Total
Cash flow before financing
FinancingIncrease in non-current receivablesIncrease in non-current liabilitiesDecrease in non-current liabilitiesIncrease(-)/decrease(+) in current receivablesIncrease in current liabilitiesInterest paid on share capitalIncrease in share capital and additional share capitalDecrease in capital and reserves (donations)
Total
Increase(+)/decrease(-) in liquid funds
Increase(+)/decrease(-) in liquid fundsLiquid funds at end of yearLiquid funds at beginning of year
*Includes change in obligatory provisions
1.1.-31.12.1997 1.1.-31.12.1996
16.4 -111.645.8 36.0
230.0 119.90.2 0.1
292.4 44.4
6.0 279.0-103.9 26.0108.4 -133.8
10.5 171.2
302.9 215.6
158.8 346.835.6 130.9
-123.2 -215.9
179.7 -0.3
-63.1 -250.4231.7 297.1129.6 493.9
-7.5 59.985.1 89.413.3 12.847.0 28.70.1 0.1
150.2 -282.1
329.9 -282.4
1 683.5 1 353.6-1 353.6 -1 636.0
329.9 -282.4
SOK CASH FLOW STATEMENT
18
NOTES TO THE FINANCIAL STATEMENTS
ACCOUNTING PRINCIPLES
Scope of the consolidatedfinancial statements
The SOK Corporation consists of theparent company, Suomen Osuuskaup-pojen Keskuskunta (SOK), and its sub-sidiaries. In addition to the parent com-pany, the consolidated financial state-ments include all those companies inwhich SOK owns, either directly or indi-rectly, more than 50 % of the vote-car-rying shares. Of the subsidiaries, 1 SHBhousing company and 13 non-businesscompanies have not been consolidated.Their total book value in the parent com-pany’s balance sheet is FIM 0.3 million.The subsidiaries are listed under item 12in the Notes.Investments in associated companies, inwhich the Corporation’s holding is 20-50 % of the votes, are consolidated inthe accounts with the exception of 10housing companies of which 9 are SHBhousing companies. Their total book value in the parent company’s balancesheet is FIM 1.0 million. These associat-ed companies are listed under item 12in the Notes.The exclusion of the above mentionedsubsidiary and associated companieshas no significant effect on the Corpo-ration’s result and non-restricted equity. One foreign associated company hasbeen consolidated in the accounts.
Principles of consolidationThe consolidated financial statementsare for the period 1.1. -31.12.1997.Companies acquired during the year areincluded in the accounts from the timeof their acquisition. Subsidiaries and as-sociated companies sold during the pe-riod are included up to their date of sale.The same principle has been appliedwhen Corporation companies have beenmerged during the financial year.
Intra-corporate holdingsIntra-corporate shareholdings havebeen eliminated using the acquisitioncost method. This means that the ac-quisition cost of a subsidiary’s share hasbeen eliminated against the subsidiary’sequity at the moment of acquisition. Dif-
ferences arising from eliminations havebeen so allocated that those due to thedifference between the market value andbook value of properties have been tak-en to fixed assets and the remainder isdisclosed as consolidated goodwill.Planned depreciation on the eliminationdifferences arising from buildings hasbeen made in accordance with plan de-preciated of the relevant buildings. Con-solidated goodwill treated as a singleitem is depreciated according to planover its useful life which, as a rule, is 5years.
Internal transactions andmarginsIn drawing up the consolidated financialstatements, all intra-corporate sales, in-come and expenses, dividends, marginson stocks, gains and losses on the saleof fixed assets, receivables and liabilitieshave been eliminated.
Minority interestsThe minority interests of subsidiary com-panies’ capital and reserves and profitfor the year have been stated as a sep-arate item in the consolidated incomestatement and balance sheet.
Conversion differencesThe figures in the financial statements forthe foreign associated company havebeen translated into Finnish marks at theaverage Bank of Finland rates of ex-change prevailing on the balance sheetdate. The conversion difference createdin eliminating the capital and reserveshas been taken to non-restricted equityin the consolidated balance sheet.
Associated companiesAssociated companies have been con-solidated according to the equitymethod. The Corporation’s share of theirresults is presented on a separate lineunder financial income and expenses.The Corporation’s share in the accumu-lated net wealth of the associated com-panies since their acquisition has beenadded to the acquisition cost and the
non-restricted equity in the consolidat-ed balance sheet.Profits on sales of fixed assets betweenthe Corporation and the associatedcompanies have been eliminated in pro-portion to the shareholdings. The itemhas been deducted from the consoli-dated non-restricted equity and assets.The eliminated sales profit is entered asincome in keeping with depreciation. FIM40.1 million in intra-corporate marginsbetween SOK and one associated com-pany has not been eliminated as the Cor-poration’s holding of over 20 % is notconsidered permanent.
Items denominated in foreign currencies and
derivative contractsBusiness transactions denominated inforeign currencies have been entered atthe rate of exchange prevailing at thetime of the transaction. Receivables andliabilities in foreign currencies outstand-ing at the end of the year have beentranslated into Finnish marks at the av-erage Bank of Finland rates of exchangeprevailing on the balance sheet date andexchange differences have been enteredas affecting income.Differences in the interest on currencyforwards have been phased throughoutthe duration of the agreements under in-terest income or expenses, and ex-change differences have been enteredas affecting the income of the exchangedifferences on the hedged items duringthe year in which they were entered. Theunrealised exchange differences on fu-ture cash flows protected by currencyforwards after the account date havebeen entered in the balance sheet.
The premiums on interest options havebeen phased on the time-used basis toadjust the entered, hedged interests. Alloption premiums have been entered un-der advances paid or received. The en-try has been made at the latest when thecontract closed, fell due or expired. In-terest on interest rate swaps has beenentered in full as interest income or ex-penses.
The negative changes in the values ofother derivative contracts than those en-tered into for hedging purposes open at
19

the account date have been entered asexpenses. Valuation gains have been en-tered as income only when losses havebeen entered to the position of the rele-vant contract.
StocksStocks are stated in the balance sheeton the FIFO basis at the acquisition costor repurchase price or probable marketprice, whichever is the lower. Intra-cor-porate margins on stocks have beeneliminated.
Fixed assets and depreciationFixed assets have been valued in the bal-ance sheet at cost less accumulatedplanned depreciation. The difference be-tween planned depreciation and the de-preciation entered is treated in the in-come statement as an appropriation. Inthe consolidated balance sheet the ac-celerated depreciation is divided be-tween capital and reserves and an im-puted tax liability. Of the revaluation fundof FIM 622 million in the consolidatedbalance sheet, FIM 530 million has beentreated as a revaluation item. Other reval-uations of FIM 92 million were made inthe companies concerned. The marketvalue of the Corporation’s fixed assetsexceeds the total fixed assets in the con-solidated balance sheet.
Depreciation is calculated on a straight-line basis so as to write off the cost offixed assets over their expected usefullives, which are as follows:
YearsBuildings 30 - 35Light constructions and building equipment 10 - 15Office and warehouse fixtures 10Warehouse, servicing and processing machinery 7Hotel and restaurant furnishings 5 - 10Shop furnishings 5 - 7Motor vehicles and computer hardware (other than PCs) 5Goodwill 5 Other tangible As permittedand intangible by taxationassets laws
LeasingLeasing charges have been treated asrent expenses.
Future expenses and lossesFuture expenses and losses, to whichthe company has bound itself or whoserealisation is considered probable, havebeen entered as expenses under the rel-evant heading. In the balance sheet, therelevant cost reservations have been en-tered as obligatory provisions.
AppropriationsAppropriations are accelerated depreci-ation and voluntary provisions. In theconsolidated balance sheet voluntaryprovisions and accelerated depreciation
has been divided between capital andreserves and a deferred tax liability.
Pension arrangementsIn addition to the statutory pension in-surance scheme, the SOK Corporationhas had a voluntary pension fund,Eläkekassa Elonvara, operating primar-ily within companies belonging to the SGroup.In respect to that part of the pension li-abilities not covered by the funds of Elon-vara at the time of its dissolution, mem-bers of the scheme took out additionalinsurance with the Tapiola Mutual Pen-sion Insurance Company Ltd to coverthe deficit, with a commitment to paywithin a period of ten years. Similarly,members of the scheme issued a per-sonal surety on the payment of the ad-ditional insurance taken out by othermembers. In accordance with the agree-ment, the uncovered joint liability shall becovered at the latest by the year 2000.SOK’s own share of the uncovered jointliability has been paid.Additional pension insurance has alsobeen taken out with Tapiola for the for-mer members of the dissolved Elonvarain the employment of the Corporation,thus securing their currents and futureretirement benefits as stipulated in Elon-vara’s rules and which were previouslytreated as pension transactions.
Of the pension premiums paid, the pen-sion costs included in staff costs wereentered on the accrual basis as pensionspaid for the year, and the remainder aspension costs for earlier years under ex-traordinary items.
20
Responsibility for managing the SOKCorporation’s financial risks resides withSOK Finance. The principles of risk man-agement have been confirmed by theSOK Board of Directors, which has like-wise set the limits for liquidity, interestrate, foreign exchange and credit risks.In addition, numerical objectives havebeen established for the different areasof financing in order to guarantee the suf-ficiency, balance and low cost of fi-nancing under all circumstances.
Liquidity riskA sufficient level of liquidity is maintainedwith cash assets, account limits, money
market investments and binding creditlimits.
Interest rate riskInterest rate risk is managed within theCorporation by diffusing loans betweenfixed and variable interest instrumentsand using interest rate derivatives.
Foreign exchange riskAlmost all of the SOK Corporation’s netsales come from the domestic market.The Corporation’s foreign exchangeloans are fully covered by foreign ex-change swaps. Exchange risks related
to imports are monitored for the coming12 months and hedging operationsagreed upon separately with the im-porting companies.
Credit riskThe management of credit risk in com-mercial operations is the responsibility ofthe business units concerned. Creditrisks deriving from the investment of liq-uid assets and dealings in derivatives areminimised by establishing credit limitswith selected counterparties and bymaking agreements only with leadingdomestic and foreign banks, financial in-stitutions and brokers.
FINANCIAL RISK MANAGEMENT

NOTES TO THE CONSOLIDATED AND SOK INCOME STATEMENT AND BALANCE SHEET
21
FIM million
1. Net sales by sectorHardware and agricultural tradeHotel and restaurant businessCar tradeDepartment store tradeGrocery tradeConsumer goods sourcingEDI invoicingReal estate and property leasingOther servicesEliminationsTotal
2. Operating income and costs
Other operating incomeProfits on sale of fixed assetsOther operating incomeTotal
Other operating costsLosses on sale of fixed assetsOther operating costsTotal
3. Staff costsWages and salariesPension costsOther personnel costsTotalValue of fringe benefits
Members of SOK’s Management Team and certain subsidiary company managing directors have the right to retire when they reach 58-62 years.
4. Depreciation
Plan depreciationIntangible rightsGoodwillOther capitalised expenditureBuildings and constructionsMachinery and equipmentOther tangible assetsTotal
One-time depreciationIntangible rightsGoodwillOther capitalised expenditureLand areasBuildings and constructionsMachinery and equipmentTotal
Depreciation on consolidated goodwill
Depreciation on fixed assets andother capitalised expenditure
Increase(-)/decrease(+) in accelerated depreciationIntangible rightsGoodwillOther capitalised expenditureBuildings and constructionsMachinery and equipmentOther tangible assetsTotal
SOK-CORPORATION SOK1997 1996 1997 1996
3 155.5 2 962.2874.6 741.2949.8 834.4
1 212.6 1 358.4 1 118.2253.2 80.8
1 098.4 932.74 894.9 4 470.4 4 894.9 4 470.4
487.5 414.1 230.5 161.5334.5 301.5 235.8 206.9
-883.8 -597.512 377.2 11 498.2 5 361.2 5 957.0
105.3 60.0 69.2 42.31.2 0.6 0.1
106.5 60.6 69.3 42.3
3.3 0.7 0.45.7 5.09.0 0.7 5.0 0.4
592.4 576.3 63.8 185.784.6 98.8 11.7 35.978.3 73.2 13.6 23.3
755.3 748.3 89.1 244.910.3 9.6 2.4 3.0
18.0 15.3 8.4 7.58.0 11.0 2.0
23.6 16.4 2.8 3.555.8 45.5 2.2 2.169.8 68.5 5.6 16.70.8 0.3 0.4
176.0 157.0 19.4 31.8
0.22.0 1.9
0.3 1.61.5
4.1 5.04.0 3.8 0.28.6 13.9 0.0 2.1
2.0 2.8
186.6 173.7 19.4 33.9
-1.1 0.1 0.6 0.3-2.5 2.9 0.2-0.7 -2.9 0.5 0.2-5.4 -32.7 -0.5 -1.7-5.0 25.1 2.7 14.6-0.3 -0.2
-15.0 -7.5 3.1 13.6

22
FIM million
5. Intra-corporate financial income and expensesInterest income from non-current investmentsOther interest incomeOther financial incomeExchange rate gains and lossesInterest expensesOther financial expensesTotal
6. Extraordinary income and expensesExtraordinary incomeContributions from subsidiariesOtherTotal
Extraordinary expensesContributions to subsidiariesOtherTotalTotal extraordinary income and expenses
7. Increase(-)/decrease(+) in obligatory provisionsIncrease in rent expenses againstempty business premisesDecrease in rent expenses againstempty business premisesIncrease in other future expensesand lossesDecrease in other future expensesand lossesTotal
8. Increase(-)/decrease(+) in voluntary provisionsTransition provisionsApartment block provisionsTotal
9. Income taxesFor the yearFor earlier yearsTotal
10. Intangible and tangible assets
Intangible assets
Intangible rightsAcquisition cost at 1.1.Increase 1.1.-31.12.Decrease 1.1.-31.12.Acquisition cost at 31.12.Accumulated plan depreciation at 31.12.Book value at 31.12.
Accelerated depreciation at 1.1.Increase 1.1.-31.12.Decrease 1.1.-31.12.Accelerated depreciation at 31.12.
GoodwillAcquisition cost at 1.1.Increase 1.1.-31.12.Decrease 1.1.-31.12.Acquisition cost at 31.12.Accumulated plan depreciation at 31.12.Book value at 31.12.
Accelerated depreciation at 1.1.Increase 1.1.-31.12.Decrease 1.1.-31.12.Accelerated depreciation at 31.12.
SOK-CORPORATION SOK1997 1996 1997 1996
108.9 115.117.4 19.72.9 3.8
-4.7 -0.1-13.2 -17.2-0.4 -0.5
110.9 120.8
228.7 124.63.3 1.2 3.2 1.23.3 1.2 231.9 125.8
0.41.9 9.6 1.9 5.51.9 9.6 1.9 5.91.4 -8.4 230.0 119.9
-28.3 -40.0 -27.5 -39.7
35.5 42.4 30.3 34.6
-26.2 -8.7 -20.5
4.4 1.0-14.6 -5.3 -17.7 -5.1
54.6 6.0-0.1 -0.154.5 5.9 0.0 0.0
5.4 2.9 0.4-2.1 0.2 -0.6 -0.13.3 3.1 -0.2 -0.1
107.4 103.6 47.3 58.927.4 21.8 13.6 6.4
-11.4 -18.0 -6.1 -18.0123.4 107.4 54.8 47.3-80.5 -73.3 -37.4 -35.042.9 34.1 17.4 12.3
5.6 5.8 3.3 3.62.2 0.7
-1.1 -0.9 -0.7 -0.36.7 5.6 2.6 3.3
50.9 85.8 0.0 34.737.4
-37.6 -34.9 -34.750.7 50.9 0.0 0.0
-10.5 -35.240.2 15.7 0.0 0.0
0.8 3.7 0.0 0.22.5
-2.9 -0.23.3 0.8 0.0 0.0
23
FIM million
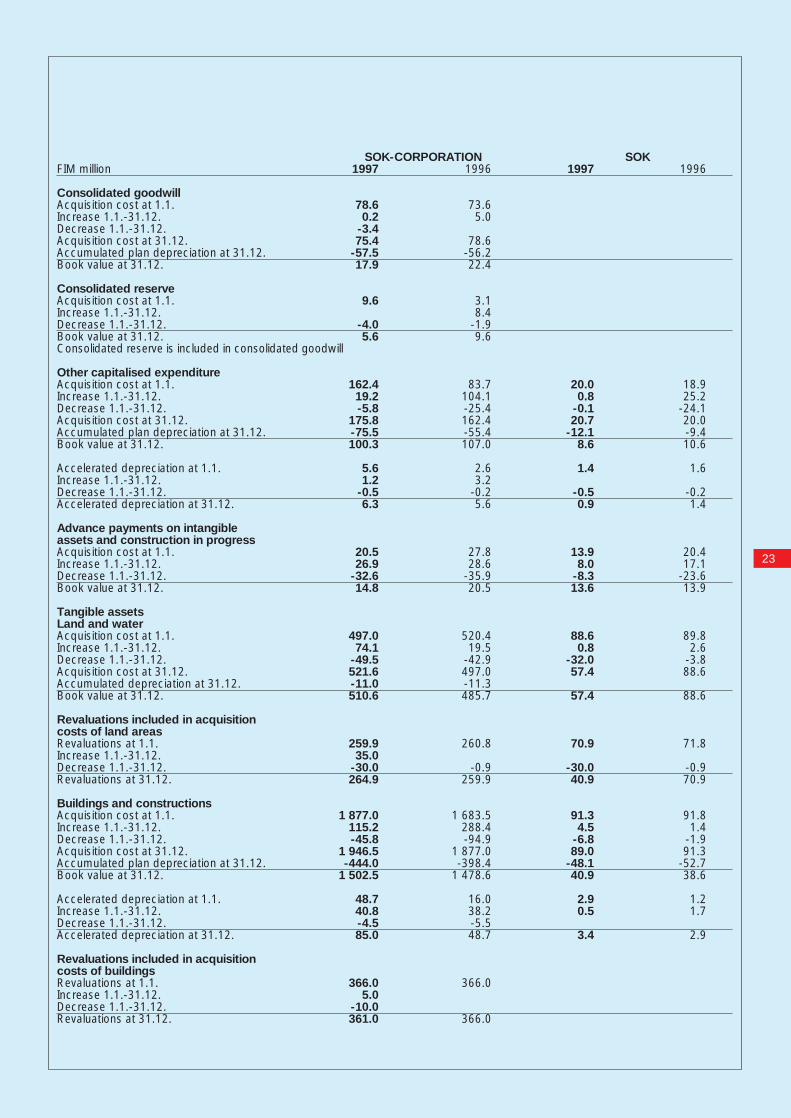
Consolidated goodwillAcquisition cost at 1.1.Increase 1.1.-31.12.Decrease 1.1.-31.12.Acquisition cost at 31.12.Accumulated plan depreciation at 31.12.Book value at 31.12.
Consolidated reserveAcquisition cost at 1.1.Increase 1.1.-31.12.Decrease 1.1.-31.12.Book value at 31.12.Consolidated reserve is included in consolidated goodwill
Other capitalised expenditureAcquisition cost at 1.1.Increase 1.1.-31.12.Decrease 1.1.-31.12.Acquisition cost at 31.12.Accumulated plan depreciation at 31.12.Book value at 31.12.
Accelerated depreciation at 1.1.Increase 1.1.-31.12.Decrease 1.1.-31.12.Accelerated depreciation at 31.12.
Advance payments on intangibleassets and construction in progressAcquisition cost at 1.1.Increase 1.1.-31.12.Decrease 1.1.-31.12.Book value at 31.12.
Tangible assetsLand and waterAcquisition cost at 1.1.Increase 1.1.-31.12.Decrease 1.1.-31.12.Acquisition cost at 31.12.Accumulated depreciation at 31.12.Book value at 31.12.
Revaluations included in acquisition costs of land areasRevaluations at 1.1.Increase 1.1.-31.12.Decrease 1.1.-31.12.Revaluations at 31.12.
Buildings and constructionsAcquisition cost at 1.1.Increase 1.1.-31.12.Decrease 1.1.-31.12.Acquisition cost at 31.12.Accumulated plan depreciation at 31.12.Book value at 31.12.
Accelerated depreciation at 1.1.Increase 1.1.-31.12.Decrease 1.1.-31.12.Accelerated depreciation at 31.12.
Revaluations included in acquisition costs of buildingsRevaluations at 1.1.Increase 1.1.-31.12.Decrease 1.1.-31.12.Revaluations at 31.12.
SOK-CORPORATION SOK1997 1996 1997 1996
78.6 73.60.2 5.0
-3.475.4 78.6
-57.5 -56.217.9 22.4
9.6 3.18.4
-4.0 -1.95.6 9.6
162.4 83.7 20.0 18.919.2 104.1 0.8 25.2-5.8 -25.4 -0.1 -24.1
175.8 162.4 20.7 20.0-75.5 -55.4 -12.1 -9.4100.3 107.0 8.6 10.6
5.6 2.6 1.4 1.61.2 3.2
-0.5 -0.2 -0.5 -0.26.3 5.6 0.9 1.4
20.5 27.8 13.9 20.426.9 28.6 8.0 17.1
-32.6 -35.9 -8.3 -23.614.8 20.5 13.6 13.9
497.0 520.4 88.6 89.874.1 19.5 0.8 2.6
-49.5 -42.9 -32.0 -3.8521.6 497.0 57.4 88.6-11.0 -11.3510.6 485.7 57.4 88.6
259.9 260.8 70.9 71.835.0
-30.0 -0.9 -30.0 -0.9264.9 259.9 40.9 70.9
1 877.0 1 683.5 91.3 91.8115.2 288.4 4.5 1.4-45.8 -94.9 -6.8 -1.9
1 946.5 1 877.0 89.0 91.3-444.0 -398.4 -48.1 -52.7
1 502.5 1 478.6 40.9 38.6
48.7 16.0 2.9 1.240.8 38.2 0.5 1.7-4.5 -5.585.0 48.7 3.4 2.9
366.0 366.05.0
-10.0361.0 366.0

FIM million
Machinery and equipmentAcquisition cost at 1.1.Increase 1.1.-31.12.Decrease 1.1.-31.12.Acquisition cost at 31.12.Accumulated plan depreciation at 31.12.Book value at 31.12.
Accelerated depreciation 1.1.Increase 1.1.-31.12.Decrease 1.1.-31.12.Accelerated depreciation at 31.12.
Share of machinery and equipmentof book value at 31.12.
Other tangible assetsAcquisition cost at 1.1.Increase 1.1.-31.12.Decrease 1.1.-31.12.Acquisition cost at 31.12.Accumulated plan depreciation at 31.12.Book value at 31.12.
Accelerated depreciation at 1.1.Increase 1.1.-31.12.Accelerated depreciation at 31.12.
Advance payments and construction in progressAcquisition cost at 1.1.Increase 1.1.-31.12.Decrease 1.1.-31.12.Book value at 31.12.
11. Non-current investments
Shares in corporate companiesAcquisition cost at 1.1.Increase 1.1.-31.12.Decrease 1.1.-31.12.Acquisition cost at 31.12.Accumulated depreciation at 31.12.Book value at 31.12.
Shares in associated companiesAcquisition cost at 1.1.Increase 1.1.-31.12.Decrease 1.1.-31.12.Acquisition cost at 31.12.Accumulated depreciation at 31.12.Book value at 31.12.
Shares and holdingsAcquisition cost at 1.1.Increase 1.1.-31.12.Decrease 1.1.-31.12.Acquisition cost at 31.12.Accumulated depreciation at 31.12.Book value at 31.12.
Revaluations included in acquisition cost of sharesRevaluations at 1.1.Revaluations at 31.12.
SOK-CORPORATION SOK1997 1996 1997 1996
511.9 602.5 67.4 276.8161.4 152.3 3.7 20.0-49.9 -242.9 -8.1 -229.4623.4 511.9 63.0 67.4
-364.9 -326.4 -47.6 -50.0258.5 185.5 15.4 17.4
28.1 52.9 11.7 26.312.9 3.5-7.8 -28.3 -2.8 -14.633.2 28.1 8.9 11.7
2.6 1.4
5.8 5.1 0.8 0.717.7 2.6 14.4 0.1-0.6 -1.922.9 5.8 15.2 0.8-2.3 -1.5 -0.4 -0.120.6 4.3 14.8 0.7
0.10.3 0.1 0.20.4 0.1 0.2
36.5 146.4 20.0 22.062.9 50.3 0.9 1.6
-91.7 -160.2 -20.0 -3.67.7 36.5 0.9 20.0
1 252.6 1 011.9128.9 245.2-10.8 -4.5
1 370.7 1 252.6-31.9 -31.9
1 338.8 1 220.7
431.5 404.3 441.1 431.640.9 27.4 4.8 9.7
-27.7 -0.2 -0.2444.7 431.5 445.9 441.1-67.1 -94.6 -76.0 -76.0377.6 336.9 369.9 365.1
287.5 291.3 280.2 286.68.5 62.0 7.0 59.2
-27.0 -65.8 -26.3 -65.6269.0 287.5 260.9 280.2
-167.9 -134.0 -157.7 -123.9101.1 153.5 103.2 156.3
0.3 0.3 0.3 0.30.3 0.3 0.3 0.3
24

25
FIM million
13. Taxable values of fixed assetsLand and waterBuildingsShares in corporate companiesShares in associated companiesShares and holdings
12. Companies owned by the Corporation andthe Parent company at 31.12.1997
Corporate companiesCommercialAutomaa OyHankkija Agriculture LtdHelsinki Hotels OyHotel City Vantaa OyHämeenmaan Automarket OyHämeenmaan Hotellit OyIntrade Partners OyJollas-Opisto OyKuusinen OyLahden Uusi Seurahuone OyOy Maan Auto AbOy Sokos AbOy Sokoteria AbRoyal Hotels OySOK-Business OySOK-Takaus OySokotel OyTurun Valtavaunu OyÄssähuoltamot OyReal estate companies (30 pcs)Total (under fixed assets)Real estate subsidiaries (57 pcs) (under stocks)
Associated companiesAs. Oy Hämeenkatu 29As. Oy HätilänkiviEtelä-Suomen Huoltamot Oy GroupGraanin Liikekeskus OyInex Partners GroupKiinteistö Oy Iisalmen MarjahakaKiinteistö Oy PysäköintiveturiKiinteistö Oy TullintorniKiinteistö Oy Turun ToripaikoitusKiinteistö Oy Valkeakosken LiikekeskusKiinteistö Oy Vilhonk. 5Malmintorin Kiinteistö OyRealinvest GroupTenco GroupTullin Parkki OyHotellipankki OyVaajakosken Tulitikkutehdas OyOther companies (13 pcs)TotalOther associated companies (2 pcs) (under stocks)
Other shares owned by the Parent CompanyPaper and State Housing Board CompaniesCervuctum OySato-Yhtymä OyjPolar-Yhtymä OyOther companiesTotal
Total under fixed assetsTotal under stocks
Corporation’s SOK’s Shares owned by SOK Profit/voting share- share- number nominal book lossrights holders’ holding value value
% equity % FIM 1000 FIM 1000 FIM 1000FIM 1000
100.0 100.0 17 918 100.0 13 300 13 300 23 895 -4 008100.0 100.0 168 453 100.0 156 100 156 100 174 996 7 987
90.0 90.0 25 329 90.0 27 000 27 000 25 586 8 22899.9 99.9 26 701 99.9 13 554 397 20 331 13 229 4 08490.0 90.0 21 664 90.0 32 400 32 400 32 528 -6 185
100.0 100.0 -29 990 100.0 2 500 2 500 2 500 -1 611100.0 100.0 25 077 100.0 16 660 24 990 24 995 3100.0 100.0 24 389 100.0 24 000 24 000 24 000 159100.0 100.0 6 953 100.0 7 500 1 500 3 075 1 792100.0 100.0 477 -107100.0 100.0 90 375 100.0 8 000 000 80 000 102 825 -2 233100.0 100.0 56 542 100.0 100 000 50 000 150 071 -60 179100.0 100.0 90 116 100.0 29 000 58 000 80 248 -5 978100.0 100.0 21 571 100.0 4 000 20 000 30 000 -8 427100.0 100.0 -301 100.0 150 15 15 -243
99.9 99.9 26 324 99.9 249 771 24 977 26 979 5757.9 57.9 2 727 9.0 394 394 400 4
100.0 100.0 -663 100.0 30 30 3 101 790.8 90.8 2 316 90.8 18 158 1 816 1 816 271
627 739 301 982 618 568 39 4151 203 717 839 335 1 338 827 -26 964
34 177 21 239 40 408 7 640
25.1 25.1 -4 25.1 377 0 4 975 -8523.9 23.9 1 908 23.9 18 320 1 832 4 547 3846.5 46.5 4 552 46.5 6 510 6 510 9 346 -6 74150.0 50.0 1 439 50.0 10 500 11 3 765 150.0 50.0 71 917 50.0 40 000 40 000 40 000 18 62633.3 33.3 468 33.3 500 500 500 -9549.7 40.2 8 872 49.7 293 29 9 013 -65740.0 40.0 15 148 40.0 21 403 21 10 151 -92028.6 28.6 20 28.6 100 20 20 048.8 48.8 16 090 48.8 585 650 586 16 620 050.0 50.0 33 450 50.0 50 004 18 001 6 -5 83540.7 40.7 71 573 40.7 4 177 6 266 74 574 021.9 21.9 197 456 21.9 7 520 000 188 000 188 000 15 00050.0 50.0 427 50.0 1 000 1 000 1 000 98945.1 30.0 6 710 45.1 246 25 5 448 -77824.7 24.7 397 133.3 33.3 710 33.3 5 500 500 3
216 728 1 467 -223431 349 264 029 369 932 19 324
1 553 21 3 538 4
289 28918.8 150 000 15 000 0
8.7 190 220 1 902 36 8754.4 5 305 272 53 053 25 465
9 197 40 56679 441 103 195
1 182 805 1 811 95421 260 43 946
shareholding
%
SOK-CORPORATION SOK1997 1996 1997 1996
534.0 528.4 72.2 74.4699.1 682.5 28.0 31.2
1 125.6 1 146.7436.6 375.3 436.2 374.6109.2 100.8 95.8 86.5

26
FIM million
14. Non-current investments and loan receivables
Corporate companiesShares and holdingsLoan receivablesTotal
Commitments for stabilisingcorporate company liabilities
Associated companiesShares and holdingsLoan receivablesTotal
15. Current assets
Receivables due after one year or a longer periodTrade receivablesPrepaid expenses and accrued incomeOther receivablesTotal
Receivables from corporate companiesTrade receivablesPrepaid expenses and accrued incomeCurrent investmentsTotal
Receivables from associated companiesTrade receivablesLoan receivablesPrepaid expenses and accrued incomeCurrent investmentsTotal
16. Capital and reservesRestricted equityShare capital at 1.1.Increase 1.1.-31.12.Share capital at 31.12.Share capital due will accrue in 1998-2001
Additional share capital at 1.1.Increase 1.1.-31.12.Additional share capital at 31.12.
Reserve fund at 1.1.Reserve fund at 31.12.
Revaluation fund at 1.1.Decrease in connection with saleof fixed assetsIncrease 1.1.-31.12.Decrease 1.1.-31.12.Revaluation fund at 31.12.
Non-restricted equityNon-restricted equity at 1.1.Interest on share capitalDonationsOther changePart transferred from accelerated depreciation and voluntary provisionsRetained earnings at 31.12.
Profit for the periodTotal non-restricted equity
SOK-CORPORATION SOK1997 1996 1997 1996
1 338.8 1 220.71 512.4 1 489.82 851.2 2 710.5
475.1 608.9
377.6 336.9 369.9 365.163.0 73.5 62.9 73.4
440.6 410.4 432.8 438.5
58.5 3.27.6 5.0 5.6 3.52.7 6.1 2.6 6.0
68.8 14.3 8.2 9.5
50.2 45.116.6 26.7
238.5 226.1305.3 297.9
15.2 9.8 13.9 9.49.0 9.01.4 1.4 0.7 0.72.2 8.1 2.2 8.1
27.8 19.3 25.8 18.2
194.9 166.1 194.9 166.132.0 28.8 32.0 28.8
226.9 194.9 226.9 194.913.3 26.9 13.3 26.9
15.0 15.015.0 15.0
65.1 65.1 65.1 65.165.1 65.1 65.1 65.1
621.7 622.7 71.2 72.2
-1.0 -1.030.0
-30.0 -30.0621.7 621.7 41.2 71.2
248.5 231.6 1 326.3 1 317.0-13.2 -12.8 -13.2 -12.8-0.1 -0.1 -0.1 -0.1
1.4
95.3330.5 220.1 1 313.0 1 304.2
174.2 28.4 171.5 22.1504.7 248.5 1 484.5 1 326.3
27
FIM million
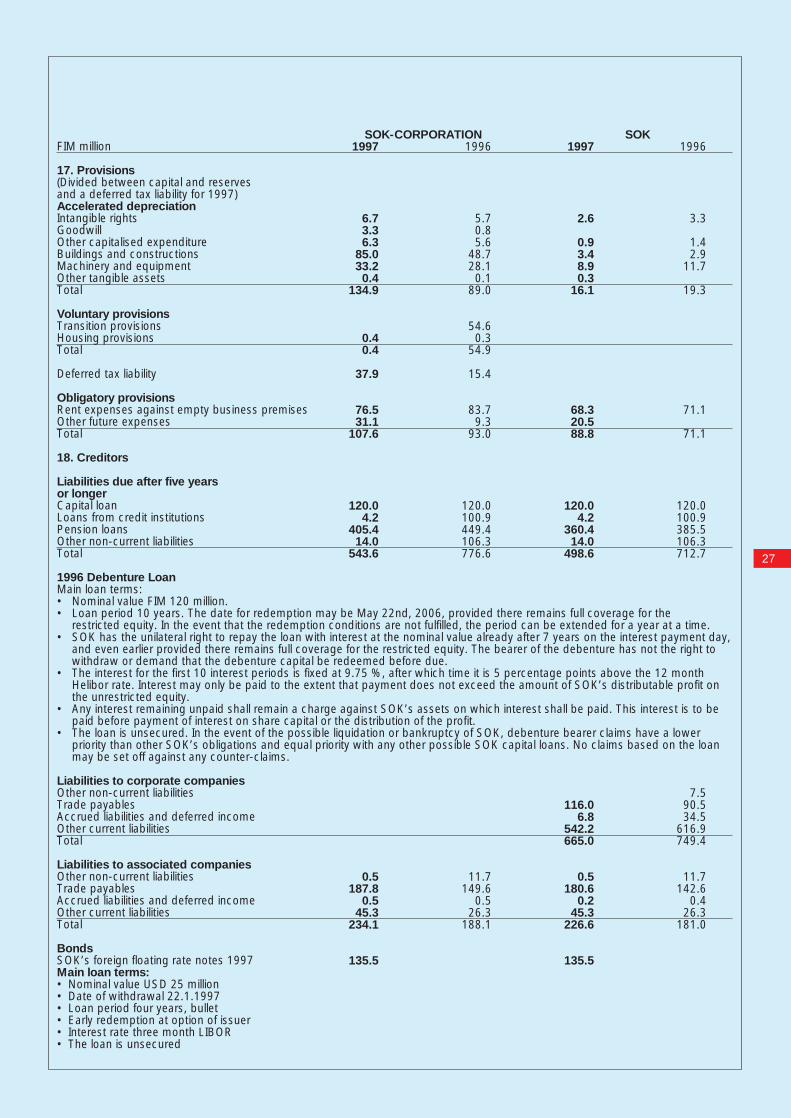
17. Provisions(Divided between capital and reserves and a deferred tax liability for 1997)Accelerated depreciationIntangible rightsGoodwillOther capitalised expenditureBuildings and constructionsMachinery and equipmentOther tangible assetsTotal
Voluntary provisionsTransition provisionsHousing provisionsTotal
Deferred tax liability
Obligatory provisionsRent expenses against empty business premisesOther future expensesTotal
18. Creditors
Liabilities due after five yearsor longerCapital loanLoans from credit institutionsPension loansOther non-current liabilitiesTotal
1996 Debenture LoanMain loan terms:• Nominal value FIM 120 million.• Loan period 10 years. The date for redemption may be May 22nd, 2006, provided there remains full coverage for the
restricted equity. In the event that the redemption conditions are not fulfilled, the period can be extended for a year at a time. • SOK has the unilateral right to repay the loan with interest at the nominal value already after 7 years on the interest payment day,
and even earlier provided there remains full coverage for the restricted equity. The bearer of the debenture has not the right to withdraw or demand that the debenture capital be redeemed before due.
• The interest for the first 10 interest periods is fixed at 9.75 %, after which time it is 5 percentage points above the 12 month Helibor rate. Interest may only be paid to the extent that payment does not exceed the amount of SOK’s distributable profit on the unrestricted equity.
• Any interest remaining unpaid shall remain a charge against SOK’s assets on which interest shall be paid. This interest is to be paid before payment of interest on share capital or the distribution of the profit.
• The loan is unsecured. In the event of the possible liquidation or bankruptcy of SOK, debenture bearer claims have a lower priority than other SOK’s obligations and equal priority with any other possible SOK capital loans. No claims based on the loan may be set off against any counter-claims.
Liabilities to corporate companiesOther non-current liabilitiesTrade payablesAccrued liabilities and deferred incomeOther current liabilitiesTotal
Liabilities to associated companiesOther non-current liabilitiesTrade payablesAccrued liabilities and deferred incomeOther current liabilitiesTotal
BondsSOK’s foreign floating rate notes 1997Main loan terms:• Nominal value USD 25 million• Date of withdrawal 22.1.1997• Loan period four years, bullet• Early redemption at option of issuer• Interest rate three month LIBOR• The loan is unsecured
SOK-CORPORATION SOK1997 1996 1997 1996
6.7 5.7 2.6 3.33.3 0.86.3 5.6 0.9 1.4
85.0 48.7 3.4 2.933.2 28.1 8.9 11.70.4 0.1 0.3
134.9 89.0 16.1 19.3
54.60.4 0.30.4 54.9
37.9 15.4
76.5 83.7 68.3 71.131.1 9.3 20.5
107.6 93.0 88.8 71.1
120.0 120.0 120.0 120.04.2 100.9 4.2 100.9
405.4 449.4 360.4 385.514.0 106.3 14.0 106.3
543.6 776.6 498.6 712.7
7.5116.0 90.5
6.8 34.5542.2 616.9665.0 749.4
0.5 11.7 0.5 11.7187.8 149.6 180.6 142.6
0.5 0.5 0.2 0.445.3 26.3 45.3 26.3
234.1 188.1 226.6 181.0
135.5 135.5

28
FIM million
19. Contingent liabilities
Pledges and contingent liabilities
For own liabilitiesPledgesMortgagesTotal
For corporate companies’ liabilitiesPledgesMortgagesGuaranteesTotal
For associated companies’ liabilitiesPledgesMortgagesGuaranteesTotal* Includes liabilities to corporate companiesfor redemption of mortgage securities
For cooperative societiesPledgesMortgagesGuaranteesTotal
For othersGuaranteesTotal
Other own contingent liabilitiesLeasing liabilitiesRepurchasing liabilitiesInstallment liabilitiesOther liabilitiesTotal
Pension liabilitiesUncovered joint liability on voluntary pension commitments of FIM 28.6 million (1996 FIM 145.8 million).
Liability under derivative contracts
Forward Rate AgreementsInterest options
PurchasedWritten
Interest rate swaps
Currency forwards
Stock forwardsStock options
Written
In examining the overall risk position account should be taken of the position of the hedged balance sheet itemsin addition to the derivatives.
The principles observed in calculating market values:
• The market value of interest rate swaps is estimated on the basis of the present value of future cash flows.• In determining the market value of other derivative contracts the market value on the balance sheet date is used.
SOK-CORPORATION SOK1997 1996 1997 1996
430.8 418.7 327.9 329.3214.9 323.4 28.2 36.0645.7 742.1 356.1 365.3
71.7 71.7 71.7 71.7848.9 1 049.4 13.1
455.4 459.5920.6 1 121.1 527.1 544.3
6.7 1.8 6.7 1.812.0 11.8 5.0 6.865.9 83.8 23.4 28.584.6 97.4 35.1 37.1
3.8 3.8 3.8 3.80.2 0.2
129.4 168.2 25.0 25.0133.2 172.2 28.8 29.0
1.0 16.2 1.0 16.21.0 16.2 1.0 16.2
14.9 19.9 3.0 2.9282.4 222.5 162.5 77.2113.4 82.0
0.2410.7 324.6 165.5 80.1
Value of Marketunderlying asset value
31.12.1997 31.12.1997
1 295.4 0.4
4 909.0 0.61 259.0 -0.1
705.5 4.6
983.2 12.4
30.3 -0.2
11.3 0.2
*
*
*
*

SOK CORPORATION KEY RATIONS 1993-1997
29
1993 1994 1995 1996 1997
Net sales 10 327 11 206 10 325 11 498 12 377
Operating profitFIM million 229 307 316 117 268% of net sales 2.2 2.7 3.1 1.0 2.2
Profit/loss before extraordinary items,voluntary provisions and income taxesFIM million -145 73 91 42 137% of net sales -1.4 0.7 0.9 0.4 1.1
Profit/loss before voluntary provisionsand income taxesFIM million -271 64 89 33 138% of net sales -2.6 0.6 0.9 0.3 1.1
Return on equity, % -2.6 12.9 16.7 3.2 14.3
Return on investment, % 7.7 8.8 10.4 5.5 8.4
Equity ratio, % 1) 17.6 19.6 21.9 23.7 23.9
Gross investment in fixed assetsFIM million 1 111 366 251 423 374% of net sales 10.8 3.3 2.4 3.7 3.0
Gearing, % 208 142 105 112 99
Personnel average for the year 5 323 4 949 4 136 4 211 4 375
CALCULATION OF KEY RATIOS
The average personnel for the year Calculated on the basis of the monthly averages.
Gross investment in fixed assets = Increase in fixed assets + increase in fixed assets due to changes in corporation structure
1) If the capital loan entered under liabilities in the balance sheet is considered as comparable to capital and reserves, the equity ratio for 1997 was 25.8 %.
1993 1994 1995 1996 1997Interest-free liabilities FIM million 1 532 1 570 1 737 1 759 1 953
Return on equity, % =Profit/loss after financial items + depreciation on investments - income taxes
x 100Capital and reserves + minority interest (+ untaxed provisions 1993-1996), average
Return on investment, % = Profit/loss after financial items + interest and other financial expenses + depreciation on investments
x 100Total assets - interest-free liabilities - obligatory provisions, average
Equity ratio % =Capital and reserves + minority interest (+ untaxed provisions 1993-1996) x 100Total assets - advances received
Gearing, % = Interest-bearing liabilities - liquid funds x 100Capital and reserves + minority interest (+ untaxed provisions 1993-1996)

PROPOSAL OF THE EXECUTIVE BOARDCONCERNING THE USE OF SOK’S PROFIT FOR THE YEAR
30
The Executive Board proposes that the profit for the fiscal year of FIM 171 539 900.60 be used as follow:
– be paid interest on additional share capital FIM 277 921.23
– an interest of 8 % be declared on shares fully paid up by cooperative societiesby the beginning of the year FIM 15 588 000.00
– be transferred to the Supervisory Board’s disposal fund FIM 200 000.00
– be left in the profit account FIM 155 473 979.37
If the above proposal is approved by the Annual General Meeting, the shareholders' equity of SOK will be:
Share capital FIM 226 933 800.00Additional share capital FIM 15 000 000.00Reserve fund FIM 65 081 200.00Revaluation fund FIM 41 210 000.00Disposal fund FIM 1 254 275 860.08 Supervisory Board’s Disposal fund FIM 347 161.20Profit account FIM 214 000 543.86Total FIM 1 816 848 565.14
Helsinki, March 19, 1998
Eero Kolamo
Jere Lahti
Veikko Autio Martti Eurola
Jukka Salminen
Leo Laukkanen Kalevi Liukkonen Jorma Niiniaho

31
AUDITORS' REPORT
STATEMENT OF THE SUPERVISORY BOARD
To the members of Suomen Osuuskauppojen
Keskuskunta (SOK)We have examined the financial state-ments, accounting records, annual re-port and administration of SOK for theperiod 1.1. - 31.12.1997. The financialstatements drawn up by the ExecutiveBoard contain the income statements,balance sheets, cash flow statementsand accompanying notes for both theSOK Corporation and the Cooperative.On the basis of our audit we give the fol-lowing opinion on the financial state-ments and administration.Our examinations were made in accor-dance with generally accepted auditing
standards. The bookkeeping as well asthe accounting principles, content andpresentation were examined in sufficientdepth to establish that the financial state-ments contain no mistakes or deficien-cies of importance. In our examinationof the administration, the lawfulness ofthe actions of the members of the Super-visory Board and the Executive Boardwere assessed on the basis of the Coop-erative Societies Act.
In our opinion, the accounts for SOKwhich show a profit of FIM171,539,900.60 and the consolidated accounts which show an unrestrictedequity of FIM 504,695,509.95, havebeen drawn up in accordance with theAccounting Act and other relevant reg-
ulations and ordinances. The financialstatements offer correct and sufficient in-formation concerning the performanceand financial position of the Corporationand the Cooperative as intended by theAccounting Act. We recommend that thefinancial statements be approved andthat the members of the SupervisoryBoard and Executive Board be dis-charged from liability for the year audit-ed by us. The Executive Board's propo-sal concerning the use of the accumu-lated profit and transfers to funds is inaccordance with the Cooperative Soci-eties Act and the rules of the Coopera-tive.
In accordance with § 18, subsection 1,paragraph 2, of the rules of SOK, the Su-pervisory Board has today examined thereport of the Executive Board for 1997,together with the related financial state-ments and proposal for using the profit,as well as the Auditors’ Report. In sub-mitting the report of the Executive Boardand the Auditors’ Report to the Annual
General Meeting, the Supervisory Boardrecommends that the financial state-ments be adopted and that the propos-al concerning the result for the year andshareholders’ equity be endorsed.
The following members of the Super-visory Board are retiring upon comple-tion of their terms of office: Eino Laak-
sonen, Eino Tenhunen, Simo Kutinlahti,Kalle Lähdesmäki, Matti Vanto, TuomoSaloniemi, Jouko Vehmas and HåkanSmeds. The Annual General Meetingshall elect members to replace them forthe following term of three years.
Helsinki, March 25, 1998
Jorma JäskeCPA
Juhani HeiskanenCPA
Tapani Rotola-PukkilaCPA
Helsinki, March 30, 1998
SUOMEN OSUUSKAUPPOJENKESKUSKUNTA
On behalf of the Supervisory BoardKari NeilimoChairman
Osmo MaunukselaSecretary

FIELD DIVISION
32
The Field Division consisted of threebranches: supermarkets and servicestations, hotels and restaurants, and theagricultural and automobile trade. In ad-dition the Division included Marketingand Customer-Owner Services. The Division was led by Eero Kolamo.The value of sales in the national grocerytrade is estimated to have grown bysome 2.5 %. That for the S Group grewconsiderably faster, by 10.9 %, whichmeant an expansion of its share of themarket for the seventh year running. TheGroup’s share of the grocery market in-creased from 23.3 to about 25 %.The hotel and restaurant business ex-panded faster than the retail trade. Li-censed restaurant sales rose by about7 % and hotel sales by some 11 %. Theoccupancy rate increased by 2.5 per-centage points to a good 48 %. S Grouplicensed restaurant sales expanded byover 7 % and hotel sales by 16 %. TheGroup hotel occupancy rate of 58.5 %was almost 6 percentage points higherthan the year before. The Group thusmanaged to increase its market share inthe licensed restaurant and hotel busi-nesses.There was a modest improvement in theagricultural business. Increased saleswere recorded in the machine businessand the seed and grain trade, but ferti-lizer sales slumped. The Group main-tained its leading position in the agricul-tural business.The number of service stations in Fin-land remained unchanged. Unmannedstations increased slightly and therewere a good 500 of them at the end ofthe year. Likewise the number of foodstores attached to service stations grewto 180 at year end. Petrol consumptionwas up by 2.5 % over the previous year.The S Group again managed to improveits market position in the fuel trade.The automobile business continued tobe one of the fastest growing sectorswithin the Finnish retail trade. Some104 500 new cars were sold. Peugeot
managed to lightly improve its marketshare.
Hankkija Agriculture LtdHankkija Agriculture Ltd’s turnoveramounted to FIM 3 155 million, up 6.9%. The company operated in a favour-able environment as there was a slightimprovement in the agricultural markets.Pent-up demand from the slump in theearly 1990s erupted during the year in aflood of plants and machinery invest-ments. Fiercer competition, however,meant lower margins. The toughestfields were in the fertilizer and feedtrades.With the contraction of the fertilizer mar-ket, the company’s delivery volumes fellby 6 % yet it managed to expand its mar-ket share despite tougher competition.Brisk sales in the latter months of theyear enabled budgeted sales of pesti-cides to be overtaken. After years of de-pressed sales, the seed trade took offonce the seasonal pricing system hadbeen upgraded and the advantages ofusing certified sowing seeds appreciat-ed. The company invested in a new sack-packing line and seed dressing machin-ery at its seed centre. The feed trade didnot come up to expectations. The autumn grain buying campaign wassuccessful and record quantities werepurchased during the short harvestingseason. The grain trade expanded by 13%.As in the previous year, the fastest grow-ing area in the agricultural machine tradewas farm implements. The sales budgetwas easily overtaken and there was evena 19 % growth quantities sold. Thechain’s share of the machine marketstrengthened. Tractor and harvestersales were up by 18 %. In respect tocombine harvesters, the Agrimarketchain dominates the market with a 66 %share. Tractor sales increased by 900 toa total of 5 888 for the year. The marketshare for the chain’s own Massey Fer-
guson and John Deere tractors was 17.5 %.Garden trade sales grew by 11 %. Farmbuildings were the main area of focus inthe hardware trade. Jonsered chainsaws and garden machines were takeninto the range at the end of the year. The15 % increase in hardware sales volumeswas higher than the national average.With the help of major on-going devel-opment projects it is hoped to improvecost-effectivity and customer service inthe agricultural business. A quality pro-gramme will be introduced in the graintrade in time for the 1998 harvesting sea-son. Work has also begun on drawingup an environmental programme for theAgrimarket chain. The bonus system has now been in op-eration for two years and applies to storepurchases by S Privilege Card holders.Bonus purchases increased by 35 %during the year. In addition, an Agribonusof 0.5 % on purchases of capital goodsand machines amounting to at least FIM30 000 a year. The Agribonus is part ofthe Agrimarket chain’s regular customerscheme aimed at producing added val-ue to loyal customers.
During the year, 17 outlets were refur-bished and nine others relocated. At yearend there were 24 Agrimarkets and 88Agrimarket stores in the chain’s network.In addition, the chain included 7 Agri-markets and 27 stores belonging to theregional societies.
Three cooperative societies relinquishedtheir hardware stores and these werejoined to the chain. As from the begin-ning of the year, the company’s grainbuying organisation was transferred tothe Agrimarket chain. Responsibility fordrawing up contracts, purchasing andstorage was likewise transferred to theAgrimarkets and stores. At the end ofthe year, an agreement was signed totransfer the agricultural operations of theLammi cooperative society to the com-pany as from January 1st 1998.
Eero Kolamo

At the end of the year the company had704 employees, an increase of 22 large-ly as the result of mergers.
1997 FIM million ChangeNet sales 3 155 +204Operating profit before depreciation 90.1 -4.1Operating profit 70.3 +4.4Profit after financial items 71.6 +9.6
Oy Sokoteria AbOy Sokoteria Ab is SOK’s subsidiary inthe hotel and restaurant business, with13 hotels throughout Finland. It accountsfor about one third of total Sokos Hotelssales and rooms.In addition, the company leased the op-eration of the Sokos Hotel Seurahuone,Lahti, from Lahden Uusi Seurahuone Oyfrom May 1st onwards. Lahden UusiSeurahuone Oy will be merged into OySokoteria Ab during the early part of1998. Work continued on refurbishing theSokos Hotel Ilves, Tampere, begun in1996 and is expected to be completedduring 1998. A similar project for the tow-er wing of the Sokos Hotel Royal Waasa,Vaasa, was begun and should be readyby early 1998. The dining restaurant ofthe Sokos Hotel Vaakuna, Pori, was ren-ovated in November. The renovation ofSokos Hotel Tammer, Tampere, wascompleted in the same month.Efforts to improve sales and quality, andguarantee cost effectivity were contin-ued. Important areas of emphasis wereenhancing customer satisfaction andfine-tuning business concepts. Stafftraining was another key area of devel-opment.The company had 694 employees on itspayroll.
1997 FIM million ChangeNet sales 419 +39Operating profit before depreciation 60.1 +12.0Operating profit 45.2 +18.3Profit after financial items 47.0 +17.7
Helsinki Hotels OyHelsinki Hotels Oy is in the hotel andrestaurant business in the GreaterHelsinki area. It now has only 6 hotelssince the sale of the Sokos Hotel Hes-peria’s operations to Royal Hotels Oy onOctober 1st.
In accordance with a contract signed onJanuary 2nd 1998, SOK has purchasedHOK’s ten per cent holding in the com-pany, after which it will be a 100 % ownedSOK subsidiary.Work on the extension and new restau-rants for the Sokos Hotel Helsinki con-tinued in the early months of the year.The room refurbishing was completed inJune and the new restaurants openedin November. Improvements were madeto the night club during the last quarterof the year. The 1st floor restaurants andmeeting rooms on the Sokos Hotel Hes-peria were refurbished during the sum-mer months. After repairs, the Sokos Ho-tel Vaakuna’s Memphis restaurant wasreopened in May and the Memphis Cof-fee House in October. A Memphisrestaurant is also being planned for theSokos Hotel Klaus Kurki and the deci-sion will be taken in spring 1998. The of-fices in the Sokos Hotel Tapiola Gardenwere converted into guest rooms.Efforts to improve sales and quality, andguarantee cost effectivity were contin-ued. Important areas of emphasis wereenhancing customer satisfaction andfine-tuning business concepts. Stafftraining was another key area of devel-opment.The company had 317 employees on itspayroll.
1997 FIM million ChangeNet sales 308 +37Operating profit before depreciation 58.9 +31.0Operating profit 35.5 +26.1Profit after financial items 33.3 * +24.9
* Includes FIM 15.4 million income on inter-corporate goodwill.
Royal Hotels OyRoyal Hotels Oy is a 100 % owned SOKsubsidiary in the hotel and restaurantbusiness. It has two hotels in Helsinki op-erating under the Radisson SAS trade-mark. Two more hotels are on the way:one in Vaasa at the end of 1998 and theother in Helsinki in summer 1999. By theend of 2001 the company will have 7-8hotels.SOK and Radisson SAS Hotels World-wide signed an agreement on August31st according to which SOK has soleright to operate under the Radisson SAStrademark in Finland for 15 years. At thebeginning, the Radisson SAS chain willoperate under a management agree-ment, but later on the basis of a SOKfranchise agreement. Under the agree-
ment, Royal Hotels purchased the op-erations of the Radisson SAS Royal ho-tel from Kamppi Hotel Oy on August 31stand Hotel Hesperia from Helsinki HotelsOy on October 1st.As the company was only operating forfour months during the year, its net salescame to only FIM 48.6 million. At yearend there were 275 employees on thepayroll.
Others hotel companiesHämeenmaan Hotellit Oy is a SOK sub-sidiary operating four hotels in the Hämearea. The operations of the Sokos HotelAscot were relinquished in September.On January 1st 1998 the company soldthe operations of the Sokos HotelVaakuna, Hämeenlinna, to Oy SokoteriaAb and the restaurant operations of theRiihimäki Seurahuone to the Lahti co-operative society. The company’s netsales totalled FIM 38.6 million and it em-ployed a staff of 59.Hotel City Vantaa Oy is an SOK sub-sidiary responsible for operating an ho-tel in Tikkurila, Vantaa. The company’snet sales came to FIM 50.5 million, up27.6 %, and had 48 employees on itspayroll.Lahden Uusi Seurahuone Oy is a sub-sidiary of Oy Sokoteria Ab and owns anhotel in Lahti. The company’s operationsand related assets and premises wereleased on May 1st to the parent com-pany. Since then the company has onlyhad business and leasing operations,and is at present going into voluntary liq-uidation. This should be completed ear-ly in 1998 at which time the operations,assets and residual liabilities will be hand-ed over to Oy Sokoteria Ab. The com-pany’s net sales totalled FIM 7.8 millionbefore going into liquidation. The staff of64 at April 30th transferred to Oy Soko-teria Ab when the operations wereleased. Since then the company has hadno employees of its own.
Oy Maan Auto AbThe company is an SOK subsidiary, im-porting and marketing Peugeot cars,spare parts and accessories through anetwork of dealers in Finland and Esto-nia. At the end of the year there were 37dealerships, of which 7 were owned byAutomaa Oy, 17 by the regional soci-eties and 13 privately.
Peugeot car sales grew by 9.7 % to5 613 and their share of the market from5.3 to 5.4 %. The Peugeot 306 FamilyWagon appeared in Finland in the au-tumn, thus extending Peugeot’s rangein the all-important family car market.
33

34
The number of customer-owner families in the S Group has reached 600 000 already. During the year they received FIM 258 million in bonus payments
from the cooperative societies and SOK.
35
Peugeot’s range of vans was widenedin the spring with the light deliveries Peu-geot Partner. Van sales doubled to 317and Peugeot’s share of the market from1.8 to 2.7 %.Exports of new Peugeot cars expandedstrongly, especially to Estonia. The num-ber sold increased from 347 in 1996 to657.The company concentrated on trainingdealers to exploit the market potential ofnew models thus improving their mar-keting effort.Net sales increased by 13.7 % to FIM724 million. Higher sales, reduced fi-nancing costs and a strong markka allcontributed to improving the company’soverall performance. Personnel at yearend totalled 52.
1997 FIM million ChangeNet sales 724 +87Operating profit before depreciation 24.1 +1.8Operating profit 21.8 +2.6Profit after financial items 24.3 +6.6
Automaa OyThe company is a SOK subsidiary re-tailing Peugeot cars in Helsinki, Espoo,Vantaa, Tampere, Jyväskylä andHämeenlinna, and from January 1st1998 also in Turku. The company alsorepresents Nissan in Hämeenlinna.The company relinquished its Forssaoutlet on January 1st and purchased Tu-run Valtavaunu Oy on December 31st.The customer-owner bonus system op-erates in all outlets.Sales of new Peugeot cars were as fol-lows: Helsinki 694, Espoo 508, Vantaa312, Jyväskylä 330, Tampere 346 andHämeenlinna 125, a total of 2 315. In ad-dition, 161 Nissan cars were sold inHämeenlinna.Peugeot’s share of the market in thecompany’s area of operation increasedfrom 5.2 to 5.3 %. The number of em-ployees at year was 231.
1997 FIM million ChangeNet sales 453 +36 Operating lossbefore depreciation -0.4 +3.8Operating loss -2.8 +3.4Profit after financial items -3.4 +4.1
Hämeenmaan Automarket OyHämeenmaan Automarket Oy, estab-lished by SOK and the Lahti cooperativesociety, is responsible for the super-market business in the society’s area. Itis a 90 % SOK owned subsidiary, theoperative management of which is in thehands of the local society.Responsibility for running the S Marketsin the Lahti and Hämeenlinna Sokos de-partment stores was transferred to thecompany on January 1st. During the yearnew a S Market was opened in Riihimä-ki and a Prisma hypermarket in Laune,Lahti. It addition the company also hasa Prisma store in Hämeenlinna.The company’s net sales totalled FIM253 million and it employed a staff at yearend of 230.
Market Chain ManagementThe unit is responsible for developingand guiding the S Market, Prisma andSale outlets and the whole S Group’sgrocery trade.Combined Group supermarket saleswere FIM 15 380 million, a growth of 11.8%. The grocery trade expanded by 10.9% to FIM 13 512 million. The Group’smarket share again increased and is es-timated to be 25 %. All chains performedwell during the year. With 264 outlets, an increase of ten, theS Market remains the largest grocerychain within the Group. Sales amount-ed to FIM 7 699 million, up 14.1 %, withthose in its main lines growing by 15 %.Prisma hypermarkets continued theirstrong growth. Sales totalled FIM 5 598million, up 12.9 %. Grocery sales in-creased by 12.6 % and consumer goodsby 12.7 %. During the year two new out-lets were opened bringing the total up to32.
The number of outlets in the Sale chaingrew by three to 165. Sales increasedby 7.6 % to FIM 1 072 million. Respon-sibility for operating the Alepa chain inthe Greater Helsinki area rests with thelocal society HOK. Sales amounted toFIM 715 million.Work continued on developing the net-work of chain outlets. New Prismas wereopened in Lahti and Turku. Major new SMarkets were opened in Konala inHelsinki, Olari in Espoo, the Zeppelinshopping mall in Kempele, Herukka inOulu, Sarankulma in Tampere, and Ri-ihimäki.The supermarkets developed well, mar-ket positions and performance improvedand customers were satisfied. During theyear, business ideas for Prismas and SMarkets were revised, documented anddistributed to the field. The consumergoods support system for the chainsprovided the basis for developing a newrange strategy. A new strategy wasdrawn up for data control in the sector.
Sokotel OySokotel Oy is the marketing and devel-opment company for the S Group’s ho-tel and restaurant business. Its task is tocreate new business ideas, form chainsand guide their operations. The compa-ny is also responsible for chain market-ing and sales guidance, as well as de-veloping logistics and information sys-tems for the whole sector.Combined S Group hotel and restaurantsales were FIM 2.2 billion, an increase of8.9 %. The sector significantly improvedits performance. The Group had a totalof 263 hotels and restaurants.
The Sokos Hotels chain consisted of 41hotels. With its reputation for reliabilityand familiar presence in all major towns,the chain is guaranteed its market lead-ership in Finland. Chain sales were FIM1.2 billion, a growth of 11.5 %. The oc-cupancy rate was 58.5 %, which wasclearly higher than the national average.
In the autumn, SOK entered into anagreement with the international hotelchain Radisson SAS. By the end of theyear there were two hotels in the Radis-son SAS chain, the Radisson SAS Roy-
al Hotel Helsinki and the Radisson SASHesperia Hotel Helsinki.There are 104 restaurants in the SGroup’s chains. The largest chain isRosso, which operates 43 cosy familyrestaurants throughout the country. Other national chains include Frans-manni, which operates within Sokos hotels, and Amarillo, Sevilla and Mem-phis. During the year 9 new chain restau-rants were opened. Total restaurantsales were FIM 620 million, up 8.3 %.Profitability remained good.Sokotel Oy’s net sales totalled FIM 26.7million and it employed a staff of 34 atyear end.
Ässähuoltamot OyÄssähuoltamot Oy is the developmentcompany for the S Group’s service sta-tion operations. Its main task is to offersupport and guidance to regional coop-erative societies operating in this field.The number of cooperative-run petrolstations at the end of the year was 212,a net increase of 4. Of these 107 werefull-service outlets with shops attachedand 105 unmanned stations. Oy ShellAb is the main oil-company partner, witha share of 62 %. Total sales came to FIM2 138 million, up 11.8 %.
During the year the company concen-trated on developing and implementingnew business concepts, the extensionof the systems base to all units, site ac-quisition, and assisting in the planningand building of full-service and un-manned stations. The societies opened8 new full-service outlets. These wereShell stations in Tammisilta in Paimio,Hannikaisenkatu in Jyväskylä, Nastola,Marjahaka in Iisalmi, Valtionkatu inSeinäjoki and Sodankylä, and Esso sta-tions in Masuuni in Karkkila and Nikkilä.In addition, there were significant exten-sions to full-service outlets, many newunmanned stations opened, and exist-ing stations refurbished in accordancewith chain concepts.
The S Group’s petrol business devel-oped favourably and its market share in-creased to over 10 %. This was mainlydue to the expansion of the network, butalso because customer-owners have in-creasingly concentrated their purchasesin S Group service stations.Ässähuoltamot Oy’s turnover from chainand opening charges on service stationswas FIM 3.8 million and it employed astaff of five.
Marketing and Customer-Owner Services
Marketing Services is the internal adver-tising agency for the S Group. It designsand realises advertising for the Group,its chains and subsidiaries, and the re-gional societies, making full use of thelatest developments in information tech-nology and networks.The unit’s output increased over the pre-vious year. Its main clients were the Pris-ma and Sokos chains for whom it pro-duced catalogues, brochures and pressadverts. It helped Customer-Owner Ser-vices in their work and collaborated withthem in the ”Your Benefits in Finland”campaign. The unit also promoted thelaunching of new chain outlets in col-laboration with the regional societies.Customer-Owner Services producesand develops the customer-owner sys-tem and promotes customer relationswhich are the S Group’s prime weaponsin competition.A new customer-owner programme wascompleted in April, which laid down thelines and objectives for future develop-ments.Between January and June, the region-al societies took into use the new datasystems for membership and savingsfund administration. Despite the tightschedule and wide coverage - all regionalsocieties, members and savings ac-counts were included - the systemsproved highly successful. These enablecustomer-owners to be served through-out the country within a single systemand also the development of multi-me-dia interactive communications.
New characteristics were added to bal-ance control instruments were devel-oped during the year to facilitate use ofthe S Privilege Card. Customers maynow check their S Account and S Cred-it balances, credit limits and bonus pay-ments on a statement terminal in theshops. Automat technology was im-proved and can now by accessed byphone. Statements can now also be ob-tained on GSM phones and as from thebeginning of April 1998 on a home pcvia the Internet.Important partnerships were begun withthe Hassen Matkat Oy travel agency andSilmäasemat Marketing Oy opticians.The aim is to increase interest in the cus-tomer-owner concept by extending therange of services and benefits to traveland optics. Nation-wide agreementswere signed in June and by the end of
the year they embraced 19 regional so-cieties.The number of members in the regionalsocieties at year end was 589 591, ofwhom almost 550 000 were customer-owners within the bonus system, an in-crease of 72 903. S Privilege Card bonuspurchases amounted to FIM 11.3 billion,a growth of 22 %, of which FIM 258 mil-lion was returned in bonuses. The num-ber of S Privilege Cards in use was about1.4 million, of which about 250 000 hadcredit facilities.Customer-owners received a monthlypersonalised letter from the manage-ment of their regional society, enclosingtheir bonus and S Account statements,and the Yhteishyvä magazine. It also in-cluded information about products andservices offered by the S Group.
36
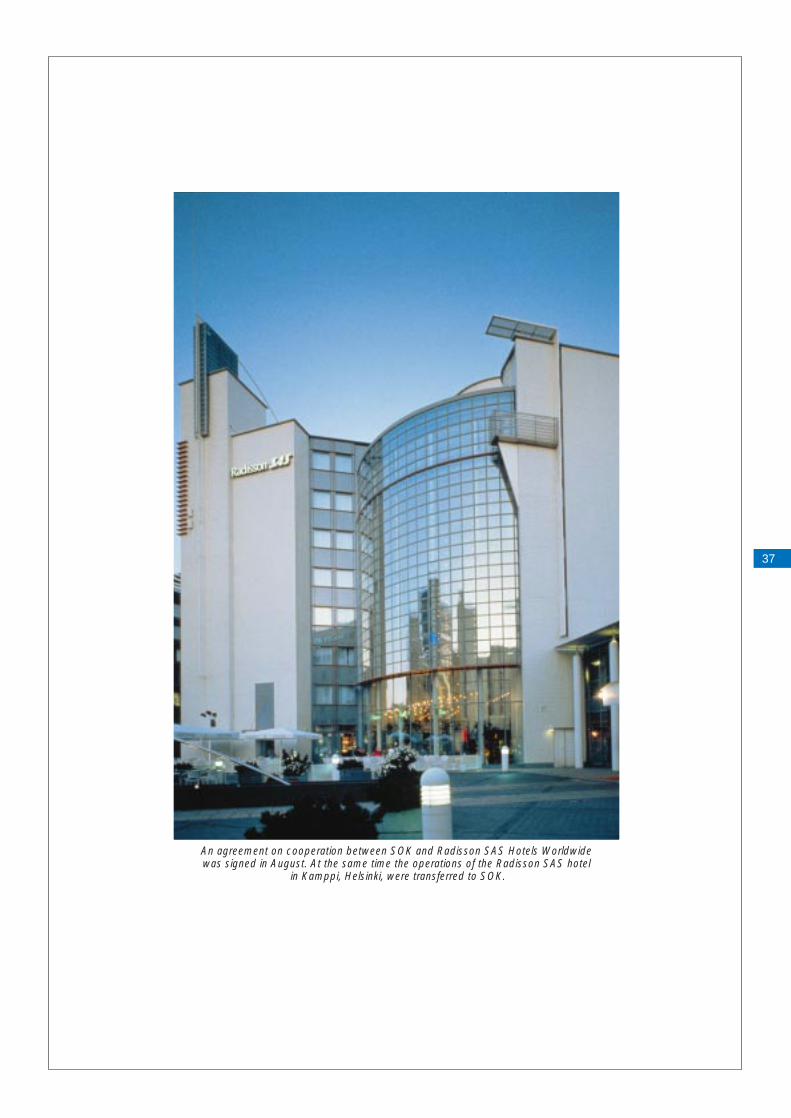
37
An agreement on cooperation between SOK and Radisson SAS Hotels Worldwide was signed in August. At the same time the operations of the Radisson SAS hotel
in Kamppi, Helsinki, were transferred to SOK.

The Specialty Stores Division consistedof the SOK subsidiaries Oy Sokos Ab,Intrade Partners Oy and Kuusinen Oy. Itwas led by Olavi Kuusela.It is estimated that the consumer goodstrade expanded by less than 4 % duringthe year, whereas the specialty storestrade is reckoned to have grown by agood 5 %. Sales of domestic appliances,sports and leisure goods were particu-larly brisk. After taking the structuralchanges into consideration, the Sokoschain performed well with comparablesales increasing by 6.6 %. The nationaldepartment store and hypermarket tradegrowing by 5.9 %.
Oy Sokos AbThis was Oy Sokos Ab’s first full year ofoperation. The changes carried out tothe network involved converting the de-partment stores in Hämeenlinna,Lappeenranta, Kouvola, Oulu andSeinäjoki into Sokos Fashion stores. Atyear-end the company had 9 Sokos de-partment stores and 8 Sokos Fashionstores, plus the Ruljanssi remaindersstore in Helsinki’s East Centre shoppingmall. In addition the chain had 6 Sokosstores in the ownership of regional soci-eties and the Sokos department store inTallinn, Estonia, owned jointly by SOKand the German Kaufhof Warenhaus AG.The Vaasa department store was closedat the beginning of the year and later thedecision was taken to close the Ruljanssistore in February 1998.Although the company’s net sales fell toFIM 1 212 million, largely as the result ofthe above mentioned changes, due tostrict cost control its performance im-proved by over FIM 70 million. Investments during the year concentrat-ed on developing the operations of sev-eral department and fashion stores. Ma-jor refurbishings were carried out in theTampere and Lahti department storesand the Oulu and Seinäjoki Sokos Fash-ion stores. The tunnel under the roadconnecting Sokos to the Forum shop-
ping mall in Helsinki was completed atthe end of the year and considerablyhelped customer traffic. In autumn thedecision to refurbish and expand theTapiola department store was taken andwork will begin in spring 1998 and is ex-pected to be completed in time for theChristmas market.The most important areas of develop-ment in the chain’s operations are cus-tomer service and a clear-cut productconcept. Work continued on upgradingthe Sokos Fashion concept by produc-ing a new operations model and defin-ing its core areas. The operation of theregional societies’ Sokos stores is large-ly based on the range concept used inthe fashion stores.During the year a marketing calendarwas planned with the aim of reconcilingcustomer needs and life-patterns withSokos ranges. Improved store milieusand displays helped promote customer-friendly services. As part of Sokos’ ”BestService” concept campaign, a dressingservice was launched and dress expertstrained in each outlet. In Helsinki, anagreement on joint marketing wassigned with the Chiasma Museum ofContemporary Art to be opened in spring1998.Sourcing operations were improved bythe transfer of these functions to IntradePartners Oy on November 1st. In the fieldof logistics, control over goods flow wasconsiderably improved through the au-tomatic transfer of deliveries to unit dis-plays. Data systems were upgraded toimprove goods management and oper-ations. The installation of new point-of-sale systems in the department storeswas carried during the year and will con-tinue in the other outlets in spring 1998.The number of employees at year-endwas 1 276, a decrease of 417 due tochanges in the network.
1997 FIM million Change Net sales 1 212 -149Operating loss before depreciation -18.5 +65.2Operating loss -52.0 +54.7Loss after financial items -54.6 +71.4
Intrade Partners OyIntrade Partners Oy is responsible forsourcing home, clothing and leisuregoods for the S Group’s chains. Itslargest clients were the Prisma and SMarket chains and from the end of theyear also the Sokos department storesand Sokos Fashion stores. Among itsother clients were the Sale, Alepa andAgrimarket chains, and the service-station stores. The company also sup-plied shop furnishings to S Group out-lets, and textiles and restaurant equip-ment also to outside customers. The decision was taken in the spring tomerge the consumer goods sourcingfunctions of Oy Sokos Ab. As a result,55 employees transferred to IntradePartners with effect from April 1st. Re-sponsibility for sourcing operations wastransferred to Intrade Partners on Octo-ber 1st. Initially this covered the sourc-ing of home, clothing and leisure goods;that for cosmetics will be transferred dur-ing spring 1998. The aim is to effect asaving in costs through larger purchasevolumes, as well as improve purchasingexpertise.In the spring, the company and Oy SokosAb signed an agreement to work to-gether with Gemex Trading Limited ofHong Kong, with the aim of developingsourcing operations in the Far East anddiscovering new suppliers. The agree-ment will come into force at the begin-ning of 1998. Already at the beginningof 1997 the company began collaborat-ing with Gemex Trading AG in sourcingoperations in Europe.At the end of the year it was decided toreorganise a number of operations with-
SPECIALTY STORES DIVISION
38
Olavi Kuusela

in the S Group. Several core productgroups in the grocery trade will be trans-ferred to Inex Partners Oy at the begin-ning of 1998. Offer sales will transfer toSOK’s new subsidiary Rainex Yritys-palvelu Oy at the same time. It was fur-ther decided that the hardware sourcingoperations of Rainex Partners Oy, pur-chased by SOK, will be transferred to In-trade Partners Oy in autumn 1998.Increases in the sale of consumer goodsin the S Group’s chains and the open-ing of two new Prisma hypermarketswere the main reasons for the growth indelivery volumes by the company. Therewas a particularly powerful increase interminal deliveries. Intrade Partners Oyhad a staff of 170 at the end of the year.
1997 FIM million ChangeNet sales 1 098 +166Operating profitbefore depreciation 8.1 +0.6Operating profit 5.1 +0.4Profit after financial items 7.5 -0.1
Kuusinen OyKuusinen’s three stores in central Helsin-ki sell international brand fashions andfootwear for ladies and men. The com-pany’s net sales were FIM 48.5 million,an increase of 9.5 %, and it showed aprofit for the year. Personnel at year-endtotalled 47.
39

The Administrative Division was respon-sible for the accounting, financing, realestate, logistics and information sys-tems, legal affairs and administrative ser-vices of the SOK Corporation. It was ledby Jukka Salminen.
AccountingIn addition to the financial control of theSOK Corporation, the unit was also re-sponsible for drawing up common prin-ciples and guidelines on financial controlwithin the S Group in such fields as in-ternal accounting, bookkeeping, closingthe books and taxation, as well as pro-viding other services.Work on changing the forms of accountsand differentiating between internal andexternal reporting required by account-ing legislation with a view to their intro-duction at the beginning of 1998. SOKtook into use an electronic documentmanagement system for production ac-counting, which will replace filing paperas well as material coming from outsideand report data produced by the sys-tem. Similarly, the system will replace themicrofilm archives of the invoicing sys-tem for direct deliveries to chain units.The extension of the electronic docu-ment management system to other dataand in other parts of the S Group is un-der way.The project for improved interface re-porting on daily sales, margins and var-ious other criteria to group and unit man-agement was brought into use.Scheduled deliveries were made to tenregional societies of the new accountingsystem and followed up with training andadvice. Further deliveries will be made in1998 by which time all regional societieswill be operating the new system. Net-work operability and securing audit-trailhave required most attention.
FinanceThe function of this unit is to arrange fi-nancing for the SOK Corporation. Fol-lowing developments on the money mar-ket, its corporate bank acts on behalf ofboth the cooperative societies and Cor-poration units.Diversification of the Corporation’s fi-nancing continued in respect to sourcesand instruments.Following amendments to the rules in thespring, SOK adopted the additionalshare payment system. Additional sharepayments are a form of equity financingby the cooperative societies.Interest risks on the Corporation’s float-ing-rate loans were fully protected by in-terest options and hedging operationswere carried out to secure loans in for-eign currencies. Derivatives were usedalmost exclusively to hedge against fi-nancial risks. SOK-Takaus Oy issued guarantees tothe societies and SOK’s subsidiaries. Atyear-end these stood at FIM 390 million,a reduction of FIM 124 million due to thediminishing need by societies for suchguarantees. Counter-sureties and ownfunds amounted to FIM 509 million.
Real Estate ManagementThe unit is responsible for the Corpora-tion’s real estate, as well as property de-velopment and management.Property investments amounted to FIM129 million. The Sarankulma S Market inTampere was opened in May. Work onrefurbishing the rooms in the Sokos Ho-tel Ilves in Tampere continued and is ex-pected to be completed by early 1998.In Helsinki, the tunnel under Manner-heimintie street connecting the Sokosdepartment store to the Forum shoppingmall was ready in October. The totalstock of the company owning the Hakki-la logistics centre was purchased in De-cember. A major development project
was initiated for the Kilo logistics centre,which will be mainly carried out in 1998.Work was begun on planning the con-version of SOK’s former head office incentral Helsinki into the Radisson SASPlaza Hotel and it is estimated that thehotel will be completed by spring 1999.Real estate to the value of FIM 122 mil-lion was sold during the year. The PoriSokos property was sold to Merita Kiin-teistöt Oy under a sale and leasebackagreement and a long-term lease signed.The Shares in the Vantaanportti businesscentre and restaurant property inHyvinkää were sold to the HOK Group.The remaining part of the Prisma prop-erty in Kajaani were sold to the local so-ciety. The amount of unoccupied premiseswas 29 630 m2, which was 9 000 m2 lessthan the previous year. The greater part,65 %, consisted of warehouse, officeand factory premises resulting from restructuring.The unit’s income from rents was FIM493.5 million, of which FIM 140.5 millioncame from outside tenants. The profit af-ter extraordinary items, voluntary provi-sions and incomes taxes was FIM 5.1million up on the previous year. The user services unit carried out eval-uations of the condition of numerousproperties. Substantial savings accruedto the S Group when competitive ten-dering was introduced for electricity sup-ply and property maintenance. Duringthe year, work continued on formulatingand implementing the environmentalprogramme for real estate management.The unit’s most important tenant is theSokos department store chain.
Logistics and Information Systems
The information systems unit was trans-ferred from Corporate Development andPlanning to the Administrative Divisionon November 1st. The unit’s field of re-
ADMINISTRATIVE DIVISION
40
Jukka Salminen

CORPORATE DEVELOPMENT AND PLANNING
41
The unit included Field Consulting,Strategic Planning, the Cooperative De-partment and development projects inthe Baltic and St. Petersburg areas. Itwas led by Risto Mäkeläinen.
Field ConsultingThe main task of the unit focussed onguiding regional societies in implement-ing the S Group’s strategy, developingbusiness structures, preparing invest-ments in collaboration with regional so-ciety managements and supervising so-ciety finances. The performance and financial positionof the societies were determined in ac-cordance with the accounting guide-lines. The unit helped the societies drawup their annual budgets by providingbusiness environment analyses andbudget guidelines.Other areas of work involved participa-tion in the preparation of S Group oper-ation and structure strategy, as well asrevising the agreement on strategic co-operation between the regional societiesand SOK. The redivision of operations inGreater Helsinki between the local so-ciety HOK and the SOK Corporation wasfinalised. The unit also helped plan theTenco Group’s department store pro-ject for the Baltic states, as well as thereorganisation of service-station opera-tions in South Finland.The unit assisted implementing the de-velopment programme for the Lahti so-ciety. The society’s operations have de-veloped favourably and surpassedplanned objectives. SOK’s subsidiaryHämeenmaan Automarket Oy is re-sponsible for the operations of new su-permarket outlets in the society’s area.At the beginning of the year it purchasedthe S Markets in the Lahti and Hämeen-linna department stores and opened anew S Market in Riihimäki and a Prismahypermarket in Lahti.Field Consulting took part in supervisingsociety savings funds operating within
guarantee circle contracts. Responsibil-ity for the savings funds operations of asociety rests with its executive board andthe actual operations are supervised bya special inspector. The society is liableto its member investors for their invest-ments. Responsibility for repaying in-vestments rests in the first instance withthe society to the extent of its total as-sets, but in addition the society has twoseparate guarantee circle contracts; thefirst formed by 22 regional cooperativesocieties and the second by the 13 lo-cal societies operating savings funds.Member investments in the societies’savings funds increased by FIM 186 million to a year end total of FIM 1 589million.
Strategic PlanningStrategic Planning’s main preoccupa-tions were the updating of competitivestrategies and the environmental pro-grammes, and writing a scenario for theS Group.A major step forward In the supply ofconsumer goods to department storesand supermarket chain units was takenin the autumn when sourcing operationswere combinedIndividual environmental programmesfor the chains were drawn up and up-dated. SOK cooperated actively in bothnational and international developmentsin this field.The Quelle mail order experiment wasconcluded in the autumn and the deci-sion taken to extend collaboration withQuelle Schickedanz AG to the whole ofthe country as from the beginning of1998.Within the in-house Intranet system,Strategic Planning is responsible for theproduction of news about the S Groupand its environmental policies.
sponsibility was extended to include thecoordination of distance trading andbusiness and the development of logis-tics. At the same time the unit’s namewas changed to Logistics and Informa-tion Systems.Work continued on developing informa-tion systems in accordance with the SGroup’s data systems strategy. Themain emphasis continued to be on sup-port systems for the chains and cus-tomer-owner services. Considerableprogress was made with networking be-tween the S Group and suppliers. Partof this concerned extending E mail cov-erage within the Group and the publi-cation of information through the Inter-net. Investigations into electronic shop-ping were stepped up and the first pilotscheme introduced.
Other unitsThe other units within the AdministrativeDivision were Legal Affairs and Admin-istrative Services.The legal affairs unit manages all legalmatters for the SOK Corporation. Workfocussed on drawing up contracts andagreements relating to business andother operations. The rules of SOK wererevised on two occasions when addi-tional share payments were taken intouse and the administrative structure ofthe Corporation modernised. A workinggroup under the leadership of the Min-istry of Justice initiated a major overhaulof the Cooperatives Societies Act.The administrative services unit is re-sponsible for providing centralised ser-vices in the Ässäkeskus office and co-ordinating similar services throughoutthe whole S Group.
Risto Mäkeläinen

Baltic area projectsThese projects include S Group, asso-ciated company and partner operationswithin the Baltic states and Russia, aswell as certain international cooperationand development schemes.During the year cooperation within theBaltic states was extended in accor-dance with present strategy in order tosecure conditions for future business op-erations.
The EMU ProjectThe third stage of economic and mone-tary union (EMU) is planned to take placeon 1.1.1999. Its realisation and Finland’simmediate participation appear to bemost probable. It will, however, meangreat changes for companies as well astransitional costs. The EMU Project ini-tiated by SOK’s executive board beganfunctioning at the beginning of the year.Its task is to coordinate preparations andthe transfer to a single currency through-out the whole S Group. During the yearthe project issued a preliminary transi-tional plan for the Group and the differ-ent sectors and operations.
The Finnish Cooperative UnionResponsibility for the activities of theFinnish Cooperative Union lies withSOK’s Cooperative Department. Themain task of the FCU is to uphold andadvance the principles of cooperation inthe everyday work of the S Group, helpthe societies to improve the quality of co-operative administration and promotecollaboration between the different partsof the S Group. The members of the FCUare SOK and all the societies belongingto the S Group.The FCU Board of Directors consistedof attorney Matti Vanto (chairman), edu-cationalist Anna-Maija Kujala (vice chair-man), farmer Pekka Havukainen, attor-
ney Jukka Huiskonen, member of par-liament Tytti Isohookana-Asunmaa,headmaster Pekka Kivimäki, teacher UllaKurvinen, attorney Marja Lehtiranta,managing director Eero Saukkonen andmanaging director Håkan Smeds, as wellas SOK’s representatives CEO Jere Lahtiand department manager Tapio Peltola.As before, administrative training atGroup level took place in collaborationwith the Jollas Institute. Two nation-widetraining sessions were held during theyear, in addition to numerous otherswithin the societies for members of theexecutive and supervisory boards andcouncil representatives. These eventswere based on the new edition of the”Administration Handbook”, extensivelyused in training in earlier years.Some 1 560 customer-owners took partin the administration of the regional co-operative societies; 81 as members ex-ecutive boards, 450 as members of su-pervisory boards and 1 029 as councilrepresentatives. Council elections wereheld in six regional societies, the aver-age participation rate being 28 %. Theresults gave women a majority for thefirst time on the councils of S Group re-gional societies.As in early years, the department con-tinued to assist the societies in mattersrelating to changes in the rules. All therules to regional society savings fundsamended the year before were enteredin the trade register during 1997.The seventh S Group convention washeld over the weekend of May 24-25 inJyväskylä. Some 900 cooperative so-ciety and SOK Corporation administra-tion and management representativesand their spouses participated. In addi-tion, the department took part in nu-merous administrative and interestgroup events organised by the societies.International relations are managedthrough the Finnish Consumer Cooper-ative Union, which is a member of theInternational Cooperative Alliance (ICA)
and the Brussels-based lobby organi-sation EURO COOP. The ICA has 225member associations with a total mem-bership of over 778 million from 94 coun-tries.EURO COOP represents more than3 200 cooperative societies and their 21million members from 13 EU memberstates and 5 associate consumer coop-erative organisations from east-centralEurope. EURO COOP is increasinglymaking its presence felt in Brussels andthe ICA has decided to make it a mainarea of emphasis.
Number of elected officials inthe S Group’s Regional
Cooperative Societies in 1997 (excluding committees)
Men Women TotalExecutive Board 70 11 81Supervisory Board1) 286 164 450Council of Represent-atives1) 507 522 1 029Total 863 697 1 560
1) Includes (cooperative society) personnel
42
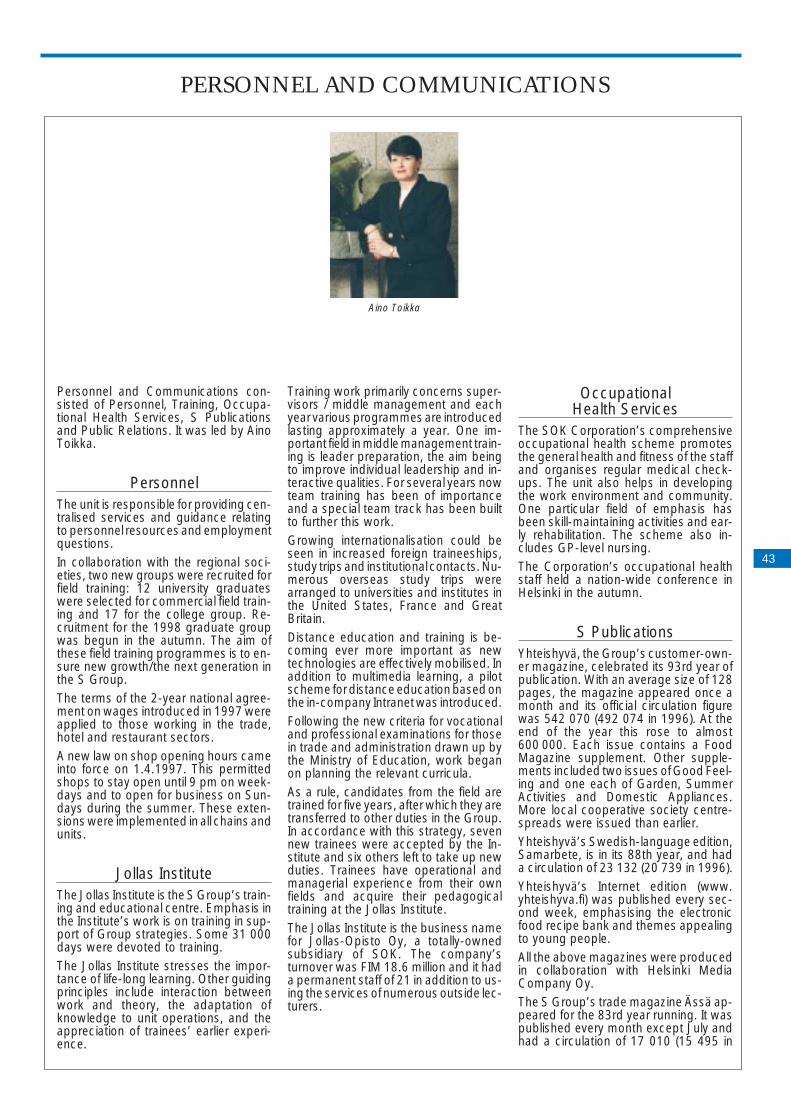
PERSONNEL AND COMMUNICATIONS
43
Personnel and Communications con-sisted of Personnel, Training, Occupa-tional Health Services, S Publicationsand Public Relations. It was led by AinoToikka.
PersonnelThe unit is responsible for providing cen-tralised services and guidance relatingto personnel resources and employmentquestions.In collaboration with the regional soci-eties, two new groups were recruited forfield training: 12 university graduateswere selected for commercial field train-ing and 17 for the college group. Re-cruitment for the 1998 graduate groupwas begun in the autumn. The aim ofthese field training programmes is to en-sure new growth/the next generation inthe S Group.The terms of the 2-year national agree-ment on wages introduced in 1997 wereapplied to those working in the trade, hotel and restaurant sectors.A new law on shop opening hours cameinto force on 1.4.1997. This permittedshops to stay open until 9 pm on week-days and to open for business on Sun-days during the summer. These exten-sions were implemented in all chains andunits.
Jollas InstituteThe Jollas Institute is the S Group’s train-ing and educational centre. Emphasis inthe Institute’s work is on training in sup-port of Group strategies. Some 31 000days were devoted to training.The Jollas Institute stresses the impor-tance of life-long learning. Other guidingprinciples include interaction betweenwork and theory, the adaptation ofknowledge to unit operations, and theappreciation of trainees’ earlier experi-ence.
Training work primarily concerns super-visors / middle management and eachyear various programmes are introducedlasting approximately a year. One im-portant field in middle management train-ing is leader preparation, the aim beingto improve individual leadership and in-teractive qualities. For several years nowteam training has been of importanceand a special team track has been builtto further this work.Growing internationalisation could beseen in increased foreign traineeships,study trips and institutional contacts. Nu-merous overseas study trips werearranged to universities and institutes inthe United States, France and GreatBritain. Distance education and training is be-coming ever more important as newtechnologies are effectively mobilised. Inaddition to multimedia learning, a pilotscheme for distance education based onthe in-company Intranet was introduced.Following the new criteria for vocationaland professional examinations for thosein trade and administration drawn up bythe Ministry of Education, work beganon planning the relevant curricula. As a rule, candidates from the field aretrained for five years, after which they aretransferred to other duties in the Group.In accordance with this strategy, sevennew trainees were accepted by the In-stitute and six others left to take up newduties. Trainees have operational andmanagerial experience from their ownfields and acquire their pedagogicaltraining at the Jollas Institute. The Jollas Institute is the business namefor Jollas-Opisto Oy, a totally-ownedsubsidiary of SOK. The company’sturnover was FIM 18.6 million and it hada permanent staff of 21 in addition to us-ing the services of numerous outside lec-turers.
Occupational Health Services
The SOK Corporation’s comprehensiveoccupational health scheme promotesthe general health and fitness of the staffand organises regular medical check-ups. The unit also helps in developingthe work environment and community.One particular field of emphasis hasbeen skill-maintaining activities and ear-ly rehabilitation. The scheme also in-cludes GP-level nursing.The Corporation’s occupational healthstaff held a nation-wide conference inHelsinki in the autumn.
S PublicationsYhteishyvä, the Group’s customer-own-er magazine, celebrated its 93rd year ofpublication. With an average size of 128pages, the magazine appeared once amonth and its official circulation figurewas 542 070 (492 074 in 1996). At theend of the year this rose to almost600 000. Each issue contains a FoodMagazine supplement. Other supple-ments included two issues of Good Feel-ing and one each of Garden, SummerActivities and Domestic Appliances.More local cooperative society centre-spreads were issued than earlier.Yhteishyvä’s Swedish-language edition,Samarbete, is in its 88th year, and hada circulation of 23 132 (20 739 in 1996). Yhteishyvä’s Internet edition (www.yhteishyva.fi) was published every sec-ond week, emphasising the electronicfood recipe bank and themes appealingto young people. All the above magazines were producedin collaboration with Helsinki MediaCompany Oy.The S Group’s trade magazine Ässä ap-peared for the 83rd year running. It waspublished every month except July andhad a circulation of 17 010 (15 495 in
Aino Toikka

1996). The contents mainly concernthemes topical to the Group’s retail tradeand other operations. In August the mag-azine dealt extensively with training andintroduced the Jollas Institute’s trainingprogramme. Coverage of overseasevents in the sector and the activities ofcompetitors was increased. Ässä is alsoposted to all members of the adminis-tration.The SOK Corporation’s staff newsletterS-Viesti came out 11 times. In additionto illuminating different aspects of theCorporation’s business activities and op-erating environment, S-Viesti also con-tinued its theme of maintaining and im-proving work health.
Public RelationsThe unit is responsible for informing thevarious interest groups about the activ-ities of the SOK Corporation and SGroup. It also issued press and otherstatements regarding the on-going de-bate on developments within the retailtrade and the hotel and restaurant sec-tor. The annual and interim report werepublished in Finnish, Swedish and Eng-lish.
SOK CORPORATION’S PERSONNEL IN 1997
44
SOK CORPORATION´S PERSONNEL, 31.12.1997
Number % ChangeSOK CORPORATIONField Division 2 757 61.2 +515Specialty Stores Division 1 495 33.2 -361Administrative Division 173 3.8 +3Office of the CEO 16 0.4 ±0Corporate Development and Planning 12 0.3 ±0Personnel and Communications 51 1.1 ±0TOTAL SOK CORPORATION 4 504 100.0 +157SUBSIDIARIES 4 169 92.6 +136SOK 335 7.4 +21
NumbersAt year-end there were 4 504 employ-ees on the Corporation’s payroll, an in-crease of 157. The increase came fromthe reopening of the Sokos Hotel Helsin-ki, the transfer of the Radisson SAS Ho-tel in Helsinki to SOK, and the openingsof the Lahti Prisma and Riihimäki S Mar-ket.On the other hand, there was also a lossin employees declined due to the clo-sure of the Sokos department store inVaasa, the transfer of the SavonlinnaSokos to the local society, and the con-version of others in Hämeenlinna,Lappeenranta, Kouvola, Oulu andSeinäjoki into Sokos Fashion stores.
Employment relationsAt the end of the year, 93.2 % of the Cor-poration’s staff were employed on a per-manent basis and 6.8 % on a temporarybasis. Full-time employees accountedfor 69.1 % and part-time employees 30.9%. There were no significant changes inthese percentages compared with 1996.Most temporary employees worked inthe hotel, restaurant and retailing com-panies.
Gender structureAt the end of the year 36.4 % of the Cor-poration’s employees were men and63.6 % women.
Age structureThe average age of a Corporation em-ployee was 36 years, and there was noappreciable difference between menand women. Within the individual com-panies, however, there were differences,with the youngest group being mostprominent in the hotel, restaurant andretailing companies.
Permanentemployees93.2 %
Temporaryemployees6.8 %
Part-timeemployees30.9 %
Full-timeemployees69.1 %
35-39-29 30-34 40-44 45-49 50-54 55-59 60-
24
20
16
12
8
4
0
22.8
15.912.3 12.4
15.713.1
6.4
1.4
%
AGE STRUCTURE OF SOK CORPORATION`SPERSONNEL, 31.12.1997
EMPLOYMENT RELATIONS IN SOK CORPORATION, 31.12.1997

ASSOCIATED COMPANIES
The Inex GroupThe Inex Group consists of the parentcompany Inex Partners Oy and its sub-sidiaries Meira Nova Oy, Meira Oy, A-Muna Oy, and Rainex Partners Oy andits subsidiary Rainex Yrityspalvelu Oy.SOK has a 50 % holding in Inex PartnersOy.Due to its customer-oriented and effi-cient operations, outstanding client per-formance and Finland’s favourable econ-omic climate, Inex managed to increasethe amount of added value produced forits clients. The Group’s performancewas the best in its history. Sales contin-ued to grow strongly and the company’sprice competitiveness was good. Thecommercial, economic and strategiccompetitive edge of its clients increasedsignificantly. Its market position, sourc-ing impact, cost-effectivity and operat-ing performance all improved. The com-pany also maintained a high level of ser-vice and delivery reliability.The value of the Group’s economic andoperational successes emphasises theon-going phase of growth, change anddevelopment which has enabled the pro-duction of added value. Growth andpowerful development work continue.The projects concern the customer-oriented operating processes of the net-work formed by the Group and its clientchains and partners. The major fields un-der development are personnel, assort-ments, computer systems, logistics cen-tres, terminals and combined store de-liveries. Success is guaranteed by thewilling cooperation and entrepreneurialspirit of the Inex staff. The structural and organisationalchanges initiated in the Group threeyears ago have been completed. TheRainex companies were sold to SOK: on1.1.1998.All aspects of the Group’s developmenthave been positive. Net sales were FIM7 593 million, up 13 %. The profit beforeextraordinary items, voluntary provisionsand income taxes for both the Group andthe subsidiaries was excellent, up on theyear before and higher than anticipated.Financing, liquidity and return on capitalemployed was at a good level. The grocery sourcing and distributionparent company Inex Partners Oy per-
formed well. Net sales totalled FIM 6 272million, a growth of 14 %, thanks to clientchain successes in the grocery trade andInex’s efficient operations model. Thecompany showed a profit before extra-ordinary items, voluntary provisions andincome taxes that exceeded the previ-ous year and was higher than anticipat-ed. The operating model developed by thecompany and its partners has confirmedthe network’s position as a pioneer inchain selling and logistics in the grocerymarket. This can be seen in its successon the market, as well as improved pricecompetitiveness and profitability.
The foodservice trade company MeiraNova Oy continued tits favourablegrowth. The company confirmed its po-sition as a pioneer in customer-orientedlogistics. Its has stabilised its share ofthe wholesale deliveries in the grocerymarket at around 30 %. The company’snet sales totalled FIM 899 million, an in-crease of 6 % over the previous year.
The coffee and spice company Meira Oystrengthened its market position. Meiracoffee’s market share rose to over 27 %and Meira spices reaffirmed their lead-ership position in Finland. Following theintroduction of a new company law inEstonia, Meira’s representative office inTallinn was closed down and a new com-pany, Meira Eesti Oü, established on1.7.1997 to continue its activities.Meira’s net sales were FIM 481 million,an increase of 30 %.
Sourcing contracts to the value of FIM700 million were made by the hardwaretrade sourcing and logistics companyRainex Partners Oy: Net sales totalledFIM 70 million, an increase of 24 %. Thebuilding trade suppliers Rainex Yritys-palvelu Oy recorded net sales of FIM 386million, up 11 %. The Inex Group’s most important tasksfor the year 1998 are to continue pro-ducing competitive advantages for itsclients through cost-effective and prof-itable operations and completion of themajor on-going development projects.
At the end of the year the Group em-ployed 1 702 people. The managing di-rector of both the Group and the parentcompany was Martti Haaman.
The Etelä-Suomen Huoltamot Group
The Etelä-Suomen Huoltamot Oy oper-ates store-type service stations inGreater Helsinki, Porvoo and the coun-ty of Häme. The shareholders are SOK(46.5 %) and the Helsinki (48.5 %), Lahti(2.5 %) and Porvoo (2.5 %) cooperativesocieties. On 1.7.1997 the companypurchased all the shares of Liiken-nepalvelut Oy, which operates service-station stores in Tammisilta, Paimio, fromthe Salo cooperative society. At year-endthe Group had 13 service-station storesand 6 unmanned stations.Net sales for the company were FIM 187million and for the Group FIM 199 mil-lion. At year-end the Group employed141 people. The managing director ofEtelä-Suomen Huoltamot Oy was Han-nu Plaketti.
The Tenco GroupTenco’s function is to develop and op-erate the department store business inthe Baltic countries and St. Petersburgarea. The Tenco Group consists of the parentcompany Tenco Oy and its fully-ownedsubsidiaries Tenco Eesti AS and TencoLatvia SIA. It is owned fifty-fifty by SOKand the Germany company WarenhausKaufhof AG.Tenco Eesti AS operates a departmentstore in accordance with the Sokos busi-ness idea in the centre of Tallinn. Thestore’s net sales for the year were FIM32.4 million.
45

46
A new Prisma hypermarket was opened in Lahti in the autumn.

THE S GROUP IN 1997
47
The S Group consists of the SOK Cor-poration and the cooperative societies,together with their subsidiaries. S Groupretail sales totalled FIM 29 011 million,an increase of 10 %. This was due par-ticularly to good performance by the SMarket and Prisma chains and the carbusiness.The combined result for the Groupshowed a profit after financial items butbefore extraordinary items, voluntaryprovisions and incomes taxes of FIM 800million, an increase over the previousyear of FIM 300 million. This was an all-time record for the Group. At year-end the Group had 1 205 retailoutlets, an increase of 16. The Group’smain investments were the completionof Prisma hypermarkets in Lahti andTurku, major new S Markets in Riihimä-ki, Olari in Espoo, Konala in Helsinki,Sarankulma in Tampere and the Zep-pelin shopping mall in Kempele, the ac-quisition of the operations of the Radis-son SAS Royal Hotel in Helsinki and ser-vice-station stores in Tammisilta inPaimio, Nastola and Karkkila. In additionthere were extensions and refurbishingsto numerous S Markets, Prismas, Sokosdepartment stores and restaurants.Total S Group investments were FIM1 000 million, an increase of FIM 30 mil-lion.S Group personnel at year-end num-bered 18 283, an increase of 1 018.
The cooperative societiesThe number of cooperative societies atyear end remained unchanged at 44. Ofthese 23 were regional societies oper-
ating in accordance with the S Group’sstrategy and the other 21 were local so-cieties.Sales by the societies and their sub-sidiaries amounted to FIM 22 233 mil-lion, up 10.4 %. Regional societies, whoaccounted for 96.8 % of sales, increasedtheir market shares in all core fields.The societies’ profit after financial itemsbut before extraordinary items, voluntaryprovisions and income taxes, was FIM660 million, an increase of FIM 200 mil-lion over the year before. All regional so-cieties recorded a profit.The societies’ investments amounted toFIM 728 million, a rise of FIM 51 million.Deposits by customer-owners in thesavings funds rose by FIM 186 million toFIM 1 589 million.With 63 487 people joining during theyear, total membership of the societiesrose to 607 008. The number of cus-tomer-owners in the regional societieswas 589 591, an increase of 63 356. Thecustomer-owner bonus system was inoperation in all regional societies. Bonuspurchases by customer-owners came toFIM 11.3 billion of which FIM 258 millionwas returned as bonuses.The societies and their subsidiaries hada total of 13 779 employees at year end,an increase of 861.
S Group Regional Cooperative Societies
Cooperative Society Varuboden,KirkkonummiSouth Carelia Cooperative Society,Lappeenranta
South Ostrobothnia CooperativeSociety, Seinäjoki
Helsinki Cooperative Society, Helsinki
Jukola Cooperative Society, Nurmes
Koillismaa Cooperative Society,Kuusamo
Cooperative Society Arina, Oulu
Cooperative Society Hämeenmaa,Lahti
Cooperative Society Keskimaa,Jyväskylä
Cooperative Society Keula, Rauma
Cooperative Society KPO, Kokkola
Cooperative Society Maakunta,Kajaani
Cooperative Society Osla, Porvoo
Cooperative Society PeeÄssä, Kuopio
Cooperative Society Seutu, Lohja
Cooperative Society Suur-Savo,Mikkeli
Cooperative Society Ympyrä, Hamina
Cooperative Society Ympäristö,Kouvola
Pirkanmaa Cooperative Society,Tampere
North Carelia Cooperative Society,Joensuu
Salo District Cooperative Society,Salo
Satakunta Cooperative Society, Pori
Turku Cooperative Society, Turku
S GROUP RETAIL SALES BY CHAIN
S Markets264
Prismahyper-
markets32
Salestores165
Alepastores
49
Sokos andSokos fashion
stores23
Hotels andrestaurants
263
Service-stations
124
Agri-markets
140
4000
6000
3000
2000
1000
0
8000
7000
5000
7 699
5 598
1 072715
1 788
FIM million
2 694
1 792
3 781Food andgrocery 46.8 %
Leisure-time 3.0 %
Clothing 6.1 %
Service stations7.4 %
Car dealerships8.5 %
Grain trade 2.8 %
Hardware/Agri 13.5 %
Hotels/Restaurants9.7 %
Homewares 2,3 %
S GROUP RETAIL TRADE BY BRANCHTotal FIM 29.0 Billion
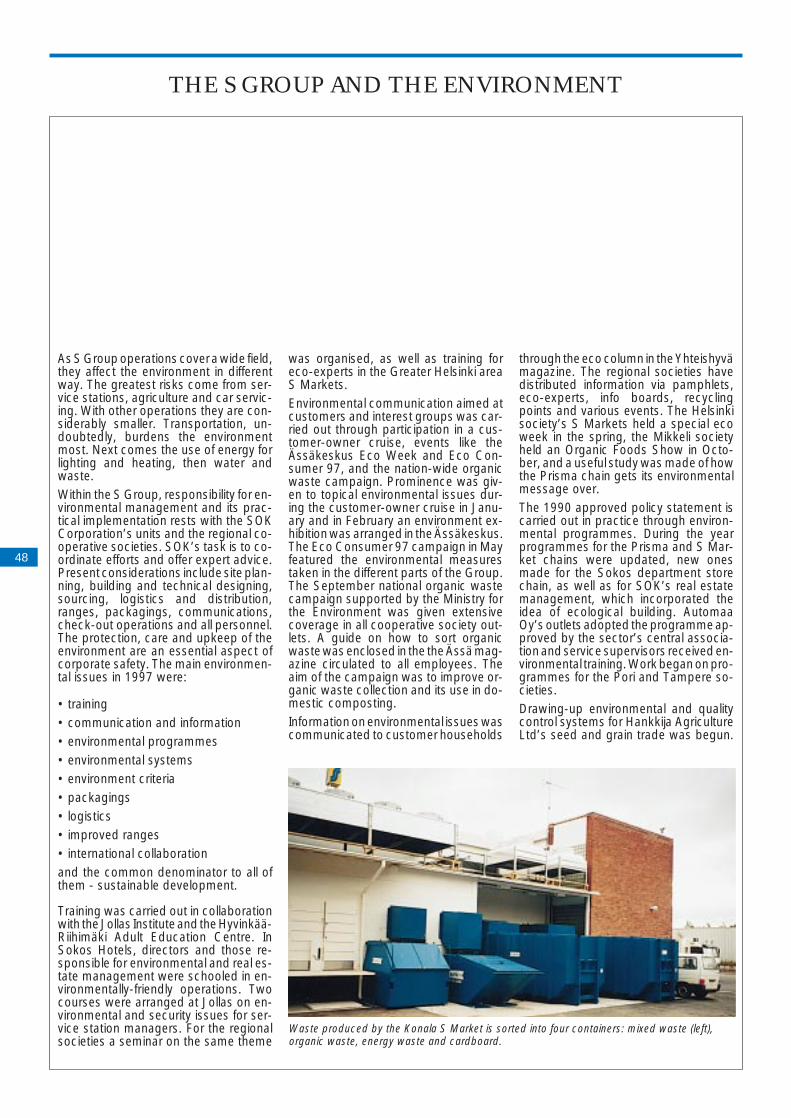
As S Group operations cover a wide field,they affect the environment in differentway. The greatest risks come from ser-vice stations, agriculture and car servic-ing. With other operations they are con-siderably smaller. Transportation, un-doubtedly, burdens the environmentmost. Next comes the use of energy forlighting and heating, then water andwaste.Within the S Group, responsibility for en-vironmental management and its prac-tical implementation rests with the SOKCorporation’s units and the regional co-operative societies. SOK’s task is to co-ordinate efforts and offer expert advice.Present considerations include site plan-ning, building and technical designing,sourcing, logistics and distribution,ranges, packagings, communications,check-out operations and all personnel.The protection, care and upkeep of theenvironment are an essential aspect ofcorporate safety. The main environmen-tal issues in 1997 were:
• training• communication and information• environmental programmes • environmental systems • environment criteria• packagings• logistics• improved ranges • international collaborationand the common denominator to all ofthem - sustainable development.
Training was carried out in collaborationwith the Jollas Institute and the Hyvinkää-Riihimäki Adult Education Centre. InSokos Hotels, directors and those re-sponsible for environmental and real es-tate management were schooled in en-vironmentally-friendly operations. Twocourses were arranged at Jollas on en-vironmental and security issues for ser-vice station managers. For the regionalsocieties a seminar on the same theme
was organised, as well as training foreco-experts in the Greater Helsinki areaS Markets.Environmental communication aimed atcustomers and interest groups was car-ried out through participation in a cus-tomer-owner cruise, events like theÄssäkeskus Eco Week and Eco Con-sumer 97, and the nation-wide organicwaste campaign. Prominence was giv-en to topical environmental issues dur-ing the customer-owner cruise in Janu-ary and in February an environment ex-hibition was arranged in the Ässäkeskus.The Eco Consumer 97 campaign in Mayfeatured the environmental measurestaken in the different parts of the Group.The September national organic wastecampaign supported by the Ministry forthe Environment was given extensivecoverage in all cooperative society out-lets. A guide on how to sort organicwaste was enclosed in the the Ässä mag-azine circulated to all employees. Theaim of the campaign was to improve or-ganic waste collection and its use in do-mestic composting. Information on environmental issues wascommunicated to customer households
through the eco column in the Yhteishyvämagazine. The regional societies havedistributed information via pamphlets,eco-experts, info boards, recyclingpoints and various events. The Helsinkisociety’s S Markets held a special ecoweek in the spring, the Mikkeli societyheld an Organic Foods Show in Octo-ber, and a useful study was made of howthe Prisma chain gets its environmentalmessage over.The 1990 approved policy statement iscarried out in practice through environ-mental programmes. During the yearprogrammes for the Prisma and S Mar-ket chains were updated, new onesmade for the Sokos department storechain, as well as for SOK’s real estatemanagement, which incorporated theidea of ecological building. AutomaaOy’s outlets adopted the programme ap-proved by the sector’s central associa-tion and service supervisors received en-vironmental training. Work began on pro-grammes for the Pori and Tampere so-cieties.Drawing-up environmental and qualitycontrol systems for Hankkija AgricultureLtd’s seed and grain trade was begun.
THE S GROUP AND THE ENVIRONMENT
48
Waste produced by the Konala S Market is sorted into four containers: mixed waste (left),organic waste, energy waste and cardboard.

These are based on ISO 14001 and ISO9002 standards and are expected to beoperative in 1999 and 1998 respective-ly. Sokos Hotel Klaus Kurki participatedin a tourist promotion project, the aim ofwhich is to adopt the environmental sys-tem based on both ISO 14001 and theEU’s EMAS certification in the hotel andrestaurant sector. This was startedthrough staff training and the introduc-tion of environmental criteria.Environmental criteria are required toproduce simple and comparable infor-mation about the measures taken. Thesewere introduced in the hotel and restau-rant sector to measure electricity andheat consumption and waste. Energy re-lated devices were developed in collab-oration with the LINKKI2 project financedby the Ministry of Trade and Industry. Inthe grocery trade, pilot schemes wereintroduced in certain of the Jyväsklä so-ciety’s S Markets and Sale stores. En-ergy monitors have been installed inSOK-owned properties.Statistics on packaging and packingwaste also function as nevironmental cri-teria. This was a major concern of InexPartners Oy, Intrade Partners Oy andHankkija Agriculture Ltd during the year.Although the relevant decision of theCouncil of State did not come into forceuntil December 1st, good progress ondeveloping statistical systems had al-ready been made. The decision affectsthe S Group in respect to importedgoods packed by retailers. The purposeof the statistics is to provide data onpacking materials and waste amounts,but also to prevent waste occurring, re-duce throw-aways and increase the useof recyclable packings.
Most retail trade waste comes frompackaging, which could be reduced byusing returnable plastic crates like Trans-boxes or finding another use for it. Butsome of it could be put to another use.In the spring, Inex Partners Oy began thetrial collection of plastic waste in GreaterHelsinki. Plastic used in wrappings hasbeen returned from certain supermar-kets to the Kilo warehouse, where it is
shipped to Norway for use as raw ma-terial in plastic bags. A recycling termi-nal is being installed at Kilo to improvethe recycling of packaging and trans-portation materials. Another practical ex-ample is the Mikkeli Prisma hypermar-ket which has increased the degree ofwaste recovery from 80 % in 1996 to 95% last year. Reducing the amount of waste going tothe municipal tip by even 5 % requires amotivated staff, close collaboration withthe local community and the develop-ment of other potential uses. One rea-son for increased use of waste is its util-isation by the local heating utility. A sim-ilar trend can be seen elsewhere in Fin-land, so it would be possible to increasethe rate of waste recovery in the retailtrade from its present 50 % to 90 %.Measures relating to logistics and distri-bution should also be seen as practicalenvironmental actions. Because Finlandis a large and sparsely populated coun-try, it is both economically and environ-mentally sound to rationalise the deliv-ery of goods to eliminate unnecessaryjourneys, packing and unpacking. Col-laboration between trade and industrythrough the ECR (Efficient Consumer Re-sponse) improves data control and lo-gistic planning. The environmental ad-vantage of electronic trading is that the
delivery of Internet-ordered goods canbe organised centrally. Electronic trad-ing was first introduced by the Joensuucooperative society.The number of environmentally-friendlygoods in ranges is continuously grow-ing. Organic foods have establishedthemselves and the range is expandingall the time. Even so, there are timeswhen demand outstrips supply.The S Group has continued to play anactive role in international cooperation.The environment working group in EUROCOOP lobbies the EU in such questionsas genetically modified foods, packag-ing waste and eco labelling. It has alsodiscussed sustainable developmentfrom the point of view of the retail trade.In October, the board of the Federationof Finnish Commerce and Trade ap-proved a policy statement calling for sus-tainable development which supple-ments the Government’s own policy.
49
Cardboard40 %
Organicwaste10 %
Mixed waste50 %
Organicwaste10 %
Mixed waste10 %
Energy40 %
Cardboard40 %
NOW OBJECTIVE
BREAKDOWN OF RETAIL TRADE WASTEAFTER ON-SITE SORTING
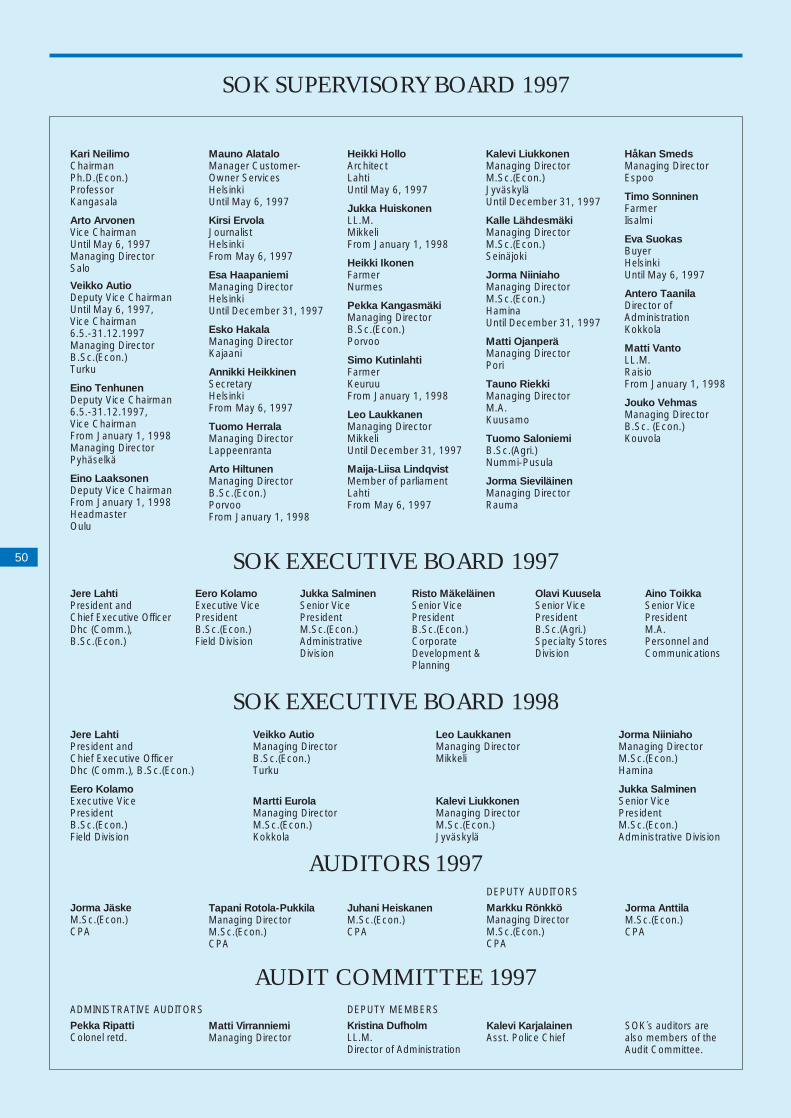
SOK SUPERVISORY BOARD 1997
Kari NeilimoChairmanPh.D.(Econ.)ProfessorKangasala
Arto ArvonenVice ChairmanUntil May 6, 1997Managing DirectorSalo
Veikko AutioDeputy Vice ChairmanUntil May 6, 1997, Vice Chairman6.5.-31.12.1997Managing DirectorB.Sc.(Econ.)Turku
Eino TenhunenDeputy Vice Chairman6.5.-31.12.1997,Vice ChairmanFrom January 1, 1998Managing DirectorPyhäselkä
Eino LaaksonenDeputy Vice ChairmanFrom January 1, 1998HeadmasterOulu
Mauno Alatalo Manager Customer-Owner ServicesHelsinkiUntil May 6, 1997
Kirsi ErvolaJournalistHelsinkiFrom May 6, 1997
Esa HaapaniemiManaging DirectorHelsinkiUntil December 31, 1997
Esko HakalaManaging DirectorKajaani
Annikki Heikkinen SecretaryHelsinkiFrom May 6, 1997
Tuomo HerralaManaging DirectorLappeenranta
Arto HiltunenManaging DirectorB.Sc.(Econ.)PorvooFrom January 1, 1998
Heikki HolloArchitectLahtiUntil May 6, 1997
Jukka HuiskonenLL.M.MikkeliFrom January 1, 1998
Heikki IkonenFarmerNurmes
Pekka KangasmäkiManaging DirectorB.Sc.(Econ.)Porvoo
Simo KutinlahtiFarmerKeuruuFrom January 1, 1998
Leo LaukkanenManaging DirectorMikkeliUntil December 31, 1997
Maija-Liisa LindqvistMember of parliamentLahtiFrom May 6, 1997
Kalevi LiukkonenManaging DirectorM.Sc.(Econ.)JyväskyläUntil December 31, 1997
Kalle LähdesmäkiManaging DirectorM.Sc.(Econ.)Seinäjoki
Jorma NiiniahoManaging DirectorM.Sc.(Econ.)HaminaUntil December 31, 1997
Matti OjanperäManaging DirectorPori
Tauno RiekkiManaging DirectorM.A.Kuusamo
Tuomo SaloniemiB.Sc.(Agri.)Nummi-Pusula
Jorma SieviläinenManaging DirectorRauma
Håkan SmedsManaging DirectorEspoo
Timo SonninenFarmerIisalmi
Eva SuokasBuyerHelsinkiUntil May 6, 1997
Antero TaanilaDirector of AdministrationKokkola
Matti VantoLL.M.RaisioFrom January 1, 1998
Jouko VehmasManaging DirectorB.Sc. (Econ.)Kouvola
SOK EXECUTIVE BOARD 1997
SOK EXECUTIVE BOARD 1998
AUDITORS 1997
AUDIT COMMITTEE 1997ADMINISTRATIVE AUDITORS
Pekka RipattiColonel retd.
Matti VirranniemiManaging Director
DEPUTY MEMBERS
Kristina DufholmLL.M.Director of Administration
Kalevi KarjalainenAsst. Police Chief
SOK´s auditors are also members of the Audit Committee.
Jorma JäskeM.Sc.(Econ.)CPA
Tapani Rotola-PukkilaManaging DirectorM.Sc.(Econ.)CPA
Juhani HeiskanenM.Sc.(Econ.)CPA
DEPUTY AUDITORS
Markku RönkköManaging DirectorM.Sc.(Econ.)CPA
Jorma AnttilaM.Sc.(Econ.)CPA
Jere LahtiPresident andChief Executive OfficerDhc (Comm.),B.Sc.(Econ.)
Eero KolamoExecutive VicePresidentB.Sc.(Econ.)Field Division
Jukka SalminenSenior Vice PresidentM.Sc.(Econ.)Administrative Division
Risto MäkeläinenSenior VicePresidentB.Sc.(Econ.)CorporateDevelopment &Planning
Olavi KuuselaSenior VicePresidentB.Sc.(Agri.)Specialty StoresDivision
Aino ToikkaSenior VicePresidentM.A.Personnel andCommunications
50
Jere LahtiPresident andChief Executive OfficerDhc (Comm.), B.Sc.(Econ.)
Eero KolamoExecutive VicePresidentB.Sc.(Econ.)Field Division
Veikko AutioManaging DirectorB.Sc.(Econ.)Turku
Martti EurolaManaging DirectorM.Sc.(Econ.)Kokkola
Leo LaukkanenManaging DirectorMikkeli
Kalevi LiukkonenManaging DirectorM.Sc.(Econ.)Jyväskylä
Jorma NiiniahoManaging DirectorM.Sc.(Econ.)Hamina
Jukka SalminenSenior Vice PresidentM.Sc.(Econ.)Administrative Division

51
SOK CORPORATION ORGANISATION 1.1.1998
48
President and CEOJere Lahti ❍ ●
Business ControllPekka Kantonen
SecretariatOsmo Maunuksela
Administrative Division
Jukka Salminen ❍ ●
Field DivisionEero Kolamo ❍ ●
Agricultural TradeCar Trade
Reijo Lähteenmäki ●
Corporate Development & Planning
Risto Mäkeläinen ●
Personnel andCommunications
Aino Toikka ●
Specialty Stores Division
Olavi Kuusela ●
Hotel and RestaurantOperations
Juhani Järvenpää ●
Food and Grocery RetailingService Station Business
Tapani Parkkinen ●
Sokotel OyErja Takala
Oy Sokoteria AbJuhani Järvenpää
Helsinki Hotels OyJuhani Järvenpää
Royal Hotels OyPekka Törmälä
Market ChainManagement
Tapani Parkkinen
Ässähuoltamot OyHeikki Strandén
Hankkija Agriculture Ltd
Reijo Lähteenmäki
Oy Maan Auto AbJorma Lehmuskallio
Automaa OyReino Ylä-Autio
AccountingReijo Kaltea
FinanceJari Annala
Real Estate Management
Christian Lybeck
Logistics and Information Systems
Harri Mönkkönen
Legal AffairsSeppo Pöyhönen
Administrative Services
Jarmo Vehokari
SOK-Takaus OyMauri Söderlund
Field Consulting Risto Malin
Strategic PlanningJuhani Suni
Projects in the Baltic areaHannu Uski
Cooperative DepartmentTapio Peltola
PersonnelAino Toikka
TrainingMatti Pulkki
OccupationalHealth Services
Juha Teirilä
S PublicationsPentti Törmälä
Public RelationsTarmo Tuominen
Oy Sokos AbOlavi Kuusela
Kuusinen OyPekka Timonen
Intrade Partners OyTaavi Heikkilä
Rainex Partners OyJari Helenius
Rainex Yrityspalvelu Oy
Stig Lindh
❍ Member of the Board of Directors● Member of the Management Team
Tenco Oy
Finnish Cooperative
Union
Marketing and Customer-Owner Services
Risto Niemelä
Hämeenmaan Automarket Oy
Erkki Niemi
Inex Partners Oy

S GROUP KEY FIGURES 1993-1997
52
FIM million
SOK CORPORATIONNet salesGross marginFixed costsOperating profit before depreciationDepreciationOperating profit Financial income and expensesProfit/loss before extraordinary items, voluntary provisions and income taxesNet earnings from operationsProfit/loss for the period
Total assetsFixed assets and other non-current investmentsStocksFinancial assetsCapital and reservesMinority interestAccelerated depreciation *)Voluntary provisions *)Obligatory provisionsLiabilities
Increase in fixed assetsSale of/decrease in fixed assets
Interest-bearing liabilitiesLiquid fundsNet interest-bearing liabilities
Personnel at 31.12.
*) Accelerated depreciation and voluntaryprovisions have been divided between capital andreserves and an imputed tax liability for 1997.
SOKSales (excl. VAT)Sales to cooperative societiesOperating profit before extraordinary items, voluntary provisions and income taxesProfit/loss for the period
Personnel at 31.12.
COOPERATIVE SOCIETIES + SUBSIDIARIESSales (FIM million)Number of societiesMembership
Personnel at 31.12.
S GROUPRetail sales (FIM million)Outlets
Personnel at 31.12.
1993 1994 1995 1996 1997 ± %
10 327 11 206 10 325 11 498 12 377 7.61 883 1 928 2 034 1 943 2 176 12.01 403 1 405 1 502 1 652 1 721 4.2
480 523 533 291 455 56.4251 216 217 174 187 7.5229 307 316 117 268 129.1
-374 -234 -224 -76 -132 73.7
-145 73 91 42 137 95 FIM million221 367 430 216 393 177 FIM million-31 130 113 28 174 146 FIM million
6 535 6 349 6 211 5 931 6 592 11.1
3 369 2 987 2 802 2 968 3 070 3.4795 655 674 730 822 12.6
2 371 2 707 2 735 2 233 2 700 20.9904 982 1 085 1 130 1 434 26.9
30 85 92 91 92 1.1123 98 81 89
75 65 61 5599 101 88 93 108 16.1
5 304 5 018 4 804 4 473 4 959 10.9
491 254 245 382 275 -28.0321 375 116 137 72 -47.4
3 772 3 447 3 067 2 714 3 007 10.81 413 1 697 1 685 1 183 1 492 26.12 359 1 750 1 382 1 531 1 514 -1.1
5 179 4 864 4 061 4 347 4 504 3.6
4 982 5 257 5 466 6 002 5 400 -10.03 608 2 983 3 286 4 378 4 800 9.6
-384 -75 -133 -112 -62 50.0 FIM million-254 98 -22 22 172 150.0 FIM million
2 414 2 068 1 944 314 335 6.7
15 584 16 628 18 297 20 106 22 233 10.646 46 44 44 44 0.0
403 631 429 325 479 087 543 521 607 008 11.7
12 137 11 333 12 382 12 918 13 779 6.7
23 204 24 814 24 099 26 372 29 011 10.01 222 1 190 1 191 1 189 1 205 1.3
17 316 16 197 16 443 17 265 18 283 5.9
CALCULATION OF KEY RATIOS
Net earnings from operations = Operating profit before depreciation – financial income and expenses + value adjustment on investments – income taxes
Liquid funds = Cash and bank + other investments + other current investments
Net interest-bearing liabilities = Interest-bearing liabilities – liquid funds
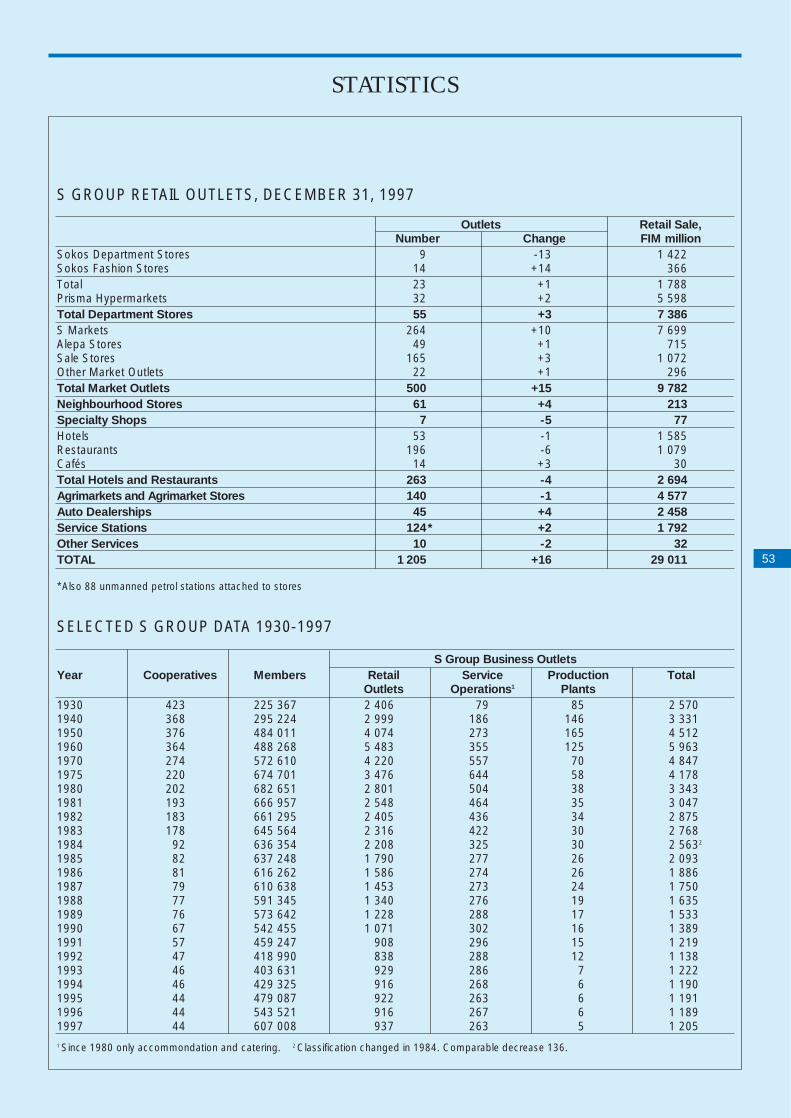
STATISTICS
53
S GROUP RETAIL OUTLETS, DECEMBER 31, 1997
Outlets Retail Sale,Number Change FIM million
Sokos Department Stores 9 -13 1 422Sokos Fashion Stores 14 +14 366Total 23 +1 1 788Prisma Hypermarkets 32 +2 5 598Total Department Stores 55 +3 7 386S Markets 264 +10 7 699Alepa Stores 49 +1 715Sale Stores 165 +3 1 072Other Market Outlets 22 +1 296Total Market Outlets 500 +15 9 782Neighbourhood Stores 61 +4 213Specialty Shops 7 -5 77Hotels 53 -1 1 585Restaurants 196 -6 1 079Cafés 14 +3 30Total Hotels and Restaurants 263 -4 2 694Agrimarkets and Agrimarket Stores 140 -1 4 577Auto Dealerships 45 +4 2 458Service Stations 124 +2 1 792Other Services 10 -2 32TOTAL 1 205 +16 29 011
SELECTED S GROUP DATA 1930-1997
S Group Business OutletsYear Cooperatives Members Retail Service Production Total
Outlets Operations1 Plants1930 423 225 367 2 406 79 85 2 5701940 368 295 224 2 999 186 146 3 3311950 376 484 011 4 074 273 165 4 5121960 364 488 268 5 483 355 125 5 9631970 274 572 610 4 220 557 70 4 8471975 220 674 701 3 476 644 58 4 1781980 202 682 651 2 801 504 38 3 3431981 193 666 957 2 548 464 35 3 0471982 183 661 295 2 405 436 34 2 8751983 178 645 564 2 316 422 30 2 7681984 92 636 354 2 208 325 30 2 5632
1985 82 637 248 1 790 277 26 2 0931986 81 616 262 1 586 274 26 1 8861987 79 610 638 1 453 273 24 1 7501988 77 591 345 1 340 276 19 1 6351989 76 573 642 1 228 288 17 1 5331990 67 542 455 1 071 302 16 1 3891991 57 459 247 908 296 15 1 2191992 47 418 990 838 288 12 1 1381993 46 403 631 929 286 7 1 2221994 46 429 325 916 268 6 1 1901995 44 479 087 922 263 6 1 1911996 44 543 521 916 267 6 1 1891997 44 607 008 937 263 5 1 2051 Since 1980 only accommondation and catering. 2 Classification changed in 1984. Comparable decrease 136.
* Also 88 unmanned petrol stations attached to stores
*

EVENTS OF THE YEAR
54
Over 900 representatives of the cooperatives and SOK took part in the S Group’s convention in Jyväskylä.
Transport minister Matti Aura and CEO Jere Lahticutting the blue ribbon at the official opening of theSokos-Forum tunnel under Mannerheimintie street.
The winners of the ”For You, the Customer” competitionmade a memorable trip to Paris in the autumn.
The S Market in Konala, Helsinki, became the firstExpress Shop in Scandinavia when self-scanningequipment was introduced for customers.
Visitors could buy organic foods from the S Market’sstand at the EcoConsumer Fair held in Old Harbour,Helsinki.
The bakery department at the Kuopio society’s Prisma hypermarket was chosen as Baker of the Year. The bakery departments in the Turku and Oulu societies’ Prisma stores were also awarded prizes.

SUOMEN OSUUSKAUPPOJEN KESKUSKUNTA (SOK)Fleminginkatu 34
P.O.Box 171, FIN-00511 Helsinki, FinlandTel. +358 9 1881, telefax +358 9 188 2332
Internet http://www.sok.fi


