Kevin E. Trenberth John Fasullo Lesley Smith Trends and variability in column-integrated atmospheric water vapor Received: 06 December 2004 / Accepted: 14 February 2005 / Published online: 11 May 2005 Ó Springer-Verlag 2005 Abstract An analysis and evaluation has been performed of global datasets on column-integrated water vapor (precipitable water). For years before 1996, the Ross and Elliott radiosonde dataset is used for validation of European Centre for Medium-range Weather Forecasts (ECMWF) reanalyses ERA-40. Only the special sensor microwave imager (SSM/I) dataset from remote sensing systems (RSS) has credible means, variability and trends for the oceans, but it is available only for the post-1988 period. Major problems are found in the means, vari- ability and trends from 1988 to 2001 for both reanalyses from National Centers for Environmental Prediction (NCEP) and the ERA-40 reanalysis over the oceans, and for the NASA water vapor project (NVAP) dataset more generally. NCEP and ERA-40 values are reason- able over land where constrained by radiosondes. Accordingly, users of these data should take great care in accepting results as real. The problems highlight the need for reprocessing of data, as has been done by RSS, and reanalyses that adequately take account of the changing observing system. Precipitable water variabil- ity for 1988–2001 is dominated by the evolution of ENSO and especially the structures that occurred during and following the 1997–98 El Nin˜o event. The evidence from SSM/I for the global ocean suggests that recent trends in precipitable water are generally positive and, for 1988 through 2003, average 0.40±0.09 mm per decade or 1.3±0.3% per decade for the ocean as a whole, where the error bars are 95% confidence inter- vals. Over the oceans, the precipitable water variability relates very strongly to changes in SSTs, both in terms of spatial structure of trends and temporal variability (with a regression coefficient for 30°N–30°S of 7.8% K À1 ) and is consistent with the assumption of fairly constant rel- ative humidity. In the tropics, the trends are also influ- enced by changes in rainfall which, in turn, are closely associated with the mean flow and convergence of moisture by the trade winds. The main region where positive trends are not very evident is over Europe, in spite of large and positive trends over the North Atlantic since 1988. A much longer time series is probably required to obtain stable patterns of trends over the oceans, although the main variability could probably be deduced from past SST and associated precipitation variations. 1 Introduction Water vapor plays a major role in climate as a dominant feedback variable in association with radiative effects and moist dynamics. In the lower troposphere, water vapor in the atmosphere acts as the main resource for precipitation in all weather systems, providing latent heating in the process and dominating the structure of diabatic heating in the troposphere (Trenberth and Stepaniak 2003a, b). Trenberth (1999) estimates that, for extratropical cyclones, on average about 70% of the precipitation comes from moisture that was already in the atmosphere at the time the storm formed, while the rest comes from surface evaporation, or more generally evapotranspiration, during the course of the storm’s evolution. As climate warms, the amount of moisture in the atmosphere, which is governed by the Clausius– Clapeyron equation, is expected to rise much faster than the total precipitation amount, which is governed by the surface heat budget through evaporation (Trenberth et al. 2003). This means that storms will be affected and it implies that the main changes to be experienced are in the character of precipitation: increases in intensity must be offset by decreases in duration or frequency of events, The National Center for Atmospheric Research is sponsored by the National Science Foundation. K. E. Trenberth (&) J. Fasullo L. Smith National Center for Atmospheric Research, Boulder, CO80307 USA E-mail: [email protected]Tel.: +1-303-4971318 Fax: +1-303-4971333 Climate Dynamics (2005) 24: 741–758 DOI 10.1007/s00382-005-0017-4
Transcript
Kevin E. Trenberth Æ John Fasullo Æ Lesley Smith
Trends and variability in column-integrated atmospheric water vapor
Received: 06 December 2004 / Accepted: 14 February 2005 / Published online: 11 May 2005� Springer-Verlag 2005
Abstract An analysis and evaluation has been performedof global datasets on column-integrated water vapor(precipitable water). For years before 1996, the Ross andElliott radiosonde dataset is used for validation ofEuropean Centre for Medium-range Weather Forecasts(ECMWF) reanalyses ERA-40. Only the special sensormicrowave imager (SSM/I) dataset from remote sensingsystems (RSS) has credible means, variability and trendsfor the oceans, but it is available only for the post-1988period. Major problems are found in the means, vari-ability and trends from 1988 to 2001 for both reanalysesfrom National Centers for Environmental Prediction(NCEP) and the ERA-40 reanalysis over the oceans, andfor the NASA water vapor project (NVAP) datasetmore generally. NCEP and ERA-40 values are reason-able over land where constrained by radiosondes.Accordingly, users of these data should take great carein accepting results as real. The problems highlight theneed for reprocessing of data, as has been done by RSS,and reanalyses that adequately take account of thechanging observing system. Precipitable water variabil-ity for 1988–2001 is dominated by the evolution ofENSO and especially the structures that occurred duringand following the 1997–98 El Nino event. The evidencefrom SSM/I for the global ocean suggests that recenttrends in precipitable water are generally positive and,for 1988 through 2003, average 0.40±0.09 mm perdecade or 1.3±0.3% per decade for the ocean as awhole, where the error bars are 95% confidence inter-vals. Over the oceans, the precipitable water variabilityrelates very strongly to changes in SSTs, both in terms ofspatial structure of trends and temporal variability (with
a regression coefficient for 30�N–30�S of 7.8% K�1) andis consistent with the assumption of fairly constant rel-ative humidity. In the tropics, the trends are also influ-enced by changes in rainfall which, in turn, are closelyassociated with the mean flow and convergence ofmoisture by the trade winds. The main region wherepositive trends are not very evident is over Europe, inspite of large and positive trends over the North Atlanticsince 1988. A much longer time series is probablyrequired to obtain stable patterns of trends over theoceans, although the main variability could probably bededuced from past SST and associated precipitationvariations.
1 Introduction
Water vapor plays a major role in climate as a dominantfeedback variable in association with radiative effectsand moist dynamics. In the lower troposphere, watervapor in the atmosphere acts as the main resource forprecipitation in all weather systems, providing latentheating in the process and dominating the structure ofdiabatic heating in the troposphere (Trenberth andStepaniak 2003a, b). Trenberth (1999) estimates that, forextratropical cyclones, on average about 70% of theprecipitation comes from moisture that was already inthe atmosphere at the time the storm formed, while therest comes from surface evaporation, or more generallyevapotranspiration, during the course of the storm’sevolution. As climate warms, the amount of moisture inthe atmosphere, which is governed by the Clausius–Clapeyron equation, is expected to rise much faster thanthe total precipitation amount, which is governed by thesurface heat budget through evaporation (Trenberthet al. 2003). This means that storms will be affected andit implies that the main changes to be experienced are inthe character of precipitation: increases in intensity mustbe offset by decreases in duration or frequency of events,
The National Center for Atmospheric Research is sponsored by theNational Science Foundation.
K. E. Trenberth (&) Æ J. Fasullo Æ L. SmithNational Center for Atmospheric Research, Boulder, CO80307USAE-mail: [email protected].: +1-303-4971318Fax: +1-303-4971333
or perhaps by changes in efficiency, as well as changes inphase from snow to rain. Such changes are observed inthe United States (Groisman et al. 2004). Increasedintensity of precipitation further implies stronger latentheating and increasing intensity of weather systems. Atthe extremes of precipitation incidence are the eventsthat give rise to floods and droughts, whose changes inoccurrence and severity have enormous impact on theenvironment and society. Changes in water vaporamounts are, therefore, key determinants of climatechange character.
In addition, water vapor is the most importantgreenhouse gas (Kiehl and Trenberth 1997). Its changesin the upper troposphere are especially important forclimate change (Held and Soden 2000), but are poorlyknown. Some changes in water vapor in the upper tro-posphere stem directly from human influences throughemissions from aircraft and associated generation ofcontrails, and these contribute to radiative forcing oforder 0.1 W m�2 that is expected to grow in time but isnot well measured (Marquart et al. 2003). Of course aswater vapor condenses into clouds, other radiativeeffects become important and clouds are the greatestsource of uncertainty in climate models.
Hence, advancing the understanding of variabilityand change in water vapor is vital, but knowledge islimited by inadequate observations. In this paper, weassess changes in atmospheric water vapor, with a focuson the column-integrated amount, known as precipita-ble water. We are especially interested in evaluating andexploiting the ERA-40 reanalysis data from the Euro-pean Centre for Medium range Weather Forecasts(ECMWF), see Uppala et al. (2005). We also use theNational Centers for Environmental Prediction/Na-tional Center for Atmospheric Research (NCEP/NCAR) (henceforth NCEP-1) (Kalnay et al. 1996) andNCEP-2 (Kanamitsu et al. 2002) reanalyses. Other glo-bal analyses of water vapor fields are part of the NASAwater vapor project (NVAP) dataset (Randel et al.1996), which we also use. Over land, radiosonde datafrom Ross and Elliott (1996, 2001) provide direct mea-surements for possible validation. Over the oceans aftermid-1987, precipitable water analyses are available fromthe special sensor microwave imager (SSM/I). Specifi-cally, products from remote sensing systems (RSS, seeLiu et al. 1992; Wentz 1997), which uses the Wentzalgorithm, are used. The datasets are described in moredetail in Sect. 2.
From carefully quality-controlled observations, itappears that atmospheric moisture amounts generallyincreased in the atmosphere after about 1973 (prior towhich reliable moisture soundings are mostly notavailable) through 1995 (Ross and Elliott 2001). Henseet al. (1988) revealed increases in moisture over thewestern Pacific. In the Western Hemisphere north of theequator, annual mean precipitable water amountsbelow 500 hPa increased over the United States,Caribbean and Hawaii by about 5% per decade reveal-ing a statistically significant trend from 1973 through
1993 (Ross and Elliott 1996), and these correspond tosignificant increases of 2–3% per decade in relativehumidities over the Southeast, Caribbean and subtrop-ical Pacific. Most of the increase is, however, related totemperature and hence in atmospheric water-holdingcapacity. In China, analysis by Zhai and Eskridge (1997)also revealed upward trends in precipitable water in allseasons and for the annual mean from 1970 to 1990.Precipitable water and relative humidities did not in-crease over much of Canada, and decreases were evidentwhere temperatures declined in northeast Canada (Rossand Elliott 1996).
Ross and Elliott (2001) extended their regionalanalysis of sonde data to the northern hemisphere. Theyconfirm the generally upward trends in precipitablewater for 1973–1995 over China and southern Asia,strong upward trends in the tropical Pacific, but foundsmall and insignificant trends over Europe. We haveobtained the Ross and Elliott (2001) radiosonde resultsto use as validation where possible. However, majorchanges in radiosonde types at the end of 1995 (Elliottet al. 2002) and more recently have made further updatesof those analyses difficult. We update six coastal stationsin the U.S. through 1999.
One global constraint on vertically integrated watervapor amounts is due to conservation of mass. Theglobal mean surface pressure from water vapor chan-ges should match those of actual surface pressure, asthis is the only significant influence on global masswithin measurement accuracies. Trenberth and Smith(2005) document changes in global surface pressure,water vapor surface pressure and dry air surfacepressure from ERA-40, ERA-15 and NCEP-1 reanal-yses. Considerable problems are evident prior to 1979,but results are quite good thereafter for ERA-40, witha standard error in monthly global surface pressureanomalies of 0.035 hPa while real fluctuations oftenexceed ±0.1 hPa. Results are not as good for NCEP-1. There is an increase in global water vapor amountwith El Nino, although the main increase is in theequatorial region from 10�N to 20�S often with com-pensating drier regions near 20�N. During the 1982–1983 and 1997–1998 El Nino events, global meanwater vapor amounts and total mass increased byabout 0.1 hPa in surface pressure for several months.For the latter event, the result is reproduced in globalsurface pressure and in NCEP-1 reanalyses, providingstrong evidence that it is real. Trenberth and Smith(2005) show that some evidence exists for slight de-creases following the Mount Pinatubo eruption in1991, as also found by Soden et al. (2002), and alsofor upward trends associated with increasing globalmean temperature, partially verified by upward trendsin surface pressure. The least-squares linear trendsfrom September 1985 to August 2002 are 0.12 hPa perdecade for the global analyzed surface pressure and0.09 hPa per decade for the contribution derived fromhumidity. As this comes from the analysis of obser-vations, it likely has a real basis. However, as uncer-
742 Trenberth et al.: Trends and variability in column-integrated atmosphere water vapor
tainties due to the changing observing system com-promise the evidence, these aspects are explored muchmore here.
In this paper, to extend the Ross and Elliott (2001)results both in time and over the oceans, we focus on thetrends after 1988 when SSM/I data are available.Records from a few radiosonde stations where the typeof sonde has not changed are also extended. As we willsee, the various products have very different trends butthey also have some variability in common. We designedan analysis to bring out the common aspects and in theprocess determined that only one product, the SSM/Ifrom RSS, is really credible, as the others have signifi-cant identifiable problems. Accordingly, the materialpresented reflects also the results of the evaluation.Section 2 describes the datasets and methods in moredetail. Section 3 presents the results, firstly with a de-tailed comparison of ERA-40 with Ross and Elliott(2001) radiosonde results for 1973–1995, and somecomparisons of NVAP with Ross and Elliott (2001)data. Some results are extended through 2003 and re-sults for six U.S. radiosonde stations are presentedthrough 1999. This is followed by an analysis of trends,variability and differences among the datasets over1988–2001, and then empirical orthogonal function(EOF) analyses results. The discussion and conclusionsare given in Sect. 4.
2 Datasets and methods
The datasets used in this study are the ERA-40 rea-nalyses, the NCEP-1 and NCEP-2 reanalyses, SSM/I,NVAP, and the radiosondes from Ross and Elliott,with an update from the NCEP archive created by JackWoollen at a few stations through 1999. Unfortunately,there is no good standard that can be used to calibrateor validate results. The main historical observations ofwater vapor have come from radiosondes after about1945. Quite aside from the limited spatial distributionand only up to twice-daily soundings, the biggestshortcoming has been the moisture sensor and itschanges over time; summaries for the U.S. are given byElliott and Gaffen (1991) and Trenberth (1995; see hisTable 1) and updated in Elliott et al. (2002). Fairlycrude sensors were used in early radiosondes thatsuffered from slow response times and biases. In theU.S. a carbon humidity element was introduced in1965, but low relative humidities (below 20%) were notreported until after 1993. Limits were also applied tohigh humidities (values in clouds were set at 95%).Shortcomings of operational sondes are well known(e.g., Ross and Elliott 2001; Guichard et al. 2000;Wang et al. 2002; Lanzante et al. 2003). A prototypereference sonde developed by NCAR (Wang et al.2003) was extensively tested against operational Vaisalaand VIZ sondes during IHOP, the International WaterVapor (H2O) Program, in the central United Statesduring a field program in the summer of 2002. It
further revealed the poor performance of operationalsondes at temperatures below about �20�C whilemeasuring humidity. Accordingly, Ross and Elliott(1996, 2001) have used water vapor only up to 500 hPain their analyses of sonde data. In addition, the majorchanges in U.S. radiosonde types at the end of 1995(Elliott et al. 2002) led to spurious changes that dependon time of observation, elevation, location, and season.In terms of moisture, there was a spurious drying butmainly in the upper troposphere. In the lower tropo-sphere, the relative humidity decreased from 5% to 8%with the switch from VIZ to Vaisala sondes. Forradiosondes, missing data can also be a substantialconcern.
We use the Version-5 precipitable water analysesfrom RSS SSM/I from a series of six intercalibratedsatellites (F08, F10, F11, F13, F14, and F15) combinedwhen they overlap, see Wentz (1997). The RSS recordhas been revised through several versions, and an eval-uation by Sohn and Smith (2003) used the Wentz algo-rithm as the standard and outlined reasons why there aremany algorithms applied to SSM/I data and why theydiffer. All of the DMSP satellites were launched into anear circular subsynchronous polar orbit. Except forF10, this was achieved and the equator crossing timechanged by less than an hour over the lifetime of themission. The exception is F10, which did not achieve thedesired orbit and the equator crossing time increasedfrom 19:42 at launch on 1 December 1990 to 22:09 inSeptember 1995, a change of 2 h 27 min. Accordingly,an allowance has to be made for diurnal cycle drift in therecord of F10. In addition, the ascending equatorcrossing times varied from 06:15 for F8, to 17:42 forF13, 18:11 for F11, 19:42 for F10, 20:21 for F14, and21:31 for F15. Therefore adjustments have to be madefor the diurnal cycle. RSS has paid careful attention tocross calibration across different satellites in theirVersion-5 (http://www.ssmi.com/ssmi/ssmi_description.html) that ‘‘allows investigators to confidently use theSSM/I products for detailed interannual and decadaltrends studies’’. We further explore the effects of crosscalibration on trends in Sect. 3.4. All algorithms dependon calibration with radiosonde records and thus build inany biases from the latter.
An alternative algorithm from Greenwald andStephens (GS, Greenwald et al. 1993) applied to SSM/Idata has been incorporated in the global NVAP (Randelet al. 1996) dataset. An evaluation of early versions ofthese two algorithms found deficiencies in the GSproduct (Trenberth and Guillemot 1995). Since thatevaluation, both NVAP and RSS SSM/I records havecontinued and further issues arise from how recordsfrom instruments on successive satellites are merged,especially in the NVAP dataset (Von der Haar et al.2003). Major changes in processing procedures occurredbeginning in 1993, with the introduction of the 22 GHzSSM/I channel, and in 2000 with a ‘‘next generation’’processing system involving multiple changes. Simpsonet al. (2001) explored the time-dependent biases of the
Trenberth et al.: Trends and variability in column-integrated atmosphere water vapor 743
NVAP dataset and noted a discontinuity at the begin-ning of 1993 associated with the change in procedures.
We use the NCEP-1 reanalyses (Kalnay et al. 1996)in model (sigma) coordinates at full resolution, therebyavoiding any errors from interpolating into pressuresurfaces and allowing exact vertical integrals to becomputed. These reanalyses did not assimilate SSM/Iwater vapor data or utilize the water vapor infraredchannels. Trenberth and Guillemot (1998) evaluatedNCEP-1 reanalysis for water vapor and found sub-stantial problems, with bulls eyes around isolatedisland stations, indicating a strong model influence, andbiases over much of the oceans. The goal of NCEP-2(Kanamitsu et al. 2000) was to improve upon theNCEP-1 reanalysis by fixing some errors and byupdating the parameterizations of the physical pro-cesses. However, the data stream was the same and thechanges did not greatly affect water vapor. Zveryaevand Chu (2003) analyzed the precipitable water recordfrom NCEP-1 for 1979–1998 and also from 1948 to1998 and found that the dominant pattern ofvariability featured spurious trends associated withchanges in the observing system.
For ERA-40, a full description is given by Uppalaet al. (2005). From 1979 onwards, ERA-40 bias-cor-rected the radiosonde data to account for at least part ofthe radiation errors (Andrae et al. 2004). Corrections ofup to 2�C in magnitude evolved with time as sondeschanged and were devised as a function of sun elevationangle, although the largest corrections are applied in thestratosphere. Nevertheless, the almost universal need tomake such corrections and the evidence of improved rmsdepartures from the first guess fields demonstrate the lackof an adequate baseline to calibrate results. The ERA-40data, we use, is at T106 resolution (1.125�) althoughmost analysis is at T63 resolution. In all cases of reducedresolution, a taper is applied near the truncation limit togreatly reduce any ringing effects.
For ERA-40, SSM/I radiances are assimilated asbrightness temperatures and a retrieval is effectivelyperformed that makes use of other variables (surfacewind stress is needed, for instance). The resultingproduct makes use of all other observations as well. Amajor advantage of ERA-40 is that it applies the data atthe time of observation, thereby avoiding possibleproblems associated with orbital drift, different time ofday of observations, and aliasing of the diurnal cycle.These reanalyses also make use of water vapor channelsfrom TIROS operational vertical sounder (TOVS) andATOVS as well as SSM/I radiances, which should havea substantial positive influence over the oceans. How-ever, a serious problem diagnosed in the ERA-40 anal-yses is excessive tropical oceanic precipitation,particularly after 1991 (e.g., Trenberth et al. 2002; Up-pala et al. 2005). This was due in part to effects of vol-canic aerosols on high resolution infrared radiationsounder (HIRS) infrared radiances following the erup-tion of Mt. Pinatubo, which were not included directlyin the forward radiative transfer model used in the
variational analysis. This also occurred just at the timeNOAA-12 became operational thereby affecting the biascorrection. Inadequately corrected infrared radiancebiases tend to result in spurious humidity changes in thetropical troposphere, since the relatively low back-ground errors specified for temperature force analysischanges predominantly in humidity. An initial poor biascorrection of SSM/I data was corrected for ERA-40analyses from January 1993, along with revised thin-ning, channel-selection and quality control of HIRSradiances in 1997 and prior to 1989. [This peculiar se-quence comes from the fact that there were multiplestreams of reanalysis and that the pre-1989 stream wasseparate from the post-1989 stream].
We choose to focus on the ocean domain for the coreanalysis. We first performed an EOF analysis of eachdataset independently. Although the EOF patterns andassociated principle component time series were similar,they were also different enough to require a means ofanalyzing them together, which was initially accom-plished through an extended combined EOF analysis. Acoarse grid (every fourth point at T63 resolution) waschosen and all fields were concatenated and analyzedsimultaneously. The resulting principle component timeseries was then projected onto the full grids, includingover the land where data are available. The fields ana-lyzed were the covariances. Hence, all fields contributeequally in determining the results and the emphasis is onthe actual anomalies. However, while the results of thisanalysis were useful to us in the evaluation, it has be-come apparent that all datasets have major problemsexcept perhaps the RSS SSM/I. Therefore, the mainresults shown will use the latter to define core time seriesand principle components.
Other approaches have also been tried. For instance,a singular value decomposition (SVD) analysis wouldeffectively analyze the correlations and thus normalizedanomalies, placing more weight on higher latitudes.Also, with five datasets, SVD analysis done pair-wisewould result in ten different pairings. Alternative ap-proaches would be to define the core time series in otherways, such as by choosing the Nino 3.4 sea surfacetemperature (SST) index, but this turns out to beunnecessary as the Nino 3.4 time series emerges from theanalysis spontaneously.
3 Results
3.1 Comparisons of ERA-40 with Ross and Elliott
Because of the above-expressed concerns over ERA-40water vapor fields, we have performed a detailedcomparison with monthly means from Ross and Elliott(2001); referred to as RE. Separate sets of order 200stations were used at both 0000 UTC and 1200 UTC,and our initial evaluation examined these separately;but results are combined for our presentation to giveabout 240 total stations. In each case, we extracted the
744 Trenberth et al.: Trends and variability in column-integrated atmosphere water vapor
nearest grid point at T106 resolution from ERA-40(1.125� grid) and masked the data to match the sondedata in the few cases in which some sonde data weremissing.
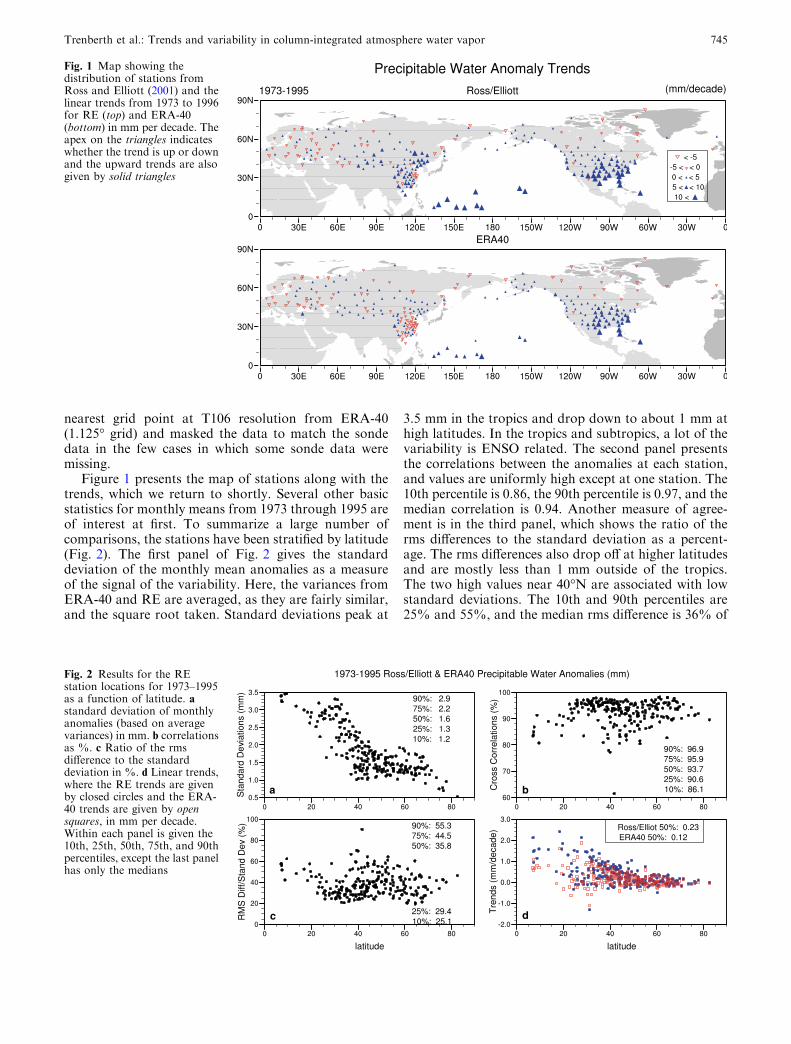
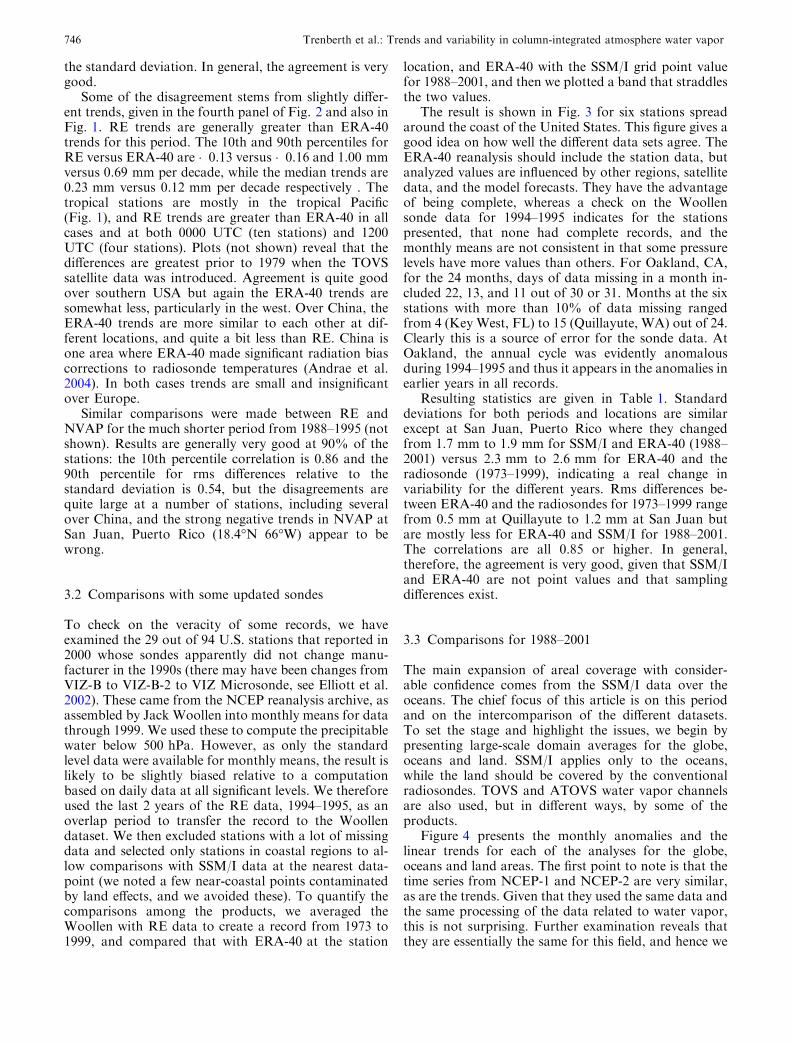
Figure 1 presents the map of stations along with thetrends, which we return to shortly. Several other basicstatistics for monthly means from 1973 through 1995 areof interest at first. To summarize a large number ofcomparisons, the stations have been stratified by latitude(Fig. 2). The first panel of Fig. 2 gives the standarddeviation of the monthly mean anomalies as a measureof the signal of the variability. Here, the variances fromERA-40 and RE are averaged, as they are fairly similar,and the square root taken. Standard deviations peak at
3.5 mm in the tropics and drop down to about 1 mm athigh latitudes. In the tropics and subtropics, a lot of thevariability is ENSO related. The second panel presentsthe correlations between the anomalies at each station,and values are uniformly high except at one station. The10th percentile is 0.86, the 90th percentile is 0.97, and themedian correlation is 0.94. Another measure of agree-ment is in the third panel, which shows the ratio of therms differences to the standard deviation as a percent-age. The rms differences also drop off at higher latitudesand are mostly less than 1 mm outside of the tropics.The two high values near 40�N are associated with lowstandard deviations. The 10th and 90th percentiles are25% and 55%, and the median rms difference is 36% of
Fig. 1 Map showing thedistribution of stations fromRoss and Elliott (2001) and thelinear trends from 1973 to 1996for RE (top) and ERA-40(bottom) in mm per decade. Theapex on the triangles indicateswhether the trend is up or downand the upward trends are alsogiven by solid triangles
a b
c d
Fig. 2 Results for the REstation locations for 1973–1995as a function of latitude. astandard deviation of monthlyanomalies (based on averagevariances) in mm. b correlationsas %. c Ratio of the rmsdifference to the standarddeviation in %. d Linear trends,where the RE trends are givenby closed circles and the ERA-40 trends are given by opensquares, in mm per decade.Within each panel is given the10th, 25th, 50th, 75th, and 90thpercentiles, except the last panelhas only the medians
Trenberth et al.: Trends and variability in column-integrated atmosphere water vapor 745
the standard deviation. In general, the agreement is verygood.
Some of the disagreement stems from slightly differ-ent trends, given in the fourth panel of Fig. 2 and also inFig. 1. RE trends are generally greater than ERA-40trends for this period. The 10th and 90th percentiles forRE versus ERA-40 are �0.13 versus �0.16 and 1.00 mmversus 0.69 mm per decade, while the median trends are0.23 mm versus 0.12 mm per decade respectively . Thetropical stations are mostly in the tropical Pacific(Fig. 1), and RE trends are greater than ERA-40 in allcases and at both 0000 UTC (ten stations) and 1200UTC (four stations). Plots (not shown) reveal that thedifferences are greatest prior to 1979 when the TOVSsatellite data was introduced. Agreement is quite goodover southern USA but again the ERA-40 trends aresomewhat less, particularly in the west. Over China, theERA-40 trends are more similar to each other at dif-ferent locations, and quite a bit less than RE. China isone area where ERA-40 made significant radiation biascorrections to radiosonde temperatures (Andrae et al.2004). In both cases trends are small and insignificantover Europe.
Similar comparisons were made between RE andNVAP for the much shorter period from 1988–1995 (notshown). Results are generally very good at 90% of thestations: the 10th percentile correlation is 0.86 and the90th percentile for rms differences relative to thestandard deviation is 0.54, but the disagreements arequite large at a number of stations, including severalover China, and the strong negative trends in NVAP atSan Juan, Puerto Rico (18.4�N 66�W) appear to bewrong.
3.2 Comparisons with some updated sondes
To check on the veracity of some records, we haveexamined the 29 out of 94 U.S. stations that reported in2000 whose sondes apparently did not change manu-facturer in the 1990s (there may have been changes fromVIZ-B to VIZ-B-2 to VIZ Microsonde, see Elliott et al.2002). These came from the NCEP reanalysis archive, asassembled by Jack Woollen into monthly means for datathrough 1999. We used these to compute the precipitablewater below 500 hPa. However, as only the standardlevel data were available for monthly means, the result islikely to be slightly biased relative to a computationbased on daily data at all significant levels. We thereforeused the last 2 years of the RE data, 1994–1995, as anoverlap period to transfer the record to the Woollendataset. We then excluded stations with a lot of missingdata and selected only stations in coastal regions to al-low comparisons with SSM/I data at the nearest data-point (we noted a few near-coastal points contaminatedby land effects, and we avoided these). To quantify thecomparisons among the products, we averaged theWoollen with RE data to create a record from 1973 to1999, and compared that with ERA-40 at the station
location, and ERA-40 with the SSM/I grid point valuefor 1988–2001, and then we plotted a band that straddlesthe two values.
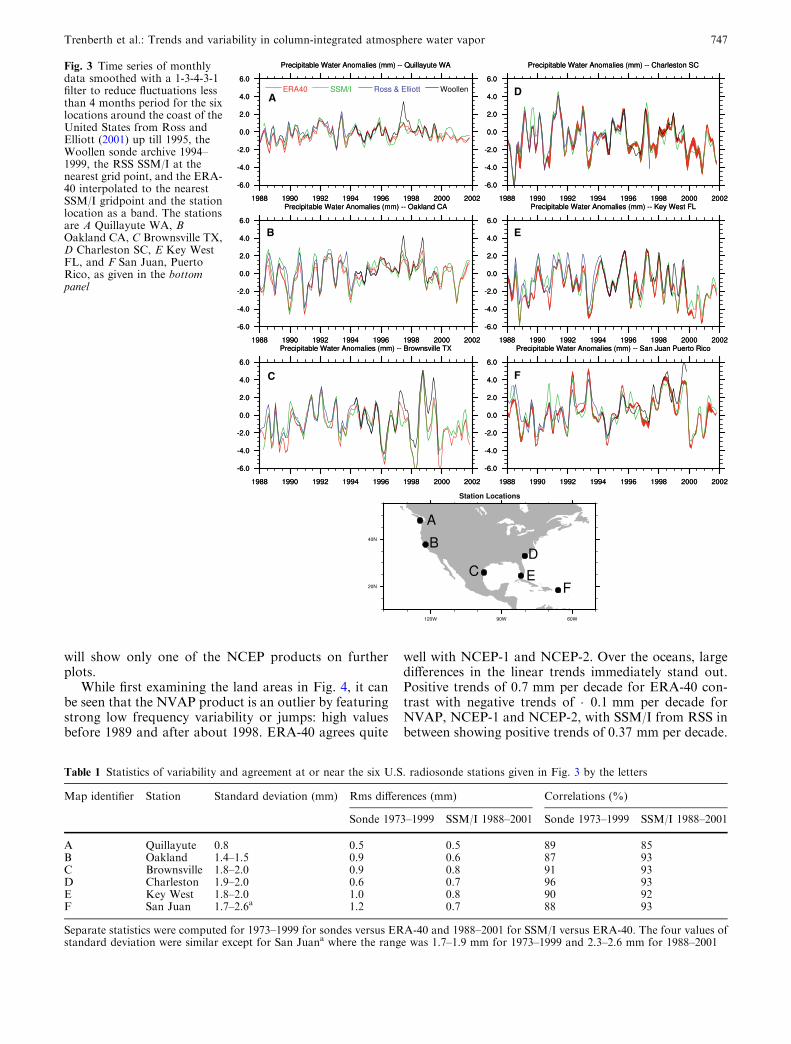
The result is shown in Fig. 3 for six stations spreadaround the coast of the United States. This figure gives agood idea on how well the different data sets agree. TheERA-40 reanalysis should include the station data, butanalyzed values are influenced by other regions, satellitedata, and the model forecasts. They have the advantageof being complete, whereas a check on the Woollensonde data for 1994–1995 indicates for the stationspresented, that none had complete records, and themonthly means are not consistent in that some pressurelevels have more values than others. For Oakland, CA,for the 24 months, days of data missing in a month in-cluded 22, 13, and 11 out of 30 or 31. Months at the sixstations with more than 10% of data missing rangedfrom 4 (Key West, FL) to 15 (Quillayute, WA) out of 24.Clearly this is a source of error for the sonde data. AtOakland, the annual cycle was evidently anomalousduring 1994–1995 and thus it appears in the anomalies inearlier years in all records.
Resulting statistics are given in Table 1. Standarddeviations for both periods and locations are similarexcept at San Juan, Puerto Rico where they changedfrom 1.7 mm to 1.9 mm for SSM/I and ERA-40 (1988–2001) versus 2.3 mm to 2.6 mm for ERA-40 and theradiosonde (1973–1999), indicating a real change invariability for the different years. Rms differences be-tween ERA-40 and the radiosondes for 1973–1999 rangefrom 0.5 mm at Quillayute to 1.2 mm at San Juan butare mostly less for ERA-40 and SSM/I for 1988–2001.The correlations are all 0.85 or higher. In general,therefore, the agreement is very good, given that SSM/Iand ERA-40 are not point values and that samplingdifferences exist.
3.3 Comparisons for 1988–2001
The main expansion of areal coverage with consider-able confidence comes from the SSM/I data over theoceans. The chief focus of this article is on this periodand on the intercomparison of the different datasets.To set the stage and highlight the issues, we begin bypresenting large-scale domain averages for the globe,oceans and land. SSM/I applies only to the oceans,while the land should be covered by the conventionalradiosondes. TOVS and ATOVS water vapor channelsare also used, but in different ways, by some of theproducts.
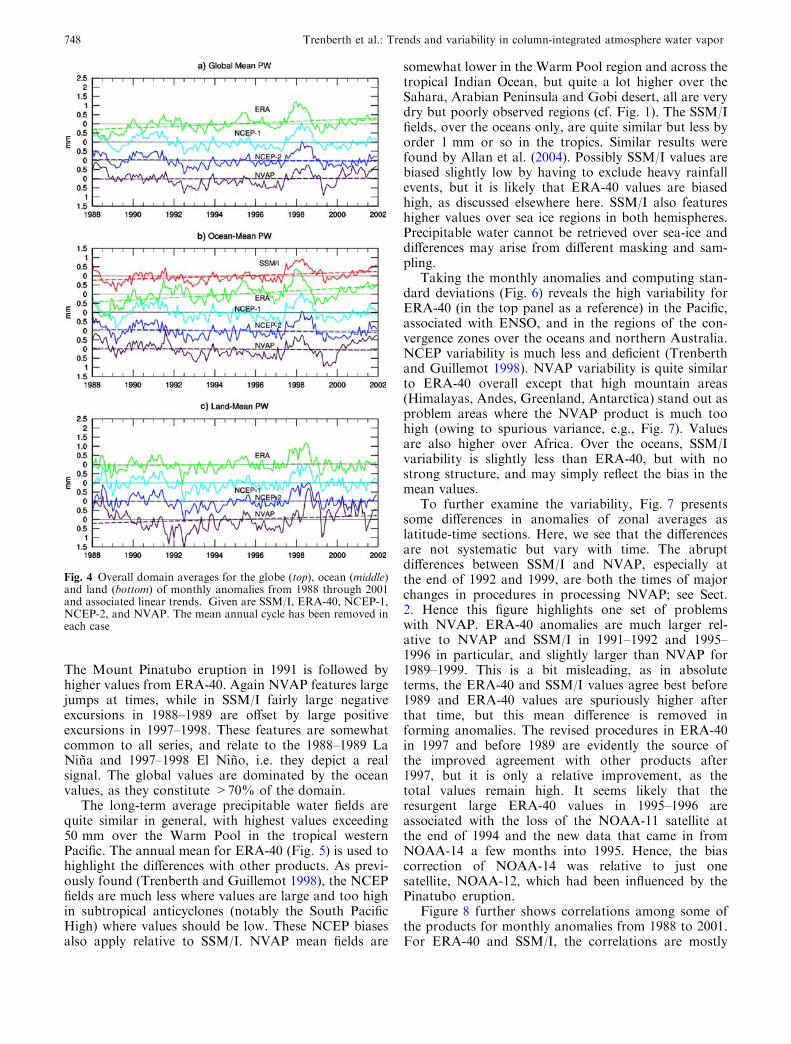
Figure 4 presents the monthly anomalies and thelinear trends for each of the analyses for the globe,oceans and land areas. The first point to note is that thetime series from NCEP-1 and NCEP-2 are very similar,as are the trends. Given that they used the same data andthe same processing of the data related to water vapor,this is not surprising. Further examination reveals thatthey are essentially the same for this field, and hence we
746 Trenberth et al.: Trends and variability in column-integrated atmosphere water vapor
will show only one of the NCEP products on furtherplots.
While first examining the land areas in Fig. 4, it canbe seen that the NVAP product is an outlier by featuringstrong low frequency variability or jumps: high valuesbefore 1989 and after about 1998. ERA-40 agrees quite
well with NCEP-1 and NCEP-2. Over the oceans, largedifferences in the linear trends immediately stand out.Positive trends of 0.7 mm per decade for ERA-40 con-trast with negative trends of �0.1 mm per decade forNVAP, NCEP-1 and NCEP-2, with SSM/I from RSS inbetween showing positive trends of 0.37 mm per decade.
Table 1 Statistics of variability and agreement at or near the six U.S. radiosonde stations given in Fig. 3 by the letters
Map identifier Station Standard deviation (mm) Rms differences (mm) Correlations (%)
A Quillayute 0.8 0.5 0.5 89 85B Oakland 1.4–1.5 0.9 0.6 87 93C Brownsville 1.8–2.0 0.9 0.8 91 93D Charleston 1.9–2.0 0.6 0.7 96 93E Key West 1.8–2.0 1.0 0.8 90 92F San Juan 1.7–2.6a 1.2 0.7 88 93
Separate statistics were computed for 1973–1999 for sondes versus ERA-40 and 1988–2001 for SSM/I versus ERA-40. The four values ofstandard deviation were similar except for San Juana where the range was 1.7–1.9 mm for 1973–1999 and 2.3–2.6 mm for 1988–2001
A
B
C F
E
D
Fig. 3 Time series of monthlydata smoothed with a 1-3-4-3-1filter to reduce fluctuations lessthan 4 months period for the sixlocations around the coast of theUnited States from Ross andElliott (2001) up till 1995, theWoollen sonde archive 1994–1999, the RSS SSM/I at thenearest grid point, and the ERA-40 interpolated to the nearestSSM/I gridpoint and the stationlocation as a band. The stationsare A Quillayute WA, BOakland CA, C Brownsville TX,D Charleston SC, E Key WestFL, and F San Juan, PuertoRico, as given in the bottompanel
Trenberth et al.: Trends and variability in column-integrated atmosphere water vapor 747
The Mount Pinatubo eruption in 1991 is followed byhigher values from ERA-40. Again NVAP features largejumps at times, while in SSM/I fairly large negativeexcursions in 1988–1989 are offset by large positiveexcursions in 1997–1998. These features are somewhatcommon to all series, and relate to the 1988–1989 LaNina and 1997–1998 El Nino, i.e. they depict a realsignal. The global values are dominated by the oceanvalues, as they constitute >70% of the domain.
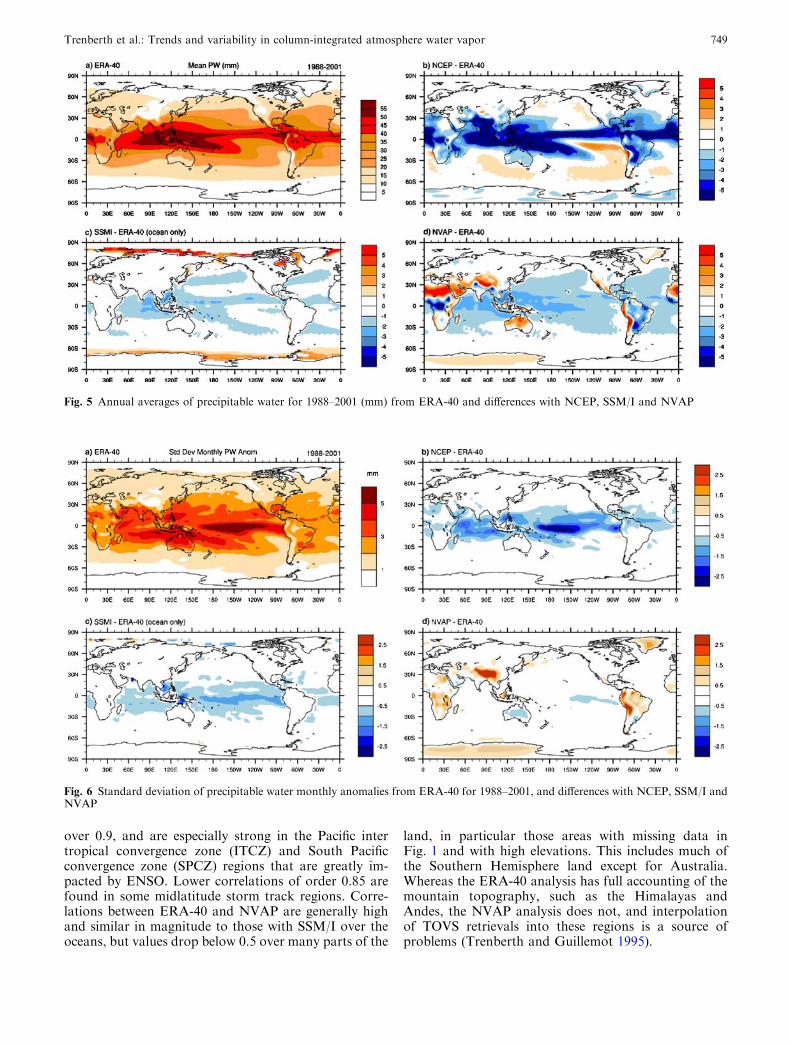
The long-term average precipitable water fields arequite similar in general, with highest values exceeding50 mm over the Warm Pool in the tropical westernPacific. The annual mean for ERA-40 (Fig. 5) is used tohighlight the differences with other products. As previ-ously found (Trenberth and Guillemot 1998), the NCEPfields are much less where values are large and too highin subtropical anticyclones (notably the South PacificHigh) where values should be low. These NCEP biasesalso apply relative to SSM/I. NVAP mean fields are
somewhat lower in the Warm Pool region and across thetropical Indian Ocean, but quite a lot higher over theSahara, Arabian Peninsula and Gobi desert, all are verydry but poorly observed regions (cf. Fig. 1). The SSM/Ifields, over the oceans only, are quite similar but less byorder 1 mm or so in the tropics. Similar results werefound by Allan et al. (2004). Possibly SSM/I values arebiased slightly low by having to exclude heavy rainfallevents, but it is likely that ERA-40 values are biasedhigh, as discussed elsewhere here. SSM/I also featureshigher values over sea ice regions in both hemispheres.Precipitable water cannot be retrieved over sea-ice anddifferences may arise from different masking and sam-pling.
Taking the monthly anomalies and computing stan-dard deviations (Fig. 6) reveals the high variability forERA-40 (in the top panel as a reference) in the Pacific,associated with ENSO, and in the regions of the con-vergence zones over the oceans and northern Australia.NCEP variability is much less and deficient (Trenberthand Guillemot 1998). NVAP variability is quite similarto ERA-40 overall except that high mountain areas(Himalayas, Andes, Greenland, Antarctica) stand out asproblem areas where the NVAP product is much toohigh (owing to spurious variance, e.g., Fig. 7). Valuesare also higher over Africa. Over the oceans, SSM/Ivariability is slightly less than ERA-40, but with nostrong structure, and may simply reflect the bias in themean values.
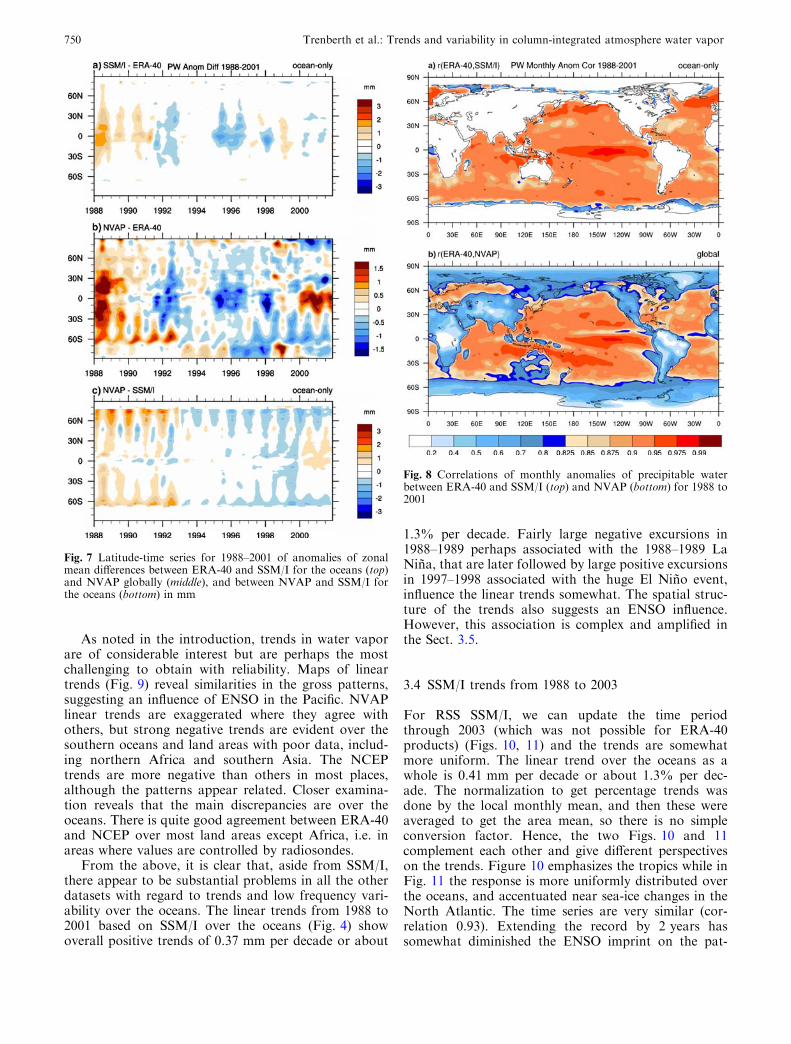
To further examine the variability, Fig. 7 presentssome differences in anomalies of zonal averages aslatitude-time sections. Here, we see that the differencesare not systematic but vary with time. The abruptdifferences between SSM/I and NVAP, especially atthe end of 1992 and 1999, are both the times of majorchanges in procedures in processing NVAP; see Sect.2. Hence this figure highlights one set of problemswith NVAP. ERA-40 anomalies are much larger rel-ative to NVAP and SSM/I in 1991–1992 and 1995–1996 in particular, and slightly larger than NVAP for1989–1999. This is a bit misleading, as in absoluteterms, the ERA-40 and SSM/I values agree best before1989 and ERA-40 values are spuriously higher afterthat time, but this mean difference is removed informing anomalies. The revised procedures in ERA-40in 1997 and before 1989 are evidently the source ofthe improved agreement with other products after1997, but it is only a relative improvement, as thetotal values remain high. It seems likely that theresurgent large ERA-40 values in 1995–1996 areassociated with the loss of the NOAA-11 satellite atthe end of 1994 and the new data that came in fromNOAA-14 a few months into 1995. Hence, the biascorrection of NOAA-14 was relative to just onesatellite, NOAA-12, which had been influenced by thePinatubo eruption.
Figure 8 further shows correlations among some ofthe products for monthly anomalies from 1988 to 2001.For ERA-40 and SSM/I, the correlations are mostly
Fig. 4 Overall domain averages for the globe (top), ocean (middle)and land (bottom) of monthly anomalies from 1988 through 2001and associated linear trends. Given are SSM/I, ERA-40, NCEP-1,NCEP-2, and NVAP. The mean annual cycle has been removed ineach case
748 Trenberth et al.: Trends and variability in column-integrated atmosphere water vapor
over 0.9, and are especially strong in the Pacific intertropical convergence zone (ITCZ) and South Pacificconvergence zone (SPCZ) regions that are greatly im-pacted by ENSO. Lower correlations of order 0.85 arefound in some midlatitude storm track regions. Corre-lations between ERA-40 and NVAP are generally highand similar in magnitude to those with SSM/I over theoceans, but values drop below 0.5 over many parts of the
land, in particular those areas with missing data inFig. 1 and with high elevations. This includes much ofthe Southern Hemisphere land except for Australia.Whereas the ERA-40 analysis has full accounting of themountain topography, such as the Himalayas andAndes, the NVAP analysis does not, and interpolationof TOVS retrievals into these regions is a source ofproblems (Trenberth and Guillemot 1995).
Fig. 5 Annual averages of precipitable water for 1988–2001 (mm) from ERA-40 and differences with NCEP, SSM/I and NVAP
Fig. 6 Standard deviation of precipitable water monthly anomalies from ERA-40 for 1988–2001, and differences with NCEP, SSM/I andNVAP
Trenberth et al.: Trends and variability in column-integrated atmosphere water vapor 749
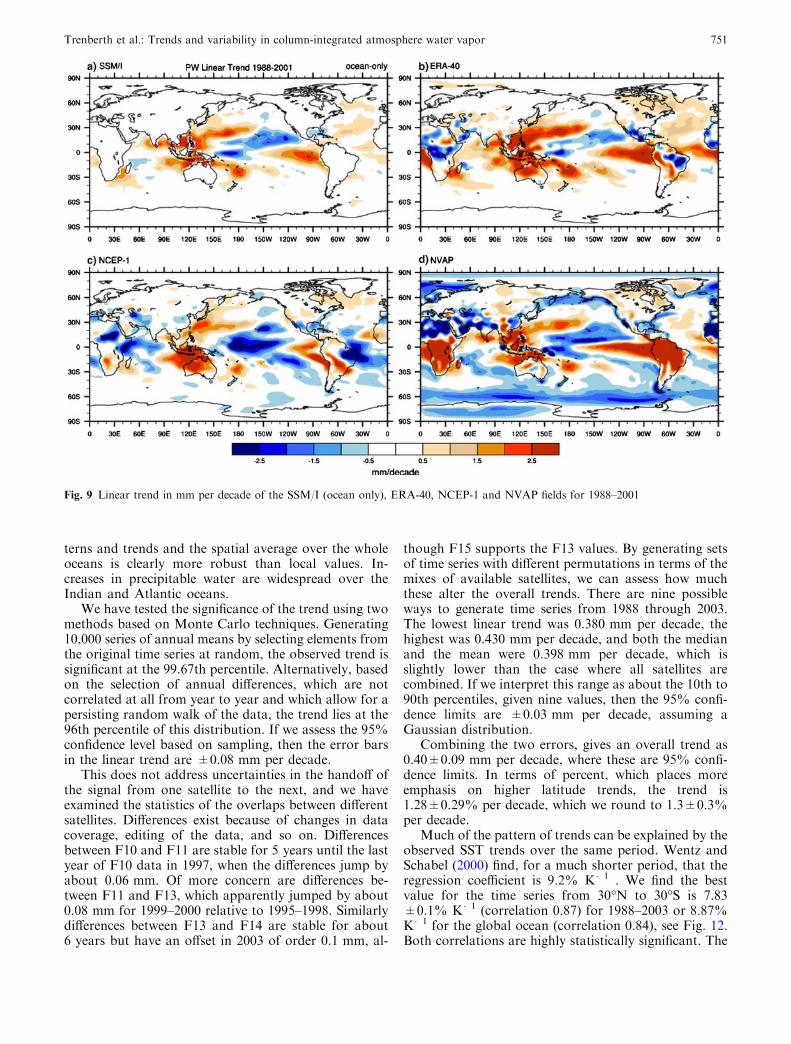
As noted in the introduction, trends in water vaporare of considerable interest but are perhaps the mostchallenging to obtain with reliability. Maps of lineartrends (Fig. 9) reveal similarities in the gross patterns,suggesting an influence of ENSO in the Pacific. NVAPlinear trends are exaggerated where they agree withothers, but strong negative trends are evident over thesouthern oceans and land areas with poor data, includ-ing northern Africa and southern Asia. The NCEPtrends are more negative than others in most places,although the patterns appear related. Closer examina-tion reveals that the main discrepancies are over theoceans. There is quite good agreement between ERA-40and NCEP over most land areas except Africa, i.e. inareas where values are controlled by radiosondes.
From the above, it is clear that, aside from SSM/I,there appear to be substantial problems in all the otherdatasets with regard to trends and low frequency vari-ability over the oceans. The linear trends from 1988 to2001 based on SSM/I over the oceans (Fig. 4) showoverall positive trends of 0.37 mm per decade or about
1.3% per decade. Fairly large negative excursions in1988–1989 perhaps associated with the 1988–1989 LaNina, that are later followed by large positive excursionsin 1997–1998 associated with the huge El Nino event,influence the linear trends somewhat. The spatial struc-ture of the trends also suggests an ENSO influence.However, this association is complex and amplified inthe Sect. 3.5.
3.4 SSM/I trends from 1988 to 2003
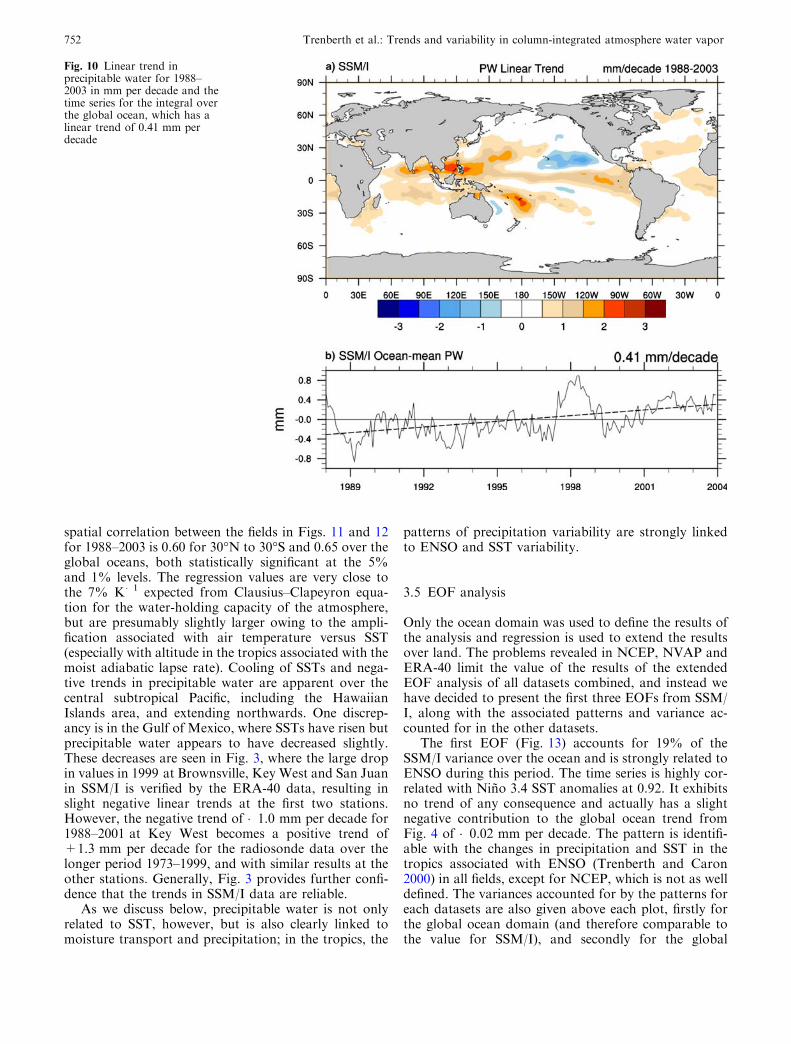
For RSS SSM/I, we can update the time periodthrough 2003 (which was not possible for ERA-40products) (Figs. 10, 11) and the trends are somewhatmore uniform. The linear trend over the oceans as awhole is 0.41 mm per decade or about 1.3% per dec-ade. The normalization to get percentage trends wasdone by the local monthly mean, and then these wereaveraged to get the area mean, so there is no simpleconversion factor. Hence, the two Figs. 10 and 11complement each other and give different perspectiveson the trends. Figure 10 emphasizes the tropics while inFig. 11 the response is more uniformly distributed overthe oceans, and accentuated near sea-ice changes in theNorth Atlantic. The time series are very similar (cor-relation 0.93). Extending the record by 2 years hassomewhat diminished the ENSO imprint on the pat-
Fig. 7 Latitude-time series for 1988–2001 of anomalies of zonalmean differences between ERA-40 and SSM/I for the oceans (top)and NVAP globally (middle), and between NVAP and SSM/I forthe oceans (bottom) in mm
Fig. 8 Correlations of monthly anomalies of precipitable waterbetween ERA-40 and SSM/I (top) and NVAP (bottom) for 1988 to2001
750 Trenberth et al.: Trends and variability in column-integrated atmosphere water vapor
terns and trends and the spatial average over the wholeoceans is clearly more robust than local values. In-creases in precipitable water are widespread over theIndian and Atlantic oceans.
We have tested the significance of the trend using twomethods based on Monte Carlo techniques. Generating10,000 series of annual means by selecting elements fromthe original time series at random, the observed trend issignificant at the 99.67th percentile. Alternatively, basedon the selection of annual differences, which are notcorrelated at all from year to year and which allow for apersisting random walk of the data, the trend lies at the96th percentile of this distribution. If we assess the 95%confidence level based on sampling, then the error barsin the linear trend are ±0.08 mm per decade.
This does not address uncertainties in the handoff ofthe signal from one satellite to the next, and we haveexamined the statistics of the overlaps between differentsatellites. Differences exist because of changes in datacoverage, editing of the data, and so on. Differencesbetween F10 and F11 are stable for 5 years until the lastyear of F10 data in 1997, when the differences jump byabout 0.06 mm. Of more concern are differences be-tween F11 and F13, which apparently jumped by about0.08 mm for 1999–2000 relative to 1995–1998. Similarlydifferences between F13 and F14 are stable for about6 years but have an offset in 2003 of order 0.1 mm, al-
though F15 supports the F13 values. By generating setsof time series with different permutations in terms of themixes of available satellites, we can assess how muchthese alter the overall trends. There are nine possibleways to generate time series from 1988 through 2003.The lowest linear trend was 0.380 mm per decade, thehighest was 0.430 mm per decade, and both the medianand the mean were 0.398 mm per decade, which isslightly lower than the case where all satellites arecombined. If we interpret this range as about the 10th to90th percentiles, given nine values, then the 95% confi-dence limits are ±0.03 mm per decade, assuming aGaussian distribution.
Combining the two errors, gives an overall trend as0.40±0.09 mm per decade, where these are 95% confi-dence limits. In terms of percent, which places moreemphasis on higher latitude trends, the trend is1.28±0.29% per decade, which we round to 1.3±0.3%per decade.
Much of the pattern of trends can be explained by theobserved SST trends over the same period. Wentz andSchabel (2000) find, for a much shorter period, that theregression coefficient is 9.2% K�1 . We find the bestvalue for the time series from 30�N to 30�S is 7.83±0.1% K�1 (correlation 0.87) for 1988–2003 or 8.87%K�1 for the global ocean (correlation 0.84), see Fig. 12.Both correlations are highly statistically significant. The
Fig. 9 Linear trend in mm per decade of the SSM/I (ocean only), ERA-40, NCEP-1 and NVAP fields for 1988–2001
Trenberth et al.: Trends and variability in column-integrated atmosphere water vapor 751
spatial correlation between the fields in Figs. 11 and 12for 1988–2003 is 0.60 for 30�N to 30�S and 0.65 over theglobal oceans, both statistically significant at the 5%and 1% levels. The regression values are very close tothe 7% K�1 expected from Clausius–Clapeyron equa-tion for the water-holding capacity of the atmosphere,but are presumably slightly larger owing to the ampli-fication associated with air temperature versus SST(especially with altitude in the tropics associated with themoist adiabatic lapse rate). Cooling of SSTs and nega-tive trends in precipitable water are apparent over thecentral subtropical Pacific, including the HawaiianIslands area, and extending northwards. One discrep-ancy is in the Gulf of Mexico, where SSTs have risen butprecipitable water appears to have decreased slightly.These decreases are seen in Fig. 3, where the large dropin values in 1999 at Brownsville, Key West and San Juanin SSM/I is verified by the ERA-40 data, resulting inslight negative linear trends at the first two stations.However, the negative trend of �1.0 mm per decade for1988–2001 at Key West becomes a positive trend of+1.3 mm per decade for the radiosonde data over thelonger period 1973–1999, and with similar results at theother stations. Generally, Fig. 3 provides further confi-dence that the trends in SSM/I data are reliable.
As we discuss below, precipitable water is not onlyrelated to SST, however, but is also clearly linked tomoisture transport and precipitation; in the tropics, the
patterns of precipitation variability are strongly linkedto ENSO and SST variability.
3.5 EOF analysis
Only the ocean domain was used to define the results ofthe analysis and regression is used to extend the resultsover land. The problems revealed in NCEP, NVAP andERA-40 limit the value of the results of the extendedEOF analysis of all datasets combined, and instead wehave decided to present the first three EOFs from SSM/I, along with the associated patterns and variance ac-counted for in the other datasets.
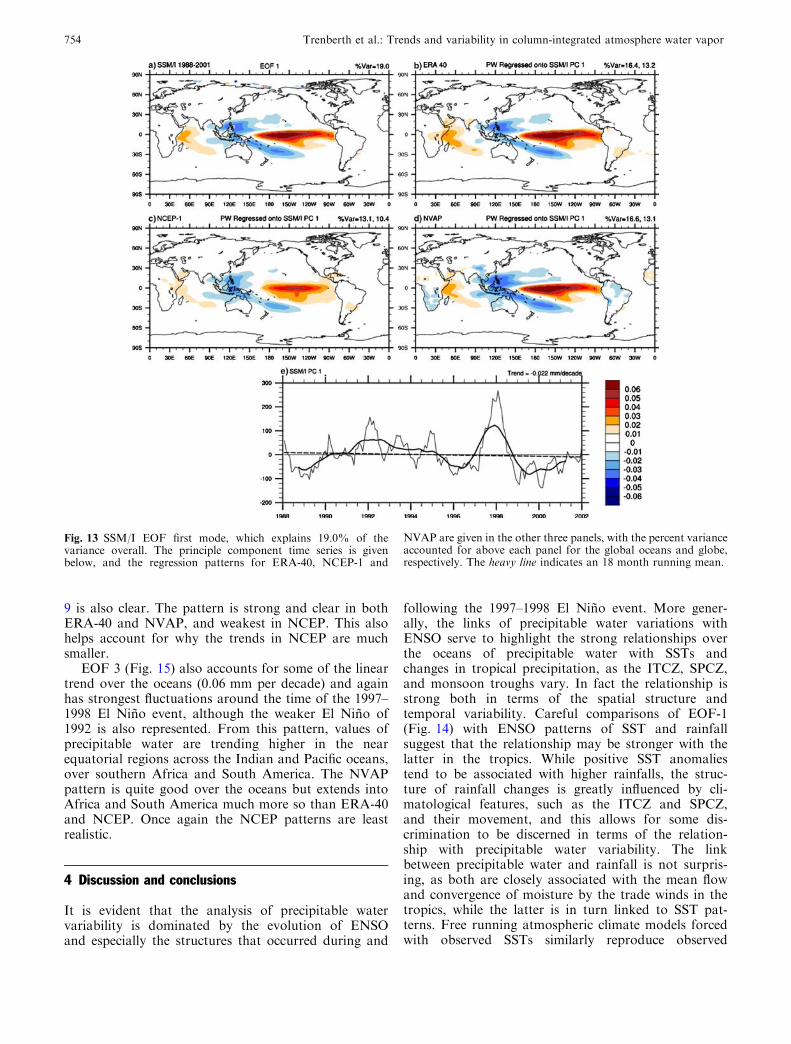
The first EOF (Fig. 13) accounts for 19% of theSSM/I variance over the ocean and is strongly related toENSO during this period. The time series is highly cor-related with Nino 3.4 SST anomalies at 0.92. It exhibitsno trend of any consequence and actually has a slightnegative contribution to the global ocean trend fromFig. 4 of �0.02 mm per decade. The pattern is identifi-able with the changes in precipitation and SST in thetropics associated with ENSO (Trenberth and Caron2000) in all fields, except for NCEP, which is not as welldefined. The variances accounted for by the patterns foreach datasets are also given above each plot, firstly forthe global ocean domain (and therefore comparable tothe value for SSM/I), and secondly for the global
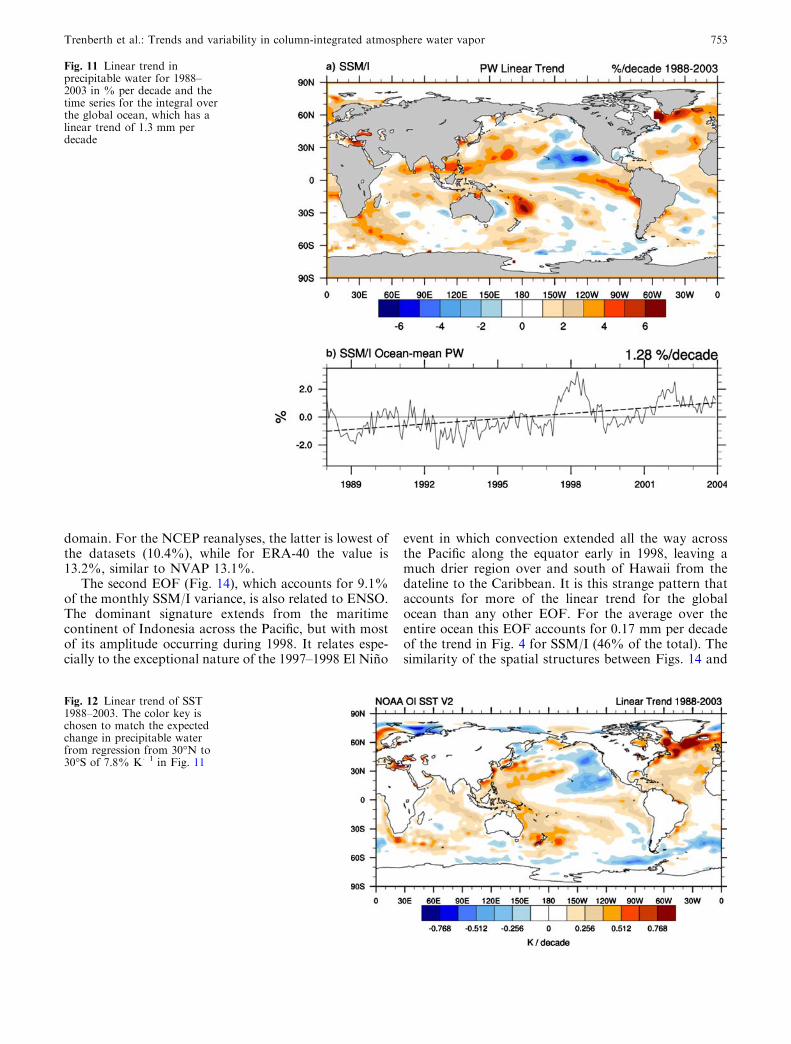
Fig. 10 Linear trend inprecipitable water for 1988–2003 in mm per decade and thetime series for the integral overthe global ocean, which has alinear trend of 0.41 mm perdecade
752 Trenberth et al.: Trends and variability in column-integrated atmosphere water vapor
domain. For the NCEP reanalyses, the latter is lowest ofthe datasets (10.4%), while for ERA-40 the value is13.2%, similar to NVAP 13.1%.
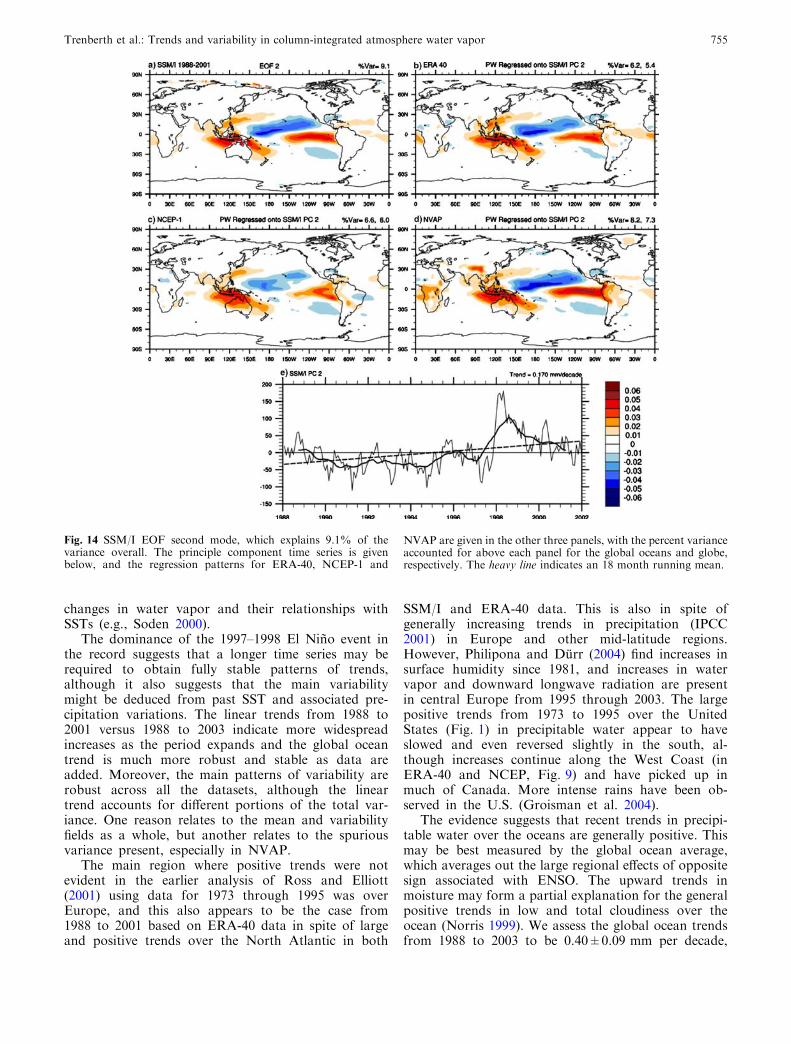
The second EOF (Fig. 14), which accounts for 9.1%of the monthly SSM/I variance, is also related to ENSO.The dominant signature extends from the maritimecontinent of Indonesia across the Pacific, but with mostof its amplitude occurring during 1998. It relates espe-cially to the exceptional nature of the 1997–1998 El Nino
event in which convection extended all the way acrossthe Pacific along the equator early in 1998, leaving amuch drier region over and south of Hawaii from thedateline to the Caribbean. It is this strange pattern thataccounts for more of the linear trend for the globalocean than any other EOF. For the average over theentire ocean this EOF accounts for 0.17 mm per decadeof the trend in Fig. 4 for SSM/I (46% of the total). Thesimilarity of the spatial structures between Figs. 14 and
Fig. 11 Linear trend inprecipitable water for 1988–2003 in % per decade and thetime series for the integral overthe global ocean, which has alinear trend of 1.3 mm perdecade
Fig. 12 Linear trend of SST1988–2003. The color key ischosen to match the expectedchange in precipitable waterfrom regression from 30�N to30�S of 7.8% K�1 in Fig. 11
Trenberth et al.: Trends and variability in column-integrated atmosphere water vapor 753
9 is also clear. The pattern is strong and clear in bothERA-40 and NVAP, and weakest in NCEP. This alsohelps account for why the trends in NCEP are muchsmaller.
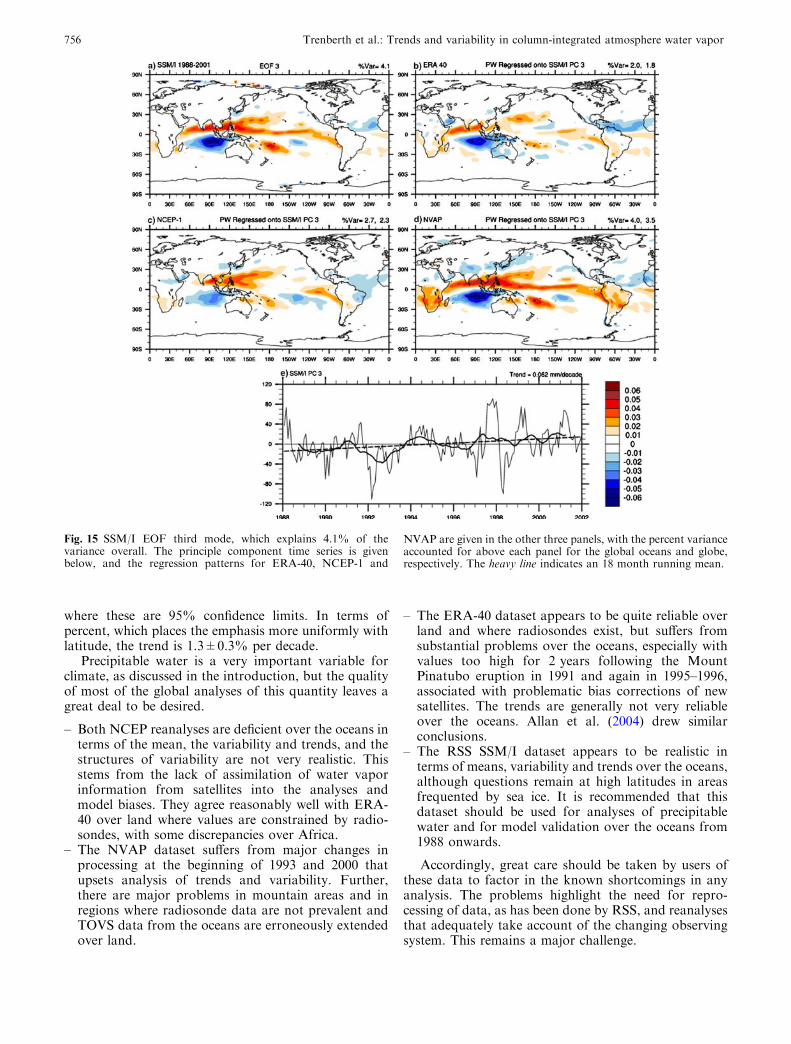
EOF 3 (Fig. 15) also accounts for some of the lineartrend over the oceans (0.06 mm per decade) and againhas strongest fluctuations around the time of the 1997–1998 El Nino event, although the weaker El Nino of1992 is also represented. From this pattern, values ofprecipitable water are trending higher in the nearequatorial regions across the Indian and Pacific oceans,over southern Africa and South America. The NVAPpattern is quite good over the oceans but extends intoAfrica and South America much more so than ERA-40and NCEP. Once again the NCEP patterns are leastrealistic.
4 Discussion and conclusions
It is evident that the analysis of precipitable watervariability is dominated by the evolution of ENSOand especially the structures that occurred during and
following the 1997–1998 El Nino event. More gener-ally, the links of precipitable water variations withENSO serve to highlight the strong relationships overthe oceans of precipitable water with SSTs andchanges in tropical precipitation, as the ITCZ, SPCZ,and monsoon troughs vary. In fact the relationship isstrong both in terms of the spatial structure andtemporal variability. Careful comparisons of EOF-1(Fig. 14) with ENSO patterns of SST and rainfallsuggest that the relationship may be stronger with thelatter in the tropics. While positive SST anomaliestend to be associated with higher rainfalls, the struc-ture of rainfall changes is greatly influenced by cli-matological features, such as the ITCZ and SPCZ,and their movement, and this allows for some dis-crimination to be discerned in terms of the relation-ship with precipitable water variability. The linkbetween precipitable water and rainfall is not surpris-ing, as both are closely associated with the mean flowand convergence of moisture by the trade winds in thetropics, while the latter is in turn linked to SST pat-terns. Free running atmospheric climate models forcedwith observed SSTs similarly reproduce observed
Fig. 13 SSM/I EOF first mode, which explains 19.0% of thevariance overall. The principle component time series is givenbelow, and the regression patterns for ERA-40, NCEP-1 and
NVAP are given in the other three panels, with the percent varianceaccounted for above each panel for the global oceans and globe,respectively. The heavy line indicates an 18 month running mean.
754 Trenberth et al.: Trends and variability in column-integrated atmosphere water vapor
changes in water vapor and their relationships withSSTs (e.g., Soden 2000).
The dominance of the 1997–1998 El Nino event inthe record suggests that a longer time series may berequired to obtain fully stable patterns of trends,although it also suggests that the main variabilitymight be deduced from past SST and associated pre-cipitation variations. The linear trends from 1988 to2001 versus 1988 to 2003 indicate more widespreadincreases as the period expands and the global oceantrend is much more robust and stable as data areadded. Moreover, the main patterns of variability arerobust across all the datasets, although the lineartrend accounts for different portions of the total var-iance. One reason relates to the mean and variabilityfields as a whole, but another relates to the spuriousvariance present, especially in NVAP.
The main region where positive trends were notevident in the earlier analysis of Ross and Elliott(2001) using data for 1973 through 1995 was overEurope, and this also appears to be the case from1988 to 2001 based on ERA-40 data in spite of largeand positive trends over the North Atlantic in both
SSM/I and ERA-40 data. This is also in spite ofgenerally increasing trends in precipitation (IPCC2001) in Europe and other mid-latitude regions.However, Philipona and Durr (2004) find increases insurface humidity since 1981, and increases in watervapor and downward longwave radiation are presentin central Europe from 1995 through 2003. The largepositive trends from 1973 to 1995 over the UnitedStates (Fig. 1) in precipitable water appear to haveslowed and even reversed slightly in the south, al-though increases continue along the West Coast (inERA-40 and NCEP, Fig. 9) and have picked up inmuch of Canada. More intense rains have been ob-served in the U.S. (Groisman et al. 2004).
The evidence suggests that recent trends in precipi-table water over the oceans are generally positive. Thismay be best measured by the global ocean average,which averages out the large regional effects of oppositesign associated with ENSO. The upward trends inmoisture may form a partial explanation for the generalpositive trends in low and total cloudiness over theocean (Norris 1999). We assess the global ocean trendsfrom 1988 to 2003 to be 0.40±0.09 mm per decade,
Fig. 14 SSM/I EOF second mode, which explains 9.1% of thevariance overall. The principle component time series is givenbelow, and the regression patterns for ERA-40, NCEP-1 and
NVAP are given in the other three panels, with the percent varianceaccounted for above each panel for the global oceans and globe,respectively. The heavy line indicates an 18 month running mean.
Trenberth et al.: Trends and variability in column-integrated atmosphere water vapor 755
where these are 95% confidence limits. In terms ofpercent, which places the emphasis more uniformly withlatitude, the trend is 1.3±0.3% per decade.
Precipitable water is a very important variable forclimate, as discussed in the introduction, but the qualityof most of the global analyses of this quantity leaves agreat deal to be desired.
– Both NCEP reanalyses are deficient over the oceans interms of the mean, the variability and trends, and thestructures of variability are not very realistic. Thisstems from the lack of assimilation of water vaporinformation from satellites into the analyses andmodel biases. They agree reasonably well with ERA-40 over land where values are constrained by radio-sondes, with some discrepancies over Africa.
– The NVAP dataset suffers from major changes inprocessing at the beginning of 1993 and 2000 thatupsets analysis of trends and variability. Further,there are major problems in mountain areas and inregions where radiosonde data are not prevalent andTOVS data from the oceans are erroneously extendedover land.
– The ERA-40 dataset appears to be quite reliable overland and where radiosondes exist, but suffers fromsubstantial problems over the oceans, especially withvalues too high for 2 years following the MountPinatubo eruption in 1991 and again in 1995–1996,associated with problematic bias corrections of newsatellites. The trends are generally not very reliableover the oceans. Allan et al. (2004) drew similarconclusions.
– The RSS SSM/I dataset appears to be realistic interms of means, variability and trends over the oceans,although questions remain at high latitudes in areasfrequented by sea ice. It is recommended that thisdataset should be used for analyses of precipitablewater and for model validation over the oceans from1988 onwards.
Accordingly, great care should be taken by users ofthese data to factor in the known shortcomings in anyanalysis. The problems highlight the need for repro-cessing of data, as has been done by RSS, and reanalysesthat adequately take account of the changing observingsystem. This remains a major challenge.
Fig. 15 SSM/I EOF third mode, which explains 4.1% of thevariance overall. The principle component time series is givenbelow, and the regression patterns for ERA-40, NCEP-1 and
NVAP are given in the other three panels, with the percent varianceaccounted for above each panel for the global oceans and globe,respectively. The heavy line indicates an 18 month running mean.
756 Trenberth et al.: Trends and variability in column-integrated atmosphere water vapor
Acknowledgements This research is partially sponsored by theNOAA CLIVAR and CCDD programs under grantNA17GP1376. The ERA-40 data used were provided by ECMWF.SSM/I data are produced by Remote Sensing Systems and spon-sored by the NASA Earth Science REASoN DISCOVER Project.Data are available at http://www.remss.com. We thank Brian So-den and Adrian Simmons for comments.
References
Allan RP, Ringer MA, Pamment JA, Slingo A (2004) Simulation ofthe Earth’s radiation budget by the European Centre forMedium-Range Weather Forecasts 40-year reanalysis (ERA40).J Geophys Res 109:D18107. DOI 10.1029/2004JD004816
Andrae U, Sokka N, Onogi K (2004) The radiosonde temperaturebias corrections used in ERA-40. ERA-40 Project Report Series15, 34 pp
Elliott WP, Gaffen DJ, (1991) On the utility of radiosonde archivesfor climate studies. Bull Amer Meteorol Soc 72:1507–1520
Elliott WP, Ross RJ, Blackmore WH (2002) Recent changes inNWS upper-air observations with emphasis on changes fromVIZ to Vaisala radiosondes. Bull Amer Meteorol Soc 83:1003–1017
Greenwald TJ, Stephens GL, Von der Haar TH, Jackson DL(1993) A physical retrieval of cloud liquid water over the globaloceans using SSM/I measurements. J Geophys Res 98:18471–18488
Ya GP, Knight RW, Karl TR, Easterling DR, Sun BM, LawrimoreJH (2004) Contemporary changes of the hydrological cycle overthe contiguous United States: trends derived from in situobservations. J Hydrometeorol 5:64–85
Guichard F, Parsons D, Miller E (2000) Thermodynamic andradiative impact of the correction of sounding humidity bias inthe tropics. J Climate 13:3611–3624
Held IM, Soden BJ (2000) Water vapor feedback and globalwarming. Ann Rev Energy Environ 25:441–475
Hense A, Krahe P, Flohn H (1988) Recent fluctuations of tropo-spheric temperature and water vapour content in the tropics.Meteorol Atmos Phys 38:215–227
IPCC (Intergovernmental Panel on Climate Change) (2001) Cli-mate Change 2001. In: Houghton JT et al (eds) The scientificbasis. Cambridge University Press, Cambridge, 881pp
Kalnay E, Kanamitsu M, Kistler R, Collins W, Deaven D, GandinL, Iredell M, Saha S, White G, Woollen J, Zhu Y, Chelliah M,Ebisuzaki W, Higgins W, Janowiak J, Mo K-C, Ropelewski C,Leetmaa A, Reynolds R, Jenne R, Joseph D (1996) The NCEP/NCAR reanalysis project. Bull Amer Meteorol Soc 77:437–471
Kanamitsu M, Ebisuzaki W, Woolen J, Yang S-K, Hnilo JJ, Fi-orino M, Potter GL (2002) NCEP-DOE AMIP-II reanalysis(R-2). Bull Amer Meteorol Soc 83:1631–1643
Kiehl JT, Trenberth KE (1997) Earth’s annual global mean energybudget. Bull Amer Meteorol Soc 78:197–208
Lanzante JR, Klein SA, Seidel DJ (2003) Temporal homogeniza-tion of monthly radiosonde temperature data. Pt I: methodol-ogy. J Climate 16:224–240
Liu WT, Tang W, Wentz F (1992) Precipitable water and surfacehumidity over global oceans from Special Sensor MicrowaveImager and European Centre for Medium Range WeatherForecasts. J Geophys Res 97:2251–2264
Marquart S, Ponater M, Mager F, Sausen R (2003) Futuredevelopment of contrail cover, optical depth, and radiativeforcing: impacts of increasing air traffic and climate change.J Climate 16:2890–2904
Norris JR (1999) On trends and possible artifacts in global oceancloud cover between 1952 and 1995. J Climate 12:1864–1870
Philipona R, Durr B (2004) Greenhouse forcing outweighsdecreasing solar radiation driving rapid temperature rise overland. Geophys Res Lett 31:L22208. DOI:10.1029/2004GL020937
Randel DL, Vonder Haar TH, Ringerud MA, Stephens GL,Greenwald TJ, Combs CL (1996) A new global water vapordataset. Bull Amer Meteorol Soc 77:1233–1246
Ross RJ, Elliott WP (1996) Tropospheric water vapor climatologyand trends over North America: 1973–93. J Climate 9:3561–3574
RossRJ,ElliottWP (2001)Radiosonde-basedNorthernHemispheretropospheric water vapor trends. J Climate 14:1602–1611
Simpson JJ, Berg JS, Koblinsky CJ, Hufford GL, Beckley B (2001)The NVAP global water vapor dataset: independent cross-comparison and multiyear variability. Remote Sensing Environ76:112–129
Soden BJ (2000) The sensitivity of the tropical hydrological cycle toENSO. J Climate 13:538–549
Soden BJ, Wetherald RT, Stenchikov GL, Robock A (2002) Glo-bal cooling after the eruption of Mount Pintubo: a test of cli-mate feedback by water vapor. Science 296:727–730
Sohn B-J, Smith EA (2003) Explaining sources of discrepancy inSSM/I water vapor algorithms. J Climate 16:3229–3255
Trenberth KE (1995) Atmospheric circulation climate changes.Clim Change 31:427–453
Trenberth KE (1999) Atmospheric moisture recycling: role ofadvection and local evaporation. J Climate 12:1368–1381
Trenberth KE, Caron JM (2000) The southern oscillation revisited:sea level pressures, surface temperatures and precipitation.J Climate 13:4358–4365
Trenberth KE, Guillemot CJ (1995) Evaluation of the globalatmospheric moisture budget as seen from analyses. J Climate8:2255–2272
Trenberth KE, Guillemot CJ (1998) Evaluation of the atmosphericmoisture and hydrological cycle in the NCEP/NCAR reanaly-ses. Clim Dyn 14:213–231
Trenberth KE, Smith L (2005) The mass of the atmosphere: aconstraint on global analyses. J Climate 18:86–875
Trenberth KE, Stepaniak DP (2003a) Co-variability of componentsof poleward atmospheric energy transports on seasonal andinterannual timescales. J Climate 16:3690–3704
Trenberth KE, Stepaniak DP (2003b) Seamless poleward atmo-spheric energy transports and implications for the Hadley cir-culation. J Climate 16:3705–3721
Trenberth KE, Stepaniak DP, Caron JM (2002) Preliminary eval-uation of vertically-integrated fluxes of moisture and energyfrom ERA-40. Workshop on reanalysis. ECMWF, Reading, 5–9 November 2001. ERA-40 Proj Rep Ser 3:265–266
Trenberth KE, Dai A, Rasmussen RM, Parsons DB (2003) Thechanging character of precipitation. Bull Amer Meteorol Soc84:1205–1217
Uppala SM, Kallberg PW, Simmons AJ, Andrae U, da CostaBechtold V, Fiorino M, Gibson JK, Haseler J, Hernandez A,Kelly GA, Li X, Onogi K, Saarinen S, Sokka N, Allan RP,Andersson E, Arpe K, Balmaseda MA, Beljaars ACM, van deBerg L, Bidlot J, Bormann N, Caires S, Dethof A, DragosavacM, Fisher M, Fuentes M, Hagemann S, Holm E, Hoskins BJ,Isaksen L, Janssen PAEM, McNally AP, Mahfouf J-F, JenneR, Morcrette J-J, Rayner NA, Saunders RW, Simon P, Sterl A,Trenberth KE, Untch A, Vasiljevic D, Viterbo P, Woollen J(2005) The ERA-40 reanalysis. Quart J Roy Meteor Soc(Submitted)
Von der Haar T et al (2003) Continuation of the NVAP globalwater vapor data sets for Pathfinder science analysis Scienceand Technology Corp. STC Technical Report 3333, 44 pp.http://eosweb.larc.nasa.gov/PRODOCS/nvap/sci_tech_re-port_3333.pdf
Wang J, Cole HL, Carlson DJ, Miller ER, Beierle K, PaukkunenA, Lane TK (2002) Corrections of humidity measurementerrors from the Vaisala RS80 radiosonde—applicationto TOGA-COARE data. J Atmos Ocean Technol 19:981–1002
Wang J, Carlson DJ, Parsons DB, Hock TF, Lauritsen D, ColeHL, Beierle K, Chamberlain E (2003) Performance of oper-ational radiosonde humidity sensors in direct comparison
Trenberth et al.: Trends and variability in column-integrated atmosphere water vapor 757
with a chilled mirror dew-point hygrometer and its climateimplication. Geophys Res Lett 30:1860. DOI 10.1029/2003GL016985
Wentz FJ (1997) A well-calibrated ocean algorithm for specialsensor microwave/imager. J Geophys Res 102(C4):8703–8718.DOI 10.1029/96JC01751
Wentz FJ, Schabel M (2000) Precise climate monitoring usingcomplementary satellite data sets. Nature 403:414–416
Zhai P, Eskridge RE (1997) Atmospheric water vapor over China.J Climate 10:2643–2652
Zveryaev II, Chu P-S (2003) Recent climate changes in precipitablewater in the global tropics as revealed in National Centers forEnvironmental Prediction/National Center for AtmosphericResearch reanalysis. J Geophys Res 108(D10):4311. DOI10.1029/2002JD2476
758 Trenberth et al.: Trends and variability in column-integrated atmosphere water vapor