44
Key Australian infrastructure statistics 2016 bitre

Key Australian infrastructure statistics 2016
bitre
© Commonwealth of Australia 2016ISSN: 2207-0974 (Print) • ISSN: 2007-0982 (Online)ISBN: 978-1-925531-01-5 • December 2016/INFRA3074Ownership of intellectual property rights in this publication: Unless otherwise noted, copyright (and any other intellectual property rights, if any) in this publication is owned by the Commonwealth of Australia (referred to below as the Commonwealth).Disclaimer: The material contained in this publication is made available on the understanding that the Commonwealth is not providing professional advice, and that users exercise their own skill and care with respect to its use, and seek independent advice if necessary.The Commonwealth makes no representations or warranties as to the contents or accuracy of the information contained in this publication. To the extent permitted by law, the Commonwealth disclaims liability to any person or organisation in respect of anything done, or omitted to be done, in reliance upon information contained in this publication.Creative Commons licence: With the exception of (a) the Coat of Arms; and (b) the Department of Infrastructure’s photos and graphics, copyright in this publication is licensed under a Creative Commons Attribution 3.0 Australia Licence.Creative Commons Attribution 3.0 Australia Licence is a standard form licence agreement that allows you to copy, communicate and adapt this publication provided that you attribute the work to the Commonwealth and abide by the other licence terms. A summary of the licence terms is available from http://creativecommons.org/licenses/by/3.0/au/deed.en. The full licence terms are available from http://creativecommons.org/licenses/by/3.0/au/legalcode.Use of the Coat of Arms: The Department of the Prime Minister and Cabinet sets the terms under which the Coat of Arms is used. Please refer to the Department’s Commonwealth Coat of Arms and Government Branding web page http://www.dpmc.gov.au/guidelines/index.cfm#brand and in particular, the Commonwealth Coat of Arms – Information and Guidelines publication.Acknowledgement: The booklet was compiled by Natalie Fisher at the Bureau of Infrastructure, Transport and Regional Economics.An appropriate citation for this report is: Bureau of Infrastructure, Transport and Regional Economics (BITRE), 2016, Key Australian infrastructure statistics 2016, Canberra ACT.
ContentsAbout this booklet ......................................................................................................1About BITRE ................................................................................................................1Facts and figures ..........................................................................................................2Infrastructure and the economy ..............................................................................6Transport ......................................................................................................................8
Road .........................................................................................................................8
Rail ........................................................................................................................ 12
Aviation ................................................................................................................ 16
Shipping ................................................................................................................ 20
Safety .................................................................................................................... 24
Energy ......................................................................................................................... 26Communication ........................................................................................................ 30Water .......................................................................................................................... 34Abbreviations ............................................................................................................ 38

About this bookletKey Australian infrastructure statistics provides a snapshot of a diverse range of data. Statistics are presented for the four main types of economic infrastructure: transport, energy, communications and water. The transport chapter is split by mode and presents data on infrastructure assets and trends in passenger travel, freight movement and safety. The energy, communications and water chapters include statistics on infrastructure expenditure, assets, supply, pricing and usage. The statistics are drawn from the Bureau of Infrastructure, Transport and Regional Economics’ Australian Infrastructure Statistics Yearbook 2016.
About BITREThe Bureau of Infrastructure, Transport and Regional Economics (BITRE) provides economic analysis, research and statistics on infrastructure, transport and regional development issues to inform Australian Government policy development and wider community understanding.
BITRE is part of the Policy and Research Division of the Department of Infrastructure and Regional Development.
• 1 •
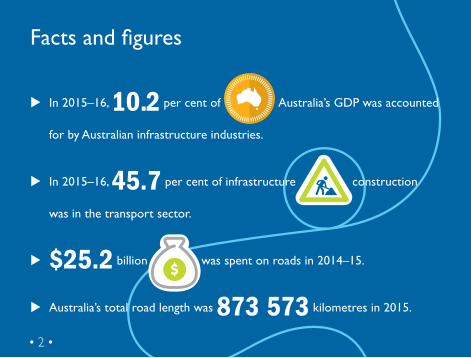
Facts and figures
u In 2015–16, 10.2 per cent of
Australia’s GDP was accounted
for by Australian infrastructure industries.
u In 2015–16, 45.7 per cent of infrastructure construction
was in the transport sector.
u $25.2 billion
was spent on roads in 2014–15.
u Australia’s total road length was 873 573 kilometres in 2015.
• 2 •
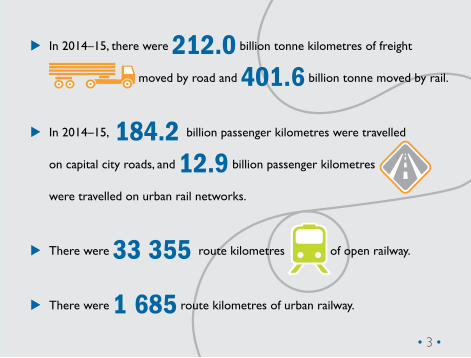
u In 2014–15, there were 212.0 billion tonne kilometres of freight
moved by road and 401.6 billion tonne moved by rail.
u In 2014–15, 184.2 billion passenger kilometres were travelled
on capital city roads, and 12.9 billion passenger kilometres
were travelled on urban rail networks.
u There were 33 355 route kilometres of open railway.
u There were 1 685 route kilometres of urban railway.
• 3 •
u
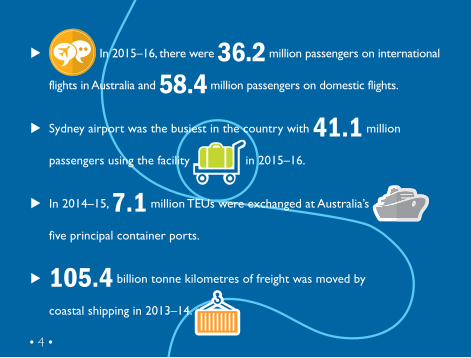
In 2015–16, there were 36.2 million passengers on international
flights in Australia and 58.4 million passengers on domestic flights.
u Sydney airport was the busiest in the country with 41.1 million
passengers using the facility in 2015–16.
u In 2014–15, 7.1 million TEUs were exchanged at Australia’s
five principal container ports.
u 105.4 billion tonne kilometres of freight was moved by
coastal shipping in 2013–14.
• 4 •
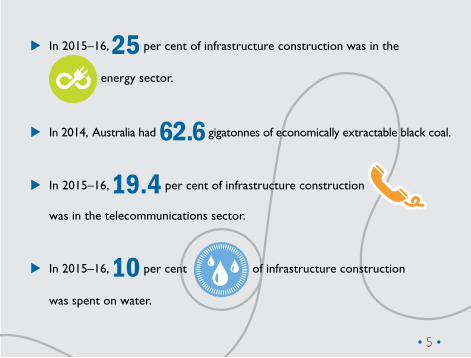
u In 2015–16, 25 per cent of infrastructure construction was in the
energy sector.
u In 2014, Australia had 62.6 gigatonnes of economically extractable black coal.
u In 2015–16, 19.4 per cent of infrastructure construction
was in the telecommunications sector.
u In 2015–16, 10 per cent of infrastructure construction
was spent on water.
• 5 •
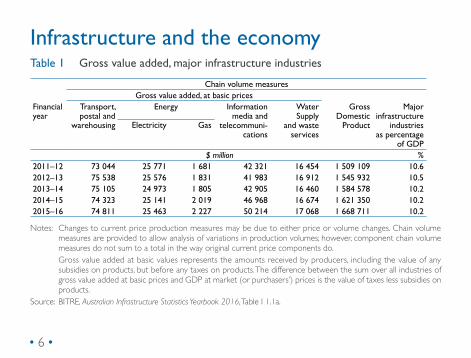
Infrastructure and the economyTable 1 Gross value added, major infrastructure industries
Chain volume measuresGross value added, at basic prices
Financial year
Transport, postal and
warehousing
Energy Information media and
telecommuni-cations
Water Supply
and waste services
Gross Domestic
Product
Major infrastructure
industries as percentage
of GDP
Electricity Gas
$ million %2011–12 73 044 25 771 1 681 42 321 16 454 1 509 109 10.62012–13 75 538 25 576 1 831 41 983 16 912 1 545 932 10.52013–14 75 105 24 973 1 805 42 905 16 460 1 584 578 10.22014–15 74 323 25 141 2 019 46 968 16 674 1 621 350 10.22015–16 74 811 25 463 2 227 50 214 17 068 1 668 711 10.2
Notes: Changes to current price production measures may be due to either price or volume changes. Chain volume measures are provided to allow analysis of variations in production volumes; however, component chain volume measures do not sum to a total in the way original current price components do.
Gross value added at basic values represents the amounts received by producers, including the value of any subsidies on products, but before any taxes on products. The difference between the sum over all industries of gross value added at basic prices and GDP at market (or purchasers’) prices is the value of taxes less subsidies on products.
Source: BITRE, Australian Infrastructure Statistics Yearbook 2016, Table I 1.1a.
• 6 •

Figure 1 Infrastructure construction activity, adjusted by chain volume index
Energy WaterTelecommunicationsTransport
$ m
illio
n
0
5 000
10 000
15 000
20 000
25 000
30 000
35 000
40 000
2015
–16
2014
–15
2013
–14
2012
–13
2011
–12
2010
–11
2009
–10
2008
–09
2007
–08
2006
–07
2005
–06
2004
–05
2003
–04
2002
–03
2001
–02
2000
–01
1999
–00
1998
–99
1997
–98
1996
–97
1995
–96
1994
–95
1993
–94
1992
–93
1991
–92
1990
–91
1989
–90
1988
–89
1987
–88
Source: BITRE, Australian Infrastructure Statistics Yearbook 2016, Figure 12.
• 7 •
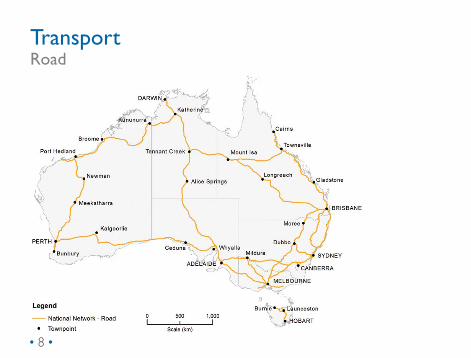
TransportRoadFigure 2 National road network
• 8 •

Table 2 Total road expenditure by level of government, 2014–15
NSW VIC QLD SA WA TAS NT ACT Other Total$ million (constant 2014–15 prices)
Commonwealth 1 801.0 536.3 1 142.7 196.8 752.9 104.8 132.7 85.9 7.9 4 760.9State/territory 3 920.1 2 483.9 3 810.7 316.0 1 421.4 157.0 187.1 177.8 na 12 474.0Local 1 762.7 1 198.5 2 065.1 366.9 757.8 142.1 nes na na 6 229.9All government 7 483.7 4 218.7 7 018.6 879.8 2 932.1 403.9 265.2 255.0 7.9 23 464.8Public and private sector
7 948.7 4 233.7 7 391.6 909.8 3 052.1 426.9 265.2 282.0 7.9 25 244.9
Note: There may be some double counting of state and local government funding due to lack of data on transfers from state/territory governments to local governments.
na: not applicable.nes: (not estimated separately). NT local government road expenditure are recorded under state/territory government
expenditure.Source: BITRE, Australian Infrastructure Statistics Yearbook 2016, Table T 1.2a–e.
Table 3 Total road length by state/territory, by road type, 2015
NSW VIC QLD SA WA TAS NT ACT Other AustraliaKilometres
Urban 39 450.8 36 416.5 30 091.3 12 717.7 18 954.5 3 948.0 1 280.7 3 056.9 0.0 145 916.3Non-urban 167 788.6 109 319.9 193 297.2 84 212.0 138 448.9 16 004.0 18 001.4 390.8 181.9 727 644.6Total 207 239.4 145 736.3 223 388.5 96 929.7 157 403.3 19 952.0 19 282.1 3 447.7 181.9 873 560.9
Source: BITRE, Australian Infrastructure Statistics Yearbook 2016, Table T 1.6.
• 9 •

Figure 3 Total bulk and non-bulk domestic freight, by road
0
50
100
150
200
250
BulkBulk Non-bulkNon-bulk TotalTotal
Billi
on t
onne
kilo
met
res
2014
–15
2013
–14
2012
–13
2011
–12
2010
–11
2009
–10
2008
–09
2007
–08
2006
–07
2005
–06
2004
–05
2003
–04
2002
–03
2001
–02
2000
–01
1999
–00
1998
–99
1997
–98
1996
–97
1995
–96
1994
–95
1993
–94
1992
–93
1991
–92
1990
–91
Source: BITRE, Australian Infrastructure Statistics Yearbook 2016, Table T 2.1a–c.
• 10 •

Figure 4 Total metropolitan passenger kilometres travelled by road, capital cities
0
2
4
6
8
10
12
14
16
18
20
BusMotor cyclesCommercial vehicles Passenger cars (right axis)
Billi
on p
asse
nger
kilo
met
res
Billi
on p
asse
nger
kilo
met
res
(pas
seng
er c
ars)
0
20
40
60
80
100
120
140
160
2014
–15
2013
–14
2012
–13
2011
–12
2010
–11
2009
–10
2008
–09
2007
–08
2006
–07
2005
–06
2004
–05
2003
–04
2002
–03
2001
–02
2000
–01
1999
–00
1998
–99
1997
–98
1996
–97
1995
–96
1994
–95
Source: BITRE, Australian Infrastructure Statistics Yearbook 2016, Table T 3.3i.
• 11 •
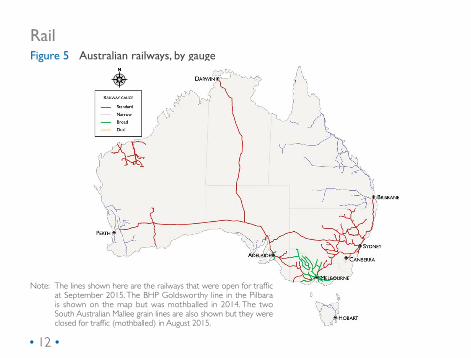
RailFigure 5 Australian railways, by gauge
Note: Thelinesshownherearetherailwaysthatwereopenfortrafficat September 2015. The BHP Goldsworthy line in the Pilbara is shown on the map but was mothballed in 2014. The two South Australian Mallee grain lines are also shown but they were closedfortraffic(mothballed)inAugust2015.
• 12 •
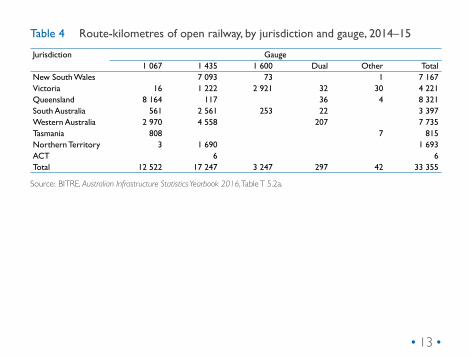
Table 4 Route-kilometres of open railway, by jurisdiction and gauge, 2014–15
Jurisdiction Gauge1 067 1 435 1 600 Dual Other Total
New South Wales 7 093 73 1 7 167Victoria 16 1 222 2 921 32 30 4 221Queensland 8 164 117 36 4 8 321South Australia 561 2 561 253 22 3 397Western Australia 2 970 4 558 207 7 735Tasmania 808 7 815Northern Territory 3 1 690 1 693ACT 6 6Total 12 522 17 247 3 247 297 42 33 355
Source: BITRE, Australian Infrastructure Statistics Yearbook 2016, Table T 5.2a.
• 13 •

Table 5 Network characteristics of heavy urban passenger railways
Route-kilometres in metropolitan areaPassenger-only
linesFreight-only
lines Shared
passenger/freight
Total Route-kilometres, electrified
Metropolitan stations
Sydney 190 70 156 416 346 178Melbourne 232 59 171 462 373 218Brisbane 103 81 140 324 243 129Adelaide 126 62 a 30 188 44 86Perth 173 121 1 295 176 70
a Broad gauge freight services over this track ceased during 2014.Source: BITRE, Australian Infrastructure Statistics Yearbook 2016, Table T 5.3.
Table 6 Total bulk and non-bulk domestic freight, rail
Financial year
Goods moved (billion tonne kilometres)Bulk Non-bulk Total
2010–11 233.8 28.0 261.82011–12 260.0 30.7 290.72012–13 288.1 30.8 319.02013–14 337.6 30.1 367.72014–15 369.4 32.2 401.6
Source: BITRE, Australian Infrastructure Statistics Yearbook 2016, Table T 2.1a–c.
• 14 •

Figure 6 Total metropolitan passenger kilometres by rail, capital cities
Light railHeavy rail
Billi
on p
asse
nger
kilo
met
res
0
1
2
3
4
5
6
7
8
9
10
11
12
13
2014
–15
2013
–14
2012
–13
2011
–12
2010
–11
2009
–10
2008
–09
2007
–08
2006
–07
2005
–06
2004
–05
2003
–04
2002
–03
2001
–02
2000
–01
1999
–00
1998
–99
1997
–98
1996
–97
1995
–96
1994
–95
1993
–94
1992
-–93
1991
–92
1990
–91
Source: BITRE, Australian Infrastructure Statistics Yearbook 2016, Table T 3.3i.
• 15 •
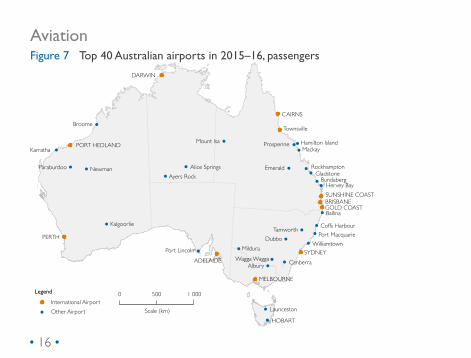
AviationFigure 7 Top 40 Australian airports in 2015–16, passengers
Legend
International AirportOther Airport
0 500 1 000
Scale (km)
Townsville
CAIRNS
MackayHamilton IslandProsperine
Emerald RockhamptonGladstone
BundabergHervey Bay
BRISBANESUNSHINE COAST
GOLD COASTBallina
Coffs HarbourPort Macquarie
WilliamtownSYDNEY
Canberra
DubboMildura
Wagga WaggaAlbury
MELBOURNE
Launceston
HOBART
ADELAIDEPort Lincoln
Mount Isa
Alice SpringsAyers Rock
DARWIN
Broome
PORT HEDLANDKarratha
Paraburdoo Newman
Kalgoorlie
PERTHTamworth
• 16 •
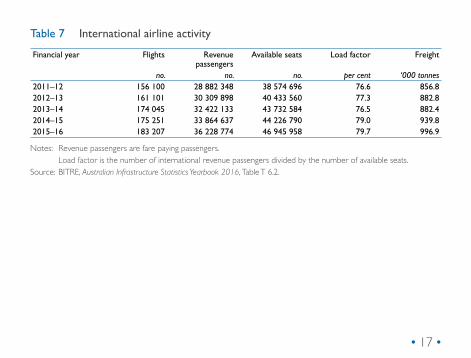
Table 7 International airline activity
Financial year Flights Revenue passengers
Available seats Load factor Freight
no. no. no. per cent ‘000 tonnes2011–12 156 100 28 882 348 38 574 696 76.6 856.82012–13 161 101 30 309 898 40 433 560 77.3 882.82013–14 174 045 32 422 133 43 732 584 76.5 882.42014–15 175 251 33 864 637 44 226 790 79.0 939.82015–16 183 207 36 228 774 46 945 958 79.7 996.9
Notes: Revenue passengers are fare paying passengers. Load factor is the number of international revenue passengers divided by the number of available seats.Source: BITRE, Australian Infrastructure Statistics Yearbook 2016, Table T 6.2.
• 17 •

Table 8 Domestic airline activityFinancial year
Flights Revenue passengers
Revenue passenger
kilometres
Available seats
Available seat kilometres
Domestic load factor
Cargo
no. no. ‘000 ‘000 ‘000 per cent ‘000 tonnes2011–12 615 706 54 972 783 64 330 105 71 105 81 619 449 78.8 236.32012–13 641 532 57 101 239 67 150 979 76 656 87 503 289 76.7 215.02013–14 640 486 57 716 013 68 079 156 77 724 89 535 414 76.0 197.12014–15 633 147 57 232 928 67 439 197 76 561 88 256 070 76.4 196.22015–16 637 005 58 406 349 68 834 143 77 147 88 880 652 77.4
Notes: Revenue passengers are fare paying passengers. Revenue passenger kilometres are calculated by multiplying the number of revenue passengers travelling on each
flightstagebythedistanceinkilometresbetweentheairports. Domestic load factor is domestic revenue passenger kilometres divided by available seat kilometres. Cargo data has been under-reported since November 2013. Data have been estimated at Australia level. Data are not readily available for missing years.Source: BITRE, Australian Infrastructure Statistics Yearbook 2016, Table T 6.3.Table 9 Activity at capital city airports—revenue passengers (thousand)Financial year Sydney Melbourne Brisbane Perth Adelaide Canberra Darwin Hobart2011–12 35 987 27 956 20 874 11 997 6 947 3 159 1 815 2 0452012–13 37 603 29 492 21 145 12 832 7 171 3 014 2 027 1 9032013–14 38 629 30 896 21 821 12 980 7 577 2 858 2 107 2 0452014–15 39 022 31 936 21 918 12 730 7 670 2 804 2 186 2 0572015–16 41 091 33 705 22 320 12 558 7 778 2 815 2 313 2 041
Note: Revenue passengers are fare paying passengers.Source: BITRE, Australian Infrastructure Statistics Yearbook 2016, Table T 6.4a.
• 18 •

Figure 8 BITRE airfare index, by ticket class
0
20
40
60
80
100
120
140
160
180
Best discountRestricted economyEconomyBusiness
Inde
x
2015
–16
2014
–15
2013
–14
2012
–13
2011
–12
2010
–11
2009
–10
2008
–09
2007
–08
2006
–07
2005
–06
2004
–05
2003
–04
2002
–03
2001
–02
2000
–01
1999
–00
1998
–99
1997
–98
1996
–97
1995
–96
1994
–95
1993
–94
Notes: Base of index: July 2003 = 100, airfare Indices are not adjusted by ABS Consumer Price Index. Restricted economy index begins 2002–03. *From the middle of February 2015, Qantas Airways ceased offering Full Economy fares for domestic travel. Since
the Full Economy fare category was mainly made up of Qantas fares, it is no longer possible to continue producing the index for this fare category.
Source: BITRE, Australian Infrastructure Statistics Yearbook 2016, Table T 6.6. • 19 •
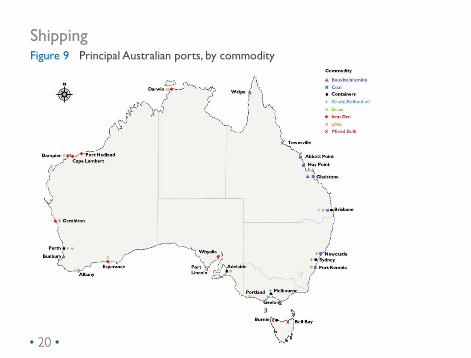
ShippingFigure 9 Principal Australian ports, by commodity
• 20 •

Table 10 Number of port calls made by ships involved in coastal or international voyages, by major ports
Financial year
Melbourne Brisbane Sydney Fremantle Newcastle Gladstone Dampier Port Hedland
2009–10 2 846 2 218 1 607 1 633 1 538 1 495 1 223 1 1682010–11 3 274 2 380 1 702 1 603 1 774 1 422 1 408 1 3122011–12 3 237 2 458 1 697 1 697 1 901 1 558 1 439 1 6692012–13 3 313 2 468 1 781 1 815 2 119 1 628 1 500 1 9132013–14 3 209 2 475 1 792 1 790 2 282 1 726 1 494 2 3852014–15 3 099 2 492 1 736 1 630 2 378 1 682 1 405 2 697
Note: Revision to historical data is due to the inclusion of “Car Carriers” and removing ‘within port’ calls (this causes a large decline in previously reported bulk port movements and the new bulk port movements).
Source: BITRE, Australian Infrastructure Statistics Yearbook 2016, Table T 7.3b.
Table 11 Cargo loaded (including exports) and discharged (including imports), by capital city portsFinancial year
Sydney Melbourne Brisbane Adelaide Perth Hobart Darwin
million tonnesLoaded 2011–12 7.5 15.1 19.2 9.2 14.3 0.9 5.5
2012–13 6.9 14.9 19.4 8.3 18.1 0.7 6.72013–14 6.4 15.0 17.0 8.9 19.3 0.7 7.0
Discharged 2011–12 21.2 19.3 17.4 6.3 13.7 0.9 5.42012–13 21.3 19.0 18.3 6.4 13.9 1.0 6.32013–14 20.7 19.3 18.2 6.6 14.4 0.9 6.6
Source: BITRE, Australian Infrastructure Statistics Yearbook 2016, Table T 7.6 a–b.• 21 •

Table 12 Containers exchanged, selected Australian ports
Financial year Melbourne Sydney Brisbane Fremantle Adelaide Five portstwenty foot equivalent units (TEU) exchanged
2009–10 2 236 635 1 927 520 919 242 557 039 274 501 5 768 0952010–11 2 392 974 2 020 151 978 815 598 250 297 701 6 137 4552011–12 2 579 098 2 036 064 1 025 069 656 918 323 834 6 620 9832012–13 2 512 926 2 126 284 1 069 881 670 296 339 061 6 718 4482013–14 2 532 669 2 206 401 1 097 365 703 081 382 681 6 922 1972014–15 2 578 839 2 289 673 1 138 706 743 562 365 874 7 116 654
Source: BITRE, Australian Infrastructure Statistics Yearbook 2016, Table T 7.7.
• 22 •

Figure 10 Total bulk and non-bulk domestic freight, coastal shipping
0
20
40
60
80
100
120
140
2013
–14
2012
–13
2011
–12
2010
–11
2009
–10
2008
–09
2007
–08
2006
–07
2005
–06
2004
–05
2003
–04
2002
–03
2001
–02
2000
–01
1999
–00
1998
–99
1997
–98
1996
–97
1995
–96
Non-bulkBulk Total
Billi
on t
onne
kilo
met
res
Source: BITRE, Australian Infrastructure Statistics Yearbook 2016, Table T 2.1a–c.
• 23 •
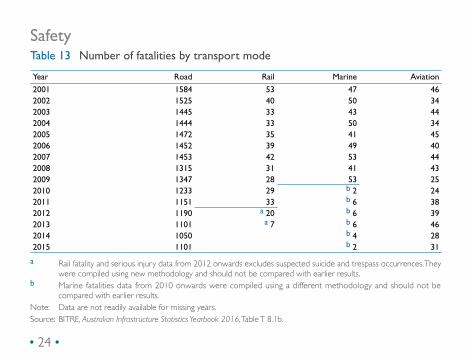
SafetyTable 13 Number of fatalities by transport mode
Year Road Rail Marine Aviation
2001 1584 53 47 462002 1525 40 50 342003 1445 33 43 442004 1444 33 50 342005 1472 35 41 452006 1452 39 49 402007 1453 42 53 442008 1315 31 41 432009 1347 28 53 252010 1233 29 b 2 242011 1151 33 b 6 382012 1190 a 20 b 6 392013 1101 a 7 b 6 462014 1050 b 4 282015 1101 b 2 31
a Rail fatality and serious injury data from 2012 onwards excludes suspected suicide and trespass occurrences. They were compiled using new methodology and should not be compared with earlier results.
b Marine fatalities data from 2010 onwards were compiled using a different methodology and should not be compared with earlier results.
Note: Data are not readily available for missing years. Source: BITRE, Australian Infrastructure Statistics Yearbook 2016, Table T 8.1b.
• 24 •
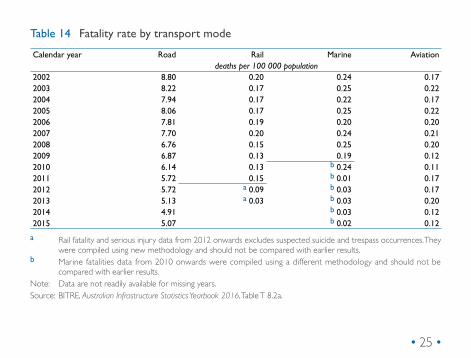
Table 14 Fatality rate by transport mode
Calendar year Road Rail Marine Aviationdeaths per 100 000 population
2002 8.80 0.20 0.24 0.172003 8.22 0.17 0.25 0.222004 7.94 0.17 0.22 0.172005 8.06 0.17 0.25 0.222006 7.81 0.19 0.20 0.202007 7.70 0.20 0.24 0.212008 6.76 0.15 0.25 0.202009 6.87 0.13 0.19 0.122010 6.14 0.13 b 0.24 0.112011 5.72 0.15 b 0.01 0.172012 5.72 a 0.09 b 0.03 0.172013 5.13 a 0.03 b 0.03 0.202014 4.91 b 0.03 0.122015 5.07 b 0.02 0.12
a Rail fatality and serious injury data from 2012 onwards excludes suspected suicide and trespass occurrences. They were compiled using new methodology and should not be compared with earlier results.
b Marine fatalities data from 2010 onwards were compiled using a different methodology and should not be compared with earlier results.
Note: Data are not readily available for missing years.Source: BITRE, Australian Infrastructure Statistics Yearbook 2016, Table T 8.2a.
• 25 •

EnergyTable 15 Flow of new infrastructure—total value of energy infrastructure
engineering construction work done, adjusted by chain volume indexFinancial year
Electricity generation, transmission and distribution
Pipelines Energy infrastructure engineering construction
work done
Energy percentage of total
$ million per cent2011–12 12 135.2 2 625.2 14 760.4 23.82012–13 14 035.1 4 215.4 18 250.5 27.92013–14 12 334.2 5 357.1 17 691.4 30.42014–15 8 994.8 6 189.7 15 184.5 30.62015–16 7 611.1 3 658.7 11 269.8 24.8
Source: BITRE, Australian Infrastructure Statistics Yearbook 2016,Table E 1.1d.
Table 16 Energy inputs—Australia’s economic demonstrated mineral energy reservesEnd of calendar year
Black coal Brown coal (lignite)
Uranium Crude oil Condensate LPG Natural gas
gigatonnes gigatonnes kilotonnes gigalitres gigalitres gigalitres billion cubic metres2010 49.2 44.2 1 158 154 335 153 2 9182011 57.5 44.2 1 196 148 305 148 2 8172012 61.1 44.2 1 174 148 305 148 2 8032013 62.1 44.2 1 1672014 62.6 44.2 1 151
Note: Data are not readily available for missing years.Source: BITRE, Australian Infrastructure Statistics Yearbook 2016,Table E 2.1.
• 26 •

Table 17 Energy production and trade—Australian energy production (primary fuels), by fuel type
Financial year
Black coal
Brown coal
Bagasse and
wood
Crude oil, NGL and naturally
occurring LPG
Natural gas
Ethane Hydro-electricity
Solar hotwater
Uranium Wind Solar PV
kilotonnes kilotonnes kilotonnes megalitres gigalitres gigalitres gigawatt hours
petajoules tonnes gigawatt hours
gigawatt hours
2009–10 363 329 72 547 16 351 31 427 52 651 339 13 549 10 7 109 5 052 4252010–11 344 400 70 403 14 238 29 678 56 398 267 16 807 12 7 069 6 085 1 5302011–12 362 709 71 991 14 315 27 881 54 017 331 14 083 12 7 650 6 970 2 5592012–13 396 095 62 335 15 461 24 911 61 724 327 18 270 13 8 918 7 960 3 8262013–14 428 251 60 543 15 135 24 046 62 642 361 18 421 13 5 548 10 252 4 858
Note: NGL represents natural gas liquid hydrocarbons other than methane, while LNG represents liquid natural gas (principally methane).
Australian energy production of uranium is measured in terms of tonnes of uranium metal equivalent, rather than ore extracted.
Source: BITRE, Australian Infrastructure Statistics Yearbook 2016, Table E 3.1h.
• 27 •

Figure 11 Electricity prices—consumer price index, price of residential electricity supply, by capital city
0
20
40
60
80
100
120
140
160
CanberraDarwinHobartPerthAdelaideBrisbaneMelbourneSydney
Inde
x
2015
–16
2014
–15
2013
–14
2012
–13
2011
–12
2010
–11
2009
–10
2008
–09
2007
–08
2006
–07
2005
–06
2004
–05
2003
–04
2002
–03
2001
–02
2000
–01
1999
–00
1998
–99
1997
–98
1996
–97
1995
–96
Note: Base of index is 2011–12.Source: BITRE, Australian Infrastructure Statistics Yearbook 2016, Table E 3.7.
• 28 •

Table 18 Energy emission—public electricity and heat production greenhouse gas (carbon dioxide equivalent) emissions, by type of fuel—Australia
Calendar year
Solid fuels Liquid fuels Gaseous fuels RenewableBlack coal Brown
coalBrown
coal briquettes
Fuel oil Auto-motive
diesel oil
Liquified petroleum gas (LPG)
Coal gas Natural gas
Wood and
wood waste
Gas biomass
gigagrams of CO2 equivalent2008 114 254.5 66 740.3 136.0 396.4 2 770.1 0.9 1 834.6 19 713.6 12.7 58.42009 116 147.1 68 996.7 135.2 113.1 2 426.7 0.8 1 827.0 21 666.9 7.6 71.82010 109 112.6 68 868.8 115.3 101.2 2 172.1 3 133.9 21 261.6 9.6 73.02011 102 828.8 67 518.3 117.9 97.4 2 188.9 3 379.0 22 089.9 6.9 76.62012 100 825.6 68 802.1 138.3 90.0 2 423.7 5 187.7 21 377.6 3.9 81.42013 97 901.6 59 579.9 103.8 80.4 2 490.0 4 190.8 22 389.1 7.6 72.02014 92 440.0 57 158.0 492.3 2 809.6 3 051.2 24 200.9 11.4 87.6
Note: For years where data are missing, emissions are either not estimated, included elsewhere or are not occurring.Source: BITRE, Australian Infrastructure Statistics Yearbook 2016, Table E 4.4.
• 29 •

CommunicationTable 19 Flow of new infrastructure—value of telecommunications engineering
construction work done by sector of construction and sector of ownership, adjusted by chain volume index
Financial year Private sector for the private
sector
Private sector for the public
sector
Public sector Telecommunications infrastructure
engineering construction
work done
Telecommunications percentage of total
$ million per cent2011–12 4 489.9 547.4 5.0 5 042.4 8.12012–13 4 570.5 822.5 9.8 5 402.7 8.32013–14 4 856.4 1 095.6 7.9 5 959.9 10.22014–15 4 685.2 1 932.1 1.9 6 619.1 13.42015–16 4 963.2 3 859.3 11.8 8 834.3 19.4
Source: BITRE, Australian Infrastructure Statistics Yearbook 2016, Table C 1.1.
• 30 •

Table 20 Investment in information technology—information media and telecommunications industry investment in information technology gross fixed capital formation, chain volume measures
Information media and telecommunications industry investment in ITFinancial year
Computers and peripherals
Electrical and electronic equipment
Intellectual property
products – Computer
software
TOTAL investment in IT by the information
media and tele-communications
industry
Total Australian investment in
information technology
Information media and tele-
communications industry
percentage of total
$ million per cent2009–10 408 1 834 611 2 853 26 001 10.972010–11 354 1 447 704 2 505 27 491 9.112011–12 306 1 498 764 2 568 30 395 8.452012–13 110 1 488 1 122 2 720 32 618 8.342013–14 324 1 513 1 390 3 227 32 364 9.972014–15 350 1 296 1 461 3 107 33 940 9.15
Note: Grossfixedcapitalformationisameasureoftotalexpenditureonnewandsecond–handfixedassets,lesssalesoffixed assets, which occur during the reference period.
Source: BITRE, Australian Infrastructure Statistics Yearbook 2016,Table C 2.1.
• 31 •
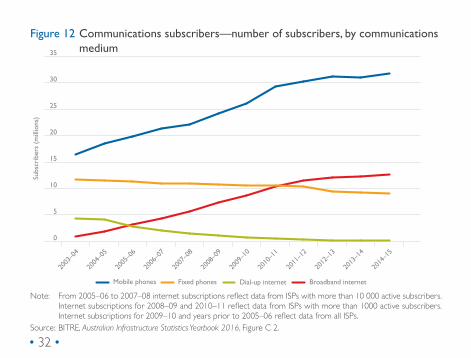
Figure 12 Communications subscribers—number of subscribers, by communications medium
0
5
10
15
20
25
30
35
Broadband internetDial-up internetFixed phonesMobile phones
Subs
crib
ers
(mill
ions
)
2014
–15
2013
–14
2012
–13
2011
–12
2010
–11
2009
–10
2008
–09
2007
–08
2006
–07
2005
–06
2004
–05
2003
–04
Note: From2005–06to2007–08internetsubscriptionsreflectdatafromISPswithmorethan10000activesubscribers.Internetsubscriptionsfor2008–09and2010–11reflectdatafromISPswithmorethan1000activesubscribers.Internetsubscriptionsfor2009–10andyearspriorto2005–06reflectdatafromallISPs.
Source: BITRE, Australian Infrastructure Statistics Yearbook 2016, Figure C 2.
• 32 •

Figure 13 Communications prices—consumer price index, telecommunications services by capital city
70
75
80
85
90
95
100
105
110
CanberraDarwinHobartPerthAdelaideBrisbaneMelbourneSydney
Inde
x
2015
–16
2014
–15
2013
–14
2012
–13
2011
–12
2010
–11
2009
–10
2008
–09
2007
–08
2006
–07
2005
–06
2004
–05
2003
–04
2002
–03
2001
–02
2000
–01
1999
–00
1998
–99
1997
–98
1996
–97
1995
–96
1994
–95
1993
–94
1992
–93
1991
–92
Note: Base year of index is 2011–12.Source: BITRE, Australian Infrastructure Statistics Yearbook 2015, Table C 4.1.
• 33 •

WaterTable 21 Flow of new infrastructure—total value of water infrastructure
engineering construction work done, adjusted by chain volume index
Financial year Water storage and supply
Sewerage and drainage
Water infrastructure engineering
construction work done
Water percentage
of total
$ million per cent2010–11 6 281.2 3 737.9 10 019.1 17.72011–12 5 015.1 3 221.9 8 236.9 13.32012–13 4 026.4 2 958.7 6 985.0 10.72013–14 3 064.3 2 748.8 5 813.1 10.02014–15 2 318.5 2 015.1 4 333.5 8.72015–16 2 052.0 2 514.1 4 566.1 10.0
Source: BITRE, Australian Infrastructure Statistics Yearbook 2016, Table W 1.1d.
• 34 •
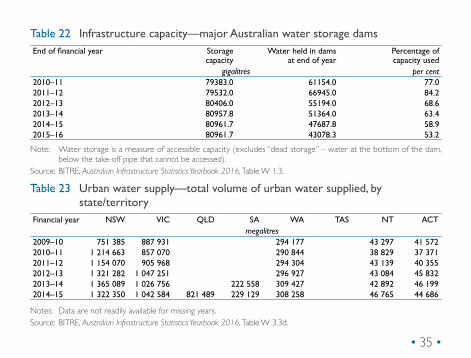
Table 22 Infrastructure capacity—major Australian water storage damsEnd of financial year Storage
capacityWater held in dams
at end of yearPercentage of capacity used
gigalitres per cent2010–11 79383.0 61154.0 77.02011–12 79532.0 66945.0 84.22012–13 80406.0 55194.0 68.62013–14 80957.8 51364.0 63.42014–15 80961.7 47687.8 58.92015–16 80961.7 43078.3 53.2
Note: Water storage is a measure of accessible capacity (excludes “dead storage” – water at the bottom of the dam, below the take-off pipe that cannot be accessed).
Source: BITRE, Australian Infrastructure Statistics Yearbook 2016, Table W 1.3.
Table 23 Urban water supply—total volume of urban water supplied, by state/territory
Financial year NSW VIC QLD SA WA TAS NT ACTmegalitres
2009–10 751 385 887 931 294 177 43 297 41 5722010–11 1 214 663 857 070 290 844 38 829 37 3712011–12 1 154 070 905 968 294 304 43 139 40 3552012–13 1 321 282 1 047 251 296 927 43 084 45 8322013–14 1 365 089 1 026 756 222 558 309 427 42 892 46 1992014–15 1 322 350 1 042 584 821 489 229 129 308 258 46 765 44 686
Notes: Data are not readily available for missing years.Source: BITRE, Australian Infrastructure Statistics Yearbook 2016, Table W 3.3d.
• 35 •

Table 24 Rural water supply—water consumption by agricultural activity, by state/territory—total
Financial year
NSW VIC QLD SA WA TAS NT Australia
megalitres2008–09 2 108 103 1 333 852 2 295 682 901 649 318 395 284 930 43 024 7 285 6332009–10 2 204 850 1 644 108 2 037 251 772 283 340 265 305 366 54 635 7 358 7562010–11 2 982 713 1 300 349 1 959 902 699 029 347 108 201 199 60 300 7 550 6022011–12 3 751 231 1 812 926 2 108 251 721 526 336 590 217 957 58 094 9 006 5732012–13 5 202 313 2 614 024 2 623 228 842 884 324 006 271 884 50 394 11 928 7332013–14 4 506 398 2 677 634 2 957 845 763 232 343 885 255 680 57 178 11 561 8532014–15 3 426 159 2 462 405 2 467 277 770 818 343 851 247 566 61 781 9 779 856
Note: NSW includes the ACT.Source: BITRE, Australian Infrastructure Statistics Yearbook 2016, Table W 3.9c.
• 36 •
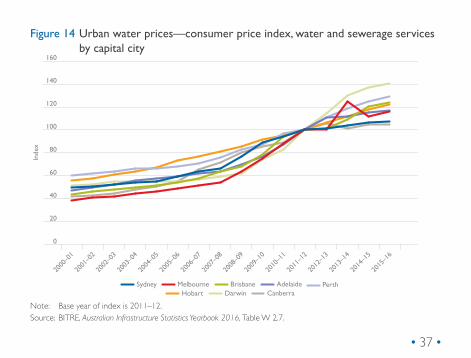
Figure 14 Urban water prices—consumer price index, water and sewerage services by capital city
0
20
40
60
80
100
120
140
160
CanberraDarwinHobartPerthAdelaideBrisbaneMelbourneSydney
Inde
x
2015
–16
2014
–15
2013
–14
2012
–13
2011
–12
2010
–11
2009
–10
2008
–09
2007
–08
2006
–07
2005
–06
2004
–05
2003
–04
2002
–03
2001
–02
2000
–01
Note: Base year of index is 2011–12.Source: BITRE, Australian Infrastructure Statistics Yearbook 2016, Table W 2.7.
• 37 •

AbbreviationsABS Australian Bureau of StatisticsACT Australian Capital TerritoryATSB Australian Transport Safety BureauBITRE Bureau of Infrastructure, Transport and Regional EconomicsCat. no. Category numberGDP Gross Domestic ProductLNG Liquefied Natural GasNa Not ApplicableNES Not estimated separatelyNGL Natural Gas LiquidsNo. NumberNSW New South WalesNT Northern TerritoryQLD QueenslandSA South AustraliaTAS TasmaniaTEU Twenty foot equivalent unitsVIC VictoriaWA Western Australia
• 38 •

ContactBureau of Infrastructure, Transport and Regional Economics Department of Infrastructure and Regional Development GPO Box 501, Canberra ACT 2601, Australia
Telephone:General enquiries: +61 2 6274 7818Publication requests: + 61 2 6274 7210Fax: + 61 2 6274 6855
Email: [email protected]


