51

3
KEY ELEMENTS FOR A 2020 COMPETITIVENESS AGENDA IN THE AMERICAS

Key
ele
men
ts f
or
a 2
020
Com
pet
itiv
enes
s a
gen
da
in t
he
am
eriC
as
4
Discussion paper prepared for the III Meeting of Americas
Competitiveness Authorities and Councils organized by the Organization
of American States and the Inter-American Competitiveness Network
November 14, 2010
Atlanta, Georgia

5
This paper presents key elements of a competitiveness strategy in the Americas. It is
organized as follows. Section 1 provides an analysis of the global context against which
countries are formulating and implementing policies and reforms aimed at boosting
productivity and laying the foundations for sustainable growth. What are some of the
forces and trends which are determining the broad parameters of the global economic
environment and the emerging factors which will best enable countries to thrive in
an increasingly complex international marketplace? Section 2 argues that the global
economic crisis has created special challenges and opportunities for Latin American
and the Caribbean and that the region is well poised to set in motion initiatives aimed
at significantly strengthening those factors which could contribute to boost overall
levels of competitiveness. Sections 3 provides a conceptual framework to look at the
various factors and policies which are essential to strengthen competitiveness, with
particular reference to the role of institutions, the regulatory framework, education,
the adoption and use of information and communication technologies, as well as
the increasingly important questions of gender equity and sustainable management
of the environment. Section 4 builds on this framework to ask the question: how
competitive are Latin America and the Caribbean, examining closely the region’s
performance in a number of critically important areas. Finally, section 5 concludes
by providing a number of specific recommendations as to the various ways in which
the Inter-American Competitiveness Network (RIAC)1 could catalyze the promotion of
a competitiveness agenda in the region.
1 - The Inter-American Competitiveness Network was launched on September 29, 2009, on the occasion of the III Americas Competitiveness Forum (ACF) held in Santiago, Chile. The Network seeks to foster dialogue, cooperation, the exchange of experiences and best practices, and the adoption of initiatives to strengthen and promote competitiveness in the Americas. The key actors are government authorities responsible for promoting competitiveness and the competitiveness councils in the Americas. Institutions supporting the network are: Organization of American States (OAS), the Inter-American Development Bank (IDB), Andean Development Corporation (CAF), the Economic Commission for Latin America and the Caribbean (ECLAC), the World Bank (WB), the United Nations Development Programme (UNDP) and the Central American Bank for Economic Integration (CABEI).


7
The global context
I.

Key
ele
men
ts f
or
a 2
020
Com
pet
itiv
enes
s a
gen
da
in t
he
am
eriC
as
8
The global economy has been
transformed in a number of fundamental
ways in the past three decades.
Spurred by progress in transport
and communication technologies,
the process of globalization has
led to a remarkable expansion of
international trade and has permitted
the achievement of important progress
in the battle against poverty. The rapid
reduction in barriers to the flow of goods
and services, capital and labor has not
always been orderly and has proceeded
at different speeds in different parts of
the world but there is little doubt that,
to a greater or lesser extent, it has now
become a permanent feature of the
international economic landscape. Not
only has it emerged as an important
driver of global economic growth, but
greater openness and stronger links
with the world economy have imposed
on domestic producers everywhere
the valuable discipline of international
competition and attracted much needed
capital and expertise, thus enhancing
the prospects for growth.
Alongside the quickening pace of global
economic integration, there has been
a marked acceleration in the pace of
technological and scientific progress.
Advances in information technology,
in particular, have created new
New technological ideas combined with social order and the trained of human beings who generate and apply them, are the basis of modern economic prosperity
opportunities for businesses against the
background of an increasingly complex
global economy. Reductions in the cost
of communication are facilitating the
shift of backroom operations to the
developing world. The multinational
corporation, already operating with a
global outlook as regards the location of
its markets and the sources of supply, is
also now operating globally in terms of
sources of finance and physical location.
With reduced transport costs, location
is becoming less important and political
and economic stability, a well-trained
labor force, and strong institutional
underpinnings are emerging as the
key drivers of competitiveness and
prosperity. These developments are
also leading an increasing number of
governments around the globe to be
more assertive in pursuing productivity-
enhancing policies.
Harvard professor Richard Cooper
makes a compelling case that at the
outset of the 21st century technical
change and innovation have become
“the dominant characteristic” of our
time. “New technological ideas,” he adds,
“combined with social order and the
trained human beings who generate and
apply them, are the basis for modern
economic prosperity.” The traditional
sources of power and influence—

9
I. Th
e gl
obal
con
text
territory, resources, raw manpower, and
military might—for centuries the chief
determinants of nations’ prosperity,
are far less important today than they
used to be and have given way to a new
world in which successful development
is increasingly linked to sound policies,
to good governance, to effective
management of scarce financial
resources, and, most important, to the
extent to which societies are able to
harness the latent capacities of their
populations. Successful countries today
are not necessarily large geographically
or richly endowed with natural resources,
nor able to project military power beyond
their borders. Increasingly, they are
countries that have managed to expand
opportunities for their populations
through the full exploitation of the
opportunities afforded by the world
economy through international trade,
foreign investment, the adoption of new
technologies, macroeconomic stability,
and high rates of saving.
The above considerations
notwithstanding, the global financial
crisis, “by any measure the deepest global
recession since the Great Depression,”2
has highlighted the presence of risks
to a scenario that, earlier in the decade,
envisaged sustained economic growth
and prosperity. The crisis, which got
underway in the developed markets, has
shown that the advanced economies
are not free of the vulnerabilities and
rigidities that had come to be recognized
as structural features of the developing
world. More important, a key lesson to
emerge from the financial crisis is that
we have global financial markets but no
global rule of law. In the past 30 years
the global economy has become both
more complex and more interconnected,
but the mechanisms and institutions
In the past 30 years the global economy has become both more complex and more interconnected, but the mechanisms and institutions that we have to deal with crises have not kept pace with the tempo of change
that we have to deal with crises have not
kept pace with the tempo of change and
what has emerged is a “governance gap”,
an inability to cope with complex global
problems either because the institutions
we have are woefully unprepared or,
in some cases, because we do not
even have an institution with relevant
jurisdiction and adequate resources
to address the problem in question
(e.g., climate change). It is becoming
increasingly clear that systemic crises
cannot be solved outside a framework
of global collective actions involving
supranational cooperation on a much
greater scale than has been the case in
the past.
2 - This is the characterization made by the IMF in its October 2008 World Economic Outlook.

10
11
Latin America and the economic crisis
II.

Key
ele
men
ts f
or
a 2
020
Com
pet
itiv
enes
s a
gen
da
in t
he
am
eriC
as
12
The latest forecasts put out by the International Monetary Fund (issued in April of 2010) for global economic growth are cautiously encouraging. Following a 0.6 percent contraction in 2009 (more brutal in the United States, Europe and Japan, softened by rapid growth in Asia, particularly China and India), world output is expected to expand in 2010 by 4.2 percent and to continue at that pace in 2011. These forecasts assume that interest rates in the advanced economies will remain at near zero levels for the foreseeable future and that public debt levels will rise from 75 percent of GDP in 2008 to some 110 percent of GDP by 2014.
As Table 1 below makes clear, the crisis has been particularly harsh in its consequences for the advanced economies, countries that over the last couple of decades have tended
Table 1. Macroeconomic Outlook (% GDP Growth)
2009 2010 2011
Source: World Economic Outlook, IMF, October 2010
In 2011 Latin America and the Caribbean have a unique opportunity to set in motion initiatives aimed at significantly strengthening policies and institutions which could contribute to boos overall level of competitiveness
to be islands of relative stability and locomotives of global economic growth. While Latin America and the Caribbean (LAC) have not been unaffected by the crisis, the impact has been more muted. The region’s

13
II. L
atin
Am
eric
a an
d th
e ec
onom
ic c
risi
s
Figure 1. Public debt (in % of GDP)
0
20
40
60
80
100
120
140
Chile
Mexic
o
Brazil
Co lom
b ia
Argen tin
a
Ru ssia
China
So uth A
f rica
Spain
Poland
India
Portugal
France
G reece Ita
ly
Pub
lic
Deb
t (%
of G
DP
)banks were less exposed to the kinds of toxic assets which have wreaked havoc on the financial systems of the industrial world and, with more solid banking sectors, the region was able to cushion better the impact of the credit crunch. Furthermore, in a most interesting development—particularly against the historical background of repeated fiscal crises in many countries in Latin America—its
levels of public indebtedness are now lower, on average, than those of many developed nations (Figure 1) . These facts would suggest that beginning in 2011 countries in Latin America and the Caribbean have a unique opportunity to set in motion initiatives aimed at significantly strengthening those factors, policies and institutions which could contribute to boost overall levels of competitiveness.

14
15
A competitiveness profile for LAC
III.
Key
ele
men
ts f
or
a 2
020
Com
pet
itiv
enes
s a
gen
da
in t
he
am
eriC
as
16
Two questions that suggest themselves immediately are what are those factors which are fundamental to boosting competitiveness in the region and that both theoretical considerations and empirical experience have shown to be primary determinants of productivity and, hence, economic growth? The second question is, given these factors, how do countries in LAC perform, both in relation to each other and against top performers in the world? In this paper we discuss briefly the importance of a range of such factors and then present a competitiveness profile for the region, looking specifically at the regulatory and legal framework, the region’s human and environmental capital, the adoption and use of information and communication technologies, and the institutional environment. Rather than merely showing the relative rankings of an established competitiveness index, we instead opt for framing our discussion of competitiveness in the region in terms of 4 key and distinct areas (as noted above), tapping into the latest data available from credible internationally comparable sources. The competitiveness profile is followed by a discussion of ways in which RIAC could better leverage the promotion of a competitiveness agenda for the Americas.
What matters for competitiveness?
A number of observations can be made when examining the factors, policies and institutions that contribute to improve a country’s economic performance. The first and perhaps most self-evident is that the factors are many and span several different areas. For example, there already exists considerable empirical literature documenting the central importance of macroeconomic stability for economic
growth. There are no known cases of countries—at least during the post-war period, when the existence of a system of national accounts and the emergence of national statistics has permitted the development of tracking mechanisms—in which high economic growth rates on a sustained basis has taken place against the background of runaway inflation or disorderly management of the public finances. In fact, there is overwhelming evidence that in the absence of a solid foundation of macroeconomic stability, growth will be anemic or, at best, volatile. What are, in fact, the key building blocks of competitiveness?
Institutions
There is increasing recognition that a solid foundation of macroeconomic stability alone is not sufficient to ensure rapid economic growth. Institutions matter a great deal. By institutions we mean the system of rules that shapes incentives and defines the way economic agents interact in an economy. The institutional framework has a crucial bearing on growth and development. It plays a central role in the ways societies distribute the benefits and bear the costs of development strategies and policies, and it has a bearing on investment decisions and on the organization of production. Of course, laying a sound institutional foundation is not an easy task, nor something whose results can be observed quickly, as is often the case with purely macroeconomic measures, an interest rate hike here, a tax cut there. Attempts at institutional reform often run against strenuous opposition, as such reforms often challenge powerful, deeply entrenched vested interests.
Property rights, for instance, are of central importance. A weak property
17
III. A
com
peti
tive
ness
pro
file
for
LAC
rights environment discourages investment and creates uncertainties which complicate long-range planning. In developing countries in particular, they hamper the ability of budding entrepreneurs to access the financial system using physical assets as collateral. It is of fundamental importance whether governments are accountable to their respective populations. Investors care enormously whether judges and courts are reasonably independent, or whether they are subject to undue interference or, God forbid, are for sale to the highest bidder. Do businesses have to pay bribes to settle their tax obligations? Do they have to hire private security details because police services are ineffective and unreliable? Do governments show favoritism in their decisions, or are they fairly even-handed in their relations with the business community, playing more the role of impartial formulators of transparent rules? Are public resources being allocated to education and essential infrastructure, or spent on wasteful and unproductive projects or schemes?
institutional environment characterized by openness and transparency in the management of public resources. Corruption poisons the development process. It leads to resource misallocation as funds are no longer directed toward their most productive ends, but are instead captured for private gain. It undermines the credibility of those who are perceived as being its beneficiaries (e.g., public officials, government ministers, and business leaders) and thus sharply limits their ability to gain public support for economic and other reforms.
Other elements of the institutional environment are also key. For instance, as with property rights, there is a burgeoning literature and a large body of country-specific experience on the importance of an efficient judicial system. It matters significantly for productivity and competitiveness whether firms are able to resolve legal disputes through a court system that operates transparently, with reasonable speed, and in which decisions are broadly consistent with
The institutional framework has a crucial bearing on growth and development. It plays a central role in the ways societies distribute the benefits and bear the costs of development strategies and policies
Great importance of the establishment of an institution environment characterized by openness and transparency in the management of public resources
Extensive research at the World Bank and elsewhere has shown the central importance of the establishment of an
the letter of the law, as opposed to a system where legal disputes can last a decade, drain huge financial resources,
Key
ele
men
ts f
or
a 2
020
Com
pet
itiv
enes
s a
gen
da
in t
he
am
eriC
as
18
and deliver outcomes reflecting vested interests. In the latter case firms will face a higher cost structure and lose competitiveness vis-à-vis more fortunate competitors operating in friendlier legal environments.
The regulatory framework
Related to the legal environment is the overall regulatory framework and the burdens it can impose on existing businesses and the discouraging effect it can have on the creation of new ones. Freedom to enter markets can make a significant contribution to development—indeed, not an inconsiderable share of the progress made in India and China in the past twenty years reflects a reorientation of policies which significantly relaxed the barriers to entry to goods, labor, and financial markets.
This is perhaps one area where we in Latin America—with the possible exception of Chile—are at our most vulnerable. The picture that emerges from the 2009 Doing Business Report published by the World Bank is not a pretty one. The scope of this Report, which now covers 181 countries, has expanded significantly and now, in addition to the usual indicators
protection, or has the most restrictive labor legislation making it very difficult, for instance, to adjust the size of the payroll. The sobering irony of this study is that those countries with the greatest need for entrepreneurship and private sector development are those that generally put the greatest obstacles to the creation of new enterprises, or that otherwise intervene in ways that retard the emergence of entrepreneurial capacities which are so central to the development of an enabling environment for competitiveness and innovation.
Education
Beyond these institutional factors, many others are also known to play a role in enhancing productivity growth. Education is of course absolutely critical for development and for nurturing a capacity for innovation and commendable progress has been made in the past 50 years. By 1990 about half of the world’s countries had primary enrolment rates of 100 per cent as opposed to only 28 percent in 1960. Yet much remains to be done, as illiteracy is still a fact of life in many developing nations. For example, according to UNESCO, almost 40 percent
Those countries with the greatest need for entrepreneurship and private sector development are those that generally put the greatest obstacles to the creation of new enterprises
on opening a new business (number of procedures, time taken, cost) one can also look at such things as: which countries make it easy to pay taxes, or to get licenses, where it is easier or more difficult to enforce contracts, who regulates property registration the most, who provides investors the greatest
of India’s population still cannot read or write. Lack of such basic skills severely limits the possibilities of citizens to participate in the development process, to be gainfully employed, to be well-informed judges of government policies and politicians, and not to fall captives to the manipulations of demagogues. From
19
a business perspective, without access to workers with a basic education, companies are limited to resource- or basic labor-intensive industries, and constrained in their ability to grow and to move up the value chain.
However, enrolment rates in themselves do not tell the whole story, as they disguise important differences in the quality of education. An artificial focus on quantitative targets, such as enrolment rates, has often obscured the importance of the quality of learning, and the role of incentives and motivation of teachers, students and parents. Education and training are thus emerging as key
drivers of competitiveness. As the global economy has become more complex, it has become evident that to compete and maintain a presence in global markets it is essential to boost the human capital endowments of the labor force, whose
III. A
com
peti
tive
ness
pro
file
for
LAC
As the global economy has become more complex, it has become evident that to compete and maintain a presence in global markets it is essential to boost the human capital endowments of the labor force, whose members must have access to new knowledge, be constantly trained in new processes and in the operation of the latest technologies
members must have access to new knowledge, be constantly trained in new processes and in the operation of the latest technologies. Porter provides useful insights in his discussion of the role of education in contributing to an upgrading of an economy’s productive apparatus. Worth highlighting are the emphasis he places on high educational standards—which typically require some form of state involvement in the setting of norms—as well as the need for students to receive education and training that has a strong practical orientation. He also notes that when teaching is perceived to be a prestigious job—hence, adequately compensated—it can have a measurable impact on the quality of the teaching staff and, more generally, the excellence of the education system. Porter highlights the importance of close collaboration between the educational institutions and potential employers, with universities and other institutions of higher education called upon to adapt to the changing needs of industry. Not to be neglected as well is the need for firms to “invest heavily in ongoing in-house training through industry associations or individually.” He also praises the role of technical and vocational education, and highlights the benefits of inward migration policies that allow the movement of workers with specialized skills. As coverage of primary education has expanded rapidly in the developing world, higher education has gained importance. Thus, countries which have invested heavily in creating a well-developed infrastructure for tertiary education have reaped enormous benefits in terms of growth. Education has been a particularly important driver in the development of the capacity for technological innovation,

Key
ele
men
ts f
or
a 2
020
Com
pet
itiv
enes
s a
gen
da
in t
he
am
eriC
as
20
as the experience of Finland, Korea, Taiwan, and Israel clearly shows.
Adoption and use of the latest technologies
An increasingly important factor in explaining successful economic development concerns the agility with which an economy adopts existing technologies to enhance the productivity of its industries. This is critical because technological differences have been shown to explain much of the variation in productivity between countries. In fact, the relative importance of technology
incentive for employees to acquire new skills. At the same time, other companies become increasingly aware of the advantages of upgrading technology, with positive repercussions for the productivity of the sector as a whole.
Innovation becomes more important as countries move up the technology chain. While less advanced countries, such as those operating still mainly as producers of primary commodities, can still improve their productivity by adopting existing technologies or making incremental improvements in other
An increasingly important factor in explaining successful economic development concerns the agility with which an economy adopts existing technologies to enhance the productivity of its industries
for competitiveness has been increasing in recent years, as progress in the dissemination of knowledge and the increasing use of information and communications technologies have become increasingly widespread. For example, the strong productivity growth recorded in the United States over the past decade has been linked to the high adoption of information technologies, with productivity increases registered particularly in sectors using ICT extensively, such as financial services, retail and wholesale.
We also note that technology-intensive FDI not only provides strong productivity gains and improvements in business processes, but also has a number of important spillover effects, including improvements in management practice and positive effects on human capital where new technologies provide the
areas, more advanced countries will need to do more to increase productivity. Firms in these countries must design and develop cutting-edge products and processes to maintain a competitive advantage. This requires an environment that is conducive to innovative activity, supported by both the public and the private sectors. In particular, this means sufficient business investment in research and development, high-quality scientific research institutions, investments in advanced human capital, collaboration in research between universities and industry, and protection of intellectual property.
Gender equity
A number of studies have shown that there is a close connection between national economic performance and the degree to which societies have succeeded in integrating women into
21
the economy and have allowed her to increasingly participate in decision making, particularly in the case of representation in parliaments, cabinets and other executive bodies, and have made it possible for her to avail herself of opportunities for education and the building up of her human capital3.
International competitiveness and productivity have much to do with the efficient allocation of resources, including, of course, human resources. The efficient operation of our increasingly knowledge-based economy is not only a function of adequate levels of available finance, a reasonably open trade regime for goods and services, but, more and more, is also dependant on our ability to tap into a society’s reservoir of talents and skills. When, because of tradition, a misunderstanding of the purpose of religion, social taboos or plain prejudices, half of the world’s population is prevented from making its contribution to the life of a nation, the economy will suffer. The skills set to which the private sector can tap will be necessarily narrower and shallower and productivity, the engine of sustainable growth, will be impaired. It is indeed not a surprise that the most competitive countries in the world, those that have better been able to operate on the boundaries of the technology frontier, are also those where women have been given the greatest opportunities to be equal partners with men. Thus, gender equality does not purely have an ethical or moral dimension, but, in fact, is an issue of economic efficiency and, thus, may be at the very basis of creating a more prosperous world.
Sustainable management of the environment
Notwithstanding buoyant world economic growth in the post-war period and important gains in the past twenty years in the fight against poverty, scientists have begun to ask themselves: are the processes underlying our current development path sustainable? Even if one accepts that remarkable progress has been made during the past half century in improving the lot of vast segments of humanity, are the processes and the policies which have produced these trends sustainable? How we manage the world’s resources and whether economic growth and its supporting policies are framed in a context of sustainable development is now emerging as a key consideration in the debate over what matters for competitiveness.
To a growing number of scientists our present development path is urgently in need of correction. Frequent areas of focus, where important corrective measures are needed, have been climate change, biodiversity loss and pollution. That the earth has self-correcting mechanisms, that the physical processes underpinning changes in the environment have huge inertia, has not obscured the growing consensus in the scientific community that, at the margin, the latest trends are not sustainable. To take just a few examples: global carbon dioxide emissions from fossil fuels have sharply accelerated since 2000, reflecting a quickening in the pace of growth of the global economy4, a sharp rise in energy consumption in China
3 - See, for instance, López-Claros and Zahidi (2005) “Women’s Empowerment: Measuring the Global Gender Gap”, a Special Report, Harvard Business Review.
III. A
com
peti
tive
ness
pro
file
for
LAC

Key
ele
men
ts f
or
a 2
020
Com
pet
itiv
enes
s a
gen
da
in t
he
am
eriC
as
22
and the weakening of natural carbon sinks, such as forests and seas5. Not surprisingly, large volumes of the Arctic ice have melted and accelerated flow in Greenland glaciers is contributing to a rise in sea levels. Satellite observations of the Arctic ice cap show a significant reduction in the ice cover. The decline between 2004 and 2005 was 14 percent, 18 times the rate seen over the previous years. In 1996 the volume of ice melted in Greenland was 22 cubic miles. By 2005 this figure had risen to 53 cubic miles and has picked up speed more recently6.
Even with the slowdown in global growth in 2009, the above trends are unlikely to be reversed since the present scale of human activity appears to have been only marginally and temporarily affected. In the absence of other measures aimed directly at reducing emissions, only a sustained, deep depression such as that witnessed during the 1929–1933 period might have an impact on the pace of accumulation of carbon dioxide emissions. Furthermore, expecting an economic depression to help temporarily mitigate the challenges of global warming is hardly a commendable solution, involving incalculable social costs.
But even beyond purely environmental concerns, there are other forces at work which are already having a major impact on our economic system’s institutional underpinnings, and which have been at the center of the progress achieved during the past half century. Key among these is population growth and the corresponding pressures on resources. According to the latest World Energy Outlook published by the International Energy Agency, energy demand will grow by 40 percent by 2030, reflecting the addition of some 2.2 billion people to the world’s population and the corresponding needs for housing, transportation, heating, illumination, food production, waste disposal, and the push for sustained increases in the standards of living. This is a remarkable forecast, given that it was released in November of 2009, in the middle of an emerging global recession and relies on assumptions about a sharp economic slowdown that year7. Because the mothers that will bear these 2.2 billion children are already alive today, this expected increase in the world’s population—barring some unexpected calamity—will materialize and will be largely concentrated in urban environments in developing countries.
Beyond the inevitable pressures on
Our present development path needs corrections in areas such as climate change, biodiversity loss and pollution
4 - According to the IMF’s World Economic Outlook, average annual global economic growth between 2000 and 2003 was 3.3 percent before accelerating quickly to 5.0 percent during the period 2004–2007. This pickup in the pace of economic growth was associated with a remarkable increase in the price of oil and other commodities. Although there was a slowdown in 2009, annual growth, as noted earlier, is expected to be a robust + 4 percent in 2010 and 2011.
5 - In the 20-year period to 2000, CO2 emissions rose at an average rate of 1.6 percent per year. By 2004, however, they were rising by 5.4 percent, with Asia and North America leading the way.
6 - For some impressive photos of declining ie cover see http://www.nasa.gov/centers/goddard/news/topstory/2005/arcticice_decline
7 - See www.iea.org and the press release posted there on November 10, 2009, the day of the launch of the latest World Energy Outlook.
23
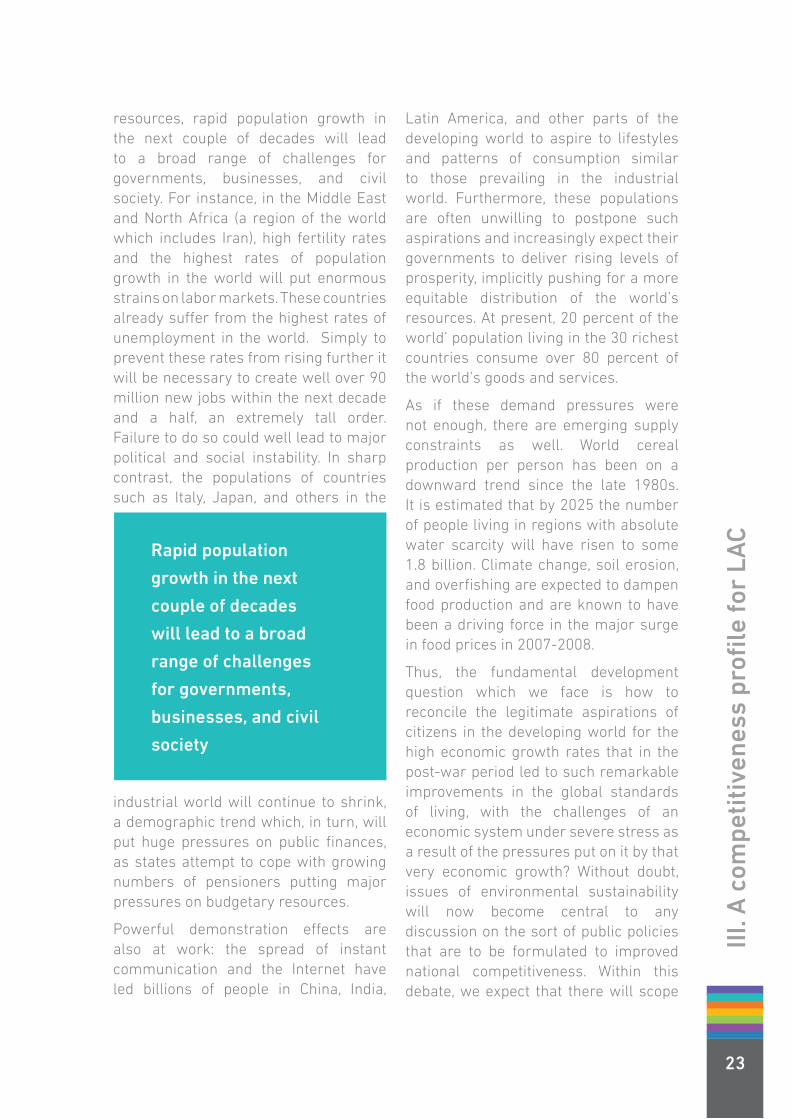
resources, rapid population growth in the next couple of decades will lead to a broad range of challenges for governments, businesses, and civil society. For instance, in the Middle East and North Africa (a region of the world which includes Iran), high fertility rates and the highest rates of population growth in the world will put enormous strains on labor markets. These countries already suffer from the highest rates of unemployment in the world. Simply to prevent these rates from rising further it will be necessary to create well over 90 million new jobs within the next decade and a half, an extremely tall order. Failure to do so could well lead to major political and social instability. In sharp contrast, the populations of countries such as Italy, Japan, and others in the
industrial world will continue to shrink, a demographic trend which, in turn, will put huge pressures on public finances, as states attempt to cope with growing numbers of pensioners putting major pressures on budgetary resources.
Powerful demonstration effects are also at work: the spread of instant communication and the Internet have led billions of people in China, India,
III. A
com
peti
tive
ness
pro
file
for
LAC
Rapid population
growth in the next
couple of decades
will lead to a broad
range of challenges
for governments,
businesses, and civil
society
Latin America, and other parts of the developing world to aspire to lifestyles and patterns of consumption similar to those prevailing in the industrial world. Furthermore, these populations are often unwilling to postpone such aspirations and increasingly expect their governments to deliver rising levels of prosperity, implicitly pushing for a more equitable distribution of the world’s resources. At present, 20 percent of the world’ population living in the 30 richest countries consume over 80 percent of the world’s goods and services.
As if these demand pressures were not enough, there are emerging supply constraints as well. World cereal production per person has been on a downward trend since the late 1980s. It is estimated that by 2025 the number of people living in regions with absolute water scarcity will have risen to some 1.8 billion. Climate change, soil erosion, and overfishing are expected to dampen food production and are known to have been a driving force in the major surge in food prices in 2007-2008.
Thus, the fundamental development question which we face is how to reconcile the legitimate aspirations of citizens in the developing world for the high economic growth rates that in the post-war period led to such remarkable improvements in the global standards of living, with the challenges of an economic system under severe stress as a result of the pressures put on it by that very economic growth? Without doubt, issues of environmental sustainability will now become central to any discussion on the sort of public policies that are to be formulated to improved national competitiveness. Within this debate, we expect that there will scope

Key
ele
men
ts f
or
a 2
020
Com
pet
itiv
enes
s a
gen
da
in t
he
am
eriC
as
24
for deliberations on the opportunities that green innovation, biotechnology, and renewable energy could offer to countries in LAC, as climate change begins to create increasing incentives for the development of new technologies to address pressing environmental challenges.
A competitiveness framework
The above discussion is not meant to be exhaustive. The list of other factors which contribute to create an enabling environment for competitiveness is long and our intent has been to highlight a few of the key ones, without attempting to make a comprehensive analysis, which is beyond the scope of this paper. Questions that are also relevant include: What is the legal basis for secure intellectual property and contract rights? What is the structure and level of sophistication of the financial sector, and of the policies and regulations that affect it? Is the financial sector deep enough to allow reasonably free access to finance and the emergence of venture capital? Is the trade regime unduly restrictive, or it is reasonably open, encouraging competition and gains in efficiency? What
are the levels of spending in education, both in absolute terms (percent of GDP) and in relative terms (as percent of total government expenditure)? What is the proportion of university students enrolled in science and engineering? Is regulation of the labor market appropriate, or does it provide perverse incentives for both employers and workers? What are the penetration rates of the latest technologies? How effective is the government in providing information and public services for the people, and is this done through an electronic platform? Are public procurement policies and systems open and transparent and do they encourage the adoption of new technologies and reward innovation? What is the degree of collaboration between industry and the universities? Do they work independently from each other, or do they consult and give each other feedback?
One way to synthesize the above discussion is to lay out these various factors in four component elements of competitiveness, each capturing a distinctive dimension. While there is no unique way to do this, we believe that the four components identified in Appendix I below provide a reasonably comprehensive framework that provides sufficient analytical content, with the added advantage that it can be estimated from existing data sources. In the section that follows we choose key elements of this framework—again, with no attempt to be comprehensive but mainly to provide an overview—and ask ourselves how competitive are the economies of Latin America and the Caribbean?
20 percent of the world’
population living in the
30 richest countries
consume over 80
percent of the world’s
goods and services

25

26

27
How competitive are we?
IV.

Key
ele
men
ts f
or
a 2
020
Com
pet
itiv
enes
s a
gen
da
in t
he
am
eriC
as
28
Figure 2 below shows GDP per
capita over the period 1980-2008 for
Argentina, Brazil, Korea and Ireland. If
the primary purpose of implementing
productivity-enhancing policies and
reforms to boost competitiveness is
to generate processes of sustainable
growth in income per capita, what this
figure shows is that Argentina and
Brazil have succeeded to some extent,
but Korea and Ireland have succeeded
of time. This graph encapsulates in
a nutshell one of the key lessons that
comes out of a thorough examination
of a broad range of competitiveness
indicators in LAC over the past couple
of decades: we have generally made
improvements with respect to our past,
but not nearly as much as the Koreas
of this world and, therefore, we have
fallen behind on a relative basis. Let
us take a look at where we stand with
Figure 2. GDP per capita 1980-2008 (PPP in US$)
Argentina Brazil Korea Ireland
0
10,000
20,000
30,000
40,000
50,000
1980 1985 1990 1995 2000 2005 2010
42,110
27,692
14,408
10,466
Latin America and the Caribbean have generally made improvements with respect to our past, but not nearly as much as the Koreas of this world and, therefore, we have fallen behind on a relative basis
to a much, much greater extent. Indeed
what is a little perturbing about this
figure is that in 1980 Korea’s GDP per
capita was actually lower than that of
Argentina and Brazil; today it is 2 times
larger than that of Argentina and 3 times
larger than that of Brazil—an impressive
divergence over a relatively short span
respect to some of the key pillars of
competitiveness.
Education
Table 2 shows the results of the OECD’s
Program for International Student
Assessment (PISA) scores for a handful
of countries in the OECD and for all

29
IV. H
ow c
ompe
titi
ve a
re w
e?
the countries in Latin America which,
following Chile’s path-breaking example,
have asked the OECD to carry out these
evaluation tests in their countries as well.
As is well known PISA is an assessment
of student skills in three critical areas:
reading comprehension, mathematics
and science—it is a predictor of the
kinds of skills which will be found
in the country’s labor force. Several
observations are immediately apparent.
First, Chile and Uruguay—in that order—
are the best performers in Latin America,
followed by Mexico, Argentina, Brazil and
Colombia. Second, there is a significant
gap (about 41 points on average)
between Chile and Portugal and Spain,
two of the more mediocre performers
in the OECD and near the bottom in the
EU. So, even Chile does not measure up.
Third, the gap is huge with respect to
Finland (about 122 points on average),
the OECD’s top performer. Finally,
there appears to be an extremely close
correspondence between performance
in the PISA and the Innovation Capacity
Index, highlighting the critical role that
skills and training have for an extremely
important dimension of competitiveness.
These results are sobering for our
region and they are generally consistent
with other data which paints a broadly
similar picture (see Table 3). For instance,
tertiary enrollment rates are quite low.
Among 131 countries ranked, Brazil is
placed 68th, Mexico 67th, compared to
Korea (3rd), and Portugal (32nd). Annual
expenditure on education in LAC is, on
average, 3.6 percent of GDP, compared
to 6.5 percent of GDP in Finland and 7.4
percent of GDP in Sweden. So, without
Table 2 - PISA (Program for International Student Assessment)*
* PISA 2006: Science Competencies for Tomorrow’s World, Executive Summary; OECD 2007.
** Rankings for all participating countries. On the basis of the samples of students assessed by PISA, it is not always possible to say with confidencewhich of two countries with similar performance has a higher mean score for the whole population. However, it is possible to give a range of rankingswithin which each country falls.
Innovation Capacity Index

Key
ele
men
ts f
or
a 2
020
Com
pet
itiv
enes
s a
gen
da
in t
he
am
eriC
as
30
question, education has to be one of the
key priority areas for action in LAC and
RIAC could play an important catalytic
role in raising awareness among the
authorities that the region is falling
deficiencies in the educational system.
Incidentally, there is not a single Latin
American university among the best 220
in the world8. According to this particular
set of rankings, the Universidad Nacional
Table 3 - Human and Environmental Capital - Key variables
* Rank of 131** Rank of 163
8 - According to: http://www.topuniversities.com/world-university-rankings
Annual expenditure on education in LAC is, on average, 3.6 percent of GDP, compared to 6.5 percent of GDP in Finland and 7.4 percent of GDP in Sweden
behind. For a start, it would be vital to
expand the number of countries in LAC
that participate in the PISA. This is an
extremely important benchmarking
exercise and an excellent way to focus
the attention of the authorities on
Autónoma de México (UNAM) is the
best in the region, with a rank of 222,
and there are no others among the top
250. There are relatively low levels of
research and development spending in
the region, which, as might be expected,
31
has a counterpart in the inadequate
funding provided by the government
and the business community to the
universities. There is no well-established
tradition in Latin America of active
collaboration between the universities
and the business sector, a fertile source
of innovations in those countries that
have succeeded in nurturing this critical
relationship.
Regulatory framework
The private sector in Latin America
labors under the onerous weight of
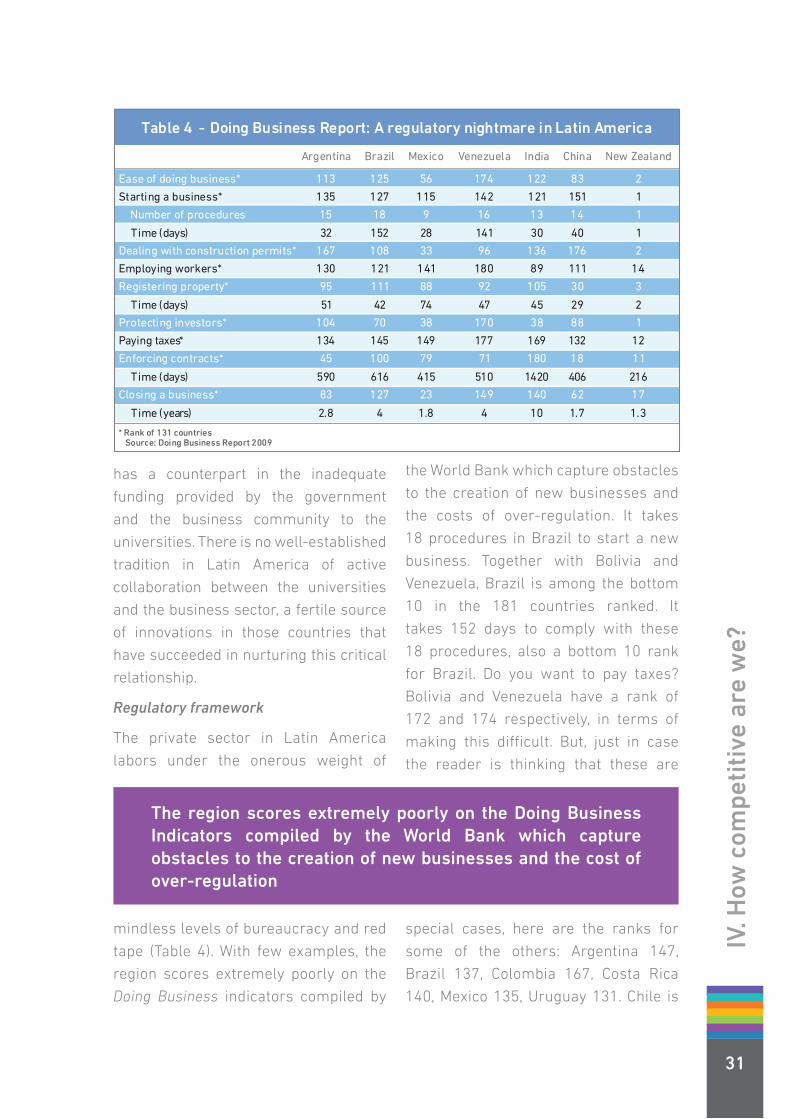
the World Bank which capture obstacles
to the creation of new businesses and
the costs of over-regulation. It takes
18 procedures in Brazil to start a new
business. Together with Bolivia and
Venezuela, Brazil is among the bottom
10 in the 181 countries ranked. It
takes 152 days to comply with these
18 procedures, also a bottom 10 rank
for Brazil. Do you want to pay taxes?
Bolivia and Venezuela have a rank of
172 and 174 respectively, in terms of
making this difficult. But, just in case
the reader is thinking that these are
IV. H
ow c
ompe
titi
ve a
re w
e?
* Rank of 131 countriesSource: Doing Business Report 2009
Table 4 - Doing Business Report: A regulatory nightmare in Latin America
The region scores extremely poorly on the Doing Business Indicators compiled by the World Bank which capture obstacles to the creation of new businesses and the cost of over-regulation
mindless levels of bureaucracy and red
tape (Table 4). With few examples, the
region scores extremely poorly on the
Doing Business indicators compiled by
special cases, here are the ranks for
some of the others: Argentina 147,
Brazil 137, Colombia 167, Costa Rica
140, Mexico 135, Uruguay 131. Chile is
Key
ele
men
ts f
or
a 2
020
Com
pet
itiv
enes
s a
gen
da
in t
he
am
eriC
as
32
34, more than 100 places ahead of the
rest. Chile aside, most other countries
seem to be saying: “want to pay your
taxes: please don’t bother, we are too
busy!” Registering property? It takes
14 procedures in Brazil and 45 days.
Enforcing contracts? 616 days in Brazil,
compared to 590 days in Argentina,
versus 20 days in Ireland. In Argentina
it takes 28 procedures to get a license,
demanding 338 days and costing the
applicant, on average, 234 percent of
income per capita, indicators which
earn Argentina a rank of 165 in this
indicator.
These results are simply appalling.
What is particularly troublesome (not to
say tragic) is that bureaucracy and red
tape are self-imposed evils. Countries in
the region may be price-takers for the
international commodities they export,
they may have little control over the
broader parameters that determine the
pace and the direction of the globalization
process, they may have been innocent
bystanders of the 2008-2009 financial
crisis which got underway with flaws
in the financial sectors of the advanced
economies, but they most definitely
have a large degree of control over the
bureaucratic obstacles they put in the
way of entrepreneurship and innovation.
This is yet another area in which we see
ample scope for RIAC to play an important
role in the region, both in terms of raising
awareness but, more importantly, in
collaborating with the private sector to
identify needless barriers to economic
growth and prosperity and working with
governments to remove them, as Chile
has successfully done over the past
quarter century.
Economists seem to be agreed that an
important source of corruption stems
from the distributional attributes of the
state. For better or for worse, the role of
the state in the economy has expanded
in a major way over the past century and
this has led to the proliferation of benefits
under its control and also in the various
ways in which the state imposes costs on
civil society and the business community.
While a large state need not necessarily
be associated with higher levels of
corruption—the Nordic countries have
the highest levels of public spending in
the world but are also the least corrupt—
it is the case that, at least in principle,
the larger the number of interactions
between officials and private citizens,
the larger the number of opportunities in
which the latter may wish to illegally pay
for benefits to which they are not entitled,
or avoid responsibilities or costs for
which they bear an obligation. In those
countries where the state is involved in
the distribution of social benefits, but
in ways that are not transparent, and
which may involve corruption, these
will not be equitably distributed and the
poor—less able to pay/bribe—will be at a
disadvantage. In such cases, the intent of
social policy will be distorted and, if the
problem is serious enough, perverted.
Governing often translates into the
issuing of licenses and permits. From
the cradle to the grave, the average
citizen has to enter into transactions

33
with some government office or
bureaucrat to obtain a birth certificate,
to get a passport, to pay taxes, to open
up a new business, to drive a car, to
register property, to engage in foreign
trade, to sell a good or service to the
government, to hire an employee,
to use the publicly provided health
services, to be allowed to build a house,
among countless others. There is thus
an additional interesting dimension
to bureaucracy and red tape in the
developing world including, of course
the LAC region. Studies have shown that
the prevalence of corruption is highly
correlated with the incidence of red
tape and excessive regulation. Figure 3
below shows the country rankings for
Transparency International’s Corruption
Perceptions Index and the rankings
for the World Bank’s Doing Business
Report for a total of 170 countries—
and it speaks for itself: the greater the
extent of bureaucracy and red tape, the
IV. H
ow c
ompe
titi
ve a
re w
e?
Figure 3. 2009 Corruption Perceptions Index vs Ease of Doing Business Ranks
0
40
80
120
160
200
0 40 80 120 160 200DBR
CP
I
Source: Transparency International and World Bank 2009 Doing Business Report
Table 5 - Corruption Perceptions IndexGeneral Ranks 2009: Latin America
Source: Transparency International
Key
ele
men
ts f
or
a 2
020
Com
pet
itiv
enes
s a
gen
da
in t
he
am
eriC
as
34
greater the incidence of corruption—the
correlation coefficient is close to 0.80.
Table 5 shows the actual corruption
rankings for several countries in LAC—
only three countries (Chile, Uruguay and
Costa Rica) are among the top 50.
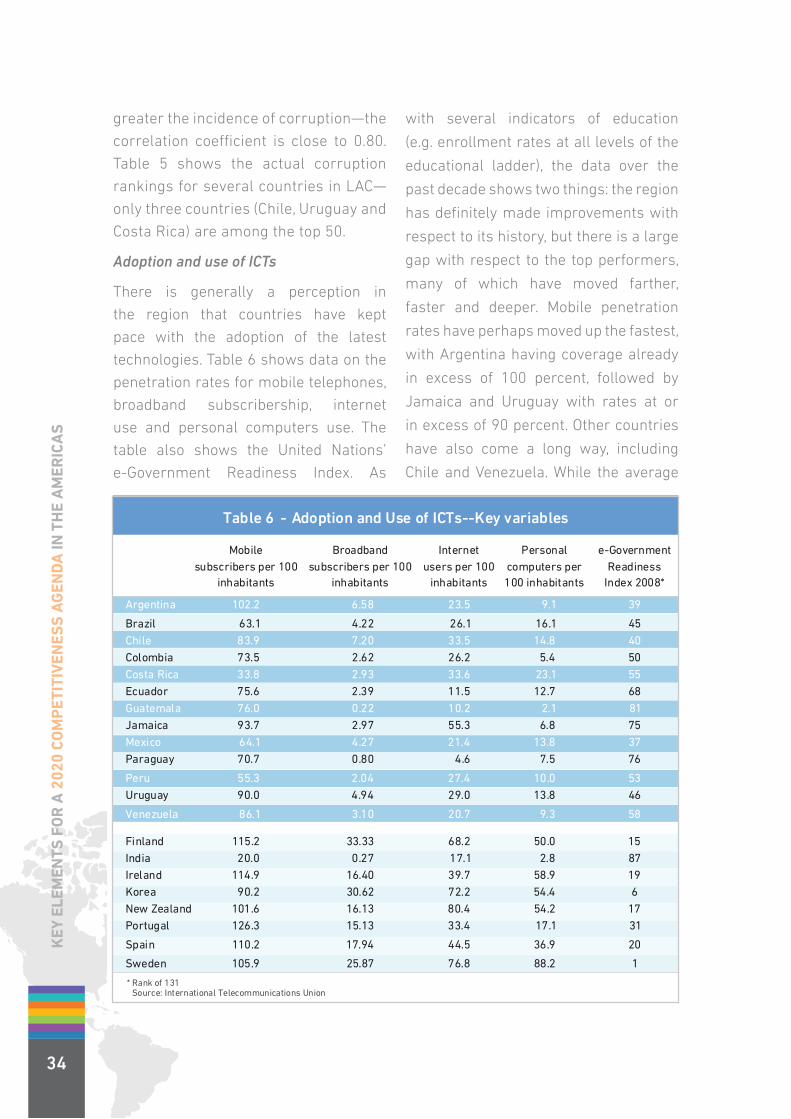
Adoption and use of ICTs
There is generally a perception in
the region that countries have kept
pace with the adoption of the latest
technologies. Table 6 shows data on the
penetration rates for mobile telephones,
broadband subscribership, internet
use and personal computers use. The
table also shows the United Nations’
e-Government Readiness Index. As
with several indicators of education
(e.g. enrollment rates at all levels of the
educational ladder), the data over the
past decade shows two things: the region
has definitely made improvements with
respect to its history, but there is a large
gap with respect to the top performers,
many of which have moved farther,
faster and deeper. Mobile penetration
rates have perhaps moved up the fastest,
with Argentina having coverage already
in excess of 100 percent, followed by
Jamaica and Uruguay with rates at or
in excess of 90 percent. Other countries
have also come a long way, including
Chile and Venezuela. While the average
Table 6 - Adoption and Use of ICTs--Key variables
* Rank of 131Source: International Telecommunications Union
35
for the region is still well below that
seen in the advanced economies, it is not
unreasonable to argue that the gap is
likely to narrow further in coming years.
In many countries in LAC mobile phones
have turned out to be an excellent way
to bypass the limitations associated with
fixed telephone lines, which tended to
be extremely scarce and costly, sharply
curtailing business productivity. Internet
use is highest in Jamaica (55 user per
100 inhabitants) and Costa Rica and
Chile (33.5 users per 100 inhabitants)
but, unlike mobile telephony, the gap
with respect to countries like Korea (72.2
users per 100 inhabitants) is very large
and is larger with respect to countries
like Netherlands and Norway (not shown
in Table 6) and New Zealand which are
all above 80 users per 100 inhabitants.
The gap with respect to the advanced
economies is even larger when
considering broadband penetration
rates where the region’s top performer—
Chile—has 7.2 users per 100 inhabitants,
compared to over 30 in Korea, Finland,
Netherlands, Norway and Switzerland.
Costa Rica leads the region in personal
computer use but at rates that are still
less than half those of Korea and less
than a third of Canada, Netherlands
and Switzerland, among others. Table
6 also shows the rankings—among
131 countries—for the United Nations
e-Government Readiness Index.
E-government is defined as the use of
ICT and its application by the government
for the provision of information and
public services to the people. The aim
of e-government therefore is to provide
efficient government management of
information to the citizen, better service
delivery to citizens, and empowerment of
the people through access to information
and participation in public policy decision
making. Mexico, Argentina, and Chile are
LAC’s top performers, roughly on a par
with Bulgaria, Greece, Latvia, Croatia,
and the Slovak Republic and well below
Korea.
In Chile, the use of online platforms to
facilitate the government’s interactions
with civil society and the business
community has been particularly
successful in the areas of tax collection,
public procurement, and red tape. The
Internal Revenue Service (IRS)9 was
the first government agency to adopt
the Internet as a tool to enhance the
quality of client services, to improve
tax administration, and add a degree of
transparency to interactions between
the agency and taxpayers. Through its
Website, the Chilean IRS processes
IV. H
ow c
ompe
titi
ve a
re w
e?
9 - See www.sii.cl
In many countries in LAC mobile phones have turned out to be an excellent way to bypass the limitations associated with fixed telephone lines, which tended to be extremely scarce and costly, sharply curtailing business productivity
Key
ele
men
ts f
or
a 2
020
Com
pet
itiv
enes
s a
gen
da
in t
he
am
eriC
as
36
the delivery of annual and monthly
income tax statements, electronic
invoicing and fee billing, and electronic
start-up application forms. It also has
a service which provides assistance
to small businesses with accounting
and electronic invoicing. The Chilean
IRS is one of the most modern tax
administrations in the world. Indeed, its
success has spurred other public and
private agencies in Chile and abroad to
use similar electronic platforms to deal
with clients. High levels of compliance
a level playing field for suppliers, fairly
clear bidding procedures, and so on. Of
course, there is a wide variety of country
practice. Often, the poorer the country,
the more archaic—and hence the more
vulnerable to corruption—the rules
governing public procurement.
As with tax collection, Chile has used
the latest technologies to create one
of the world’s most transparent public
procurement systems in the world. www.
MercadoPúblico.cl, better known as
ChileCompra.it was launched in 2000, and
In Chile, the use of online platforms to facilitate the government’s interactions with civil society and the business community has been particularly successful in the areas of tax collection, public procurement, and red tape
have shown not only that technology can
help eliminate corruption in the payment
of taxes, but contribute to improve overall
efficiency. The statistics are impressive:
over 98 percent of Chilean tax-payers
state and pay their income taxes through
the Internet, amounting to over 2 million
statements filed during 2009.
With the increasing presence of the state
in the economy, purchases of goods and
services by the state can be sizable, in
most countries somewhere between
5-10 percent of GDP, or equivalent to
somewhere between US$ 3-6 trillion
on an annual basis worldwide, a huge
sum. Because the awarding of contracts
can involve a measure of bureaucratic
discretion, more and more countries
have opted for procedures that guarantee
adequate levels of openness, competition,
is a public electronic system for purchasing
and hiring, based on an Internet platform.
It has earned a worldwide reputation for
excellence, transparency and efficiency. It
serves companies, public organizations
(including universities, hospitals, schools,
the military, government ministries,
and Congress, among others) as well
as individual citizens, and is by far the
largest business-to-business site in Chile.
Involving 850 purchasing organizations, in
2009 registered users completed 450,000
purchases issuing invoices totaling US$6
billion. It has also been a catalyst for
the use of the Internet throughout the
country. The third area in which Chile
has spearheaded the use of technology
to improve the efficiency of the state
is in the area of red tape. ChileClic is a
government site coordinating the work
37
of over 150 government agencies and
private institutions, and managing close
to 450 administrative processes online,
including birth certificates, identity
documents, pension fund payments,
trademarks/patents, housing subsidies,
university credits, and so on. The site
receives an average of more than 3
million visits per year.
The authorities in Chile have shown
remarkable leadership as well in
identifying the key challenges ahead to
strengthen the role of ICTs in improving
productivity and in boosting the
innovation capacities of the public and
private sectors and civil society. In this
respect they feel that it is necessary to
expand and intensify the integration of
digital technologies in the educational
curriculum and to improve the education
and training of highly qualified workers. It
is also necessary in their view to enhance
connectivity, especially among the lowest
four-fifths of the income distribution, by
overcoming unequal income distribution,
restrictions facing micro- and small
companies, and connectivity problems
in rural and remote regions. They would
also like to encourage the development
by the private sector of computer
packages for low-income households
and micro-companies to access Internet
more cheaply and effectively as well as
to continue government subsidies for
rural and remote areas and low-income
communities and microcompanies.
Priority is also being given to increase
R&D in the use of ICTs to stimulate
competitiveness of the main export
sectors and to rectify limitations in the
legal system and provide appropriate
institutional framework to stimulate/
encourage e-trade, e-government, and
use of ICTs, to assure public trust in
electronic operations and platforms.
Finally, priority is also being given to
facilitate the takeoff of the ICT industry by
improving virtuous cycles of cooperation
between institutions of higher education
and the business community. This is
seen as essential to narrow the skills
gap that exists today between Chile and
the average in the OECD, made evident
by the results of the PISA tests.
In all these areas, there is ample
scope for technical assistance from
the international financial institutions,
particularly the World Bank. Chile was
able to implement the above reforms
because it had the financial means,
the human capital resources, and
the strong backing of its politicians
to use technologies to improve the
efficiency of public services. Many
developing countries may have the
will to implement similar reforms, but
often lack the funding or the technical
means to put such systems in place.
Over the past several decades, we have
tended to underestimate the relative
importance of technical assistance
in foreign aid programs. Often the
knowledge gap—the inability to tap into
best practices because countries do not
have adequate human resources to run
programs like ChileCompra—is far more
insurmountable than the financial gap,
which donors can fund.
IV. H
ow c
ompe
titi
ve a
re w
e?

Key
ele
men
ts f
or
a 2
020
Com
pet
itiv
enes
s a
gen
da
in t
he
am
eriC
as
38
Environment
One of the leading efforts to measure the
effectiveness of national environmental
protection policies in a large number
of countries is the Environmental
Performance Index (EPI) compiled
jointly by the Yale University’s Center
for Environmental Law and Policy
and Columbia University’s Center for
International Earth Science Information
Network. The EPI measures two core
objectives of environmental policy:
environmental health, which measures
environmental stresses to human
health; and ecosystem vitality, which
measures ecosystem health and natural
resource management. The EPI used
25 indicators that capture various
dimensions of environmental policy,
such as the environmental burden of
disease, water resources for human
health, air quality for human health, air
quality for ecosystems, water resources
for ecosystems, biodiversity and habitat,
forestry, fisheries, agriculture, and
climate change. According to the authors
of the EPI Report: “the 25 indicators
reflect state-of-the-art data and the best
current thinking in environmental health
and ecological science. Some represent
direct measures of issue areas, others
are proxy measures that offer a rougher
gauge of policy progress by tracking
a correlated variable. Each indicator
corresponds to a long-term public health
or ecosystem sustainability target.”10 It is
noteworthy that, unlike many of the other
areas analyzed thus far (e.g., education,
the regulatory framework, the adoption
of new technologies) the LAC region does
have two top-ten performers among the
163 countries ranked in 2010 by the
EPI: Costa Rica is 3rd and Colombia is
10th , with Chile in 16th place. We are
of the view that high-carbon economies
in the future will become increasingly
uncompetitive and that those countries
which move early on to deal with some
of the critical environmental challenges
we have identified above and gear up
to move to low-carbon technologies
and to a more effective management of
national ecosystems will be winners. It
is encouraging to know that this is one
area in which the region could fruitfully
contribute to the international debate on
how to do this in a cost-effective way.
Other areas
It is beyond the scope of this paper
to provide a more comprehensive
assessment of the key competitiveness
challenges facing the LAC region—the
above analysis provides, in our view, an
appropriate overview. Two areas that
perhaps deserve here brief mention are
income disparities and the efficiency of
public spending. Gini coefficients (see
Table 3) for countries in Latin America
are among the highest in the world.
Gini coefficients for most countries
are somewhere between 25 and 60.
The Nordic countries, among the most
egalitarian, have Gini values in the mid-
twenties as does Japan. The United
States has a Gini coefficient of 40.8 and
China an even higher one of 41.5. Some
10 - 2010 Environmental Performance Index, available at http://epi.yale.edu/file_columns/0000/0151/epi2010_report.pdf

39
of the highest coefficients can be found
in Latin America and Africa, with Gini
values in the 50s and some, like Brazil,
Colombia, Bolivia and South Africa,
are actually closer to 55-60. Economic
growth will reduce poverty, there is
a close correspondence between the
growth of per capita GDP and the gains
made by the poor—this is one of the main
lessons to emerge from the post World
War II period. But it will not necessarily
reduce income inequality; indeed, in
some cases, depending on the country’s
stage of development, it may well widen
it. Of course, one also worries about
widening inequalities because of some
of the consequences they bring about,
such as an increase in the likelihood
of a breakdown of democracy, or a
postponement in the onset of democracy
in authoritarian regimes, as has been
established in a number of empirical
studies.
The second area has to do with
enormous inefficiencies in the structure
and priorities of government spending in
much of the region. Large public sector
deficits are no longer the problem—but
rather of concern are the opportunity costs
associated with misguided spending
priorities. According to a study by the
International Energy Agency released
ahead of the latest G20 meeting in Korea
“37 large developing countries spent
about $557 billion in energy subsidies”11
in 2008. According to the IEA’s chief
economist “fossil fuel subsidies are IV. H
ow c
ompe
titi
ve a
re w
e?
the appendicitis of the global energy
system which needs to be removed
for a healthy, sustainable development
future.” According to the study “energy
consumption could be reduced by 850
million tonnes equivalent of oil—or
the combined current consumption of
Japan, South Korea, Australia and New
Zealand—if the subsidies are phased
out between now and 2020.” A similar
study by the IMF notes that “the benefits
of gasoline subsidies are the most
regressively distributed, with over 80
percent of total benefits accruing to
the richest 40 percent of households.
For diesel and liquefied petroleum gas
(LPG), respectively, over 65 percent
and 70 percent of benefits go to these
income groups.” The authors argue
further that reducing fuel subsidies by
half “would result in greenhouse gas
emissions reductions of 14-17 percent
by 2050 (p. 12).”12 It goes without
saying that a large part of this problem
is concentrated in LAC, where energy
subsidies are ubiquitous and where
governments in general have not paused
to think about the opportunity costs in
terms of education, public health and
infrastructure, areas where the region
lags behind and where investments
are productivity-enhancing. Of course,
a gradual phasing out of regressive
subsidies would go some way toward
empowering governments to implement
policies that would be more proactive in
terms of reducing income inequalities.
11 - “World Spends more than $550bn a year on energy aid, says IEA”, Financial Times, June 7, 2010.
12 - Coady, David, Robert Gillingham, Rolando Ossowski, John Piotrowski, Shamsuddin Tareq, and Justin Tyson. 2010. “Petroleum Product Subsidies: Costly, Inequitable, and Rising”, IMF Staff Position Note, International Monetary Fund, Washington, DC.

40

41
RIAC and the promotion of acompetitiveness agenda in LAC
V.
Key
ele
men
ts f
or
a 2
020
Com
pet
itiv
enes
s a
gen
da
in t
he
am
eriC
as
42
The previous section has provided
a survey of the key competitiveness
challenges facing Latin America and the
Caribbean in the near term. The picture
that emerges is one of countries that,
having made some progress in recent
years with respect to past performance,
have not done so in a way that has kept
pace with the rhythm of reforms in many
other parts of the world, particularly Asia,
but also, for instance, the countries of
Central and Eastern Europe all of which
(save for Chile) are more competitive
than every other country in LAC.
In thinking about creative ways in which
RIAC could engage in the promotion of
a competitiveness agenda in LAC we
of sustainable economic growth with
more and better jobs and greater social
cohesion.”13 As part of the Strategy
governments laid out a medium-term
reform program intended to tackle
perceived weaknesses in critical areas14.
While the goals set out in 2000 have
partly fallen victims to the constraints
imposed on governments by the global
financial crisis, there is little doubt that
Lisbon markedly contributed to a better
identification of policy priorities and
to focus debate on the key structural
reform challenges facing Europe. We
are unaware of any similar regional
initiative in Asia. However, it is the
case that countries in Asia (Korea,
13 - See “Presidency Conclusions”, Lisbon European Council, 23 and 24 March 2000, Press Release Library, European Commission.Outlook.
14 - Among the reform areas identified in the Lisbon Strategy are: liberalization of the regulatory framework to guarantee completion of the EU’s single market; developing a European area for innovation, research and development; increasing social inclusion; and enhancing sustainable development.
An important benchmark in terms of regional programs to promote issues of competitiveness was that launched by EU members a decade ago, under the banner of the Lisbon Strategy
have examined the experience of other
regions. An important benchmark in
terms of regional programs to promote
issues of competitiveness was that
launched by EU members a decade ago,
under the banner of the Lisbon Strategy.
The Lisbon Strategy was adopted by
EU governments in 2000, identifying
a number of areas where reforms
were needed to make the EU “the most
competitive and dynamic knowledge-
based economy in the world, capable
Singapore, and Taiwan, come quickly
to mind and, more recently, India and
China) take competitiveness issues
extremely seriously. Indeed, it is this
focus on reforms aimed at enhancing
productivity and tackling inefficiencies
and bottlenecks in their respective
economies that is mainly responsible for
the strong economic performance of Asia
in the past two decades with respect to
the more subdued performance of LAC
and, indeed, other regions of the world.

43
V. R
IAC
and
the
prom
otio
n of
a c
ompe
titi
vene
ss a
gend
a in
LA
C
We are of the view that to have a
meaningful periodic exchange of views on
competitiveness issues and performance
among RIAC members it is necessary
to have a quantified competitiveness
framework as a platform to stimulate
debate and provide an intellectual
context. There is, of course, no unique
way to develop such a framework and
the 4 areas offered in Appendix I at the
end of this paper are one such possibility
which, in our view, bring in some of the
most critically important dimensions
The question that now emerges is: in what
ways can RIAC contribute to promote
a competitiveness agenda in LAC that
succeeds in engaging the attention and
the commitment of governments and
the private sector? We have a number of
recommendations:
1. The meeting in Atlanta is obviously
important in terms of formulating
such a strategy. This paper
has provided an overview of
competitiveness issues in the region
mainly as a way to suggest priorities
for action. We believe that an
important element of the program in
Atlanta should focus on an analysis
of where we stand in a number of
these key areas and how different
countries in the region are coping
with these challenges. Four such
areas that readily come to mind are
education, the regulatory framework,
the use of the latest technologies to
enhance the efficiency of the public
sector, and the various ways in which
countries are beginning to formulate
better policies for the low-carbon
economy of the future.
2. There seems to be broad consensus
among RIAC representatives that
a systematic exchange of views on
relevant country experiences in the area
of competitiveness has to be a central
element of RIAC’s work program. There
is, in our view, considerable scope for
a useful sharing of such experiences,
focused on creative ways in which
countries have met some success in
introducing productivity-enhancing
We are of the view that to have a meaningful periodic exchange of views on competitiveness issues and performance among RIAC members it is necessary to have a quantified competitiveness framework as a platform to stimulate debate and provide an intellectual context
of competitiveness. Unlike other
competitiveness indices, however, it has
the virtue of overwhelmingly relying on
hard data and incorporating within its
structure aspects which have in recent
years emerged as important building
blocks in the debate over what sorts of
factors and policies will contribute to
enhance productivity and allow for high-
quality sustainable growth.

Key
ele
men
ts f
or
a 2
020
Com
pet
itiv
enes
s a
gen
da
in t
he
am
eriC
as
44
reforms. The meeting in Atlanta could
be the starting point of a sustained
process of cross-fertilization of ideas
and experiences, with countries sharing
and comparing notes on various
dimensions of the competitiveness
agenda. What were the critical elements
behind the introduction of Chile’s highly
successful electronic platform for
public procurement? What has Costa
Rica done right to have attained a rank of
3rd in the Environmental Performance
Index? What has been the experience
in Chile, Uruguay, Mexico, Argentina,
Colombia and Brazil with the OECD’s
PISA (Program for International Student
Assessment) and has it facilitated
the formulation of better policies to
improve the educational system? Is the
region producing enough engineers and
scientists and, if not, why not? Why is the
region lagging so far behind the rest of
the world in creating a more intelligent
regulatory framework and how can
governments and the private sector
work together in the identification and
subsequent gradual elimination of
mindless bureaucracy and red tape?
How successful have countries been
in improving girls education and in
removing various obstacles to a fuller
participation of women in decision
making bodies, both in government and
in business? Some countries have been
more successful in weaning themselves
away from regressive energy subsidies
while others seem to be stuck in a
vicious circle where large subsidies
(sometimes exceeding spending on
education) limit the government’s ability
to invest in areas that are far more
likely to boost competitiveness over
the medium-term. What explains these
differences in country experience? Can
other countries in the region follow
Chile’s example and earn entry into the
OECD, something that now will allow the
government regularly to benchmark
itself against the extremely useful set of
market regulation indicators developed
by that organization to “assess the extent
to which the regulatory environment
promotes or inhibits competition in
markets where technology and market
conditions make competition viable”?
3. While the beginnings of a useful
debate on the above issues could
be very much part of the program in
Atlanta, we need to also give some
thought to the next stage, namely,
finding a forum (that is, a home) for
an ongoing periodic consultation
in a way that is structured and
There seems to be
broad consensus among
RIAC representatives
that a systematic
exchange of views
on relevant country
experiences in the area
of competitiveness has
to be a central element
of RIAC’s work program

45
evolutionary in character. A natural
starting point could be the Summit
of the Americas, of which the OAS is
the Secretariat. This gathering has
the advantage that it brings together
heads of state and government and
would provide an ideal opportunity
to engage senior decisionmakers on
the broad array of competitiveness
challenges facing the region. Another
possibility would be to explore the
inclusion of a competitiveness chapter
in the Ibero-American Summit
organized by the Ibero-American
General Secretariat (SEGIB), which
also benefits from the participation
of senior business community
representatives. Alternatively, one
could hold a Competitiveness Forum
in parallel to the Summit, drawing
from the presence of senior officials
and leading business executives.
more technical level the Americas
Competitiveness Forum (ACF) is, of
course, already an ideal forum to
bring together the innovation and
competitiveness authorities and
councils to explore issues of common
interest. In time, one could explore
the possibility of adding a second
yearly gathering of experts, perhaps
in preparation for the ACF.
4. It would seem that there is an
opportunity for RIAC to catalyze
a process of collaboration on
competitiveness issues with the
key international development
organizations, particularly the World
Bank (WB), the IMF, the Inter-American
Development Bank (IDB) and the
Andean Development Corporation
(CAF) . The multilateral organizations
are closely aligned with the promotion
of improvements in the investment
V. R
IAC
and
the
prom
otio
n of
a c
ompe
titi
vene
ss a
gend
a in
LA
C
It would seem that there is an opportunity for RIAC to catalyze a process of collaboration on competitiveness issues with the key international development organizations, particularly the World Bank (WB), the International Monetary Fund (IMF), the Inter-American Development Bank (IDB) and the Andean Development Corporation (CAF)
To the extent that there is a need
for closer collaboration between
government and the private sector
on competitiveness issues and the
associated reform agenda, this model
could provide beneficial synergies
and, of course, would not preclude
other initiatives aimed at promoting
the competitiveness agenda. At a
climate—indeed, the whole range of
factors which are identified in the 4
areas discussed above (regulatory
and legal framework, human and
environmental capital, adoption and
use of ICTs, and the institutional
environment). We see no reason why
the multilateral organizations could
not be approached by the OAS to
Key
ele
men
ts f
or
a 2
020
Com
pet
itiv
enes
s a
gen
da
in t
he
am
eriC
as
46
help fund an annual Competitiveness
Forum in LAC that would bring
together policy makers and business
community representatives, to
review the reform agenda, to share
experiences, and, more generally, to
more firmly implant competitiveness
within national plans and priorities.
This collaboration could be a key
element behind the positioning of RIAC
as a unique forum for public-private
partnerships (including academia) to
address the different competitiveness
challenges facing the region, including
in the areas of innovation, productivity
and logistics, among others.
5. One way to ensure sustained interest
in the implementation of an ambitious
agenda of reforms aimed at boosting
LAC’s competitiveness profile would
be to secure commitment from heads
of state and governments to the
equivalent of the EU’s Lisbon Strategy
approved in 2000. The benefits of
framing a reform agenda over a 10-
year period with a well-identified
set of priorities over a range of key
areas are obvious. As we have seen
above, most of the weaknesses
currently afflicting the LAC region
will not be addressed overnight.
They are not in the nature of short-
term macroeconomic stabilization
measures; rather they are more in the
spirit of structural and institutional
reforms which necessarily have to be
framed in a medium-term perspective.
Something like a “Latin American
Competitiveness Strategy 2020“
could become an effective instrument
to promote reforms in the region.
Securing support for it at the highest
political levels would, of course, be
essential. Identifying a set of well-
defined goals in key areas would also
be an unavoidable requirement—
in this respect something like the
structure proposed in Appendix I
(see also paragraph 6 below) could
be an extremely useful tracking tool.
One obvious advantage that readily
emerges is that a Competitiveness
Strategy 2020 could provide critically
important content to many of the
high-level gatherings that with
predictable regularity bring senior
politicians and civil servants together
to discuss issues of common interest.
To add a competitiveness dimension
to these gatherings would be highly
advantageous, given the challenges
the region faces, with the emergence
of Asia in particular. Of course, RIAC
and the OAS could play a catalytic
role in moving governments and the
private sector in this direction. Indeed,
in the region there is a great need for
a multi-stakeholder platform that
will gradually see competitiveness-
enhancing reforms as part of a joint
collaborative undertaking between
the state, the business community
and civil society that goes beyond
the political cycles that often
provide short-term motivations to
governments.
6. To provide a quantified framework
for on-going discussions and

47
consultations on competitiveness
issues as proposed in the preceding
paragraphs, we think that the annual
estimation of four competitiveness
sub-indices covering the regulatory
and legal framework, human
and environmental capital, the
adoption and use of information and
communication technologies, and the
institutional environment, would be
an extremely useful exercise. These
sub-indices would enrich the debate
advantage that it would not require
a RIAC-sponsored business survey
but could be compiled and estimated,
as noted earlier, utilizing readily
available international data sources.
7. To the extent that RIAC succeeds in
inserting competitiveness issues into
the national policy agenda it will also
succeed in generating interest with
the general public and the media. We
agree that it is important to capture
the attention of print journalism and
We think that the annual estimation of four competitiveness sub-indices covering the regulatory and legal framework, human and environmental capital, the adoption and use of information and communication technologies, and the institutional environment, would be an extremely useful exercise
and make possible meaningful cross
country comparisons (including
vis-à-vis relevant top performers
outside the LAC region) and, over
time, comparisons with respect to a
country’s own historical performance.
Furthermore, the structure proposed
in Appendix I has the additional
TV, as part of efforts to shape public
opinion and engender support for
reforms within civil society. But this
presupposes that we have a solid
“output” that can garner the interest
of the public and begin to generate a
consensus in favor of change.V.
RIA
C a
nd th
e pr
omot
ion
of a
com
peti
tive
ness
age
nda
in L
AC

48

49
A Competitiveness Framework
Appendix I:
Key
ele
men
ts f
or
a 2
020
Com
pet
itiv
enes
s a
gen
da
in t
he
am
eriC
as
50
As noted earlier, competitiveness has
many dimensions. Below we present
four aspects of competitiveness which
capture key elements of the regulatory
and legal framework, a country’s human
and environmental capital, the use and
adoption of the latest technologies and
the institutional environment.
Regulatory and legal framework
A. Doing business
1. Starting a business
•Numberofprocedures
•Time(days)
•Cost(as%ofincomepercapita)
2. Ease of employing workers
•Easeofemployingworkers
3. Paying taxes
•Payingtaxes
4. Protecting investors
•Strengthofinvestorprotection
5. Registering property
•Numberofprocedures
•Time(days)
•Cost(as%ofpropertyvalue)
6. Other regulatory
•Dealingwithconstruction
permits
•Closingabusiness
Human and environmental capital
A. Education
• Adultliteracyrate(%aged15and
older)
• Secondarygrossenrolmentratio
(%)
• Tertiarygrossenrolmentratio(%)
• Expenditureineducation(as%of
GDP)
• Qualityoftheeducationalsystem
• Qualityoftheinstitutionsofhigher
education
B. Sustainability and equity
• GenderEquity
• Environmentalsustainability
• Healthworkerdensity
• Inequalitymeasure:ratioofrichest
20%topoorest20%
Adoption and use of information and
communication technologies
A. Telephone communications
• Main(fixed)telephonelinesper
100 inhabitants
• Waitinglistformain(fixed)lines
per 1000 inhabitants
• Businessconnectioncharge(as%
of GDP/capita)
• Businessmonthlysubscription(as
%ofGDP/capita)
• Residentialconnectioncharge(as
%ofGDP/capita)
• Residentialmonthlysubscription
(as%ofGDP/capita)
B. Mobile cellular communications
• Subscribersper100inhabitants
• Prepaidsubscribersper100
inhabitants

51
App
endi
x I:
A C
ompe
titi
vene
ss F
ram
ewor
k
• Populationcoverage(%)
• Connectioncharge(as%ofGDP/
capita)
C. Internet, computers and TV
• Totalfixedinternetsubscribersper
100 inhabitants
• Totalfixedbroadbandsubscribers
per 100 inhabitants
• Internetusersper100inhabitants
• Personalcomputersper100
inhabitants
• Televisionreceiversper100
inhabitants
D. Government ICT usage
• E-governmentreadinessindex
E. Quality of the infrastructure
• Electrificationrate(%)
• Electricpowertransmissionand
distributionlosses(as%ofoutput)
• Roadspaved(as%oftotalroads)
Institutional environment
A. Good governance
• Voiceandaccountability
• Politicalstability
• Governmenteffectiveness
• Ruleoflaw
• Propertyrightsframework
• Transparencyandjudicial
independence
• CorruptionPerceptionsIndex(TI)
B. Country policy assessment
1. Public sector management
•Qualityofbudgetaryandfinancial
management
•Qualityofpublicadministration
2. Structural policies
•Financialsectorefficiency
•Tradeopenness
•Foreigndirectinvestmentgross
inflows(as%ofGDP)
3. Macroeconomy
•Debtlevels
•Fiscalbalance
•Macrostability
•Realeffectiveexchangerate