26
Key findings from the national Accident and Emergency patient survey 2014

Key findings from the national
Accident and Emergency patient survey 2014
Key findings from the national Accident and Emergency patient survey 2014 2
Summary
For many people who have a health crisis their local accident and emergency (A&E) department is one of the first places they will go to seek help. There have been a number of changes to the way urgent and emergency care is organised, with patients encouraged to use NHS 111 and Urgent Care Centres, which have been established helping to divert the less urgent cases from A&E departments. A&E is one of the eight core services that CQC inspects and rates in acute hospitals, and patients’ experiences of care are a key aspect in determining these ratings. In October 2014 we published our 2013/14 report, “the State of Health Care and Adult Social Care in England”. In that report we said that, to date, A&E had the highest proportion of inadequate ratings from our inspections and that overcrowding, long waiting times, and insufficient staffing levels were common problems.1 These problems typically affect the ratings for our key questions (are services safe, effective, caring, responsive and well-led) with the exception of caring which focuses on the quality of the interaction between staff and patients. The 2014 Accident and Emergency Patient Survey shows an encouraging picture of patients’ overall experience of A&E. Most patients (80%) told us that their overall experience of attending A&E was good, rating it seven or above out of ten. The results are also encouraging about how caring A&E services are nationally:
• 79% of respondents felt that they were treated with respect and dignity all of the time while they were in A&E.
• The survey shows that despite pressures, many patients say they are being well cared for by doctors and nurses with only 3% of people saying that the doctors and nurses that treated them didn’t listen to what they had to say, for example.
• Similarly, experiences of discharge are beginning to improve. However, there is still a long way to go to ensure that patients have the information they need when they leave A&E. It is not acceptable, for example, that 42% of patients receiving new medications were not told about possible side effects or that 22% were not give any information or not enough about their care and treatment. It is also concerning that patients said that their home and family circumstances were not always taken into account as part of discharge planning including, for example 51% of 76-85 year olds and 42% of those over 85. It is also concerning that 22% of all patients who were feeling distressed were not reassured by a staff member. This is worse for those with a mental health condition (33%) or a learning disability (31%) and more must be done to support vulnerable patients.
1 Our early inspections of NHS acute hospitals under our new approach mostly focused on those that were deemed higher risk, and so this early picture is not representative of acute hospitals across England.

Key findings from the national Accident and Emergency patient survey 2014 3
Nationally, more needs to be done to ensure that A&E services are safe, effective and responsive2:
• Many people are waiting too long to be seen and treated in A&E. Around one in 10 patients (11%) arriving by ambulance waited over 30 minutes to be handed over to A&E. This is not acceptable and hospitals and ambulance providers must work together to ensure patients are transferred as soon as possible to avoid unnecessary clinical risks.
• 13% of patients who requested pain relief medication stated that they waited at least half an hour before they received it.
There also remains wide variation in patients’ experiences, particularly between trusts but also, for example, for patients who re-attend A&E. While some trusts are performing well there remains a significant number of trusts where patients’ experiences are worse than we would expect. We will use these results to support Intelligent Monitoring to help us to decide when, where, and what to inspect. They will also form a key source of evidence to support the judgements and ratings we publish for acute trusts with A&E departments. We would also encourage all trusts to use their results to identify and make the improvements they need in order to deliver a better experience for every patient.
2 The survey does not ask questions directly about aspects of ‘well-led’. This reflects the focus of the survey on the experiences of patients, which is based mostly around the other key questions, particularly ‘caring’.

Key findings from the national Accident and Emergency patient survey 2014 4
Introduction The 2014 A&E survey involved patients who had attended one of 142 acute and specialist NHS trusts with a major accident and emergency department.3 Patients visited A&E during January, February or March 2014.
Responses were received from almost 40,000 patients, a response rate of 34%. In 2012 the response rate was 38%. Patients were eligible to take part in the survey if they were aged 16 years or older and were not staying in hospital at the time the patients were sampled. Women with certain obstetric or pregnancy related conditions were excluded from the survey to minimise distress and protect their confidentiality. Questionnaires and reminders were sent out to patients between May and September 2014.
The survey was developed and co-ordinated by Picker Institute Europe, a charity specialising in the measurement of people’s experiences of care. This report sets out key findings from the 2014 survey and, where relevant, compares results with findings from the previous survey, taken in 2012.4 Alongside the results, we discuss what these findings say about how patients experience care provided by A&E services. Who responded?
Basic demographic information was collected for everyone who took part in the survey. Full details can be found in the ‘national tables’ document (see further information). However, we note certain characteristics of respondents in this report where they reveal differences in the profile of A&E patients since the 2012 survey, or where results flag issues potentially important to the effective operation of A&E services. Older patients In the 2014 survey there was an increase in the percentage of respondents aged over 65 (45% in 2014 compared with 40% in 2012). This rise in older respondents is partly explained by the increased use nationally of A&E services by older patients.5 We know older patients tend to be more positive in their feedback about NHS services than younger age groups.6 This means the slightly older sample composition in 2014 could have contributed to some of the positive changes seen since 2012. However, we have checked the results for each age group where there have been improvements in results between the two
3 Trusts were eligible to participate if they had a major or consultant-led 24 hour service with full resuscitation facilities and designated accommodation for the reception of accident and emergency patients. However the A&E at Mid Staffordshire NHS Trust was only open for reduced hours during the survey period. 4 Only statistically significant changes are reported, which means that where differences between surveys are mentioned, they are very unlikely to have occurred by chance. All findings are available in the national tables document (see further information). 5 Analysis of Hospital Episode Statistics data undertaken by CQC, which showed increase of 1% point in the proportion of people over 65 between the two survey periods. 6 Healthcare Commission, Variations in the experiences of patients in England: Analysis of the Healthcare Commission’s 2003/04 national surveys of patients, October 2005

Key findings from the national Accident and Emergency patient survey 2014 5
surveys. In most cases every age group reported an improvement. Therefore where positive trends are reported, these improvements would have been evident even if the age profile of respondents had remained the same. Who is going to A&E? One in three respondents (33%) had been to the same A&E for the same (or related) condition previously. Fourteen per cent had attended within the past week or month. People were asked how they had decided whether they should go to A&E and who advised them to go. Just over a quarter of people made this decision themselves. Of particular note, 14% were told by their local GP to attend A&E and 3% by an out-of-hours GP. A higher proportion of respondents said they arrived at A&E in an ambulance than in 2012 (41% compared with 39%). Hospital Episodes Statistics (HES) data shows a broadly comparable increase with 36% of patients nationally arriving at A&E in an ambulance in 2014, up from 35% in 2012.7 There have been a number of recent changes to the way urgent and emergency care is organised, with patients encouraged to use NHS 111 to determine the appropriate local options for advice and care. A substantial number of Urgent Care Centres have been established helping to divert the less urgent cases from A&E departments, and those units are not covered by this survey. The types of patient seen at Urgent Care Centres are likely to have different needs and expectations, and the finding that a higher proportion arrived by ambulance in 2014 could indicate that there is a slight difference in the types of patients compared with those in 2012. Results of the survey should be considered in this light as some of the changes across the survey years could in part be explained by the different profile of respondents.
7 Analysis of Hospital Episode Statistics data undertaken by CQC of ambulance arrivals during survey sampling periods.
How the key findings displayed
CQC regulates all providers to ensure that services are safe, effective, caring, responsive and well-led. To do that our inspection teams ask key lines of enquiry to determine the quality of services under each of those five key questions. The results of the survey have been grouped under these five key questions showing the topics that CQC considers as important measures of quality. In each case we show the question, the key results for 2014 and 2012, where a comparison is appropriate, and whether there is a significant trend. We have not shown every answer in order to focus on those responses that could best indicate good quality care and areas for improvement. For the full set of results please see the National Tables for further explanation. Some questions have been aggregated in the results below, where this is the case small variations may exist between these results and the full question results in the National Tables due to rounding. An arrow is shown in the ‘Change’ columns below to indicate statistically significant differences in the figures since 2012, with a dash (-) noting no change. Unless otherwise specified, questions were answered by all respondents.

Key findings from the national Accident and Emergency patient survey 2014 6
Key findings
What people told us about their experience overall
Survey results
Respondents were asked to rate their overall experience of attending A&E by allocating a score between 0 and 10 (0 being very poor, 10 being very good). Eighty per cent of respondents scored their overall experience as 7 or above out of 10. Just under half of respondents (46%) chose the highest scores of either 9 or 10 out of 10, compared with 41% in 2012.
Question Response 2012 2014 Change+
Q43. Overall…(how would you rate your experience: 0 very poor to 10 very good)
7 - 10 76% 80% ↑
0 - 3 7% 6% ↓
+ The arrows in the change column denote statistically significant differences across survey years.
The other issues raised in the ‘CQC view’ above are outlined in more detail below.
CQC view
Overall most patients attending A&E rated their experience as positive. This overall rating corresponds with a greater proportion of patients saying they were treated with dignity and respect, had enough time to discuss health problems with clinical staff, and had confidence and trust in staff.* While this is a step in the right direction, CQC would encourage trusts to continue to review and develop the quality of the services they provide to ensure that these improvements continue. However, the key findings in this report also highlight areas of concern and variations in performance between providers. These must be reviewed to ensure that everyone who accesses emergency care receives high quality care consistently throughout their time in A&E. * Correlations conducted using Pearson’s Product Moment (lowest correlation 0.805).

Key findings from the national Accident and Emergency patient survey 2014 7
Key question: What does patient experience tell us about whether services are safe?
CQC view
The survey included a number of questions under the heading of safety. For example, the time a patient waits until they are first assessed by a doctor or nurse, the time it takes patients who arrived by ambulance to be handed over to A&E staff, and the cleanliness of the A&E department are all considered, along with ensuring that patients do not feel threatened by other patients or visitors. It is encouraging that patients are experiencing cleaner facilities in A&E and the vast majority do not feel threatened while they are waiting for, or receiving, emergency care. However, patients should not wait longer than necessary for access to medical assistance as it increases clinical risks and impacts negatively on their experience. While there are a number of small, but significant, improvements in the results in 2014 compared with 2012, the overall picture remains a concern. Around four in 10 patients (41%) arrived at A&E in an ambulance. Of these, around one in 10 patients (11%) said they waited over 30 minutes for their care to be handed over to the A&E staff; 5% experienced waiting times of over an hour.* There has been no change in this picture since 2012 with the exception of a small decline in those waiting 15 minutes or less. This is despite hospital and ambulance trusts working together to improve handover times for a significant period of time. Over a quarter (27%) of all patients waited more than 60 minutes before being examined by a doctor or a nurse. For 3% of people this wait was over four hours. It is essential that trusts review their practices and staffing levels within A&E to ensure that they are within expected limits including the Department of Health’s standards and, more importantly, to ensure people are seen and treated in a timely manner. * ‘Everyone counts 2013/14: technical definitions’. http://www.england.nhs.uk/wp-content/uploads/2012/12/ec-tech-def.pdf

Key findings from the national Accident and Emergency patient survey 2014 8
Survey results
Question Response 2012 2014 Change+
Access to care
Q4: Once you arrived at hospital, how long did you wait with the ambulance crew before your care was handed over to the A&E staff? *
Under 30 minutes 90% 89% -
Over 30 minutes ** 10% 11% -
Q6: How long did you wait before you first spoke to a nurse or doctor?
0 -15 minutes 38% 40% ↑
More than 15 minutes 62% 60% ↓
Q7: From the time you first arrived at the A&E department, how long did you wait before being examined by a doctor or nurse?
0 - 60 minutes 71% 73% ↑
More than 60 minutes *** 29% 27% ↓
Safeguarding
Q32: While you were in the A&E department, did you feel threatened by other patients or visitors?
No 93% 94% ↑
Yes, definitely 2% 2% -
Cleanliness
Q31: In your opinion, how clean was the A&E department?
Very clean 55% 59% ↑
Not at all clean 1% 1% ↓
+ The arrows in the change column denote statistically significant differences across survey years.
* Answered by those who arrived by ambulance ** In 2014, 3% waited more than an hour but no more than two hours, and 2% waited more than two hours (no change from 2012) *** 3% waited more than four hours in 2014, a slight decrease from 2012.
Key findings from the national Accident and Emergency patient survey 2014 9
Key question: What does patient experience tell us about whether services are effective?
CQC view
Few questions in the patient survey relate to the effectiveness of care. However, the questions considered under this heading are important aspects of effective care in A&E. Access to pain relief is important, and CQC always considers issues related to nutrition and hydration when assessing effectiveness. It is unacceptable for patients to not receive help for their pain when attending A&E, or for them to be left waiting for medication for long periods of time. The survey results show that only just under two thirds of people thought that the hospital staff had definitely done everything they could to help control their pain. Thirteen per cent of people who requested pain relief medication waited more than 30 minutes before that support was made available to them, with a further 8% not receiving any after requesting it. All trusts should review their processes and staff levels to ensure that they are sufficient to ensure that patients receive medication in a timely and appropriate manner. Patients are experiencing better access to suitable food and drink while they are in A&E. While improvements in facilities are a positive step, trusts should ensure that all people in A&E have access to appropriate nutrition and hydration and that further improvements continue to reduce the proportion of patients (23%) who are not able to get suitable food or drink and the further 11% who were not advised whether they were able to eat or drink. All trusts should review these results to ensure that A&E services are effective and that improvements are made, or continue to be made, where necessary.

Key findings from the national Accident and Emergency patient survey 2014 10
Survey results
Question Response 2012 2014 Change+
Nutrition and hydration
Q33: Were you able to get suitable food or drinks when you were in the A&E department? *
Yes 54% 57% ↑
No ** 26% 23% ↓
Pain relief ***
Q29. How many minutes after you requested pain relief medication did it take before you got it?
Under 30 minutes - 79%
More than 30 minutes **** - 13%
Q30: Do you think the hospital staff did everything they could to help control your pain?
Yes, definitely - 63%
No - 13%
+ The arrows in the change column denote statistically significant differences across survey years.
* Question 33 excludes respondents who said that they did not want anything to eat or drink ** A further 11% in 2014 did not know if they were allowed to eat or drink, a slight decrease from 2012. *** Question 29 was answered by those who were in pain and requested pain relief, question 30 was answered by those who were in pain **** A further 8% asked for pain relief but were not given any.

Key findings from the national Accident and Emergency patient survey 2014 11
Key question: What does patient experience tell us about whether services are caring?
CQC view
Most questions within the survey (22 of the 35 questions) contribute to the assessment of caring. These relate to interactions between staff and patients and include compassionate care, involving patients in decisions, and providing emotional support. Over three-quarters of patients said overall they were always treated with respect and dignity while receiving care in A&E, showing a small increase since 2012. There is also an encouraging increase in the proportion of patients saying they were given enough privacy when discussing their condition with the A&E receptionist. While this represents progress, trusts should ensure that all patients are treated appropriately and that there are effective arrangements in place to protect people’s privacy and dignity at all times. It is also encouraging that patients’ experiences of the doctors and nurses that treated them show improvements since 2012, where such comparisons are possible. Significantly more people were always able to get help when they needed attention and more felt that they were involved as much as they wanted in decisions about their care. This is positive for many patients and supports one of the Department of Health’s clinical quality indicators for A&E departments to assess locally, which relates to ‘service experience’.* However, we would encourage trusts to continue focusing on this improvement to ensure that where some patients are not receiving good quality care this is identified and appropriate action taken. In particular, trusts must review their processes and staffing levels to support the:
• 22% of people who were either not given any information or not enough information about their care and treatment.
• 22% of those who felt distressed who were not reassured by a staff member.
• Approximately one in seven people (15%) that were not able to discuss their fears and anxiety about their condition or treatment.
* http://www.hscic.gov.uk/catalogue/PUB14986/prov-ae-qual-indi-eng-June%202014-rep1.pdf

Key findings from the national Accident and Emergency patient survey 2014 12
Survey results
Question Response 2012 2014 Change+
Compassionate care *
Q12: Did the doctors and nurses listen to what you had to say?
Yes, definitely 75% 77% ↑
No 4% 3% ↓
Q15: Did doctors or nurses talk to each other about you as if you weren't there?
No - 84%
Yes, definitely - 5%
Q19: If you needed attention, were you able to get a member of medical or nursing staff to help you?
Yes, always 56% 59% ↑
No, could not find one 8% 7% ↓
Q42: Overall, did you feel you were treated with respect and dignity while you were in the A&E department?
Yes, all of the time 78% 79% ↑
No 4% 4% ↓
CQC view (continued)
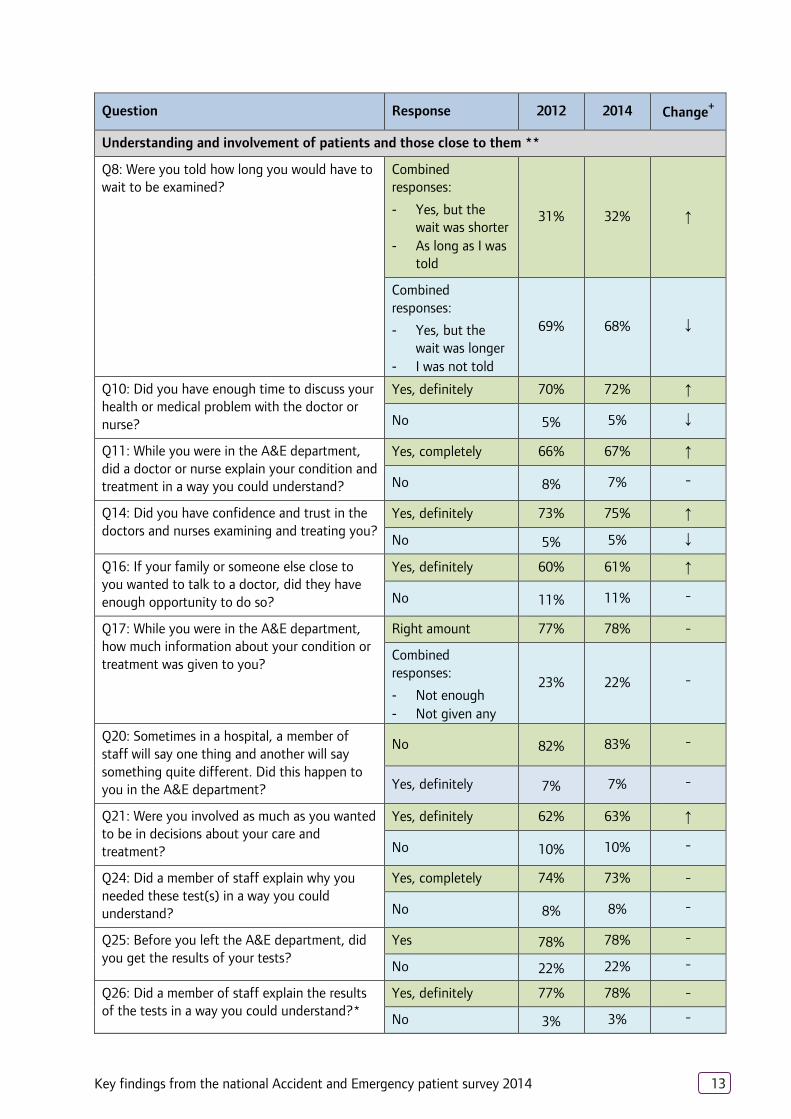
Trusts should assure themselves that the experiences of vulnerable patients are the same as all other patient groups. Thirty-three per cent of those with mental health conditions who were distressed in A&E said staff did not help to reassure them. This is compared with 21% of patients without a mental health condition. At a national level we can see improvements across all questions asking about discharge from A&E (questions 36 to 41). While this improvement is welcome there is a considerable way for trusts to go to improve patients’ experiences of care at discharge. Far too many patients, at least one in three, are not being told important information that they need. This includes information about the side effects of medication, danger signals to watch for regarding their condition, or who to contact if they are worried. While there is a small but significant improvement in people’s home situation being taken into account at discharge, nearly half (45%) still say that this is not the case. It is also worrying that more than one person in every five are not getting their test results before they leave A&E. Trusts should also assure themselves that all patients experience good quality care and that their circumstances are taken into account in discharge decisions.
Key findings from the national Accident and Emergency patient survey 2014 13
Question Response 2012 2014 Change+
Understanding and involvement of patients and those close to them **
Q8: Were you told how long you would have to wait to be examined?
Combined responses:
- Yes, but the wait was shorter
- As long as I was told
31% 32% ↑
Combined responses:
- Yes, but the wait was longer
- I was not told
69% 68% ↓
Q10: Did you have enough time to discuss your health or medical problem with the doctor or nurse?
Yes, definitely 70% 72% ↑
No 5% 5% ↓
Q11: While you were in the A&E department, did a doctor or nurse explain your condition and treatment in a way you could understand?
Yes, completely 66% 67% ↑
No 8% 7% -
Q14: Did you have confidence and trust in the doctors and nurses examining and treating you?
Yes, definitely 73% 75% ↑
No 5% 5% ↓
Q16: If your family or someone else close to you wanted to talk to a doctor, did they have enough opportunity to do so?
Yes, definitely 60% 61% ↑
No 11% 11% -
Q17: While you were in the A&E department, how much information about your condition or treatment was given to you?
Right amount 77% 78% -
Combined responses:
- Not enough - Not given any
23% 22% -
Q20: Sometimes in a hospital, a member of staff will say one thing and another will say something quite different. Did this happen to you in the A&E department?
No 82% 83% -
Yes, definitely 7% 7% -
Q21: Were you involved as much as you wanted to be in decisions about your care and treatment?
Yes, definitely 62% 63% ↑
No 10% 10% -
Q24: Did a member of staff explain why you needed these test(s) in a way you could understand?
Yes, completely 74% 73% -
No 8% 8% -
Q25: Before you left the A&E department, did you get the results of your tests?
Yes 78% 78% -
No 22% 22% -
Q26: Did a member of staff explain the results of the tests in a way you could understand?*
Yes, definitely 77% 78% -
No 3% 3% -

Key findings from the national Accident and Emergency patient survey 2014 14
Question Response 2012 2014 Change+
Q36: Did a member of staff explain the purpose of the medications you were to take at home in a way you could understand?
Yes, completely 83% 86% ↑
No 3% 3% -
Q37: Did a member of staff tell you about medication side effects to watch for?
Yes, completely 39% 41% ↑
No 44% 42% ↓
Q38: Did a member of staff tell you when you could resume your usual activities, such as when to go back to work or drive a car?
Yes, definitely 38% 42% ↑
No 40% 38% ↓
Q39. Did hospital staff take your family or home situation into account when you were leaving the A&E department?
Yes, completely 35% 39% ↑
No 48% 45% ↓
Q40: Did a member of staff tell you about what danger signals regarding your illness or treatment to watch for after you went home?
Yes, completely 40% 44% ↑
No 36% 33% ↓
Emotional support ***
Q13: If you had any anxieties or fears about your condition or treatment, did a doctor or nurse discuss them with you?
Yes, completely 52% 55% ↑
No 17% 15% ↓
Q41: Did hospital staff tell you who to contact if you were worried about your condition or treatment after you left the A&E department?
Yes 68% 70% ↑
No 32% 30% ↓
+ The arrows in the change column denote statistically significant differences across survey years.
* Questions 12 and 15 were answered by those who saw a doctor or a nurse. ** Questions 8, 11, 14 and 16 were answered by those who saw a doctor or a nurse. Questions 24 and 25 were answered by those who had tests. Question 26 was answered by those who received their test results before they left A&E. Questions 36 and 37 were answered by those who were not admitted to hospital or a nursing home and who were prescribed medication. Questions 38, 39 and 40 were answered by those who were not admitted to hospital or a nursing home. *** Question 13 was answered by those who saw a doctor or a nurse. Question 41 was answered by those who were not admitted to hospital or a nursing home.
Additional analysis
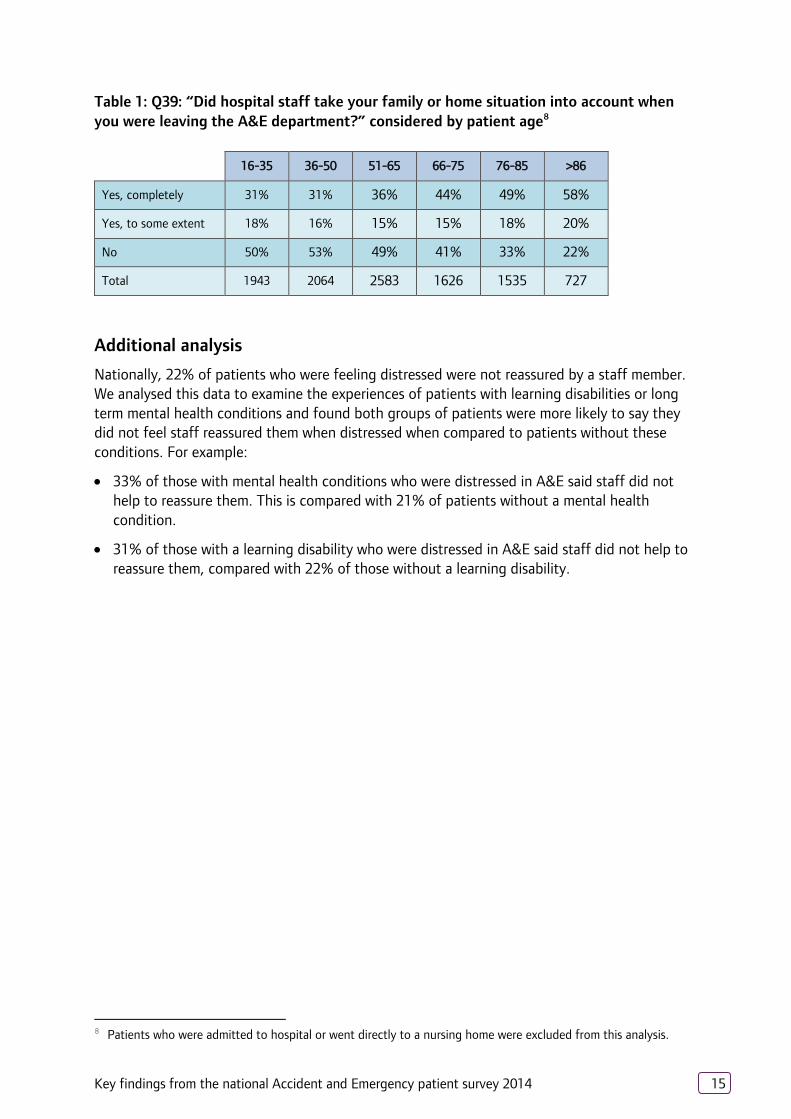
We explored whether discussions about patients’ home situations varied by patient age (table 1). Older groups of patients more often said that their home and family circumstances were completely considered, but too many said this was not the case. For example, 51% of people aged 76-85 said that their circumstances were not always taken into account, and 42% of those aged 86 and over said this.
Key findings from the national Accident and Emergency patient survey 2014 15
Table 1: Q39: “Did hospital staff take your family or home situation into account when you were leaving the A&E department?” considered by patient age8
16-35 36-50 51-65 66-75 76-85 >86
Yes, completely 31% 31% 36% 44% 49% 58%
Yes, to some extent 18% 16% 15% 15% 18% 20%
No 50% 53% 49% 41% 33% 22%
Total 1943 2064 2583 1626 1535 727
Additional analysis
Nationally, 22% of patients who were feeling distressed were not reassured by a staff member. We analysed this data to examine the experiences of patients with learning disabilities or long term mental health conditions and found both groups of patients were more likely to say they did not feel staff reassured them when distressed when compared to patients without these conditions. For example:
• 33% of those with mental health conditions who were distressed in A&E said staff did not help to reassure them. This is compared with 21% of patients without a mental health condition.
• 31% of those with a learning disability who were distressed in A&E said staff did not help to reassure them, compared with 22% of those without a learning disability.
8 Patients who were admitted to hospital or went directly to a nursing home were excluded from this analysis.
Key findings from the national Accident and Emergency patient survey 2014 16
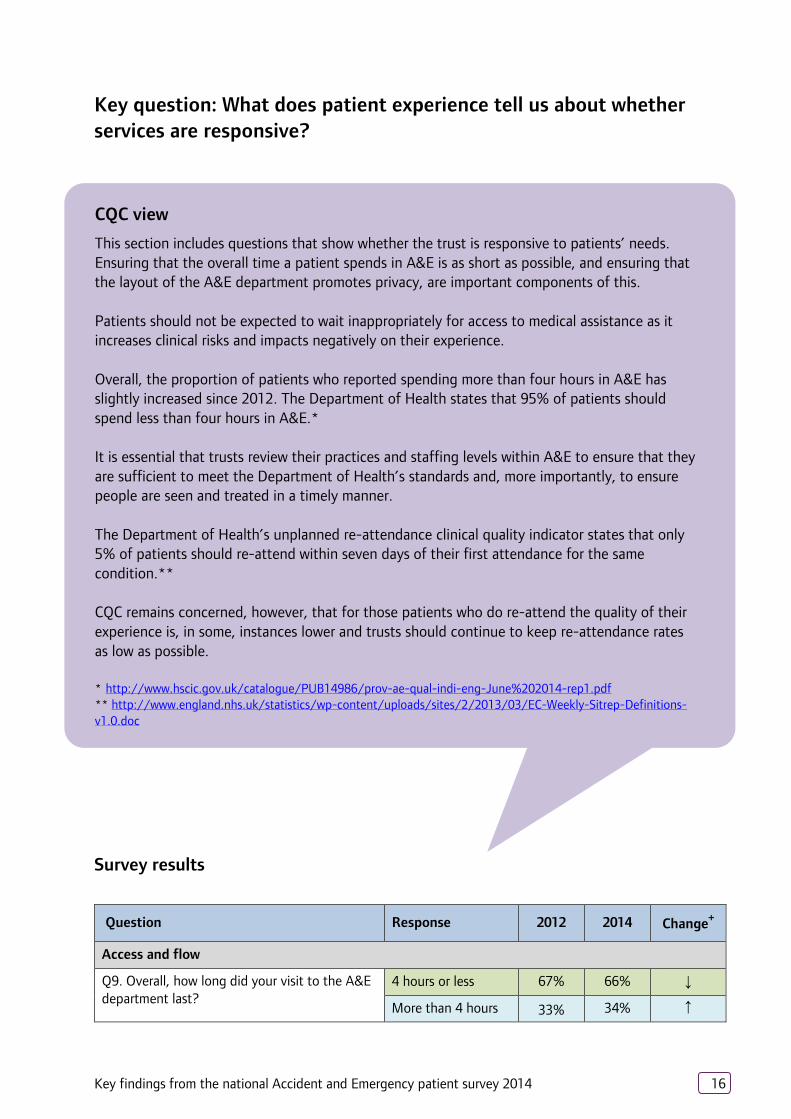
Key question: What does patient experience tell us about whether services are responsive?
Survey results
Question Response 2012 2014 Change+
Access and flow
Q9. Overall, how long did your visit to the A&E department last?
4 hours or less 67% 66% ↓
More than 4 hours 33% 34% ↑
CQC view
This section includes questions that show whether the trust is responsive to patients’ needs. Ensuring that the overall time a patient spends in A&E is as short as possible, and ensuring that the layout of the A&E department promotes privacy, are important components of this. Patients should not be expected to wait inappropriately for access to medical assistance as it increases clinical risks and impacts negatively on their experience. Overall, the proportion of patients who reported spending more than four hours in A&E has slightly increased since 2012. The Department of Health states that 95% of patients should spend less than four hours in A&E.* It is essential that trusts review their practices and staffing levels within A&E to ensure that they are sufficient to meet the Department of Health’s standards and, more importantly, to ensure people are seen and treated in a timely manner. The Department of Health’s unplanned re-attendance clinical quality indicator states that only 5% of patients should re-attend within seven days of their first attendance for the same condition.** CQC remains concerned, however, that for those patients who do re-attend the quality of their experience is, in some, instances lower and trusts should continue to keep re-attendance rates as low as possible. * http://www.hscic.gov.uk/catalogue/PUB14986/prov-ae-qual-indi-eng-June%202014-rep1.pdf ** http://www.england.nhs.uk/statistics/wp-content/uploads/sites/2/2013/03/EC-Weekly-Sitrep-Definitions-v1.0.doc

Key findings from the national Accident and Emergency patient survey 2014 17
Question Response 2012 2014 Change+
Meeting people’s individual needs
Q5: Were you given enough privacy when discussing your condition with the receptionist?
Yes, definitely 48% 53% ↑
No 13% 11% ↓
Q18: Were you given enough privacy when being examined or treated?
Yes, definitely 81% 82% ↑
No 2% 2% -
+ The arrows in the change column denote statistically significant differences across survey years.
Additional analysis
We analysed results to see if there were differences in reported experience according to whether patients were attending A&E for the first time for a condition or were re-attending for the same or a related condition. Overall, 33% of respondents had previously been to the same A&E department for the same condition, or something related to it. Of those, 5% had attended within the previous week. Nine per cent had attended between one week and one month earlier, and the remaining 19% had been more than a month prior to the visit they were referring to in the survey. Sixty seven per cent of respondents had attended A&E for the first time for a particular condition. They were generally more positive about the quality of their experience compared with those who had previously attended the same A&E. For example:
• 75% of those attending for the first time for a problem felt they ‘definitely’ had enough time to discuss this with staff, compared with 66% who had attended previously.
• 65% of those who had attended for the first time for an illness or injury thought staff did ‘everything they could’ to control their pain, compared with 57% of those re-attending.
• 59% of those who had attended for the first time said they could completely discuss their fears, compared with 49% of those who had been to A&E for the same condition before.
Key question: What does patient experience tell us about whether services are well-led? The survey does not ask questions directly about aspects of ‘well-led’. This reflects the focus of the survey on the experiences of patients which is based mostly around the other key questions, particularly ‘caring’.

Key findings from the national Accident and Emergency patient survey 2014 18
Variation in trust results
Overall performance
This section looks at variation in trusts’ results by highlighting trusts performing better or worse than expected across a number of survey questions. It helps to identify areas where many trusts could improve how they are providing care. The questions in the survey focus on key aspects of patients’ experience, particularly on how caring it is. This means that we ask a different number of questions relating to four of the five key areas of quality that CQC measures (safe, effective, caring, responsive).9 Tables 2 and 4 should not be used as a definitive measure of the ordering of trusts when it comes to their performance. Instead the tables serve as an indication of what the survey results show about levels of performance across the questions asked. For example we ask only one question regarding pain management but four about the environment and facilities. We ask different numbers of questions to get a rounded view of experience and not to imply that one area is more or less important to patients’ overall experience. It is therefore necessary to also review the specific findings from each trust before making firm conclusions about individual performance. Where trusts indicated in these tables have been rated via CQC inspection, this is shown in tables 3 and 5.
9 The survey does not ask questions directly about aspects of ‘well-led’. This reflects the focus of the survey on the experiences of patients which is based mostly around the other key questions, particularly ‘caring’.
How it is calculated
The results for each trust are published on the CQC website (see further information section). For each question in the survey that evaluates trust performance, responses are converted into scores on a scale from 0 to 10. The higher the score, the better a trust is performing. This data is standardised by age and by gender to enable fairer comparisons of results between trusts that have different population profiles. Data is analysed using a statistic called the ‘expected range’. This is the range within which we would expect a particular trust to score if it performed about the same as most other trusts in the survey. The range takes into account the number of respondents from each trust as well as the scores for all other trusts, and allows us to identify which trusts we can confidently say are performing 'better' or 'worse' than the majority of others, or if they are ‘about the same’. Presenting the data in this way gives a quick indication of how well each trust is performing, without requiring any form of statistical interpretation from the users of the data.

Key findings from the national Accident and Emergency patient survey 2014 19
For the A&E survey, trusts on the whole tended to achieve fairly consistent ratings across patient experience questions, with just 13 trusts achieving a mix with some questions that were ‘better’ and some that were ‘worse’ than expected. Twenty seven trusts achieved ‘about the same’ for all survey questions. Trusts achieving ‘better than expected’ results
Table 2 shows the 12 trusts that were classed as ‘better than expected’ for 20% or more of all scored questions within the survey (seven or more questions from a total of 35 scored questions). Dorset County Hospital NHS Foundation Trust performed ‘better than expected’ for over two-thirds of survey questions (69%), including consistently ‘better’ scores for sections on how staff communicated with patients and the information patients were given at discharge.
The trusts highlighted in table 2 are performing comparatively well across the survey, with none from this list being categorised as ‘worse’ than other trusts for any survey question. However, we would ask that they nonetheless examine their survey findings to ensure they continue to maintain a high standard of care, and in particular across areas where patients have said care is ‘about the same’ as at other trusts.
Table 2: Trusts with high proportions of questions where their performance is ‘better than expected’ when compared with other trusts10
Trust
Percentage of question scores that
were ‘better than expected’
Number of questions ‘better’
Dorset County Hospital NHS Foundation Trust 69% 24
Salisbury NHS Foundation Trust 46% 16
Taunton and Somerset NHS Foundation Trust 43% 15
Royal Surrey County Hospital NHS Foundation Trust 31% 11
Cambridge University Hospitals NHS Foundation Trust 31% 11
South Tees Hospitals NHS Foundation Trust 31% 11
Salford Royal NHS Foundation Trust 26% 9
Epsom and St Helier University Hospitals NHS Trust 26% 9
Frimley Park Hospital NHS Foundation Trust 23% 8
South Warwickshire NHS Foundation Trust 23% 8
Northumbria Healthcare NHS Foundation Trust 23% 8
Harrogate and District NHS Foundation Trust 20% 7
Inspections for the following trusts have been undertaken in 2014.
10 Moorfields Eye Hospital NHS Foundation Trust achieved nine ‘better than expected’ scores (29%). However they do not feature in this table as they also had two scores (6%) rated ‘worse than expected’.
Key findings from the national Accident and Emergency patient survey 2014 20
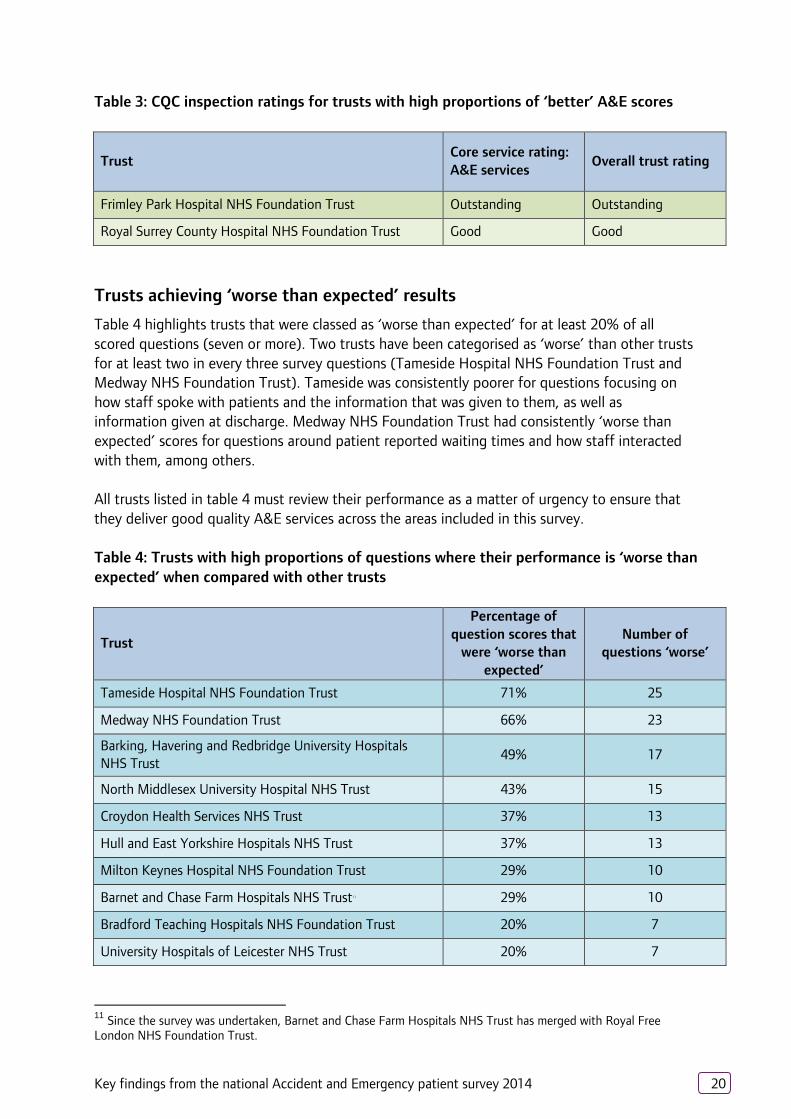
Table 3: CQC inspection ratings for trusts with high proportions of ‘better’ A&E scores
Trust Core service rating: A&E services
Overall trust rating
Frimley Park Hospital NHS Foundation Trust Outstanding Outstanding
Royal Surrey County Hospital NHS Foundation Trust Good Good
Trusts achieving ‘worse than expected’ results
Table 4 highlights trusts that were classed as ‘worse than expected’ for at least 20% of all scored questions (seven or more). Two trusts have been categorised as ‘worse’ than other trusts for at least two in every three survey questions (Tameside Hospital NHS Foundation Trust and Medway NHS Foundation Trust). Tameside was consistently poorer for questions focusing on how staff spoke with patients and the information that was given to them, as well as information given at discharge. Medway NHS Foundation Trust had consistently ‘worse than expected’ scores for questions around patient reported waiting times and how staff interacted with them, among others.
All trusts listed in table 4 must review their performance as a matter of urgency to ensure that they deliver good quality A&E services across the areas included in this survey. Table 4: Trusts with high proportions of questions where their performance is ‘worse than expected’ when compared with other trusts
Trust
Percentage of question scores that
were ‘worse than expected’
Number of questions ‘worse’
Tameside Hospital NHS Foundation Trust 71% 25
Medway NHS Foundation Trust 66% 23
Barking, Havering and Redbridge University Hospitals NHS Trust
49% 17
North Middlesex University Hospital NHS Trust 43% 15
Croydon Health Services NHS Trust 37% 13
Hull and East Yorkshire Hospitals NHS Trust 37% 13
Milton Keynes Hospital NHS Foundation Trust 29% 10
Barnet and Chase Farm Hospitals NHS Trust11 29% 10
Bradford Teaching Hospitals NHS Foundation Trust 20% 7
University Hospitals of Leicester NHS Trust 20% 7
11 Since the survey was undertaken, Barnet and Chase Farm Hospitals NHS Trust has merged with Royal Free London NHS Foundation Trust.

Key findings from the national Accident and Emergency patient survey 2014 21
Inspections for the following trusts have been undertaken in 2014 where inspection findings for A&E services were almost always consistent with the results of this survey. Where results from the survey do not align with findings at the time of the CQC inspection, we will be raising this with the trust and taking account of the new findings in our next inspection. Table 5: CQC inspection ratings for trusts with high proportions of ‘worse’ A&E scores
Trust Core service rating: A&E services
Overall trust rating
Tameside Hospital NHS Foundation Trust Good Inadequate
Medway NHS Foundation Trust Inadequate Inadequate
North Middlesex University Hospital NHS Trust Requires improvement
Requires improvement
Hull and East Yorkshire Hospitals NHS Trust Requires improvement
Requires improvement
Milton Keynes Hospital NHS Foundation Trust and Bradford Teaching Hospitals NHS Foundation Trust are currently undergoing inspection and reports will be published shortly. Data from this survey will inform inspections of A&E services at all trusts not yet inspected. Trusts performing ‘as expected’
The remainder of trusts achieved ‘about the same’ for most or all questions asked of patients. This represents experiences of care that are in line with current performance for care across the country, however CQC strongly encourages these trusts to consider their results carefully to ensure that they improve services and achieve the highest levels of care for people. It is possible to determine where improvement activity should focus by studying your trust report. Focus on CQC key questions
We have highlighted trusts achieving generally better or worse results across the survey in its entirety. This section looks more closely at how trusts differ across four of the five key questions that CQC focuses on to assess quality: safety, effectiveness, caring and responsiveness.12 Each key question is illustrated by survey questions that exemplify that aspect of care. Each figure below shows trusts that are performing ‘better than expected’ or ‘worse than expected’ on the questions by each of the key questions. Trusts featuring in the table will have achieved either ‘better’ or ‘worse’ results for each of the questions shown. Where trusts are not performing in line with their peers for a key question, we suggest that those trusts aim to learn from the experience of trusts rated ‘better’ nationally. It is not unexpected to see that some of the trusts shown at the top of the table for ‘worse’ scores tend to be included here, due to the considerably high proportion of ‘worse’ scores that those trusts received. 12 CQC also assesses whether services are ‘well-led’ which is not covered within the A&E patient survey.

Key findings from the national Accident and Emergency patient survey 2014 22
Table 6: Trusts performing ‘better’ or ‘worse’ against CQC’s five key questions13
Trusts better than expected Trusts worse than expected
Safe
Access to care (Questions 4, 6 and 7)
North Cumbria University Hospitals NHS Trust Medway NHS Foundation Trust
Mid Essex Hospital Services NHS Trust
Safeguarding (Question 32)
Taunton and Somerset NHS Foundation Trust Hull and East Yorkshire Hospitals NHS Trust
Lewisham and Greenwich NHS Trust
Medway NHS Foundation Trust
Royal Liverpool and Broadgreen University Hospitals NHS Trust
University Hospital Southampton NHS Foundation Trust
University Hospitals of Leicester NHS Trust
Cleanliness (Question 31)
Frimley Park Hospital NHS Foundation Trust
Salford Royal NHS Foundation Trust
St Helens and Knowsley Teaching Hospitals NHS Trust
Barking, Havering and Redbridge University Hospitals NHS Trust
Barnet and Chase Farm Hospitals NHS Trust
Buckinghamshire Healthcare NHS Trust
Central Manchester University Hospitals NHS Foundation Trust
Croydon Health Services NHS Trust
Ealing Hospital NHS Trust
Medway NHS Foundation Trust
Milton Keynes Hospital NHS Foundation Trust
North Middlesex University Hospital NHS Trust
Southend University Hospital NHS Foundation Trust
The North West London Hospitals NHS Trust
The Whittington Hospital NHS Trust
13 Trusts in ‘better’ or ‘worse’ categories are listed alphabetically as it is not appropriate to order based on question scores.

Key findings from the national Accident and Emergency patient survey 2014 23
Trusts better than expected Trusts worse than expected
Effective
Nutrition and hydration (Question 33)
Burton Hospitals NHS Foundation Trust
Cambridge University Hospitals NHS Foundation Trust
Dartford and Gravesham NHS Trust
Dorset County Hospital NHS Foundation Trust
Mid Staffordshire NHS Foundation Trust
Royal Surrey County Hospital NHS Foundation Trust
The Queen Elizabeth Hospital King's Lynn NHS Foundation Trust
The Royal Wolverhampton NHS Trust
Wrightington, Wigan and Leigh NHS Foundation Trust
Bradford Teaching Hospitals NHS Foundation Trust
Colchester Hospital University NHS Foundation Trust
King's College Hospital NHS Foundation Trust
North Middlesex University Hospital NHS Trust
Tameside Hospital NHS Foundation Trust
The Dudley Group NHS Foundation Trust
The Rotherham NHS Foundation Trust
Pain relief (Questions 29 and 30)
Dorset County Hospital NHS Foundation Trust
Poole Hospital NHS Foundation Trust
Royal Surrey County Hospital NHS Foundation Trust
North Middlesex University Hospital NHS Trust
The Newcastle-upon-Tyne Hospitals NHS Foundation Trust
Walsall Healthcare NHS Trust
Caring14
Compassionate care (Question 42)
Cambridge University Hospitals NHS Foundation Trust
Dorset County Hospital NHS Foundation Trust
Frimley Park Hospital NHS Foundation Trust
Lancashire Teaching Hospitals NHS Foundation Trust
Royal Surrey County Hospital NHS Foundation Trust
Royal United Hospital Bath NHS Trust
Salisbury NHS Foundation Trust
South Warwickshire NHS Foundation Trust
Taunton and Somerset NHS Foundation Trust
Croydon Health Services NHS Trust
Hull and East Yorkshire Hospitals NHS Trust
Medway NHS Foundation Trust
North Middlesex University Hospital NHS Trust
Tameside Hospital NHS Foundation Trust
14 Given the focus of the survey, the majority of questions relate to this key question. We have taken indicative questions to represent compassionate care, patient understanding and involvement and emotional support. However trusts should review the performance of those listed in table 4 above in order to develop and improve services.

Key findings from the national Accident and Emergency patient survey 2014 24
Trusts better than expected Trusts worse than expected
Patient understanding and involvement (Question 11)
Chelsea and Westminster Hospital NHS Foundation Trust
Dorset County Hospital NHS Foundation Trust
Epsom and St Helier University Hospitals NHS Trust
Harrogate and District NHS Foundation Trust
Moorfields Eye Hospital NHS Foundation Trust
Northumbria Healthcare NHS Foundation Trust
Poole Hospital NHS Foundation Trust
Salford Royal NHS Foundation Trust
Salisbury NHS Foundation Trust
Taunton and Somerset NHS Foundation Trust
Barking, Havering and Redbridge University Hospitals NHS Trust
Croydon Health Services NHS Trust
Hull and East Yorkshire Hospitals NHS Trust
Medway NHS Foundation Trust
Tameside Hospital NHS Foundation Trust
University Hospitals of Leicester NHS Trust
Emotional support (Question 13)
Chelsea and Westminster Hospital NHS Foundation Trust
Dorset County Hospital NHS Foundation Trust
Epsom and St Helier University Hospitals NHS Trust
Maidstone and Tunbridge Wells NHS Trust
Mid Staffordshire NHS Foundation Trust
Moorfields Eye Hospital NHS Foundation Trust
Northumbria Healthcare NHS Foundation Trust
Royal Surrey County Hospital NHS Foundation Trust
Salford Royal NHS Foundation Trust
Salisbury NHS Foundation Trust
South Warwickshire NHS Foundation Trust
Bradford Teaching Hospitals NHS Foundation Trust
Heatherwood and Wexham Park Hospitals NHS Foundation Trust
Hull and East Yorkshire Hospitals NHS Trust
Medway NHS Foundation Trust
Northampton General Hospital NHS Trust
Tameside Hospital NHS Foundation Trust
The Dudley Group NHS Foundation Trust
Responsive
Access and flow (Question 9)
Airedale NHS Foundation Trust
Bolton NHS Foundation Trust
Isle of Wight NHS Trust
North Cumbria University Hospitals NHS Trust
Northern Lincolnshire and Goole NHS Foundation Trust
South Tees Hospitals NHS Foundation Trust
The Royal Wolverhampton NHS Trust
Barking, Havering and Redbridge University Hospitals NHS Trust
Ealing Hospital NHS Trust
Medway NHS Foundation Trust
The Dudley Group NHS Foundation Trust
The Princess Alexandra Hospital NHS Trust
University Hospital Southampton NHS Foundation Trust
University Hospitals of Leicester NHS Trust
Meeting people’s individual needs (Question 5 & 18)
Dorset County Hospital NHS Foundation Trust No trusts worse for both questions
Key findings from the national Accident and Emergency patient survey 2014 25
Next steps This report has presented the results for England from the 2014 A&E patient survey. The detailed survey results have been provided back to NHS trusts and we would expect all trusts to use their results to identify and make the improvements they need in order to drive a better experience for every patient. We will use these results to support Intelligent Monitoring to help us to decide when, where and what to inspect. It will also form a key source of evidence to support the judgements and ratings we publish for acute trusts with A&E departments. NHS England will use the results to check progress and improvement against the objectives set out in the NHS mandate, and the Department of Health will hold them to account for the outcomes they achieve. The NHS Trust Development Authority will use the results to inform the quality and governance assessment as part of their oversight model for NHS trusts.
Key findings from the national Accident and Emergency patient survey 2014 26
Further information The full national results are on the CQC website, together with an A to Z list to view the results for each trust, and a link to the benchmark report for each trust. Also available is a ‘technical document’ detailing the methodology for the trust level analysis: www.cqc.org.uk/accidentandemergency Full details of the methodology of the survey can be found at: http://www.nhssurveys.org/surveys/738 The results from previous A&E surveys can be found on the NHS surveys website at: http://www.nhssurveys.org/surveys/296 More information on the programme of NHS patient surveys is available at: www.cqc.org.uk/public/reports-surveys-and-reviews/surveys More information on CQC’s hospital intelligent monitoring system is available on the CQC website: http://www.cqc.org.uk/public/hospital-intelligent-monitoring


