41

Note 1 : The financial results of ABNL are consolidated financials unless otherwise specified
Key Highlights 3 – 7
Business-wise Performance 8 – 20
Going Forward 21
Financials and other Annexure 22 – 41
2
Note 2 : The financial figures in this presentation have been rounded off to the nearest ` 1 Crore
Glossary
CY – Current Year
FY – Financial Year (April-March)
PY – Corresponding period in Previous Year
PQ – Previous Quarter
Q1– April-June
Q2– July-September
YTD – Year to date
CAB – Corporate Agents and Brokers
RMS – Revenue Market Share
ROACE – Return on Avg. Operating Capital Employed based on EBIT
VLR – Visitor Location Register
VAS – Value Added Services
TPA – Tons per annum
AAUM – Quarterly Average Assets under Management
FYP – First Year Premium Income
PPI – Prepaid Payment Instrument
Banca - Bancassurance

` 1200 Crore
Targeted Capex and Investment outlay
for FY17 largely towards Financial
Services businesses
New VenturesTargeting launch of operations of
Health Insurance, Payments Bank &
Solar Power ventures over next 1 year
Investing in Promising Sectors
Digital Capacity Expansion
3
` 1,664 Crore (Pre tax)
Garnered from sale of 23% stake in
Life Insurance JV in April 2016
2.5 X
Standalone Net debt to EBITDA as on
30th June 2016
Supported by strong Balance Sheet
To be Future Ready
Investing in technology & analytics to
build digital go-to- market capabilities
in Financial Services business
Expanding Linen Yarn and VFY
capacities to tap sector growth

` 1,96,545 Crore
Funds under Management1 as on
30th June 2016 (13%↑ y-o-y)
` 2,169 Crore
` 28,700 Crore
Loan book (Incl. Housing Finance) as
on 30th June 2016 (54%↑ y-o-y)
Aditya Birla Financial Services
` 286 Crore
41 Includes AUM of Life Insurance, Private Equity and quarterly average AUM of Asset Management businesses
` 2,169 Crore
Quarterly revenue (14%↑ y-o-y)
Telecom (Idea Cellular)
19.3% (Q4 FY16)
3rd largest in India with improved
revenue market share2 (PY: 18.2%)
` 2521 Crore (Q1 FY17)
Standalone3 post tax cash profit
supporting balance sheet & growth plans
2 Based on gross revenue for UAS and mobile licenses only (Source : TRAI)
3 Standalone = Idea Cellular and its wholly owned subsidiaries
` 286 Crore
Quarterly EBT (21%↑ y-o-y)

22% p.a.Healthy ROACE
6,200 TPA
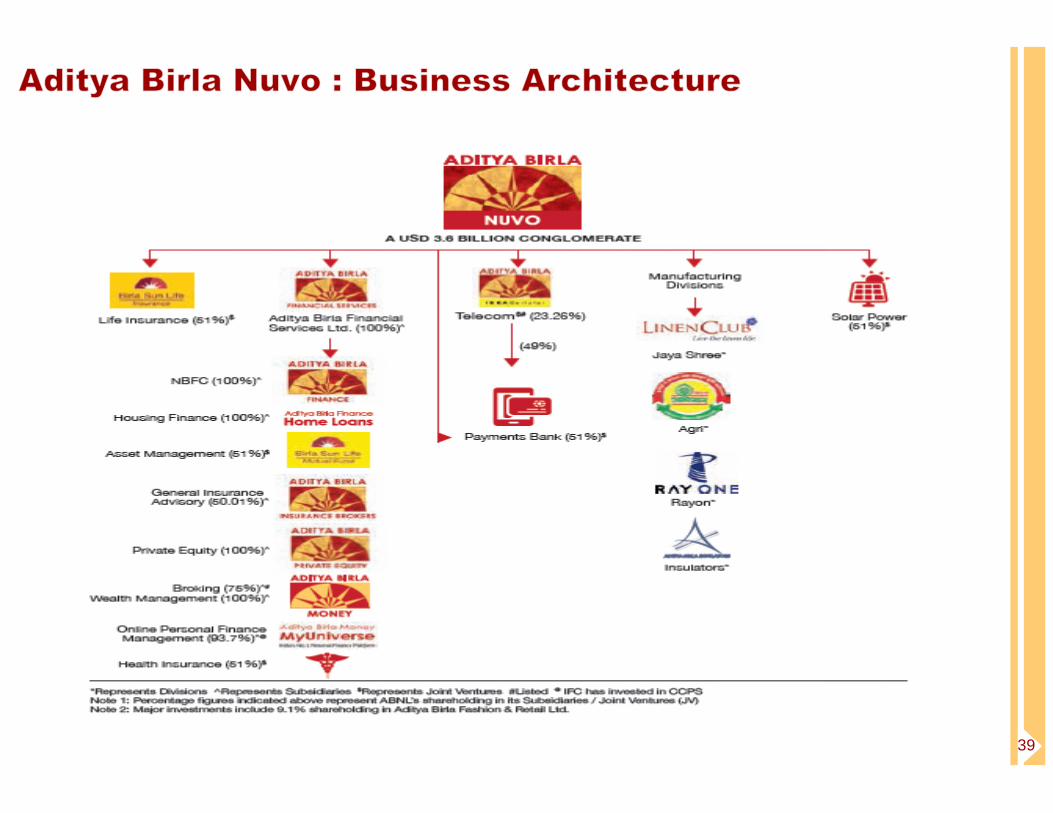
Divisions (Jaya Shree, Indo-Gulf fertilisers, Indian Rayon, Aditya Birla Insulators)
` 279 Crore (Pre tax)
Strong Free Cash Flow to firm
~750 TPA
5
6,200 TPA
Almost doubling linen yarn capacity from
3,400 TPA to 6,200 TPA by Q1 FY18
~750 TPA
Scaling up VFY capacity at a capex of
` 40 Cr. by Q1 FY18
Solar PowerPPA signed for 60 MW projects won in
Karnataka. Land acquisition in process
Payments BankTargeting to launch services by the First
Half of 2017, subject to approvals
New Ventures

Standalone Ratios
1,151 1,193 1,112 925
3,1963,584
3,930
2,192
Mar'14 Mar'15 Mar'16 Jun'16
Standalone Net Debt
( ` Crore)
O/s
Fertilisers
Subsidy
2.63.0
4.6
2.5
0.39 0.42 0.46
0.22
Mar'14 Mar'15 Mar'16 Jun'16
Net Debt/annualised EBITDA Net Debt/Equity
* ** *
6
Net Debt stand reduced by ~ ` 1750 Cr. q-o-q led by proceeds of ` 1,664 Cr. from sale of 23% stake in Birla
Sun Life Insurance (BSLI) in April 2016 and realisation of ` 512 Cr. of fertilisers subsidy in Q1
Further realised fertilisers subsidy of ` 286 Cr. in July’16
In Q1, incurred capex of ` 37 Cr. for divisions and infused capital of ` 138 Cr. mainly in Financial Services
Annual Capital requirements for FY17 are :
Capex of ~` 325 Cr. for divisions including ` 191 Cr. & ` 40 Cr. towards Linen Yarn & VFY capacities expansion
Infusion of ` 150 Cr. for its 51% share in new ventures viz., Solar, Payments Bank and Health Insurance
Capital infusion of about ` 750 Cr. mainly for scaling up NBFC, Housing Finance & MyUniverse
* Reported financials as per IGAAP
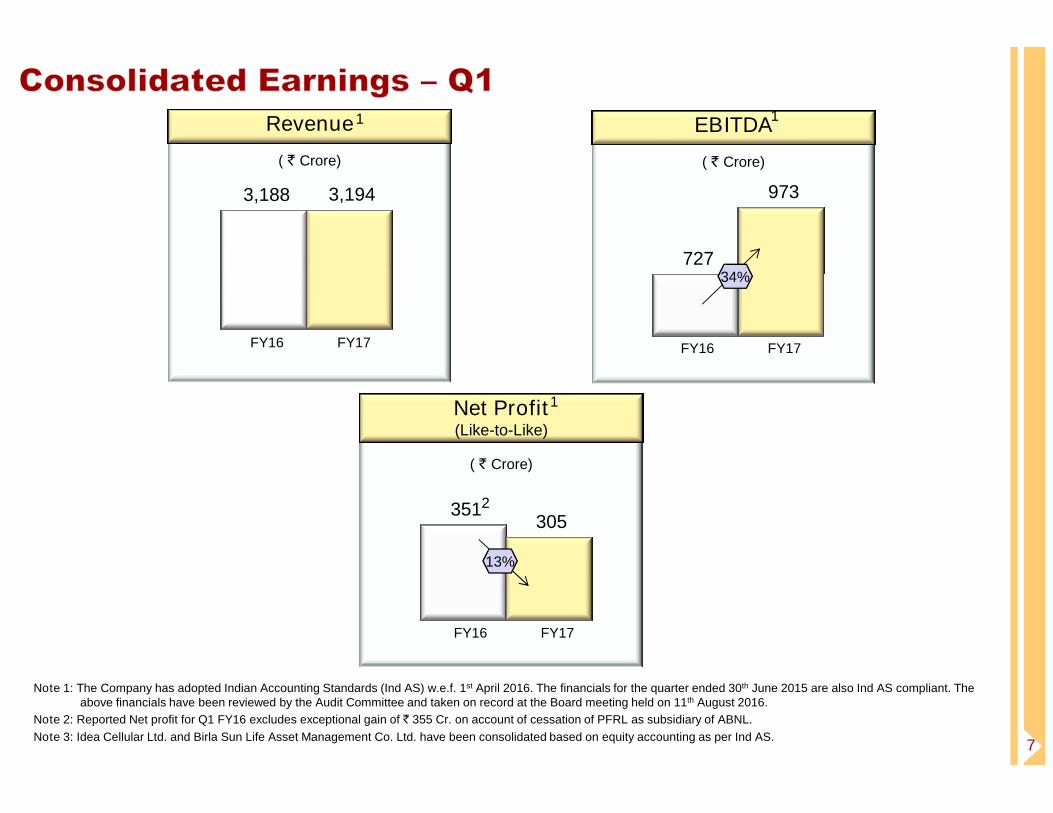
Revenue
( ` Crore)
3,188 3,194
FY16 FY17
EBITDA
( ` Crore)
727
973
34%
Net Profit
FY16 FY17
1 1
1
7
Net Profit(Like-to-Like)
( ` Crore)
351305
FY16 FY17
13%
Note 1: The Company has adopted Indian Accounting Standards (Ind AS) w.e.f. 1st April 2016. The financials for the quarter ended 30th June 2015 are also Ind AS compliant. Theabove financials have been reviewed by the Audit Committee and taken on record at the Board meeting held on 11th August 2016.
Note 2: Reported Net profit for Q1 FY16 excludes exceptional gain of ` 355 Cr. on account of cessation of PFRL as subsidiary of ABNL.
Note 3: Idea Cellular Ltd. and Birla Sun Life Asset Management Co. Ltd. have been consolidated based on equity accounting as per Ind AS.
1
2

A significant non-bank financial services group
8
Performance highlights : Q1 FY 2016-17
A significant non-bank financial services group

Funds under Management1 at ` 196,545 Cr. (13%↑ y-o-y)
Lending book (incl. Housing Finance) at ` 28,700 Cr. (54%↑ y-o-y)
Quarterly revenue from established business at ` 2,110 Cr.
(11%↑ y-o-y) and EBT at ` 323 Cr. (26%↑ y-o-y)
Improved market standing
NBFC business continues to grow ahead of the market
Market share improved y-o-y in the Asset Management and Insurance
AMC & Private Life Insurance Co. in India
# 4 Birla Sun Life
Fund Managers in India (excl. LIC)
Among
Top 5 ABFS
Diversified Private NBFCs
Among
Top 10 ABFL
9
Advisory businesses
1Includes AUM of Life Insurance, Private Equity & quarterly AAUM of Asset Management businesses
Strategic Updates
Sun Life raised its stake in BSLI from 26% to 49% for ` 1,664 Cr. in
Apr ’16, valuing BSLI at ` 7235 Cr.
Certificate of Registration (R3 Approval) for Health Insurance business
received on 11th July ‘16 1,896 2,110
Revenue (` Crore)
(Established businesses2)
11%
Q1FY16 Q1FY17
256323
EBT (` Crore)
(Established businesses2)
26%
Q1FY16 Q1FY17
Personal Finance Management Portal
# 1Aditya Birla Money
MyUniverse
2 Established businesses include Life Insurance, Asset Management, NBFC, Private Equity, Broking, Wealth Management & General Insurance Broking businesses

Aditya Birla Finance Ltd. (ABFL) - NBFC
LRD9%
ConstructionFinance 5%
Promoter 7%
Retail 5%
Broker 3%
Bonds 1%
Channel &Vendor
3%
WCDL4%
Term Loan21%
CorporateLoan 4%
StructuredFinance 2%
Project Loan
Loan Mix` 26,267 Cr.
(Jun’16)Healthy internal accruals supporting book growth
Built well diversified and long term sustainable portfolio
Diversified Private NBFCs in India
Among
Top 10 Ranking
Loan book as on 30th Jun ‘16
` 26,267 Cr. 44%↑y-o-y
10
LAP12%
9% Project Loan21%
Others3%
Built well diversified and long term sustainable portfolio
Launched unsecured business loan & personal finance
solutions in Q3 FY16
Corporate Finance book crossed ` 7,300 Cr. (66%↑ y-o-y)
Infra Finance book crossed ` 7,150 Cr. (63%↑ y-o-y)
Strong growth in earnings and sound return ratios
Portfolio quality continues to be strong
Gross NPA at 0.71% (PY 0.84%) lowest among the top 5
NBFCs operating in similar lines of business
(` Crore)
Q1FY16 Q1FY17 ∆ %
Revenue 553 766 39%↑
EBT 139 186 34%↑
Net Worth 1,972 3,605 83%↑
ROE (p.a.) 15.3% 14.6%
ROA (p.a.) 2.19% 1.96%
Note 1: ROE and ROA are based on monthly average

Birla Sun Life Insurance Co. Ltd. (BSLI)
Ranks # 4 in India with new business1 market share at 8.4%
New business premium grew y-o-y by 5% to ` 331 Cr.
Individual Life FYP rose by 21% to ` 133 Cr.
Led by improved productivity & average ticket size in agency
All the channels contributed to the growth
Improvement in quality of business
(` Crore)
Premium Q1FY16 Q1FY17 ∆ %
First Year 316 331 5%↑
- Individual 111 133 21%↑
- Group 205 197 4%↓
Renewal 726 643 11%↓
Total 1,042 974 ↓
11
13th month persistency improved y-o-y from 58.7% to 64.0%
Share of traditional product increased to 74% (PY: 65%) led by new
product launch. Share of Non PAR increased to 28% (PY: 10%)
Augmenting distribution strength
Third Party Distribution tie up with 6 corporate agents and brokers
Banca tie up with Development Bank of Singapore (DBS )
Note 1: In terms of Annual Premium Equivalent (APE) among private sector players
Total 1,042 974 7%↓
As on 31st March ‘16 (PY: ` 3,260 Cr.)
` 3,275 Cr. EV
FY 2015-16 (PY: 14.1%.)
15.2% p.a. VNB Margin

Ranks # 4 in India with AAUM market share at 10.36% (PY: 10.23%)
Equity ranking improved y-o-y to #4 with 7.81% share (PY: 7.24%)
Total AUM rose by 15% y-o-y and 7% q-o-q to ` 163,121 Cr.
Strong focus on scaling up retail and high margin assets
Domestic Equity AAUM rose to ` 34,969 Cr. (26%↑ y-o-y, 10% q-o-q)
PMS AAUM more than doubled y-o-y to ` 1,493 Cr. (24% ↑ q-o-q)
Birla Sun Life Asset Management Co. Ltd. (BSLAMC)
(` Crore)
Q1FY16 Q1FY17 ∆ %
AAUM 141,486 163,121 15%↑
Revenue 194 204 5%↑
EBT 90 109 21%↑
Net Worth 660 900 36%↑
12
AUM from B-15 cities grew y-o-y 31% vis-à-vis 21% industry growth
(Source: CAMS)
Digital Initiatives: Launched Adhaar based eKYC and mobile
app ‘FINGO’ for instant paperless investing
Consistently gaining market share with focus on retail segment
Q1FY17 ∆% (y-o-y)
Share of Equity in domestic AAUM 23.5% 138 bps↑
Live SIP market share 9.58% 50 bps↑
Monthly SIP book size ` 309 Cr. 44%↑
Customer Folios (Million) 3.1 25%↑
10.23%
10.36%
7.24%
7.81%
Q1FY16 Q1FY17
Market Share
Total AAUM Equity AAUM

Aditya Birla Housing Finance Ltd. (ABHFL)
Loan book has scaled up to ` 2,432 Cr. (PY: ` 453 Cr., PQ: ` 1,973 Cr.).
Posted 23% q-o-q growth
Net worth stood at ` 291 Cr. in Jun’16 led by capital infusion of ` 97 Cr. in Q1
Aditya Birla Insurance Brokers Ltd. (ABIBL: General Insurance Advisory)
In Q1, ABIBL’s premium placement rose y-o-y by 40% to ` 630 Cr.
while industry premium grew by 17%.1.92%
2.31%
ABIBL Market share
58%35%
7%
ConstructionFinance
Loan againstProperty
HomeLoan
ABHFL Loan Mix(Jun’16)
13
Outperforming industry and gaining market share
Aditya Birla Health Insurance Co. Ltd. (ABHICL)
Having received FIPB approval, MMI Strategic Investment (PTY) Limited, a wholly owned subsidiary of MMI
Holdings Ltd. has infused ` 196 Cr and acquired 49% stake in ABHICL, the health insurance arm, in June 2016
With R3 Approval in place, retail products have been filed with IRDAI and launch of services is targeted in H2 FY17
1.92%
Q1 FY16 Q1 FY17

Aditya Birla Private Equity (ABPE)
Funds under management (net) at ` 1,035 Cr.
Both, Fund I and Sunrise Fund, have invested their net deployable corpus
Total 7 exits across both the funds till date. Have achieved IRR of 90% + on the higher side
Aditya Birla Money (Broking, Wealth Management & Online Personal Finance Management)
Broking :
Revamped mobile trading app “Mobile Invest” launched and gaining good response.
In process of launching paperless e-KYC
14
Wealth Management (ABMM) :
Avg. Assets under Advisory stood at ` 8,822 Cr.
Avg. equity Assets under Advisory at ` 2,334 Cr. (16% ↑ y-o-y)
Online Personal Finance Management (MyUniverse) :
Enjoying trust of over 2.7 million registered users who are managing over ` 200 billion through MyUniverse
Among the top 10 largest distributors of new SIPs by numbers in India
Transformed into a multi-product transaction platform with analytics based integrated cross-sell capabilities
Now offering online Goal based Investing , Insurance (Term, Health & Car), Instant Personal Loan and
Paperless Equity

Revenue from the established businesses rose by 11% to ` 2,110 Cr.
EBT from the established businesses surged by 26% to ` 323 Cr.
Revenue
Q1FY16 Q1FY17 ∆%(` Crore)
EBT
Q1FY16 Q1FY17 ∆%Remarks on profitability
553 766 39% NBFC 139 186 34% Higher lending book (44%↑ y-o-y)
1,070 1,062 1% Life Insurance 15 29 95%Growth in premium income coupled with
cost optimisation initiatives
194 204 5% Asset Management 90 109 21% Growth in AUM (15%↑ y-o-y)
33 38 14% General Insurance Advisory 19 19 Higher retail premium placement
15
33 38 14% General Insurance Advisory 19 19 Higher retail premium placement
30 28 9% Broking (0) (2) Lower volumes in retail equity cash & F&O
15 11 25% Wealth Management (4) (9) 127% Cap on upfront commission on MF sales
5 5 Private Equity 1 1
(4) (3) Others / Elimination (4) (10)
1,896 2,110 11% Established businesses 256 323 26%
6 60 New Businesses (20) (38)Housing Finance, MyUniverse, Health Insurance
& Payments Bank are in the investment phase
1,903 2,169 14% Total 236 286 21%
Note: Full financial figures of Asset Management business have been considered above. In the financial results of ABNL, BSLAMC has been consolidated based on equity accounting as per Ind AS

3rd largest Cellular Operator in India
16
3rd largest Cellular Operator in India
Performance highlights : Q1 FY 2016-17
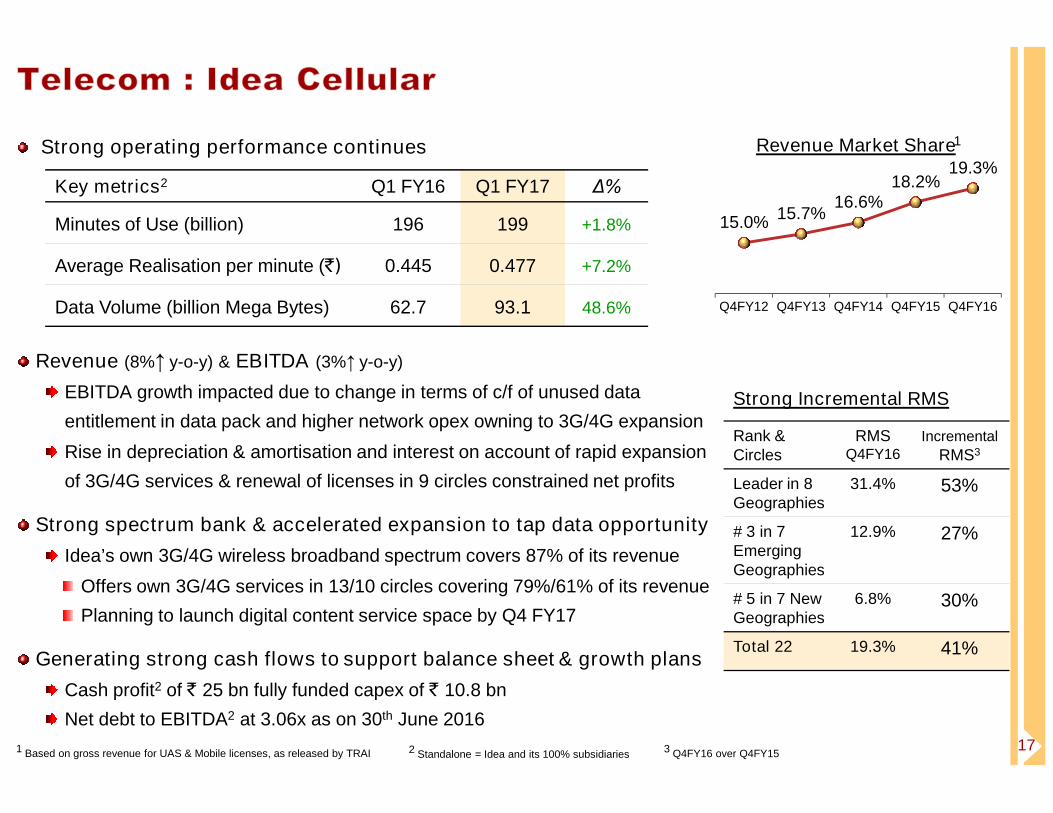
Strong operating performance continues
Revenue (8%↑ y-o-y) & EBITDA (3%↑ y-o-y)
EBITDA growth impacted due to change in terms of c/f of unused data
Key metrics2 Q1 FY16 Q1 FY17 Δ%
Minutes of Use (billion) 196 199 +1.8%
Average Realisation per minute (`) 0.445 0.477 +7.2%
Data Volume (billion Mega Bytes) 62.7 93.1 48.6%
15.0%15.7%
16.6%18.2%
19.3%
Q4FY12 Q4FY13 Q4FY14 Q4FY15 Q4FY16
Revenue Market Share1
Strong Incremental RMS
17
entitlement in data pack and higher network opex owning to 3G/4G expansion
Rise in depreciation & amortisation and interest on account of rapid expansion
of 3G/4G services & renewal of licenses in 9 circles constrained net profits
Strong spectrum bank & accelerated expansion to tap data opportunity
Idea’s own 3G/4G wireless broadband spectrum covers 87% of its revenue
Offers own 3G/4G services in 13/10 circles covering 79%/61% of its revenue
Planning to launch digital content service space by Q4 FY17
Generating strong cash flows to support balance sheet & growth plans
Cash profit2 of ` 25 bn fully funded capex of ` 10.8 bn
Net debt to EBITDA2 at 3.06x as on 30th June 2016
1 Based on gross revenue for UAS & Mobile licenses, as released by TRAI 2 Standalone = Idea and its 100% subsidiaries3 Q4FY16 over Q4FY15
Strong Incremental RMS
Rank &Circles
RMSQ4FY16
Incremental
RMS3
Leader in 8Geographies
31.4% 53%
# 3 in 7EmergingGeographies
12.9% 27%
# 5 in 7 NewGeographies
6.8% 30%
Total 22 19.3% 41%

18
Leading manufacturer of Linen, Urea, VFY and Insulators in India
Performance highlights : Q1 FY 2016-17
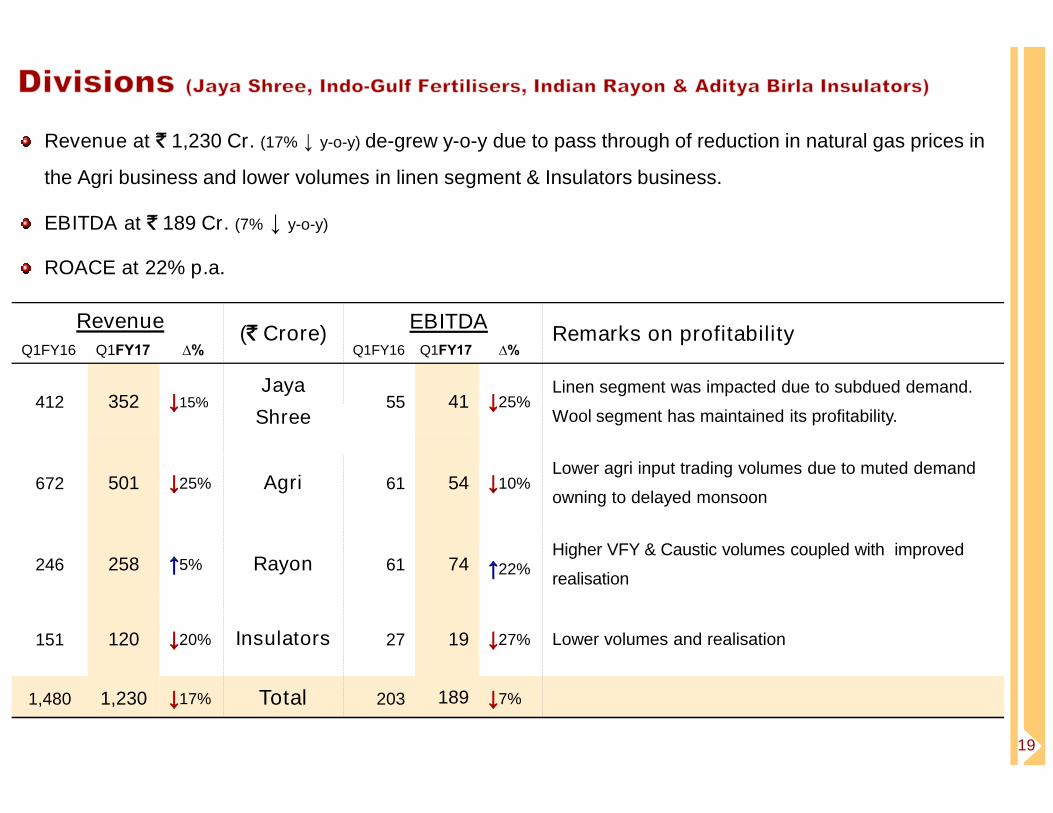
Revenue at ` 1,230 Cr. (17% ↓ y-o-y) de-grew y-o-y due to pass through of reduction in natural gas prices in
the Agri business and lower volumes in linen segment & Insulators business.
EBITDA at ` 189 Cr. (7% ↓ y-o-y)
ROACE at 22% p.a.
Revenue
Q1FY16 Q1FY17 ∆%(` Crore)
EBITDAQ1FY16 Q1FY17 ∆%
Remarks on profitability
412 352 15%Jaya
Shree55 41 25%
Linen segment was impacted due to subdued demand.
19
412 352 15%Shree
55 41 25%Wool segment has maintained its profitability.
672 501 25% Agri 61 54 10%Lower agri input trading volumes due to muted demand
owning to delayed monsoon
246 258 5% Rayon 61 74 22%Higher VFY & Caustic volumes coupled with improved
realisation
151 120 20% Insulators 27 19 27% Lower volumes and realisation
1,480 1,230 17% Total 203 189 7%

Payments Bank
Incorporated ‘Aditya Birla Idea Payments Bank Limited’ in a 51:49 joint venture with Idea Cellular
The JV is in the process of appointing senior management team, selecting the right IT system and defining
innovative products & cost efficient processes before starting services.
Likely to launch its services by the first half of 2017, post receipt of requisite approvals from RBI
The JV will acquire customers ‘Online’ leveraging Aditya Birla Group’s current ~50 million digital customers as
well as ‘Offline’ riding on the strength of Idea’s 2 million+ retail distribution channel across 390,000 towns/villages.
Will partner with Aditya Birla Financial Services, select universal banks etc. to offer range of banking products.
20
Will partner with Aditya Birla Financial Services, select universal banks etc. to offer range of banking products.
The NEFT/IMPS & PPI business of Idea will be integrated with the new Payments Bank to run as single entity
ABNL had won a total of 60 MW (AC Capacity) Solar Power projects in Karnataka in Mar’16
Won 20 MW (AC) project each in 3 Talukas for tariff ranging between ` 4.86 per KWh to ` 4.97 per KWh
CRISIL A- (Stable) rating assigned for proposed ` 300 Cr. bank facilities for the project
In negotiation with lenders, technology suppliers, land owners, equipment suppliers and EPC
contractors etc.
PPA got signed in June 2016 and the commissioning of plants is targeted by end of FY2016-17
Solar Power

Financial Services
NBFC: Expanding offerings to diversify portfolio while sustaining asset quality
Life Insurance: Strengthening channel relationships & enriching product suite to gain market share with
focus on quality sales.
Mutual Fund: Scaling up investors base, expanding profitable assets & maintaining strong fund performance
Housing Finance: Building scalable and profitable book through optimal product-sourcing-customer mix
Health Insurance: Launch of services is targeted in the second half of FY 2016-17
MyUniverse: Scaling up and leveraging the platform for multi-product offering
21
MyUniverse: Scaling up and leveraging the platform for multi-product offering
Payments Bank: Commencing operations in the first half of calendar year 2017 post receipt of RBI approval
Telecom
Capitalising on brand !DEA, strong cash flows and competitive spectrum profile & infrastructure expansion to
capture growth opportunities in voice, emerging wireless broadband and mobile banking business segments
Divisions: Expanding linen yarn and VFY capacities and improving operating efficiency
Solar: Building a 500 MW Solar Power generation platform

22
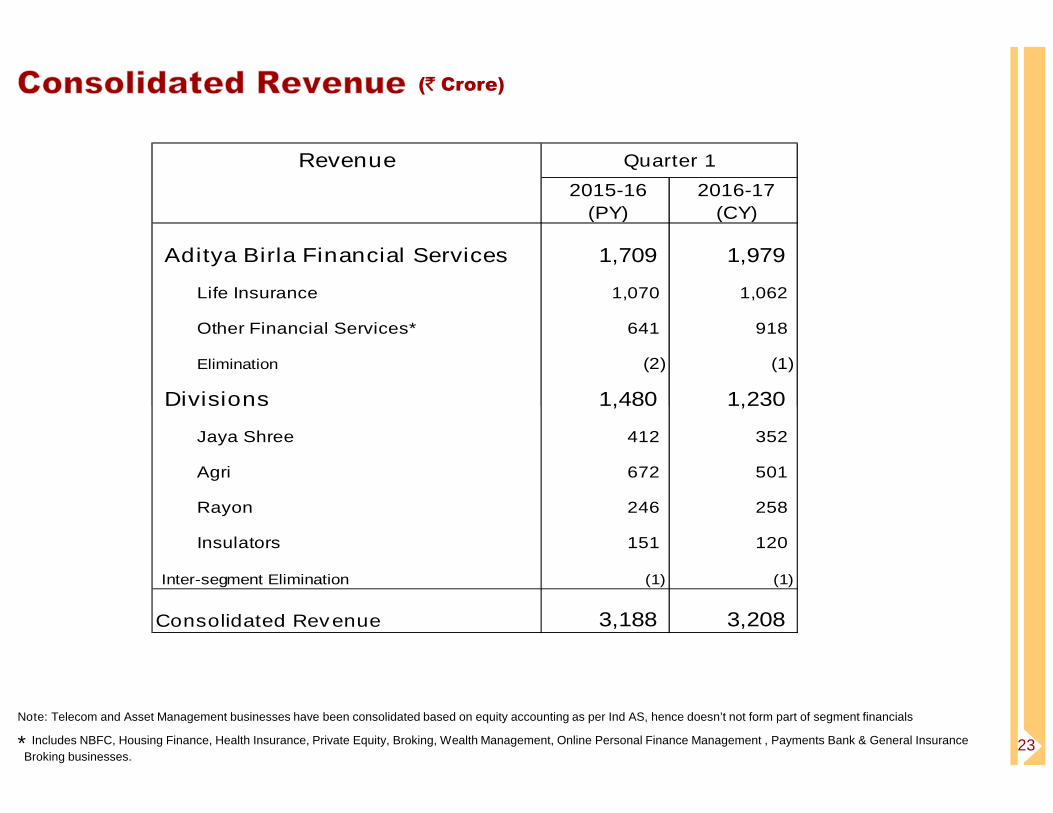
(` Crore)
Revenue
2015-16
(PY)
2016-17
(CY)
Aditya Birla Financial Services 1,709 1,979
Life Insurance 1,070 1,062
Other Financial Services* 641 918
Elimination (2) (1)
Divisions 1,480 1,230
Quarter 1
23
Divisions 1,480 1,230
Jaya Shree 412 352
Agri 672 501
Rayon 246 258
Insulators 151 120
Inter-segment Elimination (1) (1)
Consolidated Revenue 3,188 3,208
Note: Telecom and Asset Management businesses have been consolidated based on equity accounting as per Ind AS, hence doesn’t not form part of segment financials
* Includes NBFC, Housing Finance, Health Insurance, Private Equity, Broking, Wealth Management, Online Personal Finance Management , Payments Bank & General Insurance
Broking businesses.
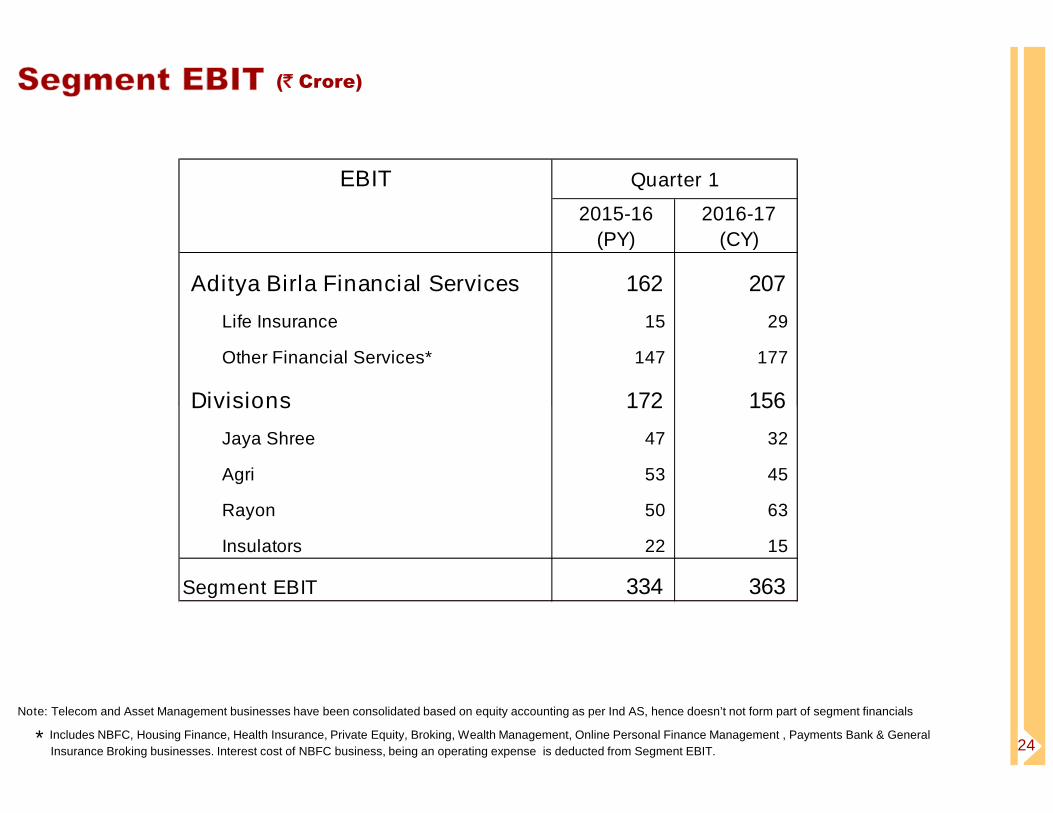
(` Crore)
EBIT
2015-16
(PY)
2016-17
(CY)
Aditya Birla Financial Services 162 207
Life Insurance 15 29
Other Financial Services* 147 177
Divisions 172 156
Quarter 1
24
Note: Telecom and Asset Management businesses have been consolidated based on equity accounting as per Ind AS, hence doesn’t not form part of segment financials
* Includes NBFC, Housing Finance, Health Insurance, Private Equity, Broking, Wealth Management, Online Personal Finance Management , Payments Bank & General
Insurance Broking businesses. Interest cost of NBFC business, being an operating expense is deducted from Segment EBIT.
Divisions 172 156
Jaya Shree 47 32
Agri 53 45
Rayon 50 63
Insulators 22 15
Segment EBIT 334 363
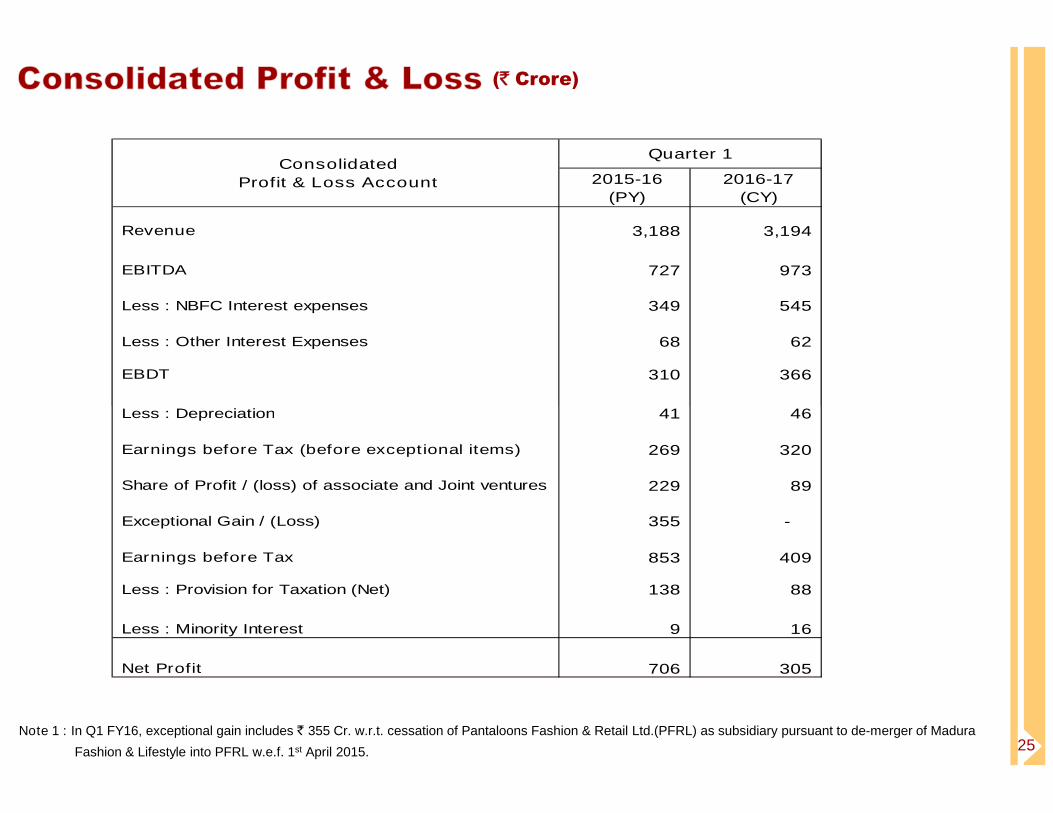
(` Crore)
2015-16
(PY)
2016-17
(CY)
Revenue 3,188 3,194
EBITDA 727 973
Less : NBFC Interest expenses 349 545
Less : Other Interest Expenses 68 62
EBDT 310 366
Less : Depreciation 41 46
Quarter 1Consolidated
Profit & Loss Account
25Note 1 : In Q1 FY16, exceptional gain includes ` 355 Cr. w.r.t. cessation of Pantaloons Fashion & Retail Ltd.(PFRL) as subsidiary pursuant to de-merger of Madura
Fashion & Lifestyle into PFRL w.e.f. 1st April 2015.
Less : Depreciation 41 46
Earnings before Tax (before exceptional items) 269 320
Share of Profit / (loss) of associate and Joint ventures 229 89
Exceptional Gain / (Loss) 355 -
Earnings before Tax 853 409
Less : Provision for Taxation (Net) 138 88
Less : Minority Interest 9 16
Net Profit 706 305
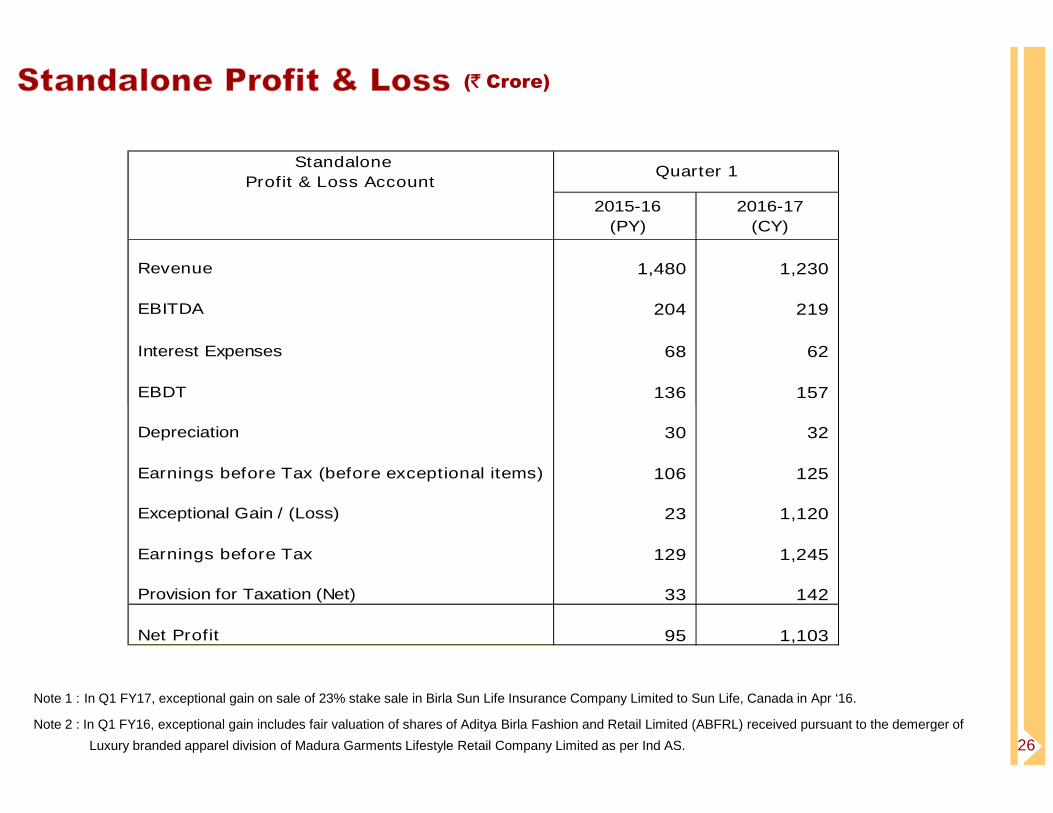
(` Crore)
Standalone
Profit & Loss Account
2015-16
(PY)
2016-17
(CY)
Revenue 1,480 1,230
EBITDA 204 219
Interest Expenses 68 62
EBDT 136 157
Quarter 1
26
Note 1 : In Q1 FY17, exceptional gain on sale of 23% stake sale in Birla Sun Life Insurance Company Limited to Sun Life, Canada in Apr ‘16.
Depreciation 30 32
Earnings before Tax (before exceptional items) 106 125
Exceptional Gain / (Loss) 23 1,120
Earnings before Tax 129 1,245
Provision for Taxation (Net) 33 142
Net Profit 95 1,103
Note 2 : In Q1 FY16, exceptional gain includes fair valuation of shares of Aditya Birla Fashion and Retail Limited (ABFRL) received pursuant to the demerger of
Luxury branded apparel division of Madura Garments Lifestyle Retail Company Limited as per Ind AS.

27

2015-16
(PY)
2016-17
(CY)
2015-16
(PY)
2016-17
(CY)
Aditya Birla Finance 553 766 139 186
Birla Sun Life Insurance 1,070 1,062 15 29
Birla Sun Life Asset Management 194 204 90 109
Aditya Birla Insurance Brokers 33 38 19 19
EBT
Quarter 1
Revenue` Crore
28
Aditya Birla Insurance Brokers 33 38 19 19
Aditya Birla Money 30 28 (0) (2)
Aditya Birla Money Mart 15 11 (4) (9)
Aditya Birla Capital Advisors (PE) 5 5 1 1
Others / Elimination (4) (3) (4) (10)
Established businesses 1,896 2,110 256 323
New businesses (Housing Finance, MyUniverse
& Health Insurance, Payments Bank)6 60 (20) (38)
Total 1,903 2,169 236 286
Note: Full financial figures of Asset Management business have been considered above. In the financials of ABNL, BSLAMC has been consolidated based on equity accounting as per Ind AS

Optimising borrowings cost and ALM profile
Long term debt accounts for ~ 70% of total debt
Overall borrowings cost in Q1FY17 reduced y-o-y by 39 bps
Long term / Short term credit rating at AA+ / A1+ from CRISIL
and India Ratings
2015-16
(PY)
2016-17
(CY)
Revenue 553 766
Earnings before tax 139 186
Net Profit 90 122
Quarter 1
` Crore
Segment-wise Loan book (EOP) Jun'15 Mar'16 Jun'16
Capital Market 3,552 4,407 4,330
Corporate Finance 4,397 6,917 7,311
Infra Finance 4,384 7,336 7,153
Key Business Metrics Q1 FY16 Q1 FY17
Average Yield (incl. fee income) (%) 13.1% 12.1%
Net Interest Income (incl. fee income) (%) 4.9% 4.3%
Opex to NII Ratio (%) 22.5% 20.4%
29
Targeting addition of 10 more branches to reach to 38 markets by Mar ‘17
from current 32 markets (through 37 branches in 15 states)
Long term debt accounts for ~ 70% of total debt
Aditya Birla Housing Finance Ltd. (ABHFL)
2015-16
(PY)
2016-17
(CY)
Revenue 6 58
Earnings before tax (6) (15)
Net Worth 90 291
Quarter 1` Crore
Infra Finance 4,384 7,336 7,153
Mortgages (LAP, LRD & Construction Finance) 5,478 6,593 6,765
Unsecured - 22 62
Others 367 480 647
Total 18,178 25,755 26,267
Cost of Debt (%) 9.47% 9.08%

Industry
In Q1, industry’s total new business premium1 grew by 23% while
private sector grew by 13%. In individual life segment, industry grew
by 16% while private sector grew by 21%.
Birla Sun Life Insurance
Agency channel gaining momentum led by improved productivity
and double digit growth in average ticket size
BSLI remains #1 in group segment with 25.1% market share1
Quarterly EBT is higher at ` 29 Cr. (PY: ` 15 Cr.)
2015-16
(PY)
2016-17
(CY)
New Business Premium (Gross) 316 331
Individual 111 133
Group 205 197
Renewal Premium (Gross) 726 643
Individual 698 613
Group 29 31
Quarter 1
` Crore
30
Quarterly EBT is higher at ` 29 Cr. (PY: ` 15 Cr.)
AUM at ` 32,390 Cr. (6%↑ y-o-y)
Product and Channel Mix (Individual Life Segment) :
Note 1: In terms of APE2 among private sector players Note 2: Annual Premium Equivalent (APE) = 100% of regular premium + 10% of single premium
Premium Income (Gross) 1,042 974
Less : Reinsurance ceded & Service tax (61) (59)
Premium Income (Net) 981 915
Revenue 1,070 1,062
Earnings before tax 15 29
Net Profit 15 29
Assets under management 30,637 32,390
Policyholders' Investments 28,583 27,973
Shareholders' Investments 2,054 4,417
Product Mix Channel Mix
Q1FY16 Q1FY17 Q1FY16 Q1FY17
ULIP35% 26% Agency 85% 78%
PAR55% 46% Banca 9% 8%
Non-PAR 10% 28% CAB 3% 6%
Others 3% 8%

Birla Sun Life Insurance ` Crore
Embedded Value as on 31st Mar’16 3,275
Insurance Business Value 1,540
31
Adjusted Net Worth 1,735
Value of New Business (Individual Life) (FY16) 111
VNB as % of individual life APE (FY16) 15.2%

Industry
AAUM at an all time high of ` 14.4 trillion (17%↑ y-o-y)
Equity AUM rose by 17% to ` 4.5 trillion contributing to 30% of
industry’s AUM growth in past one year
Debt and Liquid assets grew by 18% and 17% respectively
Birla Sun Life Asset Management
Total AAUM expanded to ` 163,121 Cr. (15%↑ y-o-y)
Domestic Equity AAUM surged by 26%
Q1FY16
(PY)
Q4FY16
(PQ)
Q1FY17
(CY)
Domestic Equity 27,702 31,891 34,969
Domestic Fixed Income 97,800 104,612 114,123
Offshore Assets 14,280 13,718 11,535
Alternate Assets 1,703 2,206 2,492
Total AAUM 141,486 152,427 163,121
` Crore
Average AUM
32
PMS AAUM more than doubled y-o-y to ` 1,493 Cr.
Customer base increased y-o-y by 25% to 3.1 million served
by more than 48,500 independent financial advisors
` Crore
2015-16
(PY)
2016-17
(CY)
Revenue (Fee Income) 194 204
Earnings before tax 90 109
Net Profit 60 74
Net Worth 660 900
Quarter 1

> Aditya Birla Insurance Brokers Ltd. (General insurance advisory)
In Q1, premium placement increased y-o-y by 40% from ` 449 Cr. to ` 630 Cr.
Quarterly revenue at ` 38 Cr. (14%↑ y-o-y) and EBT at ` 19 Cr.
> Aditya Birla Money (Broking, Wealth Management & Online Money Management )
Broking: In Q1 FY17, industry volumes grew by 8% in retail cash equity, 25% in retail F&O and 6% in commodity
Market share of Aditya Birla Money is at 1.22% (PY:1.35%) in retail cash equity segment, 1.11% (PY: 1.72%) in retail F&O
segment and 0.67% (PY:0.57%) in commodity segment
Wealth Management: Quarterly average Assets under Advisory stood at ` 8,822 Cr. (13%↑ q-o-q)
33
The business has moved from upfront commission to trail commission model impacting earnings during the quarter
Online Money Management: Growing revenues through broadening of product offerings.
> Aditya Birla Private Equity : Funds under management (net) at ` 1,035 Cr.
PY CY PY CY PY CY PY CY
Revenue 33.0 37.5 30.3 27.5 15.1 11.4 5.1 4.6
Earnings before tax 18.9 18.5 (0.1) (1.5) (4.3) (9.2) 1.3 1.3
Net Profit / (Loss) 12.5 11.5 (0.1) (1.5) (4.4) (9.2) 1.0 0.9
Aditya Birla
Capital Advisors
(Private Equity)
Aditya Birla Money
(Equity & Commodity
Broking)
` Crore
Quarter 1
Aditya Birla
Money Mart
(Wealth Management)
Aditya Birla Insurance
Brokers (General
Insurance Broking)

Base of 183 million VLR (active) subscribers provides Idea a
unique platform for future growth in Mobile Voice, Wireless
Broadband, Digital Content and Mobile banking services
FY16 Y-o-Y Δ%
Idea’s total Data Subscribers (Mn) 49.0 +32%
- Of these 3G / 4G Data Subscribers (Mn) 27.0 +62%
- 3G / 4G Data Volume Usage (Bn MB) 66.9 +86%
- 3G / 4G data volume as % of total volume 72% +1430 bps
2015-16
(PY)
2016-17
(CY)
Revenue 8,792 9,487
EBITDA 2,979 3,074
EBIT 1,568 1,155
Net Profit 855 220
` Crore
(Consolidated Results)
Quarter 1
34
~88% of Idea’s spectrum holding is acquired through auction
which provides flexibility to offer any service (2G / 3G / 4G), based
on consumer demand & eco-system.
Capex of ` 10.8 billion (excluding spectrum payout & capitalised
interest / forex cost) was incurred in Q1 FY17
Capex guidance for FY17 (excl. spectrum payout &
associated capex) stands at ` 65-70 billion.
VLR Subs. as % of reported Subs.103.9%
(May’16)
Highest in
industry
VAS as % of Service revenue (Q4) 28.2% +210 bps
Net Profit 855 220
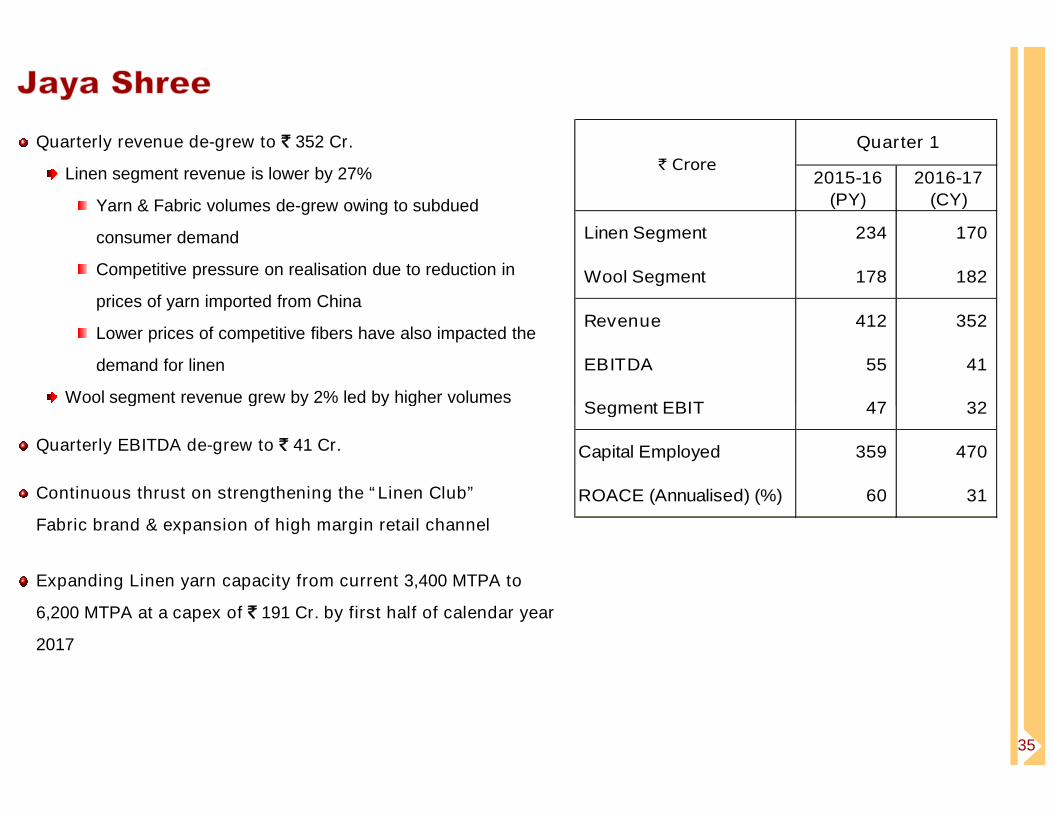
Quarterly revenue de-grew to ` 352 Cr.
Linen segment revenue is lower by 27%
Yarn & Fabric volumes de-grew owing to subdued
consumer demand
Competitive pressure on realisation due to reduction in
prices of yarn imported from China
Lower prices of competitive fibers have also impacted the
demand for linen
Wool segment revenue grew by 2% led by higher volumes
2015-16
(PY)
2016-17
(CY)
Linen Segment 234 170
Wool Segment 178 182
Revenue 412 352
EBITDA 55 41
Segment EBIT 47 32
` Crore
Quarter 1
35
Wool segment revenue grew by 2% led by higher volumes
Quarterly EBITDA de-grew to ` 41 Cr.
Continuous thrust on strengthening the “Linen Club”
Fabric brand & expansion of high margin retail channel
Expanding Linen yarn capacity from current 3,400 MTPA to
6,200 MTPA at a capex of ` 191 Cr. by first half of calendar year
2017
Segment EBIT 47 32
Capital Employed 359 470
ROACE (Annualised) (%) 60 31

Despite higher urea sales volume (6%↑ y-o-y) , revenue
de-grew to ` 501 Cr. due to pass through of reduction in natural
gas prices on account of gas pooling policy effective from
1st Jun’15
EBITDA is lower at ` 54 Cr. due to lower agri input trading
revenue on account of delayed monsoon
Outstanding fertilisers subsidy at ` 925 Cr. (PY: ` 1,033 Cr.,
Mar ‘16: ` 1,112 Cr )
Further realised subsidy of ` 286 Cr. in July 2016
2015-16
(PY)
2016-17
(CY)
Manufactured Urea Sales ('000 MT) 286 305
Revenue 672 501
Manufacturing(Urea, Customised Fertilisers)
583 439
Trading(Fertilisers, Seeds, Agro-Chemicals)
89 62
EBITDA 61 54
Quarter 1
` Crore
36
Further realised subsidy of ` 286 Cr. in July 2016
With reduction in gas prices and gas pooling policy in place,
urea subsidy is expected to be lower y-o-y
New Urea Policy -2015 and implementation of Pooling of Gas
for Fertilisers / Urea sector, effective from 01st Jun ‘15, enable
the energy efficient plants to achieve full production capacity
Segment EBIT 53 45
Capital Employed 1,384 1,351
ROACE (Annualised) (%) 15 13

Revenue at ` 258 Cr. is up y-o-y by 5%
VFY segment revenue at ` 205 Cr.
Volume grew marginally by 2% y-o-y
Chemicals segment revenue surged by 15%
Higher caustic soda volumes (3%↑ y-o-y) and
improved caustic prices in line with international prices
EBITDA rose y-o-y by 22% to ` 74 Cr.
Improved realisation and higher volumes augmented
2015-16
(PY)
2016-17
(CY)VFY
Manufactured VFY Sales Volumes (MT) 4,940 5,056
Revenue (VFY & allied chemicals) ( ` Cr.) 200 205
Chemicals
Caustic Soda Sales Volume (MT)1 19,443 19,943
Revenue ( ` Cr.) 46 53
Total Revenue 246 258
EBITDA 61 74
Quarter 1
` Crore
37
Improved realisation and higher volumes augmented
profitability in both the segments
Scaling up VFY capacity at a capex of ` 40 Cr. by the first
half of calendar year 2017
ROACE enhanced y-o-y from 28% p.a. to 35% p.a.
Note 1 : Including captive consumption and inter unit sale
Segment EBIT 50 63
Capital Employed 729 726
ROACE (Annualised) (%) 28 35
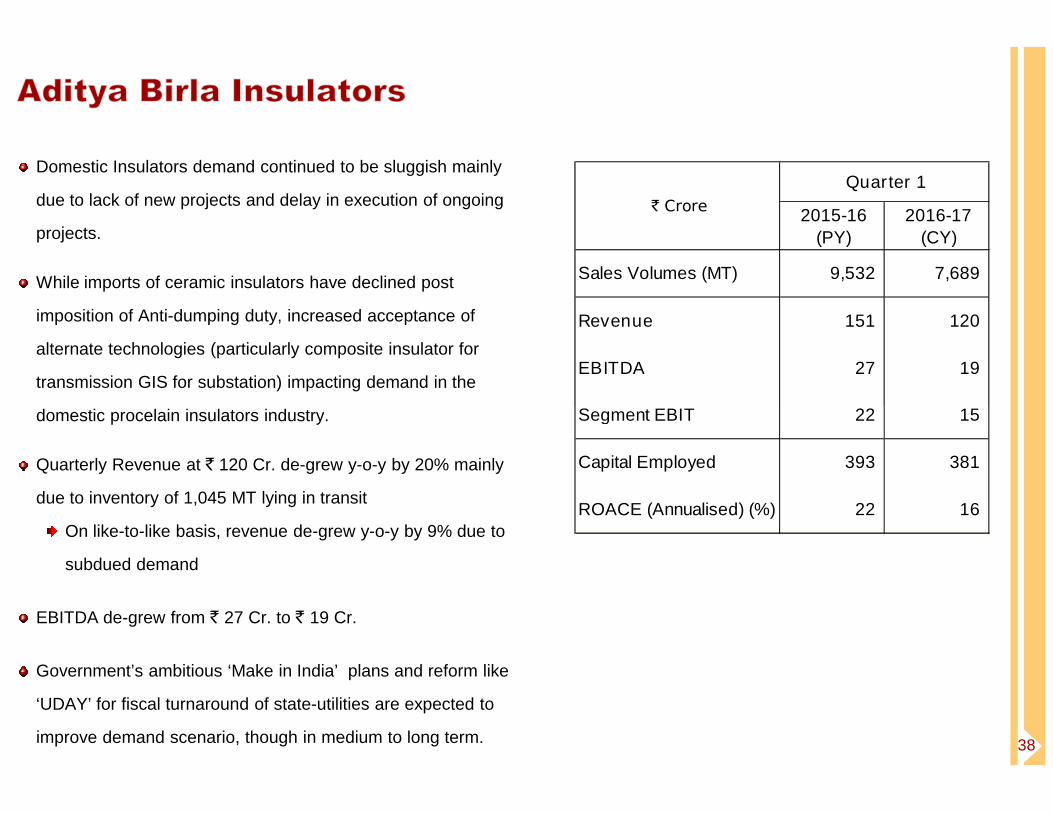
Domestic Insulators demand continued to be sluggish mainly
due to lack of new projects and delay in execution of ongoing
projects.
While imports of ceramic insulators have declined post
imposition of Anti-dumping duty, increased acceptance of
alternate technologies (particularly composite insulator for
transmission GIS for substation) impacting demand in the
domestic procelain insulators industry.
2015-16
(PY)
2016-17
(CY)
Sales Volumes (MT) 9,532 7,689
Revenue 151 120
EBITDA 27 19
Segment EBIT 22 15
Quarter 1
` Crore
38
domestic procelain insulators industry.
Quarterly Revenue at ` 120 Cr. de-grew y-o-y by 20% mainly
due to inventory of 1,045 MT lying in transit
On like-to-like basis, revenue de-grew y-o-y by 9% due to
subdued demand
EBITDA de-grew from ` 27 Cr. to ` 19 Cr.
Government’s ambitious ‘Make in India’ plans and reform like
‘UDAY’ for fiscal turnaround of state-utilities are expected to
improve demand scenario, though in medium to long term.
Segment EBIT 22 15
Capital Employed 393 381
ROACE (Annualised) (%) 22 16
39

Certain statements made in this presentation may not be based on historical information or facts and may be “forward looking statements” including, but not
limited to, those relating to general business plans & strategy of Aditya Birla Nuvo Limited ("ABNL"), its future outlook & growth prospects, future
developments in its businesses, its competitive & regulatory environment and management's current views & assumptions which may not remain constant
due to risks and uncertainties. Actual results may differ materially from these forward-looking statements due to a number of factors, including future
changes or developments in ABNL's business, its competitive environment, its ability to implement its strategies and initiatives and respond to technological
changes and political, economic, regulatory and social conditions in the countries in which ABNL conducts business. Important factors that could make a
difference to ABNL’s operations include global and Indian demand supply conditions, finished goods prices, feed stock availability and prices, cyclical
demand and pricing in ABNL’s principal markets, changes in Government regulations, tax regimes, competitors actions, economic developments within India
and the countries within which ABNL conducts business and other factors such as litigation and labour negotiations.
This presentation does not constitute a prospectus, offering circular or offering memorandum or an offer to acquire any shares and should not be considered
as a recommendation that any investor should subscribe for or purchase any of ABNL's shares. Neither this presentation nor any other documentation or
information (or any part thereof) delivered or supplied under or in relation to the shares shall be deemed to constitute an offer of or an invitation by or on
40
information (or any part thereof) delivered or supplied under or in relation to the shares shall be deemed to constitute an offer of or an invitation by or on
behalf of ABNL.
ABNL, as such, makes no representation or warranty, express or implied, as to, and does not accept any responsibility or liability with respect to, the
fairness, accuracy, completeness or correctness of any information or opinions contained herein. The information contained in this presentation, unless
otherwise specified is only current as of the date of this presentation. ABNL assumes no responsibility to publicly amend, modify or revise any forward
looking statements on the basis of any subsequent developments, information or events or otherwise. Unless otherwise stated in this document, the
information contained herein is based on management information and estimates. The information contained herein is subject to change without notice and
past performance is not indicative of future results. ABNL may alter, modify or otherwise change in any manner the content of this presentation, without
obligation to notify any person of such revision or changes. This presentation may not be copied and disseminated in any manner.
INFORMATION PRESENTED HERE IS NOT AN OFFER FOR SALE OF ANY EQUITY SHARES OR ANY OTHER SECURITY OF ABNL
This presentation is not for publication or distribution, directly or indirectly, in or into the United States, Canada or Japan. These
materials are not an offer of securities for sale in or into the United States, Canada or Japan.
Copyright © 2016 Aditya Birla Nuvo Ltd.

Contact Us
41
Corporate Identity Number L17199GJ1956PLC001107
Regd. Office: Indian Rayon Compound, Veraval – 362 266 (Gujarat)
Corporate Office: 4th Floor ‘A’ Wing, Aditya Birla Center, S.K. Ahire Marg, Worli, Mumbai – 400 030
Website: www.adityabirlanuvo.com or www.adityabirla.com Email: [email protected]
Aditya Birla Nuvo Limited
Investor Relations ContactRomi Talwar | Corporate Finance & Investor Relations | Aditya Birla Nuvo Ltd.
Address : Aditya Birla Centre | A-Wing | 4th Floor | S. K. Ahire Marg | Worli | Mumbai 400030
Phone : +91 22 2499 5573 | Email : [email protected]


