6 Mr. Horas – AP Human Geography Chapter 2: Population (pages 44 – 81) Key Issue #1: Where is the World’s Population Distributed? (page 45) Before you Read: In what geographic areas do you believe most people in the world live? BYR: 1. State three reasons the study of population is important. 1a. 1b. 1c. 2. Define demography. 2. 3. List the regions (areas) where most people live (e.g. near the coast) 3. 4. What percent of the world’s population is located in the following regions and what percentage is urban? A. East Asia B. South Asia C. Southeast Asia D. Western & Eastern Europe E. Northeast U.S. & Southeast Canada Region % world population % urban East Asia South Asia SE Asia Europe NE U.S. & SE Canada
Transcript
6
Mr. Horas – AP Human Geography Chapter 2: Population (pages 44 – 81)
Key Issue #1: Where is the World’s Population Distributed? (page 45) Before you Read: In what geographic areas do you believe most people in the world live?
BYR:
1. State three reasons the study of population is important.
1a.
1b.
1c.
2. Define demography. 2.
3. List the regions (areas) where most people live (e.g. near the coast)
3.
4. What percent of the world’s population is located in the following regions and what percentage is urban? A. East Asia B. South Asia C. Southeast Asia D. Western & Eastern Europe E. Northeast U.S. & Southeast Canada
Region % world population % urban
East Asia
South Asia
SE Asia
Europe
NE U.S. & SE Canada
7
5. Define ecumene.
5.
6. State four reasons why certain regions of the world are sparsely populated.
6a.
6b.
6c.
6d.
7. Define the following terms: Arithmetic Density 7a.
Physiological Density 7b.
Agricultural Density 7c.
After you read: In a sentence, write a main idea that answers the key issue question posed.
AYR:
8
Key Issue #2: Where Has the World’s Population Increased? (page 53) Before you read: In what regions of the world do you believe population is increasing most rapidly? Why?
BYR:
1. Define the following terms and give a “low” number for the developed countries and a “high” number for a developing country. A. Crude Birth Rate (CBR): B. Crude Death Rate (CDR): C. Natural Increase Rate (NIR) D. Doubling Time E. Total Fertility Rate (TFR): F: Infant Mortality Rate (IMR): G. Life Expectancy
Term Defined Low Rate
High Rate
CBR
CDR
NIR
Doubling Time
TFR
IMR
Life Expectancy
2. How are the maps (2-7, 2-8, 2-9, 2-10 & 2-11) similar? Point out three ways.
2a.
2b. 2c.
9
3. Why doesn’t map 2-12 on CDR follow this same pattern?
3.
After you read: In a sentence, write a main idea that answers the key issue question posed.
AYR:
Key Issue #3: Why is Population Increasing at Different Rates in Different Countries? (57)
Before you read: Why do you think
population is actually decreasing in some parts of the world?
1. Name and describe the four stages of the demographic transition model. Make note of any revolution that pushed a country into a new stage.
1a. Stage One:
1b. Stage Two:
1c. Stage Three:
1d. Stage Four:
2. Draw and label each line of the Demographic Transition Model (DTM):
2.
10
3. Describe what happened in England in each of the four stages of the DTM.
3a.
3b.
3c.
3d.
4. What are two types of information provided by a population pyramid?
4a.
4b.
5. Define dependency ratio. Why is this a concern in poor as well as wealthy countries?
5a.
5b.
6. Define sex ratio.
6.
7. Draw and describe the population pyramid for each country.
7a. Cape Verde (Stage 2):
11
7b. Chile (Stage 3):
7c. Denmark (Stage 4):
8. In what stage of the DTM are most countries of the world?
8.
9. Give two reasons why the death rate has dropped worldwide.
9a.
9b.
10. Why hasn’t the world’s crude birth rate (CBR) declined as well? Give two reasons.
10a.
10b.
11. Why is world population increasingly rapidly? Give two reasons.
11a.
11b.
After you read: In a sentence, write a main idea that answers the key issue question posed.
AYR:
12
Key Issue #4: Why Might the World Face an Overpopulation Problem? (69) Before you read: Do you believe the world will soon face an overpopulation problem? Why or why not?
BYR:
1. Explain Thomas Malthus’s (1766 – 1834) view on world population and the future.
1.
2. Explain two ways Neo-Malthusians have changed Malthus’s original theory.
2a.
2b.
3. Explain two criticisms of Malthus’s theory. 3a.
3b.
4. Why didn’t Malthus’s views concerning world population come true?
4.
5. Describe two ways of reducing the natural increase rate (NIR).
5a.
5b.
13
6. Define epidemiology. 6.
7. What are the main cause(s) of death in each of the four (five) stages of the DTM?
7a. Stage One:
7b. Stage Two:
7c. Stage Three:
7d. Stage Four:
7e. (Stage Five):
8. How has AIDS impacted Sub-Saharan Africa. Give three examples.
8a.
8b.
8c.
After you read: In a sentence, write a main idea that answers the key issue question posed.
AYR:
14
AP Human Geography – Mr. Horas Chapter 3: Migration (pages 82 – 113)
Introduction (page 85)
1. Explain the difference between immigration and emigration.
1.
2. Compare circulation and migration. 2.
3. Explain how migration affects globalization. 3.
Key Issue #1: Why Do People Migrate? (87)
Before You Read: Give two reasons why you believe people migrate to another country.
BYR:
1. List E. G. Ravenstein’s three main elements of migration.
1a.
1b.
1c.
2. Compare push to pull factors. 2.
3. Name and describe three main types of
push and pull factors for migration. 3a.
3b.
3c.
15
4. Define intervening obstacle. 4.
5. Compare internal migration to international
migration. 5.
6. List and explain the two types of internal
migration. 6a.
6b.
7. List and explain the two types of
international migration. 7a.
7b.
8. Describe the four stages of Wilbur
Zelinsky’s migration transition model. 8.
9. What changes did Ravenstein observe
about gender and migration?
9.
16
10. What changes did Ravenstein observe about family status and migration?
10.
11. Why do undocumented residents (illegal
immigrants) have little trouble finding jobs in the U.S.?
11.
After you read: In a sentence, write a main idea that answers the key issue question posed.
AYR:
Key Issue #2: Where Are Migrants Distributed? (page 90)
Before you read: In what four states would you guess most immigrants to the U.S. live? Why?
BYR:
1. Describe three characteristics of global migration patterns.
1a.
1b.
1c.
2. What percentage of the following countries’
populations is made up of immigrants?
U.S. 2a. U.S.
Australia 2b. Australia
Canada 2c. Canada
17
United Arab Emirates 2d. United Arab Emirates
Kuwait 2e. Kuwait
3. Describe the three main eras of immigration to the U.S.
3a.
3b.
3c.
4. Describe who came to the U.S. and why in
each of the three eras:
A. Colonial Immigration (1600s to 1800) A.
B. Nineteenth Century Immigration 1. First Peak (1840s & 1850s) B1.
2. Second Peak (1880s) B2.
3. Third Peak (1890s) B3.
C. Recent Immigration From LDCs 1. Asian (1970s - ) C1.
2. Latin American (1980s - ) C2.
5. In a sentence, summarize immigration
patterns to what is now the current U.S. 5.
18
6. How did the demographic transition affect Europe’s emigration?
6.
7. Describe the impact of European
emigration on world culture. 7.
8. What is an undocumented immigrant and
how do they get into the U.S.? 8a.
8b.
9. What is the BCIS and how does it stem the
flow of illegal immigrants? 9a.
9b.
10. Describe the pattern of immigration of Latin
Americans to the U.S. 10.
11. What have been the main destinations of
recent immigrants into the U.S.? 11.
12. Define chain migration. 12.
After you read: In a sentence, write a main idea that answers the key issue question posed.
AYR:
19
Key Issue #3: Why Do Migrants Face Obstacles? (98)
Before you read: List three obstacles you believe migrants to a new country face.
BYR:
1. What are the two main difficulties faced by
migrants to a new country? 1a.
1b.
2. What was the primary goal of the Quota Act
of 1921 and the National Origins Act of 1924?
2.
3. How did U.S. immigration policy change in
1968? 3.
4. Who gets preference for legal migration to
the U.S.? 4.
5. How are refugees treated under U.S. law? 5.
6. Define brain drain. 6.
7. Compare and contrast guest workers to
time-contract workers. 7.
8. Explain how the U.S. treats people leaving
the following locations coming to the U.S.
a. Cuba: 8a.
20
b. Haiti: 8b.
c. Vietnam: 8c.
9. Compare and contrast the U.S. attitude towards immigrants to that of other countries toward their guest workers.
9.
After you read: In a sentence, write a main idea that answers the key issue question posed.
AYR:
Key Issue #4: Why Do People Migrate Within a Country? (107)
Before you read: List three reasons why you believe people migrate within a country.
BYR:
1. Name and describe two main types of
internal migration. 1a.
1b.
2. What is the “center of population gravity?” 2.
3. List three reasons it took so long for the
“center of population gravity” to move away from the coast?
3a.
3b.
3c.
4. What two factors fueled the western
movement between 1790 & 1830? 4a.
4b.
5. What role did the 98th meridian play in the
western expansion of the US? 5.
21
6. State 3 reasons the western movement of the “center of population gravity” slowed after 1880?
6a.
6b.
6c.
7. List the 2 reasons for the movement of
people from the North & East to the South & West.
7a.
7b.
8. Explain why interregional migration has
occurred in 3 countries or areas (e.g. Russia).
8a.
8b. 8c.
9. How does intraregional migration patterns differ between MDCs and LDCs?
9.
10. What are the attractions of the suburbs
over urban areas? 10.
11. What is counterurbanization? 11.
12. Why is counterurbanization no longer a
factor in .the USA? 12.
After you read: In a sentence, write a main idea that answers the key issue question posed.
AYR:
22
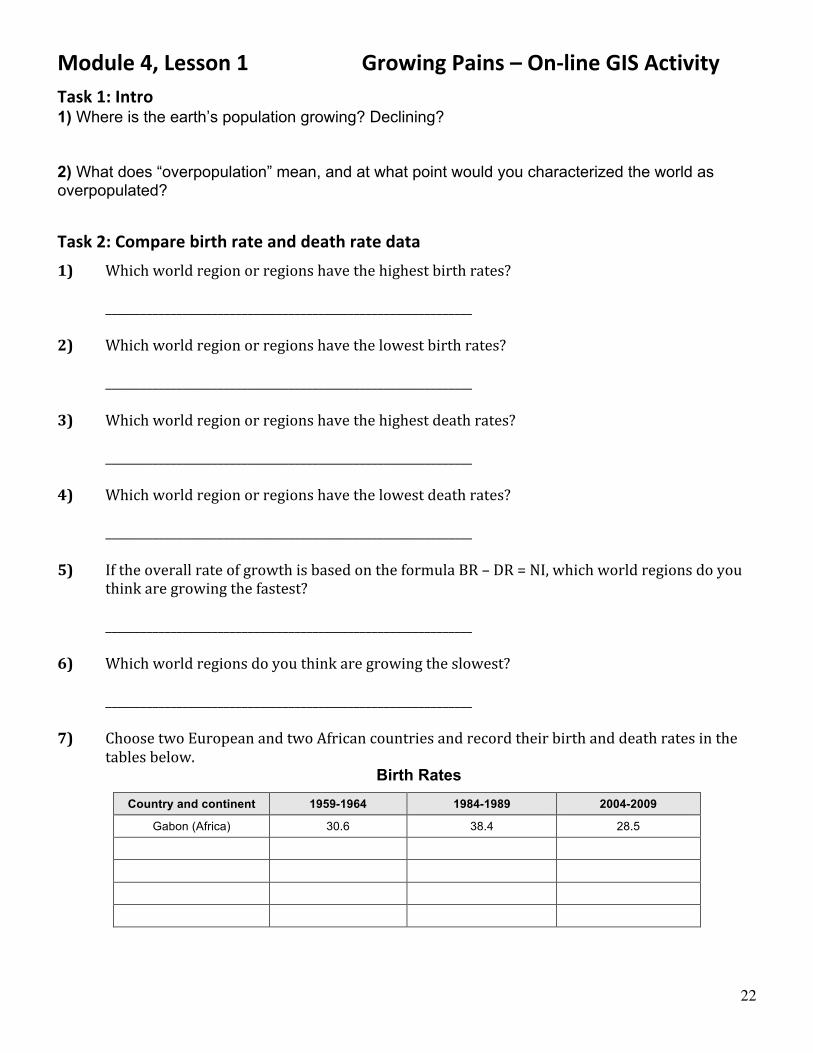
Module 4, Lesson 1 Growing Pains – On-‐line GIS Activity Task 1: Intro 1) Where is the earth’s population growing? Declining? 2) What does “overpopulation” mean, and at what point would you characterized the world as overpopulated?
Task 2: Compare birth rate and death rate data
1) Which world region or regions have the highest birth rates?
______________________________________________________________ 2) Which world region or regions have the lowest birth rates?
______________________________________________________________ 3) Which world region or regions have the highest death rates?
______________________________________________________________ 4) Which world region or regions have the lowest death rates?
______________________________________________________________ 5) If the overall rate of growth is based on the formula BR – DR = NI, which world regions do you
think are growing the fastest?
______________________________________________________________ 6) Which world regions do you think are growing the slowest?
______________________________________________________________ 7) Choose two European and two African countries and record their birth and death rates in the
tables below. Birth Rates
Country and continent 1959-1964 1984-1989 2004-2009
Gabon (Africa) 30.6 38.4 28.5
23
Death Rates
Country and continent 1959-1964 1984-1989 2004-2009
Gabon (Africa) 25.5 12.5 10.2
8) List three questions that the Birth Rate and Death Rate maps raise in your mind.
______________________________________________________________ Task 3: Add the Natural Increase layer
9) What is happening to the populations of countries that are pink?
______________________________________________________________ 10) Which world regions are growing the fastest?
______________________________________________________________ 11) Which world regions are losing people or not growing?
______________________________________________________________ 12) Think about what it would mean for a country to have a population that is growing rapidly or one
that is growing slowly or shrinking. Which of these two situations do you think would cause more problems within the country?
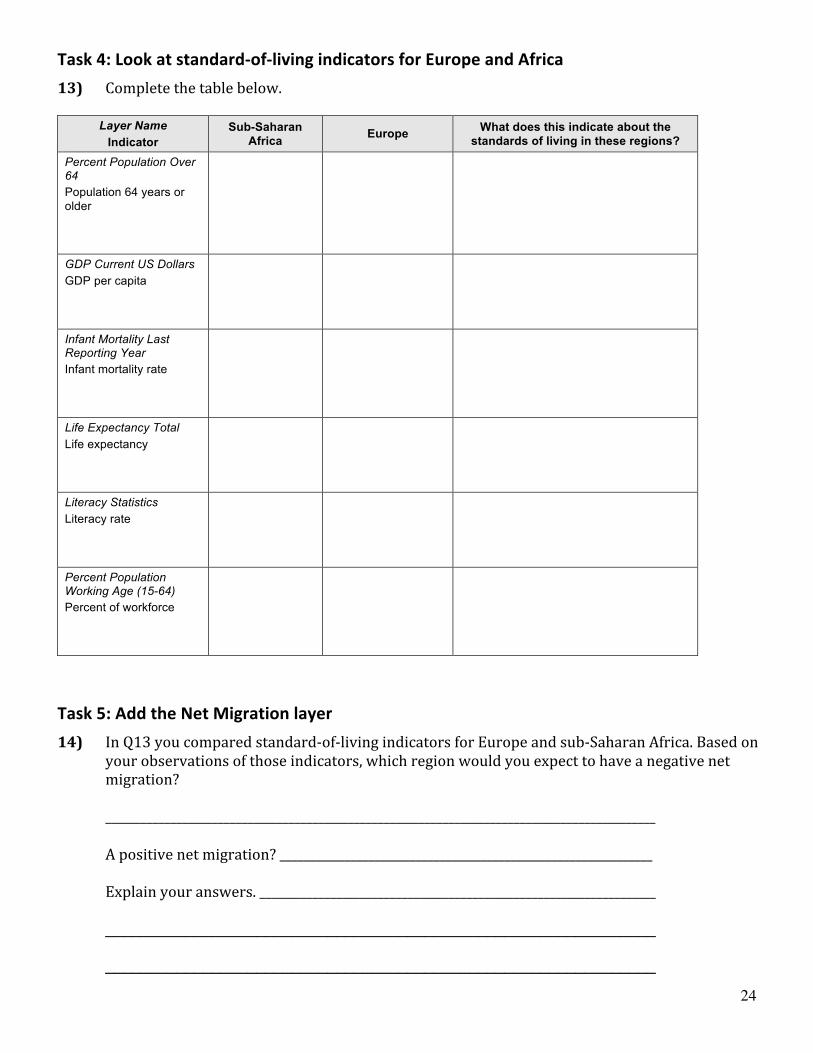
Task 4: Look at standard-‐of-‐living indicators for Europe and Africa
13) Complete the table below.
Layer Name Indicator
Sub-Saharan Africa Europe What does this indicate about the
standards of living in these regions?
Percent Population Over 64 Population 64 years or older
GDP Current US Dollars GDP per capita
Infant Mortality Last Reporting Year Infant mortality rate
Life Expectancy Total Life expectancy
Literacy Statistics Literacy rate
Percent Population Working Age (15-64) Percent of workforce
Task 5: Add the Net Migration layer
14) In Q13 you compared standard-‐of-‐living indicators for Europe and sub-‐Saharan Africa. Based on your observations of those indicators, which region would you expect to have a negative net migration?
_____________________________________________________________________________________________ A positive net migration? _______________________________________________________________
Explain your answers. ___________________________________________________________________
17) Based on your map investigations, write a hypothesis about how a country’s rate of natural increase affects its standard of living and its net rate of migration.
18) In the table below, illustrate your hypothesis with data from one European country and one sub-‐
Saharan African country.
Europe Data Africa
Country name
Natural increase
Net migration
26
AP Human Geography – Mr. Horas Eating Bitterness 1. Who are you? Where did you originally live? 2. Why did you leave your rural residence to come to Gan Jia Zhai? 3. In what way is your life better off in the city of Gan Jia Zhai? 4. Describe two challenges you face living in Gan Jia Zhai? 5. What is an interesting or humorous story about your life? 6. In what way is your life similar to your character’s life? 6. How is your life different?
27
Chinese Characters – Eating Bitterness Discussion Step One: Everyone tells their story. As they tell their story (or afterward), each person in the group must ask them at least one question. Step Two: Answer the following questions: 1. In what ways (at least four) are your lives similar? 2. In what ways are your lives better off in the city of Gan Jia Zhai? 3. Describe at least two challenges each of you face living in Gan Jia Zhai? 4. Who had the most interesting or humorous story? What was it? 5. What did you learn about China’s past from your reading? 6. What did you learn about China’s future prospects from your reading?
28
The Other Side of Immigration Documentary Before watching 1. What kind of person immigrates? From where do most immigrants to the U.S. come? 2. In what ways is immigration helpful to the U.S.? In what ways does it hurt the U.S.? 3. If you were President of the U.S., what would you do about illegal immigration? After watching 1. List three reasons Mexicans immigrate illegally to the U.S. 2. What is NAFTA and why or how did it motivate some Mexicans to migrate illegally to the U.S.? 3. How do remittances (money immigrants send home) impact households and communities in rural Mexico? Give two examples. 4. Give two examples of how migration affects families in rural Mexico. 5. If you were President of the U.S., what would you do about illegal immigration?
29
AP Human Geography – Mr. Horas “Globals, Locals and Mobals” by Harm DiBlij Core Periphery
Def
ine
Loca
tion
Eco
nom
ic T
raits
Soc
ial /
Dem
ogr.
Trai
ts
Give three examples of how events and processes in the Core influence life in the periphery. You may want to focus on the migration of peoples.