35
A Framework & Guidance for Co-operatives January 2019 Key Performance Indicators

A Framework & Guidance forCo-operatives January 2019
Key Performance
Indicators

This guidance can be used on a standalone basis or in conjunction with the following Co-operatives UK publications:
Narrative Reporting: A Framework and Guidance for Co-operatives. (2017)
Simply Performance: A guide to creating member value by aligning co-operative strategy, performance measurement and reporting. (2013)
B Key Performance Indicators • A Framework & Guidance for Co-operatives
Foreword “If you don’t know where you’re going, any road will take you there.” Part of the exchange (paraphrased here) between the Cheshire Cat and Alice is the antithesis of good business planning.
We need high level objectives and a plan for how to achieve them. Over time those objectives and strategies may change as we seek out the best ways to achieve our aims. What does not change is our basic co-operative values and principles.
So where do KPIs come in? Just as we must know our destination, we also need to know our progress. KPIs provide that sense-check. They are an incredibly important tool in terms of delivering our strategy and feeding back to members. But how do we select the right indicators? And where does our co-operative status come in?
Co-operative values and principles are the very bedrock upon which our organisations are built, so our KPIs have to be co-operative. They have to be effective and meaningful and the framework in this document is designed to help co-operatives select the indicators most appropriate to them. Put together by the Co-operative Performance Committee, the framework is simple and flexible and can be used by all co-ops, irrespective of type, size or sector.
John Sandford
Chair of the Co-operative Performance Committe
The Role of the Co-operative Performance Committee (CPC)
The CPC is a Co-operatives UK Member Group made up of senior finance leaders from the co-operative sector which provides strategic direction and best practice guidance in matters of accounting, financial reporting and business performance monitoring: www.uk.coop/cpc

C Key Performance Indicators • A Framework & Guidance for Co-operatives
Contents
Executive summary 1
Introduction 2
Key Performance Indicator framework for co-operatives 3
Developing KPIs 6
The Framework 8
Principle 1 – Voluntary and Open Membership 9
Principle 2 – Democratic Member Control 10
Principle 3 – Member Economic Participation 12
Principle 4 – Autonomy and Independence 14
Principle 5 – Education, Training and Information 15
Principle 6 – Co-operation among Co-operatives 16
Principle 7 – Concern for Community 17
Embedding KPIs in your Co-operative 19
Appendix A – Elements of Governance Wheel 21
Appendix B – Co-operative Principles 22
Appendix C – Narrative Reporting Pillars 23
Appendix D – KPI Best Practice Examples 25
Seward Community Coop 25
VanCity Credit Union 26
The Co-op 27
The Midcounties Co-operative 28
Rochdale Boroughwide Housing 31

1 Key Performance Indicators • A Framework & Guidance for Co-operatives
Executive summary Key Performance Indicators (KPIs) are quantifiable metrics that – when done well – reflect how well an organisation is achieving its stated goals and objectives. They play a key role in how organisations agree, monitor, review and improve the things that deliver their core purpose, mission and strategy. KPIs can be used internally or externally and link to a wide range of other processes, tools and approaches to running co-operatives.
KPIs give direction, focus and insight to all those involved in the running and governance of a co-operative – from the Board to colleagues or volunteers, or members in a worker co-operative. They provide a clear structure for reporting to members and other stakeholders.
This report provides a framework, based on a series of questions which reflect the seven co-operative principles, to help co-operatives set meaningful KPIs. Real examples of best practice from other co-operatives are included in the Appendices to bring this framework to life.
The framework also provides a tool that can be used alongside Co-operatives UK’s Elements of Governance Wheel; depicting the areas of governance and reporting that should be in place within a thriving co-operative business (see Appendix A).
Each co-operative can choose the areas of the framework that will particularly resonate with their members and use the model as an ‘options menu’ for developing best practice.

2 Key Performance Indicators • A Framework & Guidance for Co-operatives
IntroductionKey Performance Indicators (KPIs) are one of the tools used by many businesses and organisations to set and monitor performance against their core objectives, goals and purpose. Effective KPIs should provide a snapshot of how an organisation is delivering against its strategy, mission and purpose. They are supplemented by a wide range of other business performance tools and data.
The challenge for any organisation is identifying and selecting a set of KPIs that will drive the right behaviours and activity to deliver their organisation purpose, mission, strategy and goals.
This guidance helps co-operatives to challenge, test and determine the right KPIs. It is not designed to be a prescriptive list or standard set of KPIs as every co-op needs to set the most appropriate ones that demonstrate their difference as a co-op. Instead, a simple and flexible question-based framework is provided to help embed, revisit or start the process of identifying KPIs.
This guidance sets out:
An overall framework to support co-operatives to demonstrate their ‘co-operative difference’ through KPIs
A bank of questions, based on the seven principles of co-operation, that can be used by a range of co-operatives (by type, sector, size, stage of development) to identify and select potential KPIs
Best practice examples for each principle showing how other co-operatives use KPI’s (or similar measures)
Support and guidance for co-operatives with limited experience or expertise in identifying and setting KPIs

3 Key Performance Indicators • A Framework & Guidance for Co-operatives
Key Performance Indicator framework for co-operativesThe KPI framework builds on the principles and approach set out in Co-operatives UK’s Narrative Reporting: A Framework and Guidance for Co-operatives.
Co-operatives exist for the benefit of their members and the wider community and the Narrative Reporting Framework sets out a simple and effective way to think about how KPIs support delivering member value, member voice and co-operative values.
Like the Narrative Reporting Framework and Guidance, this KPI Guidance integrates best business practice with co-operative principles – rather than co-operative KPIs treated as an ‘add on’ and/or standalone from business KPIs (or not used at all).
KPIs have many different uses within businesses and their strength comes when there is clear alignment and understanding. When used effectively they are integral to driving behaviour, activity and prioritisation – not just purely as measures.
Key Elements
Your Co-operative Difference
Bringing your co-op’s purpose and mission to life
The three narrative reporting pillars
Demonstrating your co-op difference through:
Member Value
Member Voice
Co-operative Values
Our shared Co-operative Principles and Values
How your co-op applies the ICA principles common to all co-ops globally
See Appendices B and C

4 Key Performance Indicators • A Framework & Guidance for Co-operatives
This is not a prescriptive approach, but one based on generating examples and questions to support co-operatives in their journey to agree the right KPIs for their organisation. The most important element is the discussion and selection of KPIs that reflect the ‘co-operative difference’ and making these as integral to the organisation as turnover and surplus.
The context or answers to questions may differ across co-operatives (due to a range of factors from membership type to size or sector). There are no right or wrong answers. However, many of the questions can be used as a starting point for discussions around how core objectives and the mission is delivered, and what are the key indicators when applying a co-op lens.
There are growing examples of all types of businesses, including co-operatives, adopting a more integrated approach to their reporting of business and corporate social responsibility, rather than separate and standalone.
Many larger businesses, including co-operatives, have already taken the step of aligning their business reporting, KPIs, metrics and targets to the United Nations Sustainable Development Goals 2030 – demonstrating a link to a broader external set of goals. Best practice advocates taking an integrated approach to the ways organisations apply KPIs, targets and business aspirations.
Tips and Guidance
Integrating co-op KPIs into the core business planning, target setting, management and reporting processes will create a stronger alignment to delivering the co-operative’s purpose and reinforce the co-operative difference.
Create one set of KPIs with supporting metrics, data, reporting and processes.
Many organisations use balanced scorecards or dashboards to bring together all their KPIs to create a single view that can be understood and used by all those involved in a co-operative – employees, directors and members.
Effective KPIs should bring the co-operative business model and the individual co-operative’s way of doing business to life by demonstrating the co-operative difference.
Track trends and where possible identify and use benchmarks.

SMART: Specific, Measurable, Achievable, Realistic and Timely
5 Key Performance Indicators • A Framework & Guidance for Co-operatives
Basic structureThe guidance uses an open set of questions to help co-operatives:
Test how a co-op’s current KPIs support delivery of its core purpose and co-operative difference.
Help identify gaps, potential new co-op KPIs or strengthen existing ones.
Open up thinking and discussion on the right KPIs for the type and size of co-operative with links to ambition and business strategy.
As no two co-ops are identical it is likely that different co-ops will identify different KPIs to reflect their own unique purpose, mission and priorities. Some KPIs will be similar, for example, all co-ops should be member-focused. What should be evident is a direct link from KPIs back to what it means to be a co-operative.
KPIs can also be used to demonstrate to members how the co-op is doing; to identify trends; and in more progressive cases, future targets and aspirations. They can also be part of the ‘holding to account’ framework within a co-op business.
Co-ops are adopting a similar reporting approach by focusing on how they create value (inputs and outputs). Examples include The Cooperators (Canada) and Rabobank (Netherlands).
Effective KPIs
To drive and support the right behaviours KPIs must be:
Well understood at all levels within the organisation – particularly if this cascades through to performance management processes
Key levers to achieving the co-operative’s core purpose and business success by translating vision, mission and strategy into a set of measurable indicators of success
Limited in number (and underpinned by supporting metrics) to ensure a clear focus is maintained and SMART
Integrated into the way the business and its people operate
Used as a tool to look forward, as well as backwards and identify gaps, challenges and opportunities
Complement wider strategic and business discussions and dialogue, supporting prioritisation and areas where actions or initiatives may be needed to achieve KPI targets or aspirations

6 Key Performance Indicators • A Framework & Guidance for Co-operatives
Developing KPIsAt a high-level co-op KPIs need to be rooted in thinking about why the co-operative exists. This extends to using KPIs to support the delivery of strategy against purpose, vision and mission.
A number of high-level questions can be used as a simple way to test how well aligned current KPIs are to mission, purpose and co-operative identity/difference.
Why the co-op exists
What the co-op measures
How, when and where does the co-op use KPIs and measures?
Who has access to performance indicators?
Purpose
Mission
Type of co-op
Who it exists for (member type)
Types of member services and member benefits
Identify current KPIs and map to:
• Co-operative Principles (see Appendix B)
• Narrative Reporting Pillars (see Appendix C)
Are there any major gaps?
How do KPIs support delivery of mission and purpose?
Identify what the co-op does well; could do better; doesn’t currently do
Is reporting (internal and external):
• Backward looking
• Forward looking
• Setting priorities and actions
Are co-op KPIs used as part of regular business management processes?
Are co-op KPIs part of performance management and remuneration processes?
Members
Board
Management
Employees
Wider public, suppliers, customers
Using member or stakeholder surveys for co-op KPIs
Engaging members or stakeholders in a survey is a good way to test or answer questions. Ask questions most suited to your co-op and engage members or stakeholders in advance to help select the right questions in the first place – the ones most relevant to the business and to the people you are asking.
Exercise care in survey design to ensure fairness (note that if people know a question is reported as a KPI some may respond in a different way). It may be possible to repeat questions and compare responses year-on-year to develop benchmarking.

7 Key Performance Indicators • A Framework & Guidance for Co-operatives
Some KPIs may be used over the long term to provide a consistent benchmark for the organisation to monitor and review progress and set targets. It helps to have a comparison over time to understand whether the organisation’s potential is being reached.
Other KPIs may be time sensitive to address external risks or critical issues (for example, compliance or regulatory changes), to address new activities (such as a new area of business or investment) or where a step change in performance is required to address issues (for example, if active membership has fallen to an unsustainable level).
Creating MemberValue
Meeting MemberNeeds
Your Members
Member Voice
Co-operative Values & Principles
Strategy
Business Plans
Why your co-op exists: Purpose
& Mission
What your co-op does to deliver its
Purpose & Mission
How you measure and communicate
performance
8 Key Performance Indicators • A Framework & Guidance for Co-operatives
The FrameworkThe framework from page nine onwards is designed to guide and help co-operatives determine the co-op KPIs that best support delivery of their objectives. Linking back to the Co-operative Principles and Narrative Reporting Pillars provides a simple way to review and explore how some of the co-operative fundamentals are being applied and brought to life in the way the business operates and its key objectives.
Co-operative Values and Principles are the DNA shared by co-operatives across the world, irrespective of size, sector or type. The seven co-operative principles have been used to create the framework for co-op KPIs as they apply to all co-operatives.
They also provide a flexible way to consider how your co-operative operates; why it exists; and how, through business activity, the seven principles are put into practice.
The framework takes each principle and identifies a number of core questions to consider. It sets out example KPIs and how supporting metrics may also be used.
The KPIs shown may only be relevant to certain types of co-ops. Some will be more applicable to those with resources to monitor, measure and report on specific areas. Others may be more suited to newer or less complex co-ops. But all can be used to prompt debate and discussion on the KPIs that work for individual co-ops and align with their co-operative difference.
Too many KPIs can be counterproductive and it is important to look for the right balance. There may be many indicators that are worth tracking, but only at the Management Indicator (MI) or project level. There will be others that may not be right to track now, but may be worth tracking in the future. In France, for example, once every five years co-operatives now complete an independent ‘co-operative audit’ on how they are performing against all the co-operative values and principles.
The international co-operative principles are guidelines by which all co-operatives put their values into practice.
See Appendix B
9 Key Performance Indicators • A Framework & Guidance for Co-operatives
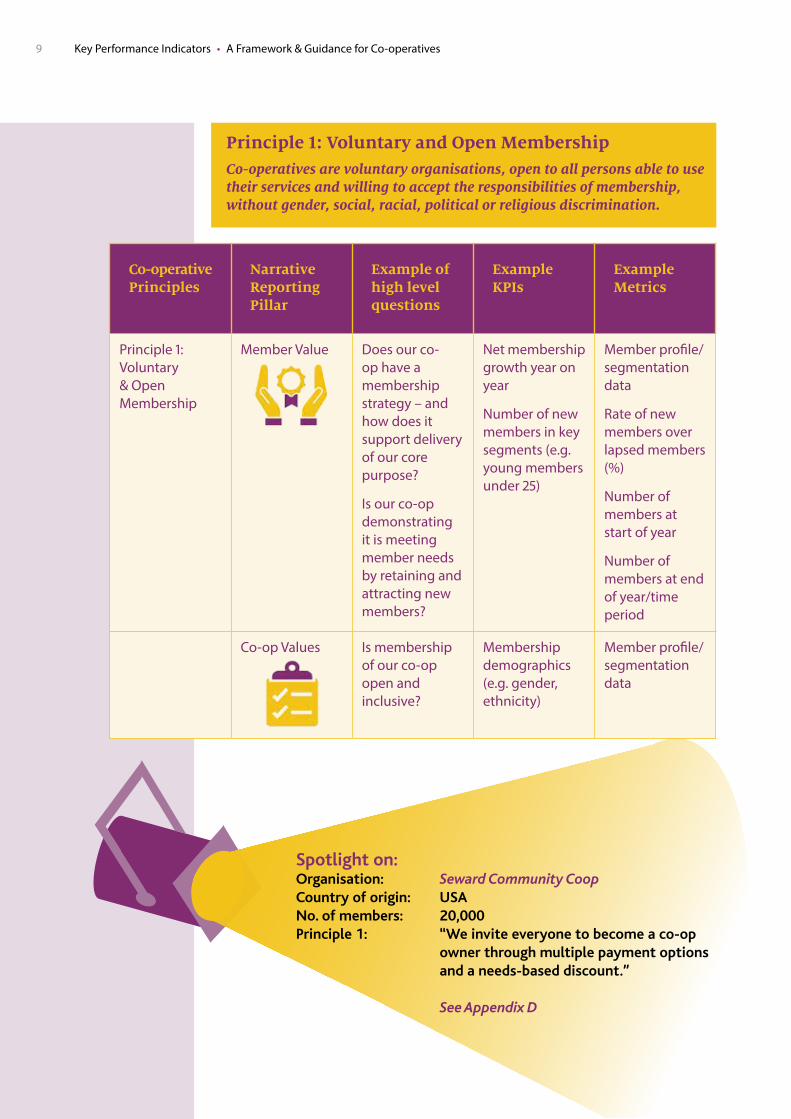
Principle 1: Voluntary and Open MembershipCo-operatives are voluntary organisations, open to all persons able to use their services and willing to accept the responsibilities of membership, without gender, social, racial, political or religious discrimination.
Co-operative Principles
Narrative Reporting Pillar
Example of high level questions
Example KPIs
Example Metrics
Principle 1: Voluntary & Open Membership
Member Value Does our co-op have a membership strategy – and how does it support delivery of our core purpose?
Is our co-op demonstrating it is meeting member needs by retaining and attracting new members?
Net membership growth year on year
Number of new members in key segments (e.g. young members under 25)
Member profile/segmentation data
Rate of new members over lapsed members (%)
Number of members at start of year
Number of members at end of year/time period
Co-op Values Is membership of our co-op open and inclusive?
Membership demographics (e.g. gender, ethnicity)
Member profile/segmentation data
Spotlight on:Organisation: Seward Community CoopCountry of origin: USANo. of members: 20,000Principle 1: “We invite everyone to become a co-op owner through multiple payment options and a needs-based discount.”
See Appendix D

10 Key Performance Indicators • A Framework & Guidance for Co-operatives
Principle 2: Democratic Member ControlCo-operatives are democratic organisations controlled by their members, who actively participate in setting their policies and making decisions. Those serving as elected representatives are accountable to the membership. In primary co-operatives members have equal voting rights (one member, one vote) and co-operatives at other levels are also organised in a democratic manner.
Co-operative Principles
Narrative Reporting Pillar
Example of high level questions
Example KPIs
Example Metrics
Principle 2: Democratic Member Control
Member Voice
Co-op Values
How do we want our members to engage in the co-op?
How, and why, are members involved in the democracy of our co-op?
Are values of equality reflected in how the democracy works?
% of members engaging with our co-op
% of members voting at General Meetings (online /in person /post)
Gender equality at senior levels (Board/staff)
AGM participation
Voter turnout %
% members engaging online/ social media
% members attending events
Member profile/ segmentation data
Gender pay ratios
Member Voice Do our members understand our governance and how they have can get involved?
% of contested elections (and or average no. of candidates per vacancy)
Election data
Member survey data
Demographics (gender, age, ethnicity, disability, etc)
11 Key Performance Indicators • A Framework & Guidance for Co-operatives
Co-operative Principles
Narrative Reporting Pillar
Example of high level questions
Example KPIs
Example Metrics
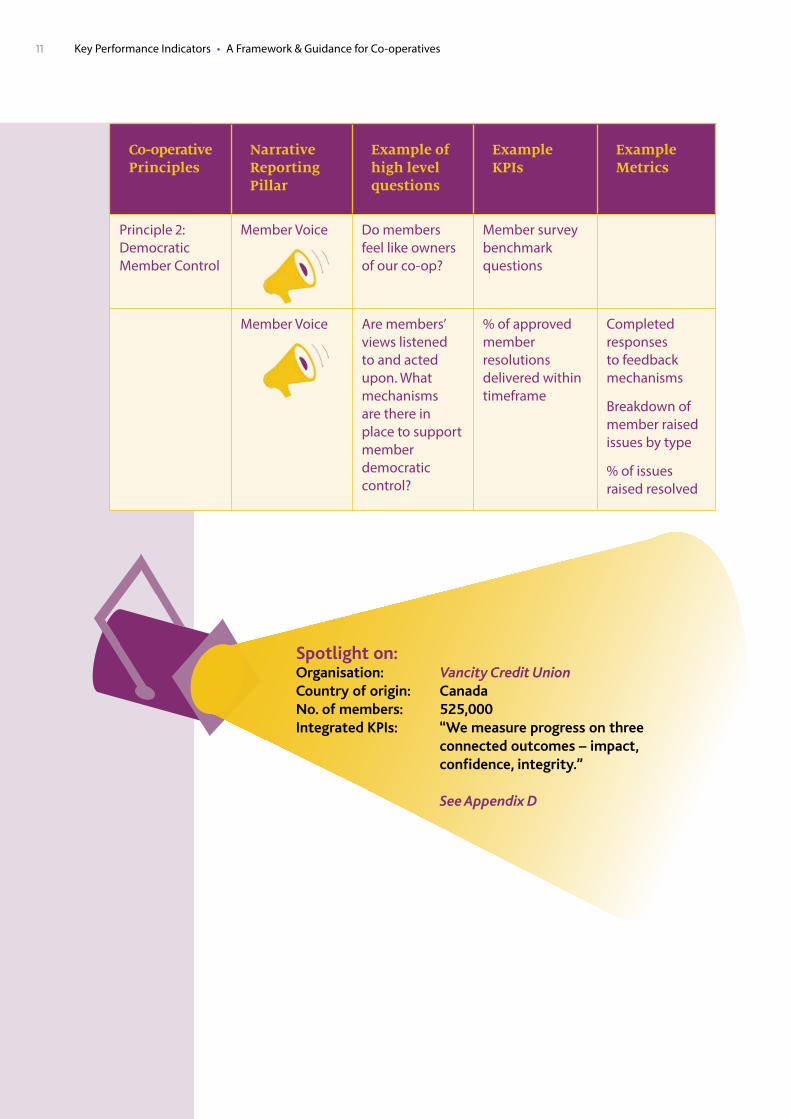
Principle 2: Democratic Member Control
Member Voice Do members feel like owners of our co-op?
Member survey benchmark questions
Member Voice Are members’ views listened to and acted upon. What mechanisms are there in place to support member democratic control?
% of approved member resolutions delivered within timeframe
Completed responses to feedback mechanisms
Breakdown of member raised issues by type
% of issues raised resolved
Spotlight on:Organisation: Vancity Credit UnionCountry of origin: CanadaNo. of members: 525,000Integrated KPIs: “We measure progress on three connected outcomes – impact, confidence,integrity.”
See Appendix D

12 Key Performance Indicators • A Framework & Guidance for Co-operatives
Principle 3: Member Economic ParticipationMembers contribute equitably to, and democratically control, the capital of their co-operative. At least part of that capital is usually the common property of the co-operative. Members usually receive limited compensation, if any, on capital subscribed as a condition of membership. Members allocate surpluses for any or all of the following purposes: developing their co-operative, possibly by setting up reserves (part of which at least would be indivisible); benefiting members in proportion to their transactions with the co-operative; and supporting other activities approved by the membership.
Co-operative Principles
Narrative Reporting Pillar
Example of high level questions
Example KPIs
Example Metrics
Principle 3: Member Economic Participation
Member Value What trade do we have with our members?
Amount of trade with members (sales/income) %
% (and no.) members trading within x timeframe
Breakdown by type of trade (business)/ location
Average member transaction value versus non-member
Member Value How do we give back benefit to members of our co-op?
% turnover returned to members in direct benefits
Members’ wages (%)
Total value of discount vouchers redeemed
Total value of dividend paid/net profit distribution to members (%)
Total value of member pricing
Total value of other member benefits
13 Key Performance Indicators • A Framework & Guidance for Co-operatives
Co-operative Principles
Narrative Reporting Pillar
Example of high level questions
Example KPIs
Example Metrics
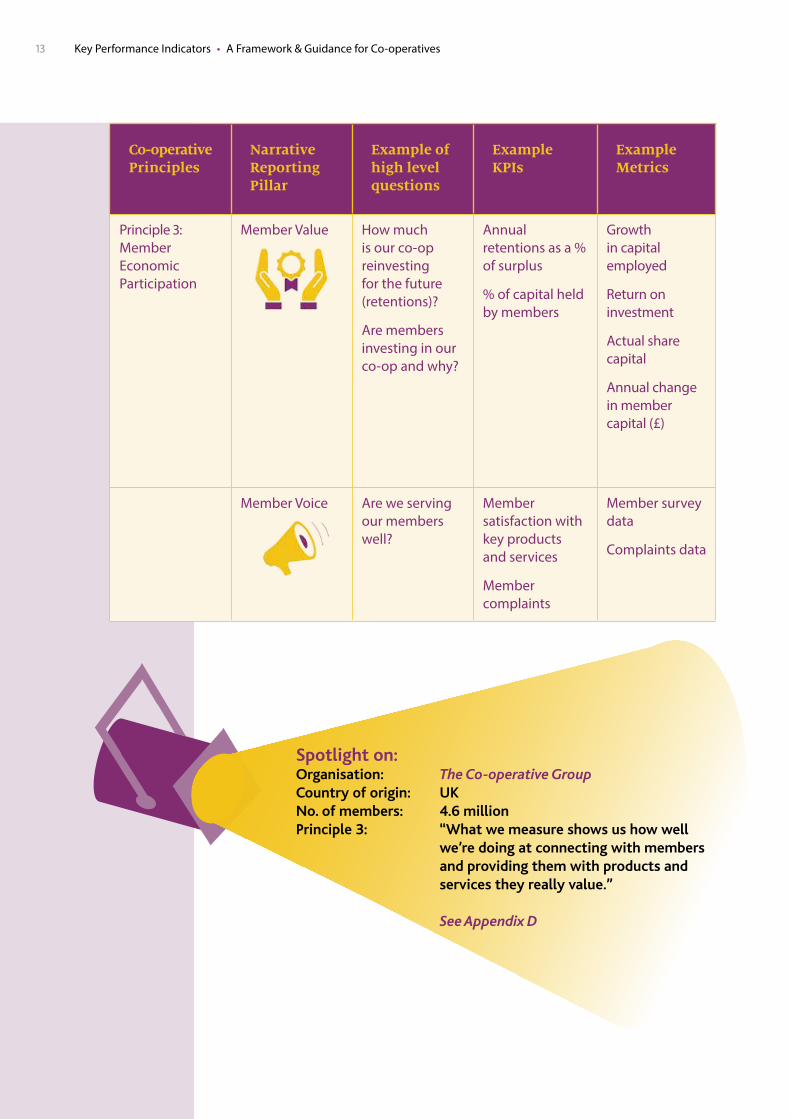
Principle 3: Member Economic Participation
Member Value How much is our co-op reinvesting for the future (retentions)?
Are members investing in our co-op and why?
Annual retentions as a % of surplus
% of capital held by members
Growth in capital employed
Return on investment
Actual share capital
Annual change in member capital (£)
Member Voice Are we serving our members well?
Member satisfaction with key products and services
Member complaints
Member survey data
Complaints data
Spotlight on:Organisation: The Co-operative GroupCountry of origin: UKNo. of members: 4.6 millionPrinciple 3: “What we measure shows us how well we’re doing at connecting with members and providing them with products and services they really value.”
See Appendix D

14 Key Performance Indicators • A Framework & Guidance for Co-operatives
Principle 4: Autonomy and IndependenceCo-operatives are autonomous, self-help organisations controlled by their members. If they enter into agreements with other organisations, including governments, or raise capital from external sources, they do so on terms that ensure democratic control by their members and maintain their co-operative autonomy.
Co-operative Principles
Narrative Reporting Pillar
Example of high level questions
Example KPIs
Example Metrics
Principle 4: Autonomy and Independence
Member Value How secure is our co-op?
Are we growing our co-op? How transparent is our reporting to members?
Gearing Ratio (%) (net debt/net assets)
Capital expenditure in comparison to net cashflow
Return on capital employed
Free cashflow/ Interest cover
Change in assets/surplus
Like-for-like value turnover change (%)
Staff retention
Member Value How are we planning (and investing)to meet future needs of members (products and services)
% investment in new products and services
Member research/surveys (what our members need and want)
Member voice How transparent is our reporting to members?
What say do members have regarding major transactions and policies?
How robust is our holding to account framework?
Click-through rates on digital member communications
Downloads of corporate communications such as the Annual Report
Number of member resolutions acted on within agreed timescales
Digital analytics
Compliance with quality frameworks, such as for co-operative governance
Member engagement at General Meetings
15 Key Performance Indicators • A Framework & Guidance for Co-operatives
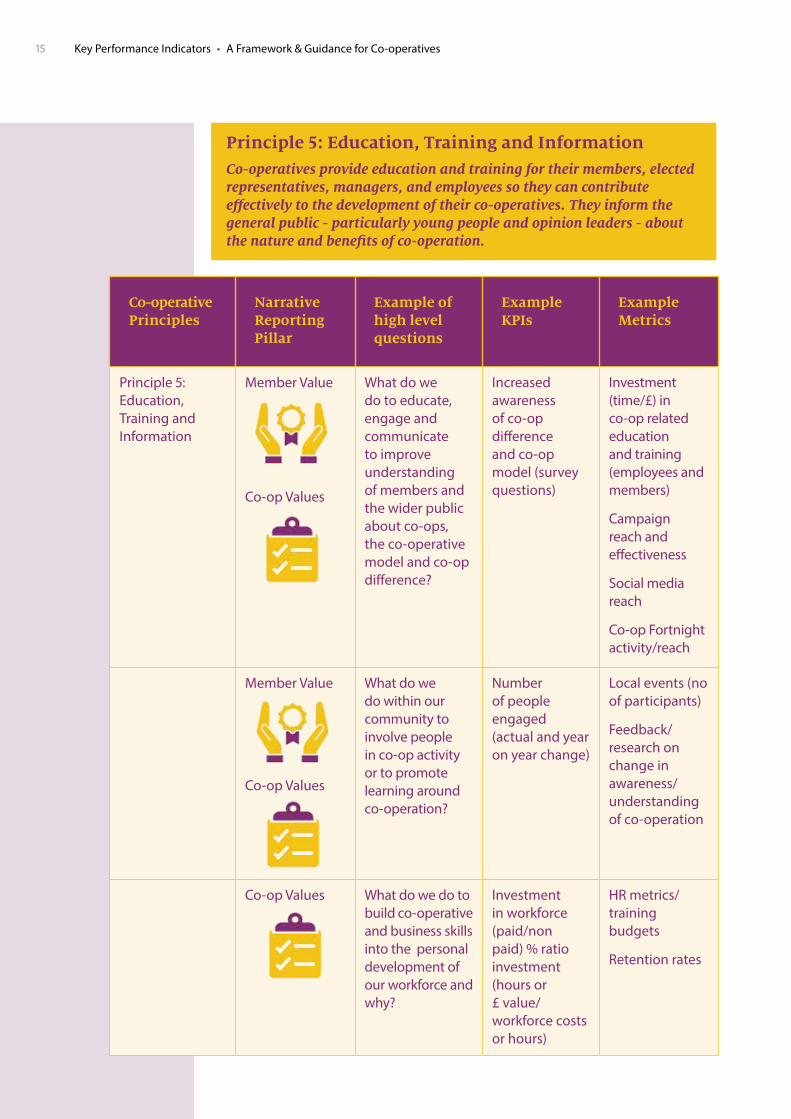
Principle 5: Education, Training and InformationCo-operatives provide education and training for their members, elected representatives, managers, and employees so they can contribute effectively to the development of their co-operatives. They inform the general public - particularly young people and opinion leaders - about the nature and benefits of co-operation.
Co-operative Principles
Narrative Reporting Pillar
Example of high level questions
Example KPIs
Example Metrics
Principle 5: Education, Training and Information
Member Value
Co-op Values
What do we do to educate, engage and communicate to improve understanding of members and the wider public about co-ops, the co-operative model and co-op difference?
Increased awareness of co-op difference and co-op model (survey questions)
Investment (time/£) in co-op related education and training (employees and members)
Campaign reach and effectiveness
Social media reach
Co-op Fortnight activity/reach
Member Value
Co-op Values
What do we do within our community to involve people in co-op activity or to promote learning around co-operation?
Number of people engaged (actual and year on year change)
Local events (no of participants)
Feedback/ research on change in awareness/understanding of co-operation
Co-op Values What do we do to build co-operative and business skills into the personal development of our workforce and why?
Investment in workforce (paid/non paid) % ratio investment (hours or £ value/workforce costs or hours)
HR metrics/ training budgets
Retention rates
16 Key Performance Indicators • A Framework & Guidance for Co-operatives
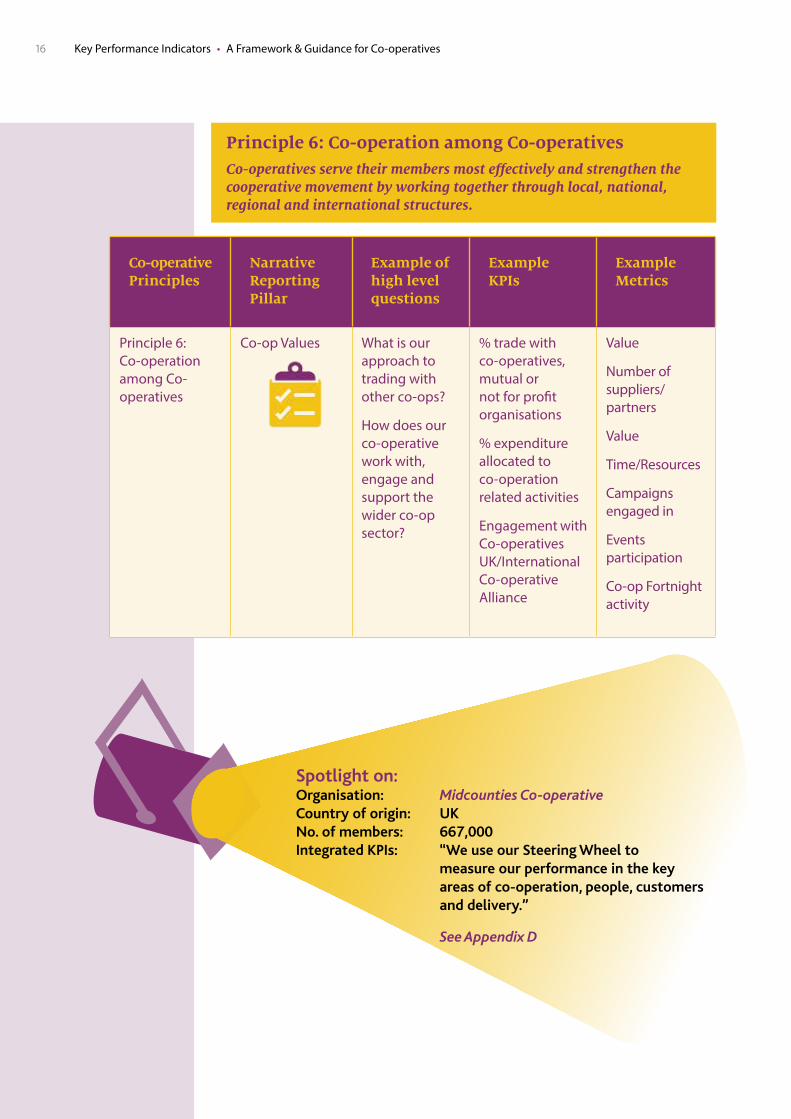
Principle 6: Co-operation among Co-operativesCo-operatives serve their members most effectively and strengthen the cooperative movement by working together through local, national, regional and international structures.
Co-operative Principles
Narrative Reporting Pillar
Example of high level questions
Example KPIs
Example Metrics
Principle 6: Co-operation among Co-operatives
Co-op Values What is our approach to trading with other co-ops?
How does our co-operative work with, engage and support the wider co-op sector?
% trade with co-operatives, mutual or not for profit organisations
% expenditure allocated to co-operation related activities
Engagement with Co-operatives UK/International Co-operative Alliance
Value
Number of suppliers/partners
Value
Time/Resources
Campaigns engaged in
Events participation
Co-op Fortnight activity
Spotlight on:Organisation: Midcounties Co-operativeCountry of origin: UKNo. of members: 667,000Integrated KPIs: “We use our Steering Wheel to measure our performance in the key areas of co-operation, people, customers and delivery.”
See Appendix D
17 Key Performance Indicators • A Framework & Guidance for Co-operatives
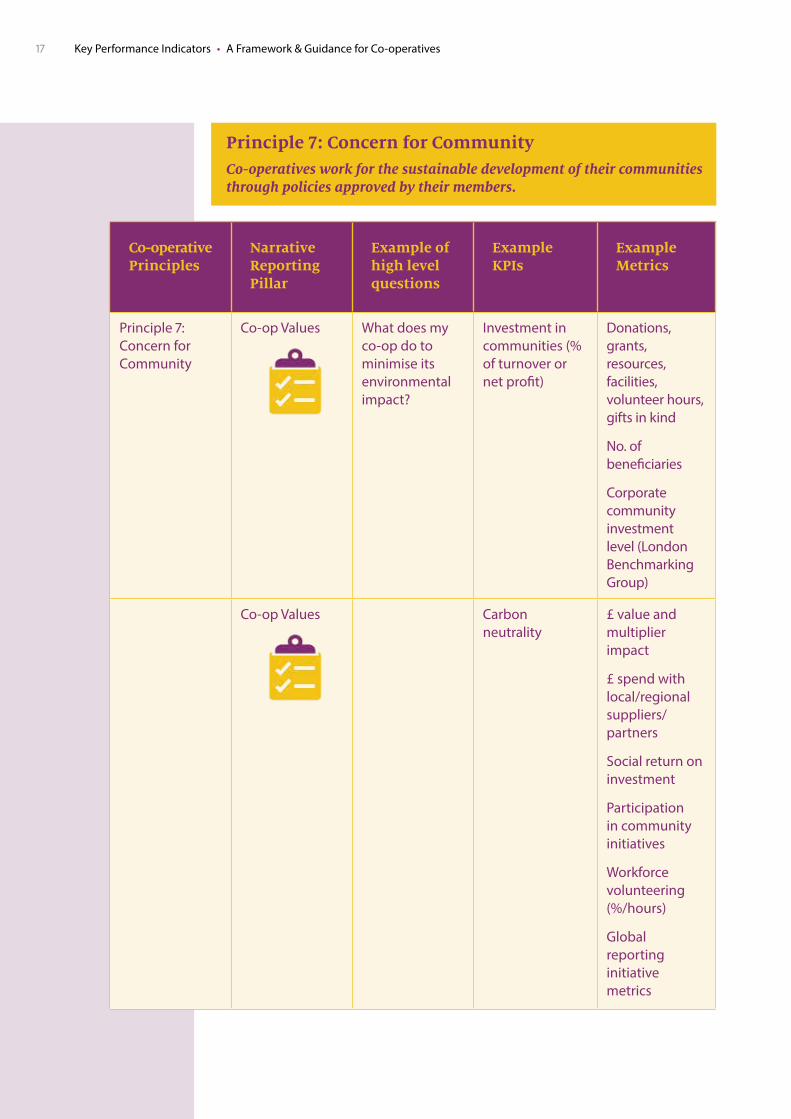
Principle 7: Concern for CommunityCo-operatives work for the sustainable development of their communities through policies approved by their members.
Co-operative Principles
Narrative Reporting Pillar
Example of high level questions
Example KPIs
Example Metrics
Principle 7: Concern for Community
Co-op Values What does my co-op do to minimise its environmental impact?
Investment in communities (% of turnover or net profit)
Donations, grants, resources, facilities, volunteer hours, gifts in kind
No. of beneficiaries
Corporate community investment level (London Benchmarking Group)
Co-op Values Carbon neutrality
£ value and multiplier impact
£ spend with local/regional suppliers/partners
Social return on investment
Participation in community initiatives
Workforce volunteering (%/hours)
Global reporting initiative metrics
18 Key Performance Indicators • A Framework & Guidance for Co-operatives
Co-operative Principles
Narrative Reporting Pillar
Example of high level questions
Example KPIs
Example Metrics
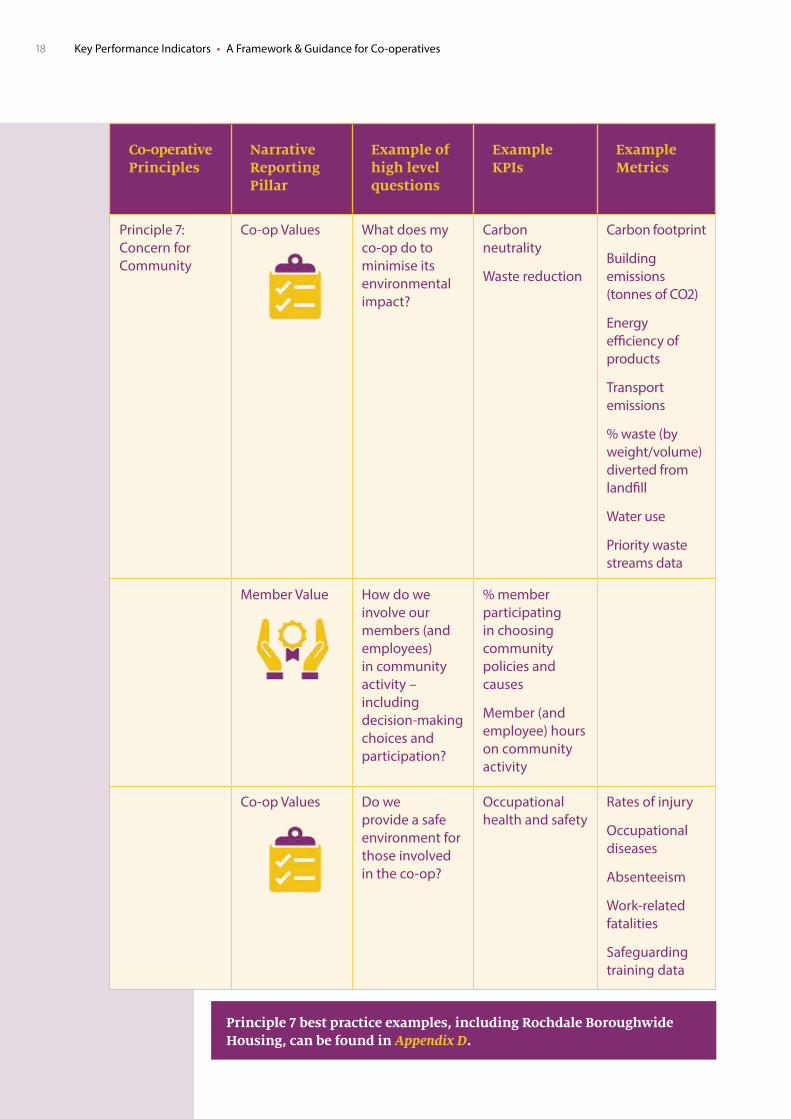
Principle 7: Concern for Community
Co-op Values What does my co-op do to minimise its environmental impact?
Carbon neutrality
Waste reduction
Carbon footprint
Building emissions (tonnes of CO2)
Energy efficiency of products
Transport emissions
% waste (by weight/volume) diverted from landfill
Water use
Priority waste streams data
Member Value How do we involve our members (and employees) in community activity – including decision-making choices and participation?
% member participating in choosing community policies and causes
Member (and employee) hours on community activity
Co-op Values Do we provide a safe environment for those involved in the co-op?
Occupational health and safety
Rates of injury
Occupational diseases
Absenteeism
Work-related fatalities
Safeguarding training data
Principle 7 best practice examples, including Rochdale Boroughwide Housing, can be found in Appendix D.

19 Key Performance Indicators • A Framework & Guidance for Co-operatives
Embedding KPIs in your co-operativeAs with any business or organisation tool – KPIs will only be of value if they are fully embedded in the way a co-operative operates and is run.
KPIs can act as a trigger to:
Prompt enquiry and questioning on why things are or are not happening
Build understanding of challenges or opportunities facing your co-operative
Provide clarity and focus for members, volunteers or employees around how key measures demonstrate delivery against purpose, mission and strategy
Spark internal and external communications
Inform risk assessment
Prioritise areas of action when KPIs are not being met
Influence behaviour, culture and action
It does take time and resource to develop and report on KPIs. To help bring out the value KPIs can contribute to your co-operative it is important to focus on how they are used and integrated into the way you do things.
KPIs can provide the common thread that links purpose, strategy and activity to the work of the board, employees, members and volunteers. KPIs add least value or can even hinder an organisation when they operate in isolation of the discussions, decisions and way the organisation works.
This guide is designed to open up ideas and thinking about how to develop new or existing KPI’s to bring your co-operative purpose and difference to life and embed this in a balanced set of indicators that help deliver against your strategy.
KPIs will need to evolve and change over time. What can be a constant is ‘the how’ your co-operative uses KPIs in its operations.
Just as each co-operative needs to determine relevant KPIs, it also needs to discuss and agree ‘the how’ to embed them into the organisation. On the following page you will find tips on how to embed KPIs into your organisation.

20 Key Performance Indicators • A Framework & Guidance for Co-operatives
Four ways to embed KPIs into your co-operative
Commit Develop – and use – a balanced set of KPIs to bring your co-operative purpose (why you exist), strategy (where you are going) and difference (what you do) to life.
Nurture a co-operative culture that embraces and integrates the use of KPIs to link organisation performance (past, current and future) and deliver your co-operative difference and purpose.
Cascade
Build KPIs into how you cascade information to employees, members and wider audiences – making the links between purpose, strategy and what progress looks like.
Build strong links between KPIs, operational plans, teams, performance management and strategy delivery.
Communicate
Use KPIs as part of internal, member and external communications to bring the work and progress of your co-operative to life.
Make KPIs visible in your co-operative through a range of channels and in different ways (including graphics, visuals and through story-telling).
Challenge
Monitor, track and review KPIs to test how your co-op is performing. Track trends and where possible use benchmarks to help assess progress.
Use KPIs to support discussions with the board, employees and members to support continuous improvement.
21 Key Performance Indicators • A Framework & Guidance for Co-operatives
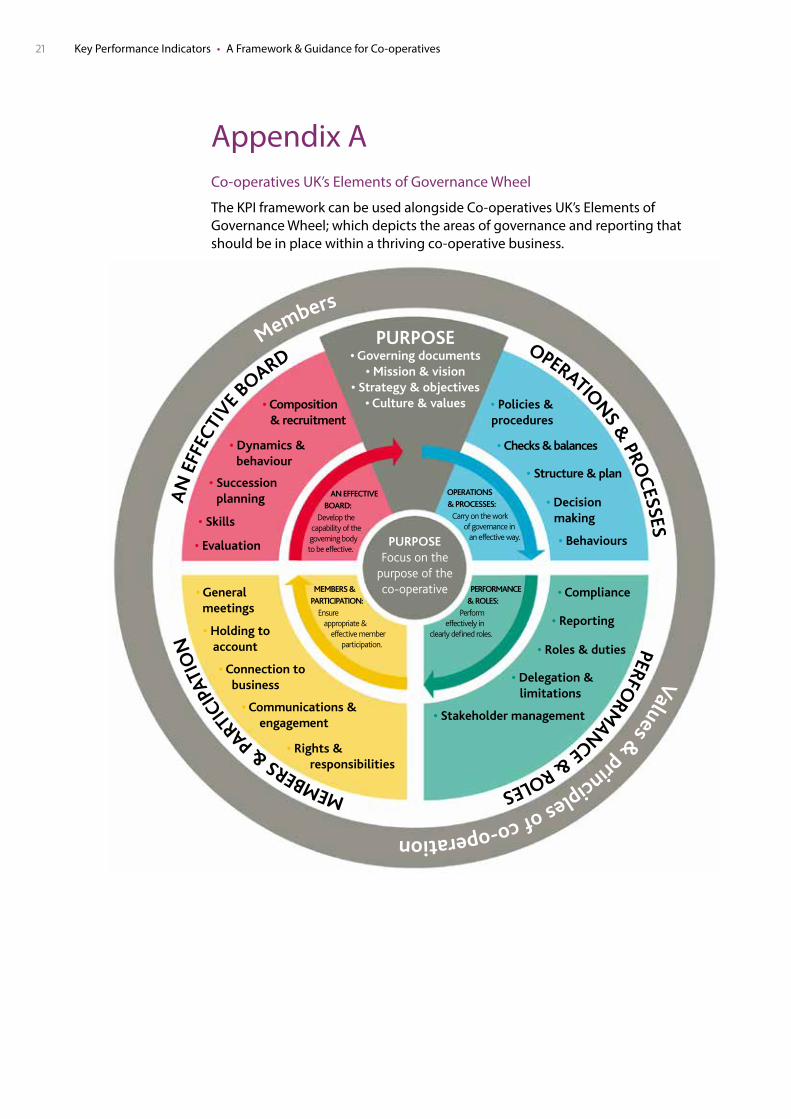
Appendix ACo-operatives UK’s Elements of Governance Wheel
The KPI framework can be used alongside Co-operatives UK’s Elements of Governance Wheel; which depicts the areas of governance and reporting that should be in place within a thriving co-operative business.
AN
EFF
ECTI
VE BOARD
OPERATIO
NS &
PROC
ESSES PERFORM
ANCE & ROLES MEMBERS &
PART
ICIP
ATIO
N
Members
Values & principles of co-operation
PURPOSE• Governing documents
• Mission & vision • Strategy & objectives
• Culture & values
• Skills
• Evaluation • Behaviours
• Composition & recruitment
• Dynamics & behaviour
• Succession planning
• General meetings
• Policies & procedures
• Structure & plan
• Decision making
• Holding to account
• Connection to business
• Communications & engagement
• Rights & responsibilities
• Compliance
• Reporting
• Roles & duties
• Delegation &limitations
• Stakeholder management
AN EFFECTIVE BOARD: Develop the capability of the governing body to be effective.
OPERATIONS & PROCESSES: Carry on the work of governance in an effective way.
MEMBERS & PARTICIPATION: Ensure appropriate & effective member participation.
PERFORMANCE & ROLES: Perform effectively in clearly defined roles.
PURPOSEFocus on the
purpose of the co-operative
• Checks & balances
The key elements of governance
www.thehive.coop

22 Key Performance Indicators • A Framework & Guidance for Co-operatives
Appendix BCo-operative Principles
The Co-operative Principles are guidelines by which co-operatives put their values into practice and form part of the globally recognised International Cooperative Alliance’s Statement on the Co-operative Identity.
Principle Description
Voluntary and open membership
Co‑operatives are voluntary organisations, open to all persons able to use their services and willing to accept responsibilities of membership, without gender, social, racial, political or religious discrimination.
Democratic member control
Co‑operatives are democratic organisations controlled by their members, who actively participate in setting their policies and making decisions. Men and women serving as elected representatives are accountable to the membership. In primary co‑operatives members have equal voting rights (one member, one vote), and co‑operatives at other levels are also organised in a democratic manner.
Member economic participation
Members contribute equitably to, and democratically control, the capital of their co‑operative. At least part of that capital is usually the common property of the co‑operative. Members usually receive limited compensation, if any, on capital subscribed as a condition of membership. Members allocate surpluses for any of the following purposes: developing their co‑operative, possibly by setting up reserves, part of which at least would be indivisible; benefiting members in proportion to their transactions with the co‑operative; and supporting other activities approved by the membership.
Autonomy and independence
Co‑operatives are autonomous, self‑help organisations controlled by their members. If they enter into agreements with other organisations, including governments, or raise capital from external sources, they do so on terms that ensure democratic control by their members and maintain their co‑operative autonomy.
Education, training and information
Co‑operatives provide education and training for their members, elected representatives, managers and employees so they can contribute effectively to the development of their co‑operatives. They inform the general public – particularly young people and opinion leaders – about the nature and benefits of co‑operation.
Co-operation among co-operatives
Co‑operatives serve their members most effectively and strengthen the co‑operative movement by working together through local, national, regional and international structures.
Concern for community
Co-operatives work for the sustainable development of their communities through policies approved by their members.

23 Key Performance Indicators • A Framework & Guidance for Co-operatives
The co-operative difference The 3 pillars represent broad areas of potential content for narrative reporting and as such can be used to frame and organise the reporting. It is through these areas of content (the pillars) that the ‘co-operative difference’ can be demonstrated and brought to life.
Guidance on how the pillars can be used to express and demonstrate the ‘co-operative difference’ and how they can be translated into compelling co-operative narrative reporting is given in the subsequent sections
Member value (pillar 1)
Member value can take many forms and reflects the essence of the relationship between a co-operative and its members.
Different members will value different things and this will vary between members and between co-operatives.
What is important is that each co-operative looks to define and express that value in relation to its members.
Appendix CCo-operatives UK Narrative Reporting pillars
The excerpts (below and overleaf ) are taken from the Narative Reporting framework and guidance, published by Co-operatives UK. Download the full document at: www.uk.coop/nr.
Tips and guidance
The 3 pillars sit under the umbrella of the ‘co-operative difference.’ It is through the pillars that the ‘co-operative difference’ can be demonstrated.
Pillars
Member value
Member voice
Co-operative value
Key questions
What value do members want from their co-operative?
How well is the co-operative doing at creating, monitoring and sustaining that value?

24 Key Performance Indicators • A Framework & Guidance for Co-operatives
Member voice (pillar 2)
Member voice is a vital component of any healthy co-operative. Demonstrating and articulating how this is being achieved is paramount to generating further member engagement.
Co-operative values (pillar 3)
These underpin the sector as a whole and each co-operative can look to demonstrate and articulate them throughout any narrative reporting that is undertaken.
Key questions
How engaged are the members with their co-operative?
How well is the co-operative doing at listening to, understanding and responding to what their members really want from their co-operative?
Key questions
How is the co-operative demonstrating the sectors’ core values?
25 Key Performance Indicators • A Framework & Guidance for Co-operatives
Appendix D
KPI Best Practice Examples
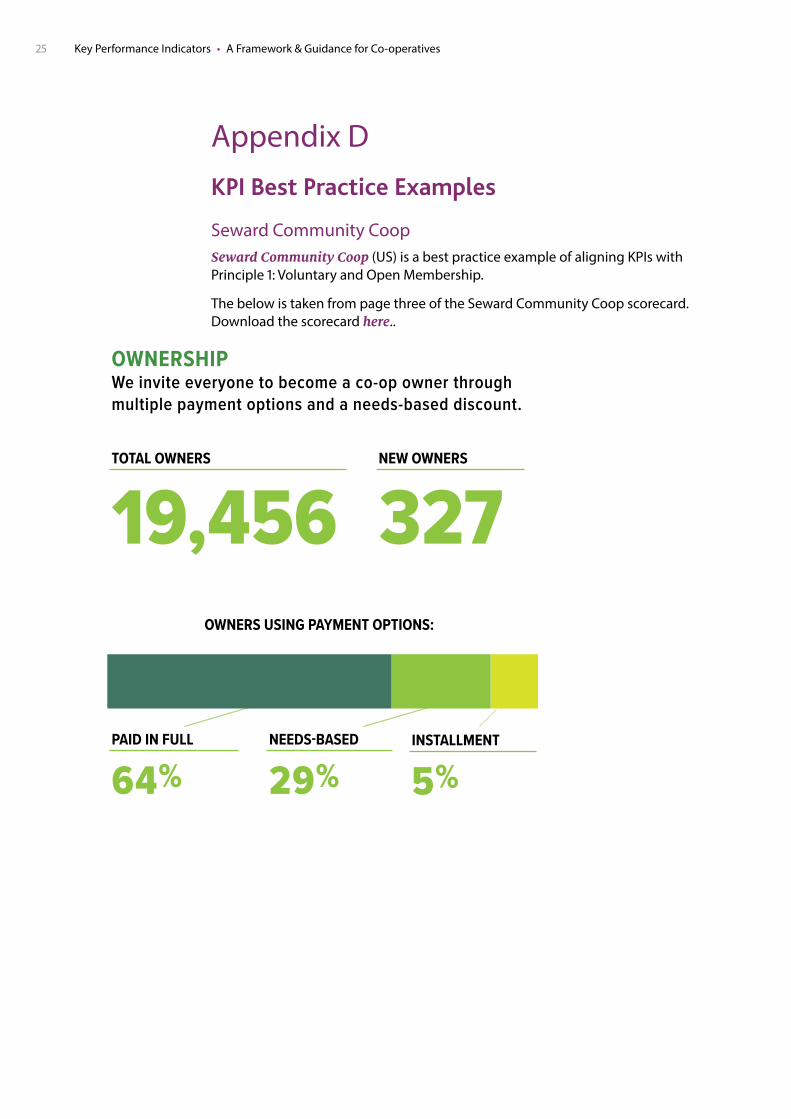
Seward Community CoopSeward Community Coop (US) is a best practice example of aligning KPIs with Principle 1: Voluntary and Open Membership.
The below is taken from page three of the Seward Community Coop scorecard. Download the scorecard here..
Total of 31 multilingual staff
STAFF RESIDING WITHIN WALKING OR BIKING DISTANCE (1.5 MILES) OF OUR LOCATIONS
66%STAFF IDENTIFYING AS PEOPLE OF COLOR
40%
MULTILINGUAL STAFF
10%
GIVING BACKWe prioritize and promote giving back to our community
STAFF DIVERSITYWe hire staff who reflect the neighborhoods in which we operate.
INSTALLMENT
5%NEEDS-BASED
29%PAID IN FULL
64%
19,456 327 TOTAL OWNERS NEW OWNERS
RESPECTFUL RELATIONSHIPSWe build respectful relationships with customers that cultivate trust within our cooperative.
OWNERSHIPWe invite everyone to become a co-op owner through multiple payment options and a needs-based discount.
PRODUCT CHANGES PER CUSTOMER REQUESTS
141
PUBLIC STORE TOURS BY STAFF
3CLASSES OFFERED TO THE PUBLIC
11
EMPLOYEE COMMUNITY SERVICE HOURS REDEEMED
84CUSTOMER SEED DONATIONS
$70,952 GRANTS, DONATIONS AND SPONSORSHIPS DISTRIBUTED
$1,840
Seward Co-op will sustain a healthy community that has inclusive, socially responsible practices.
OWNERS USING PAYMENT OPTIONS:
QUARTER 4 APRIL–JUNE 2018
26 Key Performance Indicators • A Framework & Guidance for Co-operatives
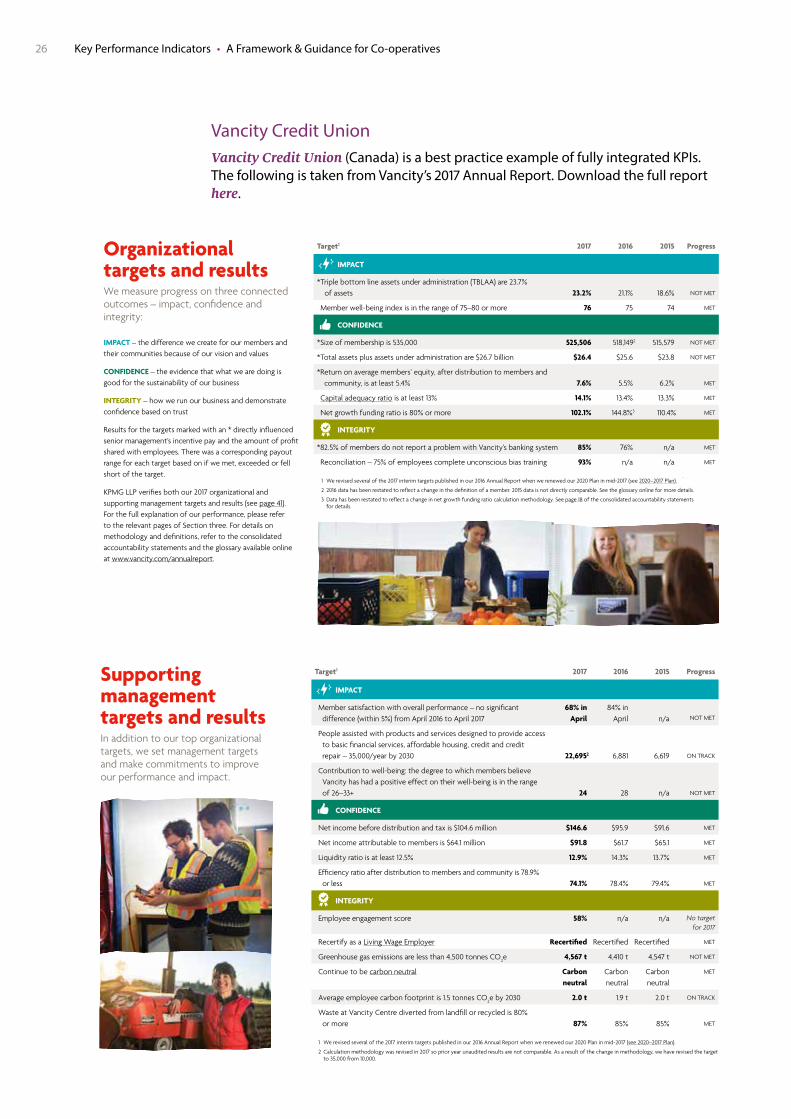
Vancity Credit UnionVancity Credit Union (Canada) is a best practice example of fully integrated KPIs. The following is taken from Vancity’s 2017 Annual Report. Download the full report here.
VANCITY 2017 ANNUAL REPORT 12
Organizational targets and resultsWe measure progress on three connected outcomes – impact, confidence and integrity:
IMPACT – the difference we create for our members and their communities because of our vision and values
CONFIDENCE – the evidence that what we are doing is good for the sustainability of our business
INTEGRITY – how we run our business and demonstrate confidence based on trust
Results for the targets marked with an * directly influenced senior management’s incentive pay and the amount of profit shared with employees. There was a corresponding payout range for each target based on if we met, exceeded or fell short of the target.
KPMG LLP verifies both our 2017 organizational and supporting management targets and results (see page 41). For the full explanation of our performance, please refer to the relevant pages of Section three. For details on methodology and definitions, refer to the consolidated accountability statements and the glossary available online at www.vancity.com/annualreport.
Target1 2017 2016 2015 Progress
IMPACT
* Triple bottom line assets under administration (TBLAA) are 23.7% of assets
23.2%
21.1%
18.6%
NOT MET
Member well-being index is in the range of 75–80 or more 76 75 74 MET
CONFIDENCE
*Size of membership is 535,000 525,506 518,1492 515,579 NOT MET
*Total assets plus assets under administration are $26.7 billion $26.4 $25.6 $23.8 NOT MET
* Return on average members’ equity, after distribution to members and community, is at least 5.4%
7.6%
5.5%
6.2%
MET
Capital adequacy ratio is at least 13% 14.1% 13.4% 13.3% MET
Net growth funding ratio is 80% or more 102.1% 144.8%3 110.4% MET
INTEGRITY
*82.5% of members do not report a problem with Vancity’s banking system 85% 76% n/a MET
Reconciliation – 75% of employees complete unconscious bias training 93% n/a n/a MET
1 We revised several of the 2017 interim targets published in our 2016 Annual Report when we renewed our 2020 Plan in mid-2017 (see 2020–2017 Plan).
2 2016 data has been restated to reflect a change in the definition of a member. 2015 data is not directly comparable. See the glossary online for more details.
3 Data has been restated to reflect a change in net growth funding ratio calculation methodology. See page 18 of the consolidated accountability statements for details.
Organizational targets and results Supporting management targets and results
About Vancity Key results Business review and plans Summarized statements and other information
VANCITY 2017 ANNUAL REPORT 13
Supporting management targets and resultsIn addition to our top organizational targets, we set management targets and make commitments to improve our performance and impact.
Target1 2017 2016 2015 Progress
IMPACT
Member satisfaction with overall performance – no significant difference (within 5%) from April 2016 to April 2017
68% in April
84% in April
n/a
NOT MET
People assisted with products and services designed to provide access to basic financial services, affordable housing, credit and credit repair – 35,000/year by 2030
22,6952
6,881
6,619
ON TRACK
Contribution to well-being: the degree to which members believe Vancity has had a positive effect on their well-being is in the range of 26–33+
24
28
n/a
NOT MET
CONFIDENCE
Net income before distribution and tax is $104.6 million $146.6 $95.9 $91.6 MET
Net income attributable to members is $64.1 million $91.8 $61.7 $65.1 MET
Liquidity ratio is at least 12.5% 12.9% 14.3% 13.7% MET
Efficiency ratio after distribution to members and community is 78.9% or less
74.1%
78.4%
79.4%
MET
INTEGRITY
Employee engagement score 58% n/a n/a No target for 2017
Recertify as a Living Wage Employer Recertified Recertified Recertified MET
Greenhouse gas emissions are less than 4,500 tonnes CO2e 4,567 t 4,410 t 4,547 t NOT MET
Continue to be carbon neutral Carbon neutral
Carbon neutral
Carbon neutral
MET
Average employee carbon footprint is 1.5 tonnes CO2e by 2030 2.0 t 1.9 t 2.0 t ON TRACK
Waste at Vancity Centre diverted from landfill or recycled is 80% or more
87%
85%
85%
MET
1 We revised several of the 2017 interim targets published in our 2016 Annual Report when we renewed our 2020 Plan in mid-2017 (see 2020–2017 Plan).
2 Calculation methodology was revised in 2017 so prior year unaudited results are not comparable. As a result of the change in methodology, we have revised the target to 35,000 from 10,000.
Organizational targets and results Supporting management targets and results
About Vancity Key results Business review and plans Summarized statements and other information

27 Key Performance Indicators • A Framework & Guidance for Co-operatives
Key performance indicators (KPIs)
32Co-op Annual Report 2017 Strategic report – Key performance indicators
Colleague engagement is measured by our annual Talkback survey.
Colleague engagement
75% 2016: 78%
Why is this measure important?Having colleagues who are engaged is really important in helping our Co-op achieve our goals and serve our members and customers. High levels of engagement show the pride and passion our colleagues have. More information on colleague engagement can be found on page 26.
Colleague KPI
Why are these measures important?Membership and community are at the heart of what we do as a co-op. What we measure shows us how well we’re doing at connecting with members and providing them with products and services they really value. The returns made to members and their communities through the 5% and 1% are one way in which our Co-op shares value.
Membership and Community KPIs
Wedefine‘activemembers’asmemberswho have traded with us in the last 12 months
The amount members earned for local communities through the 1% Membership offer on own brand products
Active members
4.6 million 2016: 4 million
1% reward earned for communities
£13m 2016: £3m
5% reward earned by members
£61m 2016: £16m
Member sales in Food
33% 2016: 28%
The amount members earned for themselves through the 5% Membership offer on own brand products
The percentage of sales in our Food business that are made to members
Underlying profit before tax
£65m 2016: £52m
Underlyingoperatingprofit(seebelow)less underlying interest
Underlying operating profit
£138m 2016: £126m
Bank loans and borrowings less the cash we hold
Total revenue
£9.5bn 2016: £9.5bn
Net revenue as shown in the consolidated income statement (page 96)
Operating profit
£126m 2016: £148m
Totalprofit(orlossfortheyear)beforetaxation
Net debt
£775m 2016: £885m
Profit / (Loss) Before Tax
£72m 2016: (£132m)
Ameasureofunderlyingprofitbeforeone-off items and gains or losses on disposals of assets (see note 1 for more details on how it’s calculated)
Operatingprofitasshownintheconsolidated income statement (page 96). Includestheunderlyingoperatingprofitof our businesses as well as one-off items and gains or losses on disposals of assets
Financial KPIsWhy are these measures important?Aprofitablebusinessandfinancialstability is essential in helping our Co-op meet its plan for Stronger Co-op, Stronger Communities which our Chief Executive talks about on page 9. It’s important to get the right balance between the returns to members and reinvesting in our Co-op for future growth.
Moreinformationonourfinancialperformance can be found on page 22.
The Co-operative GroupThe Co-operative Group (UK) is used as a best practice example for Principle 3: Member Economic Participation. The following is taken from page 32 of The Co-op’s Annual Report 2017. Download the full report here.
28 Key Performance Indicators • A Framework & Guidance for Co-operatives
17
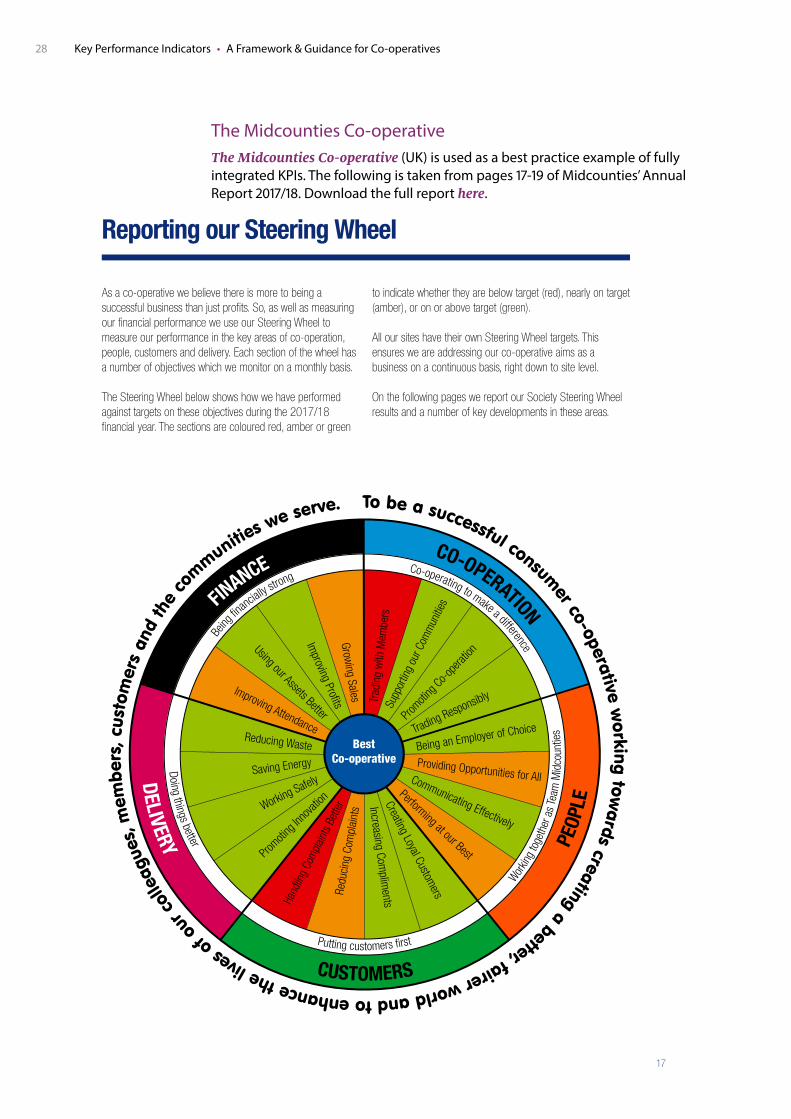
As a co-operative we believe there is more to being a successful business than just profits. So, as well as measuring our financial performance we use our Steering Wheel to measure our performance in the key areas of co-operation, people, customers and delivery. Each section of the wheel has a number of objectives which we monitor on a monthly basis.
The Steering Wheel below shows how we have performed against targets on these objectives during the 2017/18 financial year. The sections are coloured red, amber or green
to indicate whether they are below target (red), nearly on target (amber), or on or above target (green).
All our sites have their own Steering Wheel targets. This ensures we are addressing our co-operative aims as a business on a continuous basis, right down to site level.
On the following pages we report our Society Steering Wheel results and a number of key developments in these areas.
Being
financ
ially stro
ngCo-operating to make a difference
Workin
g to
geth
er a
s Te
am M
idco
untie
s
Putting customers first
Doing things betterFIN
ANCECO-OPERATION
PEOP
LE
CUSTOMERS
DELIVERY
Trad
ing
with
Mem
bers
Sup
porti
ng o
ur C
omm
unitie
s
Promoti
ng Co-o
perat
ion
Trading Responsibly
Promoti
ng In
novat
ionWorking Safely
Reducing Waste
Saving Energy
Creating Loyal Customers
Increasing Complim
ents
Redu
cing
Com
plai
nts
Hand
ling
Com
plaint
s Bet
ter
Growing Sales
Improving Profits
Using our Assets Better
Improving Attendance
Being an Employer of Choice
Providing Opportunities for AllCommunicating Effectively
Performing at our Best
BestCo-operative
Reporting our Steering Wheel
The Midcounties Co-operativeThe Midcounties Co-operative (UK) is used as a best practice example of fully integrated KPIs. The following is taken from pages 17-19 of Midcounties’ Annual Report 2017/18. Download the full report here.
29 Key Performance Indicators • A Framework & Guidance for Co-operatives
18
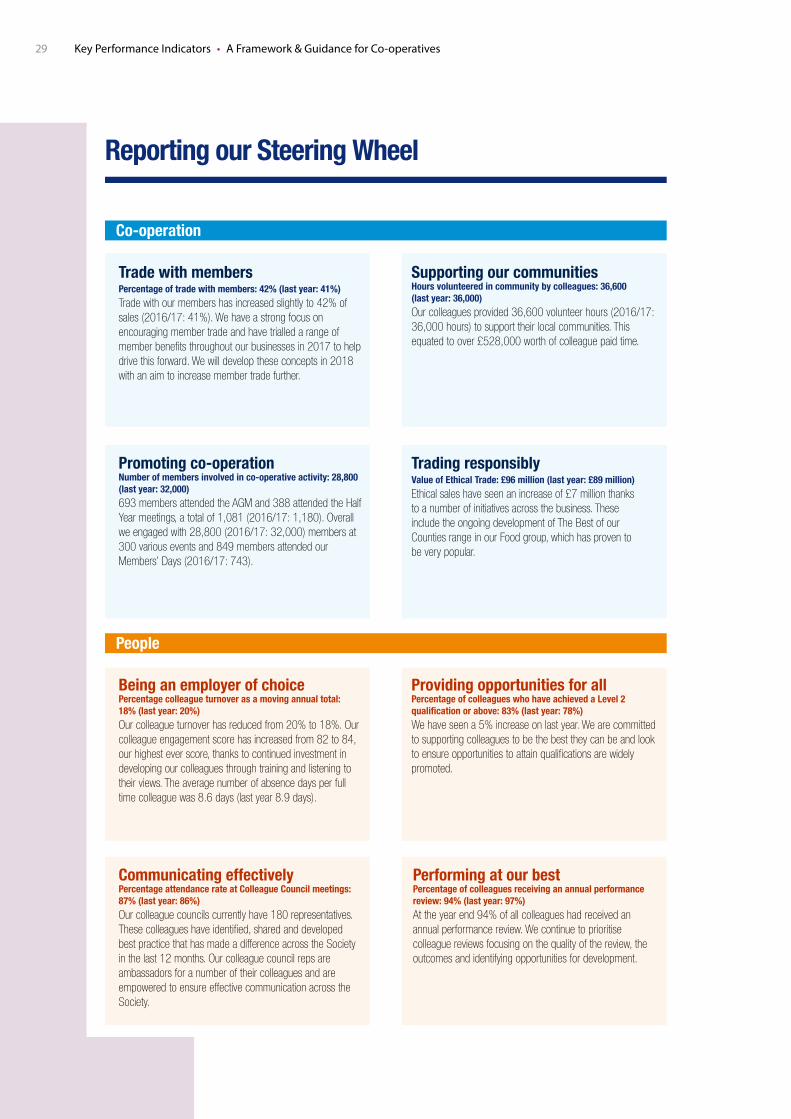
Reporting our Steering Wheel
Co-operation
People
Trade with membersPercentage of trade with members: 42% (last year: 41%)Trade with our members has increased slightly to 42% ofsales (2016/17: 41%). We have a strong focus on encouraging member trade and have trialled a range of member benefits throughout our businesses in 2017 to help drive this forward. We will develop these concepts in 2018 with an aim to increase member trade further.
Being an employer of choicePercentage colleague turnover as a moving annual total: 18% (last year: 20%)Our colleague turnover has reduced from 20% to 18%. Our colleague engagement score has increased from 82 to 84, our highest ever score, thanks to continued investment in developing our colleagues through training and listening to their views. The average number of absence days per full time colleague was 8.6 days (last year 8.9 days).
Promoting co-operationNumber of members involved in co-operative activity: 28,800 (last year: 32,000) 693 members attended the AGM and 388 attended the HalfYear meetings, a total of 1,081 (2016/17: 1,180). Overall we engaged with 28,800 (2016/17: 32,000) members at 300 various events and 849 members attended our Members’ Days (2016/17: 743).
Communicating effectivelyPercentage attendance rate at Colleague Council meetings: 87% (last year: 86%)Our colleague councils currently have 180 representatives. These colleagues have identified, shared and developed best practice that has made a difference across the Society in the last 12 months. Our colleague council reps are ambassadors for a number of their colleagues and are empowered to ensure effective communication across the Society.
Supporting our communitiesHours volunteered in community by colleagues: 36,600 (last year: 36,000)Our colleagues provided 36,600 volunteer hours (2016/17:36,000 hours) to support their local communities. Thisequated to over £528,000 worth of colleague paid time.
Providing opportunities for allPercentage of colleagues who have achieved a Level 2 qualification or above: 83% (last year: 78%) We have seen a 5% increase on last year. We are committed to supporting colleagues to be the best they can be and look to ensure opportunities to attain qualifications are widely promoted.
Trading responsiblyValue of Ethical Trade: £96 million (last year: £89 million) Ethical sales have seen an increase of £7 million thanks to a number of initiatives across the business. These include the ongoing development of The Best of our Counties range in our Food group, which has proven to be very popular.
Performing at our bestPercentage of colleagues receiving an annual performance review: 94% (last year: 97%)At the year end 94% of all colleagues had received anannual performance review. We continue to prioritise colleague reviews focusing on the quality of the review, the outcomes and identifying opportunities for development.

30 Key Performance Indicators • A Framework & Guidance for Co-operatives
19
Customers
Delivery
Creating loyal customersCustomer Loyalty Index: 81 (last year: 80)Our customer loyalty score increased by 1 point to 81.Many of our trading groups saw increases in their scores this year, especially Energy, and received some really positive feedback. All groups, both trading and non-trading, continue to monitor their service performance levels closely.
Reducing wastePercentage of waste recycled: 97% (last year: 91%)During the year we produced 3,559 tonnes of waste (2016/17: 3,587 tonnes), a 1% reduction, and recycled 3,481 tonnes of waste. We recover the majority of our Food Retail waste from our retail stores and use a recycling collection company to collect and monitor waste from our other sites. We send the food waste from our Food Retail and Childcare sites to an anaerobic digester to produce energy.
Increasing complimentsNumber of customers compliments: 13,467 (last year: 15,547)We encourage customers to provide us with feedback to help us improve their experience. We continue to use a broad range of channels to capture these comments including face-to-face interviews, customer panels, web surveys and, increasingly, social media.
Promoting innovation Number of ideas implemented having a positive impact on another Steering Wheel Measure: 37 against a target of 10 (last year: 8) The GIFTS (Growing Ideas for Tomorrow’s Society) programme was relaunched in 2017 to make it more relevant and easier to submit ideas. Each business group now has its own GIFTS Champions. This has been received positively and is reflected in the increased number of ideas implemented.
Reducing complaintsNumber of customer complaints: 16,244 (last year: 17,867)We have seen a significant decrease in the number of complaints as we place an increased focus on training our customer-facing colleagues and improving our systems. Our Energy business in particular has seen a marked reduction and has won a number of customer service awards during the year.
Saving energyEnergy reduction on prior year through electricity use (kw/h): 3.7% (last year: 4%)Our focus on raising colleague awareness around energy saving resulted in the Society reducing energy use by 3.7%, ahead of our 3% target. This saved over 1,600 tonnes of CO
2. Our total CO
2 emissions for the year were 1.5 tonnes per
£1 million gross sales (2016/17: 1.9 tonnes). This figure is calculated from our energy consumption (1,936 tonnes CO
2)
and colleague business miles (328 tonnes CO2). As the
electricity we use comes from 100% green sources, our electricity use is not included in the figure.
Handling complaints betterPercentage of customers who agreed we responded well to their complaint: 70% (last year: 74%)We have seen a decrease in the number of customers that said we responded well to their complaint, which has largely been as a result of complaints relating to Energy, in particular, around billing related issues.
Working safelyNumber of accidents/incidents reported as a moving annual trend: 936 (last year: 853) The number of accidents and incidents reported as a moving annual trend has increased during the year as reporting processes have continued to be altered to improve visibility across the Society, giving greater transparency and more accurate details. It is pleasing to note, however, that the total number of incidents reported under RIDDOR (Reporting of Injuries Disease and Dangerous Occurrences Regulations) reduced to 31 (2016/17: 41).

31 Key Performance Indicators • A Framework & Guidance for Co-operatives
1716
A new offer - Currently 42% of our tenants are aged over 55 and this proportion is expected to increase over the next 5-10 years. We will make sure that, by working with health and social care partners, we have a plan in place to support those who may find that they need more care and support to stay at home. We will also make sure that we provide an age-friendly environment which is attractive and welcoming, including for those who are currently active and well
An independent living service offer - We will undertake a review of our Independent Living and Community Response service to see if we are providing the right services in the right places to meet demographic challenges around increased frailty and dementia. We will examine whether it is right to offer a more differentiated service in Independent Living so that some schemes become more specialist around care, support and frailty. We will be mindful of the need to achieve a balance in the mix of people who live in our schemes to ensure that they continue to be attractive and welcoming homes for people whose support needs are not so high
Additional Extra Care provision - We will seek to build on the success of our scheme at Hare Hill by providing additional Extra Care facilities in the borough to meet this identified need and facilitate greater independence and less reliance on residential and/or nursing care provision
Housing options - A personalised and individual housing options assessment - Housing Options for Older People or HOOP
We will develop an approach which identifies barriers which may be stopping older people from living at home. We will also look at whether there are options for people to move into a home which is better suited to meet health and care needs. We will do this by working closely with all providers, commissioners and Integrated Neighbourhood Teams
Age friendly - We will play a full and leading role in moving toward age friendly neighbourhoods and ensure that we are the lead housing partner in the emerging district ageing strategy
For older people Thriving Together means:
Support to sustain tenancies - Based on our housing options assessment we will look at what support or services may need to be provided either directly by RBH or by a clear pathway to support from partners. We will participate in Greater Manchester initiatives to prevent homelessness and at a borough level will develop a housing options service which identifies at the outset those services which need to be in place to help someone to sustain a tenancy
New products and services - We will look to develop new products and services which widen people’s choices – this may be a new offer around shared tenancies for younger people, a market rented offer or a specific offer for older BME people
Reduced tenancy turnover and increased tenancy sustainment
Number of homelessness preventions
Increased external income received to sustain tenancies and provide tenancy support services
Performance of the Independent Living Service
Our commitments in the Greater Manchester Social Value pledge
Increased service satisfaction across age groups and communities moving to top quartile by 2025
For all our customers, Thriving Together means:
We will measure delivery through stretching targets on:
Rochdale Boroughwide HousingRochdale Boroughwide Housing (UK) is used as a best practice example of fully integrated KPIs. The following is taken from page 17 of Together - Our Corporate Strategy 2018-21. Download the strategy here.

Author: The Co-operative Performance Committee (CPC)www.uk.coop/cpc
Published by: Co-operatives UK Holyoake House Hanover Street Manchester M60 0AS
www.uk.coop
© Copyright Co-operatives UK, 2018
Co-operatives UK is the network for Britain’s thousands of co-operatives. Together we work to promote, develop and unite member-owned businesses across the economy. From high street retailers to community owned pubs, fan owned football clubs to farmer controlled businesses, co-operatives are everywhere and together are worth £36 billion to the British economy.


