67
Key Performance Indicators of transportation category management On-time delivery performance Sanna-Mari Juntunen Thesis May 2017 School of Technology Bachelor of engineering, Logistics

Key Performance Indicators of
transportation category management On-time delivery performance
Sanna-Mari Juntunen
Thesis May 2017 School of Technology Bachelor of engineering, Logistics
Description
Author(s)
Juntunen, Sanna-Mari Kyllikki Type of publication
Bachelor’s thesis Date
May 2017
Number of pages
93 Language of publication: English
Permission for web
publication: x
Title of publication
Key Performance Indicators of transportation category management On-time delivery performance
Degree programme
Logistics, Bachelor of engineering
Supervisor(s)
Kokkonen, Toni Pakarinen, Risto
Assigned by
Valmet Oy
Description
Thesis was carried out for Valmet Oy whose transportation team manages standard cargo transportation network and agreements in the company’s internal and external processes. To manage, analyse, develop and follow processes, Valmet transportation team must have indicators which are valid, reliable, relevant and actionable.
The company pointed out two main problems for the research, which was: Unsureness about the relevant content of Transportation team’s KPI dashboard and doubts about the real status of on-time delivery performance indicator in road category. The objective of the research was to establish the KPI dashboard and solve out how Valmet transportation team could improve their on-time delivery performance measuring process and by what tools and action the loss of the indicator could be prevented and overall reporting could be improved. Thesis was divided in two different parts in according to addressed research problems. First part was conducted mainly by qualitative research were literature was reviewed by thematic analysis and founded tools were deployed in creation phase. Second part was conducted by case study research strategy were the shipment data produced by suppliers was examined by qualitative and quantitative methods. Thesis made resulted interactive KPI dashboard as well as data upload portal that was integrated in principle’s transportation management system. The research included classified material that is only presented in appendixes.
Keywords (subjects)
Supplier relationship management, Performance measuring, Key performance indicators, Case study Miscellanous
This is public version of the thesis (appendixes removed)

Kuvailulehti
Tekijä(t)
Juntunen, Sanna-Mari Kyllikki Julkaisun laji
Opinnäytetyö, AMK Päivämäärä
Toukokuu 2017
Sivumäärä
93 Julkaisun kieli
Englanti
Verkkojulkaisulupa
myönnetty: x
Työn nimi
Key Performance Indicators of transportation category management On-time delivery performance
Tutkinto-ohjelma
Logistiikan koulutusohjelma, insinööri (AMK)
Työn ohjaaja(t)
Toni Kokkonen Risto Pakarinen
Toimeksiantaja(t)
Valmet Oy
Tiivistelmä
Opinnäytetyön toimeksiantaja oli Valmet Oy:n kuljetushallintaosasto, joka vastaa yrityksen kuljetussopimuksista ja kuljetusverkoston hallinnasta sisäisissä ja ulkoisissa standardirahtikuljetuksissa. Seuratakseen kuljetusverkostoa kuljetushallinnalla tulee olla asiaankuuluva mittaristo, joka mittaa oikeita asioita luotettavasti ja johon voidaan omalla toiminnalla vaikuttaa.
Toimeksiantaja esitti tutkimukselle kaksi tutkimusongelmaa: He halusivat tietää, mitä suorituskykymittaristoon tulisi sisällyttää, jotta siitä saataisiin mahdollisimman pätevä työkalu yrityksen käyttöön sekä mikä on tiekuljetuskategorian suorituskyvyn oikea taso. Tutkimuksen tavoitteena oli luoda suorituskykymittaristo sekä selvittää kuinka toimeksiantaja voisi parantaa kuljetuskategorioiden suorituskyvyn mittaamistapoja ja prosessia sekä ehkäistä suorituskyvyn tason laskua.
Osoitetut tutkimusongelmat jakoivat tutkimuksen kahteen erilliseen osaan: suorituskykymittaristo tutkimukseen sekä raportointi tutkimukseen. Näihin tukimuksiin lähdettiin hakemaan vastausta kvalitatiivisen ja kvantitatiivisen tutkimusotteen kautta, niin että opinnäytetyö rakennettiin aiheille yhteisestä teoriaosasta. Suorituskykymittaristo tutkimus tehtiin kvalitatiivisena kirjallisuuskatsauksena, josta löytyneet apuvälineet implementoitiin mittariston luomisprosessiin kun taas raportointi tutkimus tehtiin tapaustutkimuksena, jossa tutkittiin kuljetusliikkeiden raportoimaa dataa kvantitatiivisin ja kvalitatiivisin tutkimusottein.
Opinnäytetyön tuloksena luotiin uusi interaktiivinen suorituskykymittaristo ja prosessi vaihe, jossa kuljetusliikkeiden tuottama raportti validoitaan ennen tietokantaan latausta. Alkuperäinen tutkimus sisältää liikesalaisuuksia, joten osa tiedoista löytyy vain liitteistä.
Avainsanat (asiasanat)
Toimittajasuhteiden hallinta, Suorituskykymittaristo, Suorituskyvyn mittaaminen, Tapaustutkimus Muut tiedot
Tämä on julkinen versio opinnäytetyöstä, liitteet poistettu perustuen Julkisuuslain 621/1999 24§, kohta 17, yrityksen liike‐ tai ammattisalaisuus.

Content
1 INTRODUCTION ........................................................................................................... 1
1.1 Problem description and research questions ................................................... 2
2 RESEARCH PROCESS AND APPROACH ....................................................................... 3
2.1 Research outlines and perspectives .................................................................. 3
2.2 Research orientation........................................................................................... 4
3 COMPANY PRESENTATION ......................................................................................... 7
3.1 Valmet .................................................................................................................. 7
3.2 Valmet tools......................................................................................................... 8
4 DESCRIPTIONS OF PRESENT STATE ............................................................................ 9
4.1 Valmet strategy and transportation team key initiatives .............................. 10
4.2 Supplier management in Valmet transportation team .................................. 12
4.3 Road category .................................................................................................... 13
4.4 Currently existing indicators............................................................................. 13
4.5 On-time delivery performance indicator......................................................... 14
5 THEORETICAL FRAMEWORK .................................................................................... 17
5.1 Supplier relationship management (SRM) ...................................................... 18
5.2 Key performance indicators (KPIs) ................................................................... 25
6 RESEARCH PART ........................................................................................................ 36
6.1 KPI dashboard research .................................................................................... 37
6.2 Reporting research ............................................................................................ 40
7 RESULTS OF THE THESIS ........................................................................................... 42
7.1 KPI dashboard development ............................................................................ 42
7.2 On-time delivery performance indicator levels .............................................. 44
8 Conclusion ................................................................................................................. 45
8.1 Key performance indicators and created dashboard ..................................... 45
8.2 SRM and reporting research............................................................................. 46
8.3 IT-system as a part of process .......................................................................... 47
8.4 Further development proposals ...................................................................... 50
8.5 Reliability and repeatability.............................................................................. 53
9 Afterword and comments ........................................................................................ 58
REFERENCES ...................................................................................................................... 60

Figures
Figure 1. Valmet strategy briefly (Valmet’s Way forward 2017) .................................. 11
Figure 2. SRM interfaces of Valmet transportation team ............................................. 13
Figure 3. Value creation map (Marr 2009, 108) ............................................................. 35
Figure 4. Supplier management at Valmet transportation team.................................. 50
Figure 5. Supplier evaluation perspectives (Saaty 2003, 2)........................................... 52
Tables Table 1. Existing key performance indicators of Valmet transportation team ............ 13
Table 2. KPI and value creation map engagement......................................................... 39
Table 3. Key performance indicators in the dashboard................................................. 43

1
1 INTRODUCTION
Thesis was carried out for Valmet transportation team that manages standard cargo
transportation network and agreements in the Company’s internal and external
processes. To manage, analyse, develop and follow processes, Valmet transportation
team must have indicators which are valid, reliable, relevant and actionable.
Transportation team have existing measures which includes indicators that measure
transportation team’s processes but the proper dashboard has not been created.
One of the indicators differs from the others with its measurement target: On-time
delivery performance indicator measures not so much Valmet’s performance as
suppliers’ performance. Indicator’s level forms basis for analysis and follow -up of
suppliers’ performance level and with that, to realization of agreements and reward
system.
The company have noticed that on-time delivery performance measurements needs
development and currently the performance of road category is on low level.
Principle have also doubts about supplier’s way of reporting in the category and
wants to know the real performance status of the suppliers. Invalid performance
indicator belies functionality and quality of the company’s transportation network
and the suppliers, which caused the need of the research.
Third party involvement to the company’s operations increases always a
procurement risk. Transportation operations’ procurement risk has high dependency
on suppliers and the supplier can effect on organization’s product quality, brand
image, production efficiency and more. Well managed supplier relationship can avoid
supply chain risks and disruptions, protect company’s brand and reputation, avoid
costs and achieve savings, improve internal processes and tighten collaboration with
the supplier. One important character of the supplier is on-time delivery

2
performance, which reflects on the supplier’s service level and reliability. As a vast
company, Valmet must have reliable suppliers which can produce their services on
certain level of service and reliability. Reliable suppliers construct reliable
transportation network and ensures shipment movement through the supply chain.
1.1 Problem description and research questions
The company pointed out two main problems for the research, which was:
Unsureness about the relevant content of Transportation team’s KPI dashboard and
doubts about the real status of on-time delivery performance indicator in road
category. The objective of the research was to establish the KPI dashboard and solve
out how Valmet transportation team could improve their on-time delivery
performance measuring process and by what tools and action the loss of the
indicator could be prevented and overall reporting could be improved. To full fill the
research objective and find the solutions to addressed problems, the following
research questions were adjusted:
Question 1: What are the most important strategy elements and value creators which Valmet transportation team should measure as their Key performance indicators?
Question 2: What Valmet transportation team should include in their KPI dashboard? Question 3: What is the real status of on-time delivery performance indicator in the Road category? Question 4: What is the root cause for invalid on-time delivery performance indicators?

3
2 RESEARCH PROCESS AND APPROACH
2.1 Research outlines and perspectives
The research was divided into two parts on account of premise of the research
problems. Parts were identified as KPI dashboard research and reporting research.
The KPI dashboard research focus on Valmet transportation team’s strategy,
operations and used measurements. Overall performance measuring and
measurement procedures in the company, and its other departments, were outlined
from the research. In this case, the KPIs are the indicators which measure the
performance of the Valmet transportation team, thus relevant research perspective
was chosen to be the team’s perspective. Valmet transportation team consist of the
Head of indirect procurement and category managers whose performance reporting
is meaningful for all other functions and the company’s management.
Reporting research was the deeper investigation part of the thesis. Subject of the
research was on-time delivery performance indicator which measures suppliers’
performance in all three categories. However, Courier category as well as Air &
Ocean (A&O) category was excluded from the research because of agreement
negotiations in A&O and earlier established reason codes in Courier category.
Research target group determined by nominations in road category which consist of
group of contracted suppliers. Research was in the interface between Valmet and the
suppliers but in according to principle’s organisational structure the supplier
contacting was excluded from the research. Thus, research was conducted from
Valmet transportation team’s reporting perspective.

4
2.2 Research orientation
Methodological orientation of the research was both quantitative (quantity) and
qualitative (quality) research. Research methodological orientation were chosen to
compose total research which involves methods, that are complementary to each
other. Discrepancy of these methods is usually highlighted and debated even if it can
be used at the same time and the research objects can be explained in different ways
with both orientations. As a research strategy, the case study compiles these
research methods, hence was deployed in the research. Research strategy and
methods will be discussed and motivated in upcoming chapters.
2.2.1 Research material
Qualitative research material was mainly gathered from literature, company’s
documents and by participant observation. However, vendor data templates were
also used as a part of qualitative research. Theoretical framework of the thesis was
based on theories of supplier relationship management (SRM), performance
measuring and key performance indicators (KPIs). To run up the author’s knowledge
about research environment, the participant observation research method was used
when author was working for Valmet alongside the project.
Quantitative research material consists of vendor data templates, which are
produced monthly by the suppliers, and data from principle’s super data model
(SDM). Vendor data template contain information about shipments that have been
carried by certain transportation company in running twelve-month observation
period. SDM includes all relevant data from principle’s transportation network, funds
and other operations.

5
2.2.2 Case study research strategy
Case study research is usually seen rather as a research strategy than a method
where both qualitative and quantitative research orientation can be deployed. The
method focuses on one case, which can be an individual, an institution or a
community. The method can include also multiple cases like different transportation
companies. Case study research is not striving to represent generalizations; thus, it is
interested in individual cases and focuses on descriptive explanation rather than
interpretation. Case study strategy is beneficial for gathering background
information, illuminating integral processes and interactions. (Gillham 2010, Virtuaali
Ammattikorkeakoulu, 2007)
The characteristics of case study served the performance indicator research, where
fundamental set of the research consist of transportation companies. Fundamental
set of the research was decided by the means of principle’s nominations in the road
category. Selected suppliers are not dependent to each other, so the generalizations
cannot be made and detailed root causes (explanations) for performance loss are
desired outcomes. Therefore, the strategy was applied for the research. In addition,
overall information gathering as well as measuring and reporting process knowledge,
were the essence for the author, when earlier experience from the functionalities
and processes of Valmet transportation team was tangential.
2.2.3 Qualitative research methods
Qualitative methods are often seen as soft methods because of the essentially
descriptive and inferential character. All statistical results, including scientific
research, must be interpreted and described. Focus of the qualitative research
methods are primarily on the evidence that enables researcher to understand the
meaning of what is going on. That makes qualitative research methods as primary in
case study research strategy because of the essence of understanding the context
and research evidence (Gillham 2010, 9-10).

6
Qualitative research method was used in both research parts, when theory basis was
created, vendor data templates were examined and basic information about the
environment, processes and Valmet transportation team were studied. Theoretical
basis was conducted as thematic analysis, where literature and theories that support
the research problems was exploited and reviewed. The same analysis method was
deployed in the first part of the performance indicator research as well.
The idea of thematic analysis is to find out what have been told and what have been
discussed in the context. In the analysis method, the qualitative research material
will be firstly cut into pieces and regrouped into themes, that forms from central
matters that recur in the material in one way or another. Thematic analysis is the
most commonly deployed research method in structured literature reviews and
theory basis creation. (Saaranen-Kauppinen & Puusniekka 2006a)
Participant observation is an activity where researcher try to obtain general overall
view from the research object. Researcher’s role can be active or passive but the
presence and participation is always visible at some level, because the researcher’s
appearance is anyhow on the record. (Saaranen-Kauppinen & Puusniekka 2006b)
Participant observation is a research method which improves researcher’s ability to
understand research object and the research problem in the natural environment.
Participant observation research was conducted from September 2016 to December
2016 while working for Valmet transportation team. Actual notes were not written;
only present state description were made and the information was confirmed by
short unstructured discussions with VTG business responsible. Diary of observations
was made during the working for Valmet and is presented in the Appendix 1.
2.2.4 Quantitative research methods
Quantitative methods involve counting and measuring and it is a subject of statistics.
Statistics are two of kinds: Descriptive and inferential. Descriptive data describe the

7
data as a summary, like averages, and inferential data enables inferences and
significant findings from quantitative data (Gillham 2010, 9-10).
Quantitative research method was used in performance indicators research, where
status of on-time delivery performance indicator and Valmet transportation team’s
overall statistics were searched in detailed level. Fundamental set of the research
consist of one dependent variable, overall on-time delivery performance of road
category, where suppliers’ performance effect as independent variables. The
statistics related to these variables are examined by descriptive and inferential
content analysis when root causes for performance loss are explored.
3 COMPANY PRESENTATION
3.1 Valmet
Valmet is a global, publicly listed, company that develops and supplies technologies,
automation and services for pulp, paper and energy industries. Valmet’s net sales in
2016 was 2.9 billion euros and company have approximately 12 000 professionals in
30 countries. Company aims to be the best in customer service and is committed to
take their customer success forward with their services and innovations. (Annual
review 2017)
Valmet have four different business lines such as Automation, Pulp and energy,
Paper and Services. Operational area of Valmet is shared to North America, South
America, EMEA, China and Asia Pacific. The most of the business volume is on EMEA
market area, which includes Europe, Middle East and Africa. Significance of EMEA
business area is partly due to history, many of the company’s operations have been

8
established there. Nordics is the area where the most of the standard cargo
shipment volume is. (Flow 2017)
Transportation team of Valmet provides their services globally and its responsibilities
are standard cargo transportation, packing and harbour agreements, transportation
operation development, measuring and reporting. Transportation team has
categorized transportation modes into three groups, which are Courier, Road and Air
& Ocean. Transportation team analyses, develops and tests Valmet Transportation
Gateway (VTG) system which is Valmet’s own Transportation Management System
used for transportation bookings, contract and pricelist management and reporting
in Valmet logistics, suppliers and nominated transportation companies.
3.2 Valmet tools
Super Data Model (SDM) is a reporting tool which gathers all important information
and data into one database. SDM presents results of Valmet transportation measures
and calculations from various data sources. Two data sources of SDM were relevant
for the research: Valmet Transportation Gateway (VTG) and vendor data.
VTG is company’s transportation management system (TMS) which is used in Valmet
logistics, suppliers and nominated transportation companies. VTG is a tool for
executing daily bookings to transportation companies, shipment tracking, pricing and
scheduling. VTG is also an important tool enabling Valmet to measure, analyse and
follow-up transportation network and the realization of transportation contracts. At
the moment of the examination, the majority of European transportations are
handled through VTG and the aim is to globally expand the usage of the system so
the more benefits and data could be gathered for analysing and follow-up the
transportation network.

9
Vendor data is Valmet’s excel based data workbook which is used to gather
shipment data from nominated transportation companies. The workbook is formed
from vendor data template, example sheet and instructions sheet. Vendor data
template includes important information from every shipment which is carried by
certain carrier. Information such as, package information, consignee and consignor
information, despatching and delivery information is compiled in the template. It
includes also information which can be used to connect vendor data shipments to
VTG shipments and invoicing system. In addition, the template includes information
about on-time deliveries and reason coding for delays.
Viewpoint is company’s data preview tool which presents data from SDM in visual
form as readable figures and clear complexes. Statistics from transportation network,
funds flow and reporting are available in Viewpoint environment. Viewpoint is a
platform for transportation team’s KPIs where the indicators are obtainable for all
interest groups.
4 DESCRIPTIONS OF PRESENT STATE
Information that proved to be relevant for forthcoming chapters and the research
part will be discussed in this chapter. Descriptions of present state was done to chart
the initial situation when the research was started, so the comparison between the
starting point and the end as well as conclusion with reasonable result analysis could
be done. Understanding of the problem context, the environment and processes
where the problem occurs was essential for the author, so the solutions for research
problem and adjusted research questions could be find.
Current descriptions were made by reviewing written documents and by participant
observation. Information was gathered from September 2016 to December 2016

10
alongside working for Valmet and short, unstructured discussions were deployed
when information was needed for burning questions. Present state descriptions were
made in according to observations and discussion with VTG business responsible.
Notes was not made, only descriptions were written and the facts were confirmed by
the person discussed with.
4.1 Valmet strategy and transportation team key
initiatives
The strategy forms a foundation of the company’s overall operations and actions
which are taken to full fill the mission and achieve the vision. Valmet’s objective is to
serve their customers in optimum way by offering sustainable process technologies,
services and automation from renewable resources. Valmet emphasize the
importance of excellence, competitiveness, innovation and sustainability in their
strategy. Daily basis decision making and behaviour is driven by four values:
Customers, Excellence, Renewal and People. Figure 1. Presents Valmet strategy that
is a long-term strategy which ties up all departments in the organization and guides
units to take actions towards common goals and vision.

11
Figure 1. Valmet strategy briefly (Valmet’s Way forward 2017)
The organizational strategy is put into practice to operational level by business units
and departments. Strategy of Valmet transportation team lean on Valmet’s overall
strategy and the team executes the common goals and organizational vision to
standard cargo transportations and transportation network level.
Valmet transportation team is part of Valmet Indirect Procurement and SC
Development department and operations are mostly focused on process excellence.
Valmet transportation team have yearly action plans which are presented in the end
of the year and key initiatives for the next year are presented. The initiatives are
highlighted in the figure (See appendix 2.) that represent the strategical elements of
Valmet transportation team. Initiatives remains mainly the same, only focus can vary
by the year. Permanence of key initiatives was confirmed in yearly iPRO Forward
meeting, where strategy of next year was presented. (Loikkanen 2016)

12
4.2 Supplier management in Valmet transportation
team
Transportation team have identified and nominate the most important suppliers in
all three categories. Contracts with the suppliers are managed by category manager
and perspectives such as reporting, demanded integration level and agreed
performance level is considered in contracting phase. Transportation team have
quarterly business reviews in action with the nominated transportation companies,
where annual plan of business performance is monitored and followed. In the end of
the year annual business reviews is taken place where the work of past year is
summarized and the plans and goals for next year are set. Category manager
together with the global category team participates to supplier management
procedures. Global category team consist of personnel from various business lines
and areas and gathers multiple outlooks from different perspectives per certain
transportation mode and the suppliers in the category.
Valmet have implementation process of SRM running in several departments which
are mostly related to procurement. Valmet transportation team has started the SRM
process and have already supplier management practices which are fundamental and
typical for SRM process. The process will continue and was presented in action plan
for 2017. (Loikkanen 2016)
Figure 2. illustrates sections of the company’s supply chain where Valmet
transportation team’s SRM process would be located. Category manager’s
responsibility is to take care of interface between the company and the logistics
provider whereupon their responsibility will be the SRM process performing in the
future.

13
Figure 2. SRM interfaces of Valmet transportation team
4.3 Road category
See appendix 3. for detailed road category description where status of delivery
performance is also presented.
4.4 Currently existing indicators
Valmet transportation have indicators which have been presented in 2016 action
plan and Viewpoint. These indicators are named as main KPIs and were categorized
as savings, process, lead-time, quality and sustainability indicators. Team have
measured indicators such as total savings, contracts compliance, delivery
performance and CO2 emissions in different periods. Table 1. Presents active
indicators and the indicators which were considered to be a part of the KPI
dashboard. The focus of the active indicators is savings in one way or another and
the team have drafted indicators that would measure spend, process and network.
Table 1. Existing key performance indicators of Valmet transportation team
KPI Category Status
Contractual savings Savings ACTIVE
Margin of transportation savings Savings ACTIVE
VTG savings: ACTIVE

14
Operational savings Process savings Lead-time
ACTIVE
Consolidation savings Process savings
ACTIVE
Load Plan savings Process savings
ACTIVE
TOTAL SAVINGS ACTIVE
Contract compliance Process savings
ACTIVE
On-time delivery performance Process quality
ACTIVE
CO2 Emissions Sustainability ACTIVE
Total spend Spend DRAFT
Top 10 lanes by spend Spend Network
DRAFT
Share of shipment types Spend Network
DRAFT
VTG shipments Process DRAFT
In addition to presented KPIs, the team have 19 other indicators that presents data
from SDM in tables, figures, histograms and line charts in Viewpoint or in
management level reports. Detailed list of existing indicators is presented in the
appendix 4.
4.5 On-time delivery performance indicator
Valmet transportation team have developed on-time delivery performance indicator
in order to measure delivery reliability of the suppliers in their standard cargo
shipment network. The indicator illustrates the service level of the whole network,
certain category or certain supplier and it is presented for Valmet personnel in all
business units. Valmet have deployed reward system that is based on suppliers’
service level and it helps to supervise the realization of the contracts.

15
On-time delivery performance indicator represents the supplier’s capability to deliver
shipments on time in according to promised delivery date and agreed lead-times. On-
time delivery performance of the transportation network and suppliers’ effects on
Valmet’s own service level in product supply, when the company have involved third
party service providers to their supply chain. Third party involvement makes
performance measuring crucial, so Valmet can supervise transportation network’s
capability to deliver shipments on agreed time for manufacturing process phases and
end customers.
Calculation method and source data
On-time delivery performance indicator uses vendor data and VTG data as source
databases. The indicator forms the status from difference between agreed delivery
date and actual delivery date from both databases with crosswise updating.
However, in this context it is important to emphasize that VTG is the data source
with higher priority and overruns vendor data information if conflicts between the
data appears. Crosswise updating means that, the system use delivery dates from
VTG and if dates are missing, then information is used from vendor data. Calculation
categorize the shipments as early, on-time or late shipments. Delayed shipments are
once more categorized per reason codes, so that reason for delay is taken into
account in on-time delivery performance indicator. Late shipments are categorized
as due to action of Valmet, vendor or force majeure by agreed reason codes.
VTG date information
In road category, estimated delivery date from VTG is based on booking day and a
pricelist that is defined by the supplier. The pricelist includes lead-time information
by shipment weight and booking day. VTG use the pricelist in delivery date
estimations and records the estimated delivery date into shipment data. When
shipment is delivered the system records barcode scan into the data and forms
actual delivery date from scanning action.

16
Vendor data date information
Vendor data date information is supplier’s conception about agreed and actual
delivery dates. Shipment information is gathered from supplier’s own databases and
is delivered for category managers in vendor data template. If shipments have
delayed, the supplier is obligated to inform reason code for the delay. Calculation
system recognize certain reason codes and process shipment data in according to
agreed codes.
4.5.1 Data gathering and performance measuring process
Performance measuring process starts from the need of performance measuring of
Valmet. Valmet needs to measure the performance of their transportation network
to supply standard cargo shipments on right time, to right place and in right
condition. The performance measuring customs and processes are agreed on
contracting phase that binds the suppliers to report their performance for the
company. Valmet have certain demand of service level for their transportation
network and to follow-up contract realization and establish the reward system, the
on-time delivery performance measure is applied. The suppliers are obligated to
produce vendor data on excel based template developed by Valmet.
Every supplier has person who is responsible of data production and data delivering
to manager of certain category. Currently the data is delivered to Valmet
transportation category managers via e-mail. Vendor data is produced monthly and
the observation period varies between the categories. For example, three months’
period in courier category is enough to cover multiple status updates for shipments.
In this time suppliers are capable to pick-up, deliver and invoice the shipment.
Category manager’s responsibility is to review and check the quality of produced
data before it is approved and forwarded to third party service provider, whose
responsibility is to gather, process and upload data as well as administrate the SDM.
When data is uploaded category manager can preview and analyse data from

17
Viewpoint or from SDM. By analysing the data, the category manager supervises the
contract and reward system realization in the category and organize the quarterly
business reviews (QBR) for the suppliers. QBR is a part of supplier relationship
management process in Valmet transportation team. Flowchart of vendor data
gathering and performance measuring process (see appendix 5.) is based on author’s
observations during working for Valmet transportation team. Generated flowchart
reveals that vendor data templates are transferred through many phases that include
data receiving and delivering actions by several parties.
5 THEORETICAL FRAMEWORK
The literature was approached in systematic way and the theory basis was conducted
as thematic analysis, where relevant topics were explored. The basis was compiled
from few main literature resources and the supportive publications were reviewed to
complete the found theories. With wider scale of preferences, the facts could be
presented and addressed in the research. To compile a wide, reliable and up-to-date
theoretical framework, the publications were chosen to be publicized within ten
years. Founded theories in prior publications were confirmed from later publications.
Theoretical framework of the thesis consist of supplier relationship management and
performance measuring part of the business approach, where importance of
measuring and performance monitoring will be discussed. Key performance
indicators are usually related to performance measuring so the supportive theory
basis for the research could be compiled from these theories.

18
5.1 Supplier relationship management (SRM)
Supplier relationship management is systematic and comprehensive approach of
collaboration in supply chain and managing the whole interface between supply and
buying organisations through the whole life of the contract.
In according to literature the SRM have same activities and primary goals than
alliance management which key practices endorse creating alliances and
collaboration between supply chain entities, such as buyers, suppliers and third-party
providers. The SRM context differentiates from conventional contracts management
because the focus of the practice is on the whole interface between the buyer and
the supplier. The aim of the SRM is to achieve the supplier’s maximum contribution
towards the buyer’s long-term strategic goals. As a term, SRM is usually connected to
procurement and strategic sourcing and generally, it is connected to suppliers who
provide parts or products for manufacturing company. (Emmett & Crocker 2009, 77;
Engel 2012; Hughes & Wadd 2012, 22; Brekalo, Albers & Delfmann, 2012) However,
the SRM is reasonable to include to every operational relationship within businesses
regardless of functions or traded products or services.
The purpose of SRM is to streamline and improve effectiveness of processes
between the company and its suppliers. When all interactions with the supplier are
coordinative planned, executed and managed, the working with the supplier is more
collaboratively and delivers significant value for both parties. Functional SRM drives
supplier behaviour, encompasses the relationship between two enterprises and
enables the company to leverage its size by coordinating across divisions, functions
and hierarchies. At its best, SRM can give more out of relationship with the supplier
and relationships can even develop to ecosystems which gives competitive
advantages for the company. Supplier relationship management encompasses all
interactions with suppliers and includes elements which are applicable to all

19
suppliers and elements which are applicable to only selected suppliers. (Hughes &
Wadd 2012, 24; Engel 2012; Schuh, Strohmer Easton, Hales, & Triplat 2014.)
5.1.1 Foundational elements
Foundational elements are applicable for all suppliers regardless of their importance
for the business. Performance management, risk management and supplier
segmentation are foundational elements of supplier relationship management.
(Schuh et al. 2014.)
Supplier Performance management is a business practice from supply chain
management that is used to monitor, analyse and manage supplier’s performance.
Successful performance management can reduce costs, lower supply chain risk
factors, identify supply chain execution issues and promote continuous
improvement. (Schuh et al. 2014) Supplier performance management ensures that
company gets services which are on agreed level and contracts will be realized so
that the performance meets the expectations against the market norms.
Risk management is a third foundational element of SRM. Well managed risk
management mitigates externalization risks and tightens collaboration with the
supplier when both companies have common goal to improve continuity and safety
of operations. In tight partnership, both parties have the willingness to share risk of
the supply chain and they have common understanding of occurred risks in
operations. (Schuh et al. 2014; Jack & Powers, 2015; 130. Hudnurkar, Rathod &
Jakhar 2016, 633-635) In transportation operations, the procurement risk has high
dependency on a supplier thus, functional risk management is important practice.
When transportation company operates between the links in supply chain, the
company can effect instantly on organization’s product quality, brand image,
production efficiency and more, thus risk management is remarkable practice for
transportation functions.

20
Supplier base segmentation defines extend of business with supplier and how
supplier is treated within the organisation. Treatment bases on supplier classification
and how important the supplier is for the business. It improves supplier follow-up
and evaluation and ability to respond to supplier-related risks which improves overall
risk management in supply chain. (Schuh et al. 2014; Hudnurkar et al. 2016, 625)
5.1.2 Strategic suppliers and strategic elements
Strategic suppliers are the most important partners which provide their services on
lanes which are remarkable for the business or have special tasks in transportation
network. Usually strategic supplier is misinterpreted to a large supplier, which does
not stack up. A strategic supplier can be the company which is not particularly large
organization. E.g. Transport Company which have small fleet, operates only in certain
country or route can be strategic supplier if rival firms do not exist for undefined
reason.
Strategic elements are applicable for selected suppliers, which can be called as
strategic suppliers. As a strategic element, coordinated communication with the
strategic supplier, is important when it tightens relationship, commitment and co-
operation between two companies. Coordinated communication includes personnel
involvement, like category manager’s role, and organisation involvement which gains
more trust for the relationship between parties. Coordinated communication and
trust improves the quality of relationship with the supplier. When coordinated
communication is done across all business units, functions and hierarchy levels, the
supplier relationship is more rigorous and the company can communicate as a single
voice. The organisation can avoid conflicts, achieve competitive advantages, have
better understanding of supplier’s placement and agreements when they are
communicating by single voice. (Schuh et al. 2014; Jack & Powers, 2015, 131)
Co-operation and commitment between strategic supplier and the company is on
higher level than with the other suppliers. When relationship is on higher level and

21
rigorous, it maximizes vendor value, enables innovations and improvements in
operations and supply chain. (Schuh et al. 2014; Hudnurkar et al. 2016, 630)
5.1.3 SRM in organisations
As Emmert and Crocker (2009) addressed in their book, from 2005 to 2010 global
procurement have performed poorly on contract management and internal
competency of contract managing have been a minor. Too many organisations
believe that after placing the order, the contract manages itself and the procurement
department can move on to the next negotiation or deal.
However, it is estimated that, in the near future more and more companies start to
develop advanced Supply Chain Management (SCM) strategies and especially
procurement and sourcing functions will value expertise and experience from
effective and unique SCM technologies like performance management and
relationship management. Not only for procurement department, this expertise will
be important in upcoming trend for every department or function who is responsible
for contacting or contracting with any supplier. Step towards better relationship
management is crucial when companies are becoming more global and outsourcing
will be wider part of the strategies. (Top 5 logistics and procurement trends,
Robinson 2016; Emmett & Crocker 2009, 89)
“Research into leaders in SRM” case study of Emmett and Crocker (2009, 87), reveals
that the leading organisations in SRM have same elements in their SRM processes.
Following elements are founded to be congruent in the organisations:
1. Supplier segmentation
2. Contract management
3. Supplier performance management
4. Integrations and collaboration
5. Correct organizational structure

22
6. The right people whose skills are developed and deployed
7. The right technology to capture and assimilate supplier specific
information and data
In according to Hughes and Wadd (2012, 24-26), the companies with the greatest
success in SRM have firstly focus on changing organisational culture and
transforming daily basis interactions within the organisation and with the suppliers.
The research resulted seven principles that underlie successful SRM initiatives:
1. To identify the greatest potential to create value and reduce risk
2. To respect and treat all suppliers with a high degree of professionalism and
respect
3. To Invest in understanding the suppliers better
4. To Invest in helping supplier to understand the buying company
5. To actively build and sustain trust with suppliers
6. To track benefits for supplier and invite the supplier to give feedback for the
company
7. To emphasize open communication and innovation
5.1.4 Benefits of SRM
In these days, supply chains are developing more integrated, and the operations
between supplier and buyer are increasingly elided. Therefore, it is more important
to manage contracts and suppliers properly. When segmentation and rationalization
of supply base reduces the number of suppliers, it makes the residual suppliers more
powerful. Positive supplier relationships which are properly managed, can produce
sustainable competitive advantages and add vendor value. (Emmett & Crocker 2009,
77-85; Hudnurkar, Rathod & Jakhar 2016)
The key components that drive SRM are trust and open communication, when both
parties rely and communicate to each other, supply chain profiling can be made

23
more effectively which can reduce operating costs and improve quality of services.
When trust and communication is unconstrained, SRM can improve supplier’s
performance and reveal supplier’s opportunities to make a profit with process
development and loss reduction. (Emmett & Crocker 2009, 77-85; Jack & Thomas,
2015, 131; Hudnurkar et al. 2016)
Every year, at least once, buying and selling organisations should meet and seek to
understand each other’s intentions, priorities, exploit common ground and deal with
any problems. Meeting should conclude in to action plan which should be set in
according to common goals. The nearest contacts should feel themselves as
relationship managers and they should aim to relationship improvement and
development. (Emmett & Crocker 2009, 77-85)
5.1.5 Effective supplier relationship management
Effective supplier relationship management can deliver value for the organisation in
long-term contracts through supplier management approach from sourcing stage.
Value will extend as organisation will focus on more collaboration and integrations
with the supplier. Maintained and rebuild supplier relationships enables possibilities
to achieve the real benefits and maximum long-term value from the supply chain
links and connections. SRM offers the catalyst to acquire services that will meet or
exceed organisation’s expectations and to give them competitive advantages.
Many organisations remain too “deal-focused” and are not good at all in managing
supplier relationships. Supplier relationship management process should be clear to
all those who have the contact with suppliers in order to develop it effective.
(Emmett & Crocker 2009, 89-91; Jack & Thomas 2015, 130)
Effective supplier relationship management provides integrated communication and
information driven management process and just like any process, which is taken
into organisation for serious actions and purposely, SRM should have an iterative

24
element. Such a review process, it enables regular feedback which enables
organisation to define changing business needs and supplier management objectives.
Effective supplier relationship management process helps suppliers to improve their
operations at all levels. When feedback is regular and analysing is done by their
customers, areas of improvement are traced. The deeper relationship and
collaboration level is, the higher level of feedback the suppliers expect. Regular
measurement, review and feedback can help them to drive out costs and
inefficiencies throughout their own supply chain and in the end that will benefit both
parties. (Emmett & Crocker 2009, 89-91.)
5.1.6 Performance monitoring
Performance monitoring is a trinity of purpose, expectations and strengths and it
should be done with a continual focus on future, not past. When indicators and
measurement process are established, the relevant parties must be adhered to the
process. If the implementation process requires significant changes and
arrangements, it is necessary to create a plan that defines measurement parties’
responsibilities and roles in time line. (Emmett & Crocker 2009, 175; 102)
Supplier performance measuring process must be beneficial also to supplier in order
to achieve supplier’s commitment. When supplier recognize advantages of
performance measuring program, co-operation will be easier and data collection will
be enabled. Without co-operation of suppliers it is impossible to collect necessary
data for performance indicator measurements. In order to achieve success with
performance indicators, it is important to supplier to clearly understand what is the
role of them, what are the advantages of measuring and why measuring is done.
(ibid., 102-103)
When supplier understand their role and the meaning of the whole monitoring
procedure, it can have positive effect on commitment level of the supplier. Increased
commitment reflects on satisfaction of the relationship which tightens the

25
collaboration between two companies. Data gathering processes should be designed
to be simple and quick so process could be done with minor effort and time.
Whereupon, people cannot rely on excuses of intractable or difficulty of usage of the
instrument nor appeal to disruption in other processes. Nowadays generalization is
that, the time is money and if something is not valuable it has to be done with
minimum effort.
5.2 Key performance indicators (KPIs)
Key performance indicators are measures that focuses on current and future success
from the most critical aspects of the organisational performance. Organisation have
their own strategy, vision and mission which determines goals and aims for overall
operations. Purpose of the performance measures is to supervise development and
effectiveness of organisation’s strategy, allocate difference between objective and
results and confirm effectiveness of organisation and its operations. Performance
measures control people’s behaviour, support strategic decision-making, learning,
reporting and compliance of the organisation. (Marr 2009, 99; Neely 2002, 176-177;
Parmenter 2010, 4)
Bad execution of measures can have reverse effect in organisation and KPIs turn
form a measure into a target, when even well-intended KPIs can turn in to a harm.
Marr (2014) presented following examples in web publication, which visualize three
different cases when performance measuring has gone terribly wrong:
- An electrical wholesale group put KPIs in place to measure the relative sales
performance of branches. It then created league tables and rewarded the
best performing branches. The result was, stores that were hundreds of
miles apart chased the same customers and even undercut the
geographically closest retailers to the customer. In many instances,

26
deliveries were made from the central warehouse to the shop hundreds of
miles away, only for this shop to drive the parts back near the warehouse
where they undercut the prices of the local store. (ibid., 2014)
- A police force introduced KPIs to measure its performance. The government
then turned some crime statistics into targets and measured every police
force against these targets. As a result, a lot of gaming took place to
improve the numbers, but not necessarily the underpinning performance.
For example, one police force was told by their chief to prioritize burglaries
of multiple-occupancy households because the system would count each
occupant as a separate solved crime. (ibid., 2014)
- A Russian nail factory is one good example of bad execution of key
performance indicators. When the government centrally planned the
economy it created targets of output for the factory, measured in weight.
The result was that the factory produced a small number of very heavy
nails. Obviously, people in Russia didn't just need massively big nails so the
target was changed to the amount of nails the factory had to produce. As a
consequence, the nail factory produced a massive amount of only tiny nails.
(ibid., 2014)
5.2.1 Characteristics of the key performance indicators
Parmenter (2010, 6) defined following seven characteristics of the key performance
indicators as a result of extensive analysis and discussion in the KPI workshops with
over 3,000 participants from different organization types in public and private
sectors. Key performance indicators:
1. Are nonfinancial measures
2. Are measured frequently
3. Are acted on by the CEO and senior management team
4. Clearly indicate what action is required by staff

27
5. Are measures that tie responsibility down to a team
6. Have significant impact
7. Encourage appropriate action
Measures can be an effectiveness or an efficiency measures. Effectiveness measures
response to question “Are we doing right things?”, whereas efficiency measures
response to question “Are we doing the things in the right way?”. Measures are
made to check position, communicate position, confirm priorities and compel
progress of the organisation in according to set goals. (Marr 2009, 100)
Check position: Measures are made to check position of the organisation and
establish starting point of the operations and strategy determining. When position is
established, organisation can define their strategy, plan improvement initiatives,
monitor their progress and compare it to other companies in the same market. (ibid.,
2009, 98)
Communicate position: Measures are made to communicate the position of the
organisation for internal and external interest groups. Organisations have voluntary
and legislative communications which are required in many industries. Organisations
are forced to report their performance, for example, annual reports are legislative
requirements for taxation and accounting purposes. Voluntarily reports are, for
example, environmental performance report and social responsibilities report. (ibid.,
2009, 98)
Confirm priorities: Measures enables organisations to highlight what matters the
most, establish the judgement for comparison and create criteria for priorities, as
well as communicate to stakeholder’s and take their needs into account. (Marr 2009,
98; Neely 2002, 68)

28
Compel progress: Measures drives people’s motivation, change their behaviour and
effects on their attitudes. Measures send a signal what is important for the
organisation and provide relevant information to empower personnel to learn and
enable actions of improvement. (Marr 2009, 98; Neely 2002, 107-108)
5.2.2 Types of KPIs
Key performance indicators can be divided into two main types, such as qualitative
and quantitative measures, which describes format of the data and behaviour of the
measurement. Qualitative KPI is descriptive characteristic, an opinion, a property or
trait. Descriptive source data is the most difficult to measure and it requires well
designed surveys with questions that will gain data in detailed level. (Parmenter
2010; The KPI Institute 2015; Neely 2002, 177)
Quantitative KPI is a measurable characteristic, resulted by counting, adding, or
averaging numbers. Quantitative data forms the backbone of the most KPIs and is
the most common measurements. Quantitative data is easy to collect and process to
numerical formula. Qualitative and quantitative key performance indicators can be
categorized in to current measures and future measures in according to the
functionality. Current measures refer to 24/7 monitored or daily measures, whereas
future measures record the actions in the future. (Parmenter 2010, 10)
Usually key performance indicators are categorized also to leading or lagging
measures which, however, is not useful way to label measures because some
indicators can be both. Parmenter (2010) expressed “late-planes-in-the-air KPI” as an
example of situation where key performance indicator can be labelled as leading and
lagging measure: it talks about the past and it is about to create the future problem
when it lands. (ibid., 6)

29
5.2.3 Benefits of KPIs and measuring
Right information enables managers to make more timely decisions and take actions
to serve customers better. Strategically valued data and information support analysis
at the three levels of quality – individual, process and organisational levels. Bhat
(2010), determined the types of information and how it is disseminated and aligned
with organisational levels, as following:
- Individual level: data provide real-time information to identify assignable
reasons for variation, determine root causes and take corrective action as
needed. (ibid., 299)
- Process level: operational performance data such as yields, cycle times and
productivity measures help managers determine whether they are doing
the right job, whether they are using resources effectively and whether
they are improving. (ibid., 299)
- Organisational level: quality and operational performance data from all
areas of the firm, along with relevant financial, market, human resources
and supplier data, form the basis for strategic planning and decision
making. (ibid., 299)
5.2.4 Importance of information management
Information management and information management systems, such as
performance management systems have key role on performance measuring. When
performance measuring is based on automatic system, the process itself is easier and
supports the key performance indicator measuring. Strong information system
improves quality of the data and renews the information management which gains
value of data in decision making and management. (Bhat 2010, 299; Neely 2002, 174-
176)

30
Benefits of informative data and good information management are:
The company knows that customers are receiving appropriate levels of
services
Workers can verify their progress in according to concrete feedback
Reward and recognition can be enabled
Signals need of corrective actions and provides a means of assessing the
progress
Improvement actions and better planning reduces costs
Relevant, practical and functional key performance indicators enable management
and decision making to act based on facts. The most benefits are gained from a
broad base of measurements, tied together by strong information systems. An
integrated whole can help a company to align its operations with its strategic
directions, streamline information sharing and improve problem solving. (Bhat 2010,
299; Neely 2002, 72)
5.2.5 Problems and common pitfalls in performance measurement
Intention of the measures is to form picture of the reality from important things,
which are easy or not, to measure. Quantification and numbers are requirements of
measuring and it works better in some areas than others. In transportation services
and transport network management it is easy to measure, for example, utilization
rate of certain transport company or route, usage of transport modes and
transported tonnes. Whereas in global transport network, which includes 3PL
companies and all transport modes, it is easy to measure lot of things but relevancy
of indicators must be re-considered in according to transportation mode. For
example, on-time delivery performance in ocean transportations can be measured,
but the truth is that performance will vary in according to external factors such as
the nautical circumstances. Therefore, supplier’s possibilities to effect on
performance level is minor.

31
Usually organisations measure business performance not only for itself, but for
shareholders and organisation board. The board is accountable for shareholders for
the proper conduct of business and results of performance metrics are easy way to
give information which is based on facts. (Neely 2002, 123)
Since performance metrics are known source for facts it is regrettably usual, that
organisations succumb to vanity with performance metrics. When pressure to
perform in the highest level is substantial, it is obvious that no one wants to use
measures which gives impression of poor performance. Vain metrics are developed
from situations which are double-edged and easily manipulated. For example, order
fulfilment measure is commonly used to measure operation’s performance against
promised delivery date. Companies can promise the date that is easily achieved and
contains wide range of days. In the worst case, the company can measure order
fulfilment from latest promised delivery day and then the metrics are always on good
level. (Hammer 2007)
Another example of vain and narcissistic measurements are metrics that measure
only from organisation’s own perspective. Many organisation measures on-time
shipping in terms of, whether the shipment left the dock on the date scheduled, or in
terms of individual components. (Hammer 2007) For example, the company sends
eighteen of twenty components to customer due to date scheduled and customer
receives the shipment on time. The company would score itself a 90 % of purchase
order fulfilment and 100 % of operational performance. However, the customer
would score them 0 %, because of their machine needs all the ordered components
to operate normally.
Often strategic metrics are determined too tightly by departmental or organizational
boundaries, which makes measuring too dogmatic. For example, metrics with bond
to budget can cause customer, quality and product or service consumption loss.
Decrease of costs usually improves the status of this kind of metrics and when

32
organisation starts to rummage for the cheapest option I.e. for transportations, the
price-quality ratio decrease is unavoidable. (Hammer 2007) Significant drop in
transportation service prices usually bespeak of the black economy or other issues in
the transportation company.
“Not everything that can be counted counts, and not everything that counts can be
counted” said Albert Einstein in twentieth century and he was right. The thing that
matter the most is usually difficult to measure and often impossible to express in
meaningful numbers. Many organisations are too lazy to develop metrics which are
relevant for their organisation. They usually have long list of possible indicators and
often these are easy to measure and create from data which is already available.
(Marr 2009, 100-101; Neely 2002, 158)
Regrettably often, these indicators, lead to a situation where organisation leap over
the lowest hurdle and end up with the irrelevant and unpractical indicators which
does not gain enough information to serve their strategy and overall goals. Too many
indicators usually bring either insufficient data or too much data, whereupon
measures are petty and in the worst case insane. (Hammer 2007) For example, if
transportation category managers would get bonuses based on the number of
contracts with the transportation companies. That would be insane metric in order
to manage global transportation network and nominated transportation companies.
Consequences of that metric could be that organisation would have contracts with
the most of the transportation companies in the world. Which surely would not be to
the purpose.
Culture of the organisation enables measuring and people’s commitment level
increases effects of the measurements. If organisation does not have receptive
culture, which is ready to apply itself to measuring and continuous improvement, the
measurements will lose their effect. People in non-receptive culture usually find

33
excuses for poor performance rather than investigates root causes or try to improve
the level of performance.
At the end, the measures capture only a fraction of total information that
organisation would like to measure and that’s why the indicators should be as
specific as possible. Before creating indicators, it is important to know the most
important elements of the strategy, identify what really matters and what does make
the value for the organisation. Strategy and the understanding of value creation must
be shared with the whole organisation to make performance measuring as efficient
as possible. Regrettably often companies have a lot of measures but no one knows
what they are measuring. (Marr 2009, 101; Neely 2002, 158; Bhat 2010, 304)
5.2.6 Data collecting and selecting indicators
As earlier common pitfall chapter expressed, the KPIs are the thing, where the most
of the organisations follow the path of least resistance, and pick measurements
which are the easiest to create from available data. However, while collecting the
data companies can make mistake on collecting wrong type of data.
Two fundamental mistakes in data collection are: irrelevant or inappropriate
measurements and not measuring key characteristics that are critical to company
performance. In the first case, company waste time and resources on directing
attention in areas which are not important for the organisation and in the second,
company often fails to meet interest group expectations and possibly loses
competitive advantages. (Bhat 2010, 304)
At first, the organisations should identify what they want to measure, instead of
searching available data from IT systems. They should approach performance
measuring from “What we want to measure?” – Perspective rather than create
indicators from available data. Performance indicators should be aligned with
business strategy and they should be actionable. Many organisations assume that all
34
available data is relevant and meaningful for their measurements and regrettably
often organisations assume that performance data is collected easily with
automation and IT systems. (Marr 2009, 108; The KPI Institute 2015; Bhat 2010, 304)
After the organisations have identified that what they want to measure, it is time to
compare it to available data and create new indicators or new data collection
procedures in order to fill gap between measurement demand and data capability.
Data can be compiled with multiple techniques and methods, which can reduce
biases and increase reliability of the data. Data from different methods can be
compared to each other, which reduces data gaps and makes it more complete.
(Marr 2009, 108-112)
Organisations should involve more people into data collection system rather than
impose measures on them. Marr (2009, 109) expressed that assessing the
performance, in particular area, is easy by asking the most closely people in the area.
Marr highlighted that internal and external people involvement is critically important
in data collection processes. (ibid., 109)
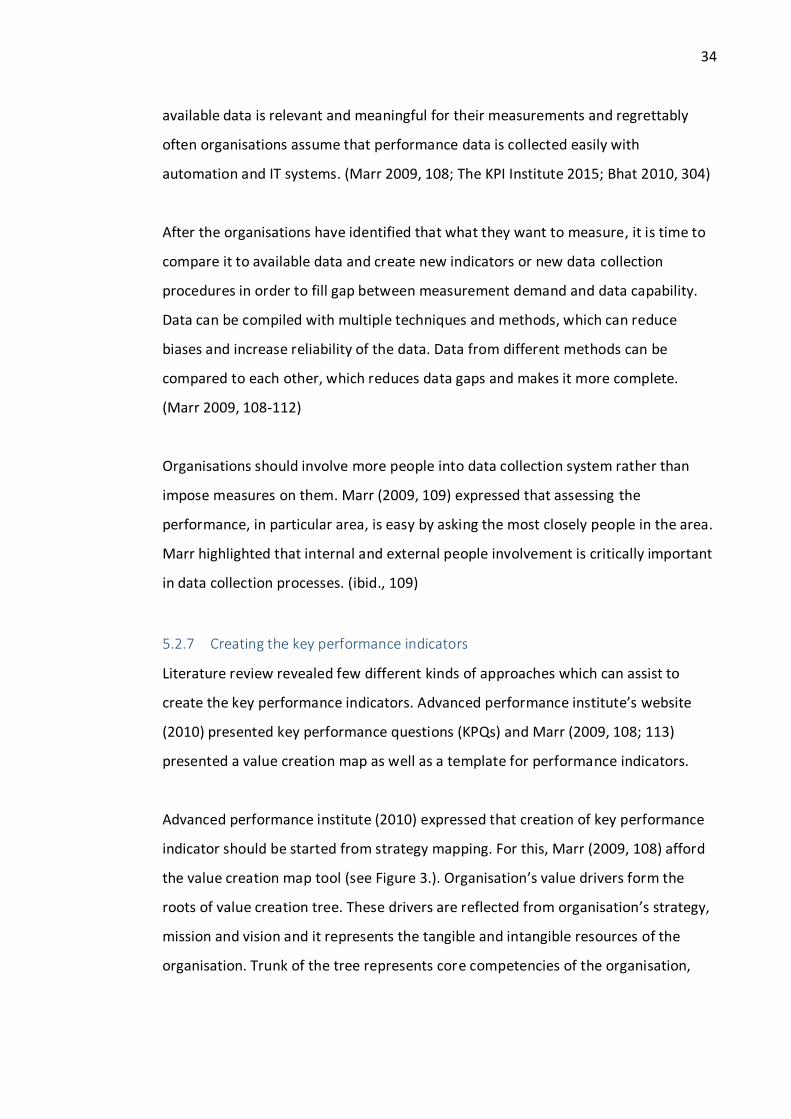
5.2.7 Creating the key performance indicators
Literature review revealed few different kinds of approaches which can assist to
create the key performance indicators. Advanced performance institute’s website
(2010) presented key performance questions (KPQs) and Marr (2009, 108; 113)
presented a value creation map as well as a template for performance indicators.
Advanced performance institute (2010) expressed that creation of key performance
indicator should be started from strategy mapping. For this, Marr (2009, 108) afford
the value creation map tool (see Figure 3.). Organisation’s value drivers form the
roots of value creation tree. These drivers are reflected from organisation’s strategy,
mission and vision and it represents the tangible and intangible resources of the
organisation. Trunk of the tree represents core competencies of the organisation,

35
which connects the resources to deliveries and gives it its strength to operate and
grow “apples”. The trunk provides the channel leveraging the resources to create
value for output deliverables or value proposition. Each element on the map should
have their own assessment or indicators and value creation map is made to guide the
development of it.
Figure 3. Value creation map (Marr 2009, 108)
When strategy is mapped out and organisation’s main goals and objectives are clear,
the next phase is to create KPQs. These questions help to answer to the most critical
business questions and guides organisations to create strategic, relevant and
meaningful KPIs for every strategic element. When the most important business
questions are established it then allows organisation to select or develop KPIs. (Marr
2010)
Marr (2009, 113) presented also more detailed approach, a template, for
performance indicator creation. The template includes necessary and important data
and gives clear picture about the indicator. Template gives information about
strategic element that is being assessed, purpose of the indicator, data collection

36
method, ownership, targets and performance thresholds, validation and confidence
level and much more.
6 RESEARCH PART
The thesis was carried out from September 2016 to December 2016, but the creation
of KPI dashboard was carried out in January 2017. Altogether, the research was
conducted in five months alongside working for Valmet. Research methods such as
systematic literature review and descriptive content analysis were deployed in the
research where data was gathered from suppliers, literature, written documents,
statistics and by participant observation.
Research part of the thesis was divided in two parts because of the wide subject
matter and to clarify the research process and reporting phase of the thesis. These
parts were identified as KPI dashboard research and reporting research when
adjusted research problems and the context of the research was explored.
Reporting research part was firstly conducted because the relevant data was
gathered more quickly and the research was more practical when vendor data
templates and statistics were reviewed and regular reporting meetings were
scheduled. As expected, from the characteristics of a case study research strategy,
the data was examined well before the supportive theory for problem solving could
be identified.
KPI dashboard research part was also approached firstly from practical perspective.
Possible indicators were searched from internet and web databases such as KPI
libraries, so that greater picture about what others, in the same or related industries,
measure could be created and new indicators could be identified. However, the

37
search made didn’t result any new indicators that could be deployed for Valmet
transportation team, thus, the research was approached theoretically. Forthcoming
chapters will discuss about the research process and how research parts were
conducted by successful matter.
6.1 KPI dashboard research
KPI dashboard research was done in according to adjusted research questions where
identification of Valmet transportation team’s value creators and solution for
relevant content of KPI dashboard was desired.
Theoretical framework of KPIs was created and the literature was reviewed
systematically by thematic analysis and the main purpose was to gain knowledge
about what kind of indicators should be deployed and what kind of tools for creation
the theory could bring out. Review resulted that, the purpose of the indicator is to
measure things that are important for the company and bring value for the
operations. The most important characteristic of the key performance indicator is
the connection to the strategy whereupon the importance of measuring target is
confirmed. Theoretical review revealed the strategy bonded value creation map tool
that was deployed in the research in order to engage the chosen indicators to the
strategy of Valmet transportation team.
The present state description of used indicators in Valmet transportation team was
made by descriptive content analysis of statistics and internal reports. Present state
description of indicators revealed that Valmet transportation team had a lot of
indicators and data gathering customs that were presented in Viewpoint,
management and transportation team reporting. As a backtrack to key findings of
the theoretical review of key performance indicators and performance measuring,
the common pitfall of performance measuring is that companies have too many

38
indicators deployed which hinders the indicators that are important for the
company. This also makes KPI dashboard creation more difficult when multiple
indicators are presenting same information in other figures and values. However, it
was a relief that Valmet transportation team had a lot of existing measurement so
the new measuring customs would not be necessary to create. Existing indicators
were gathered and summarized in the table (See appendix 4.), where category of the
indicator and reporting level and environment was identified. Valmet transportation
team had KPIs that were common for team as well as management level reporting.
When key performance indicators are created, the audience of the dashboard must
be considered. Transportation team needed KPI dashboard for operational and
management level reporting. When KPIs are designed for internal and external
audience the content of dashboard must be designed carefully. Because of multiple
audience the values and figures must serve reporting with all interest groups. Basic
idea of created KPI dashboard was that transportation team could use screen shots
from the interactive dashboard so manually generated figures could be avoided and
the information would be always available in Viewpoint.
Dashboard creation phase
In the dashboard creation phase the value creation map was created (See
appendixes 6-7.) and the relevant indicators were identified. Within the creation
process the chosen indicators were presented for transportation team and in
according to team’s comments the content of the dashboard was re-designed.
When the value creation map was created the second phase of KPI dashboard
creation was indicator and value creation map comparison. Indicators were
compared to the value creation map and the indicators were considered from the
measuring target perspective. Connection between the indicator and the strategy
was confirmed by the analysis. Table 2. Presents the summary of the analysis and a
list of chosen indicators. List presents the engagement between the strategic
element and the value creation map element.
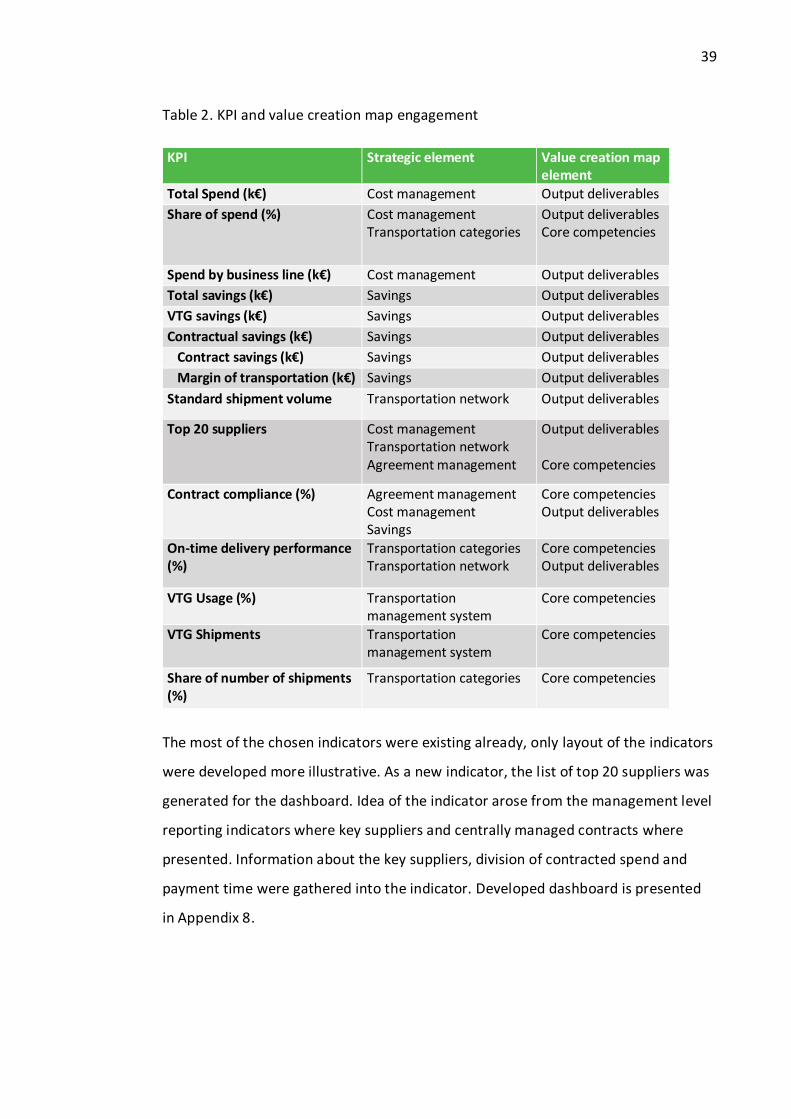
39
Table 2. KPI and value creation map engagement
KPI Strategic element Value creation map element
Total Spend (k€) Cost management Output deliverables
Share of spend (%) Cost management Transportation categories
Output deliverables Core competencies
Spend by business line (k€) Cost management Output deliverables
Total savings (k€) Savings Output deliverables
VTG savings (k€) Savings Output deliverables
Contractual savings (k€) Savings Output deliverables
Contract savings (k€) Savings Output deliverables
Margin of transportation (k€) Savings Output deliverables
Standard shipment volume Transportation network Output deliverables
Top 20 suppliers Cost management Transportation network Agreement management
Output deliverables xxxx Core competencies
Contract compliance (%) Agreement management Cost management Savings
Core competencies Output deliverables
On-time delivery performance (%)
Transportation categories Transportation network
Core competencies Output deliverables
VTG Usage (%) Transportation management system
Core competencies
VTG Shipments Transportation management system
Core competencies
Share of number of shipments (%)
Transportation categories Core competencies
The most of the chosen indicators were existing already, only layout of the indicators
were developed more illustrative. As a new indicator, the list of top 20 suppliers was
generated for the dashboard. Idea of the indicator arose from the management level
reporting indicators where key suppliers and centrally managed contracts where
presented. Information about the key suppliers, division of contracted spend and
payment time were gathered into the indicator. Developed dashboard is presented
in Appendix 8.

40
6.2 Reporting research
Reporting research was conducted in according to adjusted research questions
where real status of on time-delivery performance indicator and solutions for
reporting improvement where desired.
Fundamental set of the research consist of nominated transportation companies in
road category and research material was gathered from the suppliers in September
2016. The observation period in the data was rolling twelve months backwards.
Research material consist of vendor data templates which consist of all shipment
data by certain carrier. The data was examined by descriptive content analysis when
relevant details from the data was reviewed. Statistics from Viewpoint and data from
SDM as well as VTG was reviewed during the research.
Before the actual research, the present state descriptions were made. On-time
delivery performance indicator and the measuring process was described as well as
the starting point of the indicator status in road category was explored. Present state
description where made in according to observations that was made between the
working for Valmet. Observations was made at the daily basis working environment,
by discussions and system usage as well as in reporting development meetings.
Notes from the observations was not made, only current state descriptions were
made and the information gathered was confirmed by short discussions with the VTG
business responsible.
With present state descriptions, the basic knowledge about the process was gained
and the environment and the context of the problem was clarified for the author.
The research included description of problems in measuring process, reason code
implementation and descriptive analysis of statistics and vendor data. Occurred
problems were identified and the reporting customs of the suppliers were explored
so the answers for research questions were found and development proposals were
41
addressed. Problems of current performance measuring process is presented in the
appendix 9.
6.2.1 Vendor data and reason code usage
Vendor data and reason code usage was examined by descriptive content analysis of
produced data by supplier. All suppliers in road category use the original vendor data
template developed by Valmet transportation team. However, some of the suppliers
have add information that is not relevant for the measurements or the layout of the
template have been changed. However, the current measuring process does not
consider the layout of the template. In the content analysis, the data was firstly
grouped by themes and information shortage was described (see Appendix 10.)
Themes created were:
1. General information
2. Consignor / consignee information
3. Despatch / Delivery information
4. Incoterms
5. Package information
6. Booking information
7. Freight payer’s information
8. Freight costs information
9. Invoicing information
10. Reporting information
Booking information included the data column for reason codes which was examined
in more detailed level by descriptive content analysis. Detailed information about
examination of reason code usage in road category is presented in the appendix 11.
Used reason codes were compared to agreed reason codes (see appendix 12) then
implemented into the on-time delivery performance indicator per supplier.

42
Reporting research part of the thesis was conducted as a case study and four case
studies were created in according to revealed reporting problems per supplier. More
detailed research of case studies is presented in the appendixes 13-16.
Route top 20 data problem: Three top lanes were in a state where delivery country, dispatch country or both were unknown
High development level of performance and special transport relation: Performance level of the supplier was suddenly improved during two quarters of the year in 2016
Differences in shipment statuses: Supplier had reported shipments as on-time deliveries, even if the tracking system have notified the shipments as late deliveries
Over performance in shipment deliveries The supplier had reported shipments in multiple times with different reference numbers
7 RESULTS OF THE THESIS
7.1 KPI dashboard development
In chapter 6.1 there was a discussion about the KPI dashboard research part, where
value creation map was created and connections between the strategy and
indicators were addressed. Value creation map was used to assist the KPI dashboard
creation. The research made resulted that the most important strategy elements and
value creators for Valmet transportation team are the following:
Reliable and stabile global transportation network
Cost management and profitability improvement
Operational savings

43
Transportation agreements and agreement management
TMS system and integration level to service providers
Transportation categories and category teams
The KPI dashboard research made resulted the dashboard for Valmet transportation
team. Information and measurements for all indicators were already existing, so new
measuring customs was not developed. Mode of representation of few indicators
was redesigned to serve better Valmet transportation team reporting. Table 3.
Presents a summary of developed key performance indicators. Developed dashboard
includes more categories compared to indicators discussed in chapter 4.4. Most of
the indicators were existing already only manner of expression was changed.
Illustration of the developed dashboard is presented in Appendix 8.
Table 3. Key performance indicators in the dashboard
KPI Category
Total Spend (k€) Spend
Share of spend (%) Spend
Spend by business line (k€) Spend
Total savings (k€) Savings
VTG savings (k€) Savings
Contractual savings (k€) Savings
Contract savings (k€) Savings
Margin of transportation (k€) Savings
Standard shipment volume Network Volume
Top 20 suppliers Spend Sustainability Network
Contract compliance (%) Process savings
On-time delivery performance (%) Process quality
VTG Usage (%) Process
VTG Shipments Process

44
Share of number of shipments (%) Network Volume
7.2 On-time delivery performance indicator levels
In chapter 6.2, there was discussion about the reporting research part, which was
conducted as case study research. Case studies were made of separate problems
that occurred in road category and caused invalid data in Valmet transportation
team’s statistics and databases. The research made resulted the overall performance
level in Road category decreased only 1 % yet changes in performance level per
supplier fluctuated from -6% to 4 %.
Occurred reporting problems greatly influence to on-time delivery performance
indicator and prevented to run the reward system, when indicator cannot be defined
reliably on Valmet side, because the level is on too high or low compared to the
reality. Detailed values of performance development are presented in appendix 17.
In the reporting research part (Chapter 6.2) was discussion about suppliers’ data
reporting problems which formed the cases of the thesis. Reporting and databases
were examined from the Valmet transportation team’s reporting point of view and
following root causes for performance loss or invalid reporting results were
identified:
1. Shortage in delivery and dispatch information (Case study 1)
2. Amount of special shipments (Case study 2)
3. Differences in interpretations of pricelists (Case study 3)
4. Double reporting of shipments (Case study 4)

45
8 CONCLUSION
8.1 Key performance indicators and created dashboard
When theory of KPIs was examined, the most important characteristic of KPI proved
to be that, the indicator should be connected to the strategy, so the measures are
directed to right things. As a conclusion, the organisation should never approach the
measuring from perspective that what others are measuring, because the things that
matter the most and are valuable from the strategy point of view, can diverse a lot
from other companies. However, general overview of what others are measuring can
be explored so the knowledge about measuring targets in the same or related
industries is noticed. Theoretical review revealed that the strategy engaged
indicators could be created by identifying and mapping the value creators. So, the
strategy of Valmet transportation team was examined and the value creation map
was deployed in the research.
Theoretical findings of KPIs addressed that many of the organisation have a lot of
indicators but the relevancy of the measures are not known. From here, one of the
research problems of the thesis was determined. As theory went deeper, the role of
the indicators was explained and the importance of measuring brightened up: If
organisation does not have relevant indicators deployed the current situation and
placement is hard to illustrate in according to desired goals. When current state is
unknown the monitoring of development is impossible. Thus, operations cannot be
directed anywhere.
Measuring and indicators are important for the whole organisation and the audience
of indicators varies per interest groups and involved parties. Involved parties must be
engaged to the measuring process and they must know the idea of the
measurements. Thus, the final dashboard was created in according to comments

46
from transportation team, the indicators were designed carefully and several
reporting audience were considered when illustrative design was created. Idea of the
dashboard was that Valmet transportation team could use it straight for their
reporting by taking screen shots from the indicators.
Key performance indicators must give greater picture of the operations and the
indicators can be straight statistical facts or figures which gives space for
interpretations. In the developed dashboard, the indicators were designed to
illustrate the overall picture of operations so that transportation team could see
number of used funds and the status of their network, each category as well as
transportation management system. Indicators are roughly divided in the spend
indicators, savings indicators, network indicators and transportation management
system indicators. Detailed description of developed indicators is presented in the
appendix 18.
8.2 SRM and reporting research
Supplier relationship management is important business practice, for businesses
regardless of the size and markets. When third party involves in the global supply
chain or transportation network the procurement risk appears at the same time.
With the important supplier, it is more crucial to follow-up the realization of the
contracts and confirm the level of received service. Usually these suppliers are
segmented as strategic supplier if the role in the supply chain is remarkable.
When two organisations tighten their relationship and processes are integrated, the
performance is monitored and measures are deployed for a reason. At the same
time, the importance of coordinated communication increases and the organisation
must communicate with one voice, so that all actions with the supplier is common to
each close to supplier interface. SRM process is convenient approach to standardize

47
the communication and process with the suppliers. Within the process, the same
requirements are applied to every supplier and the relationship is more closely
monitored.
Performance monitoring is one of the supplier relationship management’s key
elements, but the process itself demands more. As it best, supplier management is a
collaborative partnership where everyone knows their role and is committed to
common processes. In the case of Valmet transportation team, the performance data
is gathered from two resources: from suppliers and from automatic system. When
suppliers are involved in the measuring process the importance of commitment level
increase. Poor commitment level reflects in the quality of produced data that reflects
on the measurements and increase the risk of invalid indicators. When measuring
procedures or tools are designed the perspective of reporter part should be
considered. Nothing is more annoying than unfunctional data gathering procedures
that demands more time than any other work task.
8.3 IT-system as a part of process
Deployment of IT systems and databases are demanded more when amount of
information is increasing and more precise and valid measurements are desired.
Exploitation of IT-systems is even necessity when it is about to follow-up the status
of global transportation network. It also enables to create clearer picture of entirety
of operations when measurements are hold up.
Transportation companies plays the key role of transportation network and the on-
time delivery performance of each must be captured by measuring. On-time delivery
performance of suppliers reflects on performance of the network as well as the
company’s operational performance. It relates the status of shipments in internal
transportations: have it been on-time or delayed. Consequences of late deliveries is
48
much more than only loss in performance indicator. It can effect on assembling or
any other manufacturing phase of machines and other products and delay the whole
supply process.
Status of global transportation network can’t be followed around-the-clock but the
awareness must be on the level where realization of contracts can be followed. Since
the level of service is agreed with the suppliers, transportation team have deployed
their on-time delivery performance indicator and vendor data reporting custom. IT-
systems are utilized in the reporting when data from all shipments in transportation
network is gathered per transportation companies. Amount of gathered data is huge
when reporting period is rolling twelve months, as in the road category. But it does
not ease even in courier category, that have three months’ observation period.
When amount of data increase the risk of quality issues increase at the same time.
The utilization of IT-systems is crucial because manual handling of the data would be
too difficult and would take too much resources.
As in the beginning of the research was mentioned that Valmet transportation team
have three transportation categories which have their own category manager
deployed. These managers are responsible of interface between Valmet and the
suppliers and have agreed on reporting procedures with the suppliers. Majority of
the reporting customs are aligned together but some of them differs from each other
and are more applied in according to each category. For example, the earlier
mentioned observation period. Valmet transportation team consist of group of
specialists who work mainly as individuals which cause that the procedures are not
fully harmonized within the team.
When vendor data templates were examined in more detailed level, the templates
included shortage and was summarized in the table (see appendix 6.). For example,
reporting customs of full container load in vendor data reporting of Ocean category
was done so that, weight information from the shipment was filled with “FCL”.

49
Moderation of this kind of data, with single typing error, is difficult to manage
manually because it is hard to find from the mass of data. Single case accumulates
quite fast and creates considerable data gap at short notice.
Valmet have advanced IT-systems that supports their reporting and measuring
customs and they should seek more benefits from the automation of the systems.
Automated settings and features can be qualified per used template if the
integration platform is available. By the help of the IT-system and automatic
features, Valmet can detect deviation in the quality or in the content of the data. IT-
systems are quite relentless that gives advantages for rules and settings that are
common to each user. When rules are set and IT-system is deployed the last step is
to commit in the process with harmonized procedures. By common rules, procedures
and deployed IT-systems, the reporting process can be forced to a state where it will
be harmonized and the results of measurements can be improved.
Vendor data validation process phase
The reporting research made resulted vendor data validation process phase that was
created based on key findings of the reporting research part where usage of vendor
data was analyzed and content of the data was categorized. Idea of vendor data
validation process phase is to standardize the shipment data made by the suppliers,
so that noted statistical and reporting problems could be solved in the future.
Vendor data process phase is designed to replace all information flow via e-mail
thereby suppliers will upload the data straight to principle’s transportation
management system via data upload portal. The system will validate uploaded data
by means of validation rules. Validation rules are set by importance of certain data
for Valmet transportation team’s reporting. Data validation rules were made in
according to data categorization in chapter 6.2 and the summary of the rules is
presented in appendix 18. The summary presents the data which is mandatory and

50
content validated in data upload portal. In according to these settings the data
validation will produce feedback for the user or reject the data.
Developed vendor data validation process phase and the data upload portal serves
one of the principle’s key initiatives in 2016: ITC and reporting development. The
initiative concerned about expanding the VTG usage which was certain outcome for
the vendor data upload that runs through the system. Within the limits of the
project, the data upload portal was implemented in the principle’s TMS and was left
on testing phase.
8.4 Further development proposals
In chapter 4.2 there was discussion about plans of SRM process implementation in
Valmet transportation team and the current supplier management procedures.
When current state of procedures is compared to case study research of Emmet and
Crocker (2009, 87), the result is that Valmet transportation team have all the same
elements than Emmet and Crocker found out from the research. Figure 4.
Summarises the results of the comparison between expressed elements and Valmet
transportation team’s current procedures.
Figure 4. Supplier management at Valmet transportation team

51
Currently Valmet transportation team should not have problems in SRM process
implementation. However, as further development proposals, Valmet transportation
team should consider to create more detailed supplier assessment procedure, where
soft and hard aspects would be considered and suppliers could be rated and ranked.
Continuing assessment procedure could improve the relationship between parties
and give more information about the supplier’s overall performance and help
transportation team to recognize well performing suppliers and to reveal possibilities
of improvements with the supplier that perform poorly.
Currently, Valmet transportation team have on-time delivery performance indicator
as one assessment perspective. However, the performance indicator does not give a
wide scale picture about the relationship and some of the important perspectives are
not considered at all. Wider evaluation process could diversify monitoring and clarify
the whole picture of the relationship with the supplier. Deployed process could
benefit Valmet transportation team by way of activating the communication
between parties and the best-case scenario could be that collaboration with the
supplier improves and operations develop more transparent. The evaluation process
could bring desirable results of SRM when current process would be fulfilled in
category managing.
Transportation service supplier assessment procedure
Supplier evaluation process (see Figure 5.) could include three groups of evaluation:
1. On-time delivery performance, quality of produced data and invoicing
accuracy for a performance evaluation
2. Sustainability, integration level and service capability for capability evaluation
3. Key Account Manager and average payment time for a relationship
evaluation which also presents the collaboration part of the assessment.
These aspects are presented in figure below which derive its origin from AHP-model
which was developed by Thomas L. Saaty in the 1970s. (Saaty 2003, ii) In AHP model
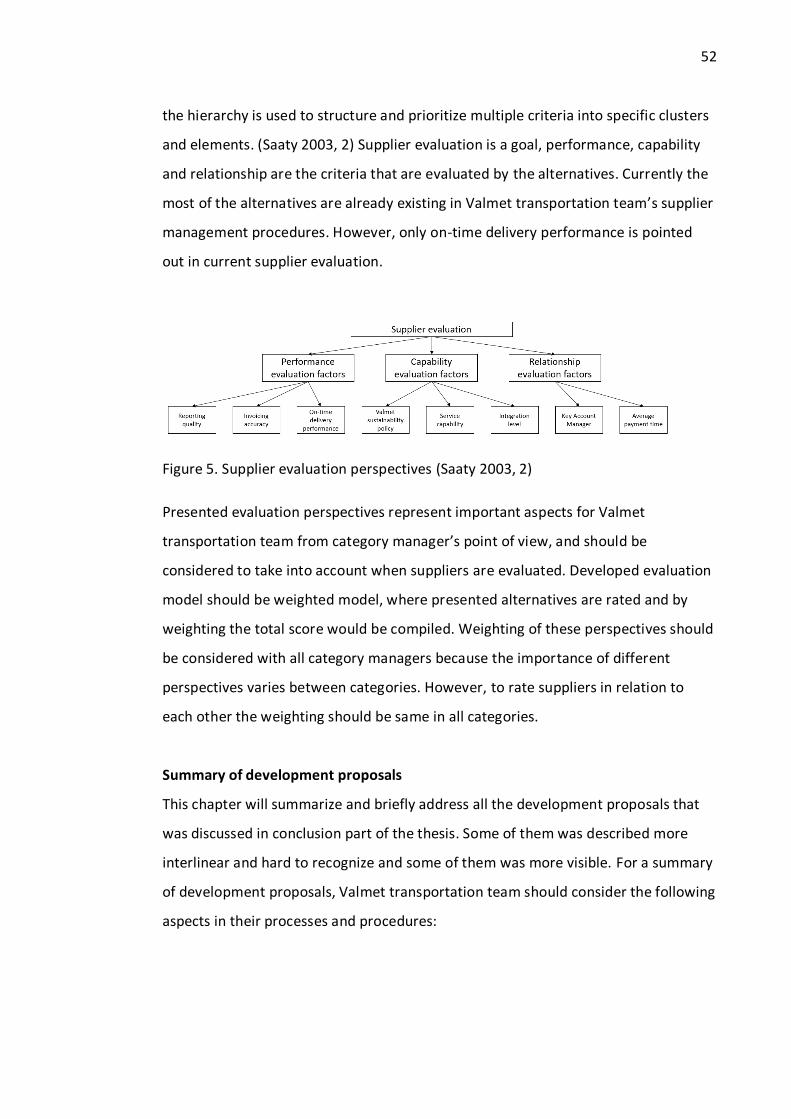
52
the hierarchy is used to structure and prioritize multiple criteria into specific clusters
and elements. (Saaty 2003, 2) Supplier evaluation is a goal, performance, capability
and relationship are the criteria that are evaluated by the alternatives. Currently the
most of the alternatives are already existing in Valmet transportation team’s supplier
management procedures. However, only on-time delivery performance is pointed
out in current supplier evaluation.
Figure 5. Supplier evaluation perspectives (Saaty 2003, 2)
Presented evaluation perspectives represent important aspects for Valmet
transportation team from category manager’s point of view, and should be
considered to take into account when suppliers are evaluated. Developed evaluation
model should be weighted model, where presented alternatives are rated and by
weighting the total score would be compiled. Weighting of these perspectives should
be considered with all category managers because the importance of different
perspectives varies between categories. However, to rate suppliers in relation to
each other the weighting should be same in all categories.
Summary of development proposals
This chapter will summarize and briefly address all the development proposals that
was discussed in conclusion part of the thesis. Some of them was described more
interlinear and hard to recognize and some of them was more visible. For a summary
of development proposals, Valmet transportation team should consider the following
aspects in their processes and procedures:

53
- Deploy the transportation service supplier assessment procedure, so the well
and poor performing suppliers could be identified
- Harmonize the reporting procedures within the whole team by learning from
each other
- Utilize and exploit more the advanced IT-systems such as VTG
8.5 Reliability and repeatability
Reliability of the research forms from main literature resources which was searched
from experts, researches and of certain area who have create a career around
publication context. Main information in every theoretical context was gathered
from books which had praise from other experts and at the end some of them was
cited in materials which was gathered to support the main theory. The main theory
of the theoretical framework was compiled from following literature;
Strategic Performance Management (2009), authored by Bernard Mar.
Bernard Marr is one of the world’s leading experts on strategic
performance management. He specialized in the identification,
measurement, and management of value creation and strategic
performance drivers. (Marr 2009)
Bernard Marr is an acclaimed keynote speaker, consultant. teacher and
award winning-writer. When references for performance measuring
and management were searched, Marr was noticed in the publications.
(Mts.)
Key Performance Indicators (KPI): Developing, Implementing, and Using Winning
KPIs (2010), authored by David Parmenter “The King of KPIs”

54
DAVID PARMENTER is a writer, facilitator and an international
presenter who is known for his thought provoking and lively sessions
that have led to substantial change in many organisations. He is a
leading expert in the development of winning KPIs, replacing the annual
planning process with quarterly rolling planning, lean finance team
practices, and management and leadership practices that will get you to
the top. David has delivered workshops in 31 countries
through professional bodies, event management companies and
organisations who want in-house training. (Parmenter n.d.)
Excellence in Supplier Management (2009), authored by Stuart Emmett & Barry
Crocker
Barry Crocker is a lecturer in the Salford Business School at the
University of Salford. He is currently Programme Leader for MCs
Procurement and Logistics and MCs Supply Chain Management.
(Emmett & Crocker 2009)
Stuart Emmett: 30 years in commercial private sector, nowadays a freelance
independent mentor / coach, trainer and consultant. (Mts.)
Supplier relationship management: how to maximize vendor value and opportunity
(2014), Authored by Stephen Easton, Michael D. Hales, Christian Schuh, Michael F.
Strohmer, Alenka Triplat and AT Kearney
The group of authors consist of procurement specialists that have lot of experience
from transformation and improvement practices as well as project works with
effectiveness improvement and much more. (Schuh, Strohmer Easton, Hales, &
Triplat 2014)
Christian Schuch: doctorate in business administration

55
Michael F. Strohmer: doctorate in business administration and law
Stephen Easton: MBA, a first degree in politics, philosophy and economics
Mike Hales: Bachelor of science in business, Master’s degree in management
Alenka Triplat: Economics and business administration degrees (Mts.)
Exiguity of the main resource material was supported with several other materials
which consist of journals and web publications from Engineering Source database
and Emerald Journals which are official databases of JAMK. Amount of resources
remain quite narrow because of the lack of available publications even if the
theoretical framework was expanded in e.g. procurement, supply chain management
and any other themes which are related to addressed theories. Wider theoretical
framework can be seen also from compilation of the resources. However, with good
quality of the main resources the research is reliable and the theoretical information
in the research is up to date.
Reliability of the research material
Quality of vendor data templates played a key role in the research. Operational
factors such as, new customer agreements, maintenance demand of old customers
and sub-contractors geographical position impact to the scale of vendor data, when
amount of shipments and Valmet’s need of standard cargo transportation varies.
Further, suppliers’ level of information technology has effect on accuracy of vendor
data. Some of the suppliers can produce vendor data based on automatic system
reports, whereas other produce reports manually. Some of them had clammy
collaboration which reflects to quality of vendor data reports.
Participant observation will always have, at least tiny, effect on the research when
information gathering is done by observing. Errors can be caused by
misunderstanding or unintentional negligence. Even if the observation should be
done as neutral perspective as possible the effect of author’s mood and personal
qualities is unavoidable. Especially in situations where author’s knowledge about the

56
context or research object is tangential, the observation can distort because of
pressurised atmosphere of new information systems, working tasks, procedures and
processes. In this thesis, before mentioned working conditions did effect on the
research when environment of the research problem was new for the author.
Because of the characteristic of on-time delivery performance indicator and running
twelve months reporting period, the status of performance indicators is not precise
when data can be updated monthly by the reporting of the supplier. The reporting
period effects also in overall statistics where information about the whole
transportation network is presented. Effect on overall statistics was not relevant for
the research because the idea of descriptive analysis was that the size of the
considered matter was illustrated.
The effect of data gathering procedures behind the on-time delivery performance
indicator can be seen for example from the table that was presented in outcomes of
the thesis. Changes in the performance level of one supplier caused by the reporting
period and when reason codes are not used, the level of performance is calculated
straight from VTG data. Margin of error in results of the development of indicator
levels by supplier could be approximately 1 %. A phenomenon is explained by
shipment data update feature of the automatic systems where supplier can update
the shipment data during the whole observation period. However, the results of
performance indicator research give a clue about the changes made by the research
and clarifies that all suppliers had some problems in their shipment reporting
procedures.
Repeatability of the research
If the thesis would be repeated, the probability of different results would be possible
in one way or another. Results of the reporting research would change mainly
because of implementation of the development proposals for the road category. The
actions would have effect on vendor data and SDM data, when suppliers would have

57
implemented reason codes and developed their reporting in according to the
proposals. However, duration of the development could vary a lot per supplier
because of their attitudes about the reporting and development of procedures.
If the approach and content of KPI dashboard research would remain the same, the
results would not change because the created dashboard is engaged to value
creators of Valmet transportation team which have been diverted from key
initiatives and Valmet strategy. However, if the research would have repeated and
the transportation team would have more participate in the research the results
could change on the grounds of their opinions.
What I would do differently is that I would make the value creation map as a
workshop with the transportation team. So, all team members could be part of the
value creation mapping and all perspectives could be considered. Now the value
creation map is based on my own observations, even if the content was checked by
my mentor. It can be possible that understanding of the value creation context was
not precise when it was taken under consideration of VTG business responsible.
Weaknesses such as lack of understanding of the context and my own observations
can cause the error in the developed KPI dashboard. However, my aim was to find
out tools and methods from the theory so the created KPI dashboard could be as
relevant as possible so Valmet transportation team could measure the things that
matters the most. Value creation map was convenient tool to approach the KPI
dashboard since, connection between chosen indicator and value creation map was
founded.

58
9 AFTERWORD AND COMMENTS
Supplier relationship management was not familiar for me as a theory whereas key
performance indicators have been one of the subjects in lectures. However, the scale
of the theory, founded tools and information was searched deeper than ever. Lots of
SRM and KPI related literature was reviewed because the literature of the SRM was
hard to find. Most of the literature was written from procurement perspective so the
content was about to slip in the wrong perspective and needed to apply on the
research context.
Occurred reporting problems could have gained deeper examination, if the suppliers
would have involved in the research and the real root causes would have been
solved also from their side. However, the scale of the thesis was already wide and
the additional perspectives would have extended it more. The wideness of the
subject complicated especially the reporting phase of the thesis and clearly occurred
in the produced report.
What made the work a bit harder was my new employment at the Valmet
transportation team. Help and advices from my mentor, an experienced VTG
business responsible, was needed during the thesis so that I could gain more
knowledge. Along with the employment, new processes, IT systems and working
environment came in to the picture and the familiarization took time a lot. This, on
one hand, made making of the thesis more challenging but on the other, also very
interesting. In addition, the topic of the thesis was close to my studies and
transportation management systems have been my all-time favourite subject at
JAMK. So, the subject for my thesis came as on cue from the Head of indirect
procurement.

59
During the work, any resistance from the team was not observed, but more
participation into the research would have been hoped from all other team members
than my mentor. It would have been nice to hear more comments and opinions from
others about the work I have been done and how I should proceed with it. However,
I’m thankful for the opportunity that I got to involve the team of professionals that
have knowledge and experience in the field of logistics.

60
REFERENCES
Annual review 2016. 2017. Publication from Valmet.com website. Referred 1.3.2017
http://hugin.info/149898/R/2083314/785285.pdf Bhat, K. 2010. Total Quality Management. Referred 24.1.2017 Brekalo, L. Albers, S. Delfmann, W. 2013. Logistics alliance management capabilities: Where are they?, International Journal of Physical Distribution & Logistics Management, Vol. 43 Iss: 7, pp.529 – 543. Referred 25.1.2017 Case-tutkimus. N.d. Virtuaaliammattikoulu website. Referred 29.3.2017 http://www2.amk.fi/digma.fi/www.amk.fi/opintojaksot/0709019/1193463890749/1193464144782/1194348546586/1194356433452.html Emmert, S. Crocker, B. 2009. Excellence in supplier management. Referred 10.10.2016 Engel, B. 2012. Alliance Management: Engaging Suppliers the Right Way. Supply Chain Management Review. Sep/Oct2012, Vol. 16 Issue 5, p20-26. 7p. Referred 24.1.2017 Flow, Businesses and Areas. 2017. Valmet database. Referred 7.1.2017 Gillham, B. 2010. Continuum Research methods: Case study research methods. Referred 20.12.2016 Hammer, M. 2007. The 7 deadly sins of performance measurement. Web publication. Referred 28.10.2016. http://www.innovationlabs.com/summit/summit6/pre/reading_materials/0407_SMR_7DeadlySinsPerfMeas.pdf Hirsjärvi, S. Remes, P. & Sahavaara S. 2013. Tutki ja Kirjoita. Hudnurkar, M. Rathod U. Jakhar, S. 2016 Multi-criteria decision framework for supplier classification in collaborative supply chains: Buyer ' s perspective, International Journal of Productivity and Performance Management, Vol. 65 Iss: 5, pp.622 – 640. Referred 24.1.2017 Hughes, J. Wadd, J. 2012. Getting the most out of SRM. Supply Chain Management Review. Jan/Feb2012, Vol. 16 Issue 1, p22-29. 8p. Referred 24.1.2017 Jack, E. Powers, T. 2015. Managing strategic supplier relationships: antecedents and outcomes, Journal of Business & Industrial Marketing, Vol. 30 Iss: 2, pp.129 – 138. Referred 24.1.2017 Kananen, J. 2013. Case-tutkimus opinnäytetyönä. Referred 20.12.2016

61
King, J. 2016. 8 aspects of quality that will improve productivity. Blog publication. Clever checklist. Referred 15.9.2016. https://www.cleverchecklist.com/blog/thoughts/quality-productivity/
Loikkanen, J. 2016. Transportation team action plan 2016. Internal document. Jyväskylä: Valmet. Marr, B. 2014. Caution: When KPIs turn to poison. Web publication. Referred 28.10.2016. https://www.linkedin.com/pulse/20140324073422-64875646-caution-when-kpis-turn-to-poison Marr, B. 2010. What are Key Performance Questions?, Management Case Study, The Advanced Performance Institute http://www.ap-institute.com. Referred 20.10.2016 Marr, B. 2006. Strategic performance management. Referred 20.10.2016 Neely, A. 2002. Business performance measurement: theory and practice. Referred 25.10.2016 Parmenter, D. 2010. Key Performance Indicators (KPI): Developing, Implementing, and Using Winning KPIs (2). Referred 23.10.2016 Parmenter, D. N.d. About David Parmenter. http://davidparmenter.com/davids-cv/ Robinson, A. 2016. 2016 supply chain trends: 7 of 12 Trends that Will Drive Supply Chain Management in 2016. Blog publication. Cerasis.com. Referred 14.10.2016. http://cerasis.com/2016/01/04/2016-supply-chain-trends/ Saaty, T. L. 2005. Theory and applications of the analytic network process: decision making with benefits, opportunities, costs, and risks. RWS publications https://www.rwspublications.com/app/download/561417304/Tutorial2003.pdf Saaranen-Kauppinen, A. & Puusniekka, A. 2006. Teemoittelu. Referred 25.3.2016. http://www.fsd.uta.fi/menetelmaopetus/kvali/L7_3_4.html. Saaranen-Kauppinen, A. & Puusniekka, A. 2006. Osallistuva havainnointi. Referred 25.3.2016. http://www.fsd.uta.fi/menetelmaopetus/kvali/L6_4_2.html. Schuh, C. Strohmer M. Easton, S. Hales & M. Triplat, A. 2014. Supplier relationship management: how to maximize vendor value and opportunity. Referred 7.10.2016. Top 5 logistics and procurement trends. 2016. Publication from cormsquare.com blog. Referred 14.10.2016. http://blog.cormsquare.com/top-5-logistics-and-procurement-trends/ Valmet’s Way forward. 2017. Valmet strategy at the company’s website. Referred 29.3.2017 http://www.valmet.com/about-us/strategy/valmets-way-forward/ Viewpoint. 2016. Valmet database. Referred 29.9.2016

62
SDM. 2016. Valmet database Referred 29.9.2016 Wilkes, J. Yip, G. Simmons, K. 2011 Performance leadership: managing for flexibility, Journal of Business Strategy, Vol. 32 Iss: 5, pp.22 – 34. Referred 24.1.2017


![Resiliency Massport - Transportation Research Boardonlinepubs.trb.org/onlinepubs/conferences/2015/Climate... · HURRICANE CATEGORY 2 HURRICANES CATEGORY 3 HURRICANES Hurricane Sandy[1]:](https://static.documents.pub/doc/80x56/5f0d32247e708231d43924ac/resiliency-massport-transportation-research-hurricane-category-2-hurricanes-category.jpg)


![Category 4: Upstream Transportation and · PDF fileTechnical Guidance for Calculating Scope 3 Emissions [49] 4 Category 4: Upstream Transportation and Distribution Category description](https://static.documents.pub/doc/80x56/5aaf8abb7f8b9a6b308d6f26/category-4-upstream-transportation-and-guidance-for-calculating-scope-3-emissions.jpg)


