Abstract In the current phase of globalization, the fashion industry is an important sector where firm strategies are frequently oriented towards product personalization – more than product customization – with a reduced price. The fashion industry relates to the ability to provide customized products or services through flexible processes in high volume and at a reasonably low cost, which are currently key variables for the fashion supply chain. Performance concepts – which usually refer to three pillars, i.e., economic, environmental and social ones – are new paradigms in this industrial sector, namely “sustainable” mass customization. This paper proposes a multi-criteria methodological approach for evaluating the performance of the fashion industry based on the Balanced Scorecard (BSC) and the Analytic Network Process (ANP), called ‘MAB’ – Multi-criteria Assessment Balanced Scorecard. Firstly, key performance indicators (KPIs) are evaluated in order to assess the performance level of a typical fashion industry. The development of an index system and methods is aimed to form a set of useful tools for policy-makers to facilitate the transformation of an industrial development mode and support the performance of the fashion industry.
Keywords Innovation, KPIs, BSC, ANP
1. Introduction
The fashion industry is a high value sector supporting a significant number of economies and individual incomes around the world. The measurement of organizational performance is a complex issue, given that performance is a multifaceted phenomenon of which the component elements may have distinct managerial priorities and may even be mutually inconsistent [1]. As discussed by De Felice and Petrillo [2], it is necessary to optimize and improve a company’s productivity in order to achieve a high level of performance.
In particular, in the current phase of globalization and market liberalization, competition among fashion firms is growing. In fact, in the fashion industry, demand forecasting is particularly complex: companies operate with a large variety of short life-cycle products, deeply influenced by seasonal sales, promotions, weather conditions, advertising and marketing campaigns, on top of festivities and socio-economic factors [3]. An updated comprehensive review of forecasting techniques in the fashion industry can be found in Nenni et al. [4].
Accordingly, fashion firms have been developing their strategic measurements to improve their organizational
Fabio De Felice and Antonella Petrillo: Key Success Factors for Organizational Innovation in the Fashion Industry 1www.intechopen.com
ARTICLE
www.intechopen.com Int. j. eng. bus. manag., 2013, Vol. 5, Special Issue Innovations in Fashion Industry, 27:2013
performance and competitive advantage. A measure of efficiency provides a good indicator of the success or otherwise of a fashion firm in a competitive market.
To achieve competitiveness and to reduce market reaction times, business process management has become a significant element of day-today operations.
Given the complexity of the problem, several researchers promote the use of multiple perspectives and multiple measures of organizational performance [5],[6], such as the BSC as introduced by Kaplan and Norton [7]. The BSC provides an enterprise view of an organization’s overall performance. It integrates financial measures with other key performance indicators around customer perspectives, internal business processes, and organizational growth, learning and innovation [8]. Almost 50% of the 1,000 fortune firms are using the BSC system.
The BSC gives a full picture as to whether a company is meeting its objectives. Moreover, using BSCs allows for stakeholders to determine the health of short-, medium- and long-term objectives at a glance.
On the contrary, BSC performance is subjective and cause-effect relationships are not clear. It is necessary to assign non-equal priorities to perspectives and performance indicators within each perspective. Thus, addressing the complex issues of a balanced system of performance assessment is not simple.
From this point of view, several researchers propose integrated frameworks that are useful to improving the BSC method.
One of the methods that can address the complex issues of a balanced system of performance assessment is the Analytic Hierarchy Process (AHP), as developed by Saaty [9]. In the present paper, we present a model based on the ANP, a generalization of the AHP [10].
In addition to the ANP, there are a lot of decision-making tools such as MACBETH (Measuring Attractiveness by a Categorical-Based Evaluation Technique) [11], ELECTRE (ELimination and Choice Expressing Reality) [12] and PROMETHEE (Preference Ranking Organization Method for Enrichment Evaluations) [13].
However, in the present study we propose the ANP because it is useful in prioritizing decision alternatives and it may be the most widely-used technique for multi-criteria decision-making [14]. In fact, the ANP is useful in a BSC analysis because the BSC, while considering several relevant dimensions of organizational performance, does not formally explain how to weight their importance within a comprehensive framework.
The contribution of our paper is to present the integration of two methodologies, the BSC – a multiple perspective framework for performance assessment – and the ANP – a decision-making tool to prioritize multiple performance perspectives and indicators and to generate a unified metric for the ranking of alternatives.
In this paper we use the ANP model to analyse in detail the strategic performance of a fashion firm in Italy, we and proposes the use of the ANP to prioritize all of the measures and strategies within a BSC framework.
The paper is organized as follows: (a) Section 2 presents the literature review, including a short presentation on the applications of the BSC and ANP models; (b) Section 3 illustrates the BSC and presents the ANP; (c) Section 4 illustrates a performance scoring framework that combines the BSC and ANP models, including an application of this framework to a sample of a fashion firm; and (d) Section 5 analyses the conclusions and the discussion.
2. Literature review: Framework for the application of the BSC and ANP models
Some studies present joint applications of either the AHP or the ANP with BSC. Here, we give a brief literature analysis. Our aim is not to propose a complete literature analysis, because there are a lot of studies on this research field; rather, we want to report the major works that characterize the evolution of applications about BSC and the AHP/ANP.
For instance, Bentes et al. [15] use the AHP to build a decision-making hierarchy in order provide a better assessment of the (relative) performance of organizational units within a Brazilian telecommunications company according to the four perspectives defined by the BSC approach.
Viglas et al. [16] combine BSC and the ANP to select a Quality Management Information System for a large Greek retailer.
Wu et al. [17] evaluate the business performance of wealth management banks in Taiwan by applying the AHP and grey relational analysis (GRA) according to the BSC approach.
Huang et al. [18] present the use of the AHP to prioritize all of the measures and strategies within a BSC framework; in a different work, Huang proposes an integrated approach for the BSC tool and a knowledge-based system using the AHP method [19].
Yuan and Chiu [20] develop a case-based reasoning (CBR) system to assist in assigning the appropriate weights according to the BSC design. They compare the results of a genetic algorithm (GA) mechanism and the AHP approach.
Int. j. eng. bus. manag., 2013, Vol. 5, Special Issue Innovations in Fashion Industry, 27:2013
2 www.intechopen.com
Jovanovic and Krivokapic [21] use AHP to identify key performance indicators from the perspectives of the BSC.
Leung et al. [22] demonstrate a BSC framework with the aid of the AHP while considering traditional problems in implementation, such as the dependence relationships among its attributes and the need to use objective and subjective measures.
Ravi et al. [23] propose an ANP model in which the dimensions of the reverse logistics for the EOL computers
have been taken from the four perspectives of the BSC.
Finally, Poveda-Bautista et al. [24] propose a methodology, based on the ANP and the BSC and as applied in industrial competitiveness measurement, following the proposal of Ellis et al. [25], who suggest that the measurement’s indicators depend upon the type of industrial sector and the competitiveness level perceived by each sector.
Our research on BSC/ANP is different to the previous applications because we propose an ANP model that respects the BSC structure model but, at the same time, allows us to measure the weights of the different indicators. Thus, our aim is not to change the BSC model but rather to improve it in the phase of measurement.
3. Theoretical approach: MAB – Multi-criteria Assessment Balanced Scorecard.
In this section, we focus our attention on the BSC and the ANP in order to analyse the main features of each methodology.
3.1 The Balanced Scorecard
The BSC method proposes reaching the final goal of the organization, such that business profitability is assessed according to many aspects (financially and non-financially). The BSC is a series of financial evaluation indices and a non-financial evaluation system. It has emerged as a decision support tool at the strategic management level. Many companies are adopting the BSC as the foundation for their strategic management systems.
Kaplan and Norton [26] classified a typical BSC according to four perspectives, as follows: (a) the financial perspective; (b) the customer’s perspective; (c) the internal process perspective, including the internal business perspective; and (d) the innovative perspective.
Elaborating, the key features of each perspective are: (a) the financial perspective indicates whether a company’s strategy, implementation and execution are contributing to bottom-line improvement. The measurement criteria are usually profit, cash flow, ROI, return on invested capital, and economic value added; (b) the customer’s perspective provides a way for managers to identify the customer and market segments in which the business unit will compete, as well as the measures of the business unit’s performance. To meet the organizational objectives and customers’ expectations, organizations must identify the key business processes at which they must excel; (c) the internal business perspective aims to satisfy shareholders and customers by excelling at a certain business process; and (d) the innovation perspective identifies the infrastructure that the organization must build in order to create long-term improvement (i.e., employee satisfaction, continuity, training and skills, etc.) [27].
The relationships between the four perspectives in the BSC is shown in Figure 1.
Figure 1. Relationships between the four perspectives in the balanced scorecard
Fabio De Felice and Antonella Petrillo: Key Success Factors for Organizational Innovation in the Fashion Industry 3www.intechopen.com
Once the appropriate objectives are identified, the BSC guides the organization to develop reasonable performance measures, and establishes targets, initiatives and alternatives to meet programmatic goals.
Definitively, the BSC is a tool the purpose of which is to align the strategy expressed in the actions actually undertaken with the strategy expressed in the plan. However, the “conventional” BSC does not consolidate the mentioned performance measures, so it is useful to integrate the BSC with other methodologies, such as the multi-criteria methodology, which we will analyse below.
3.2 The Analytic Network Process
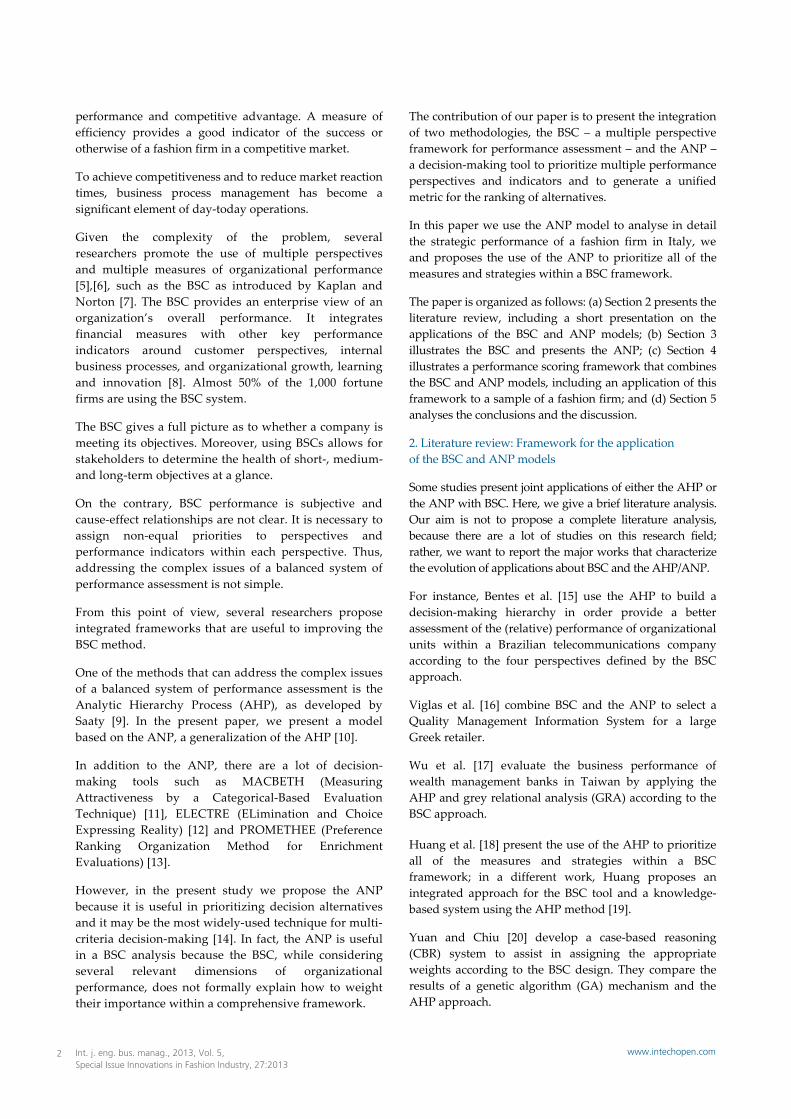
The Analytic Network Process is a multi-criteria decision making (MCDM) tool that takes into account such a complex relationship among parameters (see Figure 2).
The ANP provides a general framework to deal with decisions without making assumptions about the independence of higher-level elements from lower level elements. The ANP model consists of control networks, clusters, elements, an interrelationship between elements, and an interrelationship between clusters (see Figure 2).
The ANP feedback approach replaces hierarchies with networks, in which the relationships between levels are not easily represented as higher or lower, dominant or subordinate, direct or indirect.
The determination of the relative weights in the ANP is based on the pairwise comparison conducted with respect to their relative importance towards their control criterion. The ANP uses a 9-point scale for comparison, namely: unimportant (1); somewhat important (3); important (5); very important (7); and extremely important (9).
The fundamental scale that represents the dominance of one element over another is an absolute scale, and the priorities derived from it are normalized or idealized to again yield an absolute scale.
Figure 2. ANP dependence (inner and outer) proposed by Saaty
The result of the comparison is the so-called ‘dominance coefficient’, aij, which represents the relative importance of the component on row (i) over the component on column (j) (i.e., aij=wi/wj). The pairwise comparisons can be represented in the form of a matrix.
In matrix A, the problem becomes one of assigning to m elements A1, A2, …, Am a set of numerical weights w1, w2, …, wm that reflects the recorded judgments. If A is a consistency matrix, the relations between weights wi and wj and judgments aij are simply given by aij = wi/wj (for i, j = 1, 2, …, m) and:
w1/w1 w1/w2 w1/wm
A1 w2/w1 w2/w2 w2/wm
A= A2
… … … … …
Am wm/w1 wm/w2 … wm/wm
If matrix w is a non-zero vector, there is a λmax of Aw = λmaxw, which is the largest eigenvalue of matrix A. If matrix A is perfectly consistent, then λmaxw = m. Since aij denotes the subjective judgment of decision-makers Ax = λmaxw cannot be set up. Accordingly, the judgment matrix of the traditional ANP always needs to be revised for its consistency.
After all pairwise comparisons are completed, the priority weight vector (w) is computed as the unique solution of Aw = λmaxw, where λmax is the largest eigenvalue of matrix A.
Judgments are usually inconsistent. Saaty [28] proposed utilizing a consistency index (CI) to verify the consistency of the comparison matrix. The consistency index (CI) of the derived weights could then be calculated by: CI = (λmax−n)/ n−1. In general, if CI is less than 0.10, the satisfaction of the judgments may be derived. Otherwise, it will be necessary to re-adjust the judgment matrix.
The elements in the ANP are the entities in the system that interacts with each other.
As mentioned above, the determination of the relative weights is based on pairwise comparison. The weights are then put into the supermatrix, which represents the interrelationships of the elements in the system.
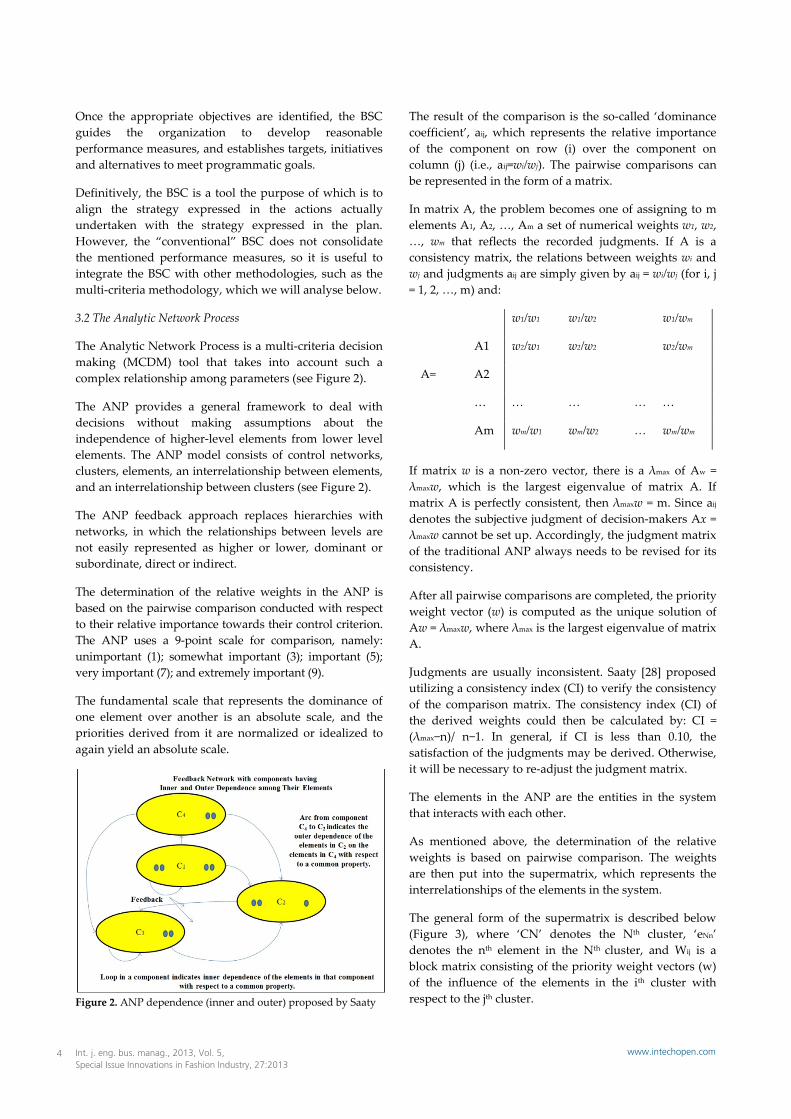
The general form of the supermatrix is described below (Figure 3), where ‘CN’ denotes the Nth cluster, ‘eNn’ denotes the nth element in the Nth cluster, and Wij is a block matrix consisting of the priority weight vectors (w) of the influence of the elements in the ith cluster with respect to the jth cluster.
Int. j. eng. bus. manag., 2013, Vol. 5, Special Issue Innovations in Fashion Industry, 27:2013
4 www.intechopen.com
Figure 3. Supermatrix
If the ith cluster has no influence on the ith cluster itself, Wij becomes zero. The supermatrix obtained is called the ‘initial supermatrix’.
The initial supermatrix consists of several eigenvectors, each of which sums to one. The clusters in the initial supermatrix must be weighted and transformed into a matrix in which each of its columns sums to unity.
In the final step, the weighted supermatrix is raised to a limiting power to get the global priority vectors, as in Function (1):
lim������� (1)
4. The proposed BSC/ANP scoring framework
The aim of our study is to construct an approach based on the ANP and BSC for creating a method for the evaluation of enterprises’ performances.
This study has established the performance evaluation network structure for the fashion industry using the ANP approach while incorporating the basic elements of a proper BSC design.
The model is based on consideration that integration between the different company functions, are the success for each kind of company working in a complex scenario [29].
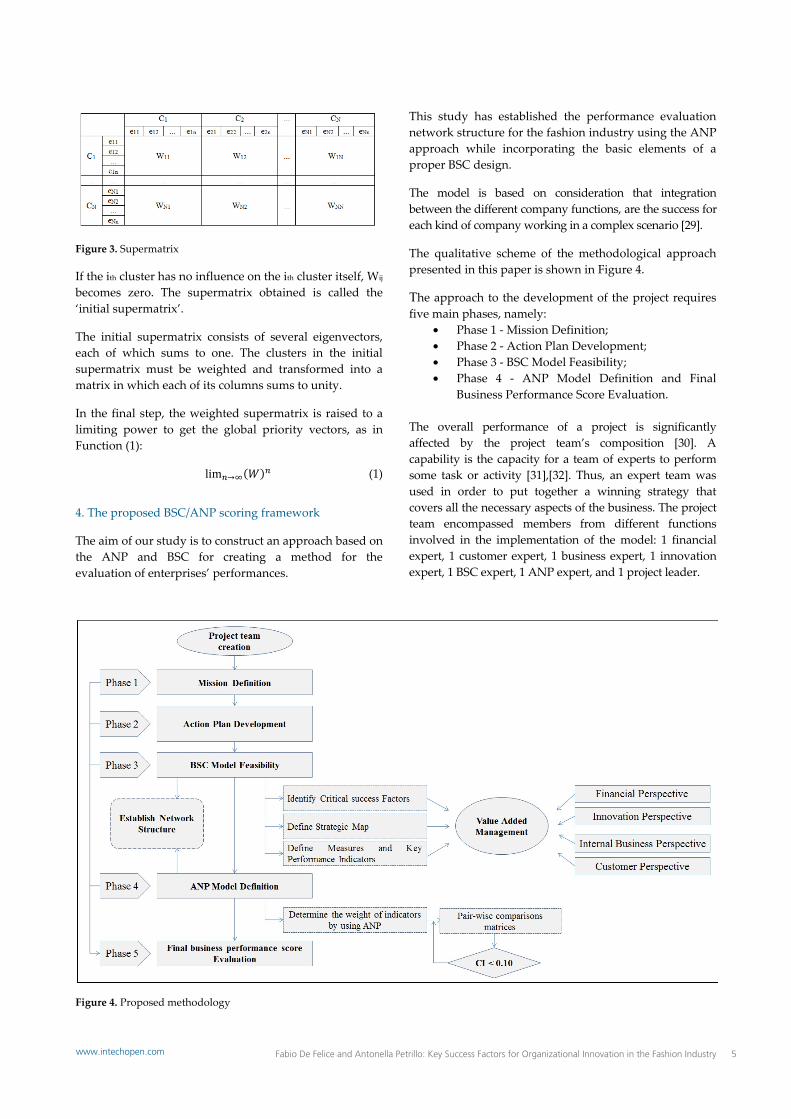
The qualitative scheme of the methodological approach presented in this paper is shown in Figure 4.
The approach to the development of the project requires five main phases, namely:
• Phase 1 - Mission Definition; • Phase 2 - Action Plan Development; • Phase 3 - BSC Model Feasibility; • Phase 4 - ANP Model Definition and Final
Business Performance Score Evaluation.
The overall performance of a project is significantly affected by the project team’s composition [30]. A capability is the capacity for a team of experts to perform some task or activity [31],[32]. Thus, an expert team was used in order to put together a winning strategy that covers all the necessary aspects of the business. The project team encompassed members from different functions involved in the implementation of the model: 1 financial expert, 1 customer expert, 1 business expert, 1 innovation expert, 1 BSC expert, 1 ANP expert, and 1 project leader.
Figure 4. Proposed methodology
Fabio De Felice and Antonella Petrillo: Key Success Factors for Organizational Innovation in the Fashion Industry 5www.intechopen.com
In the following paragraphs, the different phases are analysed.
4.1 Phase 1 - Mission Definition
The fashion industry is one of the most globalized industries and so a competitive strategy of higher value is becoming increasingly important [33],[34].
The mission of the present work is to propose a “tool” that is useful in identifying the fashion industry’s capabilities linked to the distinctive characteristics of any products/services, and at breaking up these capabilities into critical processes and their constituent activities.
To demonstrate the applicability of the proposed methodology to the fashion industry, it has been used to assess the competitiveness of a “typical” fashion industry during four different periods of time.
The aim is to obtain a structured indexing system that is useful in comparing the company’s performance in the fashion sector.
4.2 Phase 2 - Action Plan Development
The goal of this phase is to identify what competencies and resources are involved in performing critical processes. For this purpose, a structured and repeatable action plan of the activities was performed (as is shown in Table 1).
4.3 Phase 3 - BSC Model Feasibility
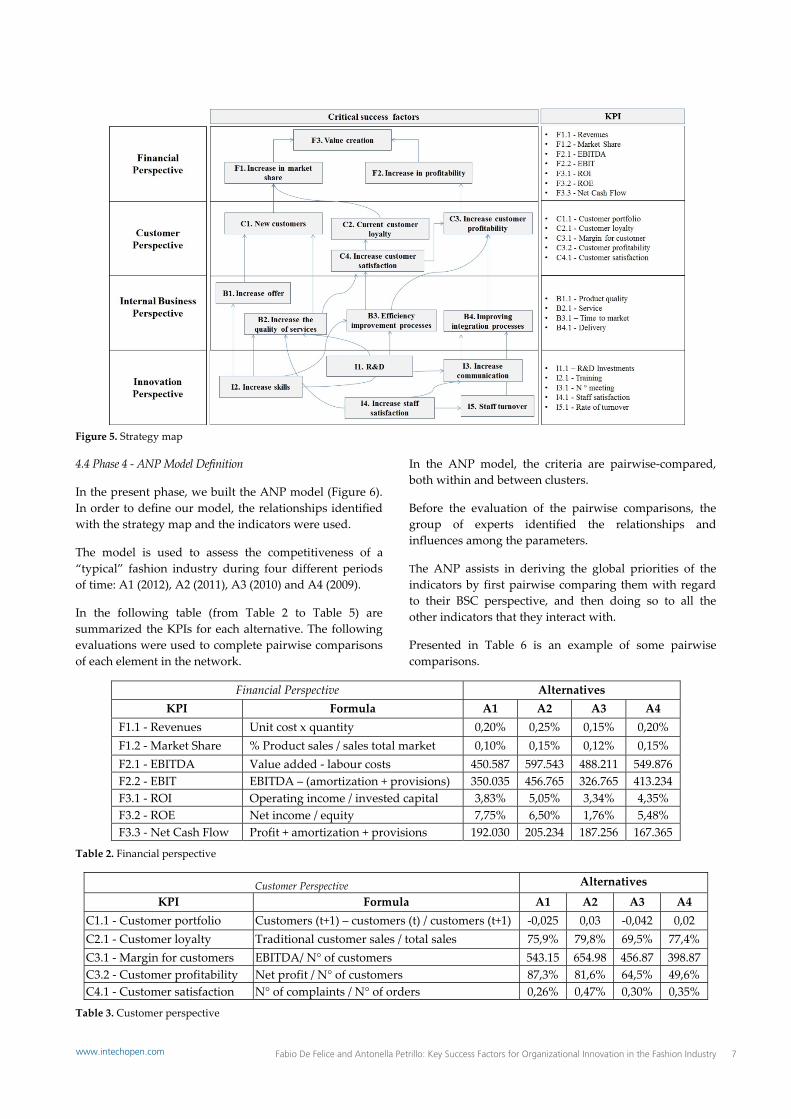
In this phase, a strategy map was built. The strategy map helps to ensure a more successful strategy because it explains how the strategy will bring about change.
Figure 5 represents the strategy map and shows the relationship among the components: Financial Perspective; Customer Perspective; Internal Business Perspective; and Innovation Perspective.
These relationships are used to define KPIs for each component.
An expert team selected the indicators that better represent the expectations of the fashion industry and the factors that more significantly affect competitive performance.
A total of 21 indicators (KPIs) were finally selected and grouped according to the four BSC aspects.
Dimension Goals KPI Targets Initiatives
Financial Perspective
F1. Increase in market share F2. Increase in profitability F3. Value creation
I1.1 – R&D investments I2.1 - Training I3.1 - N ° meeting I4.1 - Staff satisfaction I5.1 - Rate of turnover
TI1 + 23% TI2 + 25% TI3 + 32% TI4 + 20% TI5 + 33%
II1 Motivate staff II2 Optimize R&D
Table 1. Action plan development
Int. j. eng. bus. manag., 2013, Vol. 5, Special Issue Innovations in Fashion Industry, 27:2013
6 www.intechopen.com
Figure 5. Strategy map
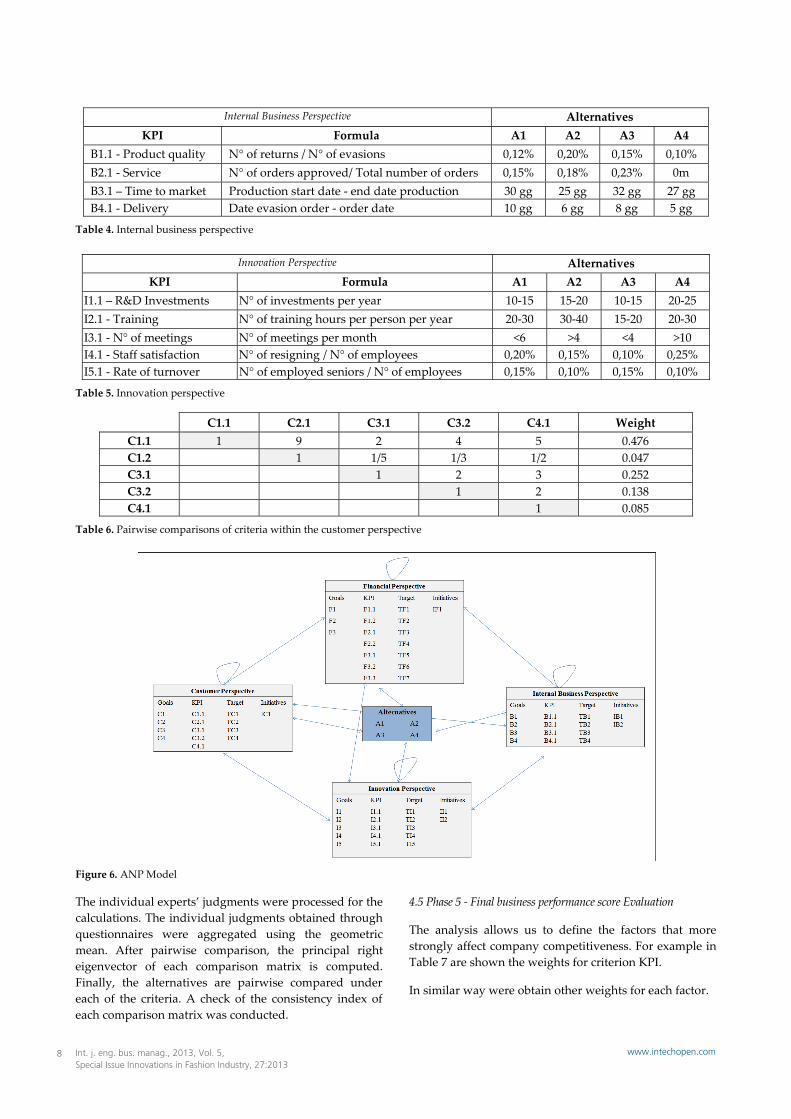
4.4 Phase 4 - ANP Model Definition
In the present phase, we built the ANP model (Figure 6). In order to define our model, the relationships identified with the strategy map and the indicators were used.
The model is used to assess the competitiveness of a “typical” fashion industry during four different periods of time: A1 (2012), A2 (2011), A3 (2010) and A4 (2009).
In the following table (from Table 2 to Table 5) are summarized the KPIs for each alternative. The following evaluations were used to complete pairwise comparisons of each element in the network.
In the ANP model, the criteria are pairwise-compared, both within and between clusters.
Before the evaluation of the pairwise comparisons, the group of experts identified the relationships and influences among the parameters.
The ANP assists in deriving the global priorities of the indicators by first pairwise comparing them with regard to their BSC perspective, and then doing so to all the other indicators that they interact with.
Presented in Table 6 is an example of some pairwise comparisons.
Financial Perspective Alternatives KPI Formula A1 A2 A3 A4
F1.1 - Revenues Unit cost x quantity 0,20% 0,25% 0,15% 0,20% F1.2 - Market Share % Product sales / sales total market 0,10% 0,15% 0,12% 0,15% F2.1 - EBITDA Value added - labour costs 450.587 597.543 488.211 549.876 F2.2 - EBIT EBITDA – (amortization + provisions) 350.035 456.765 326.765 413.234 F3.1 - ROI Operating income / invested capital 3,83% 5,05% 3,34% 4,35% F3.2 - ROE Net income / equity 7,75% 6,50% 1,76% 5,48% F3.3 - Net Cash Flow Profit + amortization + provisions 192.030 205.234 187.256 167.365
Table 2. Financial perspective
Customer Perspective Alternatives
KPI Formula A1 A2 A3 A4C1.1 - Customer portfolio Customers (t+1) – customers (t) / customers (t+1) -0,025 0,03 -0,042 0,02 C2.1 - Customer loyalty Traditional customer sales / total sales 75,9% 79,8% 69,5% 77,4% C3.1 - Margin for customers EBITDA/ N° of customers 543.15 654.98 456.87 398.87 C3.2 - Customer profitability Net profit / N° of customers 87,3% 81,6% 64,5% 49,6% C4.1 - Customer satisfaction N° of complaints / N° of orders 0,26% 0,47% 0,30% 0,35%
Table 3. Customer perspective
Fabio De Felice and Antonella Petrillo: Key Success Factors for Organizational Innovation in the Fashion Industry 7www.intechopen.com
Internal Business Perspective Alternatives KPI Formula A1 A2 A3 A4
B1.1 - Product quality N° of returns / N° of evasions 0,12% 0,20% 0,15% 0,10% B2.1 - Service N° of orders approved/ Total number of orders 0,15% 0,18% 0,23% 0m B3.1 – Time to market Production start date - end date production 30 gg 25 gg 32 gg 27 gg B4.1 - Delivery Date evasion order - order date 10 gg 6 gg 8 gg 5 gg
Table 4. Internal business perspective
Innovation Perspective Alternatives
KPI Formula A1 A2 A3 A4I1.1 – R&D Investments N° of investments per year 10-15 15-20 10-15 20-25 I2.1 - Training N° of training hours per person per year 20-30 30-40 15-20 20-30 I3.1 - N° of meetings N° of meetings per month <6 >4 <4 >10 I4.1 - Staff satisfaction N° of resigning / N° of employees 0,20% 0,15% 0,10% 0,25% I5.1 - Rate of turnover N° of employed seniors / N° of employees 0,15% 0,10% 0,15% 0,10%
Table 6. Pairwise comparisons of criteria within the customer perspective
Figure 6. ANP Model
The individual experts’ judgments were processed for the calculations. The individual judgments obtained through questionnaires were aggregated using the geometric mean. After pairwise comparison, the principal right eigenvector of each comparison matrix is computed. Finally, the alternatives are pairwise compared under each of the criteria. A check of the consistency index of each comparison matrix was conducted.
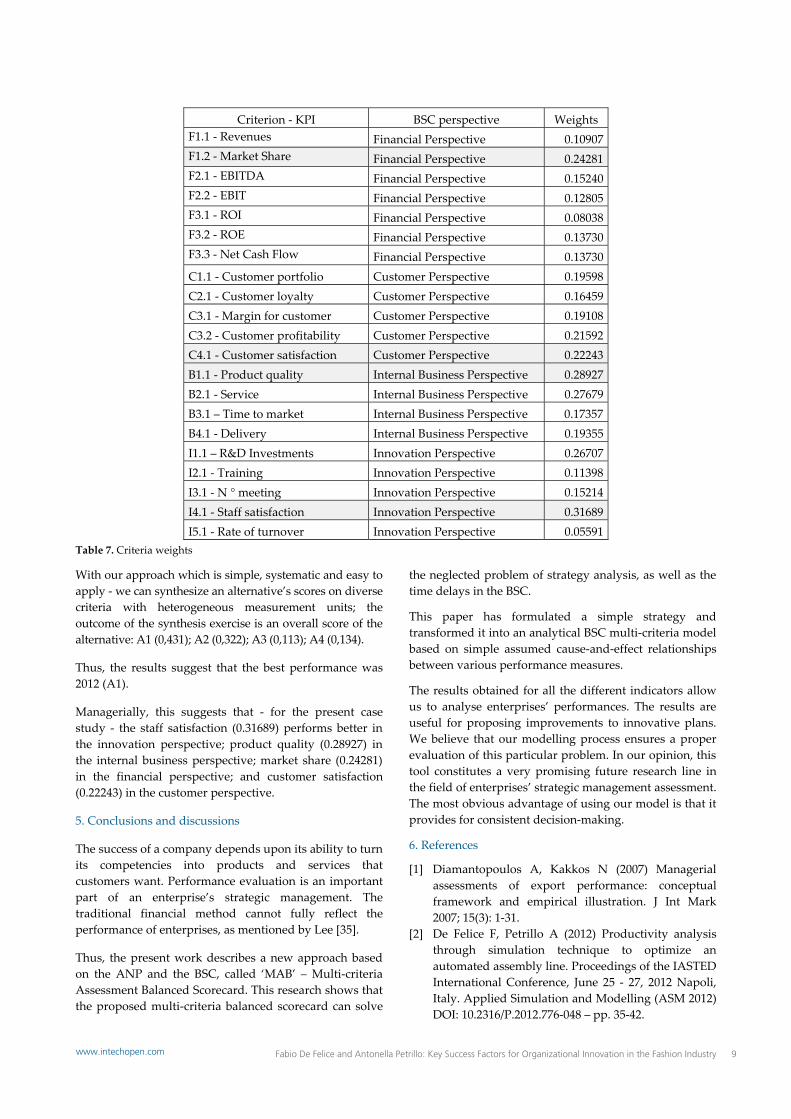
4.5 Phase 5 - Final business performance score Evaluation
The analysis allows us to define the factors that more strongly affect company competitiveness. For example in Table 7 are shown the weights for criterion KPI.
In similar way were obtain other weights for each factor.
Int. j. eng. bus. manag., 2013, Vol. 5, Special Issue Innovations in Fashion Industry, 27:2013
With our approach which is simple, systematic and easy to apply - we can synthesize an alternative’s scores on diverse criteria with heterogeneous measurement units; the outcome of the synthesis exercise is an overall score of the alternative: A1 (0,431); A2 (0,322); A3 (0,113); A4 (0,134).
Thus, the results suggest that the best performance was 2012 (A1).
Managerially, this suggests that - for the present case study - the staff satisfaction (0.31689) performs better in the innovation perspective; product quality (0.28927) in the internal business perspective; market share (0.24281) in the financial perspective; and customer satisfaction (0.22243) in the customer perspective.
5. Conclusions and discussions
The success of a company depends upon its ability to turn its competencies into products and services that customers want. Performance evaluation is an important part of an enterprise’s strategic management. The traditional financial method cannot fully reflect the performance of enterprises, as mentioned by Lee [35].
Thus, the present work describes a new approach based on the ANP and the BSC, called ‘MAB’ – Multi-criteria Assessment Balanced Scorecard. This research shows that the proposed multi-criteria balanced scorecard can solve
the neglected problem of strategy analysis, as well as the time delays in the BSC.
This paper has formulated a simple strategy and transformed it into an analytical BSC multi-criteria model based on simple assumed cause-and-effect relationships between various performance measures.
The results obtained for all the different indicators allow us to analyse enterprises’ performances. The results are useful for proposing improvements to innovative plans. We believe that our modelling process ensures a proper evaluation of this particular problem. In our opinion, this tool constitutes a very promising future research line in the field of enterprises’ strategic management assessment. The most obvious advantage of using our model is that it provides for consistent decision-making.
6. References
[1] Diamantopoulos A, Kakkos N (2007) Managerial assessments of export performance: conceptual framework and empirical illustration. J Int Mark 2007; 15(3): 1-31.
[2] De Felice F, Petrillo A (2012) Productivity analysis through simulation technique to optimize an automated assembly line. Proceedings of the IASTED International Conference, June 25 - 27, 2012 Napoli, Italy. Applied Simulation and Modelling (ASM 2012) DOI: 10.2316/P.2012.776-048 – pp. 35-42.
Fabio De Felice and Antonella Petrillo: Key Success Factors for Organizational Innovation in the Fashion Industry 9www.intechopen.com
[3] Fumi A, Pepe A, Scarabotti L, Schiraldi, MM (2013) Fourier analysis for demand forecasting in fashion company. International Journal of Engineering Business Management (in press).
[4] Nenni ME, Giustiniano L, Pirolo, L (2013) Demand forecasting in the fashion industry: a review. International Journal of Engineering Business Management (in press).
[5] Battistoni E, Fronzetti Colladon A, Mercorelli G (2013) Prominent determinants of consumer based brand equity. International Journal of Engineering Business Management (in press).
[6] Battista C, Schiraldi, MM (2013) The logistic maturity model: application to a fashion company. International Journal of Engineering Business Management (in press).
[7] Kaplan R, Norton D (2001) The strategy-focused organization: how balanced scorecard companies thrive in the new business environment. Harvard Business School Press, Boston. Massachusetts, ISBN 1-57851-250-6.
[8] Banker RD, Chang H, Janakiraman SN, Konstans C (2004) A balanced scorecard analysis of performance metrics. European Journal of Operational Research 154: 423–436.
[9] Saaty T (1980) The Analytic Hierarchy Process. McGraw-Hill, New York.
[10] Saaty TL (2001) The Analytic Network Process, 2nd ed Vol. IX. RWS Publications, Pittsburgh.
[11] Vincke PH (1992) Multicriteria decision-aid. John Wiley & Sons, New York.
[12] Roy B (1968) Classement et choix en présence de points de vue multiple (la méthode ELECTRE). La Revue d'Informatique et de Recherche Opérationelle (RIRO); 2: 57–75.
[13] Brans JP, Macharis C, Mareschal B (1997) The GDSS Promethee. Vrije Universiteit Brussel, STOOTW/277
[14] Saaty, TL (2005) Theory and Applications of the Analytic Network Process: Decision Making with Benefits, Opportunities, Costs, and Risks. RWS Publications, Pittsburgh.
[15] Bentes AV, Carneiro J, Ferreira da Silva J, Kimura H (2012) Multidimensional assessment of organizational performance: Integrating BSC and AHP. Journal of Business Research 2012; 65: 1790–1799.
[16] Viglas K, Fitsilis P, Kameas A (2011) An integrated approach for selecting information systems: a case study. Technology and Investment 2011; 2: 142–153.
[17] Wu CR, Lin CT, Tsai PH (2010) Evaluating business performance of wealth management banks. European Journal of Operational Research 2010; 207: 971–979.
[18] Huang HC, Lai MC, Lin LH (2011) Developing strategic measurement and improvement for the biopharmaceutical firm: Using the BSC hierarchy. Expert Systems with Applications 38; 2011: 4875–4881.
[19] Huang, HC (2009) Designing a knowledge-based system for strategic planning: A balanced scorecard perspective. Expert Systems with Applications 2009; 36: 209–218.
[20] Yuan FC, Chiu C (2009) A hierarchical design of case-based reasoning in the balanced scorecard application. Expert Systems with Applications 36; 2009: 333–342.
[21] Jovanovic J, Krivokapic Z (2008) AHP in implementation of Balanced Scorecard. International Journal for Quality Research 2(1), 59-67.
[22] Leung LC, Lam KC, Cao D (2006). Implementing the balanced scorecard using the analytic hierarchy process & the analytic network process. Journal of the Operational Research Society 2006; 57: 682–691.
[23] Ravia V, Shankara R, Tiwari MK (2005) Analyzing alternatives in reverse logistics for end-of-life computers: ANP and balanced scorecard approach. Computers & Industrial Engineering 2005; 48: 327–356.
[24] Poveda-Bautista R, Baptista DC, García-Melón, M (2012) Setting competitiveness indicators using BSC and ANP. International Journal of Production Research 2012; 50(17): 4738-4752..
[25] Ellis S, Elnatha D, Raz T (2002) Applying benchmarking: an organizational learning perspective. Human System Management 2002; 21 (3): 183-191 IOS Press.
[26] Kaplan R, Norton D (1992) The balanced scorecard: measures that drive performance, Harvard Business Review 1992; 70: 71–79.
[27] Sainaghi R, Phillips P, Corti V (2013) Measuring hotel performance: Using a balanced scorecard perspectives’ approach. International Journal of Hospitality Management 2013; 34: 150– 159.
[28] Saaty TL. (1990) How to make a decision: The analytic hierarchy process. European Journal of Operations Research 1990; 48: 9–26.
[29] Iannone R, Ingenito A, Martino G, Miranda S, Pepe C, Riemma S (2013) Merchandise and replenishment planning optimization for fashion retail. International Journal of Engineering Business Management (in press).
[30] De Felice F (2012) Editorial Research and applications of AHP/ANP and MCDA for decision making in manufacturing. International Journal of Production Research 2012; 50 (17),: 4735–4737.
[31] Cannavacciuolo L, Iandoli L, Ponsiglione C, Zollo G (2012) An analytical framework based on AHP and activity-based costing to assess the value of competencies in production processes. International Journal of Production Research 2012; 50(17): 4877-4888.
[32] Cricelli L, Grimaldi M (2009) Intangible asset contribution to company performance: The
Int. j. eng. bus. manag., 2013, Vol. 5, Special Issue Innovations in Fashion Industry, 27:2013
10 www.intechopen.com
"hierarchical assessment index". VINE the Journal of Information and Knowledge Management Systems, Emerald Group Publishing Limited, United Kingdom, Volume 39, Issue 1, 10 April 2009, Pages 40-54.
[33] De Carlo F, Borgia O, Tucci M (2013) Bucket brigades to increase productivity in a luxury assembly line. International Journal of Engineering Business Management (in press).
[34] De Carlo F, Arleo MA, Borgia O, Tucci M (2013) Layout design for a low capacity manufacturing line: a case study. International Journal of Engineering Business Management (in press).
[35] Lee MC (2007) A Method of Performance Evaluation by Using the Analytic Network Process and Balanced Score Car (2007) International Conference on Convergence Information Technology, 21-23 Nov. 2007, pp. 235 – 240.
Fabio De Felice and Antonella Petrillo: Key Success Factors for Organizational Innovation in the Fashion Industry 11www.intechopen.com