81
Statistics report Key World Energy Statistics 2020 August 2020
Statistics report
Key World Energy Statistics 2020
August 2020

KEY WORLD ENERGY STATISTICS
Please note that this publication is subject to specific restrictions that limit
its use and distribution. The terms and conditions are available online at
iea.org/t&c/
Source: IEA. All rights reserved.
International Energy Agency Website: iea.org
Australia Austria BelgiumCanadaCzech Republic DenmarkEstoniaFinland France Germany
Greece HungaryIreland ItalyJapanKorea Luxembourg Mexico Netherlands New Zealand
NorwayPoland Portugal Slovak Republic Spain Sweden Switzerland Turkey United Kingdom United States
INTERNATIONAL ENERGY AGENCY
The IEA examines the full spectrum of energy issues including oil, gas and coal supply and demand, renewable energy technologies, electricity markets, energy efficiency, access to energy, demand side management and much more. Through its work, the IEA advocates policies that will enhance the reliability, affordability and sustainability of energy in its 30 member countries, 8 association countries and beyond.
IEA membercountries
The European Commission also participates in the work of the IEA
IEA associationcountries
BrazilChinaIndia
IndonesiaMoroccoSingapore
South AfricaThailand
*
3
Foreword
The International Energy Agency (IEA) was established in 1974 to promote energy security and provide authoritative analysis on energy for its member countries and beyond. Energy statistics have always been and remain at the heart of the work of the IEA. They provide a comprehensive view on energy production, transformation and final use for all forms of energy as well as the factors that influence energy choices such as prices and RD&D and the wider impact of energy use on CO2 emissions. Over the years with input from energy statisticians all around the world, the IEA has gained recognition as the world’s most authoritative source for energy statistics.
Energy statistics are produced to be used: to monitor changes in energy production and use; inform debate; and provide a wider understanding of energy, including helping countries understand their energy transitions. In Key World Energy Statistics (KWES), we look to highlight some of the key facts and trends from across the vast number of datasets the IEA produces to enable everyone to know more about energy. As part of the IEA modernisation programme, KWES contains more information on energy efficiency and renewables, more geographic data – including on the “IEA Family”, created through our “Open Doors” policy – and more of the key data to better understand energy security – the heart of our work.
Because energy plays such a vital role in our lives today, I hope that these statistics will not only inform but also help policy makers and others to make wise decisions so that energy is produced and consumed in a secure, affordable, efficient, and sustainable manner. As I like to say, in the world of energy, data always wins. This has never been more true than it is today, with the world economy undergoing significant structural change as a consequence of Covid-19. I would therefore like to thank the whole team in the IEA’s Energy Data Centre under the outstanding leadership of Nick Johnstone for their work in ensuring we all have the data needed to gain a comprehensive understanding of energy today so that we can better plan for tomorrow.
Dr. Fatih Birol Executive Director, International Energy Agency
KWES is a summary of the comprehensive data made available by the IEA via its website: www.iea.org/statistics/.

4
Table of contents
5
Supply 6
Transformation 26
Final consumption 34
Energy efficiency 44
Energy balances 46
Prices 50
Emissions 54
Research, development and demonstration (RD&D) 56
Outlook 58
Energy indicators 60
Conversion factors 70
Glossary 73

Supply Key World Energy Statistics
6
World total energy supply (TES) by source
World¹ TES from 1971 to 2018 by source (Mtoe)
1973 and 2018 source shares of TES
1973 2018
6 098 Mtoe 14 282 Mtoe
02 0004 0006 0008 000
10 00012 00014 00016 000
1971 1975 1980 1985 1990 1995 2000 2005 2010 2015 2018
Coal² Oil Natural gasNuclear Hydro Biofuels and wasteOther³
Coal² 24.5%
Oil 46.2%
Natural gas
16.0%
Nuclear 0.9%
Hydro 1.8%
Biofuels and waste10.5%
Other³ 0.1%
Coal² 26.9%
Oil 31.6%
Natural gas
22.8%
Nuclear 4.9%
Hydro 2.5%
Biofuels and waste
9.3%
Other³ 2.0%
1. World includes international aviation and international marine bunkers. 2. In these graphs, peat and oil shale are aggregated with coal.
3. Includes geothermal, solar, wind, tide/wave/ocean, heat and other sources. Source: IEA, World Energy Balances, 2020.
Key World Energy Statistics Supply
7
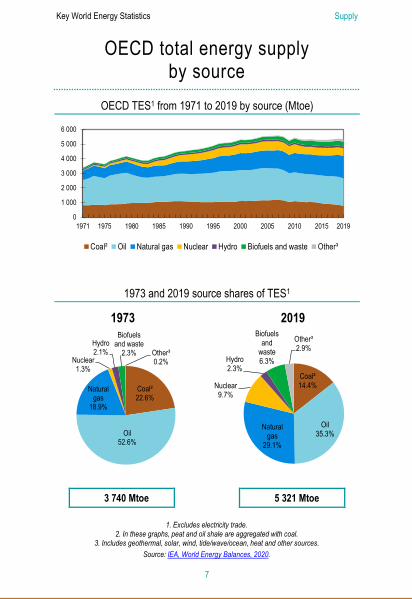
OECD total energy supply by source
OECD TES1 from 1971 to 2019 by source (Mtoe)
1973 and 2019 source shares of TES1
1973 2019
3 740 Mtoe 5 321 Mtoe
0
1 000
2 000
3 000
4 000
5 000
6 000
1971 1975 1980 1985 1990 1995 2000 2005 2010 2015 2019
Coal² Oil Natural gas Nuclear Hydro Biofuels and waste Other³
Coal²22.6%
Oil52.6%
Natural gas
18.9%
Nuclear1.3%
Hydro2.1%
Biofuels and waste
2.3% Other³0.2%
Coal²14.4%
Oil35.3%
Natural gas
29.1%
Nuclear9.7%
Hydro2.3%
Biofuels and
waste6.3%
Other³2.9%
1. Excludes electricity trade. 2. In these graphs, peat and oil shale are aggregated with coal.
3. Includes geothermal, solar, wind, tide/wave/ocean, heat and other sources. Source: IEA, World Energy Balances, 2020.

Supply Key World Energy Statistics
8
World total energy supply by region
World TES from 1971 to 2018 by region (Mtoe)
1973 and 2018 regional shares of TES
1973 2018
6 098 Mtoe 14 282 Mtoe
02 0004 0006 0008 000
10 00012 00014 00016 000
1971 1975 1980 1985 1990 1995 2000 2005 2010 2015 2018
OECD Middle EastNon-OECD Europe and Eurasia ChinaNon-OECD Asia¹ Non-OECD AmericasAfrica Bunkers²
OECD 61.3%
Middle East 0.8%
Non-OECD Europe
and Eurasia15.5%
China 7.0%
Non-OECD Asia¹ 5.5%
Non-OECD
Americas 3.5%
Africa 3.4% Bunkers²
3.0%
OECD 37.5%
Middle East 5.3%
Non-OECD Europe
and Eurasia8.1%
China 22.5%
Non-OECD Asia¹
13.5%
Non-OECD
Americas 4.2%
Africa 5.9%
Bunkers² 3.0%
1. Non-OECD Asia excludes China. 2. Includes international aviation and international marine bunkers.
Source: IEA, World Energy Balances, 2020.

Key World Energy Statistics Supply
9
World total energy supply by region
World TES from 1971 to 2018 by region (Mtoe)
1973 and 2018 regional shares of TES
1973 2018
6 098 Mtoe 14 282 Mtoe
02 0004 0006 0008 000
10 00012 00014 00016 000
1971 1975 1980 1985 1990 1995 2000 2005 2010 2015 2018IEA¹ IEA Association countries¹IEA Accession countries¹ Other countries¹Bunkers²
IEA¹61.1%
IEA Association countries¹
12.8%
IEA Accession countries¹
0.1%
Other countries¹
23.0%
Bunkers² 3.0%
IEA¹37.0%
IEA Association countries¹
34.7%
IEA Accession countries¹
0.3%
Other countries¹
25.0%
Bunkers² 3.0%
1. Please see geographical coverage for the list of IEA Accession, Association and other countries. 2. Includes international aviation and international marine bunkers.
Source: IEA, World Energy Balances, 2020.

Supply Key World Energy Statistics
10
World total energy supply by geographical region
World TES from 1990 to 2018 by region (Mtoe)
1990 and 2018 regional shares of TES
1990 2018
8 767 Mtoe 14 282 Mtoe
02 0004 0006 0008 000
10 00012 00014 00016 000
1990 1995 2000 2005 2010 2015 2018
Americas Europe Asia Africa Oceania Bunkers¹
Americas29.5%
Europe 33.2%
Asia 29.4%
Africa 4.4%
Oceania 1.2%
Bunkers¹2.3%
Americas23.4%
Europe 18.0%
Asia 48.6%
Africa 5.9%
Oceania 1.1% Bunkers¹
3.0%
1. Includes international aviation and international marine bunkers. Source: IEA, World Energy Balances, 2020.
Key World Energy Statistics Supply
11
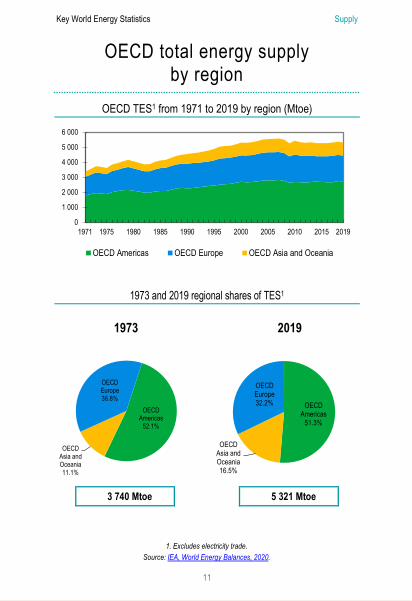
OECD total energy supply by region
OECD TES1 from 1971 to 2019 by region (Mtoe)
1973 and 2019 regional shares of TES1
1973 2019
3 740 Mtoe 5 321 Mtoe
0
1 000
2 000
3 000
4 000
5 000
6 000
1971 1975 1980 1985 1990 1995 2000 2005 2010 2015 2019
OECD Americas OECD Europe OECD Asia and Oceania
OECD Americas
52.1%
OECD Asia and Oceania11.1%
OECD Europe36.8%
OECD Americas
51.3%
OECD Asia and Oceania16.5%
OECD Europe32.2%
1. Excludes electricity trade. Source: IEA, World Energy Balances, 2020.

Supply Key World Energy Statistics
12
Crude oil production World crude oil1 production from 1971 to 2019 by region (Mt)
1973 and 2019 regional shares of crude oil1 production
1973 2019
2 868 Mt 4 439 Mt
0
1 000
2 000
3 000
4 000
5 000
1971 1975 1980 1985 1990 1995 2000 2005 2010 2015 2019OECD Middle EastNon-OECD Europe and Eurasia ChinaNon-OECD Asia² Non-OECD AmericasAfrica
OECD 23.9%
Middle East
36.7%Non-
OECD Europe
and Eurasia15.7%
China 1.9%
Non-OECD Asia² 3.2%
Non-OECD
Americas 8.5%
Africa 10.1%
OECD 28.7%
Middle East
31.3%Non-
OECD Europe
and Eurasia16.1%
China 4.3%
Non-OECD Asia² 3.4%
Non-OECD
Americas 7.2%
Africa 9.0%
1. Includes crude oil, NGL, feedstocks, additives and other hydrocarbons. 2. Non-OECD Asia excludes China.
Sources: IEA, World Energy Statistics, 2020.

Key World Energy Statistics Supply
13
Crude oil production Producers, net exporters and net importers of crude oil1
Producers Mt % of
world total
United States 742 16.7
Russian Federation 560 12.6
Saudi Arabia 546 12.3
Canada 265 6.0
Iraq 234 5.3
People's Rep. of China 192 4.3
United Arab Emirates 189 4.3
Islamic Rep. of Iran 146 3.3
Brazil 145 3.3
Kuwait 144 3.2
Rest of the world 1 276 28.7
World 4 439 100.0 2019 provisional data
Net exporters Mt Saudi Arabia 368 Russian Federation 260
Iraq 190 Canada 148
United Arab Emirates 125
Islamic Rep. of Iran 106 Kuwait 105
Nigeria 93 Kazakhstan 70
Angola 67
Others 550 Total 2 082
2018 data
Net importers Mt People's Rep. of China 459 United States 292 India 226
Korea 151 Japan 151
Germany 85 Spain 67
Italy 63
Netherlands 61 Singapore 55
Others 525
Total 2 135 2018 data
1. Includes production of crude oil, NGL, feedstocks, additives and other hydrocarbons. Excludes liquids from other fuel sources (renewables, coal and natural gas).
Sources: IEA, World Energy Statistics, 2020.

Supply Key World Energy Statistics
14
Natural gas production World natural gas production from 1971 to 2019 by region
(billion cubic metres, bcm)
1973 and 2019 regional shares of natural gas production
1973 2019
1 224 bcm 4 089 bcm
0
1 000
2 000
3 000
4 000
5 000
1971 1975 1980 1985 1990 1995 2000 2005 2010 2015 2019OECD Middle EastNon-OECD Europe and Eurasia ChinaNon-OECD Asia¹ Non-OECD AmericasAfrica
OECD 71.5%
Middle East 2.1%
Non-OECD Europe
and Eurasia22.3%
China 0.5%
Non-OECD Asia¹ 1.0%
Non-OECD
Americas 1.8%
Africa 0.8%
OECD 37.6%
Middle East
16.0%Non-
OECD Europe
and Eurasia24.2%
China 4.3%
Non-OECD Asia¹ 7.6%
Non-OECD
Americas 4.2%
Africa 6.1%
1. Non-OECD Asia excludes China. Sources: IEA, Natural Gas Information, 2020.

Key World Energy Statistics Supply
15
Natural gas production Producers, net exporters and net importers1 of natural gas
Producers bcm % of
world total
United States 955 23.4 Russian Federation 750 18.3
Islamic Rep. of Iran 232 5.7
People’s Rep. of China 178 4.4 Canada 177 4.3
Qatar 168 4.1
Australia 142 3.5
Norway 119 2.9
Saudi Arabia 98 2.4
Algeria 91 2.2
Rest of the world 1 179 28.8 World 4 089 100.0
2019 provisional data
Net exporters bcm Russian Federation 265 Qatar 124 Norway 113
Australia 95 United States 54
Turkmenistan 52 Canada 51
Algeria 43
Nigeria 29 Malaysia 24
Others 203
Total 1 053
2019 provisional data
Net importers bcm People’s Rep. of China 122 Japan 105 Germany 103
Italy 71
Mexico 57 Korea 54
Turkey 44 France 44
United Kingdom 39
Spain 36
Others 324
Total 999 2019 provisional data
1. Net exports and net imports include pipeline gas and LNG. Sources: IEA, Natural Gas Information, 2020.

Supply Key World Energy Statistics
16
Coal production World coal1 production from 1971 to 2019 by region (Mt)
1973 and 2019 regional shares of coal1 production
1973 2019
3 074 Mt 7 921 Mt
01 0002 0003 0004 0005 0006 0007 0008 0009 000
1971 1975 1980 1985 1990 1995 2000 2005 2010 2015 2019
OECD Middle EastNon-OECD Europe and Eurasia ChinaNon-OECD Asia² Non-OECD AmericasAfrica
OECD 55.6%Non-
OECD Europe
and Eurasia24.5%
China 13.6%
Non-OECD Asia² 3.9%
Non-OECD
Americas 0.2%
Africa 2.2%
1. Includes steam coal, coking coal, lignite and recovered coal. 2. Non-OECD Asia excludes China.
Sources: IEA, World Energy Statistics, 2020; IEA, Coal Information, 2020.
OECD 20.6% Non-
OECD Europe
and Eurasia8.5%
China 46.7%
Non-OECD Asia²
19.7%
Non-OECD
Americas 1.1%
Africa 3.4%
Key World Energy Statistics Supply
17
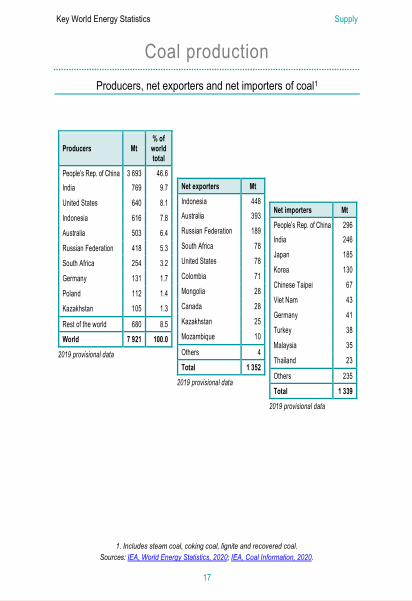
Coal production Producers, net exporters and net importers of coal1
Producers Mt % of
world total
People’s Rep. of China 3 693 46.6 India 769 9.7
United States 640 8.1
Indonesia 616 7.8 Australia 503 6.4
Russian Federation 418 5.3 South Africa 254 3.2
Germany 131 1.7
Poland 112 1.4 Kazakhstan 105 1.3
Rest of the world 680 8.5 World 7 921 100.0
2019 provisional data
Net exporters Mt Indonesia 448 Australia 393 Russian Federation 189
South Africa 78 United States 78
Colombia 71 Mongolia 28
Canada 28
Kazakhstan 25 Mozambique 10
Others 4
Total 1 352 2019 provisional data
Net importers Mt People’s Rep. of China 296 India 246 Japan 185
Korea 130
Chinese Taipei 67 Viet Nam 43
Germany 41 Turkey 38
Malaysia 35
Thailand 23
Others 235
Total 1 339 2019 provisional data
1. Includes steam coal, coking coal, lignite and recovered coal. Sources: IEA, World Energy Statistics, 2020; IEA, Coal Information, 2020.

Supply Key World Energy Statistics
18
Nuclear electricity production World nuclear electricity production from 1971 to 2018
by region (TWh)
1973 and 2018 regional shares of nuclear electricity production
1973 2018
203 TWh 2 710 TWh
0
1 000
2 000
3 000
1971 1975 1980 1985 1990 1995 2000 2005 2010 2015 2018
OECD Non-OECD Europe and EurasiaNon-OECD Asia¹ ChinaOther ²
OECD92.8%
Non-OECD Europe
and Eurasia5.9%
Non-OECD Asia¹1.3%
OECD73.0%
Non-OECD Europe
and Eurasia11.8%
Non-OECD Asia¹2.8%
China10.9%
Other ²1.5%
1. Non-OECD Asia excludes China. 2. Other includes Africa, Non-OECD Americas and the Middle East.
Sources: IEA, World Energy Statistics, 2020; IEA, Electricity Information, 2020.

Key World Energy Statistics Supply
19
Nuclear electricity production Producers of nuclear electricity
Producers TWh % of
world total
United States 841 31.0 France 413 15.2
People’s Rep. of China 295 10.9
Russian Federation 205 7.5 Korea 134 4.9
Canada 101 3.7 Ukraine 84 3.1
Germany 76 2.8
Sweden 69 2.5 United Kingdom 65 2.4
Rest of the world 427 16.0 World 2 710 100.0
2018 data
Net installed capacity GW
United States 99 France 63
People’s Rep. of China 43 Japan 37
Russian Federation 27 Korea 22
Canada 14 Ukraine 13
Germany 10
United Kingdom 9
Rest of the world 60
World 397 2018 data Source: International Atomic Energy Agency
Country (top ten producers)
% of nuclear in total
domestic electricity generation
France 71.0 Ukraine 52.8 Sweden 42.0
Korea 22.6 United Kingdom 19.5
United States 18.9 Russian Federation 18.4
Canada 15.4
Germany 11.8 People’s Rep. of China 4.1
Rest of the world¹ 7.6
World 10.1 2018 data
1. Excludes countries with no nuclear production. Sources: IEA, World Energy Statistics, 2020; IEA, Electricity Information, 2020.

Supply Key World Energy Statistics
20
Hydroelectricity production World hydroelectricity production1 from 1971 to 2018
by region (TWh)
1973 and 2018 regional shares of hydroelectricity production1
1973 2018
1 296 TWh 4 325 TWh
0
1 000
2 000
3 000
4 000
5 000
1971 1975 1980 1985 1990 1995 2000 2005 2010 2015 2018
OECD Middle EastNon-OECD Europe and Eurasia ChinaNon-OECD Asia² Non-OECD AmericasAfrica
OECD71.8%
Middle East0.3%
Non-OECD Europe
and Eurasia11.6%
China2.9%
Non-OECD Asia²4.3%
Non-OECD Americas
6.8%Africa2.3%
OECD34.7% Middle
East0.4%
Non-OECD Europe
and Eurasia7.6%
China28.5%
Non-OECD Asia²9.8%
Non-OECD
Americas15.9%
Africa3.1%
1. Includes electricity production from pumped storage. 2. Non-OECD Asia excludes China.
Sources: IEA, World Energy Statistics, 2020; IEA, Renewables Information, 2020.
Key World Energy Statistics Supply
21
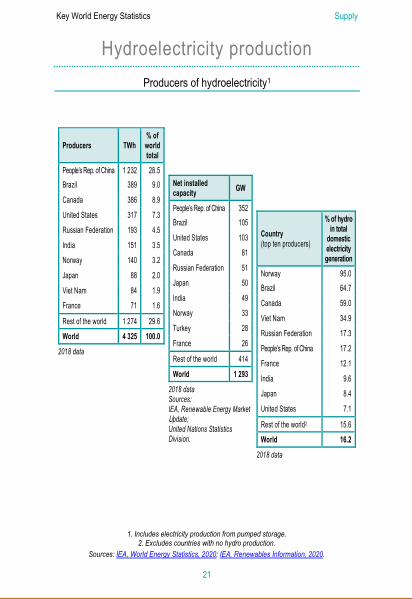
Hydroelectricity production Producers of hydroelectricity1
Producers TWh % of
world total
People’s Rep. of China 1 232 28.5 Brazil 389 9.0
Canada 386 8.9
United States 317 7.3 Russian Federation 193 4.5
India 151 3.5 Norway 140 3.2
Japan 88 2.0
Viet Nam 84 1.9 France 71 1.6
Rest of the world 1 274 29.6 World 4 325 100.0
2018 data
Net installed capacity GW
People’s Rep. of China 352 Brazil 105
United States 103 Canada 81
Russian Federation 51 Japan 50
India 49 Norway 33
Turkey 28
France 26
Rest of the world 414
World 1 293 2018 data Sources: IEA, Renewable Energy Market Update; United Nations Statistics Division.
Country (top ten producers)
% of hydro in total
domestic electricity generation
Norway 95.0 Brazil 64.7
Canada 59.0
Viet Nam 34.9 Russian Federation 17.3
People’s Rep. of China 17.2 France 12.1
India 9.6 Japan 8.4
United States 7.1
Rest of the world2 15.6 World 16.2
2018 data
1. Includes electricity production from pumped storage. 2. Excludes countries with no hydro production.
Sources: IEA, World Energy Statistics, 2020; IEA, Renewables Information, 2020.

Supply Key World Energy Statistics
22
Wind electricity production World wind electricity production from 2005 to 2018 by region (TWh)
2005 and 2018 regional shares of wind electricity production
2005 2018
104 TWh 1 273 TWh
0
250
500
750
1 000
1 250
1 500
2005 2006 2007 2008 2009 2010 2011 2012 2013 2014 2015 2016 2017 2018
OECD Middle EastNon-OECD Europe and Eurasia ChinaNon-OECD Asia¹ Non-OECD AmericasAfrica
OECD 90.3%
Middle East 0.1%
Non-OECD Europe
and Eurasia0.1%
China 1.9%
Non-OECD Asia¹ 6.1%
Non-OECD
Americas 0.7%
Africa 0.8%
OECD 58.5%
Middle East 0.1%
Non-OECD Europe
and Eurasia0.9%
China 28.7%
Non-OECD Asia¹ 5.8%
Non-OECD
Americas 4.9%
Africa 1.1%
1. Non-OECD Asia excludes China. Sources: IEA, World Energy Statistics, 2020; IEA, Renewables Information, 2020.

Key World Energy Statistics Supply
23
Wind electricity production Producers of wind electricity
Producers TWh % of
world total
People’s Rep. of China 366 28.7 United States 276 21.7
Germany 110 8.6
India 64 5.0
United Kingdom 57 4.5
Spain 51 4.0
Brazil 48 3.8
Canada 33 2.6
France 29 2.2
Turkey 20 1.6
Rest of the world 220 17.3
World 1 273 100.0 2018 data
Net installed capacity GW
People’s Rep. of China 184.3 United States 94.5
Germany 58.8
India 35.3
Spain 23.4
United Kingdom 21.8
France 14.9
Brazil 14.4
Canada 12.8
Italy 10.2
Rest of the world 92.4
World 562.9 2018 data
Country (top ten producers)
% of wind
in total domestic electricity generation
Spain 18.5 Germany 17.1
United Kingdom 17.1
Brazil 8.1
Turkey 6.5
United States 6.2
People’s Rep. of China 5.1
Canada 5.1
France 4.9
India 4.1
Rest of the world1 2.5
World 4.8 2018 data
1. Excludes countries with no wind production. Sources: IEA, World Energy Statistics, 2020; IEA, Renewables Information, 2020;
IEA, Renewable Energy Market Update, 2020.
Supply Key World Energy Statistics
24
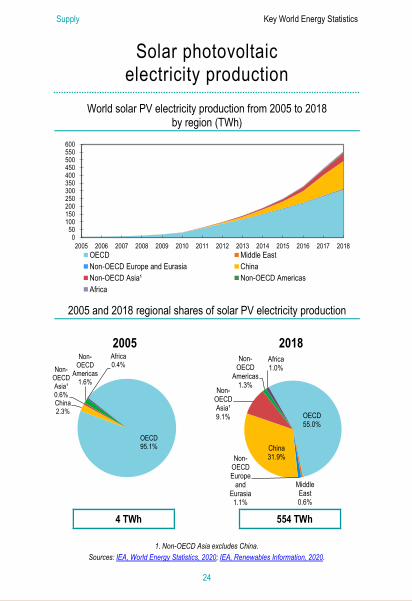
Solar photovoltaic electricity production
World solar PV electricity production from 2005 to 2018 by region (TWh)
2005 and 2018 regional shares of solar PV electricity production
2005 2018
4 TWh 554 TWh
0 50
100 150 200 250 300 350 400 450 500 550 600
2005 2006 2007 2008 2009 2010 2011 2012 2013 2014 2015 2016 2017 2018OECD Middle EastNon-OECD Europe and Eurasia ChinaNon-OECD Asia¹ Non-OECD AmericasAfrica
OECD 95.1%
China 2.3%
Non-OECD Asia¹ 0.6%
Non-OECD
Americas 1.6%
Africa 0.4%
OECD 55.0%
Middle East 0.6%
Non-OECD Europe
and Eurasia1.1%
China 31.9%
Non-OECD Asia¹ 9.1%
Non-OECD
Americas 1.3%
Africa 1.0%
1. Non-OECD Asia excludes China. Sources: IEA, World Energy Statistics, 2020; IEA, Renewables Information, 2020.

Key World Energy Statistics Supply
25
Solar photovoltaic electricity production
Producers of solar PV electricity
Producers TWh % of
world total
People’s Rep. of China 177 31.9 United States 81 14.7
Japan 63 11.3
Germany 46 8.3
India 40 7.2
Italy 23 4.1
United Kingdom 13 2.3
France 11 1.9
Australia 10 1.8
Korea 9 1.7
Rest of the world 81 14.8
World 554 100.0 2018 data
Net installed capacity GW
People’s Rep. of China 175.1 United States 62.5
Japan 56.2
Germany 45.2
India 28.3
Italy 20.1
United Kingdom 13.1
Australia 11.0
France 9.6
Korea 8.1
Rest of the world 66.4
World 495.4 2018 data
Country (top ten producers)
% of solar PV in total
domestic electricity generation
Italy 7.8 Germany 7.1
Japan 5.9
United Kingdom 3.9
Australia 3.8
India 2.5
People’s Rep. of China 2.5
United States 1.8
France 1.8
Korea 1.6
Rest of the world1 0.9
World 2.1 2018 data
1. Excludes countries with no solar PV production. Sources: IEA, World Energy Statistics, 2020; IEA, Renewables Information, 2020;
IEA, Renewable Energy Market Update, 2020.
Transformation Key World Energy Statistics
26
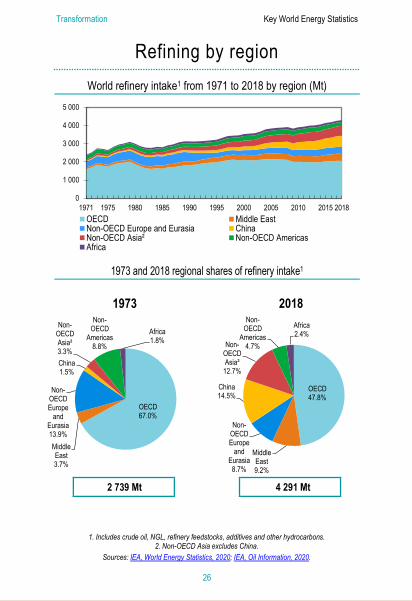
Refining by region World refinery intake1 from 1971 to 2018 by region (Mt)
1973 and 2018 regional shares of refinery intake1
1973 2018
2 739 Mt 4 291 Mt
0
1 000
2 000
3 000
4 000
5 000
1971 1975 1980 1985 1990 1995 2000 2005 2010 2015 2018OECD Middle EastNon-OECD Europe and Eurasia ChinaNon-OECD Asia² Non-OECD AmericasAfrica
OECD67.0%
Middle East3.7%
Non-OECD Europe
and Eurasia13.9%
China1.5%
Non-OECD Asia²3.3%
Non-OECD
Americas8.8%
Africa1.8%
1. Includes crude oil, NGL, refinery feedstocks, additives and other hydrocarbons. 2. Non-OECD Asia excludes China.
Sources: IEA, World Energy Statistics, 2020; IEA, Oil Information, 2020.
OECD47.8%
Middle East9.2%
Non-OECD Europe
and Eurasia8.7%
China14.5%
Non-OECD Asia²
12.7%
Non-OECD
Americas4.7%
Africa2.4%

Key World Energy Statistics Transformation
27
Refining by region Refinery capacity, net exporters and net importers of oil1
Crude distillation capacity kb/cd
% of world total
United States 19 026 18.6 People’s Rep. of China 16 726 16.3
Russian Federation 6 819 6.7
India 5 201 5.1 Japan 3 558 3.5
Korea 3 525 3.4
Saudi Arabia 2 829 2.8
Islamic Rep. of Iran 2 325 2.3
Brazil 2 175 2.1
Germany 2 022 2.0
Rest of the world 38 203 37.2 World 102 409 100.0
2019 data
Net exporters Mt
Saudi Arabia 437 Russian Federation 389 Iraq 177
Canada 156
United Arab Emirates 149 Kuwait 133
Islamic Rep. of Iran 125 Nigeria 74
Kazakhstan 74 Norway 73
Others 519
Total 2 306 2018 data
Net importers Mt
People’s Rep. of China 464 India 197 Japan 176
United States 146
Korea 122 Germany 103
Singapore 85 France 76
Spain 63
Italy 52
Others 780
Total 2 264 2018 data
1. Includes crude oil and oil products. Sources: IEA, World Energy Statistics, 2020; IEA, Oil Information, 2020.
Transformation Key World Energy Statistics
28
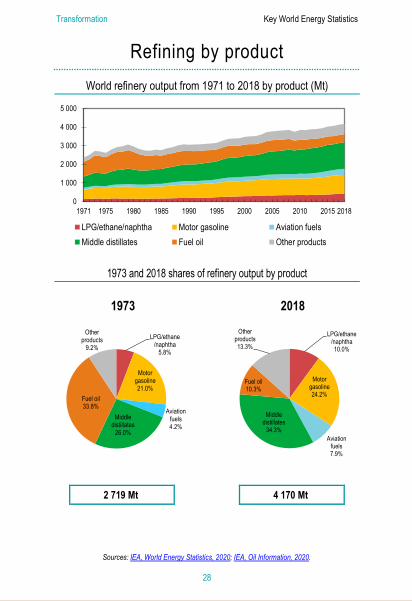
Refining by product World refinery output from 1971 to 2018 by product (Mt)
1973 and 2018 shares of refinery output by product
1973 2018
2 719 Mt 4 170 Mt
0
1 000
2 000
3 000
4 000
5 000
1971 1975 1980 1985 1990 1995 2000 2005 2010 2015 2018
LPG/ethane/naphtha Motor gasoline Aviation fuelsMiddle distillates Fuel oil Other products
LPG/ethane/naphtha
5.8%
Motor gasoline21.0%
Aviation fuels4.2%
Middle distillates
26.0%
Fuel oil33.8%
Other products
9.2%
LPG/ethane/naphtha10.0%
Motor gasoline24.2%
Aviation fuels7.9%
Middle distillates
34.3%
Fuel oil10.3%
Other products13.3%
Sources: IEA, World Energy Statistics, 2020; IEA, Oil Information, 2020.

Key World Energy Statistics Transformation
29
Refining by product Producers, net exporters and net importers of oil products
Producers Mt % of
world total
United States 856 20.5 People’s Rep. of China 599 14.4
Russian Federation 277 6.6 India 260 6.2
Korea 158 3.8 Japan 152 3.6
Saudi Arabia 128 3.1
Germany 97 2.3
Brazil 94 2.3
Canada 90 2.2
Rest of the world 1 459 35.0
World 4 170 100.0 2018 data
Net exporters Mt
United States 146 Russian Federation 129 Saudi Arabia 69
India 30
Korea 29 Kuwait 28
United Arab Emirates 24 Netherlands 22
Algeria 20
Islamic Rep. of Iran 20
Others 154
Total1 671 2018 data
Net importers Mt
Mexico 48 Singapore 29 Australia 28
Japan 25
Indonesia 23 Turkey 23
France 22 Hong Kong, China 21
Nigeria 19
Germany 18
Others 321
Total1 577 2018 data
1. The discrepancy between total net exports and total net imports arises from different data sources and possible misallocation of bunkers into exports for some countries.
Sources: IEA, World Energy Statistics, 2020; IEA, Oil Information, 2020.
Transformation Key World Energy Statistics
30
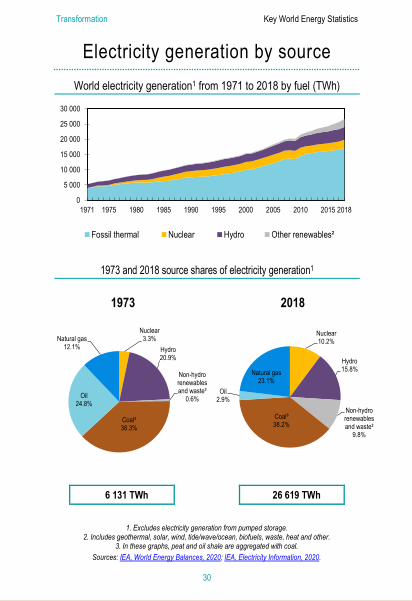
Electricity generation by source World electricity generation1 from 1971 to 2018 by fuel (TWh)
1973 and 2018 source shares of electricity generation1
1973 2018
6 131 TWh 26 619 TWh
0
5 000
10 000
15 000
20 000
25 000
30 000
1971 1975 1980 1985 1990 1995 2000 2005 2010 2015 2018
Fossil thermal Nuclear Hydro Other renewables²
Nuclear 3.3%
Hydro 20.9%
Non-hydro renewables and waste²
0.6%
Coal³ 38.3%
Oil 24.8%
Natural gas 12.1%
Nuclear 10.2%
Hydro 15.8%
Non-hydro renewables and waste²
9.8%
Coal³ 38.2%
Oil 2.9%
Natural gas 23.1%
1. Excludes electricity generation from pumped storage. 2. Includes geothermal, solar, wind, tide/wave/ocean, biofuels, waste, heat and other.
3. In these graphs, peat and oil shale are aggregated with coal. Sources: IEA, World Energy Balances, 2020; IEA, Electricity Information, 2020.

Key World Energy Statistics Transformation
31
Electricity generation by source Producers of electricity by source
Coal1 TWh People’s Rep. of China 4 773
United States 1 272
India 1 163
Japan 339
Korea 258
Germany 239
South Africa 227
Russian Federation
178
Indonesia 160
Australia 158
Rest of the world 1 393
World 10 160 2018 data
Oil TWh Saudi Arabia 160
Japan 52
United States 43
Iraq 40
Mexico 35
Pakistan 31
Kuwait 31
Islamic Rep. of Iran 29
Egypt 23
Lebanon 21
Rest of the world 319
World 784
2018 data
Natural gas TWh United States 1 519 Russian Federation
528 Japan 378
Islamic Rep. of Iran 256
People’s Rep. of China 224 Saudi Arabia 218
Mexico 202 Korea 156
Egypt 155 United Arab Emirates 134
Rest of the world 2 380
World 6 150 2018 data
Renewables2 TWh People’s Rep. of China 1 833 United States 743 Brazil 495 Canada 434
India 300 Germany 225
Russian Federation
193
Japan 177
Norway 143 Italy 114
Rest of the world 2 043
World 6 700 2018 data
1. In this table, peat and oil shale are aggregated with coal. 2. Excludes electricity generation from pumped storage.
Sources: IEA, World Energy Balances, 2020; IEA, Electricity Information, 2020.
Transformation Key World Energy Statistics
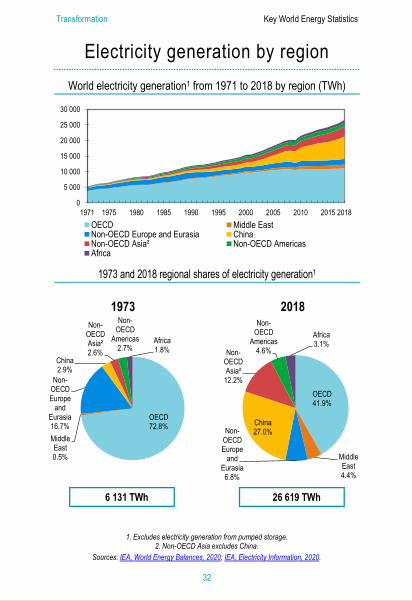
32
Electricity generation by region World electricity generation1 from 1971 to 2018 by region (TWh)
1973 and 2018 regional shares of electricity generation1
1973 2018
6 131 TWh 26 619 TWh
0
5 000
10 000
15 000
20 000
25 000
30 000
1971 1975 1980 1985 1990 1995 2000 2005 2010 2015 2018OECD Middle EastNon-OECD Europe and Eurasia ChinaNon-OECD Asia² Non-OECD AmericasAfrica
OECD 72.8%
Middle East 0.5%
Non-OECD Europe
and Eurasia16.7%
China 2.9%
Non-OECD Asia² 2.6%
Non-OECD
Americas 2.7%
Africa 1.8%
OECD 41.9%
Middle East 4.4%
Non-OECD Europe
and Eurasia6.8%
China 27.0%
Non-OECD Asia²
12.2%
Non-OECD
Americas 4.6%
Africa 3.1%
1. Excludes electricity generation from pumped storage. 2. Non-OECD Asia excludes China.
Sources: IEA, World Energy Balances, 2020; IEA, Electricity Information, 2020.

Key World Energy Statistics Transformation
33
Electricity generation by region Producers, net exporters and net importers of electricity
Producers1 TWh % of
world total
People’s Rep. of China 7 149 26.9 United States 4 434 16.7
India 1 583 5.9
Russian Federation 1 113 4.2 Japan 1 050 3.9
Canada 654 2.5
Germany 637 2.4
Brazil 601 2.3
Korea 586 2.2
France 577 2.2
Rest of the world 8 235 30.8 World 26 619 100.0
2018 data
Net exporters TWh France 63 Germany 49
Canada 48 Paraguay 42
Lao People’s. Dem. Rep. 27
Sweden 17 People’s Rep. of China 14
Czech Republic 14 Russian Federation 13
Norway 10
Others 76 Total 373
2018 data
Net importers TWh United States 44 Italy 44
Brazil 35 Thailand 26
Iraq 22
Finland 20 United Kingdom 19
Belgium 17 Hungary 14
Hong Kong, China 12
Others 123 Total 376
2018 data
1. Gross production minus production from pumped storage plants. Sources: IEA, World Energy Balances, 2020; IEA, Electricity Information, 2020.

Final consumption Key World Energy Statistics
34
World total final consumption (TFC) by source
World1 TFC from 1971 to 2018 by source (Mtoe)
1973 and 2018 source shares of TFC
1973 2018
4 660 Mtoe 9 938 Mtoe
0
2 000
4 000
6 000
8 000
10 000
1971 1975 1980 1985 1990 1995 2000 2005 2010 2015 2018
Coal² Oil Natural gas
Biofuels and waste³ Electricity Other⁴
Coal² 13.6%
Oil 48.2%
Natural gas
14.0%
Biofuels and
waste³13.1%
Electricity 9.4%
Other⁴1.7%
Coal² 10.0%
Oil 40.8%
Natural gas
16.2%
Biofuels and
waste³10.2%
Electricity 19.3%
Other⁴3.5%
1. World includes international aviation and international marine bunkers.2. In these graphs, peat and oil shale are aggregated with coal.
3. Data for biofuels and waste final consumption have been estimated for a number of countries. 4. Includes heat, solar thermal and geothermal.
Source: IEA, World Energy Balances, 2020.

Key World Energy Statistics Final consumption
35
OECD total final consumption by source
OECD TFC from 1971 to 2018 by source (Mtoe)
1973 and 2018 source shares of TFC
1973 2018
2 816 Mtoe 3 784 Mtoe
0 500
1 0001 5002 0002 5003 0003 5004 000
1971 1975 1980 1985 1990 1995 2000 2005 2010 2015 2018
Coal¹ Oil Natural gasBiofuels and waste Electricity Other²
Coal¹10.8%
Oil56.3%
Natural gas
17.7%
Biofuels and
waste3.0%
Electricity11.5%
Other²0.7%
Coal¹2.7%
Oil46.6%
Natural gas
21.0%
Biofuels and
waste5.7%
Electricity22.1%
Other²1.9%
1. In these graphs, peat and oil shale are aggregated with coal. 2. Includes heat, solar thermal and geothermal.
Source: IEA, World Energy Balances, 2020.
Final consumption Key World Energy Statistics
36
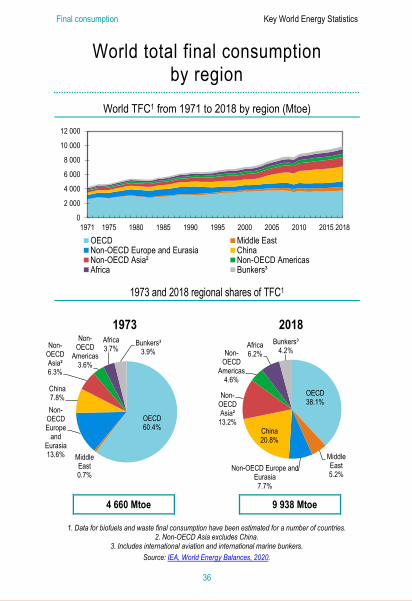
World total final consumption by region
World TFC1 from 1971 to 2018 by region (Mtoe)
1973 and 2018 regional shares of TFC1
1973 2018
4 660 Mtoe 9 938 Mtoe
0
2 000
4 000
6 000
8 000
10 000
12 000
1971 1975 1980 1985 1990 1995 2000 2005 2010 2015 2018OECD Middle EastNon-OECD Europe and Eurasia ChinaNon-OECD Asia² Non-OECD AmericasAfrica Bunkers³
OECD 60.4%
Middle East 0.7%
Non-OECD Europe
and Eurasia13.6%
China 7.8%
Non-OECD Asia² 6.3%
Non-OECD
Americas 3.6%
Africa 3.7%
Bunkers³ 3.9%
OECD 38.1%
Middle East 5.2%
Non-OECD Europe and Eurasia7.7%
China 20.8%
Non-OECD Asia²
13.2%
Non-OECD
Americas 4.6%
Africa 6.2%
Bunkers³ 4.2%
1. Data for biofuels and waste final consumption have been estimated for a number of countries. 2. Non-OECD Asia excludes China.
3. Includes international aviation and international marine bunkers. Source: IEA, World Energy Balances, 2020.

Key World Energy Statistics Final consumption
37
OECD total final consumption by region
OECD TFC from 1971 to 2018 by region (Mtoe)
1973 and 2018 regional shares of TFC
1973 2018
2 816 Mtoe 3 784 Mtoe
0 500
1 0001 5002 0002 5003 0003 5004 000
1971 1975 1980 1985 1990 1995 2000 2005 2010 2015 2018
OECD Americas OECD Europe OECD Asia and Oceania
OECD Americas
53.0%
OECD Asia and Oceania10.7%
OECD Europe36.3% OECD
Americas51.6%
OECD Asia and Oceania15.3%
OECD Europe33.1%
Source: IEA, World Energy Balances, 2020.

Final consumption Key World Energy Statistics
38
Total final consumption by sector: coal1
Coal TFC from 1971 to 2018 by sector (Mtoe)
1973 and 2018 shares of world coal1 final consumption
1973 2018
632 Mtoe 994 Mtoe
0
200
400
600
800
1 000
1 200
1971 1975 1980 1985 1990 1995 2000 2005 2010 2015 2018Iron and steel Chemical and petrochemicalNon-metallic minerals Other industryTransport ResidentialServices, agriculture and fishing Non-specified²Non-energy use
1. In these graphs, peat and oil shale are aggregated with coal. 2. Includes non-specified industry, transport and other.
Source: IEA, World Energy Balances, 2020.
Iron and steel
32.5%
Chemical and
petrochemical9.7%
Non-metallic minerals 21.2%
Other industry
9.6%
Residential 7.5%
Services, agriculture and fishing
4.6%
Non-specified²
9.7%
Non-energy use
5.2%Iron and
steel 17.5%
Chemical and
petrochemical3.8%
Non-metallic minerals
4.5%Other
industry 10.6%
Transport 5.0%
Residential 19.6%
Services, agriculture and fishing
14.6%
Non-specified²
23.4%
Non-energy use
1.0%

Key World Energy Statistics Final consumption
39
Total final consumption by sector: oil
Oil TFC from 1971 to 2018 by sector (Mtoe)
1973 and 2018 shares of world oil final consumption
1973 2018
2 252 Mtoe 4 051 Mtoe
0 500
1 0001 5002 0002 5003 0003 5004 0004 500
1971 1975 1980 1985 1990 1995 2000 2005 2010 2015 2018Industry AviationRoad RailNavigation Other¹Residential Non-energy use
Industry 20.0% Aviation
5.4%
Road 30.8%
Rail 1.7%
Navigation 6.8%
Other¹ 10.3%
Residential 13.4%
Non-energy use
11.6%
Industry 7.2%
Aviation 8.3%
Road 49.3%
Rail 0.8%
Navigation 6.8%
Other¹ 5.5%
Residential 5.4%
Non-energy use
16.7%
1. Includes agriculture, commercial and public services, non-specified other, pipeline and non-specified transport.
Source: IEA, World Energy Balances, 2020.

Final consumption Key World Energy Statistics
40
Total final consumption by sector: natural gas
Natural gas TFC from 1971 to 2018 by sector (Mtoe)
1973 and 2018 shares of world natural gas final consumption
1973 2018
652 Mtoe 1 611 Mtoe
0
300
600
900
1 200
1 500
1 800
1971 1975 1980 1985 1990 1995 2000 2005 2010 2015 2018Industry ResidentialTransport Commercial and public servicesNon-energy use Other¹
Industry 54.7%
Residential 22.7%
Transport 2.7%
Commercial and public services 10.8%
Non-energy use
2.8%
Other¹ 6.3%
Industry 37.0%
Residential 29.9%
Transport 7.3%
Commercial and public services 12.9%
Non-energy use
12.0%
Other¹ 0.9%
1. Includes agriculture, fishing and non-specified other. Source: IEA, World Energy Balances, 2020.
Key World Energy Statistics Final consumption
41
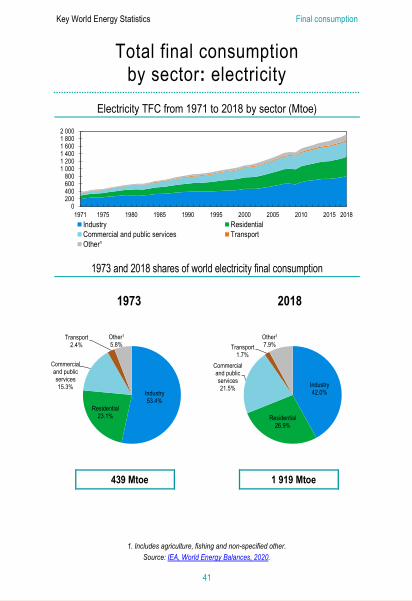
Total final consumption by sector: electricity
Electricity TFC from 1971 to 2018 by sector (Mtoe)
1973 and 2018 shares of world electricity final consumption
1973 2018
439 Mtoe 1 919 Mtoe
0 200 400 600 800
1 0001 2001 4001 6001 8002 000
1971 1975 1980 1985 1990 1995 2000 2005 2010 2015 2018Industry ResidentialCommercial and public services TransportOther¹
Industry 53.4%
Residential 23.1%
Commercial and public services 15.3%
Transport 2.4%
Other1
5.8%
Industry 42.0%
Residential 26.9%
Commercial and public services 21.5%
Transport 1.7%
Other1
7.9%
1. Includes agriculture, fishing and non-specified other. Source: IEA, World Energy Balances, 2020.

Final consumption Key World Energy Statistics
42
Top five countries by total energy supply (TES)
TES by sector (Mtoe), 2018
TES by energy source (Mtoe), 2018
0 500 1 000 1 500 2 000 2 500 3 000 3 500
Japan
RussianFederation
India
United States
People's Rep. ofChina
Total final consumption Transformation and other lossesEnergy industry own use
0 500 1 000 1 500 2 000 2 500 3 000 3 500
Japan
RussianFederation
India
United States
People's Rep. ofChina
Coal¹ Oil Natural gas Renewables Other²
1. In this graph, peat and oil shale are aggregated with coal. 2. Other includes nuclear, electricity trade, heat, non-renewable waste.
Source: IEA, World Energy Balances, 2020.
Key World Energy Statistics Final consumption
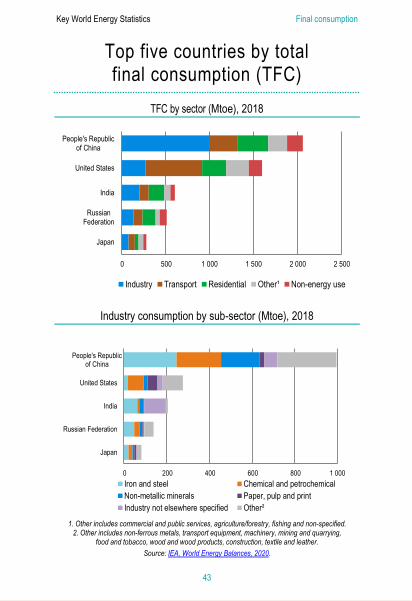
43
Top five countries by total final consumption (TFC)
TFC by sector (Mtoe), 2018
Industry consumption by sub-sector (Mtoe), 2018
0 500 1 000 1 500 2 000 2 500
Japan
RussianFederation
India
United States
People's Republicof China
Industry Transport Residential Other¹ Non-energy use
0 200 400 600 800 1 000
Japan
Russian Federation
India
United States
Iron and steel Chemical and petrochemicalNon-metallic minerals Paper, pulp and printIndustry not elsewhere specified Other²
People's Republic of China
1. Other includes commercial and public services, agriculture/forestry, fishing and non-specified. 2. Other includes non-ferrous metals, transport equipment, machinery, mining and quarrying,
food and tobacco, wood and wood products, construction, textile and leather. Source: IEA, World Energy Balances, 2020.

Energy efficiency Key World Energy Statistics
44
Energy efficiency indicators Largest end uses of energy by sector in IEA1
Source: IEA Energy Efficiency Indicators database, 2020.
Decomposition of final energy consumption in IEA
Source: Adapted from Energy Efficiency 2019, based on IEA Energy Efficiency Indicators database.
Excludes non-energy use and freight transport for the United States.
Residential space heating
10%
Manufacturing23%
Residential20%
Transport36%
Services14%
Other industries²
7%
Chemicals5%
Mining4%
Passenger cars ³21%
120
125
130
135
2009 2012 2015 2018
EJ
Final energy use Activity Structure Technical efficiency
1. Refers to 2018 data for sixteen IEA countries for which data are available for most end uses: Australia, Belgium, Canada, Czech Republic, Finland, France, Germany, Hungary, Italy, Japan, Korea, Luxembourg, New Zealand,
Spain, the United Kingdom and the United States. 2. Other industries include agriculture, mining and construction.
3. Passenger cars include cars, sport utility vehicles and personal trucks.

Key World Energy Statistics Energy efficiency
45
Energy efficiency indicators Services and manufacturing in IEA1: energy per value added
(MJ/2015 USD PPP)
Residential in IEA1: energy per floor area (GJ/m2)
Passenger transport in IEA1: energy per passenger-kilometre (MJ/pkm)
0 5 10 15 20 25 30 35
MachineryChemicals
Non-metallic mineralsPaper and printing
Basic metals
ManufacturingServices 2000
2018of which:
0
0.1
0.2
0.3
0.4
Lighting Space cooling Space heating
2000
2018
0
0.5
1
1.5
2
2.5
Passenger trains Buses Passenger cars ² Total
2000
2018
1. Refers to 2018 data for sixteen IEA countries for which data are available for most end uses: Australia, Belgium, Canada, Czech Republic, Finland, France, Germany, Hungary, Italy, Japan, Korea, Luxembourg,
New Zealand, Spain, the United Kingdom and the United States. 2. Passenger cars include cars, sport utility vehicles and personal trucks.
Source: IEA Energy Efficiency Indicators database, 2020.

Energy balances Key World Energy Statistics
46
Simplified energy balance table World energy balance, 1973
(Mtoe)
SUPPLY AND CONSUMPTION
Coal1 Crude oil Oil products
Natural gas
Nuclear Hydro Biofuels and
waste2
Other3 Total
Production 1 474.00 2 938.22 - 990.94 53.04 110.29 638.16 6.13 6 210.77 Imports 140.06 1 561.92 409.74 73.42 - - 0.13 8.14 2 193.41 Exports -130.35 -1 613.00 -443.08 -72.58 - - -0.19 -8.31 -2 267.50 Stock changes 12.48 -19.68 -16.51 -15.10 - - 0.06 - -38.74 TES 1 496.19 2 867.46 -49.85 976.69 53.04 110.29 638.15 5.96 6 097.94 Transfers - -46.64 48.72 - - - - - 2.08 Statistical diff. 1.01 11.95 -5.83 4.29 - - 0.06 -0.71 10.77 Electricity plants -555.58 -22.91 -316.76 -159.57 -52.94 -110.29 -2.20 503.62 -716.62 CHP plants -86.40 - -28.62 -50.85 -0.10 - -0.93 100.96 -65.95 Heat plants -7.81 - -0.90 -0.68 - - -0.80 7.11 -3.08 Blast furnaces -81.58 - -2.72 - - - -0.06 - -84.35 Gas works 9.85 -0.60 -9.07 -6.18 - - - - -6.00 Coke ovens4 -99.35 - -0.81 -0.19 - - -0.02 - -100.38 Oil refineries - -2 782.79 2 761.48 - - - - - -21.31 Petchem. plants - 5.09 -5.37 - - - - - -0.28 Liquefaction plants -0.73 0.23 - - - - - - -0.50 Other transf. - - -0.12 -0.03 - - -25.53 - -25.68 Energy ind. own use -34.94 -2.59 -160.13 -106.01 - - -0.20 -57.65 -361.51 Losses -9.05 -7.07 -0.25 -5.70 - - -0.25 -43.15 -65.48 TFC 631.61 22.14 2 229.76 651.77 - - 608.22 516.15 4 659.65 Industry 355.83 16.41 433.11 356.39 - - 86.19 286.80 1 534.74 Transport5 31.88 - 1 020.26 17.73 - - 0.24 10.60 1 080.71 Other 237.85 0.00 520.15 259.26 - - 521.79 218.75 1 757.81 Non-energy use 6.06 5.73 256.23 18.38 - - - - 286.39
1. In this table, peat and oil shale are aggregated with coal. 2. Data for biofuels and waste final consumption have been estimated for a number of countries.
3. Includes geothermal, solar, wind, heat and electricity. 4. Also includes patent fuel, BKB and peat briquette plants.
5. Includes international aviation and international marine bunkers. Source: IEA, World Energy Balances, 2020.

Key World Energy Statistics Energy balances
47
Simplified energy balance table World energy balance, 2018
(Mtoe)
SUPPLY AND CONSUMPTION
Coal1 Crude oil Oil products
Natural gas
Nuclear Hydro Biofuels and
waste2
Other3 Total
Production 3 893.68 4 552.55 - 3 293.12 706.81 362.33 1 324.21 288.44 14 421.15 Imports 829.29 2 479.49 1 396.84 985.02 - - 29.26 62.63 5 782.52 Exports -879.69 -2 440.07 -1 488.67 -1 019.82 - - -25.25 -62.37 -5 915.88 Stock changes -4.95 -6.45 3.32 3.28 - - -1.10 - -5.91 TES 3 838.33 4 585.52 -88.52 3 261.59 706.81 362.33 1 327.13 288.70 14 281.89 Transfers -1.16 -230.55 261.07 - - - -0.00 - 29.36 Statistical diff. -27.37 4.87 9.54 -3.13 - - -0.12 -1.22 -17.42 Electricity plants -1 758.79 -30.84 -146.14 -910.91 -703.39 -362.33 -135.89 1 697.38 -2 350.91 CHP plants -676.20 -0.02 -15.48 -333.42 -3.42 - -64.69 609.25 -483.99 Heat plants -24.10 -0.47 -9.86 -59.92 - - -12.43 99.33 -7.45 Blast furnaces -180.55 - -0.04 -0.04 - - -0.05 - -180.69 Gas works -9.66 - -2.82 5.14 - - -0.67 - -8.01 Coke ovens4 -66.28 - -2.49 -0.01 - - -0.11 - -68.89 Oil refineries - -4 361.96 4 269.23 - - - - - -92.72 Petchem. plants - 35.94 -36.00 - - - - - -0.06 Liquefaction plants -17.17 15.46 - -11.30 - - - - -13.02 Other transf. -0.28 12.61 -0.63 -14.74 - - -85.12 -0.54 -88.70 Energy ind. own use -79.96 -9.87 -199.04 -302.71 - - -15.47 -232.13 -839.19 Losses -2.31 -8.10 -0.31 -19.20 - - -0.19 -192.38 -222.50 TFC 994.50 12.59 4 038.50 1 611.35 - - 1 012.37 2 268.40 9 937.70 Industry 796.79 2.50 290.44 597.86 - - 204.05 947.68 2 839.31 Transport5 0.05 0.07 2 650.43 117.17 - - 89.64 33.53 2 890.90 Other 146.15 0.00 436.00 702.70 - - 718.68 1 287.20 3 290.73 Non-energy use 51.50 10.01 661.63 193.61 - - - - 916.76
1. In this table, peat and oil shale are aggregated with coal. 2. Data for biofuels and waste final consumption have been estimated for a number of countries.
3. Includes geothermal, solar, wind, heat and electricity. 4. Also includes patent fuel, BKB and peat briquette plants.
5. Includes international aviation and international marine bunkers. Source: IEA, World energy balances, 2020.

Energy balances Key World Energy Statistics
48
Simplified energy balance table OECD energy balance, 1973
(Mtoe)
SUPPLY AND CONSUMPTION
Coal1 Crude oil
Oil products
Natural gas
Nuclear Hydro Biofuels and waste2
Other3 Total
Production 819.10 710.51 - 706.42 49.21 78.93 87.30 6.13 2 457.60 Imports 121.92 1 277.50 336.20 62.57 - - 0.03 7.54 1 805.77 Exports -111.10 -63.59 -172.72 -50.39 - - -0.01 -7.01 -404.82 Intl. marine bunkers
- - -73.65 - - - - - -73.65
Intl. aviation bunkers
- - -24.64 - - - - - -24.64
Stock changes 14.55 -10.78 -11.36 -12.07 - - 0.06 - -19.61 TES 844.47 1 913.65 53.83 706.52 49.21 78.93 87.38 6.67 3 740.65 Transfers - -41.28 42.49 - - - - - 1.22 Statistical diff. 14.79 11.29 2.56 -5.61 - - -0.00 0.00 23.03 Electricity plants -387.59 -20.61 -228.38 -108.36 -49.11 -78.93 -1.43 364.63 -509.79 CHP plants -52.07 - -7.89 -11.64 -0.10 - -0.75 30.94 -41.51 Heat plants -7.81 - -0.90 -0.68 - - -0.80 7.11 -3.08 Blast furnaces -65.51 - -2.72 - - - - - -68.23 Gas works 11.03 -0.60 -8.72 -6.38 - - - - -4.67 Coke ovens4 -25.69 - -0.68 -0.19 - - -0.02 - -26.58 Oil refineries - -1 865.97 1 868.42 - - - - - 2.45 Petchem. plants - 4.88 -5.16 - - - - - -0.28 Liquefaction plants
- 0.02 - - - - - - 0.02
Other transf. - - -0.12 -0.03 - - - - -0.15 Energy ind. own use -24.53 -0.99 -128.88 -72.38 - - -0.07 -33.37 -260.22 Losses -3.80 - -0.23 -2.63 - - - -30.54 -37.20 TFC 303.29 0.39 1 583.63 498.62 - - 84.32 345.44 2 815.68 Industry 182.80 0.39 312.91 250.51 - - 42.26 169.38 958.24 Transport 7.34 - 665.68 17.00 - - 0.00 5.30 695.32 Other 110.05 - 393.09 225.53 - - 42.05 170.76 941.48 Non-energy use 3.10 - 211.95 5.58 - - - - 220.63
1. In this table, peat and oil shale are aggregated with coal. 2. Data for biofuels and waste final consumption have been estimated for a number of countries.
3. Includes geothermal, solar, wind, heat and electricity. 4. Also includes patent fuel, BKB and peat briquette plants.
Source: IEA, World energy balances, 2020.
Key World Energy Statistics Energy balances
49
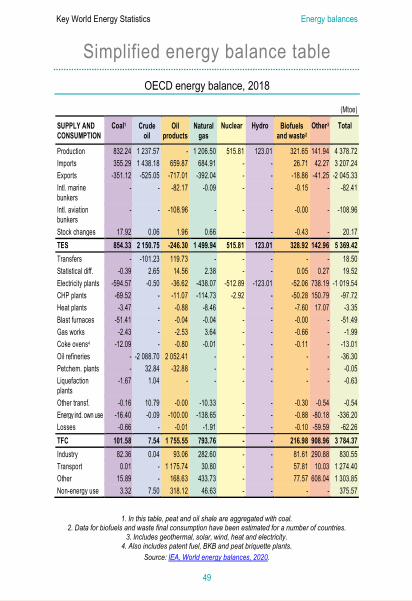
Simplified energy balance table OECD energy balance, 2018
(Mtoe)
SUPPLY AND CONSUMPTION
Coal1 Crude oil
Oil products
Natural gas
Nuclear Hydro Biofuels and waste2
Other3 Total
Production 832.24 1 237.57 - 1 206.50 515.81 123.01 321.65 141.94 4 378.72 Imports 355.29 1 438.18 659.87 684.91 - - 26.71 42.27 3 207.24 Exports -351.12 -525.05 -717.01 -392.04 - - -18.86 -41.25 -2 045.33 Intl. marine bunkers
- - -82.17 -0.09 - - -0.15 - -82.41
Intl. aviation bunkers
- - -108.96 - - - -0.00 - -108.96
Stock changes 17.92 0.06 1.96 0.66 - - -0.43 - 20.17 TES 854.33 2 150.75 -246.30 1 499.94 515.81 123.01 328.92 142.96 5 369.42 Transfers - -101.23 119.73 - - - - - 18.50 Statistical diff. -0.39 2.65 14.56 2.38 - - 0.05 0.27 19.52 Electricity plants -594.57 -0.50 -36.62 -438.07 -512.89 -123.01 -52.06 738.19 -1 019.54 CHP plants -69.52 - -11.07 -114.73 -2.92 - -50.28 150.79 -97.72 Heat plants -3.47 - -0.88 -8.46 - - -7.60 17.07 -3.35 Blast furnaces -51.41 - -0.04 -0.04 - - -0.00 - -51.49 Gas works -2.43 - -2.53 3.64 - - -0.66 - -1.99 Coke ovens4 -12.09 - -0.80 -0.01 - - -0.11 - -13.01 Oil refineries - -2 088.70 2 052.41 - - - - - -36.30 Petchem. plants - 32.84 -32.88 - - - - - -0.05 Liquefaction plants
-1.67 1.04 - - - - - - -0.63
Other transf. -0.16 10.79 -0.00 -10.33 - - -0.30 -0.54 -0.54 Energy ind. own use -16.40 -0.09 -100.00 -138.65 - - -0.88 -80.18 -336.20 Losses -0.66 - -0.01 -1.91 - - -0.10 -59.59 -62.26 TFC 101.58 7.54 1 755.55 793.76 - - 216.98 908.96 3 784.37 Industry 82.36 0.04 93.06 282.60 - - 81.61 290.88 830.55 Transport 0.01 - 1 175.74 30.80 - - 57.81 10.03 1 274.40 Other 15.89 - 168.63 433.73 - - 77.57 608.04 1 303.85 Non-energy use 3.32 7.50 318.12 46.63 - - - - 375.57
1. In this table, peat and oil shale are aggregated with coal. 2. Data for biofuels and waste final consumption have been estimated for a number of countries.
3. Includes geothermal, solar, wind, heat and electricity. 4. Also includes patent fuel, BKB and peat briquette plants.
Source: IEA, World energy balances, 2020.

Prices Key World Energy Statistics
50
Crude oil
Average key crude oil spot prices in USD/barrel
Oil products Average Rotterdam oil product spot prices in USD/barrel
Source for spot prices: Based on Argus. Copyright © 2020 Argus Media Ltd - All rights reserved.
Source: IEA, Energy Prices, 2020.
0
20
40
60
80
100
120
140
Jun-96 Jun-98 Jun-00 Jun-02 Jun-04 Jun-06 Jun-08 Jun-10 Jun-12 Jun-14 Jun-16 Jun-18 Jun-20North Sea Dubai WTI
0
20
40
60
80
100
120
140
160
180
Jun-96 Jun-98 Jun-00 Jun-02 Jun-04 Jun-06 Jun-08 Jun-10 Jun-12 Jun-14 Jun-16 Jun-18 Jun-20
HFO Gasoil Gasoline
Key World Energy Statistics Prices
51
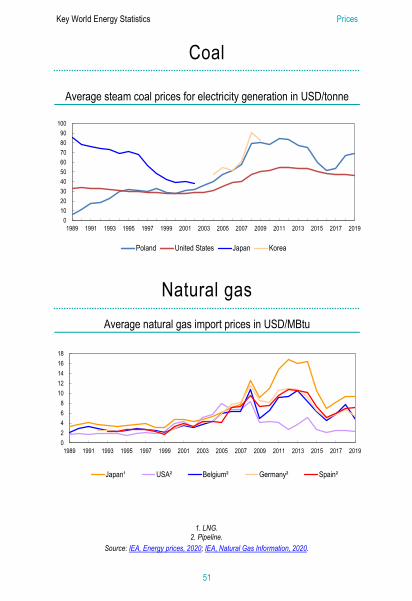
Coal
Average steam coal prices for electricity generation in USD/tonne
Natural gas Average natural gas import prices in USD/MBtu
0102030405060708090
100
1989 1991 1993 1995 1997 1999 2001 2003 2005 2007 2009 2011 2013 2015 2017 2019
Poland United States Japan Korea
02468
1012141618
1989 1991 1993 1995 1997 1999 2001 2003 2005 2007 2009 2011 2013 2015 2017 2019
Japan¹ USA² Belgium² Germany² Spain²
1. LNG. 2. Pipeline.
Source: IEA, Energy prices, 2020; IEA, Natural Gas Information, 2020.

Prices Key World Energy Statistics
52
Energy prices1 in selected OECD countries in USD/unit
Country
Heavy fuel oil for industry2 (tonne)
Light fuel oil for households (1 000 litres)
Automotive diesel oil3
(litre)
Unleaded premium4
(litre) Australia .. .. .. 1.01 Austria 515.58 785.71 0.95 1.30 Belgium 407.75 635.90 1.34 1.56 Canada .. 720.01 0.72 0.92 Chile .. 868.18 .. 1.08 Czech Republic 493.06 756.78 1.10 1.33 Denmark 720.79 1 439.36 1.20 1.69 Estonia .. 955.03 1.23 1.49 Finland .. 980.35 1.23 1.65 France 597.80 972.01 1.28 1.62 Germany .. 670.83 1.17 1.58 Greece 530.40 1 105.23 1.19 1.73 Hungary 560.46 x 0.99 1.23 Iceland .. .. .. .. Ireland 571.39 754.52 1.17 1.54 Israel c 1 742.67 c 1.76 Italy 583.09 1 401.31 1.31 1.71 Japan 634.23 958.07 0.94 1.35 Korea 636.05 803.10 .. 1.51 Latvia .. 840.04 1.09 1.40 Lithuania 424.02 641.43 1.03 1.33 Luxembourg .. 605.48 1.02 1.39 Mexico .. x .. .. Netherlands 654.87 1 182.02 1.23 1.81 New Zealand 400.00 .. 0.60 1.44 Norway .. .. 1.25 1.64 Poland 445.97 816.85 1.03 1.12 Portugal 739.02 1 284.05 1.35 1.62 Slovak Republic 422.11 .. 1.10 1.43 Slovenia x 1 026.52 1.11 1.40 Spain 506.84 776.43 1.09 1.41 Sweden 925.91 .. 1.28 1.56 Switzerland .. 836.08 1.37 1.59 Turkey 441.01 824.53 1.03 1.08 United Kingdom c 682.89 1.37 1.58 United States 451.24 782.29 0.76 0.75
1. Prices are for 1st quarter 2020 oil products, and annual 2019 for other products. 2. Low sulphur fuel oil. High sulphur fuel oil only for Canada, Ireland, Lithuania, Mexico, New Zealand, Turkey and the United States. 3. For commercial purposes. Source: IEA, Energy Prices, 2020.

Key World Energy Statistics Prices
53
Energy prices1 in selected OECD countries in USD/unit
Nat. gas for industry
(MWh GCV5)
Nat. gas for households (MWh GCV5)
Steam coal for industry6
(tonne)
Electricity for industry (MWh)
Electricity for households
(MWh)
Country
.. .. .. .. 232.1 Australia 31.5 76.9 209.3 109.6 221.4 Austria 26.0 63.9 126.4 134.9 316.2 Belgium 10.0 26.0 .. 90.5 112.5 Canada
c 112.1 .. 159.5 196.2 Chile 32.7 69.0 c 104.0 192.3 Czech Republic 33.0 90.7 .. 80.1 321.3 Denmark 35.4 50.6 .. 99.8 151.2 Estonia 50.1 .. 311.3 75.5 205.6 Finland 40.7 91.8 .. 117.8 199.1 France 29.5 76.0 .. 146.0 333.9 Germany 37.4 65.3 x 96.9 185.3 Greece 29.3 38.7 x 87.7 122.2 Hungary
.. .. .. .. .. Iceland 40.4 85.0 .. 128.8 258.5 Ireland
c x x .. .. Israel 38.0 93.6 .. 185.1 289.3 Italy
.. .. 121.4 .. .. Japan 43.2 56.6 .. 94.8 102.4 Korea 37.7 54.2 .. 124.3 191.0 Latvia 37.0 47.9 .. 116.9 142.9 Lithuania 26.7 47.9 x 81.7 193.1 Luxembourg
.. .. x .. .. Mexico 26.3 103.8 .. 96.6 249.8 Netherlands 15.9 95.2 c .. 191.7 New Zealand
x x .. .. .. Norway 25.5 51.8 83.5 98.9 155.8 Poland 35.7 86.0 c 128.2 242.4 Portugal 30.5 54.5 .. 146.8 182.2 Slovak Republic 34.6 63.5 c 93.4 179.2 Slovenia 30.7 100.7 .. 122.7 287.7 Spain 36.2 131.6 c 70.5 195.1 Sweden 66.7 103.0 96.6 119.7 212.0 Switzerland 28.7 26.5 75.0 105.8 105.9 Turkey 27.6 55.9 122.7 147.1 219.1 United Kingdom 12.9 34.9 68.4 68.3 130.4 United States
4. Unleaded premium gasoline (95 RON); unleaded regular for Japan. 5. Gross calorific value. 6. Brown coal for Turkey. Note: not available; x not applicable; c confidential Source: IEA, Energy Prices, 2020.
Emissions Key World Energy Statistics
54
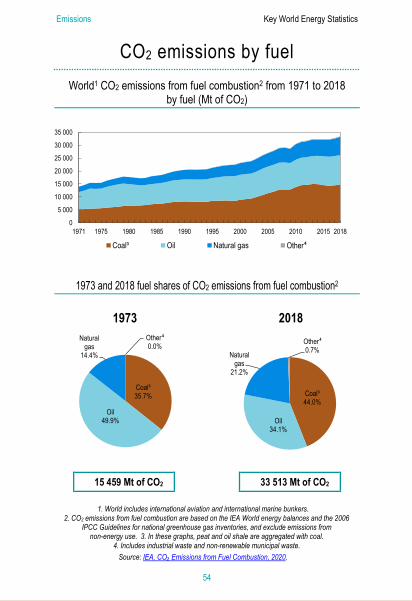
CO2 emissions by fuel World1 CO2 emissions from fuel combustion2 from 1971 to 2018
by fuel (Mt of CO2)
1973 and 2018 fuel shares of CO2 emissions from fuel combustion2
1973 2018
15 459 Mt of CO2 33 513 Mt of CO2
0
5 000
10 000
15 000
20 000
25 000
30 000
35 000
1971 1975 1980 1985 1990 1995 2000 2005 2010 2015 2018
Coal³ Oil Natural gas Other⁴
Coal³35.7%
Oil49.9%
Natural gas
14.4%
Other⁴0.0%
Coal³44.0%
Oil34.1%
Natural gas
21.2%
Other⁴0.7%
1. World includes international aviation and international marine bunkers. 2. CO2 emissions from fuel combustion are based on the IEA World energy balances and the 2006
IPCC Guidelines for national greenhouse gas inventories, and exclude emissions from non-energy use. 3. In these graphs, peat and oil shale are aggregated with coal.
4. Includes industrial waste and non-renewable municipal waste. Source: IEA, CO₂ Emissions from Fuel Combustion, 2020.
Key World Energy Statistics Emissions
55
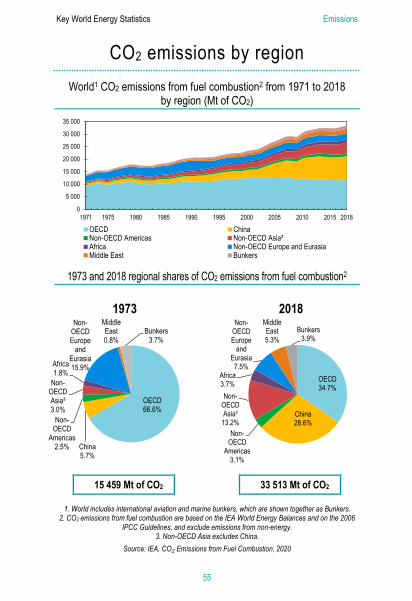
CO2 emissions by region World1 CO2 emissions from fuel combustion2 from 1971 to 2018
by region (Mt of CO2)
1973 and 2018 regional shares of CO2 emissions from fuel combustion2
1973 2018
15 459 Mt of CO2 33 513 Mt of CO2
1. World includes international aviation and marine bunkers, which are shown together as Bunkers.
2. CO2 emissions from fuel combustion are based on the IEA World Energy Balances and on the 2006 IPCC Guidelines, and exclude emissions from non-energy.
3. Non-OECD Asia excludes China.
Source: IEA, CO₂ Emissions from Fuel Combustion, 2020
0
5 000
10 000
15 000
20 000
25 000
30 000
35 000
1971 1975 1980 1985 1990 1995 2000 2005 2010 2015 2018
OECD ChinaNon-OECD Americas Non-OECD Asia³Africa Non-OECD Europe and EurasiaMiddle East Bunkers
OECD66.6%
China5.7%
Non-OECD
Americas2.5%
Non-OECD Asia³3.0%
Africa1.8%
Non-OECD Europe
and Eurasia15.9%
Middle East0.8%
Bunkers3.7%
OECD34.7%
China28.6%
Non-OECD
Americas3.1%
Non-OECD Asia³
13.2%
Africa3.7%
Non-OECD Europe
and Eurasia7.5%
Middle East5.3%
Bunkers3.9%

RD&D Key World Energy Statistics
56
Research, development and demonstration (RD&D)
IEA total1 public energy technology RD&D budget
IEA total public energy RD&D budget by technology
0
5
10
15
20
25
1975 1980 1985 1990 1995 2000 2005 2010 2015 2019
Billio
n US
D (2
019 p
rices
and P
PPs)
0%
20%
40%
60%
80%
100%
1974 1980 1990 2000 2010 2019Energy efficiency Fossil fuelsRenewable energy Hydrogen and fuel cellsOther power and storage Cross-cuttingNuclear
1. Data refer to total public energy RD&D expenditures, converted from current prices in national currencies. All IEA member countries are included, based on available or estimated data. The 2009
peak is mainly the result of the American Recovery and Reinvestment Act (stimulus) spending. For more information and documentation please see: https://www.iea.org/reports/energy-
technology-rdd-budgets-2020. Source: IEA Energy Technology RD&D Budgets database, 2020.

Key World Energy Statistics RD&D
57
Research, development and demonstration (RD&D)
Public energy RD&D budgets by country for IEA members and the European Union1
2018 and 2019 budgets by technology in selected IEA countries and the European Union
34%
13%10%
7%
7%
4%
4%
3%
3%3%
12%United StatesJapanEuropean UnionGermanyFranceUnited KingdomCanadaKoreaItalyNorwayOther IEA
0
1
2
3
4
5
6
7
8
9
10
Bill
ion
US
D (2
019
pric
es a
nd P
PP
)
Unallocated
Cross-cutting
Other powerand storageHydrogen andfuel cellsNuclear
RenewableenergyFossil fuels
Energyefficiency
EuropeanUnion
Germany Other IEA(estimated)
JapanUnitedStates
1. The amounts shown are based on 2019 budgets for: Australia, Canada, Estonia, Germany, Hungary, Japan, New Zealand, Norway, Poland, Slovak Republic, Sweden, Switzerland, the United States (US) and the European Union (EU). For other countries, data refer to 2018. Data for the US were estimated
by IEA Secretariat. EU refers to the EU budget under Horizon 2020, and not to the sum of national budgets of EU member countries.
Source: IEA, Energy Technology RD&D Budgets database, 2020.

Outlook Key World Energy Statistics
58
Outlook for world total energy supply (TES) to 2040
TES outlook by fuel and scenario to 2040 (Mtoe)
STEPS: Stated Policies Scenario Incorporates existing energy policies as well as an assessment of the results likely to stem from the implementation of announced policy intentions.
SDS: Sustainable Development Scenario⁴ Outlines an integrated approach to achieving
internationally agreed objectives on climate change, air quality and universal access to modern energy.
Total final consumption by sector and scenario in 2040
Stated Policies Scenario Sustainable Development Scenario
12 672 Mtoe 9 500 Mtoe
02 0004 0006 0008 000
10 00012 00014 00016 00018 00020 000
2000 2018 STEPS SDS STEPS SDS STEPS SDS
2025 2030 2040
Coal¹ Oil² Natural gas² Nuclear Hydro Other³
Industry30.3%
Transport 28.5%
Buildings & agriculture
31.9%
Non-energy use
9.3%
Industry30.6%
Transport27.5%
Buildings & agriculture
30.8%
Non-energy use
11.1%
1. In these graphs, peat and oil shale are aggregated with coal. 2. Includes international aviation and international marine bunkers. 3. Includes biofuels and waste, geothermal, solar, wind, tide, etc.
4. For more information: http://www.iea.org/weo/weomodel/sds/. Source: IEA, World Energy Outlook 2019.

Key World Energy Statistics Outlook
59
Outlook for world total energy supply (TES) to 2040
TES outlook by region and scenario to 2040 (Mtoe)
STEPS: Stated Policies Scenario Incorporates existing energy policies as well as an assessment of the results likely to stem from the implementation of announced policy intentions.
SDS: Sustainable Development Scenario4 Outlines an integrated approach to achieving
internationally agreed objectives on climate change, air quality and universal access to modern energy.
CO2 emissions3 by region and scenario in 2040
Stated Policies Scenario Sustainable Development Scenario
35 589 Mt of CO2 15 796 Mt of CO2
0
5 000
10 000
15 000
20 000
2000 2018 STEPS SDS STEPS SDS STEPS SDS
2040OECD ChinaNon-OECD Asia¹ Non-OECD Europe and EurasiaMiddle East AfricaNon-OECD Americas Bunkers²
2025 2030
Non-OECD Europe and
Eurasia7.0%
Middle East7.0%
OECD24.0%
China25.9%
Non-OECD Asia¹
22.1%
Africa5.1%
Non-OECD Americas
3.6%
Bunkers²5.3%
1. Non-OECD Asia excludes China. 2. Includes international aviation and international marine bunkers. 3. CO2 emissions are from fossil fuel combustion only. 4. For more information:
http://www.iea.org/weo/weomodel/sds/. Source: IEA, World Energy Outlook 2019.
Non-OECD Europe and
Eurasia8.3%
Middle East8.0%
OECD23.7%
China19.6%
Non-OECD Asia¹
22.7%
Africa7.0%
Non-OECD Americas
4.3%
Bunkers²6.4%

Energy indicators Key World Energy Statistics
60
Selected indicators for 2018 Region / Country / Economy
Popu-lation
(million)
GDP
(billion 2015 USD)
GDP (PPP) (billion
2015 USD)
Energy prod. (Mtoe)
Net imports (Mtoe)
TES
(Mtoe)
Elec. cons.1 (TWh)
CO2 emissions2
(Mt of CO2)
World 7 588 81 989 128 851 14 421 - 14 282 (3) 24 739 33 513 (4) OECD 1 302 50 049 56 757 4 379 1 162 5 369 10 629 11 645 Middle East 239 2 223 5 833 2 040 -1 245 760 1 023 1 773 Non-OECD Europe and Eurasia 341 2 477 6 463 1 987 -797 1 159 1 598 2 512 China 1 400 13 715 24 525 2 562 733 3 211 6 880 9 571 Non-OECD Asia 2 534 6 865 21 708 1 527 478 1 925 2 861 4 421 Non-OECD Americas 496 4 127 7 117 757 -144 599 1 025 1 035 Africa 1 276 2 533 6 447 1 169 -319 837 723 1 245 Albania 2.9 12.7 37.5 2.0 0.5 2.3 6.5 4.3 Algeria 42.2 175.9 619.5 155.5 -93.7 60.9 66.7 130.5 Angola 30.8 110.6 188.4 85.0 -70.3 15.4 10.4 18.0 Argentina 44.5 583.1 869.0 74.9 7.1 80.1 132.7 183.4 Armenia 3.0 12.0 28.9 0.8 2.3 3.1 5.8 5.2 Australia 25.0 1 339.7 1 209.7 411.6 -279.5 128.0 247.6 384.6 Austria 8.8 409.3 461.9 11.7 21.9 32.8 74.1 64.9 Azerbaijan 9.9 52.0 170.0 55.4 -40.7 14.4 21.7 30.8 Bahrain 1.6 34.0 70.4 22.5 -7.8 14.3 29.2 29.8 Bangladesh 161.4 241.8 668.5 33.6 8.0 41.9 75.2 78.3 Belarus 9.5 58.1 179.7 4.2 23.2 27.0 35.2 54.1 Belgium 11.4 485.2 546.8 11.7 52.9 53.2 88.6 90.4 Benin 11.5 9.8 26.4 2.7 2.6 5.2 1.2 6.8 Bolivia 11.4 37.4 84.7 19.7 -10.4 9.4 8.8 21.9 Bosnia and Herzegovina 3.3 17.7 45.0 5.7 1.8 7.5 13.2 22.3 Botswana 2.3 16.2 39.8 1.9 1.0 2.8 3.5 7.7 Brazil 209.5 1 780.9 3 195.2 295.7 -2.1 287.0 538.4 427.6 Brunei Darussalam 0.4 12.8 32.9 16.2 -12.3 3.7 3.8 6.7 Bulgaria 7.0 55.8 145.2 11.9 6.9 18.5 35.9 42.8 Cambodia 16.3 22.2 67.2 5.0 3.3 8.2 8.6 10.8 Cameroon 25.2 34.9 90.4 12.0 -2.3 9.7 7.0 6.2 Canada 37.1 1 654.6 1 695.4 529.3 -227.6 297.6 572.1 547.8 Chile 18.8 261.0 436.2 13.6 26.4 39.1 78.8 86.1
1. Electricity consumption = Gross production + imports – exports – losses. 2. CO2 emissions from fuel combustion only. Emissions are calculated using the IEA World Energy Balances and the Revised 2006 IPCC Guidelines, and exclude emissions from non-energy use. 3. TES for world includes international aviation and international marine bunkers as well as electricity and heat trade. 4. CO2 emissions for world include emissions from international aviation and international marine bunkers.

Key World Energy Statistics Energy indicators
61
Selected indicators for 2018 TES/ pop.
(toe/capita)
TES/ GDP
(toe/000 2015 USD)
TES/ GDP(PPP)
(toe/000 2015 USD)
Elec. cons./pop.
(kWh/ capita)
CO2/ TES
(tCO2/toe)
CO2/ pop.
(tCO2/ capita)
CO2/ GDP
(kgCO2/ 2015 USD)
CO2/GDP (PPP)
(kgCO2/ 2015 USD)
Region / Country / Economy
1.88 0.17 0.41 0.26 World 4.12 0.11 0.23 0.21 OECD 3.18 0.34 0.8 0.3 Middle East 3.4 0.47 1.01 0.39 Non-OECD Europe and Eurasia 2.29 0.23 0.7 0.39 China 0.76 0.28 0.64 0.2 Non-OECD Asia 1.21 0.15
0.11 3 260 2.35 4.42 0.09 8 165 2.17 8.95 0.13 4 280 2.33 7.42 0.18 4 687 2.17 7.37 0.13 4 914 2.98 6.84 0.09 1 129 2.3 1.74 0.08 2 065 1.73 2.08 0.25 0.15 Non-OECD Americas
0.66 0.33 0.13 567 1.49 0.98 0.49 0.19 Africa 0.82 0.18 0.34 0.11 Albania 1.44 0.35
0.06 2 277 1.84 1.50 0.10 1 579 2.25 3.25 0.78 0.22 Algeria
0.50 0.14 0.08 338 1.22 0.61 0.17 0.10 Angola 1.80 0.14 0.29 0.20 Argentina 1.04 0.26 0.45 0.19 Armenia 5.12 0.10 0.29 0.32 Australia 3.72 0.08 0.15 0.13 Austria 1.45 0.28 0.59 0.18 Azerbaijan 9.08 0.42
0.09 2 982 2.14 3.85 0.11 1 950 1.75 1.83 0.11 9 906 2.99 15.32 0.07 8 383 1.87 6.96 0.08 2 182 2.15 3.11 0.20 18 618 2.12 19.24 0.89 0.43 Bahrain
0.26 0.17 0.06 466 1.96 0.51 0.34 0.12 Bangladesh 2.84 0.46 0.98 0.32 Belarus 4.66 0.11
0.15 3 707 2.12 6.02 0.10 7 756 1.71 7.98 0.19 0.17 Belgium
0.46 0.54 0.20 104 1.38 0.63 0.74 0.27 Benin 0.83 0.25 0.11 774 2.24 1.85 0.56 0.25 Bolivia 2.25 0.42 1.26 0.49 Bosnia and Herzegovina 1.26 0.18 0.50 0.20 Botswana 1.37 0.16 0.23 0.13 Brazil 8.62 0.29 0.56 0.22 Brunei Darussalam 2.63 0.33
0.17 3 973 2.98 6.68 0.07 1 548 2.84 3.58 0.09 2 570 1.42 1.94 0.11 8 888 1.93 16.65 0.13 5 115 2.16 5.68 0.71 0.27 Bulgaria
0.50 0.37 0.12 532 1.29 0.65 0.47 0.16 Cambodia 0.38 0.28 0.11 278 0.65 0.25 0.18 0.07 Cameroon 8.03 0.18 0.34 0.33 Canada 2.08 0.15
0.18 15 438 1.90 15.25 0.09 4 198 2.19 4.57 0.33 0.20 Chile
Energy indicators Key World Energy Statistics
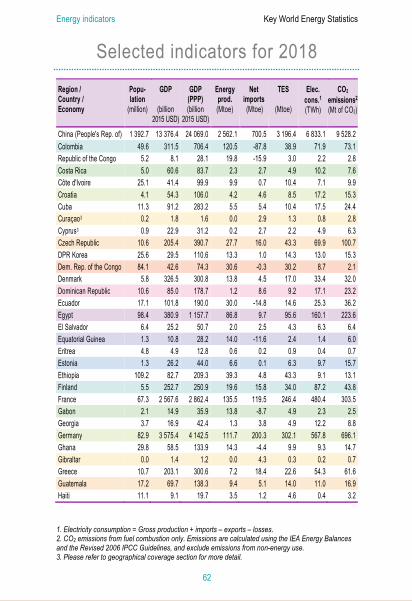
62
Selected indicators for 2018 Region / Country / Economy
Popu-lation
(million)
GDP
(billion 2015 USD)
GDP (PPP) (billion
2015 USD)
Energy prod. (Mtoe)
Net imports (Mtoe)
TES
(Mtoe)
Elec. cons.1
(TWh)
CO2 emissions2
(Mt of CO2)
China (People's Rep. of) 1 392.7 13 376.4 24 069.0 2 562.1 700.5 3 196.4 6 833.1 9 528.2 Colombia 49.6 311.5 706.4 120.5 -87.8 38.9 71.9 73.1 Republic of the Congo 5.2 8.1 28.1 19.8 -15.9 3.0 2.2 2.8 Costa Rica 5.0 60.6 83.7 2.3 2.7 4.9 10.2 7.6 Côte d'Ivoire 25.1 41.4 99.9 9.9 0.7 10.4 7.1 9.9 Croatia 4.1 54.3 106.0 4.2 4.6 8.5 17.2 15.3 Cuba 11.3 91.2 283.2 5.5 5.4 10.4 17.5 24.4 Curaçao3 0.2 1.8 1.6 0.0 2.9 1.3 0.8 2.8 Cyprus3 0.9 22.9 31.2 0.2 2.7 2.2 4.9 6.3 Czech Republic 10.6 205.4 390.7 27.7 16.0 43.3 69.9 100.7 DPR Korea 25.6 29.5 110.6 13.3 1.0 14.3 13.0 15.3 Dem. Rep. of the Congo 84.1 42.6 74.3 30.6 -0.3 30.2 8.7 2.1 Denmark 5.8 326.5 300.8 13.8 4.5 17.0 33.4 32.0 Dominican Republic 10.6 85.0 178.7 1.2 8.6 9.2 17.1 23.2 Ecuador 17.1 101.8 190.0 30.0 -14.8 14.6 25.3 36.2 Egypt 98.4 380.9 1 157.7 86.8 9.7 95.6 160.1 223.6 El Salvador 6.4 25.2 50.7 2.0 2.5 4.3 6.3 6.4 Equatorial Guinea 1.3 10.8 28.2 14.0 -11.6 2.4 1.4 6.0 Eritrea 4.8 4.9 12.8 0.6 0.2 0.9 0.4 0.7 Estonia 1.3 26.2 44.0 6.6 0.1 6.3 9.7 15.7 Ethiopia 109.2 82.7 209.3 39.3 4.8 43.3 9.1 13.1 Finland 5.5 252.7 250.9 19.6 15.8 34.0 87.2 43.8 France 67.3 2 567.6 2 862.4 135.5 119.5 246.4 480.4 303.5 Gabon 2.1 14.9 35.9 13.8 -8.7 4.9 2.3 2.5 Georgia 3.7 16.9 42.4 1.3 3.8 4.9 12.2 8.8 Germany 82.9 3 575.4 4 142.5 111.7 200.3 302.1 567.8 696.1 Ghana 29.8 58.5 133.9 14.3 -4.4 9.9 9.3 14.7 Gibraltar 0.0 1.4 1.2 0.0 4.3 0.3 0.2 0.7 Greece 10.7 203.1 300.6 7.2 18.4 22.6 54.3 61.6 Guatemala 17.2 69.7 138.3 9.4 5.1 14.0 11.0 16.9 Haiti 11.1 9.1 19.7 3.5 1.2 4.6 0.4 3.2
1. Electricity consumption = Gross production + imports – exports – losses. 2. CO2 emissions from fuel combustion only. Emissions are calculated using the IEA Energy Balances and the Revised 2006 IPCC Guidelines, and exclude emissions from non-energy use. 3. Please refer to geographical coverage section for more detail.

Key World Energy Statistics Energy indicators
63
Selected indicators for 2018 TES/ pop.
(toe/capita)
TES/ GDP
(toe/000 2015 USD)
TES/ GDP(PPP)
(toe/000 2015 USD)
Elec. cons./pop.
(kWh/ capita)
CO2/ TES
(tCO2/toe)
CO2/ pop.
(tCO2/ capita)
CO2/ GDP
(kgCO2/ 2015 USD)
CO2/GDP (PPP)
(kgCO2/ 2015 USD)
Region / Country / Economy
2.30 0.24 0.13 4 906 2.98 6.84 0.71 0.40 China (People's Rep. of) 0.78 0.12 0.06 1 448 1.88 1.47 0.23 0.10 Colombia 0.57 0.36 0.11 413 0.96 0.54 0.35 0.10 Republic of the Congo 0.97 0.08 0.06 2 032 1.57 1.53 0.13 0.09 Costa Rica 0.41 0.25 0.10 284 0.95 0.40 0.24 0.10 Côte d'Ivoire 2.08 0.16 0.08 4 205 1.80 3.74 0.28 0.14 Croatia 0.92 0.11 0.04 1 548 2.35 2.15 0.27 0.09 Cuba 8.29 0.72 0.80 4 818 2.10 17.39 1.51 1.69 Curaçao1 2.59 0.10 0.07 5 674 2.82 7.30 0.28 0.20 Cyprus1 4.07 0.21 0.11 6 574 2.33 9.48 0.49 0.26 Czech Republic 0.56 0.49 0.13 509 1.07 0.60 0.52 0.14 DPR Korea 0.36 0.71 0.41 103 0.07 0.03 0.05 0.03 Dem. Rep. of the Congo 2.94 0.05 0.06 5 764 1.88 5.53 0.10 0.11 Denmark 0.87 0.11 0.05 1 609 2.51 2.18 0.27 0.13 Dominican Republic 0.86 0.14 0.08 1 481 2.48 2.12 0.36 0.19 Ecuador 0.97 0.25 0.08 1 627 2.34 2.27 0.59 0.19 Egypt 0.67 0.17 0.09 986 1.49 1.00 0.25 0.13 El Salvador 1.86 0.23 0.09 1 055 2.45 4.55 0.55 0.21 Equatorial Guinea 0.18 0.18 0.07 90 0.82 0.15 0.14 0.06 Eritrea 4.75 0.24 0.14 7 368 2.50 11.90 0.60 0.36 Estonia 0.40 0.52 0.21 83 0.30 0.12 0.16 0.06 Ethiopia 6.16 0.13 0.14 15 804 1.29 7.93 0.17 0.17 Finland 3.66 0.10 0.09 7 141 1.23 4.51 0.12 0.11 France 2.32 0.33 0.14 1 095 0.52 1.20 0.17 0.07 Gabon 1.30 0.29 0.11 3 265 1.81 2.35 0.52 0.21 Georgia 3.64 0.08 0.07 6 848 2.30 8.40 0.19 0.17 Germany 0.33 0.17 0.07 311 1.49 0.49 0.25 0.11 Ghana 7.40 0.18 0.20 6 143 2.76 20.42 0.48 0.56 Gibraltar 2.10 0.11 0.08 5 059 2.73 5.74 0.30 0.20 Greece 0.81 0.20 0.10 637 1.20 0.98 0.24 0.12 Guatemala 0.41 0.51 0.23 37 0.70 0.29 0.35 0.16 Haiti
1. Please refer to geographical coverage section for more detail.

Energy indicators Key World Energy Statistics
64
Selected indicators for 2018 Region / Country / Economy
Popu-lation
(million)
GDP
(billion 2015 USD)
GDP (PPP) (billion
2015 USD)
Energy prod. (Mtoe)
Net imports (Mtoe)
TES
(Mtoe)
Elec. cons.1
(TWh)
CO2 emissions2
(Mt of CO2)
Honduras 9.6 23.7 46.7 2.9 3.3 6.0 6.9 9.1 Hong Kong, China 7.5 338.1 456.1 0.1 32.2 14.1 46.9 42.6 Hungary 9.8 139.5 294.1 11.2 15.5 26.7 43.0 45.6 Iceland 0.4 20.1 18.7 5.4 1.3 6.1 19.3 2.2 India 1 352.6 2 604.6 9 950.5 573.6 347.6 919.4 1 309.4 2307.8 Indonesia 267.7 999.1 3 317.7 450.8 -220.6 231.1 263.3 542.9 Islamic Rep. of Iran 81.8 436.2 1 580.8 406.3 -138.5 265.7 273.3 579.6 Iraq 38.4 198.3 635.0 241.4 -175.5 64.4 48.8 153.3 Ireland 4.9 353.7 393.8 5.0 10.0 13.7 28.9 35.3 Israel3 8.9 334.0 330.8 8.1 15.0 22.3 60.5 59.6 Italy 60.5 1 906.5 2 326.8 34.7 121.9 150.6 315.6 317.1 Jamaica 2.9 14.8 25.9 0.2 3.1 2.8 3.3 8.2 Japan 126.4 4 522.6 5 291.8 50.3 387.3 426.0 1 012.8 1 080.7 Jordan 10.0 40.4 89.4 0.6 8.8 9.1 18.5 23.0 Kazakhstan 18.3 202.0 482.9 177.6 -101.6 75.8 97.6 214.0 Kenya 51.4 75.6 168.9 22.4 6.0 27.7 9.2 15.9 Korea 51.6 1 598.1 2 108.5 45.2 252.5 282.3 571.9 605.8 Kosovo3 1.8 7.3 19.8 1.8 0.8 2.6 4.9 8.3 Kuwait 4.1 113.8 285.8 164.6 -131.8 34.0 63.7 87.8 Kyrgyzstan 6.3 7.5 23.3 2.3 2.2 4.6 12.0 10.5 Lao People’s Dem. Rep. 7.1 17.5 49.8 7.3 -1.3 5.7 5.0 17.8 Latvia 1.9 29.9 54.1 2.9 2.1 4.6 7.2 7.2 Lebanon 6.8 51.2 84.9 0.2 8.6 8.6 19.0 25.4 Libya 6.7 37.0 131.4 70.2 -52.0 17.9 27.7 45.6 Lithuania 2.8 45.9 92.8 2.0 5.9 7.6 12.2 11.1 Luxembourg 0.6 63.4 64.9 0.2 4.3 3.9 8.2 8.9 Malaysia 31.5 348.6 949.6 98.2 -2.2 93.4 157.2 228.0 Malta 0.5 12.9 19.4 0.0 3.0 0.7 2.4 1.5 Mauritius 1.3 13.1 28.5 0.2 2.1 1.5 2.9 4.1 Mexico 124.6 1 256.4 2 391.6 158.2 29.4 180.6 290.1 448.5 Moldova 3.5 8.8 24.4 0.8 3.3 4.1 5.8 8.0
1. Electricity consumption = Gross production + imports – exports – losses. 2. CO2 emissions from fuel combustion only. Emissions are calculated using the IEA Energy Balances and the Revised 2006 IPCC Guidelines, and exclude emissions from non-energy use. 3. Please refer to geographical coverage section for more detail.
Key World Energy Statistics Energy indicators
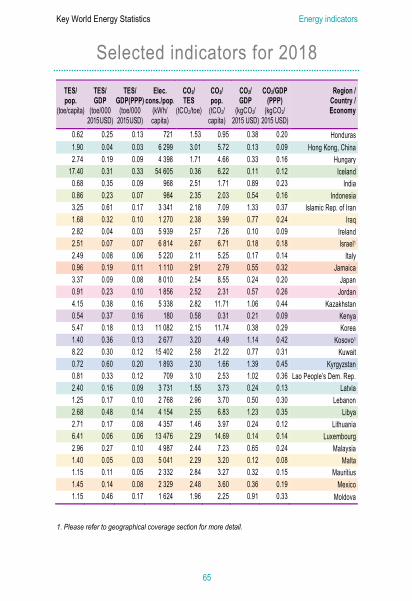
65
Selected indicators for 2018 TES/ pop.
(toe/capita)
TES/ GDP
(toe/000 2015 USD)
TES/ GDP(PPP)
(toe/000 2015 USD)
Elec. cons./pop.
(kWh/ capita)
CO2/ TES
(tCO2/toe)
CO2/ pop.
(tCO2/ capita)
CO2/ GDP
(kgCO2/ 2015 USD)
CO2/GDP (PPP)
(kgCO2/ 2015 USD)
Region / Country / Economy
0.62 0.25 0.13 721 1.53 0.95 0.38 0.20 Honduras 1.90 0.04 0.03 6 299 3.01 5.72 0.13 0.09 Hong Kong, China 2.74 0.19 0.09 4 398 1.71 4.66 0.33 0.16 Hungary
17.40 0.31 0.33 54 605 0.36 6.22 0.11 0.12 Iceland 0.68 0.35 0.09 968 2.51 1.71 0.89 0.23 India 0.86 0.23 0.07 984 2.35 2.03 0.54 0.16 Indonesia 3.25 0.61 0.17 3 341 2.18 7.09 1.33 0.37 Islamic Rep. of Iran 1.68 0.32 0.10 1 270 2.38 3.99 0.77 0.24 Iraq 2.82 0.04 0.03 5 939 2.57 7.26 0.10 0.09 Ireland 2.51 0.07 0.07 6 814 2.67 6.71 0.18 0.18 Israel1 2.49 0.08 0.06 5 220 2.11 5.25 0.17 0.14 Italy 0.96 0.19 0.11 1 110 2.91 2.79 0.55 0.32 Jamaica 3.37 0.09 0.08 8 010 2.54 8.55 0.24 0.20 Japan 0.91 0.23 0.10 1 856 2.52 2.31 0.57 0.26 Jordan 4.15 0.38 0.16 5 338 2.82 11.71 1.06 0.44 Kazakhstan 0.54 0.37 0.16 180 0.58 0.31 0.21 0.09 Kenya 5.47 0.18 0.13 11 082 2.15 11.74 0.38 0.29 Korea 1.40 0.36 0.13 2 677 3.20 4.49 1.14 0.42 Kosovo1 8.22 0.30 0.12 15 402 2.58 21.22 0.77 0.31 Kuwait 0.72 0.60 0.20 1 893 2.30 1.66 1.39 0.45 Kyrgyzstan 0.81 0.33 0.12 709 3.10 2.53 1.02 0.36 Lao People’s Dem. Rep. 2.40 0.16 0.09 3 731 1.55 3.73 0.24 0.13 Latvia 1.25 0.17 0.10 2 768 2.96 3.70 0.50 0.30 Lebanon 2.68 0.48 0.14 4 154 2.55 6.83 1.23 0.35 Libya 2.71 0.17 0.08 4 357 1.46 3.97 0.24 0.12 Lithuania 6.41 0.06 0.06 13 476 2.29 14.69 0.14 0.14 Luxembourg 2.96 0.27 0.10 4 987 2.44 7.23 0.65 0.24 Malaysia 1.40 0.05 0.03 5 041 2.29 3.20 0.12 0.08 Malta 1.15 0.11 0.05 2 332 2.84 3.27 0.32 0.15 Mauritius 1.45 0.14 0.08 2 329 2.48 3.60 0.36 0.19 Mexico 1.15 0.46 0.17 1 624 1.96 2.25 0.91 0.33 Moldova
1. Please refer to geographical coverage section for more detail.

Energy indicators Key World Energy Statistics
66
Selected indicators for 2018 Region / Country / Economy
Popu-lation
(million)
GDP
(billion 2015 USD)
GDP (PPP) (billion
2015 USD)
Energy prod. (Mtoe)
Net imports (Mtoe)
TES
(Mtoe)
Elec. cons.1
(TWh)
CO2 emissions2
(Mt of CO2)
Mongolia 3.2 13.4 41.5 26.6 -20.7 5.8 7.3 21.1 Montenegro 0.6 4.6 11.5 0.7 0.3 1.1 3.1 2.5 Morocco 36.0 109.8 298.7 2.1 20.0 20.6 33.1 58.9 Mozambique 29.5 17.8 40.8 20.2 -10.4 10.4 13.6 5.9 Myanmar 53.7 71.6 339.7 28.8 -4.8 23.8 18.8 31.5 Namibia 2.4 11.6 25.8 0.5 1.6 2.1 4.2 3.9 Nepal 28.1 24.9 82.2 10.4 3.8 14.0 6.5 11.2 Netherlands 17.2 826.0 919.4 36.4 52.5 72.9 117.1 150.9 New Zealand 4.9 197.0 191.4 15.5 6.4 20.5 41.4 31.5 Nicaragua 6.5 13.4 33.9 2.3 1.7 4.0 3.9 4.9 Niger 22.4 8.5 22.6 3.4 0.0 3.3 1.6 2.3 Nigeria 195.9 500.0 1 112.0 256.3 -97.2 159.9 30.8 104.3 North Macedonia (Rep. of) 2.1 10.7 30.4 1.1 1.5 2.6 6.5 6.9 Norway 5.3 404.1 328.2 207.0 -177.0 28.3 127.7 36.0 Oman 4.8 73.8 191.6 81.8 -53.6 25.6 34.0 68.8 Pakistan 212.2 318.9 1 119.6 68.0 44.2 111.3 125.8 194.1 Panama 4.2 62.0 101.1 1.1 8.3 4.3 9.5 9.3 Paraguay 7.0 41.1 89.6 8.3 -0.9 7.3 13.0 8.1 Peru 32.0 210.3 437.1 23.6 1.2 25.4 49.0 50.0 Philippines 106.7 354.7 904.7 28.8 34.4 60.1 90.2 132.1 Poland 38.4 544.1 1 162.4 62.4 47.2 105.8 166.8 305.7 Portugal 10.3 216.1 333.1 5.9 18.8 22.0 51.9 47.2 Qatar 2.8 170.3 334.5 219.2 -172.5 43.4 46.1 87.0 Romania 19.5 207.6 500.2 25.1 8.3 33.6 55.3 71.6 Russian Federation 144.5 1 421.7 3 672.9 1 484.1 -701.3 759.3 999.4 1 587.0 Saudi Arabia 33.7 676.3 1 767.2 665.4 -449.1 213.6 345.0 491.7 Senegal 15.9 21.6 56.8 1.7 3.0 4.6 4.2 8.1 Serbia 7.0 43.6 116.6 10.0 5.4 15.3 33.0 44.8 Singapore 5.6 339.2 542.5 0.6 93.3 37.8 52.6 47.4 Slovak Republic 5.4 96.8 177.5 6.3 10.9 17.4 29.4 31.6 Slovenia 2.1 48.5 73.5 3.5 3.6 6.9 14.9 13.6
1. Electricity consumption = Gross production + imports – exports – losses. 2. CO2 emissions from fuel combustion only. Emissions are calculated using the IEA Energy Balances and the Revised 2006 IPCC Guidelines, and exclude emissions from non-energy use.

Key World Energy Statistics Energy indicators
67
Selected indicators for 2018 TES/ pop.
(toe/capita)
TES/ GDP
(toe/000 2015 USD)
TES/ GDP(PPP)
(toe/000 2015 USD)
Elec. cons./pop.
(kWh/ capita)
CO2/ TES
(tCO2/toe)
CO2/ pop.
(tCO2/ capita)
CO2/ GDP
(kgCO2/ 2015 USD)
CO2/GDP (PPP)
(kgCO2/ 2015 USD)
Region / Country / Economy
1.81 0.43 0.14 2 303 3.67 6.67 1.57 0.51 Mongolia 1.70 0.23 0.09 5 003 2.38 4.05 0.55 0.22 Montenegro 0.57 0.19 0.07 917 2.86 1.63 0.54 0.20 Morocco 0.35 0.59 0.26 462 0.57 0.20 0.33 0.14 Mozambique 0.44 0.33 0.07 349 1.32 0.59 0.44 0.09 Myanmar 0.84 0.18 0.08 1 715 1.89 1.59 0.33 0.15 Namibia 0.50 0.56 0.17 233 0.80 0.40 0.45 0.14 Nepal 4.23 0.09 0.08 6 796 2.07 8.76 0.18 0.16 Netherlands 4.21 0.10 0.11 8 517 1.54 6.48 0.16 0.16 New Zealand 0.62 0.30 0.12 597 1.24 0.76 0.37 0.15 Nicaragua 0.15 0.39 0.15 72 0.68 0.10 0.27 0.10 Niger 0.82 0.32 0.14 157 0.65 0.53 0.21 0.09 Nigeria 1.24 0.24 0.08 3 136 2.69 3.33 0.65 0.23 North Macedonia (Rep. of) 5.33 0.07 0.09 24 047 1.27 6.78 0.09 0.11 Norway 5.29 0.35 0.13 7 046 2.69 14.24 0.93 0.36 Oman 0.52 0.35 0.10 593 1.74 0.91 0.61 0.17 Pakistan 1.03 0.07 0.04 2 272 2.16 2.22 0.15 0.09 Panama 1.04 0.18 0.08 1 867 1.11 1.16 0.20 0.09 Paraguay 0.79 0.12 0.06 1 532 1.97 1.56 0.24 0.11 Peru 0.56 0.17 0.07 846 2.20 1.24 0.37 0.15 Philippines 2.75 0.19 0.09 4 343 2.89 7.96 0.56 0.26 Poland 2.14 0.10 0.07 5 049 2.15 4.59 0.22 0.14 Portugal
15.60 0.25 0.13 16 580 2.00 31.27 0.51 0.26 Qatar 1.72 0.16 0.07 2 838 2.13 3.68 0.34 0.14 Romania 5.26 0.53 0.21 6 917 2.09 10.98 1.12 0.43 Russian Federation 6.34 0.32 0.12 10 239 2.30 14.59 0.73 0.28 Saudi Arabia 0.29 0.21 0.08 264 1.77 0.51 0.37 0.14 Senegal 2.20 0.35 0.13 4 728 2.92 6.42 1.03 0.38 Serbia 6.69 0.11 0.07 9 323 1.25 8.40 0.14 0.09 Singapore 3.19 0.18 0.10 5 402 1.82 5.81 0.33 0.18 Slovak Republic 3.35 0.14 0.09 7 215 1.97 6.58 0.28 0.19 Slovenia
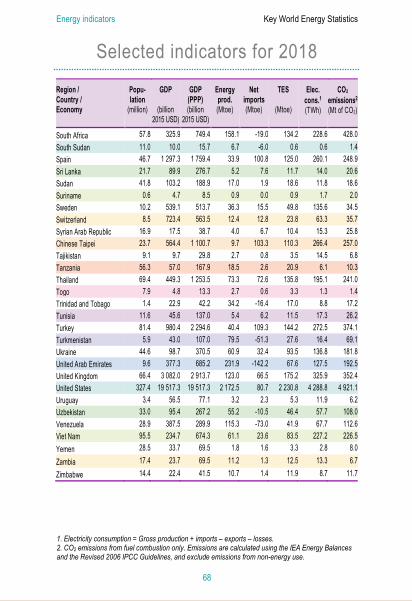
Energy indicators Key World Energy Statistics
68
Selected indicators for 2018 Region / Country / Economy
Popu-lation
(million)
GDP
(billion 2015 USD)
GDP (PPP) (billion
2015 USD)
Energy prod. (Mtoe)
Net imports (Mtoe)
TES
(Mtoe)
Elec. cons.1
(TWh)
CO2 emissions2
(Mt of CO2)
South Africa 57.8 325.9 749.4 158.1 -19.0 134.2 228.6 428.0 South Sudan 11.0 10.0 15.7 6.7 -6.0 0.6 0.6 1.4 Spain 46.7 1 297.3 1 759.4 33.9 100.8 125.0 260.1 248.9 Sri Lanka 21.7 89.9 276.7 5.2 7.6 11.7 14.0 20.6 Sudan 41.8 103.2 188.9 17.0 1.9 18.6 11.8 18.6 Suriname 0.6 4.7 8.5 0.9 0.0 0.9 1.7 2.0 Sweden 10.2 539.1 513.7 36.3 15.5 49.8 135.6 34.5 Switzerland 8.5 723.4 563.5 12.4 12.8 23.8 63.3 35.7 Syrian Arab Republic 16.9 17.5 38.7 4.0 6.7 10.4 15.3 25.8 Chinese Taipei 23.7 564.4 1 100.7 9.7 103.3 110.3 266.4 257.0 Tajikistan 9.1 9.7 29.8 2.7 0.8 3.5 14.5 6.8 Tanzania 56.3 57.0 167.9 18.5 2.6 20.9 6.1 10.3 Thailand 69.4 449.3 1 253.5 73.3 72.6 135.8 195.1 241.0 Togo 7.9 4.8 13.3 2.7 0.6 3.3 1.3 1.4 Trinidad and Tobago 1.4 22.9 42.2 34.2 -16.4 17.0 8.8 17.2 Tunisia 11.6 45.6 137.0 5.4 6.2 11.5 17.3 26.2 Turkey 81.4 980.4 2 294.6 40.4 109.3 144.2 272.5 374.1 Turkmenistan 5.9 43.0 107.0 79.5 -51.3 27.6 16.4 69.1 Ukraine 44.6 98.7 370.5 60.9 32.4 93.5 136.8 181.8 United Arab Emirates 9.6 377.3 685.2 231.9 -142.2 67.6 127.5 192.5 United Kingdom 66.4 3 082.0 2 913.7 123.0 66.5 175.2 325.9 352.4 United States 327.4 19 517.3 19 517.3 2 172.5 80.7 2 230.8 4 288.8 4 921.1 Uruguay 3.4 56.5 77.1 3.2 2.3 5.3 11.9 6.2 Uzbekistan 33.0 95.4 267.2 55.2 -10.5 46.4 57.7 108.0 Venezuela 28.9 387.5 289.9 115.3 -73.0 41.9 67.7 112.6 Viet Nam 95.5 234.7 674.3 61.1 23.6 83.5 227.2 226.5 Yemen 28.5 33.7 69.5 1.8 1.6 3.3 2.8 8.0 Zambia 17.4 23.7 69.5 11.2 1.3 12.5 13.3 6.7 Zimbabwe 14.4 22.4 41.5 10.7 1.4 11.9 8.7 11.7
1. Electricity consumption = Gross production + imports – exports – losses. 2. CO2 emissions from fuel combustion only. Emissions are calculated using the IEA Energy Balances and the Revised 2006 IPCC Guidelines, and exclude emissions from non-energy use.

Key World Energy Statistics Energy indicators
69
Selected indicators for 2018 TES/ pop.
(toe/capita)
TES/ GDP
(toe/000 2015 USD)
TES/ GDP(PPP)
(toe/000 2015 USD)
Elec. cons./pop.
(kWh/ capita)
CO2/ TES
(tCO2/toe)
CO2/ pop.
(tCO2/ capita)
CO2/ GDP
(kgCO2/ 2015 USD)
CO2/GDP (PPP)
(kgCO2/ 2015 USD)
Region / Country / Economy
2.32 0.41 0.18 3 957 3.19 7.41 1.31 0.57 South Africa 0.06 0.06 0.04 51 2.24 0.13 0.14 0.09 South Sudan 2.68 0.10 0.07 5 567 1.99 5.33 0.19 0.14 Spain 0.54 0.13 0.04 647 1.76 0.95 0.23 0.07 Sri Lanka 0.45 0.18 0.10 283 1.00 0.45 0.18 0.10 Sudan 1.62 0.20 0.11 2 990 2.17 3.51 0.43 0.24 Suriname 4.89 0.09 0.10 13 331 0.69 3.39 0.06 0.07 Sweden 2.80 0.03 0.04 7 434 1.50 4.19 0.05 0.06 Switzerland 0.61 0.59 0.27 904 2.48 1.52 1.47 0.67 Syrian Arab Republic 4.65 0.20 0.10 11 227 2.33 10.83 0.46 0.23 Chinese Taipei 0.39 0.36 0.12 1 591 1.93 0.75 0.70 0.23 Tajikistan 0.37 0.37 0.12 109 0.49 0.18 0.18 0.06 Tanzania 1.96 0.30 0.11 2 810 1.77 3.47 0.54 0.19 Thailand 0.42 0.68 0.25 162 0.44 0.18 0.30 0.11 Togo
12.25 0.74 0.40 6 331 1.01 12.37 0.75 0.41 Trinidad and Tobago 0.99 0.25 0.08 1 498 2.29 2.27 0.58 0.19 Tunisia 1.77 0.15 0.06 3 348 2.59 4.60 0.38 0.16 Turkey 4.73 0.64 0.26 2 809 2.50 11.82 1.61 0.65 Turkmenistan 2.10 0.95 0.25 3 065 1.94 4.07 1.84 0.49 Ukraine 7.02 0.18 0.10 13 242 2.85 19.99 0.51 0.28 United Arab Emirates 2.64 0.06 0.06 4 906 2.01 5.30 0.11 0.12 United Kingdom 6.81 0.11 0.11 13 098 2.21 15.03 0.25 0.25 United States 1.53 0.09 0.07 3 450 1.18 1.80 0.11 0.08 Uruguay 1.41 0.49 0.17 1 750 2.33 3.28 1.13 0.40 Uzbekistan 1.45 0.11 0.14 2 346 2.69 3.90 0.29 0.39 Venezuela 0.87 0.36 0.12 2 378 2.71 2.37 0.97 0.34 Viet Nam 0.12 0.10 0.05 100 2.43 0.28 0.24 0.12 Yemen 0.72 0.53 0.18 767 0.53 0.39 0.28 0.10 Zambia 0.82 0.53 0.29 602 0.98 0.81 0.52 0.28 Zimbabwe
Sources: Energy data: IEA, World Energy Balances, 2020. Population, GDP and GDP(PPP) (in 2015 USD): OECD/World Bank/Base CHELEM-PIB, CEPII Bureau van Dijk.

Conversion factors Key World Energy Statistics
70
Conversion factors and unit abbreviations
General conversion factors for energy
To: TJ Gcal Mtoe MBtu GWh
From: multiply by:
TJ 1 2.388 x 10² 2.388 x10⁻⁵ 9.478 x 10² 2.778 x 10⁻¹
Gcal 4.187 x 10⁻³ 1 1.000 x 10⁻⁷ 3.968 1.163 x 10⁻³
Mtoe 4.187 x 10⁴ 1.000 x 10⁷ 1 3.968 x 10⁷ 1.163 x 10⁴
MBtu 1.055 x 10⁻³ 2.520 x 10⁻¹ 2.520 x 10⁻⁸ 1 2.931 x 10⁻⁴
GWh 3.600 8.598 x 10² 8.598 x 10⁻⁵ 3.412 x 10³ 1
Conversion factors for mass
To: kg t lt st lb
From: multiply by:
kilogramme (kg) 1 1.000 x 10⁻³ 9.842 x 10⁻⁴ 1.102 x 10⁻³ 2.205
tonne (t) 1.000 x 10³ 1 9.842 x 10⁻¹ 1.102 2.205 x 10³
long ton (lt) 1.016 x 10³ 1.016 1 1.120 2.240 x 10³
short ton (st) 9.072 x 10² 9.072 x 10⁻¹ 8.929 x 10⁻¹ 1 2.000 x 10³
pound (lb) 4.536 x 10⁻¹ 4.536 x 10⁻⁴ 4.464 x 10⁻⁴ 5.000 x 10⁻⁴ 1
Conversion factors for volume
To: gal U.S. gal U.K. bbl ft3 l m3
From: multiply by:
U.S. gallon (gal) 1 8.327 x 10⁻¹ 2.381 x 10⁻² 1.337 x 10⁻¹ 3.785 3.785 x 10⁻³
U.K. gallon (gal) 1.201 1 2.859 x 10⁻² 1.605 x 10⁻¹ 4.546 4.546 x 10⁻³
barrel (bbl) 4.200 x 101 3.497 x 101 1 5.615 1.590 x 10² 1.590 x 10⁻¹
cubic foot (ft3) 7.481 6.229 1.781 x 10⁻¹ 1 2.832 x 101 2.832 x 10⁻²
litre (l) 2.642 x 101 2.200 x 10⁻¹ 6.290 x 10⁻³ 3.531 x 10⁻² 1 1.000 x 10⁻³
cubic metre (m3) 2.642 x 10² 2.200 x 10² 6.290 3.531 x 101 1.000 x 10³ 1
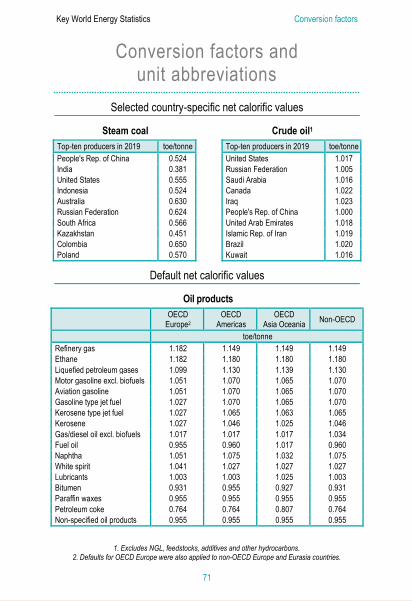
Key World Energy Statistics Conversion factors
71
Conversion factors and unit abbreviations
Selected country-specific net calorific values
Steam coal Crude oil1
Top-ten producers in 2019 toe/tonne Top-ten producers in 2019 toe/tonne People's Rep. of China 0.524 United States 1.017 India 0.381 Russian Federation 1.005 United States 0.555 Saudi Arabia 1.016 Indonesia 0.524 Canada 1.022 Australia 0.630 Iraq 1.023 Russian Federation 0.624 People's Rep. of China 1.000 South Africa 0.566 United Arab Emirates 1.018 Kazakhstan 0.451 Islamic Rep. of Iran 1.019 Colombia 0.650 Brazil 1.020 Poland 0.570 Kuwait 1.016
Default net calorific values
Oil products OECD
Europe2 OECD
Americas OECD
Asia Oceania Non-OECD
toe/tonne Refinery gas 1.182 1.149 1.149 1.149 Ethane 1.182 1.180 1.180 1.180 Liquefied petroleum gases 1.099 1.130 1.139 1.130 Motor gasoline excl. biofuels 1.051 1.070 1.065 1.070 Aviation gasoline 1.051 1.070 1.065 1.070 Gasoline type jet fuel 1.027 1.070 1.065 1.070 Kerosene type jet fuel 1.027 1.065 1.063 1.065 Kerosene 1.027 1.046 1.025 1.046 Gas/diesel oil excl. biofuels 1.017 1.017 1.017 1.034 Fuel oil 0.955 0.960 1.017 0.960 Naphtha 1.051 1.075 1.032 1.075 White spirit 1.041 1.027 1.027 1.027 Lubricants 1.003 1.003 1.025 1.003 Bitumen 0.931 0.955 0.927 0.931 Paraffin waxes 0.955 0.955 0.955 0.955 Petroleum coke 0.764 0.764 0.807 0.764 Non-specified oil products 0.955 0.955 0.955 0.955
1. Excludes NGL, feedstocks, additives and other hydrocarbons. 2. Defaults for OECD Europe were also applied to non-OECD Europe and Eurasia countries.
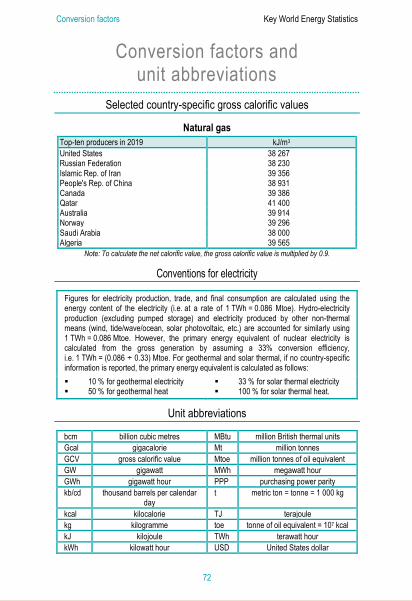
Conversion factors Key World Energy Statistics
72
Conversion factors and unit abbreviations
Selected country-specific gross calorific values
Natural gas Top-ten producers in 2019 kJ/m3 United States 38 267 Russian Federation 38 230 Islamic Rep. of Iran 39 356 People's Rep. of China 38 931 Canada 39 386 Qatar 41 400 Australia 39 914 Norway 39 296 Saudi Arabia 38 000 Algeria 39 565
Note: To calculate the net calorific value, the gross calorific value is multiplied by 0.9.
Conventions for electricity
Figures for electricity production, trade, and final consumption are calculated using the energy content of the electricity (i.e. at a rate of 1 TWh = 0.086 Mtoe). Hydro-electricity production (excluding pumped storage) and electricity produced by other non-thermal means (wind, tide/wave/ocean, solar photovoltaic, etc.) are accounted for similarly using 1 TWh = 0.086 Mtoe. However, the primary energy equivalent of nuclear electricity is calculated from the gross generation by assuming a 33% conversion efficiency, i.e. 1 TWh = (0.086 ÷ 0.33) Mtoe. For geothermal and solar thermal, if no country-specific information is reported, the primary energy equivalent is calculated as follows: 10 % for geothermal electricity 50 % for geothermal heat
33 % for solar thermal electricity 100 % for solar thermal heat.
Unit abbreviations
bcm billion cubic metres MBtu million British thermal units Gcal gigacalorie Mt million tonnes GCV gross calorific value Mtoe million tonnes of oil equivalent GW gigawatt MWh megawatt hour GWh gigawatt hour PPP purchasing power parity kb/cd thousand barrels per calendar
day t metric ton = tonne = 1 000 kg
kcal kilocalorie TJ terajoule kg kilogramme toe tonne of oil equivalent = 107 kcal kJ kilojoule TWh terawatt hour kWh kilowatt hour USD United States dollar
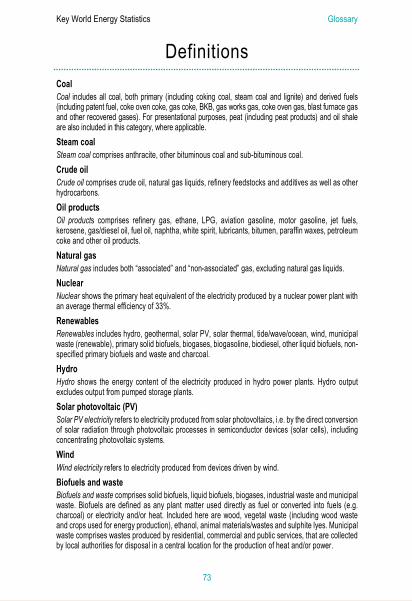
Key World Energy Statistics Glossary
73
Definitions Coal Coal includes all coal, both primary (including coking coal, steam coal and lignite) and derived fuels (including patent fuel, coke oven coke, gas coke, BKB, gas works gas, coke oven gas, blast furnace gas and other recovered gases). For presentational purposes, peat (including peat products) and oil shale are also included in this category, where applicable. Steam coal Steam coal comprises anthracite, other bituminous coal and sub-bituminous coal. Crude oil Crude oil comprises crude oil, natural gas liquids, refinery feedstocks and additives as well as other hydrocarbons. Oil products Oil products comprises refinery gas, ethane, LPG, aviation gasoline, motor gasoline, jet fuels, kerosene, gas/diesel oil, fuel oil, naphtha, white spirit, lubricants, bitumen, paraffin waxes, petroleum coke and other oil products. Natural gas Natural gas includes both “associated” and “non-associated” gas, excluding natural gas liquids. Nuclear Nuclear shows the primary heat equivalent of the electricity produced by a nuclear power plant with an average thermal efficiency of 33%. Renewables Renewables includes hydro, geothermal, solar PV, solar thermal, tide/wave/ocean, wind, municipal waste (renewable), primary solid biofuels, biogases, biogasoline, biodiesel, other liquid biofuels, non-specified primary biofuels and waste and charcoal. Hydro Hydro shows the energy content of the electricity produced in hydro power plants. Hydro output excludes output from pumped storage plants. Solar photovoltaic (PV) Solar PV electricity refers to electricity produced from solar photovoltaics, i.e. by the direct conversion of solar radiation through photovoltaic processes in semiconductor devices (solar cells), including concentrating photovoltaic systems. Wind Wind electricity refers to electricity produced from devices driven by wind. Biofuels and waste Biofuels and waste comprises solid biofuels, liquid biofuels, biogases, industrial waste and municipal waste. Biofuels are defined as any plant matter used directly as fuel or converted into fuels (e.g. charcoal) or electricity and/or heat. Included here are wood, vegetal waste (including wood waste and crops used for energy production), ethanol, animal materials/wastes and sulphite lyes. Municipal waste comprises wastes produced by residential, commercial and public services, that are collected by local authorities for disposal in a central location for the production of heat and/or power.

Glossary Key World Energy Statistics
74
Definitions Other (Energy source) Other includes geothermal, solar, wind, tide/wave/ocean energy, electricity and heat. Unless the actual efficiency of geothermal and solar thermal is known, the quantity of geothermal and solar energy entering electricity generation is inferred from the electricity/heat production at geothermal and solar plants assuming an average thermal efficiency of: 10% for geothermal electricity 50% for geothermal heat
33% for solar thermal electricity 100% for solar thermal heat.
For solar PV, wind and tide/wave/ocean energy, the quantities entering electricity generation are equal to the electrical energy generated. Direct use of geothermal and solar heat is also included here. Electricity is accounted for at the same heat value as electricity in final consumption (i.e. 1 GWh = 0.000086 Mtoe). Heat includes heat that is produced for sale and is accounted for in the transformation sector.
Production Production is the production of primary energy, i.e. coking coal, steam coal, lignite, peat, oil shale, crude oil, NGLs, natural gas, biofuels and waste, nuclear, hydro, geothermal, solar, wind and the heat from heat pumps that is extracted from the ambient environment. Production is calculated after removal of impurities (e.g. sulphur from natural gas).
Imports and exports Imports and exports comprise amounts having crossed the national territorial boundaries of the country, whether or not customs clearance has taken place. a) Oil and natural gas Quantities of crude oil and oil products imported or exported under processing agreements (i.e. refining on account) are included. Quantities of oil in transit are excluded. Crude oil, NGL and natural gas are reported as coming from the country of origin; refinery feedstocks and oil products are reported as coming from the country of last consignment. Re-exports of oil imported for processing within bonded areas are shown as exports of product from the processing country to the final destination. b) Coal Imports and exports comprise the amount of fuels obtained from or supplied to other countries, whether or not there is an economic or customs union between the relevant countries. Coal in transit is not included. c) Electricity Amounts are considered as imported or exported when they have crossed the national territorial boundaries of the country.
International marine bunkers International marine bunkers covers those quantities delivered to ships of all flags that are engaged in international navigation. The international navigation may take place at sea, on inland lakes and waterways, and in coastal waters. Consumption by ships engaged in domestic navigation is excluded. The domestic/international split is determined on the basis of port of departure and port of arrival, and not by the flag or nationality of the ship. Consumption by fishing vessels and by military forces is also excluded.

Key World Energy Statistics Glossary
75
Definitions International aviation bunkers International aviation bunkers covers deliveries of aviation fuels to aircraft for international aviation. Fuels used by airlines for their road vehicles are excluded. The domestic/international split should be determined on the basis of departure and landing locations and not by the nationality of the airline. For many countries this incorrectly excludes fuel used by domestically owned carriers for their international departures. Stock changes Stock changes reflects the difference between opening stock levels on the first day of the year and closing levels on the last day of the year of stocks on national territory held by producers, importers, energy transformation industries and large consumers. A stock build is shown as a negative number, and a stock draw as a positive number. Total energy supply (TES) Total energy supply (TES) is made up of production + imports – exports – international marine bunkers – international aviation bunkers ± stock changes. For the world total, international marine bunkers and international aviation bunkers are not subtracted from TES. Transfers Transfers includes both interproduct transfers, products transferred and recycled products (e.g. used lubricants which are reprocessed). Statistical differences Statistical differences are essentially the difference between supply and demand. They include the sum of the unexplained statistical differences for individual fuels, as they appear in the basic energy statistics. They also include the statistical differences that arise because of the variety of conversion factors in the coal and oil columns. Electricity plants Electricity plants refers to plants which are designed to produce electricity only. If one or more units of the plant is a CHP unit (and the inputs and outputs cannot be distinguished on a unit basis) then the whole plant is designated as a CHP plant. Both main activity producers and autoproducer plants are included here. Oil refineries Oil refineries shows the use of primary energy for the manufacture of finished oil products and the corresponding output. Thus, the total reflects transformation losses. In certain cases the data in the total column are positive numbers. This can be due to either problems in the primary refinery balance or to the fact that the IEA uses regional net calorific values for oil products. Other transformation Other transformation covers non-specified transformation not shown elsewhere, such as the transformation of primary solid biofuels into charcoal. Energy industry own use Energy industry own use contains the primary and secondary energy consumed by transformation industries for heating, pumping, traction and lighting purposes [ISIC 05, 06, 19 and 35, Group 091 and Classes 0892 and 0721].

Glossary Key World Energy Statistics
76
Definitions Losses Losses include losses in energy distribution, transmission and transport. Total final consumption (TFC) Total final consumption (TFC) is the sum of consumption by the different end-use sectors and also includes non-energy use. Backflows from the petrochemical industry are not included in final consumption. Industry Industry consumption is specified by sub-sector as listed below. Energy used for transport by industry is not included here but is reported under transport. Non-energy use in industry is excluded from industry and reported separately: Mining (excluding fuels) and quarrying [ISIC Divisions 07 and 08 and Group 099] Construction [ISIC Divisions 41 to 43] Iron and steel industry [ISIC Group 241 and Class 2431] Chemical and petrochemical industry [ISIC Divisions 20 and 21] excluding petrochemical feedstocks Non-ferrous metals basic industries [ISIC Group 242 and Class 2432] Non-metallic minerals such as glass, ceramic, cement, etc. [ISIC Division 23] Transport equipment [ISIC Divisions 29 and 30] Machinery comprises fabricated metal products. machinery and equipment other than transport
equipment [ISIC Divisions 25 to 28] Food and tobacco [ISIC Divisions 10 to 12] Paper. pulp and printing [ISIC Divisions 17 and 18] Wood and wood products (other than pulp and paper) [ISIC Division 16] Textile and leather [ISIC Divisions 13 to 15] Non-specified (any manufacturing industry not included above) [ISIC Divisions 22. 31 and 32]. Transport Transport includes all fuels used for transport [ISIC Divisions 49 to 51]. It includes transport in industry and covers domestic aviation, road, rail, pipeline transport, domestic navigation and non-specified transport. Fuel used for ocean, coastal and inland fishing (included under fishing) and military consumption (included in other non-specified) are excluded from transport. Please note that international marine and international aviation bunkers are also included here for world total. Non-energy use in transport is excluded from transport and reported separately. Other (Energy final consumption) Other covers residential, commercial and public services [ISIC Divisions 33, 36-39, 45-47, 52, 53, 55, 56, 58-66, 68-75, 77-82, 84 (excluding Class 8422), 85-88, 90-99], agriculture/forestry [ISIC Divisions 01 and 02], fishing [ISIC Division 03] and non-specified consumption. Non-energy use Non-energy use covers those fuels that are used as raw materials in the different sectors and are not consumed as a fuel or transformed into another fuel. Non-energy use also includes petrochemical feedstocks. Non-energy use is shown separately in final consumption under the heading non-energy use.

Key World Energy Statistics Glossary
77
Geographical coverage World OECD1 Total, Africa, Non-OECD Americas, Non-OECD Asia (excluding China), China (People’s Republic of China and Hong Kong, China), Non-OECD Europe and Eurasia, Middle East, World aviation bunkers and World marine bunkers. It is also the sum of Africa, Americas, Asia, Europe, Oceania, World aviation bunkers and World marine bunkers. Africa Algeria, Angola, Benin, Botswana, Burkina Faso, Burundi, Cabo Verde, Cameroon, Central African Republic, Chad, Comoros, the Republic of the Congo (Congo), Côte d’Ivoire, the Democratic Republic of the Congo, Djibouti, Egypt, Equatorial Guinea, Eritrea, the Kingdom of Eswatini, Ethiopia, Gabon, Gambia, Ghana, Guinea, Guinea-Bissau, Kenya, Lesotho, Liberia, Libya, Madagascar, Malawi, Mali, Mauritania, Mauritius, Morocco, Mozambique, Namibia, Niger, Nigeria, Réunion (until 2010), Rwanda, Sao Tome and Principe, Senegal, the Seychelles, Sierra Leone, Somalia, South Africa, South Sudan (from 2012), Sudan, the United Republic of Tanzania (Tanzania), Togo, Tunisia, Uganda, Zambia, Zimbabwe. Americas Antigua and Barbuda, Argentina, Aruba, the Bahamas, Barbados, Belize, Bermuda, the Plurinational State of Bolivia (Bolivia), Bonaire (from 2012), the British Virgin Islands, Brazil, Canada, the Cayman Islands, Chile, Colombia, Costa Rica, Cuba, Curaçao2, Dominica, the Dominican Republic, Ecuador, El Salvador, the Falkland Islands (Malvinas), Guatemala, French Guiana (until 2010), Grenada, Guadeloupe (until 2010), Guyana, Haiti, Honduras, Jamaica, Martinique (until 2010), Mexico, Montserrat, Nicaragua, Panama, Paraguay, Peru, Puerto Rico9, Saba (from 2012), Saint Kitts and Nevis, Saint Lucia, Saint Pierre and Miquelon, Saint Vincent and the Grenadines, Sint Eustatius (from 2012), Sint Maarten (from 2012), Suriname, Trinidad and Tobago, the Turks and Caicos Islands, the United States, Uruguay, the Bolivarian Republic of Venezuela (Venezuela). Asia (from 1990) Afghanistan, Armenia, Azerbaijan, Bahrain, Bangladesh, Bhutan, Brunei Darussalam, Cambodia, the People’s Republic of China, Cyprus3, Georgia, Hong Kong (China), India, Indonesia, the Islamic Republic of Iran, Iraq, Israel4 , Japan, Jordan, the Democratic People’s Republic of Korea, Korea, Kazakhstan, Kuwait, Kyrgyzstan, Lao People’s Democratic Republic, Lebanon, Macau, China, Malaysia, the Maldives, Mongolia, Myanmar, Nepal, Oman, Pakistan, the Philippines, Qatar, Saudi Arabia, Singapore, Sri Lanka, the Syrian Arab Republic, Tajikistan, Chinese Taipei, Thailand, Timor-Leste, Turkey, Turkmenistan, the United Arab Emirates, Uzbekistan, Viet Nam, and Yemen. Europe (from 1990) Albania, Austria, Belarus, Belgium, Bosnia and Herzegovina, Bulgaria, Croatia, the Czech Republic, Denmark, Estonia, Finland, France5, Germany, Gibraltar, Greece, Hungary, Iceland, Ireland, Italy, Kosovo6, Latvia, Lithuania, Luxembourg, Malta, the Republic of Moldova (Moldova), Montenegro, the Netherlands, the Republic of North Macedonia, Norway, Poland, Portugal, Romania, the Russian Federation, Serbia7, the Slovak Republic, Slovenia, Spain, Sweden, Switzerland, Ukraine, the United Kingdom. Oceania Australia, New Zealand, Cook Islands, Fiji, French Polynesia, Kiribati, New Caledonia, Palau, Papua New Guinea, Samoa, the Solomon Islands, Tonga, Vanuatu.
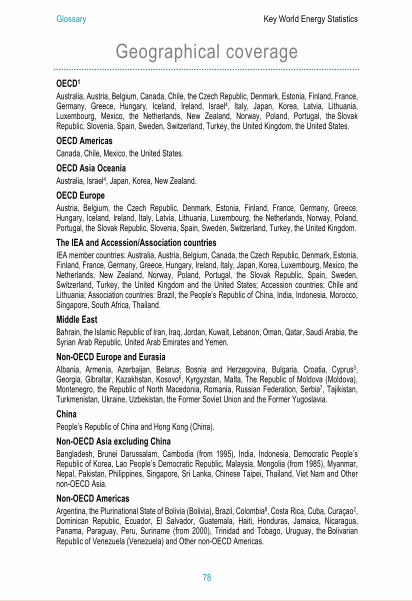
Glossary Key World Energy Statistics
78
Geographical coverage OECD1 Australia, Austria, Belgium, Canada, Chile, the Czech Republic, Denmark, Estonia, Finland, France, Germany, Greece, Hungary, Iceland, Ireland, Israel4, Italy, Japan, Korea, Latvia, Lithuania, Luxembourg, Mexico, the Netherlands, New Zealand, Norway, Poland, Portugal, the Slovak Republic, Slovenia, Spain, Sweden, Switzerland, Turkey, the United Kingdom, the United States. OECD Americas Canada, Chile, Mexico, the United States. OECD Asia Oceania Australia, Israel4, Japan, Korea, New Zealand. OECD Europe Austria, Belgium, the Czech Republic, Denmark, Estonia, Finland, France, Germany, Greece, Hungary, Iceland, Ireland, Italy, Latvia, Lithuania, Luxembourg, the Netherlands, Norway, Poland, Portugal, the Slovak Republic, Slovenia, Spain, Sweden, Switzerland, Turkey, the United Kingdom. The IEA and Accession/Association countries IEA member countries: Australia, Austria, Belgium, Canada, the Czech Republic, Denmark, Estonia, Finland, France, Germany, Greece, Hungary, Ireland, Italy, Japan, Korea, Luxembourg, Mexico, the Netherlands, New Zealand, Norway, Poland, Portugal, the Slovak Republic, Spain, Sweden, Switzerland, Turkey, the United Kingdom and the United States; Accession countries: Chile and Lithuania; Association countries: Brazil, the People’s Republic of China, India, Indonesia, Morocco, Singapore, South Africa, Thailand. Middle East Bahrain, the Islamic Republic of Iran, Iraq, Jordan, Kuwait, Lebanon, Oman, Qatar, Saudi Arabia, the Syrian Arab Republic, United Arab Emirates and Yemen. Non-OECD Europe and Eurasia Albania, Armenia, Azerbaijan, Belarus, Bosnia and Herzegovina, Bulgaria, Croatia, Cyprus3, Georgia, Gibraltar, Kazakhstan, Kosovo6, Kyrgyzstan, Malta, The Republic of Moldova (Moldova), Montenegro, the Republic of North Macedonia, Romania, Russian Federation, Serbia7, Tajikistan, Turkmenistan, Ukraine, Uzbekistan, the Former Soviet Union and the Former Yugoslavia. China People’s Republic of China and Hong Kong (China). Non-OECD Asia excluding China Bangladesh, Brunei Darussalam, Cambodia (from 1995), India, Indonesia, Democratic People’s Republic of Korea, Lao People’s Democratic Republic, Malaysia, Mongolia (from 1985), Myanmar, Nepal, Pakistan, Philippines, Singapore, Sri Lanka, Chinese Taipei, Thailand, Viet Nam and Other non-OECD Asia. Non-OECD Americas Argentina, the Plurinational State of Bolivia (Bolivia), Brazil, Colombia8, Costa Rica, Cuba, Curaçao2, Dominican Republic, Ecuador, El Salvador, Guatemala, Haiti, Honduras, Jamaica, Nicaragua, Panama, Paraguay, Peru, Suriname (from 2000), Trinidad and Tobago, Uruguay, the Bolivarian Republic of Venezuela (Venezuela) and Other non-OECD Americas.

Key World Energy Statistics Glossary
79
Geographical coverage 1. OECD includes Estonia, Latvia, Lithuania and Slovenia starting in 1990. Prior to 1990, Estonia, Latvia and Lithuania are included in Former Soviet Union and Slovenia is included in Former Yugoslavia. 2. The Netherlands Antilles was dissolved on 10 October 2010, resulting in two new constituent countries, Curaçao and Sint Maarten, with the other islands joining the Netherlands as special municipalities. From 2012 onwards, data now account for the energy statistics of Curaçao Island only. Prior to 2012, data remain unchanged and still cover the entire territory of the former Netherlands Antilles. 3. Note by Turkey: The information in this document with reference to “Cyprus” relates to the southern part of the Island. There is no single authority representing both Turkish and Greek Cypriot people on the Island. Turkey recognises the Turkish Republic of Northern Cyprus (TRNC). Until a lasting and equitable solution is found within the context of United Nations, Turkey shall preserve its position concerning the “Cyprus issue”. Note by all the European Union member states of the OECD and the European Union: The Republic of Cyprus is recognised by all members of the United Nations with the exception of Turkey. The information in this document relates to the area under the effective control of the Government of the Republic of Cyprus. 4. The statistical data for Israel are supplied by and under the responsibility of the relevant Israeli authorities. The use of such data by the OECD is without prejudice to the status of the Golan Heights, East Jerusalem and Israeli settlements in the West Bank under the terms of international law. 5. Data for the overseas departments are included in Europe starting with 2011, and in other regions as appropriate (America or Africa) until 2010. 6. This designation is without prejudice to positions on status, and is in line with United Nations Security Council Resolution 1244/99 and the Advisory Opinion of the International Court of Justice on Kosovo’s declaration of independence. 7. Serbia includes Montenegro until 2004 and Kosovo until 1999. 8. Data for Colombia, that joined the OECD in April 2020, are not included in the OECD aggregate in this publication. 9. Natural gas and electricity data for Puerto Rico are included under Other non-OECD Americas, except for input to and output to electricity and heat generation, included under the United States starting with 2017 data.
Note: The countries listed above are those for which the IEA Secretariat has direct statistics contacts. This document is without prejudice to the status of or sovereignty over any territory, to the delimitation of international frontiers and boundaries and to the name of any territory, city or area. In this publication ‘country’ refers to country or territory, as the case may be.
Key World Energy Statistics
Please note that this publication is subject to specific restrictions that limit its use and distribution. The terms and conditions are available online at www.iea.org/t&c.
This publication reflects the views of the IEA Secretariat but does not necessarily reflect those of individual IEA member countries. The IEA makes no representation or warranty, express or implied, in respect of the publication’s contents (including its completeness or accuracy) and shall not be responsible for any use of, or reliance on, the publication. Unless otherwise indicated, all material presented in figures and tables is derived from IEA data and analysis.
This publication and any map included herein are without prejudice to the status of or sovereignty over any territory, to the delimitation of international frontiers and boundaries and to the name of any territory, city or area.
IEA. All rights reserved.
IEA Publications International Energy Agency Website: www.iea.org Contact information: www.iea.org/about/contact
Typeset in France by IEA - August 2020Cover design: IEA
80


