Kimberley – population and health status Page | 1 With thanks to WA Country Health Service for permission to use data from various sources including the Kimberley Regional Health Profile 2012 which can be accessed at http://www.wacountry.health.wa.gov.au/fileadmin/sections/publications/Kimberley_Health_Care_Profile_FINAL12_APRIL_2012.pdf When planning new outreach health services focus on current gaps and using an effective team approach model. The Kimberley region is the State’s most Northern region forming part of the Northern and Remote Country Health Service and is within the boundaries of the Kimberley-Pilbara Medicare Local. The region is remote from metropolitan areas, with major towns of Broome being 2,213 kilometres and Kununurra being 3,205 kilometres from Perth by road. Other major towns include Derby, Halls Creek, Wyndham and Fitzroy Crossing. There are over 100 Aboriginal communities throughout the region of varying population sizes. The region encompasses an area of 424,517 square kilometres and is almost twice the size of the State of Victoria. The Kimberley has a diverse economy, with mining, tourism, agriculture and pearling all major contributors to its economic output. There are multiple commercial and charter air services and an extensive road network. Only 25% of roads in the region are sealed, with many being inaccessible during the wet season (November to April). The towns of Broome, Derby and Wyndham have sea ports which are gateways for the Region's imports and exports. These sea ports operate as trade links for the Kimberley region. There is also a State government-run north-west shipping service which operates between the ports of Fremantle, Broome, Wyndham and Darwin. Leading causes of hospitalisation The leading causes of hospitalisation of Kimberley residents between 2006 and 2010 were related to factors influencing health status, contact with health services and injury and poisoning. Table 1:2006-2010 Kimberley residents-Leading causes of hospitalisation Rank Cause of hospitalisation Number % of total State rank 1 Factors influencing health status and contact with health services* 40,928 41.3% 1 2 Injury and poisoning** 9,224 9.3% 5 3 Pregnancy and childbirth 6,517 6.6% 7 4 Respiratory diseases 6,433 6.5% 10 5 Digestive diseases 5,631 5.7% 2 All hospitalisations 99,198 Table 1:2006-2010 Kimberley residents-Leading causes of hospitalisation (WA Morbidity Data System) *Health services for examination and investigation, reproduction, specific procedures, renal dialysis, potential health hazards related to communicable diseases, socioeconomic and psychosocial circumstances, family and personal history. **Transport accidents, other external injuries, intentional self-harm, assault, complications of medical and survival care. Potential preventable hospitalisations Potential preventable hospitalisations (PPH) refers to those hospitalisations which could have been avoided with disease intervention plans and various methods of preventative care. Three categories are identified: acute, chronic and vaccine preventable. During 2006 to 2010 the following Kimberley trends were observed: • PPH accounted for 8,910 (9%) of hospitalisations. This rate was significantly higher (2.6 times) when compared to all residents in the State. • Vaccine preventable conditions were 4.6 times higher in the Kimberley when compared to that of the State. • Diabetes with its complications ranked number one (20% of all PPHs). • Among Aboriginal Kimberley residents the rate of PPH was four times greater than non-Aboriginal Kimberley residents. Population Estimated resident population in 2010 was 35,706, a 12% growth within five years. It is estimated that the population will increase to 46,730 by 2016 and 48,615 by 2021. The region also has a large transient population which will impact on the access to and delivery of health services. The Broome Shire has over 40% of the region’s population, the Derby- West Kimberley Shire 25%, Wyndham-East Kimberley Shire 22% and Halls Creek Shire 12%. The Aboriginal population is larger than the non-Aboriginal population in the Shires of Derby-West Kimberley and Halls Creek. In 2010, 45% or 16,094 of the Kimberley population were Aboriginal people compared to the State‘s proportion of 3%. The Aboriginal population has a younger age structure when compared to the State, with 43% being under 20 years of age. This will have an impact in the planning of health services and programs. Measure of disadvantage Socio-Economic Indexes for Areas (SEIFA) measures a broad range of socio-economic indices. The baseline for SEIFA is 1,000. A score above 1,000 indicates an area of socio-economic advantage and a score below 1,000 indicates an area of disadvantage. Research shows that a lower SEIFA correlates with a lower health status with increased risk factors to ill health.
Transcript
Kimberley – population and health status
Page | 1
With thanks to WA Country Health Service for permission to use data from various sources including the Kimberley Regional Health Profile 2012 which can be accessed at http://www.wacountry.health.wa.gov.au/fileadmin/sections/publications/Kimberley_Health_Care_Profile_FINAL12_APRIL_2012.pdf
When planning new outreach health services focus on current gaps and using an effective team approach model.
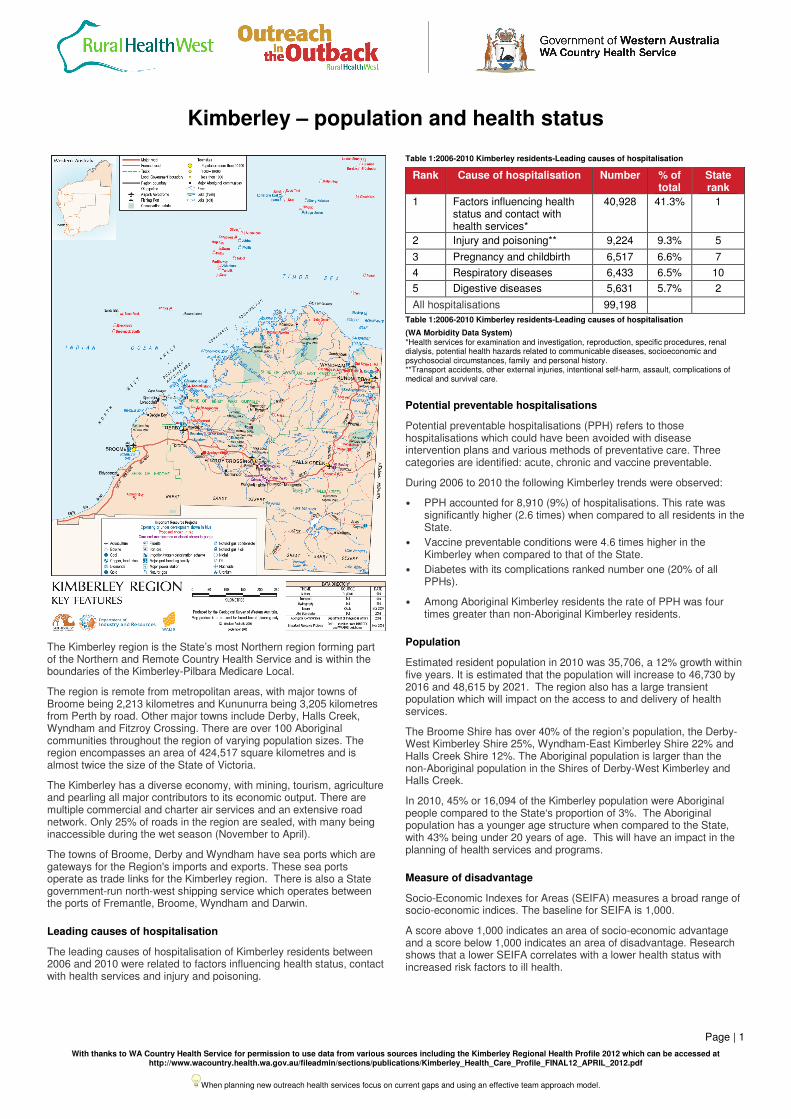
The Kimberley region is the State’s most Northern region forming part of the Northern and Remote Country Health Service and is within the boundaries of the Kimberley-Pilbara Medicare Local.
The region is remote from metropolitan areas, with major towns of Broome being 2,213 kilometres and Kununurra being 3,205 kilometres from Perth by road. Other major towns include Derby, Halls Creek, Wyndham and Fitzroy Crossing. There are over 100 Aboriginal communities throughout the region of varying population sizes. The region encompasses an area of 424,517 square kilometres and is almost twice the size of the State of Victoria.
The Kimberley has a diverse economy, with mining, tourism, agriculture and pearling all major contributors to its economic output. There are multiple commercial and charter air services and an extensive road network. Only 25% of roads in the region are sealed, with many being inaccessible during the wet season (November to April).
The towns of Broome, Derby and Wyndham have sea ports which are gateways for the Region's imports and exports. These sea ports operate as trade links for the Kimberley region. There is also a State government-run north-west shipping service which operates between the ports of Fremantle, Broome, Wyndham and Darwin.
Leading causes of hospitalisation
The leading causes of hospitalisation of Kimberley residents between 2006 and 2010 were related to factors influencing health status, contact with health services and injury and poisoning.
Table 1:2006-2010 Kimberley residents-Leading causes of hospitalisation
Rank Cause of hospitalisation Number % of total
State rank
1 Factors influencing health status and contact with health services*
40,928 41.3% 1
2 Injury and poisoning** 9,224 9.3% 5
3 Pregnancy and childbirth 6,517 6.6% 7
4 Respiratory diseases 6,433 6.5% 10
5 Digestive diseases 5,631 5.7% 2
All hospitalisations 99,198
Table 1:2006-2010 Kimberley residents-Leading causes of hospitalisation
(WA Morbidity Data System) *Health services for examination and investigation, reproduction, specific procedures, renal dialysis, potential health hazards related to communicable diseases, socioeconomic and psychosocial circumstances, family and personal history. **Transport accidents, other external injuries, intentional self-harm, assault, complications of medical and survival care.
Potential preventable hospitalisations
Potential preventable hospitalisations (PPH) refers to those hospitalisations which could have been avoided with disease intervention plans and various methods of preventative care. Three categories are identified: acute, chronic and vaccine preventable.
During 2006 to 2010 the following Kimberley trends were observed:
• PPH accounted for 8,910 (9%) of hospitalisations. This rate was significantly higher (2.6 times) when compared to all residents in the State.
• Vaccine preventable conditions were 4.6 times higher in the Kimberley when compared to that of the State.
• Diabetes with its complications ranked number one (20% of all PPHs).
• Among Aboriginal Kimberley residents the rate of PPH was four times greater than non-Aboriginal Kimberley residents.
Population
Estimated resident population in 2010 was 35,706, a 12% growth within five years. It is estimated that the population will increase to 46,730 by 2016 and 48,615 by 2021. The region also has a large transient population which will impact on the access to and delivery of health services.
The Broome Shire has over 40% of the region’s population, the Derby-West Kimberley Shire 25%, Wyndham-East Kimberley Shire 22% and Halls Creek Shire 12%. The Aboriginal population is larger than the non-Aboriginal population in the Shires of Derby-West Kimberley and Halls Creek.
In 2010, 45% or 16,094 of the Kimberley population were Aboriginal people compared to the State‘s proportion of 3%. The Aboriginal population has a younger age structure when compared to the State, with 43% being under 20 years of age. This will have an impact in the planning of health services and programs.
Measure of disadvantage
Socio-Economic Indexes for Areas (SEIFA) measures a broad range of socio-economic indices. The baseline for SEIFA is 1,000.
A score above 1,000 indicates an area of socio-economic advantage and a score below 1,000 indicates an area of disadvantage. Research shows that a lower SEIFA correlates with a lower health status with increased risk factors to ill health.
Kimberley – population and health status
Page | 2
With thanks to WA Country Health Service for permission to use data from various sources including the Kimberley Regional Health Profile 2012 which can be accessed at http://www.wacountry.health.wa.gov.au/fileadmin/sections/publications/Kimberley_Health_Care_Profile_FINAL12_APRIL_2012.pdf
When planning new outreach health services focus on current gaps and using an effective team approach model.
The 2006* SEIFA scores for towns in the Kimberley are:
• Halls Creek 615
• Broome 942
• Wyndham-East Kimberley 893
• Derby-West Kimberley 774 (ABS 2006)
The SEIFA shows differing levels of disadvantage within the region particularly in remote Aboriginal communities.
*2006 SEIFA is the most up to date data available from ABS, 2011 statistics will be available in 2013
Leading causes of death
During the period 2003-2007, the leading causes of death were diseases of the circulatory system and neoplasms, accounting for nearly 40% of deaths in the Kimberley region.
Table 2: 2003-2007 Kimberley residents - Leading causes of mortality
Rank Cause of mortality Count % of total
1 Diseases of the circulatory system 170 20.1%
2 Neoplasms 161 19%
3 Injury and poisoning 135 16%
4 Endocrine, nutritional and metabolic diseases
70 8.3%
5 Respiratory diseases 66 7.8%
(ABS Mortality Data)
There is still a discrepancy between the life expectancy of Aboriginal people when compared to non-Aboriginal people. During 2003 to 2007, there were 624 deaths of Kimberley Aboriginal residents. There were higher rates for diabetes, cardiovascular disease, respiratory disease, injury and poisoning, mental health, kidney failure, kidney disease, cancer, alcohol-related and tobacco-related conditions when compared to non-Aboriginal residents in the Kimberley region.
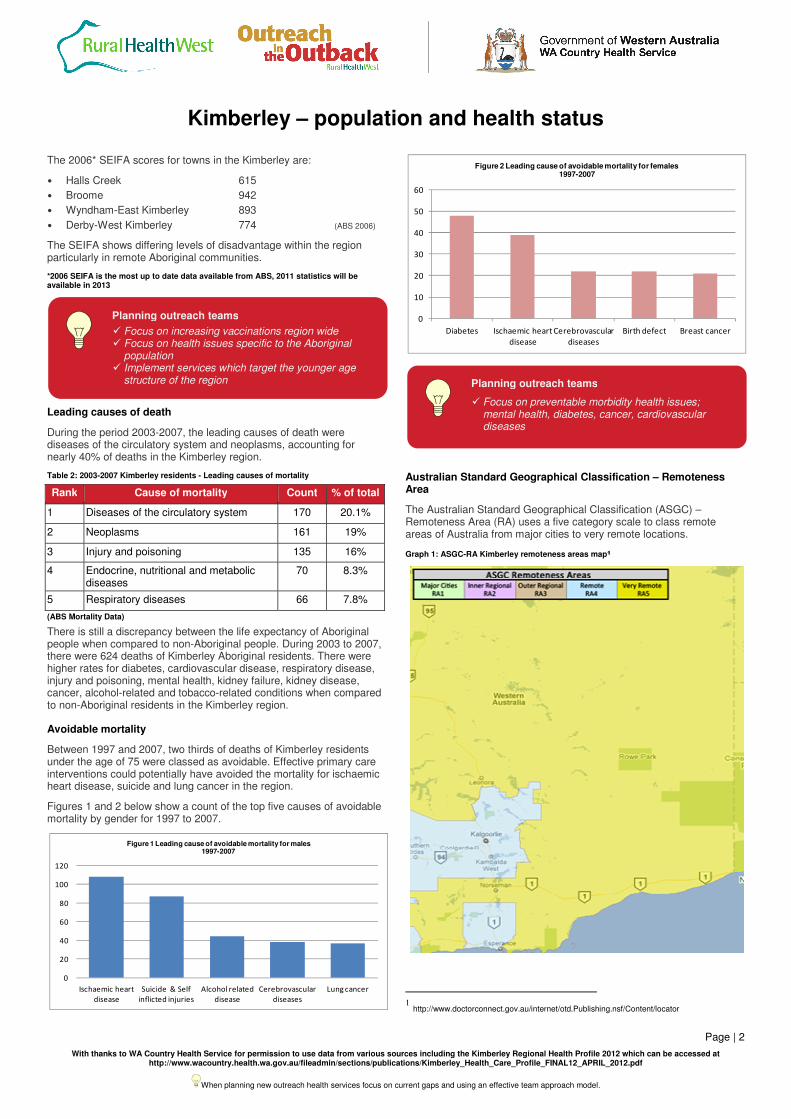
Avoidable mortality
Between 1997 and 2007, two thirds of deaths of Kimberley residents under the age of 75 were classed as avoidable. Effective primary care interventions could potentially have avoided the mortality for ischaemic heart disease, suicide and lung cancer in the region.
Figures 1 and 2 below show a count of the top five causes of avoidable mortality by gender for 1997 to 2007.
Australian Standard Geographical Classification – Remoteness Area
The Australian Standard Geographical Classification (ASGC) – Remoteness Area (RA) uses a five category scale to class remote areas of Australia from major cities to very remote locations.
Figure 1 Leading cause of avoidable mortality for males 1997-2007
0
10
20
30
40
50
60
Diabetes Ischaemic heart
disease
Cerebrovascular
diseases
Birth defect Breast cancer
Figure 2 Leading cause of avoidable mortality for females 1997-2007
Planning outreach teams
� Focus on increasing vaccinations region wide � Focus on health issues specific to the Aboriginal
population � Implement services which target the younger age
structure of the region
Planning outreach teams
� Focus on preventable morbidity health issues; mental health, diabetes, cancer, cardiovascular diseases
Kimberley – population and health status
Page | 3
With thanks to WA Country Health Service for permission to use data from various sources including the Kimberley Regional Health Profile 2012 which can be accessed at http://www.wacountry.health.wa.gov.au/fileadmin/sections/publications/Kimberley_Health_Care_Profile_FINAL12_APRIL_2012.pdf
When planning new outreach health services focus on current gaps and using an effective team approach model.
According to the 2006 ABS Census the following trends were seen for Kimberley residents:
• 47.8% lived in a very remote area
• 52.2% lived in a remote area
Major health service providers
Hospital services
Community and public health
services
Mental health and aged care
services
Aboriginal Medical Services
Broome Hospital
Community Health Service – Broome, Derby, Fitzroy Crossing, Kununurra, Wyndham
Kimberley Aged and Community Services
Derby Aboriginal Health Services
Derby Hospital
Kimberley Population Health Unit
Kimberley Mental Health and Drug Service
Kimberley Aboriginal Medical Service Council
Fitzroy Crossing Hospital
Kimberley Remote Area Health – East, West
Germanus Kent Aged Care Facility Broome
Broome Regional Aboriginal Medical Service
Halls Creek Hospital
Numbala Nunga Nursing Home, Derby
Yura Yungi Aboriginal Medical Service
Kununurra Hospital
Ord Valley Aboriginal Medical Service
Wyndham Hospital
Beagle Bay Community Health Service
Bidyadanga Aboriginal Community Health Service
Nindillingarri Cultural Health Service
RED BOX
The burden of disease
Aboriginal health
Chronic, non-communicable diseases contribute to over 70% of the total burden of illness and injury in Australia
2. In Western Australia,
chronic disease is largely detected and managed by general practitioners and Aboriginal Medical Services, with specialist care available at WA Country Health Service Regional Resource Centres and from resident and visiting specialists.
The following information about the five chronic health conditions targeted by Medical Specialist Outreach Assistance Program – Indigenous Chronic Disease (MSOAP-ICD) and their impact has primarily been sourced from the Aboriginal Health Planning Forum Data reports prepared by the WA Health Epidemiology Branch and WA Country Health Service, November 2009.
2 Improving Chronic Disease Services in Country WA: Priority Chronic Disease
Models of Care. WA Country Health Service. Oct 2009
Chronic disease amongst Aboriginal people
65% of Aboriginal people report at least one long-term health condition and approximately 27% of Aboriginal children have one or more long-term health condition.
The demographic factors of remoteness (isolation) and socio-economic disadvantage of the Aboriginal population contribute to the significantly greater burden of disease compared to non-Aboriginal people.
The high burden of disease is also reflected in a comparison of admission rates compared to the general population
3:
• 12 x greater for renal dialysis
• 8 x greater for diabetes
• 5.62 x greater due to cellulitis
• 6.64 x greater due to respiratory infections/inflammations
• 8.2 x greater due to disorders of the pancreas
Diabetes: Majority is type 2 diabetes. Risk factors for type 2 diabetes include being overweight, leading a sedentary lifestyle and consuming a high calorie diet.
Cardiovascular disease: The leading types are ischaemic heart disease and stroke.
Respiratory disease: The two major types being asthma and chronic obstructive pulmonary disease.
Kidney disease: Often develops as a complication of other medical conditions such as; diabetes, high blood pressure, urinary tract infections and drug use.
In 2006, the most common causes of cancers in Western Australia for men were prostate, melanoma, colorectal and lung. For women the most common cancers were breast, colorectal, melanoma and lung.
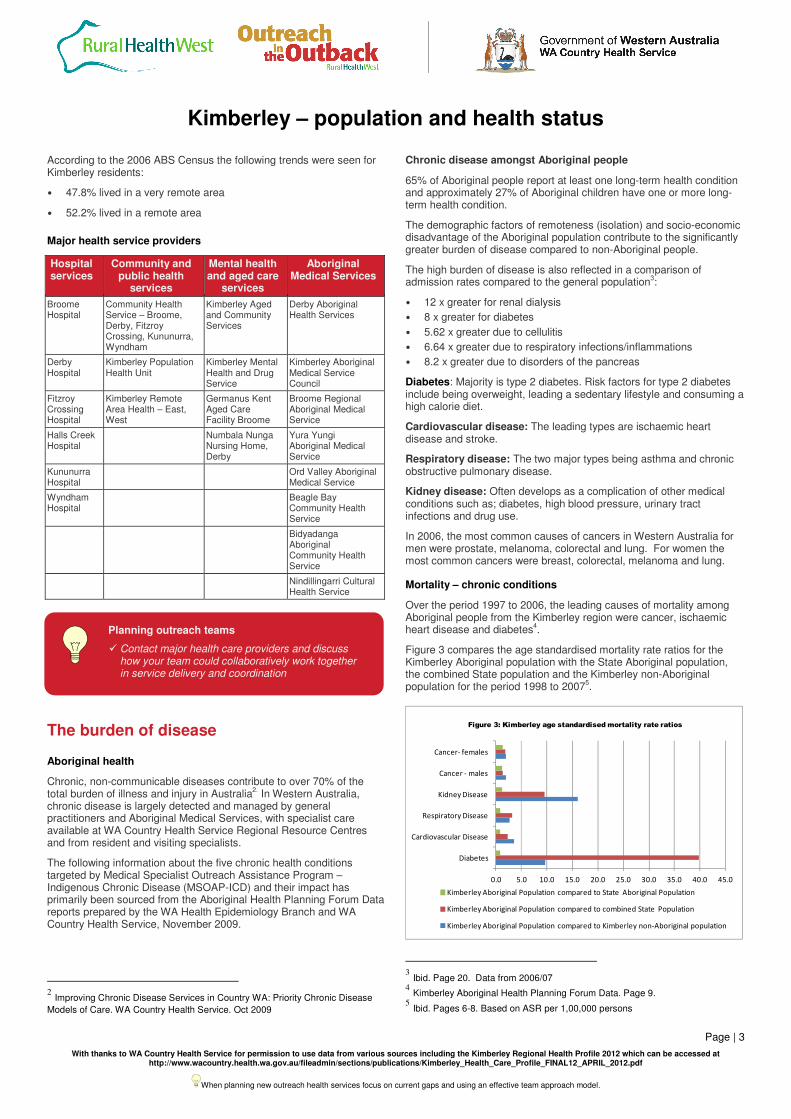
Mortality – chronic conditions
Over the period 1997 to 2006, the leading causes of mortality among Aboriginal people from the Kimberley region were cancer, ischaemic heart disease and diabetes
4.
Figure 3 compares the age standardised mortality rate ratios for the Kimberley Aboriginal population with the State Aboriginal population, the combined State population and the Kimberley non-Aboriginal population for the period 1998 to 2007
5.
3 Ibid. Page 20. Data from 2006/07
4 Kimberley Aboriginal Health Planning Forum Data. Page 9.
5 Ibid. Pages 6-8. Based on ASR per 1,00,000 persons
Planning outreach teams
� Contact major health care providers and discuss how your team could collaboratively work together in service delivery and coordination
0.0 5.0 10.0 15.0 20.0 25.0 30.0 35.0 40.0 45.0
Diabetes
Cardiovascular Disease
Respiratory Disease
Kidney Disease
Cancer - males
Cancer- females
Figure 3: Kimberley age standardised mortality rate ratios
Kimberley Aboriginal Population compared to State Aboriginal Population
Kimberley Aboriginal Population compared to combined State Population
Kimberley Aboriginal Population compared to Kimberley non-Aboriginal population
Kimberley – population and health status
Page | 4
With thanks to WA Country Health Service for permission to use data from various sources including the Kimberley Regional Health Profile 2012 which can be accessed at http://www.wacountry.health.wa.gov.au/fileadmin/sections/publications/Kimberley_Health_Care_Profile_FINAL12_APRIL_2012.pdf
When planning new outreach health services focus on current gaps and using an effective team approach model.
Table 3 below shows the leading cause of mortality that could have been avoided with effective primary interventions. Ischaemic heart disease and diabetes were leading causes of avoidable mortality for Aboriginal people, with one in seven deaths due to ischaemic heart disease.
Table 3: 1997-2007 Kimberley residents 0-74 years - Leading causes of avoidable mortality by Aboriginal status
Rank Condition Deaths Percentage
1 Ischaemic heart disease 109 14.9%
2 Diabetes 81 11.1%
3 Suicide and self inflicted injuries 67 9.1%
4 Alcohol related disease 50 6.8%
5 Selected invasive bacterial and protozoal infection
47 6.4%
(ABS Mortality Data)
Hospitalisations – chronic conditions
The Western Australian Hospital Morbidity Data System records all (Statewide) hospitalisations.
Figure 4 below compares the age standardised hospital separation rate ratios for the Kimberley Aboriginal population with the State Aboriginal population, the combined State population and the Kimberley non-Aboriginal population for the period 2004 to 2008
6.
Maternity
Overview of rural maternity services
Community based pregnancy and maternity care services are provided by WA Country Health Service, private general practitioners, Aboriginal Community Controlled Health Services and a range of community based and non-government organisations.
Specialist obstetric services are mainly provided at the regional hospitals. GP obstetricians play an important role in maternity care in
6 Ibid. Pages 11-13. Based on ASR per 1,000 persons
hospitals where specialist services are often not available. All birthing services are supported by midwives and anaesthetists. Severe workforce shortages impact across all of these professions in rural areas. Planned birthing services are available in 19 public hospitals in Western Australia and at St John of God Geraldton and Bunbury Hospitals.
Kimberley birthing services
Planned birthing services are available at Broome Regional Hospital, Derby and Kununurra District Hospitals. Broome has Level 2 neonate facilities.
Aboriginal maternity issues
There is a large body of evidence to demonstrate that Aboriginal women experience poorer maternal health outcomes, higher rates of perinatal and infant mortality and deliver babies with lower average birth weights when compared to non-Aboriginal women.
Low birth weight
A baby’s weight is a key indicator of health status. The World Health Organisation defines low birth weight as less than 2,500 grams. Babies born with a low birth weight have a greater risk of poor health and dying, and are more likely to develop significant disabilities. Statewide from 2000 to 2006, 14.1% of babies born to Aboriginal mothers were of low birth weight, compared to 5.9% of babies born to non-Aboriginal mothers.
Figure 5: Comparison of babies born with a low birth weight between regions and the State
For rural Western Australia in 2008, 6.2% of all babies were born with a low birth weight. For Aboriginal babies, the percentage with low birth weight was significantly higher at 14.6%.
Figure 5 above shows that babies born to Kimberley Aboriginal mothers were among the lowest in birth weight, exceeding the State’s average low birth weight reported.
Birth trends
In 2005, women residing in country areas of Western Australia represented 25% of the total number of women who gave birth in Western Australia while 63.9% of births by women identifying as Aboriginal were from country regions. More country women are also delivering in the metropolitan area in public and private hospitals.
0.0 20.0 40.0 60.0 80.0 100.0 120.0 140.0
Diabetes
Cardiovascular Disease
Respiratory Disease
Kidney Disease
Cancer - males
Cancer- females
Figure 4: Kimberley age standardised hospital separation rate ratios
Kimberley Aboriginal Population compared to State Aboriginal Population
Kimberley Aboriginal Population compared to combined State Population
Kimberley Aboriginal Population compared to Kimberley non-Aboriginal population
Planning outreach teams
� Focus on managing chronic diseases: respiratory, kidney, cardiovascular and diabetes in the Aboriginal population
Kimberley – population and health status
Page | 5
With thanks to WA Country Health Service for permission to use data from various sources including the Kimberley Regional Health Profile 2012 which can be accessed at http://www.wacountry.health.wa.gov.au/fileadmin/sections/publications/Kimberley_Health_Care_Profile_FINAL12_APRIL_2012.pdf
When planning new outreach health services focus on current gaps and using an effective team approach model.
From 2004 to 2008 there were 34,808 births recorded in rural Western Australia, with Aboriginal births representing an average of 18.96% of these births.
During 2004 to 2008 in the Kimberley region, there was a 0.2% annual increase in births with the number of Aboriginal women giving birth remaining the same. Figure 6 identifies the number of births in the Kimberley region.
Mothers aged less than 20 years
The following trends were evident during 2004 to 2008:
• In Western Australia the overall proportion of births to women aged less than 20 years was 5.1%. For non-Aboriginal teenage mothers the proportion was 4% compared to 23.1% for young Aboriginal women.
• In the Kimberley, for Aboriginal women less than 20 years, births ranged from one in four in 2005 to one in five in 2007.
• In 2007, 22.7% of Aboriginal mothers in the region were teenagers compared to 23.1% being the State Aboriginal women teenage population.
Figure 7: Comparison of babies born to teenage mothers by Aboriginal status of mother and region
Smoking and pregnancy
Risks associated with smoking during pregnancy include premature births, lower birth weights, organ malfunctions and stillbirths. Figure 8 shows that the proportion of Kimberley women who smoke during pregnancy has dropped for the non-Aboriginal population. Aboriginal women were twice more likely to smoke than non-Aboriginal women.
Drinking and pregnancy
Miscarriage and stillbirth are among the consequences of drinking during pregnancy. Fetal alcohol syndrome is a common cause of medical, cognitive and behavioural problems for children including prematurity, brain damage, birth defects, growth restriction and developmental delay.
National reported rates per 100,000 children per annum indicate that the Aboriginal rate is significantly higher than the non-Aboriginal rate:
• Children <5 years at diagnosis (total population) 1.14
• Non-Aboriginal population 0.37
• Aboriginal population 14.60
The Western Australian Birth Defects Registry reported rates for 2002 also indicated a significantly higher Aboriginal rate:
• 0.02/1,000 for non-Aboriginal children
• 2.76/1,000 for Aboriginal children
The WA Aboriginal Child Health Survey 2001 found that one in five Aboriginal mothers drank alcohol during their pregnancy in the regional areas of Broome, Derby and Kununurra.
Infant mortality rate
The statewide infant mortality rate for 1998 to 2007 was 3.8 per 1,000 live births. This comprised a non-Aboriginal rate of 3.2 deaths per 1,000 live births compared with a rate of 12.9 per 1,000 for Aboriginal women.
0
100
200
300
400
500
600
700
800
2004 2005 2006 2007 2008
Figure 6: Births by Aboriginal status of mother in the Kimberley 2004-2008
Aboriginal Non-Aboriginal
0%
10%
20%
30%
40%
50%
60%
70%
2008-09 2009-10
Pro
po
rtio
n o
f sm
ok
ers
Year of birth
Figure 8: Kimberley women who smoked during pregnancy
2008-2010
Aboriginal
Non-Aboriginal
Planning outreach teams
� Health promotion interventions on drinking and smoking during pregnancy
� Increase maternity services access including support for teenage mothers
Kimberley – population and health status
Page | 6
With thanks to WA Country Health Service for permission to use data from various sources including the Kimberley Regional Health Profile 2012 which can be accessed at http://www.wacountry.health.wa.gov.au/fileadmin/sections/publications/Kimberley_Health_Care_Profile_FINAL12_APRIL_2012.pdf
When planning new outreach health services focus on current gaps and using an effective team approach model.
Mental health
In the Region in 2009, 14.6% of adults 16 years and over had suffered from a mental health problem with higher rates in females. A slight proportion (6.9%) accessed mental health care services in 2009.
Aboriginal residents have reported higher levels of psychological stress than non-Aboriginals on a national level.
Community mental health services accessed between 2006 and 2010 were significantly higher in the Kimberley when compared to that of the State.
Child and adolescent health
Vaccinations
The recommended Australian vaccination coverage goals aim for greater than 90% coverage of children at two years of age and almost 100% coverage at school entry age.
More than 90% coverage is needed to create community immunity against ongoing transmission of communicable disease.
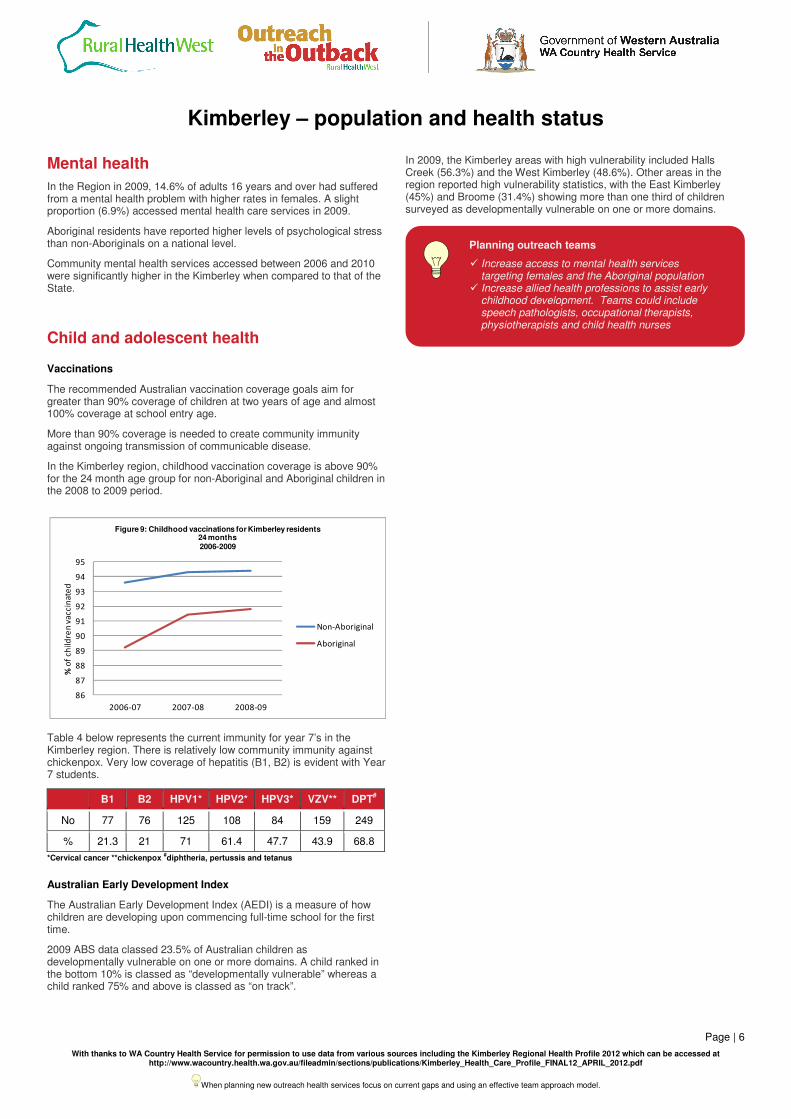
In the Kimberley region, childhood vaccination coverage is above 90% for the 24 month age group for non-Aboriginal and Aboriginal children in the 2008 to 2009 period.
Table 4 below represents the current immunity for year 7’s in the Kimberley region. There is relatively low community immunity against chickenpox. Very low coverage of hepatitis (B1, B2) is evident with Year 7 students.
B1 B2 HPV1* HPV2* HPV3* VZV** DPT#
No 77 76 125 108 84 159 249
% 21.3 21 71 61.4 47.7 43.9 68.8
*Cervical cancer **chickenpox #diphtheria, pertussis and tetanus
Australian Early Development Index
The Australian Early Development Index (AEDI) is a measure of how children are developing upon commencing full-time school for the first time.
2009 ABS data classed 23.5% of Australian children as developmentally vulnerable on one or more domains. A child ranked in the bottom 10% is classed as “developmentally vulnerable” whereas a child ranked 75% and above is classed as “on track”.
In 2009, the Kimberley areas with high vulnerability included Halls Creek (56.3%) and the West Kimberley (48.6%). Other areas in the region reported high vulnerability statistics, with the East Kimberley (45%) and Broome (31.4%) showing more than one third of children surveyed as developmentally vulnerable on one or more domains.
86
87
88
89
90
91
92
93
94
95
2006-07 2007-08 2008-09
% o
f c
hil
dre
n v
ac
cin
ate
d
Figure 9: Childhood vaccinations for Kimberley residents 24 months2006-2009
Non-Aboriginal
Aboriginal
Planning outreach teams
� Increase access to mental health services targeting females and the Aboriginal population
� Increase allied health professions to assist early childhood development. Teams could include speech pathologists, occupational therapists, physiotherapists and child health nurses