23
| Date post: | 21-Jul-2016 |
| Category: |
Documents |
| Upload: | kinder-institute-for-urban-research |
| View: | 221 times |
| Download: | 0 times |


ON A CITY INPERSPECTIVESSPERSPECTIVE
TRANSITIONT TRAN NSI IO


FIGURE 1: THE OFFICIAL UNEMPLOYMENT RATES INHARRIS COUNTY (FEBRUARY FIGURES, 1982–2015)
Source: U.S. Department of Labor, Bureau of Labor Statistics. Unemployment rates are not seasonally adjusted.
4.7
9.8
6.7
10.1
5.1
7.8
4.4 4.0
6.8
4.54.3
6.6
8.68.4
7.36.8
5.7
4.3
3.0
4.0
5.0
6.0
7.0
8.0
9.0
10.0
11.0
82 85 88 91 94 97 00 03 06 09 12 15
OF
FIC
IAL
UN
EM
PLO
YM
EN
T R
AT
ES
YEAR OF SURVEY
Of�cial unemployment rates in Harris County

71
43
11
42
25
68
41
58
35
48
58 6069
0
10
20
30
40
50
60
70
80
90
100
82 85 88 91 94 97 00 03 06 09 12 15
PE
RC
EN
T G
IVIN
G P
OS
ITIV
E R
AT
ING
S
YEAR OF SURVEY
Percent rating job opportunities as “excellent” or “good”
FIGURE 2: POSITIVE RATINGS OF JOB OPPORTUNITIESIN THE HOUSTON AREA (1982–2015)
5147
25
1520
31 28
10
71
27
10
4439 37
26
19
18
26
70
14
35
1623
16
21
0
10
20
30
40
50
60
70
80
82 85 88 91 94 97 00 03 06 09 12 15
PE
RC
EN
T O
F R
ES
PO
ND
EN
TS
YEAR OF SURVEY
TrafficEconomyCrime
FIGURE 3: THE BIGGEST PROBLEM FACING PEOPLE INTHE HOUSTON AREA TODAY (1982–2015)


FIGURE 4: ASSESSMENTS OF TRAFFIC IN THE HOUSTONAREA, AND OF THREE POTENTIAL SOLUTIONS (2009–2015)
59
2416
33
21
42
53
31
15
33
23
40
56
31
12
27 27
44
65
28
6
26 27
43
0
10
20
30
40
50
60
70
80
90
100
Worse Same Better Highways Urbanism Transit
PE
RC
EN
T O
F R
ES
PO
ND
EN
TS 2009 2011 2013 2015
“Over the past three years, has traffic in the Houston area generally gotten better, gotten worse, or has it stayed about the same?”
“Which of these proposals would be the best long-term solution to the traffic problems in the Houston area?”
50%42%
36%
05 07 09 11 13 15
“Very concerned” about the effects of air pollution on your family’s health.
37% 34%38%
05 07 09 11 13 15
Living conditions in theHouston area have“gotten better.”
31%33%
29%
05 07 09 11 13 15
“Very worried” that you or a member of your family will become the victim of a crime.
FIGURE 5: ASSESSMENTS OF CRIME, AIR POLLUTION AND OVERALL LIVING CONDITIONS IN THE HOUSTON AREA TODAY (2005–2015)
21%
38%
48%
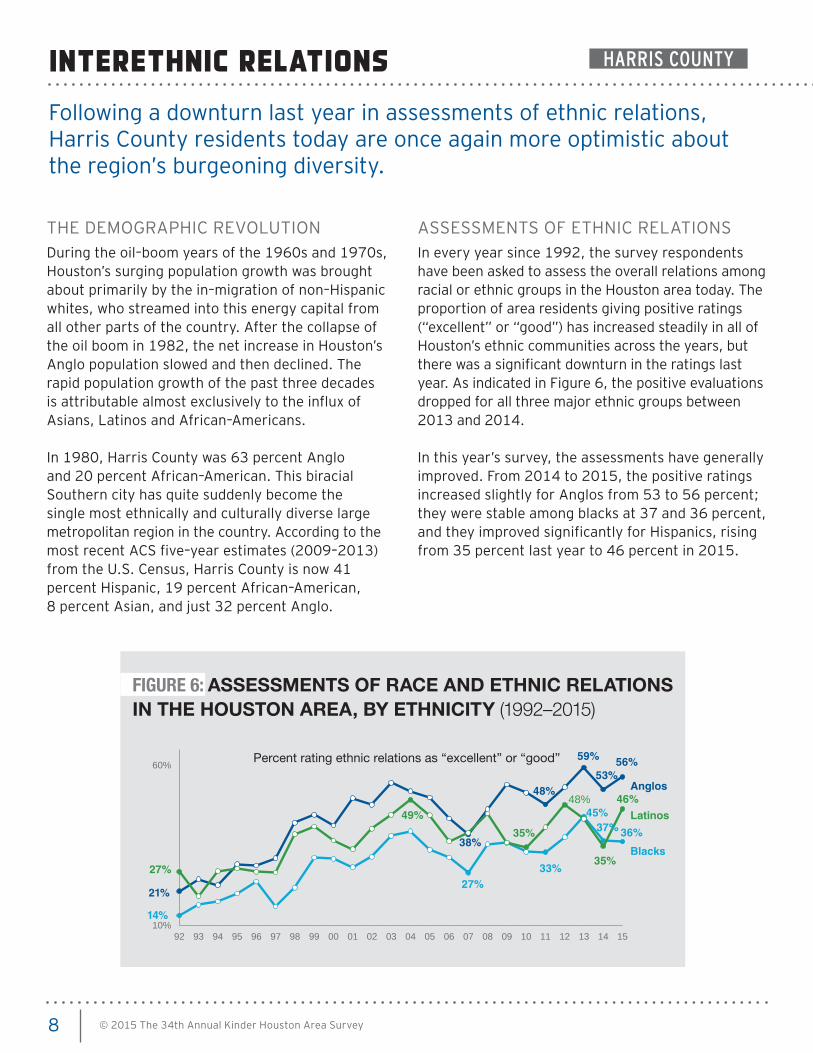
59%
53%56%
14%
27%33%
45%37% 36%
27%
49%
35%
48%
35%
46%
10%
60%
92 93 94 95 96 97 98 99 00 01 02 03 04 05 06 07 08 09 10 11 12 13 14 15
Percent rating ethnic relations as “excellent” or “good”
Anglos
Latinos
Blacks
FIGURE 6: ASSESSMENTS OF RACE AND ETHNIC RELATIONSIN THE HOUSTON AREA, BY ETHNICITY (1992–2015)
© 2015 The 34th Annual Kinder Houston Area Survey 9
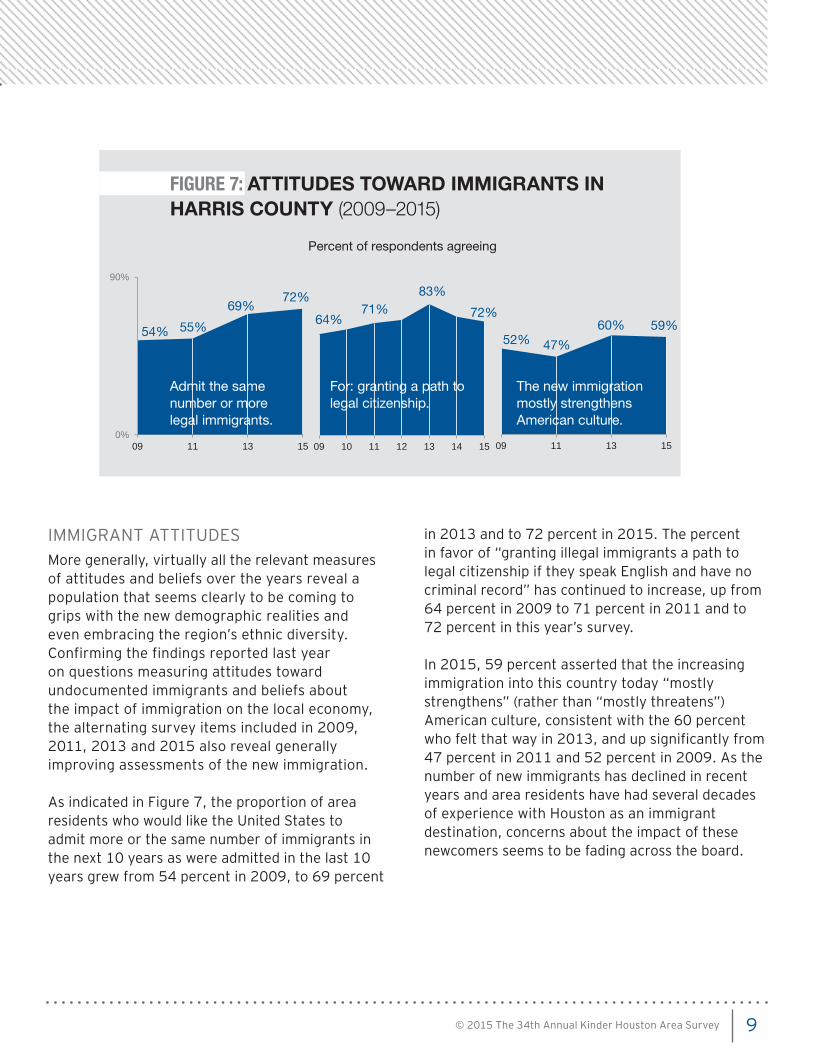
52% 47%
60% 59%
09 11 13 15
The new immigrationmostly strengthensAmerican culture.
64%71%
83%
72%
09 10 11 12 13 14 15
For: granting a path tolegal citizenship.
54% 55%
69%72%
0%
90%
09 11 13 15
Admit the samenumber or more legal immigrants.
Percent of respondents agreeing
FIGURE 7: ATTITUDES TOWARD IMMIGRANTS IN HARRIS COUNTY (2009–2015)
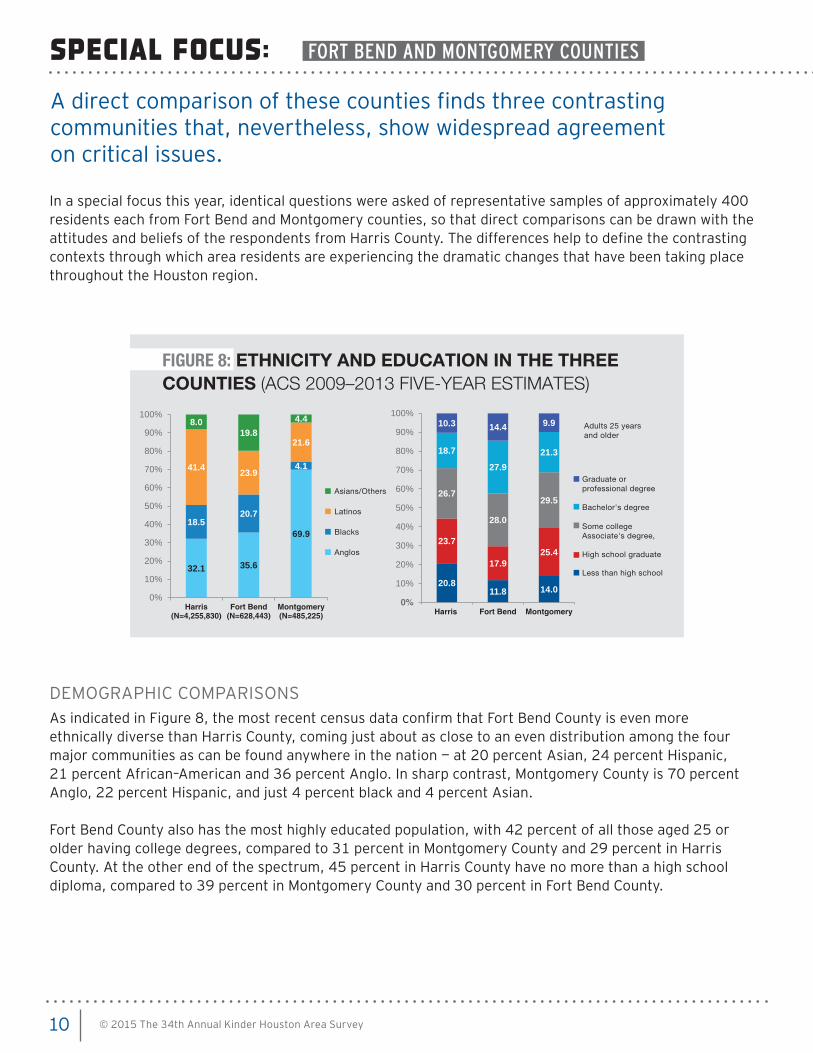
FIGURE 8: ETHNICITY AND EDUCATION IN THE THREECOUNTIES (ACS 2009–2013 FIVE-YEAR ESTIMATES)
32.1 35.6
69.918.5
20.7
4.141.4 23.9
21.6
8.019.8
4.4
0%
10%
20%
30%
40%
50%
60%
70%
80%
90%
100%
Harris(N=4,255,830)
Fort Bend(N=628,443)
Montgomery(N=485,225)
Asians/Others
Latinos
Blacks
Anglos
20.811.8 14.0
23.7
17.925.4
26.7
28.0
29.5
18.7
27.921.3
10.3 14.4 9.9
0%
10%
20%
30%
40%
50%
60%
70%
80%
90%
100%
Harris Fort Bend Montgomery
Graduate orprofessional degree
Bachelor's degree
Some collegeAssociate's degree,
High school graduate
Less than high school
Adults 25 yearsand older

© 2015 The 34th Annual Kinder Houston Area Survey 11
FIGURE 9: COUNTY DIFFERENCES IN BELIEFS ABOUTIMMIGRATION AND ETHNIC DIVERSITY (2015)
73
60 6371
49
73
60
7063
54
67
53 54
67
45
0102030405060708090
100
Admit more or aboutthe same number oflegal immigrants as in the last 10 years.
The increasingimmigration into this country mostlystrengthens American culture.
The increasing ethnicdiversity brought about by immigration is a good thing.
Favor granting illegalimmigrants in U.S. a path to legal citizenship.
Ratings of the relationsamong ethnic groups as either “good” or“excellent.”
Harris
Fort Bend
Montgomery

FIGURE 10: THE BIGGEST PROBLEM FACING PEOPLE INTHREE COUNTIES (2015)
40.4
14.813.0
23.8
8.0
Fort Bend
28.1
20.918.4
21.2
11.4
Harris
27.8
16.8
20.8
24.6
10.0
Montgomery
Traffic CrimeEconomy DK/RF All other concerns
FIGURE 11: COUNTY DIFFERENCES IN THE PREFERENCEFOR “WALKABLE URBANISM” (2015)
4941 38
54
4339 3743 42 45
4034
49
3845
0
10
20
30
40
50
60
70
80
90
100
Prefer area with mix of developments,including homes,shops and restaurants.
Visited Houston’surban amenities threeor more times in thepast year.
Percent who own a bicycle.
Percent wishing they could ride a bicycle more often.
Improving publictransportation is the best solution to traffic problems.
Harris
Fort Bend
Montgomery
© 2015 The 34th Annual Kinder Houston Area Survey 13
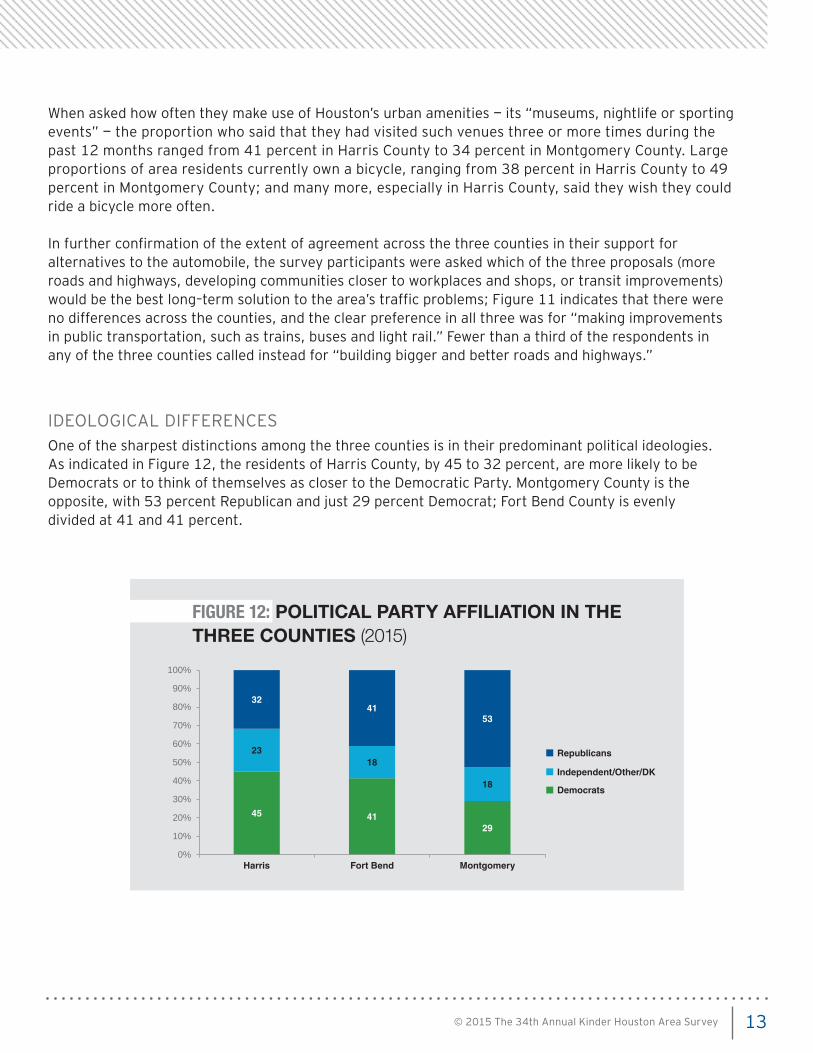
45 4129
2318
18
3241
53
0%
10%
20%
30%
40%
50%
60%
70%
80%
90%
100%
Harris Fort Bend Montgomery
FIGURE 12: POLITICAL PARTY AFFILIATION IN THETHREE COUNTIES (2015)
Republicans
Independent/Other/DK
Democrats
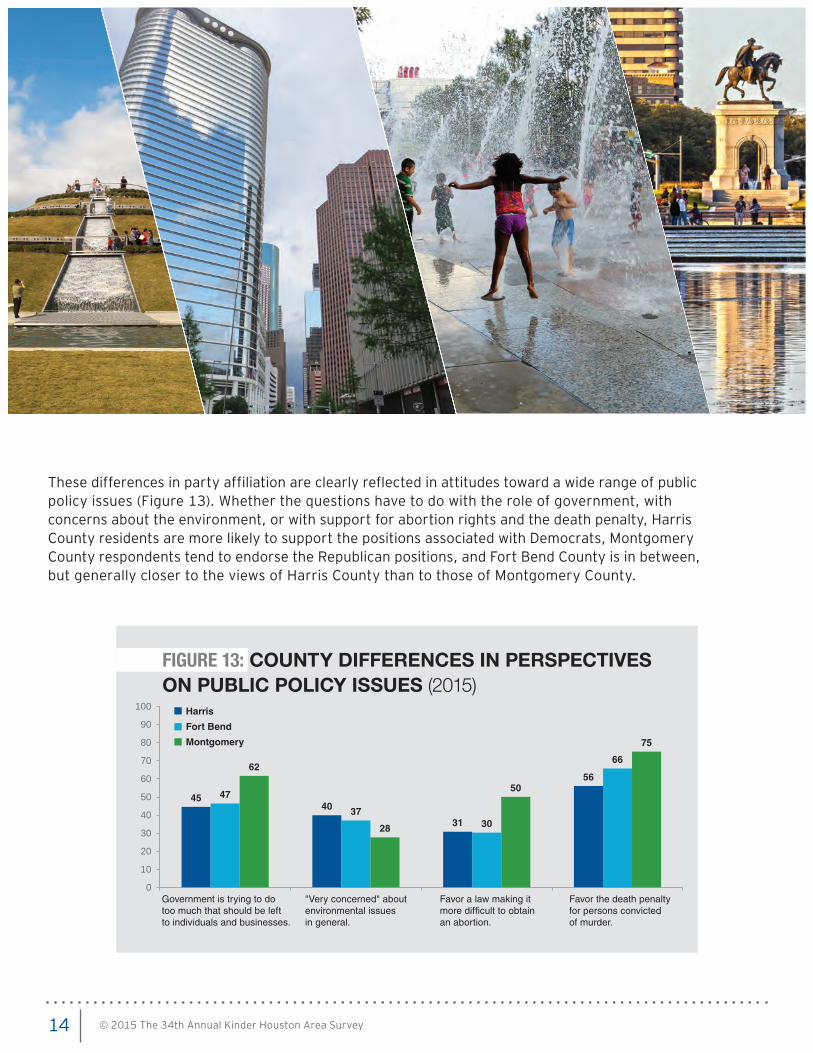
FIGURE 13: COUNTY DIFFERENCES IN PERSPECTIVESON PUBLIC POLICY ISSUES (2015)
4540
31
56
47
3730
6662
28
50
75
0
10
20
30
40
50
60
70
80
90
100
Government is trying to do too much that should be left to individuals and businesses.
"Very concerned" aboutenvironmental issues in general.
Favor a law making it more difficult to obtain an abortion.
Favor the death penalty for persons convicted of murder.
Harris
Fort Bend
Montgomery

© 2015 The 34th Annual Kinder Houston Area Survey 15
61%
58%59%
63%
0%
100%
1999 2001 2003 2005 2007 2009 2011 2013 2015
Believe that “abortion is morally wrong.”
Opposed to “a law thatwould make it moredifficult for a woman toobtain an abortion.”
FIGURE 14: ABORTION ATTITUDES IN HARRIS COUNTY (1999–2015)
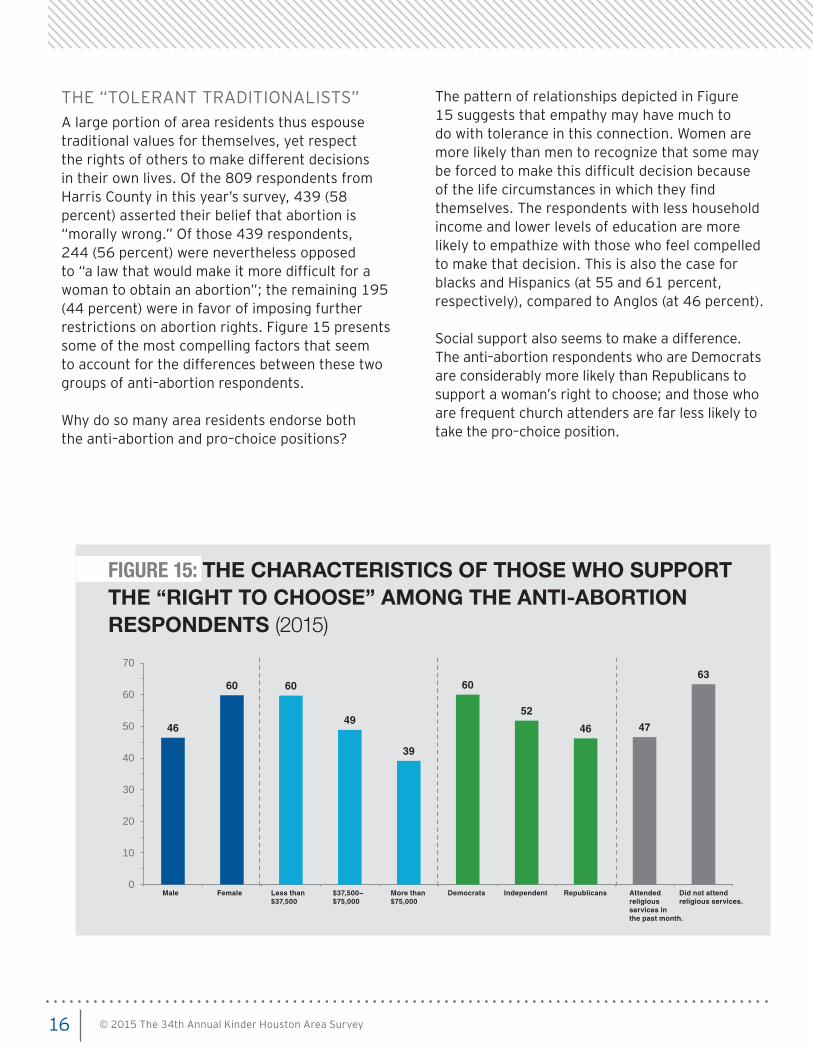
FIGURE 15: THE CHARACTERISTICS OF THOSE WHO SUPPORT THE “RIGHT TO CHOOSE” AMONG THE ANTI-ABORTION RESPONDENTS (2015)
46
60 60
49
39
60
52
46 47
63
0
10
20
30
40
50
60
70
Male Female Less than $37,500
$37,500−$75,000
More than$75,000
Democrats Independent Republicans Attendedreligiousservices in the past month.
Did not attendreligious services.

FIGURE 16: SUPPORT FOR GAY RIGHTS (1991–2015)
1727
27
28
35
3842
4749
43
51
31
32
4037
41
35 37
4345
4751
10
20
30
40
50
60
70
91 93 96 97 98 99 00 01 02 03 04 05 06 07 08 09 10 11 12 13 14 15
PE
RC
EN
T O
F R
ES
PO
ND
EN
TS
Favor: “Homosexuals being legally permitted to adopt children.”
Agree: “Marriages between homosexuals should be given the same legal status as heterosexual marriages.”

75
6266 58 67
60
66
5861
57
56
41 3432 39 37
3028
0
10
20
30
40
50
60
70
80
93 98 99 00 01 02 03 04 05 06 07 08 09 10 11 12 13 14 15PE
RC
EN
T O
F R
ES
PO
ND
EN
TS
YEAR OF SURVEY
Favor “the death penalty for persons convicted of murder.”
The death penalty, and not life imprisonment, “should generally bethe penalty for persons convicted of first-degree murder.”
FIGURE 17: SUPPORT FOR THE DEATH PENALTY (1993–2015)
18 © 2015 The 34th Annual Kinder Houston Area Survey

THE NINE-COUNTY HOUSTONMETROPOLITAN REGION
MONTGOMERY COUNTY AREA: 1,077 SQ. MI. POPULATION: 485,225
SOURCE: ACS 2013 (THREE–YEAR ESTIMATES),
U.S. CENSUS BUREAU
FORT BEND COUNTYAREA: 885 SQ. MI.POPULATION: 628,443
HARRIS COUNTYAREA: 1,777 SQ. MI.POPULATION: 4,225,830
AUSTIN
WALLER
BRAZORIA
GALVESTON
CHAMBERS
LIBERTY


