Kinetic isotopic fractionation during diffusion of ionic species in water Frank M. Richter', Ruslan A. Mendybaevl, John Christensen', Ian D. Hutcheon3, Ross W. Williams3, Neil C. Sturchio4and Abelardo D. Beloso Jr4. 'The University of Chicago, Department of the Geophysical Sciences, 5734 South Ellis Avenue, Chicago, IL 60637. 'Lawrence Berkeley National Laboratory, Berkeley, CA. 3Glenn T. Seaborg Institute, Lawrence Livermore National Laboratory, Livermore, CA. 4University of Illinois at Chicago, Chicago, IL 60607 June 9,2005 Corresponding author: Frank M. Richter ([email protected]) Abstract Experiments specifically designed to measure the ratio of the diffusivities of ions dissolved in water were used to determine DLJDK, D7Li/D6Li, D2jMg/D24MvIg, D2,jMg/D2jM,, and D37CI/D3jC1. The measured ratio of the diffusion coefficients for Li and K in water (DLi/DK =0.6) is in good agreement with published data, providing evidence that the experimental design being used resolves the relative mobility of ions with adequate precision to also be used for determining the fractionation of isotopes by diffusion in water. In the case of Li we found measurable isotopic fractionation associated with the diffusion of dissolved LiCl (D7Li/D6Li = 0.99772+0.00026). This difference in the diffusion coefficient of 7Li compared to 6Li is significantly less than reported in an earlier study, a difference we attribute to the fact that in the earlier study Li diffused through a membrane separating the water reservoirs. Our experiments involving Mg diffusing in water found no measurable isotopic fractionation (D2jMvIg/D24Mg = 1.00003+.0.00006). C1 isotopes were fractionated during diffusion in water (D37C1/D3jC1 = 0.99857+.0.00080) whether or not the co-diffuser (Li or Mg) was isotopically fractionated. The isotopic fractionation associated with the diffusion of ions in water is much smaller than values we found previously for the isotopic fractionation of Li and Ca isotopes by diffusion in molten silicate liquids. A major distinction between water and silicate liquids is that water, being a polar liquid, surrounds dissolved ions with hydration shells, which very likely play an important but still poorly understood role in reducing isotopic fractionation associated with diffusion.
Transcript
Kinetic isotopic fractionation during diffusion of ionic species in water
Frank M. Richter', Ruslan A. Mendybaevl, John Christensen', Ian D. Hutcheon3, Ross W. Williams3, Neil C. Sturchio4 and Abelardo D. Beloso Jr4.
'The University of Chicago, Department of the Geophysical Sciences, 5734 South Ellis Avenue, Chicago, IL 60637.
'Lawrence Berkeley National Laboratory, Berkeley, CA.
3Glenn T. Seaborg Institute, Lawrence Livermore National Laboratory, Livermore, CA.
4University of Illinois at Chicago, Chicago, IL 60607
Experiments specifically designed to measure the ratio of the diffusivities of ions dissolved in water were used to determine DLJDK, D7Li/D6Li, D2jMg/D24MvIg, D2,jMg/D2jM,, and D37CI/D3jC1. The measured ratio of the diffusion coefficients for Li and K in water (DLi/DK =0.6) is in good agreement with published data, providing evidence that the experimental design being used resolves the relative mobility of ions with adequate precision to also be used for determining the fractionation of isotopes by diffusion in water. In the case of Li we found measurable isotopic fractionation associated with the diffusion of dissolved LiCl (D7Li/D6Li = 0.99772+0.00026). This difference in the diffusion coefficient of 7Li compared to 6Li is significantly less than reported in an earlier study, a difference we attribute to the fact that in the earlier study Li diffused through a membrane separating the water reservoirs. Our experiments involving Mg diffusing in water found no measurable isotopic fractionation (D2jMvIg/D24Mg = 1.00003+.0.00006). C1 isotopes were fractionated during diffusion in water (D37C1/D3jC1 = 0.99857+.0.00080) whether or not the co-diffuser (Li or Mg) was isotopically fractionated. The isotopic fractionation associated with the diffusion of ions in water is much smaller than values we found previously for the isotopic fractionation of Li and Ca isotopes by diffusion in molten silicate liquids. A major distinction between water and silicate liquids is that water, being a polar liquid, surrounds dissolved ions with hydration shells, which very likely play an important but still poorly understood role in reducing isotopic fractionation associated with diffusion.
1. Introduction
Mass-dependent kinetic isotope fractionation during chemical diffusion is a well-known phenomenon in gases and certain liquids. In the case of an ideal gas at sufficiently low pressure such that collisions are infrequent, kinetic theory predicts that the ratio of the diffusion coefficients of two gaseous species will be proportional to the inverse square root of their molecular mass, which we can write as
where D, and D, are the diffusion coefficients of gas species of molecular weight m, and m2, and + O S . The more common situation of geochemical interest is that of isotope fractionation of a dilute gas diffusing through a different gas of finite pressure. A classic version of this can be found in Craig and Gordon's (1965) discussion of the relative rates of diffusion of HZl60, HD160, and H,'*0 vapor in air. Taking collisions into account while still assuming that intermolecular forces are negligible, the ratio of the diffusion coefficients of the isotopically distinct species becomes proportional to the inverse square root of their reduced mass. The reduced mass pi of a species of molecular weight mi colliding with a gas of molecular weight M is given by the expression
The ratio of the diffusion coefficients of the dilute isotopically distinct molecules is then given by
An interesting point is that when the molecular weight M of the medium is very large compared to that of the diffusing species, pi + mi as mi /M-. 0, and the ratio of the diffusion coefficients reverts to that given by Eqn. 1. Equations (1) and (3) provide an upper bound on mass-dependent kinetic isotope fractionation by diffusion in gases and serve as a point of comparison for the magnitude of fractionations observed in condensed systems. It should be kept in mind that even in the case of gases these relationships make a number of simplifying assumptions such as that the gas medium can be represented by its mean molecular weight, that intermolecular forces are negligible, and that differences in the molecular diameters of the diffusing species are not significant. Despite these simplifications, Eqn. (3) was shown by Craig and Gordon (1965) to be in reasonably good agreement with experimental data on the isotopic fractionation of water vapor diffusing in air.
In contrast to the situation for ideal gases where there are reasonable expectations as to the mass dependence of diffusion, the understanding of mass-dependent fractionation by diffusion in condensed systems is far less developed. Even such apparently simple situations as those involving the isotopic fractionation of dissolved trace gases (e.g. , He,
2
methane, CO,) in water have not yielded unambiguous results (see for example, Jahne et al. 1987; Prinzhofer and Pernaton, 1997; Zhang and Kroos 2001). Jahne et al. (1987) carried out experiments to determine the relative diffusivities of noble gases dissolved in water at various temperatures and found that the ratios of the diffusion coefficients of the noble gases are very close to the inverse square root of the mass of the noble gases (i.e. /3= 0.5 in Eqn. 1). In some cases the experimental results for the relative diffusion coefficients of the noble gases in water imply /3 slightly greater than 0.5, a surprising result suggesting that interpreting the diffusion coefficients in terms of mass alone is not entirely correct. An alternative interpretation of the noble gas data is that the diffusion coefficients of neutral species are dominated by hydrodynamic drag (as indicated by the molecular calculations of Koneshan et al. 1998), in which case the diffusivity will be inversely proportional to the size. If we use the Van der Waals radius as a measure of the relative sizes of the diffusing noble gases, then diffusion coefficients that are inversely proportional to size will appear to depend on the inverse square root of mass because of the close to linear correlation between the square root of the mass and the Van der Waals radius of noble gases other than helium. The most direct way of isolating the effect of mass on diffusion is to compare the behavior of isotopically substituted species. Jahne et al. (1987) also report on two experiments that were used to determine isotopic fractionation of dissolved '2C0, from 13C0, and 3He from 4He. The results for CO, showed an isotopic fractionation more than an order of magnitude less than what one calculates assuming that diffusivities are proportional to the inverse square root of the
mass ratio of '2C0,/'3C02 @.e., -). Jahne et al. (1987) discuss their measured isotopic
fractionation in terms of an expectation based on the inverse square root of the reduced masses using the molecular weight of water for M in Eqn. 2 (Le., pI3 =12.86, PI%o, = 12.77). The measured fractionation of carbon isotopes is then about one third the value calculated from the inverse square root of the ratio of the reduced mass. Why a reduced mass derived from the kinetic theory of gases should be applicable to the behavior dissolved trace gases in water is not explained. The fractionation of He isotopes
E co2
reported by Jahne et al. (1987) corresponds to -- D3He - 1.152.03, which, given the D 4 He
uncertainty, is indistinguishable from the ratio calculated using the actual mass of the He isotopes (1.16) or that calculated using the reduced mass based on the molecular weight of water (1.13). The upshot of all this is that the effect of mass on the diffusion of neutral species in water is not at all simple, and it is not yet well documented or understood.
The work we report in the present communication focuses on the isotopic fractionation of dissolved ionic species in water. Because one of the principal applications we hoped to explore was the development of an isotopic monitor for the diffusive transport of mineral-forming solutes in water saturated sedimentary or metamorphic systems, we focused on dissolved ionic species rather than trace gases. Another context where isotopic fractionation during diffusive transport of ionic species in water could be very important involves biological systems, where isotopic fractionation has been measured, but remains poorly understood. For example, a recent interpretation of calcium isotopic fractionation during inorganic aragonite precipitation and in cultured foraminifera
3
(Gussone et al., 2003) includes kinetic effects due to diffusion in water, but for the moment this is still in the realm of speculation due to the lack of relevant experimental data on the degree of isotopic fractionation produced during the diffusion of ions in water.
Previous work led us to expect that we would find large mass-dependent isotopic fractionation of dissolved ions as they diffused in water. We recently demonstrated significant mass dependent isotopic fractionation by diffusion in molten silicate liquids (Richter et al., 1999, 2003), which when phrased in terms of the exponent p in Eqn. ( l ) , resulted in p = 0.2 for lithium isotopes and p =: 0.1 for calcium isotopes. If diffusion in complex molten silicate liquids can produce such large isotopic fractionation, why wouldn’t diffusion in water? Another reason for us to expect that we might find significant isotopic fractionation during diffusion of ions in water was the report by Fritz (1992) of large isotopic fractionation of lithium during the diffusion of dissolved LiC1. Fritz (1992) interpreted his measurements as indicating a mass dependence of lithium
- 1.01 12 0.003 , which, he noted, is very close diffusion in water corresponding to - -
to the inverse square root of the mass ratio of 6LiCl and 7LiC1 (i.e., Eqn. 1 with ml= 40, m2= 41, and p= 0.5). Leaving aside that Fritz (1992) gave no reason why one should expect these masses to be the relevant masses for the diffusing species or for the choice of /3= 0.5, the fact that he reported large fractionation of Li isotopes as they diffused in water led us to expect that we would find similar effects.
D % C i
D7hCi
Our experimental results regarding the degree of kinetic isotope fractionation of dissolved ionic species during diffusion in water indicate a much smaller effect than we had anticipated. The Li isotope fractionations we measured are a factor of five less than implied by the results given by Fritz (1992). In the case of Mg diffusing in water, the isotopic fractionation is below our detection limits. To the extent that the lack of measurable kinetic isotope effects for Mg can be used to infer similar behavior for Cay the appeal by Gussone et al. (2003) to significant Ca isotope fractionation by diffusion in water seems unjustified.
2. Experimental design
A sketch of the experimental design we used is shown in Fig. 1. The basic design is not much different from that used by Thomas Graham (1805-1869) in his classic studies of effusion that led to what is generally known as Graham’s Law of Effusion (Eqn. 1). In our version of Graham’s experiment, two nested glass containers of very different volume are connected by a small cylindrical tube through which a dissolved salt, initially only in the smaller inner container, diffuses into the larger outer container. The dimensions were chosen such that the time for significant diffusion to take place between containers (tens of days) is long compared to the time of a few days it takes for diffusion to maintain an effectively homogeneous distribution of salt in the smaller inner container. Under these circumstances, the flux Ji of a dissolved component from the inner container to the larger outer one will be governed to a reasonably good approximation by
4
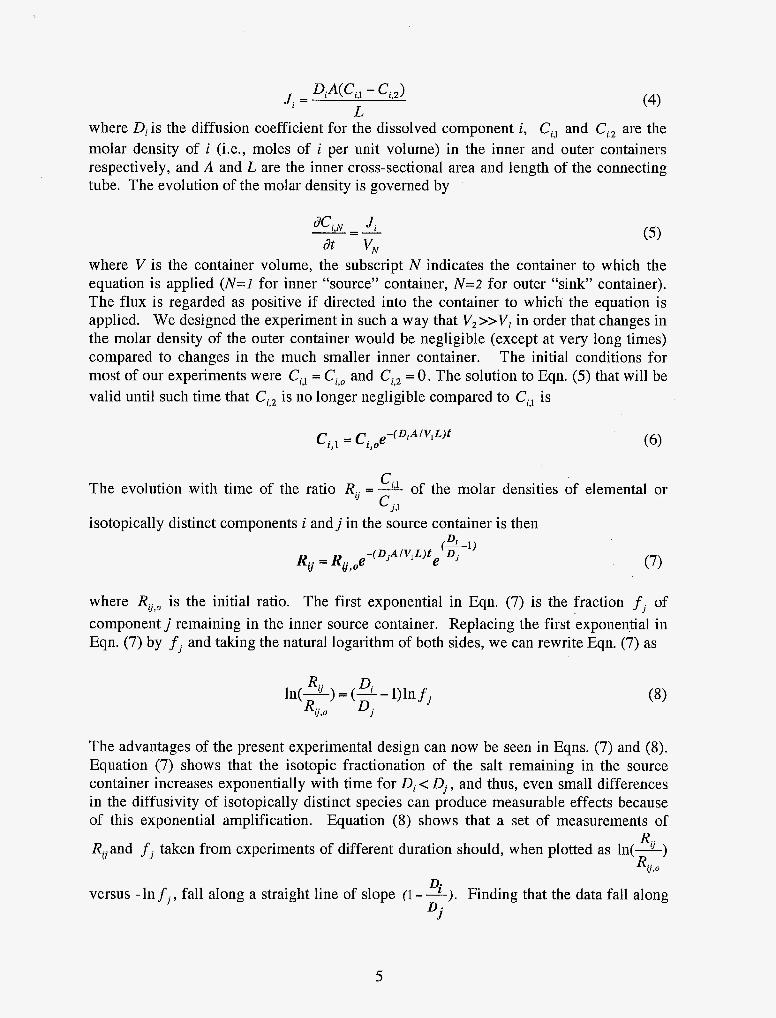
(4)
where Di is the diffusion coefficient for the dissolved component i, C, and Ci,2 are the molar density of i (i.e., moles of i per unit volume) in the inner and outer containers respectively, and A and L are the inner cross-sectional area and length of the connecting tube. The evolution of the molar density is governed by
J i = DiA(Ci,, - Ci,Z) L
dCi,N - J i
d t VN where V is the container volume, the subscript N indicates the container to which the equation is applied (N=1 for inner “source” container, N=2 for outer “sink” container). The flux is regarded as positive if directed into the container to which the equation is applied. We designed the experiment in such a way that V, >>V, in order that changes in the molar density of the outer container would be negligible (except at very long times) compared to changes in the much smaller inner container. The initial conditions for most of our experiments were C, = Ci,o and Ci,2 = 0. The solution to Eqn. (5) that will be valid until such time that Ci,2 is no longer negligible compared to Ci,l is
(DiAIV,L)t Ci,l = Ci,oe-
Ci 1 The evolution with time of the ratio R.. = - of the molar densities of elemental or
isotopically distinct components i a n d j in the source container is then
u C j.1
where R , , is the initial ratio. The first exponential in Eqn. (7) is the fraction f j of component j remaining in the inner source container. Replacing the first exponential in Eqn. (7) by f j and taking the natural logarithm of both sides, we can rewrite Eqn. (7) as
Rij D. In(-) = (2 - 1)ln fj
Rij-0 D j
The advantages of the present experimental design can now be seen in Eqns. (7) and (8). Equation (7) shows that the isotopic fractionation of the salt remaining in the source container increases exponentially with time for Di < Dj , and thus, even small differences in the diffusivity of isotopically distinct species can produce measurable effects because of this exponential amplification. Equation (8) shows that a set of measurements of
R.. Rijand f j taken from experiments of different duration should, when plotted as l n ( 2 )
Rij.0 D.
versus -In f j , fall along a straight line of slope (1 - 2). Finding that the data fall along D.i
5
such a line serves as a check that the experiment is in fact behaving as expected and also
provides a measure of 2 from the slope of the best fitting line through the data. It
should be noted that while our experimental design is appropriate for measuring small differences between diffusion coefficients, it is not particularly well suited for making high-precision determinations of the diffusion coefficients individually. Accurate determinations of the individual diffusion coefficients would require a far more detailed accounting of how the flux depends on the geometry of the system than implied by Eqn. (4). However as shown by Eqn. (S), the details of the geometry of the system cancel when results are given in terms of the ratio of diffusion coefficients.
D.
D.i
The ionic salts used in this study are KCI, LiCl, CaCl,, and MgCl,. A set of validation experiments were run in which mixtures of KC1 and LiCl were allowed to diffused out of the source container. Both the WLi and the fraction of potassium remaining in the source container were measured and the data from the various experiments used in connection
with Eqn. (8) to determine a. Our finding that the diffusivity ratio determined in this
way is in good agreement with previously published data on the diffusivity of these two cations in water would be evidence that our experimental design does fractionate dissolved cations in proportion to their relative diffusivities. The isotopic ratios we measured were 7Li/6Li in solutions from diffusion experiments involving LiCl, 25Mg/24Mg and 26Mg/24Mg in solutions from MgC1, experiments, and 37C1/35C1 in solutions from a subset of the LiCl and MgC1, experiments. In some of the diffusion experiments involving MgCl,, the water in outer container had an approximately equal molar concentration of CaC1, as the initial concentration of MgC1,in the source chamber. This was done so that Mg2+ could exchange with Ca2+ without much C1- having to diffuse to maintain elecroneutrality. In a few instances 0.5% agarose gel was added to the water in the inner chamber as a way of suppressing any mass transfer by (non-diffusive) flow between the containers that might have affected experiments in which the solvent was pure water. We found no significant difference between experiments with and without Ca as a counter diffuser or between those with and without the agarose.
DK
3. Analytical methods
Starting solutions were prepared by dissolving measured amounts of crystalline CaCl,, MgCl,, KC1, LiC1, LiBr, and LiI (all Puratronic grade, >99.99%, AlfaAesarB) in distilled water, or in a few cases, distilled water with 0.5% agarose gel. The flasks were filled by submerging them in the starting solution and extracting the air from the flask using a length of teflon microtubing attached to a 10 ml syringe. Flasks holding between 0.5-0.7 ml of starting solution were then suspended 2-3 cm below the waterline of individual containers filled with approximately 200 ml of distilled water (or CaC1, in the Mg-Ca counterdiffusion experiments). The containers were then sealed with teflon tape so as to minimize evaporation and held for various lengths of time at constant temperature in an Isotherm@ Incubator (Fisher Scientific). After a prescribed period of time a container
6
was removed from the incubator, the small source flask extracted, and its contents transferred to a 2 ml sterile polypropylene vial for storage.
Concentrations of Li, K, Mg and Ca in the starting materials and run products were measured by a VarianB SpectrAA 220 atomic absorption spectrometer using an air- acetylene flame. Standards (from 0.1 to 10 ppm) were prepared from 1000 ppm ( ~ 1 % ) reference solutions (Mg, K, and Ca solutions from Fisher Scientific; Li from Acros Organics). The solutions taken from the experiments were diluted with distilled water to concentrations of < l o ppm. The amount of the sample solution and water was controlled volumetrically using 10, 40 and 200 p1 pipettes as needed, and double checked by weighing using a Mettler AE163 balance. In order to suppress ionization of K during the atomic absorption measurements, an amount of CsNO, solution with 10000 pprn Cs (SPEX CertiF’repQ3) was added to all standards and solutions taken from the KCl/LiCl diffusion experiments to make a final solution with 1000 ppm Cs. The intake system of AA spectrometer was flushed with 3% HNO, after each analysis to reduce contamination. A typical analysis involved a set of four or five measurements of the samples bracketed by a blank and measurements of one or two standards. In addition, all standards were analyzed at the start, middle, and end of each AA session.
A subset of the samples that had been measured by atomic absorption was also measured with much greater precision with an Agilent 4500 ICPMS. The calibration standards used for quantification of the ICPMS measurements were prepared from primary standards obtained from SPEX@ and contained 0, 10, 20, 50, and 100 ppbw of Mg. All standards and samples contained 10 ppbw Sc used as an internal standard to correct for instrument drift. Samples were diluted to fall within the calibration range of the standards. The calibration standard block was run before and after the samples and the average sensitivity for 24Mg was used to quantify the concentration of the samples. The reported ICPMS data represent the average and standard deviations of duplicate analyses made on two separate days. The uncertainties assigned to the AA measurements based on repeated measurements are consistent with the comparability between the AA and the much more precise ICPMS concentration measurements.
The isotopic composition of Li in the experimental solutions was measured at Lawrence Berkeley National Laboratory using an IsoProbe (Micromass, now GV Instruments, Manchester, UK) multiple-collector ICP source sector mass spectrometer (MC-ICPMS). Ion beams of 6Li and 7Li were measured simultaneously with a pair of appropriately spaced Faraday cups. Sample and standard solutions were introduced to the IsoProbe using an Aridus (Cetac Technologies) desolvation system. To avoid background Li from the skimmer cone, “soft” extraction was used, where a positive potential is applied to the extraction lens. Helium was used in the collision cell to reduce the energy spread of the ion beam to rl eV before ion focusing and entry to the magnetic sector. Measurements of sample unknowns were bracketed with measurements of the LSVEC Li isotopic standard (NIST SRM 8545), and are reported relative to that standard (per mil deviation, 67Li). Analyses consist of 20 integrations at 5 seconds each for a total analysis time of -100 seconds of a 1 ppm solution. This scheme uses -100 ng of Li per analytical run.
7
Both the standard and sample unknowns were diluted with 2% HNO, to the same concentration.
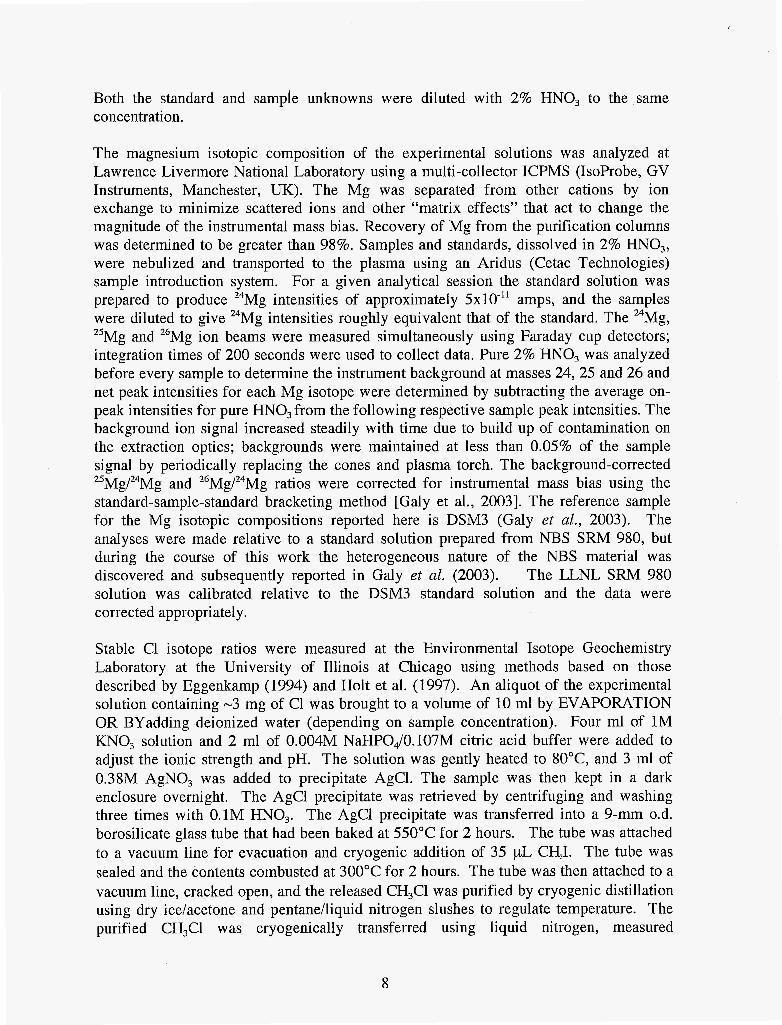
The magnesium isotopic composition of the experimental solutions was analyzed at Lawrence Livermore National Laboratory using a multi-collector ICPMS (IsoProbe, GV Instruments, Manchester, UK). The Mg was separated from other cations by ion exchange to minimize scattered ions and other "matrix effects" that act to change the magnitude of the instrumental mass bias. Recovery of Mg from the purification columns was determined to be greater than 98%. Samples and standards, dissolved in 2% HNO,, were nebulized and transported to the plasma using an Aridus (Cetac Technologies) sample introduction system. For a given analytical session the standard solution was prepared to produce 24Mg intensities of approximately 5x10-" amps, and the samples were diluted to give 24Mg intensities roughly equivalent that of the standard. The 24Mg, 25 Mg and 26Mg ion beams were measured simultaneously using Faraday cup detectors; integration times of 200 seconds were used to collect data. Pure 2% HNO, was analyzed before every sample to determine the instrument background at masses 24,25 and 26 and net peak intensities for each Mg isotope were determined by subtracting the average on- peak intensities for pure HNO, from the following respective sample peak intensities. The background ion signal increased steadily with time due to build up of contamination on the extraction optics; backgrounds were maintained at less than 0.05% of the sample signal by periodically replacing the cones and plasma torch. The background-corrected 25Mg/24Mg and 26Mg/24Mg ratios were corrected for instrumental mass bias using the standard-sample-standard bracketing method [Galy et al., 20031. The reference sample for the Mg isotopic compositions reported here is DSM3 (Galy et al., 2003). The analyses were made relative to a standard solution prepared from NBS SRM 980, but during the course of this work the heterogeneous nature of the NBS material was discovered and subsequently reported in Galy et al. (2003). The LLNL SRM 980 solution was calibrated relative to the DSM3 standard solution and the data were corrected appropriately.
Stable C1 isotope ratios were measured at the Environmental Isotope Geochemistry Laboratory at the University of Illinois at Chicago using methods based on those described by Eggenkamp (1994) and Holt et al. (1997). An aliquot of the experimental solution containing -3 mg of C1 was brought to a volume of 10 ml by EVAPORATION OR BYadding deionized water (depending on sample concentration). Four ml of 1M KNO, solution and 2 ml of 0.004M NaHP04/0.107M citric acid buffer were added to adjust the ionic strength and pH. The solution was gently heated to 8O"C, and 3 ml of 0.38M AgNO, was added to precipitate AgC1. The sample was then kept in a dark enclosure overnight. The AgCl precipitate was retrieved by centrifuging and washing three times with 0.1M HNO,. The AgCl precipitate was transferred into a 9-mm 0.d. borosilicate glass tube that had been baked at 550°C for 2 hours. The tube was attached to a vacuum line for evacuation and cryogenic addition of 35 pL CHJ. The tube was sealed and the contents combusted at 300°C for 2 hours. The tube was then attached to a vacuum line, cracked open, and the released CH,Cl was purified by cryogenic distillation using dry ice/acetone and pentanelliquid nitrogen slushes to regulate temperature. The purified CH,C1 was cryogenically transferred using liquid nitrogen, measured
8
manometrically, and sealed into another evacuated glass tube. The purified CH,C1 was then introduced into the source of a Finnigan MAT Delta-Plus XL mass spectrometer for measurement of the ratio (mlz) 52/50. Measured ratios were normalized to those of aliquots of seawater C1 (Conception Bay, Newfoundland) prepared and measured by the same procedure (1-3 seawater samples per batch of 10 samples). Precision (lo) of this analytical method is M. 1%0.
4. Results
4.1 KCl-LiCl experiments
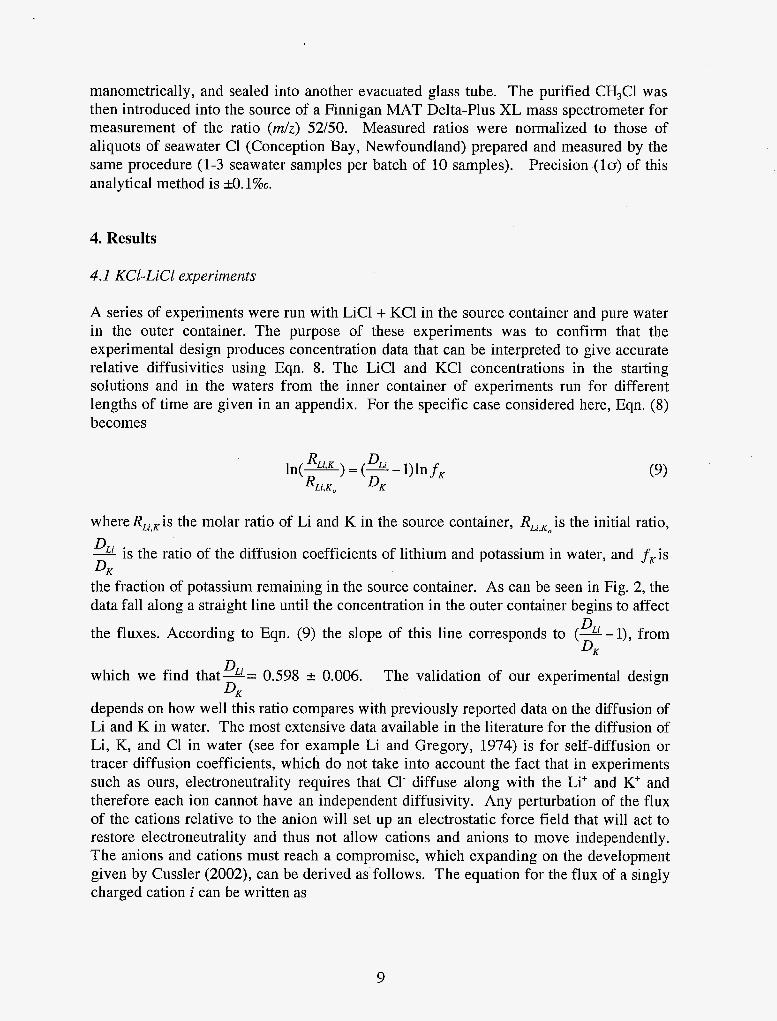
A series of experiments were run with LiCl + KC1 in the source container and pure water in the outer container. The purpose of these experiments was to confirm that the experimental design produces concentration data that can be interpreted to give accurate relative diffusivities using Eqn. 8. The LiCl and KC1 concentrations in the starting solutions and in the waters from the inner container of experiments run for different lengths of time are given in an appendix. For the specific case considered here, Eqn. (8) becomes
where RLi is the molar ratio of Li and K in the source container, RLi is the initial ratio,
a is the ratio of the diffusion coefficients of lithium and potassium in water, and fKis
the fraction of potassium remaining in the source container. As can be seen in Fig. 2, the data fall along a straight line until the concentration in the outer container begins to affect
' 0
DK
the fluxes. According to Eqn. (9) the slope of this line corresponds to (--1), DLi from
which we find that-= DLi 0.598 rf: 0.006.
DK
The validation of our experimental design DK
depends on how well this ratio compares with previously reported data on the diffusion of Li and K in water. The most extensive data available in the literature for the diffusion of Li, K, and C1 in water (see for example Li and Gregory, 1974) is for self-diffusion or tracer diffusion coefficients, which do not take into account the fact that in experiments such as ours, electroneutrality requires that C1- diffuse along with the Li' and K' and therefore each ion cannot have an independent diffusivity. Any perturbation of the flux of the cations relative to the anion will set up an electrostatic force field that will act to restore electroneutrality and thus not allow cations and anions to move independently. The anions and cations must reach a compromise, which expanding on the development given by Cussler (2002), can be derived as follows. The equation for the flux of a singly charged cation i can be written as
9
while that for the anion is
/ ( VC,, - c,, 3) RT
where the @s are self-diffusion coefficients, 3 is Faraday's constant, W is the electrostatic potential, R is the gas constant, and T is absolute temperature. We require electroneutrality (CLi+ C,+ C,=O) and no net electric current (JLi+ J,+ J,,=O) and define a parameter a=CJCLi for the concentration ratio of the cations. These constraints can be
used to eliminate resulting in new expressions for the fluxes. RT
and
where the quantities in brackets are the effective diffusion coefficients DLi and D, for Li and K when C1 is the co-diffuser. What is of interest here, however, is the ratio of the fluxes JL{JK, which turns out (somewhat surprisingly, perhaps) to be the ratio of the self- diffusion coefficients (Le., JLi/JK = DLjlDK = %{ despite the fact that the effective diffusion coefficients for Li and K are not the same as their self-diffusion coefficients.
Li and Gregory (1972) give values for the self-diffusion coefficients of Li and K at infinite dilution and T= O"C, 18"C, and 25°C. Our experiments involved - 0.1M solutions run at T=75'C. A 0.1M concentration is effectively dilute as far as diffusion is concerned, but we do have to extrapolate the data given in Li and Gregory (1972) to 75" to compare it to our results. Extrapolating the Li and Gregory data to 75°C gives value not significantly different from the ratio = 0.60+0.06 derived from the slope (and 95% confidence interval) of the data in Fig. 2 for -1nfs 1.85. This agreement, together with the fact that the data in Fig. 2 define a common line (as required by Eqn. 9 until the fraction of K remaining is no longer large compared to that in the outer container) is evidence that our experimental design provides an effective way for measuring the ratio of the diffusivities of ions in water with a precision of the order of 10% or better. The fact that K diffuses in water considerably faster than Li despite the larger ionic radius of K compared to that of Li is an indication of the special nature of ionic diffusion in water, and stands in marked contrast to the behavior in other liquids (e.g., molten silicates) in which Li diffuses orders of magnitude faster than K (Richter et al., 2003).
10
4.2 Li isotopic fiactionation
The isotopic fractionation of Li as it diffuses in water was measured in a series of experiments in which the source container was initially loaded with a LiCl solution (-0.2M) and then allowed to diffuse into an outer container filled with pure water. The conditions and compositional data are given in an appendix. Figure 3 shows the isotopic fractionation of Li as a function of the fraction of Li remaining in the source container plotted in the manner suggested by Eqn. 8. The slope of the data in Fig. 3 corresponds to
1OOOx (- - 1) and determines - = 0.99772 2 0.00026(20), which in terms of the
exponent in Eqn.(l) corresponds to b0.01475 when ml=7 and m2= 6. Also shown in Fig. 3 is a calculated curve that takes into account the concentration and isotopic composition of Li in the outer container. The calculated curve shows that once the fraction of Li remaining in the source container becomes sufficiently small, the isotopic fractionation is expected to fall increasingly below the straight line. For reasons we do not understand, this expectation was not realized in that the most fractionated composition still falls on the same line as the other data points. One possible explanation for this lack of sensitivity to the concentration of Li in the outer container is that it became stratified with the denser, salty fluid ponding at the bottom of the container while the water at the level of the opening of the source container remained relatively fresh (Le., salt free). Figure 4 shows a different way of displaying the Li isotopic data from the source container along with three measurements of the Li isotopic composition in the outer container. The isotopic composition is now reported as a7Li %O E
1OOOx ( (7’LJ)s0tnp’c - 1) , where the subscript o indicates the Li isotopic composition of the
starting solution. The figure also includes calculated curves based on Eqn. (7) where the ratio of the diffusivities corresponds to 8=0.01475 (for our data), fi =0.071 (the value corresponding to the Li fractionation reported by Fritz, 1992), and fi =0.215 (the value reported by Richter et al. (2003) for Li diffusing in a molten silicate liquid. The question as to why our data indicate so much less fractionation than those reported by Fritz (1992) is addressed in a later section.
D7Li D , D 6 L i ~ L J
- 7 7 x
4.3 Mg isotopic fiactionation
A large number of exploratory experiments (-25) were run to determine the range of isotopic fractionations of Mg by diffusion in water. Measurements of the isotopic composition of the Mg remaining in the source container of these preliminary experiments were of relatively low precision (k0. 5%0, l a ) and did not resolve any difference between the starting solution and the diffused samples. We then undertook a new series of diffusion experiments with a variety of conditions (MgC1, in water diffusing into pure water, MgC1, in water containing 0.5% agarose gel diffusing into pure water, MgC1, diffusing into an outer container containing an approximately equal molar concentration of CaCl,) using improved analytical procedures to measure the Mg isotopic
11
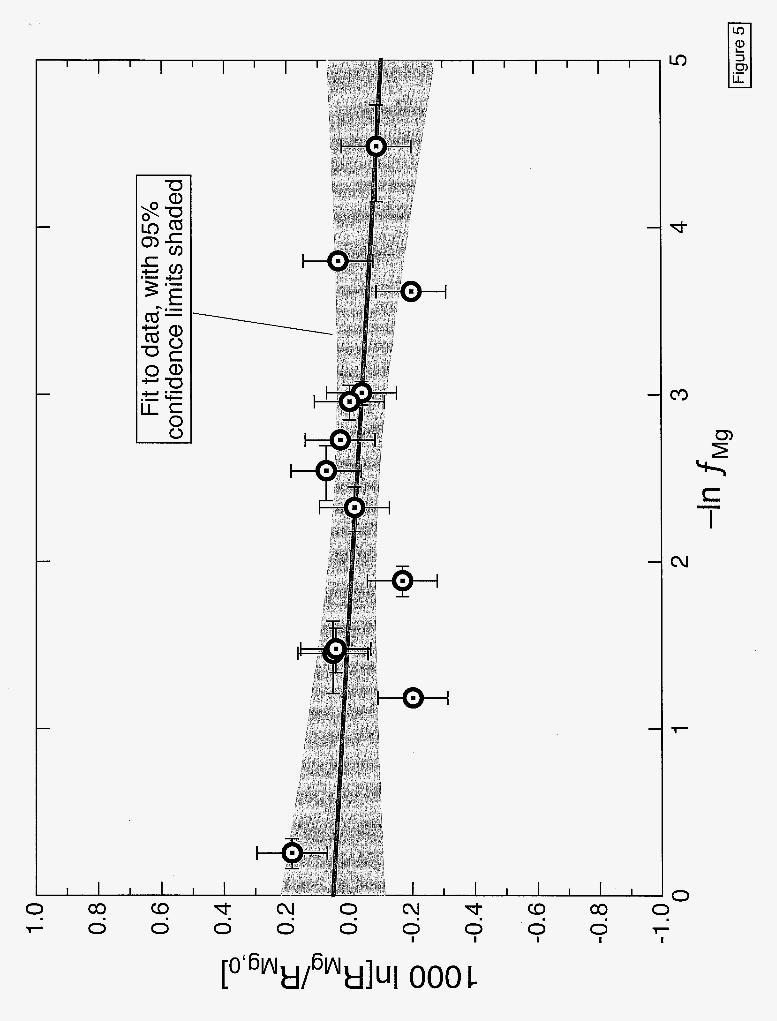
composition of the solutions with greater precision (20.2 - 0.5%0, 20). The resulting data are given in the appendix and plotted in Fig. 5. Even with the higher precision of the new isotopic measurements there is no resolvable isotopic fractionation of Mg in any of the solutions from the experiments. The precision of the isotopic analyses together with the scatter of the data around a best fitting straight line results in a bound on the isotopic fractionation factor per atomic mass unit of Mg diffusing in water of a=l.000032~.000061(20).
4.4 Cl isotopic fractionation
A subset of the waters taken from the inner container of experiments involving MgC1, and LiCl were measured for their C1 isotopic composition. The data are given in an appendix and plotted in Figs. 6 and 7. We found D37cz/D35cl = 0.99857-~0.00080(2~). For reasons we do not yet fully understand, the data in Figs. 6 and 7 are more scattered around the best fitting straight line than one would expect based on the precision of the individual C1 isotopic measurements, and this scatter accounts for the large uncertainty in our estimate of D37c1/D35cz. Nevertheless, the first order result is that diffusion in water fractionates C1 isotopes by a measurable amount regardless of whether the isotopes of the co-diffuser are themselves fractionated. Our results for the fractionation of C1 isotopes by diffusion of LiCl and MgCl, in water are comparable to the experimental results for C1 isotope fractionation during diffusion of NaCl in water reported by Coleman and co- workers (D37cz/D35cz = 0.998 1-0.9986) at the 2000 Goldschmidt Conference (Coleman et al., 2000). Our results are also within the range of the D37cl/D35cl values (0.9970-0.9988) estimated from measurements of C1 isotope ratios in sedimentary pore waters in a variety of natural settings (Desaulniers et al., 1986; Eggenkamp et al., 1994; Groen et al., 2000; Hesse et al., 2000).
5. Discussion
Our results for the isotopic fractionation of Li, Mg and C1 by diffusion in water are summarized in Table 1. For comparison, we also include the results of various earlier isotope fractionation experiments involving water and molten silicate liquids.
The results from our LiC1-KC1 diffusion experiments reproduce the well-known result that lithium, despite its much lower low mass and smaller ionic radius compared to potassium, diffuses significantly slower than potassium (Fig. 2). This result is an indication of the special nature of ionic diffusion in water compared to diffusion in other liquids such as molten silicates. The contrast in diffusive behaviors in water and silicate liquids is dramatic (Table 1). In a silicate melt the diffusion coefficient of lithium is two to three orders of magnitude larger than that of potassium and the diffused lithium is far more isotopically fractionated than what we observed in water. The special nature of ionic diffusion in water derives from a variety of sources including solvation and dielectric effects (Hubbard and Onsager, 1977). The effect of hydrodynamic friction is proportional to the radius of the diffusing species, and one can, if one chooses, use the measured ion mobilities to calculate effective radii, which in turn can be rationalized in
12
terms of hydration numbers (i.e., the number of water molecules bound to a solute). Cussler (2003, Table 6.3-1) reports hydration numbers derived from diffusion for Li' of 1.3 and for K' of -0.1. Hydration numbers derived in this way would seem to be little more than a restatement of the diffusion data in terms of a new set of parameters that are not independently verified, and in fact, these hydration numbers are significantly at odds with the hydration numbers of about 4-6 for Li' and K' derived by other methods such as neutron scattering (see the review by Enderby, 1995) and molecular computations (see for example Rempe et al., 2000; Koneshan et al., 1998). The fact that potassium diffuses significantly faster than lithium in water is most likely the result of dielectric friction that according to continuum models such as that given by Hubbard and Onsager (1977) depends inversely on some power, typically 3, of the radius of the solute. This inverse relationship between size and dielectric friction will have the effect of reducing the mobility of the smaller species, which is opposite the effect of size on the hydrodynamic friction. For charged species, it appears that the dielectric friction dominates in that the experimentally measured mobility of like-charged ions decreases with decreasing ionic radius, as we found for the diffusion of Li' and K'. It is not clear how one would use this way of rationalizing the relative mobility of dissolved ions to derive an expectation for the relative mobility of isotopically distinct species. One would, however, be tempted to believe that the small to negligible isotopic fractionations associated with diffusion in water are the result of hydration. Thinking in terms of a relationship such as given by Eqn. 1 where the ratio of the diffusivities of isotopically distinct species is a function of the ratio of the respective masses, hydration, by increasing the effective masses, will reduce the mass ratio and the associated ratio of the diffusivities.
Our focus on the relative mobility of isotopes distinguishes the work reported here from most of the earlier work on ion diffusion in water. We found the differences in the mobility of the isotopes of a given ion in water to be surprisingly small compared to mass-dependent effects in other liquids such as molten silicates (see Table 1). The potential role of hydration can be explored by calculating the number of water molecules that would be required to produce an effective mass for the diffusing species such that Eqn. (1) will yield the measured ratio of the diffusivities of the isotopically distinct species. The results of such a calculation are given in Table 2 for a range of choices for the exponent p based on prior experience with other systems that fractionate isotopes by diffusion. In the case of Li the calculation shows that a reasonable number of water molecules together with a plausible value for f3 (0.215, as found in silicate liquids) can account for the observed isotopic fractionation. In the case of Mg, however, the number of water molecules required is absurdly large even for p as small as 0.075 (the value for Ca isotope fractionation in silicate liquids). Both x-ray diffraction and molecular dynamics calculations find that the coordination shell of Mg2+ is made up of six water molecules (Skipper et al. 1989) and thus there is no independent evidence for the very large numbers of waters listed in Table 2. The number of water molecules needed to account for the fractionation of C1 isotopes is also large compared to the number of waters in the first coordination shell (-6) found by neutron scattering (Enderby, 1995). It seems difficult to avoid the conclusion that the degree of hydration of ions indicated by scattering studies and molecular dynamics calculations does not provide a simple or
13
consistent explanation for the small degree of mass-dependent fractionation of isotopically distinct species as they diffuse in water.
Perhaps the most important result of the present study is that we have found a much smaller isotopic fractionation of Li by diffusion in water than was reported in an earlier study by Fritz (1992). The magnitude of the difference between these two reports is clearly illustrated in Fig. 4. We are quite confident of our own result in that we have independent evidence from our LiCl-KC1 experiments that our experimental design yields accurate relative diffusion coefficients. The most likely explanation of why Fritz (1992) found much larger Li isotopic fractionation that what we measured is that his experimental design allowed for processes other than diffusion in water. In Fritz’s (1992) experiment the volume of water containing dissolved LiCl was enclosed in a dialysis membrane and the diffusion out of that volume was through the membrane. The exciting prospect is that Fritz’s results, when contrasted with ours, may be telling us that transport of ions across membranes can effect isotopic fractionations that are much larger than those which takes place by diffusion in water itself. The obvious test of this hypothesis is to design experiments that focus on mass-dependent isotopic fractionation by transport across membranes. The results of such experiments may prove to be quite relevant for developing a better understanding of the isotopic fractionation by organisms such as the foraminifera studied by Gussone at al. (2003).
Acknowledgements. We thank Erick Ramon for ICPMS analyses of Mg concentrations in our experiental solutions. This work was supported by DOE grant DE-FGOZ) 1ER15254.
References
Coleman M., Eggenkamp H., and Aranyossy J.F. (2000) History of solute transport in a 400m mudrock sequences, calibrated by laboratory chlorine stable isotope diffusion experiments. Extended abstract from Goldschimdt 2000 in J. Con$ Abstracts 5, 3 13-3 14.
Craig H. and Gordon L. (1965) Deuterium and oxygen 18 variation in the ocean and marine atmosphere. In Stable Isotopes in Oceanographic Studies and Paleotemperatures (ed. Tongiorgi) Spoleto, CNR, Pisa, 9-130.
Press, Cambridge.
variations in a diffusion controlled groundwater system. Geochim. Cosmochim.
Cussler E.L. (2003) Diffusion, Mass Transfer in Fluid Systems, 2nd ed. Cambridge Univ.
Acta 50,1757-1764. Eggenkamp, H. (1994) 637Cl: The geochemistry of chlorine isotopes. Faculteit
Aardwetenschappen, Universiteit Utrecht, Geologica Ultraiectina, no. 1 16. Eggenkamp, H.G.M., Middleburg, J.J., and Kreulen, R. (1994) Preferential diffusion of
C1 relative to 37Cl in sediments of Kau Bay, Halmahera, Indonesia. Clzem. Geol.
Enderby J.E. (1995) Ion solvation via neutron scattering. Chem SOC. Rev. 24, 159-168.
35
116, 3 17-325.
Fritz S.J. (1992) Measuring the ratio of aqueous diffusion coefficients between 6 Li .+ Cl- 7 + and Li C1‘ by osmometry. Geochim. Cosmochim. Acta 56,378 1-3789.
14
Galy, A., Yoffe, O., Janney, P. E., Williams, R. W., Cloquet, C., Alard, O., Halicz, L., Wadhwa, M., Hutcheon, I. D., Ramon, E., and Carignan, J. Magnesium isotopes heterogeneity of the isotopic standard SRh4980 and new reference materials for Magnesium-isotope-ratio measurements. J. Anal. At. Spectrom. 18, 1352-1356,2003.
Groen J., Velstra J., Meesters A.G.C.A. (2000) Salinization processes in paleowaters in coastal sediments of Suriname: Evidence from delta 37Cl analysis and diffusion modeling. J. Hydrol. 234, 1-20.
H.J., Lea D.W., Bijma J., and Nagler, T.F. (2003) Model for kinetic effects on calcium isotope fractionation (sMCa) in inorganic aragonite and cultured planktonic foraminifera. Geochim. Cosmochim. Acta 67, 1375-1 382.
Hesse R., Frape S.K., Egeberg P., and Matsumoto R. (2000) Stable isotope studies (Cl, 0, and H) of interstitial waters from Site 997, Blake Ridge gas hydrate field, West Atlantic. In: Paul1 C.K., Matsumoto R., Wallace P.J., and Dillon W.P. (Eds.), Proceedings of the Ocean Drilling Program, Scientific Results 164, 129-1 37.
Holt, B.D., Sturchio, N. C., Abrajano, T. A., and Heraty, L. J. (1997) Conversion of volatile chlorinated organic compounds to carbon dioxide and methyl chloride for isotopic analysis of carbon and chlorine. Analytical Chemistry 69, 2727-2733.
Hubbard J. and Onsager L. (1977) Dielectric dispersion and dielectric friction in electrolyte solutions. J. Chem. Phys. 67,4850-4857.
Jahne B., Heinz G., and Dietrich W. (1987) Measurements of diffusion coefficients of sparingly soluble gases in water. J. Geophys. Res. 92, 10,767-10,776.
Koneshan S., Jayendran C. R., Lynden-Bell R.M., and Lee S.H. (1998) Solvent structure, dynamics, and ion mobility in aqueous solutions at 25°C. J . Phys. Chem. 102,
Gussone N., Eisenhauer A., Heuser A., Dietzel M., Bock B., Bohm F., Spero
41 93-4204. Li Y-H. and Gregory S. (1974) Diffusion of ions in seawater and in deep-sea sediments.
Ludwig K.R. (2003) User's manual for Isoplot 3.00: A Geochronological Toolkit for Geochim. Cosmochim. Acta 38,703-714
Microsoft Excel. Berkeley Geochronology Center Special Publication No. 4, Berkeley, California.
Prinzhofer A. and Pernaton E. (1997) Isotopically light methane in natural gas: bacterial imprint or diffusive frsactionation? Chemical Geology 142, 193-200.
Rempe S.B., Pratt L.R., Hummer G., Kress J.D., Martin R.L., and Redondo A. (2000) The hydration number of Li' in liquid water. J . Am. Chem. SOC. 122, 966-967.
Richter F.M., Liang Y., and Davis A.M. (1999) Isotope fractionation by diffusion in molten oxides. Geochim. Cosmochim. Acta 63,2853-2861.
Richter F.M., Davis A.M., DePaolo D.J. and Watson E.B. (2003) Isotope fractionation by chemical diffusion between molten basalt and rhyolite. Geochim. Cosmochim. Acta 67, 3905-3923.
NiZ+(,,) and Mg",,,, by difference methods. J. Phys.Condens. Matter 1 , 3489- 3506.
Zhang T. and Krooss B. M. (2001)Experimental investigation of on the carbon isotope fractionation of methane during gas migration by diffusion through sedimentary
Skipper N.T., Neilson, G.W., and Cummings S.C. (1989) An x-ray diffraction study of
15
rocks at elevated temperatures and pressure. Geochim. Cosmochim. Acta 65,2723- 2742.
Figure Captions
Figure 1: Schematic diagram of the experimental apparatus used to measure the relative diffusivity of ionic species dissolved in water. The small (source) containers that we used have interior volumes between 0.5 and 0.7 cm3 while the outer (sink) container is filled with approximately 200 ml of water. The diffusion tube connecting the two chambers has a nominal inner diameter of lmm and a length of either 1 cm and 2 cm. The different lengths were used to verify that the length of the connecting tube and the associated time constant for diffusive exchange did not affect the relative diffusivity measurements.
Figure 2: Change in the Li/K of the inner (source) container as a function of the fraction fK of K remaining, plotted in the manner suggested by Eqn. 8. The data, along with 20 error bars, used to construct this figure are given in an appendix. The heavy straight line is a best fit through the data points with -lnfKs 1.85, which were not affected by the finite size of the sink container. Also shown are two thin curves illustrating the effect of the finite size of the sink on the Li/K evolution calculated using Eqns. (4) and (5). The slope
of the heavy line corresponds to -= DLi 0.598 and the shading around the straight line
shows the 95% confidence limits on the slope (-t.0.006). The best fitting straight line and the uncertainty of the slope were calculated using Isoplot 3.00 (Ludwig, 2003) taking into account both the precision of the individual data points and the scatter around a best fitting straight line.
DK
Figure 3: Same as Figure 2 but for the change in the 7Li/6Li as a function of the fraction fLi of Li remaining in the source flask. The calculated finite-volume evolution curve assumes the largest reasonable ratio of the volumes of the sink and source. The slope of the straight line and the associated 95% confidence limits correspond to
-- D7Li - 0.99772 -c 0.00026(20). D6Li
Figure 4: Same data (open symbols) shown in Figure 3, but now plotted in terms of the isotopic fractionation of the source reservoir as a function of the fraction fLi of Li remaining in the source. The filled symbols represent three measurements of the Li isotopic composition of the sink reservoir. Model curves were calculated for various choices of the fractionation parameter fi in Eqn. ( l) , which determines the ratio of diffusion coefficients used in Eqn. (7). The model curves highlight the distinctiveness of our results from those reported by Fritz (1992) and from the fractionation of Li isotopes by diffusion in silicate liquids reported by Richter et al. (2003). The corresponding evolution curves for the sink reservoir are also shown.
16
Figure 5: Same as Fig. 3 but for the change in Mg isotopes as a function of the fraction fME of Mg remaining in the source container. The data used in this plot are a combination of the measured 25Mg/24Mg and 26Mg/24Mg such that each point corresponds to the average Mg isotope fractionation per atomic mass unit (RMg= [25Mg/24Mg+(26Mg/24Mg)/2]/2). The slope of the data is not significantly different from zero at the 95% confidence level.
Figure 6: Same as Fig. 3 but for the change in 37C1/35C1 as a function of the fractionf,, of CI remaining in the source container. The slope and 95% confidence limits of the entire
a, data set correspond to 3 = 0.99857 2 0.00080. D 3 5 c [
Figure 7: Same as Fig. 4 but for the C1 isotope data.
17
Table 1
Parameters for elemental and isotopic fractionation by diffusion in water
*2a Species fi in Source
Noble gases
LiIK
Eqn. (1) -0.5
Li isotopes
Jahne et al. (1987)
Mg isotopes
0.00080 Cl isotopes 0.025 Fig. 6 (Coleman et al., 2000)
Parameters for elemental and isotopic fractionation by diffusion in silicate liquids (Richter et al., 2003)
Table 2
Number of waters of hydration (n) such that when the combined mass of the isotopes plus water is used in Eqn. 1 together with a choice of p, the calculated ratio of the diffusivities of the isotopically distinct species corresponds to the measured value DilDy
18
Appendix
07S4-F 07L7-F
07L5-C 07S5-C 07S6-C
Container samples
L iCI+ KCI T=75'C
22.8 3.2 7.77 0.47 105.3 20 4.77 0.54
-1.95 0.37 -0.95 0.3 -0.45 0.32
CI isotope fractionation T=75'C
19
Mg isotope fractionation
Starting sol. MgC12 CaClz
Flask 07s 1( MgCI2+CaC12) 07S2( MgC12+CaC12) 07s 5 ( M g CI 2+ Ca CI 2) 07L5(MgC12+CaC12) 07L7( MgC12+CaC12) 07L9( MqC12+CaC12) 07S7( MgC12)' 07s 9( M g CI 2 + Ca CI 2) ' 07L3( MgC12)' 07s 3 ( M g CI 2 + Ca C 12+ a g a r) 07s 6( M g CI 2 + ag a r) '
Container 07S2( MgC12+CaC12) 07s 5( Mg CI 2+ CaC12) 07L7( MgCI2+ Ca C12) 07L9f MaC12+CaC12\
20 aZ5Mg 5.26 2.39 4.73 2.46 0.56 2.55
19 3 17
07L3( Mg CI 2) ' 07s 3 ( M g CI 2 + Ca CI 2+ a g a r) ' 07s 6( M g CI 2 +a q a r) ' 07 L6( M g CI 2 +a g a r) 07LD (Mg CI 2+Ca C12+aga r)'
104 2.29 74 2.68
19.4 2.32 45 2.25
20.7 2.4 a ve 2.34
2 stdev 0.36
2 sigma external precision on i 5 2 5 ~ g = 0 . 2 ~ / ~ ~ duplicates generally better than .2 T= 75°C except for those with superscript ' indicating incubation at T=38"C.


![Predicting Isotopic Fractionation in Water from Quantum ... · PDF filePREDICTING ISOTOPIC FRACTIONATION IN WATER FROM ... and Schulman [17]. 2.1.1. Path Integral Quantum ... PREDICTING](https://static.documents.pub/doc/80x56/5a79ebdf7f8b9ab05f8dafe9/predicting-isotopic-fractionation-in-water-from-quantum-isotopic-fractionation.jpg)


