Published: January 26, 2011 r2011 American Chemical Society 2850 dx.doi.org/10.1021/ie101558d | Ind. Eng. Chem. Res. 2011, 50, 2850–2864 ARTICLE pubs.acs.org/IECR Kinetic Parameter Estimation of a Commercial Fe-Zeolite SCR Tae Joong Wang,* ,†,‡ Seung Wook Baek, † Hyuk Jae Kwon, §,3 Young Jin Kim, § In-Sik Nam,* ,§ Moon-Soon Cha, ^ and Gwon Koo Yeo || † Propulsion and Combustion Laboratory, School of Mechanical, Aerospace and Systems Engineering, Korea Advanced Institute of Science and Technology (KAIST), 373-1 Guseong-dong, Yuseong-gu, Daejeon 305-701, Korea § Environmental Catalysis Laboratory, Department of Chemical Engineering, Pohang University of Science and Technology (POSTECH), San 31, Hyoja-Dong, Pohang 790-784, Korea ^ Technology Center, ORDEG Corporation, 404 Mognae-dong, Danwon-gu, Ansan-si, Gyeonggi-do 425-100, Korea ) Emission Research Team, Hyundai-Kia Motors, 772-1 Jangduk-dong, Hwaseong-si, Gyeonggi-do 445-706, Korea ABSTRACT: In this work, an in-house computational code capable of simulating highly coupled physicochemical phenomena occurring in ammonia/urea SCR (selective catalytic reduction) was developed. On the basis of this computational code, the kinetic parameters of catalytic reactions were newly calibrated using the experimental results obtained over a commercial ammonia/urea SCR washcoated Fe-ion-exchanged zeolite-based catalyst. Powder-phase NH 3 TPD (temperature-programmed desorption) experiments were performed to calibrate the kinetic parameters of NH 3 adsorption and desorption, and core-out monolith experiments were conducted to estimate the kinetic parameters of various deNO x reactions as well as NH 3 oxidation. The currently established SCR model and kinetic parameters gave a good prediction for both steady-state and transient experimental results for a wide range of operating conditions. The main objectives of this study were to develop numerical tools and their implementation methodologies that can be cost-effectively applied to the design and development of real-world ammonia/urea SCR systems. Details of the procedures and techniques in numerical modeling and kinetic parameter calibration are described step-by-step in this article. 1. INTRODUCTION Ammonia/urea selective catalytic reduction (SCR) removes NO x emissions through catalytic reactions using ammonia or urea as a reducing agent. This SCR technology has been well proven in a number of industrial stationary applications since the 1970s. 1 Although there are still several problems that need to be resolved or improved, ammonia/urea SCR is thought to be the most promising technology capable of lowering diesel NO x emissions to levels required by increasingly stringent emission regulations over the world. For mobile SCR applications, aqueous urea is utilized in practice as a reductant because of the toxicity and safety problems involved in handling or transporting pure ammonia. In urea SCR, ammonia is generated in situ through thermal decomposition of urea and participates predominantly in deNO x reactions. 2,3 However, there have been several reports that direct removal of NO by urea itself and its decomposition byproduct, isocyanic acid, might play an important role in overall deNO x processes. 4,5 Compared with other deNO x aftertreatments such as hydro- carbon SCR or LNT (lean NO x trap), the advantages of urea SCR include higher conversion efficiencies over a wider tem- perature window, reduced fuel penalty, greater durability, and cost savings due to the lack of precious metals. On the contrary, potential limitations of urea SCR include system complexity, costs associated with urea dosing, the absence of an infrastructure for urea, and ammonia slip. 6 Selective catalytic reduction of NO x with ammonia was first discovered over a platinum catalyst. However, platinum technol- ogy can be used only at temperatures below 250 °C because of its poor selectivity for NO x reduction at higher temperature. 1 In recent years, three major catalysts have been widely employed for urea SCR: vanadium, Cu-zeolite, and Fe-zeolite. Surely, each one shows different performance characteristics in view of various aspects such as operating temperature window, conversion level, human health effects, supply costs, and so on. Vanadium is relatively cheaper and more resistant to sulfur poisoning, 7 but it is easily deactivated when exposed to the high temperatures required for active regeneration of soot with oxygen in diesel particulate filters (DPFs). 8 It is known that limited temperature for the use of vanadium-based SCR catalysts ranges from about 600 to 650 °C, 9,10 whereas some V 2 O 5 /TiO 2 catalysts are reported to be thermally stable up to 700 °C. 11 Transition-metal-promoted zeolites are able to endure high temperatures and achieve high NO x conversions. Two com- monly available zeolite SCR catalysts are based on iron and copper. 10 Cu-zeolite catalysts exhibit efficient NO x conversions at relatively low temperatures with little or no NO 2 , but display poor NO x conversions at elevated temperatures. On the other hand, Fe-zeolite catalysts show better NO x conversions at temperatures as high as 600 °C or higher. However, they are not as efficient as Cu-zeolite at lower temperatures in the absence of NO 2 . Currently, Cu-zeolite formulations are favored when the exhaust gas temperature is lower than 450 °C during the majority Received: July 21, 2010 Accepted: December 17, 2010 Revised: November 17, 2010
Transcript
Published: January 26, 2011
r 2011 American Chemical Society 2850 dx.doi.org/10.1021/ie101558d | Ind. Eng. Chem. Res. 2011, 50, 2850–2864
ARTICLE
pubs.acs.org/IECR
Kinetic Parameter Estimation of a Commercial Fe-Zeolite SCRTae Joong Wang,*,†,‡ Seung Wook Baek,† Hyuk Jae Kwon,§,3 Young Jin Kim,§ In-Sik Nam,*,§
Moon-Soon Cha,^ and Gwon Koo Yeo||
†Propulsion and Combustion Laboratory, School of Mechanical, Aerospace and Systems Engineering, Korea Advanced Institute ofScience and Technology (KAIST), 373-1 Guseong-dong, Yuseong-gu, Daejeon 305-701, Korea§Environmental Catalysis Laboratory, Department of Chemical Engineering, Pohang University of Science and Technology(POSTECH), San 31, Hyoja-Dong, Pohang 790-784, Korea
^Technology Center, ORDEG Corporation, 404 Mognae-dong, Danwon-gu, Ansan-si, Gyeonggi-do 425-100, Korea
)Emission Research Team, Hyundai-Kia Motors, 772-1 Jangduk-dong, Hwaseong-si, Gyeonggi-do 445-706, Korea
ABSTRACT: In this work, an in-house computational code capable of simulating highly coupled physicochemical phenomenaoccurring in ammonia/urea SCR (selective catalytic reduction) was developed. On the basis of this computational code, the kineticparameters of catalytic reactions were newly calibrated using the experimental results obtained over a commercial ammonia/ureaSCR washcoated Fe-ion-exchanged zeolite-based catalyst. Powder-phase NH3 TPD (temperature-programmed desorption)experiments were performed to calibrate the kinetic parameters of NH3 adsorption and desorption, and core-out monolithexperiments were conducted to estimate the kinetic parameters of various deNOx reactions as well as NH3 oxidation. The currentlyestablished SCR model and kinetic parameters gave a good prediction for both steady-state and transient experimental results for awide range of operating conditions. The main objectives of this study were to develop numerical tools and their implementationmethodologies that can be cost-effectively applied to the design and development of real-world ammonia/urea SCR systems. Detailsof the procedures and techniques in numerical modeling and kinetic parameter calibration are described step-by-step in this article.
1. INTRODUCTION
Ammonia/urea selective catalytic reduction (SCR) removesNOx emissions through catalytic reactions using ammonia orurea as a reducing agent. This SCR technology has been wellproven in a number of industrial stationary applications since the1970s.1 Although there are still several problems that need to beresolved or improved, ammonia/urea SCR is thought to be themost promising technology capable of lowering diesel NOx
emissions to levels required by increasingly stringent emissionregulations over the world.
For mobile SCR applications, aqueous urea is utilized inpractice as a reductant because of the toxicity and safety problemsinvolved in handling or transporting pure ammonia. In urea SCR,ammonia is generated in situ through thermal decomposition ofurea and participates predominantly in deNOx reactions.2,3
However, there have been several reports that direct removalof NO by urea itself and its decomposition byproduct, isocyanicacid, might play an important role in overall deNOx processes.
4,5
Compared with other deNOx aftertreatments such as hydro-carbon SCR or LNT (lean NOx trap), the advantages of ureaSCR include higher conversion efficiencies over a wider tem-perature window, reduced fuel penalty, greater durability, andcost savings due to the lack of precious metals. On the contrary,potential limitations of urea SCR include system complexity,costs associated with urea dosing, the absence of an infrastructurefor urea, and ammonia slip.6
Selective catalytic reduction of NOx with ammonia was firstdiscovered over a platinum catalyst. However, platinum technol-ogy can be used only at temperatures below 250 �C because of its
poor selectivity for NOx reduction at higher temperature.1 Inrecent years, three major catalysts have been widely employed forurea SCR: vanadium, Cu-zeolite, and Fe-zeolite. Surely, each oneshows different performance characteristics in view of variousaspects such as operating temperature window, conversion level,human health effects, supply costs, and so on.
Vanadium is relatively cheaper and more resistant to sulfurpoisoning,7 but it is easily deactivated when exposed to the hightemperatures required for active regeneration of soot withoxygen in diesel particulate filters (DPFs).8 It is known thatlimited temperature for the use of vanadium-based SCR catalystsranges from about 600 to 650 �C,9,10 whereas some V2O5/TiO2
catalysts are reported to be thermally stable up to 700 �C.11Transition-metal-promoted zeolites are able to endure high
temperatures and achieve high NOx conversions. Two com-monly available zeolite SCR catalysts are based on iron andcopper.10 Cu-zeolite catalysts exhibit efficient NOx conversionsat relatively low temperatures with little or no NO2, but displaypoor NOx conversions at elevated temperatures. On the otherhand, Fe-zeolite catalysts show better NOx conversions attemperatures as high as 600 �C or higher. However, they arenot as efficient as Cu-zeolite at lower temperatures in the absenceof NO2. Currently, Cu-zeolite formulations are favored when theexhaust gas temperature is lower than 450 �C during the majority
Received: July 21, 2010Accepted: December 17, 2010Revised: November 17, 2010
Industrial & Engineering Chemistry Research ARTICLE
of operation, whereas Fe-zeolite is preferred when the requiredtemperature for NOx conversion exceeds 450 �C.12 It is reportedthat the absolute upper limit on temperature for Fe-zeolite is925 �C, whereas that for Cu-zeolite is 775 �C.8 Note that the lateststate-of-the-art Cu-zeolite SCR catalyst shows a remarkable high-temperature hydrothermal stability up to 950 �C while main-taining stable low-temperature activity in NOx conversions.
13
For the past several years, modeling and simulation have beenextensively employed for the design and development of mobileSCR systems. Numerical techniques are very helpful in establish-ing control technology of urea dosing, as well as in sustainingsynchronized operation with vehicles or other aftertreatmentdevices such as diesel oxidation catalysts (DOCs) and DPFs. Anumber of studies have progressively focused on developingaccurate numerical tools and their cost-effective implementation.
Reaction kinetics over a catalyst is one of the most significantfactors influencing the accuracy of mathematical models ofcatalytic reactor systems. However, because catalytic reactionsare affected by numerous chemicophysical factors, chemicalkinetics has a case-by-case nature depending on individualsystem configuration. This implies that the direct reuse of kineticparameters taken from other sources cannot be justified and,therefore, that calibration is required by all means. Despite theimportance of kinetic parameter calibration, it is hard to find afundamental work that addresses calibration processes for am-monia/urea SCR in detail. Therefore, this study is primarilyintended to provide a detailed procedure and methodology fortuning kinetic parameters of various catalytic reactions occurringin ammonia/urea SCR.
In this study, selected model reactions and species masstransport equations were first mathematically described. Then,the partial differential forms of governing equations were nu-merically solved using an in-house Fortran 90 computationalcode that was developed through this work. With this numericaltool, kinetic parameters of ammonia adsorption/desorption werenewly calibrated on the basis of a powder-phase TPD experimentover a commercial Fe-zeolite catalyst. Also, kinetic parameters ofvarious deNOx reactions and ammonia oxidation were newlyestimated on the basis of core-out monolith SCR experimentsperformed at steady-state conditions. Finally, the simulationresults produced using the current model and kinetic parameterswere validated with both steady-state and transient experimentalresults.
2. EXPERIMENTAL SECTION
2.1. NH3 TPD Experiments. An NH3 TPD analysis wascarried out through a powder-phase microreactor experimentover a commercial Fe-ion-exchanged zeolite-based catalyst. Forthe catalyst preparation, the monolith form of a commercial SCRat 400/6.5 [cell density (cells/in.2)/wall thickness (m in.)] wascrushed and ground, and then a 0.1-g sample of catalyst powderwas obtained. Note that this catalyst sample contained cordieritesubstrate as well as catalyst itself. After the powder-phase catalystsample was charged into a quartz tube microreactor, its pretreat-ment was conducted in situ at 500 �C for 2 h with flowing Ar gas.The diameter of themicroreactor was 10.1mm, and the thicknessof the catalyst sample layer was 2 mm. In this experiment, thereactor temperature was electrically controlled.During the whole TPD test period, the volumetric flow rate of
Ar feed gas was regulated to 50 cm3/min. At 654 s, a step input of500 ppm NH3 was admitted into the reactor, so that the inlet
concentration of NH3 increased sharply from 0 to 500 ppm.From 654 to 5478 s, a 500 ppm NH3 feed was continuouslysupplied at a constant reactor temperature of 250 �C. This NH3
supply was shut down at 5478 s, so that the NH3 inletconcentration suddenly dropped from 500 to 0 ppm. From5478 to 9534 s, the reactor was flushed with Ar gas at 250 �C toremove the physisorbed species. From 9534 to 12702 s, the TPDexperiment was performed from 250 to 800 �C at a heating rateof 10 �C/min with continuous monitoring of the desorbedspecies including NH3 (m/e = 17) and its fragment, NH2
þ
(m/e = 16) by online mass spectrometer (Pfieffer/BalzersQuadstar, QMI422, QME125). Operating conditions for thisNH3 TPD analysis are summarized in Table 1.2.2. Steady-State SCR Experiments. The catalytic activities
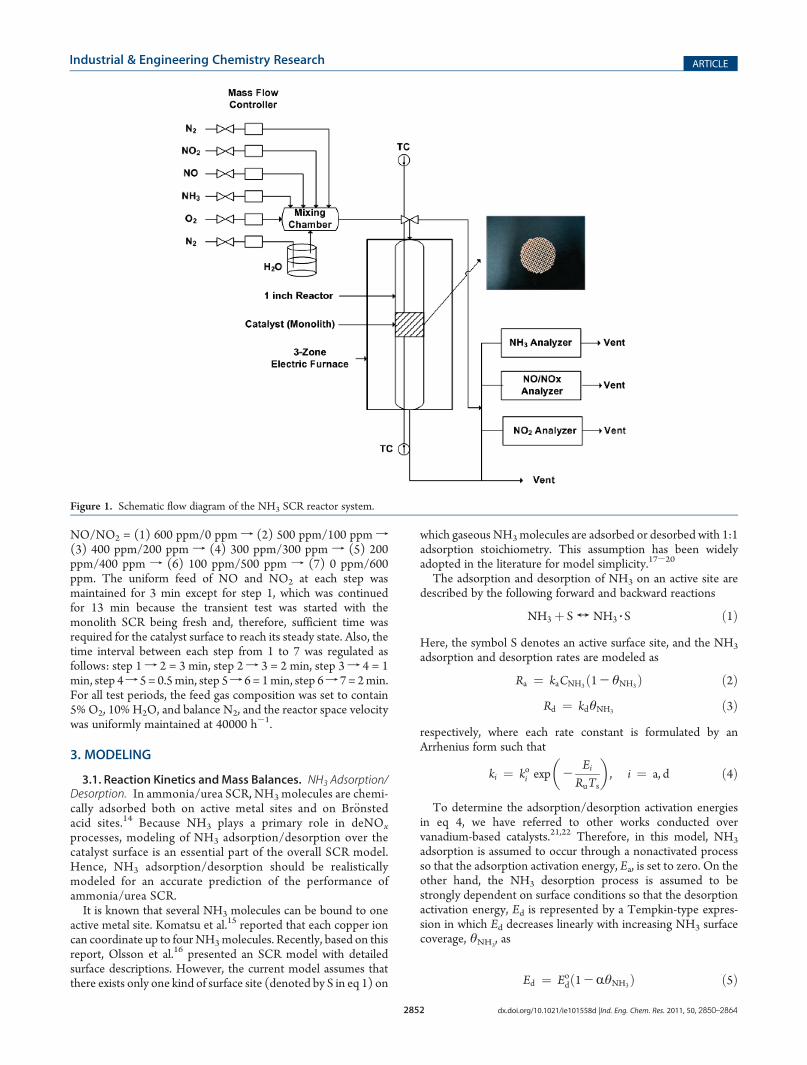
of the same commercial SCR catalyst as used in the NH3 TPDexperiment were examined using an integral flow reactor systemunder steady-state conditions as shown in Figure 1. For thesetests, a core part was taken from the original SCR catalyst so thata small (diameter � length = 20 mm � 40 mm) core-outmonolith SCR catalyst was prepared. The following list providesthe feed gas compositions (commonly containing 5% O2, 10%H2O, and balance N2) and reactor space velocities for eachreaction test: (1) NH3 oxidation, 500 ppm NH3 at 10000 h-1;(2) NO SCR reaction, 500 ppmNH3 and 500 ppmNO at 10000and 15000 h-1; (3) NO2 SCR reaction, 500 ppm NH3 and500 ppmNO2 at 30000-50000 h-1; and (4) NOx SCR reaction,500 ppm NH3, 250 ppm NO, and 250 ppm NO2 at 30000-50000 h-1. Note that reactor space velocity is defined as the ratioof the total volumetric flow rate to the volume occupied by themonolith reactor.In these core-out monolith SCR experiments, all measure-
ment data were obtained after pretreatment of the catalystsunder air atmosphere at 500 �C for 2 h. Concentrations ofNO, NO2, and NH3 were measured by online chemilumines-cence NO-NOx analyzer (Thermo Electron Corporation,model 42H), NO2 analyzer equipped with an electrochemicalcell (Testo, model 350M), and a nondispersive-infrared-(NDIR-) type NH3 analyzer (Rosemount Analytical, model880A), respectively.2.3. Transient SCR Experiments. The transient catalytic
activities of the same size of core-out monolith SCR as used inthe previous steady-state experiments were also evaluated usingthe reactor system illustrated in Figure 1. In these transient tests,the inlet concentrations of NO and NO2 were changed with timeat constant reactor temperatures of 230 and 300 �C. Here, theNH3 inlet concentration was constantly set to 600 ppm. The sumof the NO and NO2 inlet concentrations was also regulated to600 ppm, while their ratio was changed with time as follows:
Table 1. Operating Conditions for NH3 TPD Analysis
parameter value and units
total experimental duration 12702 s
NH3 injection time 654 s
NH3 shut-off time 5478 s
beginning time of heating for TPD 9534 s
temperature limit for TPD 800 �Ctemperature increase rate for TPD 10 �C/min
initial catalyst temperature 250 �Cvolumetric flow rate of feed gas 50 cm3/min
Industrial & Engineering Chemistry Research ARTICLE
NO/NO2 = (1) 600 ppm/0 ppm f (2) 500 ppm/100 ppm f(3) 400 ppm/200 ppm f (4) 300 ppm/300 ppm f (5) 200ppm/400 ppm f (6) 100 ppm/500 ppm f (7) 0 ppm/600ppm. The uniform feed of NO and NO2 at each step wasmaintained for 3 min except for step 1, which was continuedfor 13 min because the transient test was started with themonolith SCR being fresh and, therefore, sufficient time wasrequired for the catalyst surface to reach its steady state. Also, thetime interval between each step from 1 to 7 was regulated asfollows: step 1f 2 = 3 min, step 2f 3 = 2 min, step 3f 4 = 1min, step 4f 5 = 0.5min, step 5f 6 = 1min, step 6f 7 = 2min.For all test periods, the feed gas composition was set to contain5% O2, 10% H2O, and balance N2, and the reactor space velocitywas uniformly maintained at 40000 h-1.
3. MODELING
3.1. Reaction Kinetics andMass Balances. NH3 Adsorption/Desorption. In ammonia/urea SCR, NH3 molecules are chemi-cally adsorbed both on active metal sites and on Br€onstedacid sites.14 Because NH3 plays a primary role in deNOx
processes, modeling of NH3 adsorption/desorption over thecatalyst surface is an essential part of the overall SCR model.Hence, NH3 adsorption/desorption should be realisticallymodeled for an accurate prediction of the performance ofammonia/urea SCR.It is known that several NH3 molecules can be bound to one
active metal site. Komatsu et al.15 reported that each copper ioncan coordinate up to four NH3molecules. Recently, based on thisreport, Olsson et al.16 presented an SCR model with detailedsurface descriptions. However, the current model assumes thatthere exists only one kind of surface site (denoted by S in eq 1) on
which gaseous NH3molecules are adsorbed or desorbed with 1:1adsorption stoichiometry. This assumption has been widelyadopted in the literature for model simplicity.17-20
The adsorption and desorption of NH3 on an active site aredescribed by the following forward and backward reactions
NH3 þ S T NH3 3 S ð1ÞHere, the symbol S denotes an active surface site, and the NH3
adsorption and desorption rates are modeled as
Ra ¼ kaCNH3ð1- θNH3Þ ð2ÞRd ¼ kdθNH3 ð3Þ
respectively, where each rate constant is formulated by anArrhenius form such that
ki ¼ koi exp -Ei
RuTs
� �, i ¼ a, d ð4Þ
To determine the adsorption/desorption activation energiesin eq 4, we have referred to other works conducted overvanadium-based catalysts.21,22 Therefore, in this model, NH3
adsorption is assumed to occur through a nonactivated processso that the adsorption activation energy, Ea, is set to zero. On theother hand, the NH3 desorption process is assumed to bestrongly dependent on surface conditions so that the desorptionactivation energy, Ed is represented by a Tempkin-type expres-sion in which Ed decreases linearly with increasing NH3 surfacecoverage, θNH3
, as
Ed ¼ Eodð1-RθNH3Þ ð5Þ
Figure 1. Schematic flow diagram of the NH3 SCR reactor system.
Industrial & Engineering Chemistry Research ARTICLE
The mass balance of NH3 in the gas phase is described as
εpDCg, NH3
Dt¼ - uD, p
DCg, NH3
Dxþ ac, pðRd -RaÞ ð6Þ
where the left-hand side indicates the unsteady accumulation ofgas-phase NH3 within the overall packed-bed reactor-averagedcontrol volume, which consists of both pore and solid parts. Onthe right-hand side, the first term physically represents theconvective flux of gas-phase NH3. Note that the superficialvelocity (often referred to as the Darcian velocity), uD,p is equalto the pore velocity (i.e., the actual velocity through channel)multiplied by the void fraction of the packed-bed reactor. Also,the second term accounts for the source or sink of gas-phase NH3
through its adsorption or desorption on active sites. There mustbe a careful identification in defining catalytic active site becauseit is diversely represented in the literature.19,22
The mass balance of NH3 on the solid surface can be writtenas
DθNH3
Dt¼ Ra -Rd ð7Þ
which physically describes that the difference between the NH3
adsorption and desorption rates causes a temporal change inNH3 accumulation on the active sites.In eq 6, the void fraction of the packed bed, εp, can be obtained
using the relation
εp ¼ 1-Fb, pFb,m
ð1- εmÞ ð8Þ
where measurements on the masses and geometries of themonolith and packed bed give the bulk density of the monolithas Fb,m = 462.46 kg/m3 and the bulk density of the packed bed asFb,p = 624.08 kg/m3. Also, from a simple calculation based on themonolith cell density and wall thickness, the void fraction of themonolith, εm, is 0.5476.With these known properties, eq 8 finallyyields εp = 0.3895.NH3 Oxidation. Accurate prediction of NH3 concentration
through ammonia/urea SCR is important in establishing areliable SCRmodel because NH3 is related to a variety of deNOx
reactions and to NH3 slip. Therefore, the current SCR modelincludes a model of NH3 oxidation with O2 in addition to modelsof various deNOx reactions with NH3.The NH3 oxidation capability of general SCR catalysts is quite
weak up to relatively high temperatures, and also at low tem-peratures. Wurzenberger and Wanker17 reported that NH3 oxid-ation over SCR catalysts is not pronounced until the temperaturereaches as high as 500 �C.In the present steady-state NH3 oxidation experiments on a
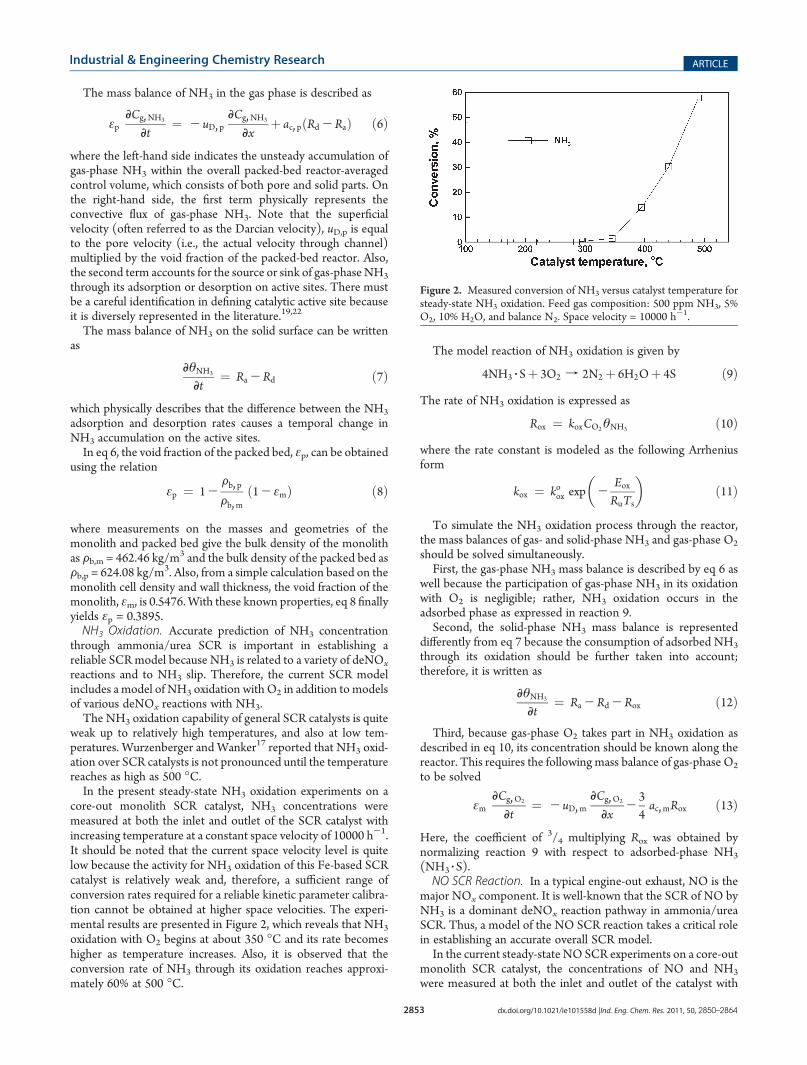
core-out monolith SCR catalyst, NH3 concentrations weremeasured at both the inlet and outlet of the SCR catalyst withincreasing temperature at a constant space velocity of 10000 h-1.It should be noted that the current space velocity level is quitelow because the activity for NH3 oxidation of this Fe-based SCRcatalyst is relatively weak and, therefore, a sufficient range ofconversion rates required for a reliable kinetic parameter calibra-tion cannot be obtained at higher space velocities. The experi-mental results are presented in Figure 2, which reveals that NH3
oxidation with O2 begins at about 350 �C and its rate becomeshigher as temperature increases. Also, it is observed that theconversion rate of NH3 through its oxidation reaches approxi-mately 60% at 500 �C.
The model reaction of NH3 oxidation is given by
4NH3 3 Sþ 3O2 f 2N2 þ 6H2Oþ 4S ð9ÞThe rate of NH3 oxidation is expressed as
Rox ¼ koxCO2θNH3 ð10Þwhere the rate constant is modeled as the following Arrheniusform
kox ¼ koox exp -EoxRuTs
� �ð11Þ
To simulate the NH3 oxidation process through the reactor,the mass balances of gas- and solid-phase NH3 and gas-phase O2
should be solved simultaneously.First, the gas-phase NH3 mass balance is described by eq 6 as
well because the participation of gas-phase NH3 in its oxidationwith O2 is negligible; rather, NH3 oxidation occurs in theadsorbed phase as expressed in reaction 9.Second, the solid-phase NH3 mass balance is represented
differently from eq 7 because the consumption of adsorbed NH3
through its oxidation should be further taken into account;therefore, it is written as
DθNH3
Dt¼ Ra -Rd -Rox ð12Þ
Third, because gas-phase O2 takes part in NH3 oxidation asdescribed in eq 10, its concentration should be known along thereactor. This requires the following mass balance of gas-phase O2
to be solved
εmDCg, O2
Dt¼ - uD,m
DCg, O2
Dx-34ac, mRox ð13Þ
Here, the coefficient of 3/4 multiplying Rox was obtained bynormalizing reaction 9 with respect to adsorbed-phase NH3
(NH3 3 S).NO SCR Reaction. In a typical engine-out exhaust, NO is the
major NOx component. It is well-known that the SCR of NO byNH3 is a dominant deNOx reaction pathway in ammonia/ureaSCR. Thus, a model of the NO SCR reaction takes a critical rolein establishing an accurate overall SCR model.In the current steady-state NO SCR experiments on a core-out
monolith SCR catalyst, the concentrations of NO and NH3
were measured at both the inlet and outlet of the catalyst with
Figure 2. Measured conversion of NH3 versus catalyst temperature forsteady-state NH3 oxidation. Feed gas composition: 500 ppm NH3, 5%O2, 10% H2O, and balance N2. Space velocity = 10000 h-1.
Industrial & Engineering Chemistry Research ARTICLE
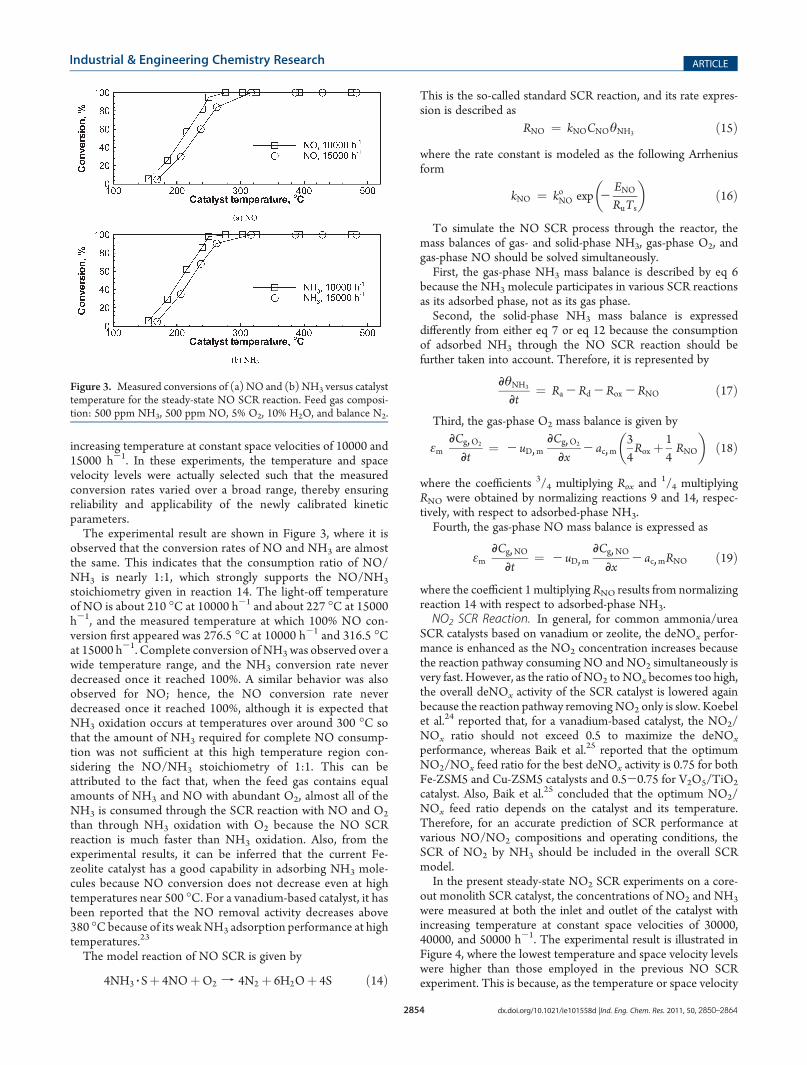
increasing temperature at constant space velocities of 10000 and15000 h-1. In these experiments, the temperature and spacevelocity levels were actually selected such that the measuredconversion rates varied over a broad range, thereby ensuringreliability and applicability of the newly calibrated kineticparameters.The experimental result are shown in Figure 3, where it is
observed that the conversion rates of NO and NH3 are almostthe same. This indicates that the consumption ratio of NO/NH3 is nearly 1:1, which strongly supports the NO/NH3
stoichiometry given in reaction 14. The light-off temperatureof NO is about 210 �C at 10000 h-1 and about 227 �C at 15000h-1, and the measured temperature at which 100% NO con-version first appeared was 276.5 �C at 10000 h-1 and 316.5 �Cat 15000 h-1. Complete conversion of NH3 was observed over awide temperature range, and the NH3 conversion rate neverdecreased once it reached 100%. A similar behavior was alsoobserved for NO; hence, the NO conversion rate neverdecreased once it reached 100%, although it is expected thatNH3 oxidation occurs at temperatures over around 300 �C sothat the amount of NH3 required for complete NO consump-tion was not sufficient at this high temperature region con-sidering the NO/NH3 stoichiometry of 1:1. This can beattributed to the fact that, when the feed gas contains equalamounts of NH3 and NO with abundant O2, almost all of theNH3 is consumed through the SCR reaction with NO and O2
than through NH3 oxidation with O2 because the NO SCRreaction is much faster than NH3 oxidation. Also, from theexperimental results, it can be inferred that the current Fe-zeolite catalyst has a good capability in adsorbing NH3 mole-cules because NO conversion does not decrease even at hightemperatures near 500 �C. For a vanadium-based catalyst, it hasbeen reported that the NO removal activity decreases above380 �C because of its weakNH3 adsorption performance at hightemperatures.23
The model reaction of NO SCR is given by
4NH3 3 Sþ 4NOþO2 f 4N2 þ 6H2Oþ 4S ð14Þ
This is the so-called standard SCR reaction, and its rate expres-sion is described as
RNO ¼ kNOCNOθNH3 ð15Þwhere the rate constant is modeled as the following Arrheniusform
kNO ¼ koNO exp -ENORuTs
� �ð16Þ
To simulate the NO SCR process through the reactor, themass balances of gas- and solid-phase NH3, gas-phase O2, andgas-phase NO should be solved simultaneously.First, the gas-phase NH3 mass balance is described by eq 6
because the NH3 molecule participates in various SCR reactionsas its adsorbed phase, not as its gas phase.Second, the solid-phase NH3 mass balance is expressed
differently from either eq 7 or eq 12 because the consumptionof adsorbed NH3 through the NO SCR reaction should befurther taken into account. Therefore, it is represented by
DθNH3
Dt¼ Ra -Rd -Rox -RNO ð17Þ
Third, the gas-phase O2 mass balance is given by
εmDCg, O2
Dt¼ - uD,m
DCg, O2
Dx- ac, m
34Rox þ 1
4RNO
� �ð18Þ
where the coefficients 3/4 multiplying Rox and1/4 multiplying
RNO were obtained by normalizing reactions 9 and 14, respec-tively, with respect to adsorbed-phase NH3.Fourth, the gas-phase NO mass balance is expressed as
εmDCg, NO
Dt¼ - uD,m
DCg, NODx
- ac, mRNO ð19Þ
where the coefficient 1 multiplying RNO results from normalizingreaction 14 with respect to adsorbed-phase NH3.NO2 SCR Reaction. In general, for common ammonia/urea
SCR catalysts based on vanadium or zeolite, the deNOx perfor-mance is enhanced as the NO2 concentration increases becausethe reaction pathway consuming NO and NO2 simultaneously isvery fast. However, as the ratio of NO2 to NOx becomes too high,the overall deNOx activity of the SCR catalyst is lowered againbecause the reaction pathway removingNO2 only is slow. Koebelet al.24 reported that, for a vanadium-based catalyst, the NO2/NOx ratio should not exceed 0.5 to maximize the deNOx
performance, whereas Baik et al.25 reported that the optimumNO2/NOx feed ratio for the best deNOx activity is 0.75 for bothFe-ZSM5 and Cu-ZSM5 catalysts and 0.5-0.75 for V2O5/TiO2
catalyst. Also, Baik et al.25 concluded that the optimum NO2/NOx feed ratio depends on the catalyst and its temperature.Therefore, for an accurate prediction of SCR performance atvarious NO/NO2 compositions and operating conditions, theSCR of NO2 by NH3 should be included in the overall SCRmodel.In the present steady-state NO2 SCR experiments on a core-
out monolith SCR catalyst, the concentrations of NO2 and NH3
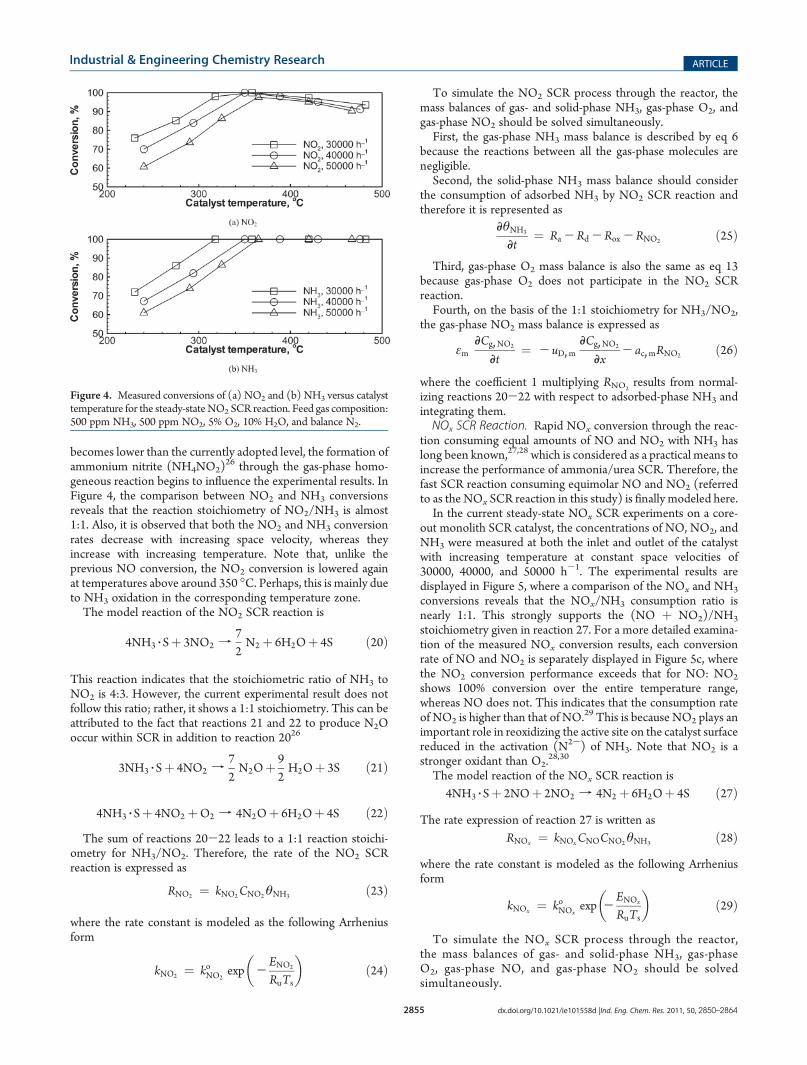
were measured at both the inlet and outlet of the catalyst withincreasing temperature at constant space velocities of 30000,40000, and 50000 h-1. The experimental result is illustrated inFigure 4, where the lowest temperature and space velocity levelswere higher than those employed in the previous NO SCRexperiment. This is because, as the temperature or space velocity
Figure 3. Measured conversions of (a) NO and (b)NH3 versus catalysttemperature for the steady-state NO SCR reaction. Feed gas composi-tion: 500 ppm NH3, 500 ppm NO, 5% O2, 10% H2O, and balance N2.
Industrial & Engineering Chemistry Research ARTICLE
becomes lower than the currently adopted level, the formation ofammonium nitrite (NH4NO2)
26 through the gas-phase homo-geneous reaction begins to influence the experimental results. InFigure 4, the comparison between NO2 and NH3 conversionsreveals that the reaction stoichiometry of NO2/NH3 is almost1:1. Also, it is observed that both the NO2 and NH3 conversionrates decrease with increasing space velocity, whereas theyincrease with increasing temperature. Note that, unlike theprevious NO conversion, the NO2 conversion is lowered againat temperatures above around 350 �C. Perhaps, this is mainly dueto NH3 oxidation in the corresponding temperature zone.The model reaction of the NO2 SCR reaction is
4NH3 3 Sþ 3NO2 f72N2 þ 6H2Oþ 4S ð20Þ
This reaction indicates that the stoichiometric ratio of NH3 toNO2 is 4:3. However, the current experimental result does notfollow this ratio; rather, it shows a 1:1 stoichiometry. This can beattributed to the fact that reactions 21 and 22 to produce N2Ooccur within SCR in addition to reaction 2026
3NH3 3 Sþ 4NO2 f72N2Oþ 9
2H2Oþ 3S ð21Þ
4NH3 3 Sþ 4NO2 þO2 f 4N2Oþ 6H2Oþ 4S ð22ÞThe sum of reactions 20-22 leads to a 1:1 reaction stoichi-
ometry for NH3/NO2. Therefore, the rate of the NO2 SCRreaction is expressed as
RNO2 ¼ kNO2CNO2θNH3 ð23Þ
where the rate constant is modeled as the following Arrheniusform
kNO2 ¼ koNO2exp -
ENO2
RuTs
� �ð24Þ
To simulate the NO2 SCR process through the reactor, themass balances of gas- and solid-phase NH3, gas-phase O2, andgas-phase NO2 should be solved simultaneously.First, the gas-phase NH3 mass balance is described by eq 6
because the reactions between all the gas-phase molecules arenegligible.Second, the solid-phase NH3 mass balance should consider
the consumption of adsorbed NH3 by NO2 SCR reaction andtherefore it is represented as
DθNH3
Dt¼ Ra -Rd -Rox -RNO2 ð25Þ
Third, gas-phase O2 mass balance is also the same as eq 13because gas-phase O2 does not participate in the NO2 SCRreaction.Fourth, on the basis of the 1:1 stoichiometry for NH3/NO2,
the gas-phase NO2 mass balance is expressed as
εmDCg, NO2
Dt¼ - uD,m
DCg, NO2
Dx- ac, mRNO2 ð26Þ
where the coefficient 1 multiplying RNO2results from normal-
izing reactions 20-22 with respect to adsorbed-phase NH3 andintegrating them.NOx SCR Reaction. Rapid NOx conversion through the reac-
tion consuming equal amounts of NO and NO2 with NH3 haslong been known,27,28 which is considered as a practical means toincrease the performance of ammonia/urea SCR. Therefore, thefast SCR reaction consuming equimolar NO and NO2 (referredto as the NOx SCR reaction in this study) is finally modeled here.In the current steady-state NOx SCR experiments on a core-
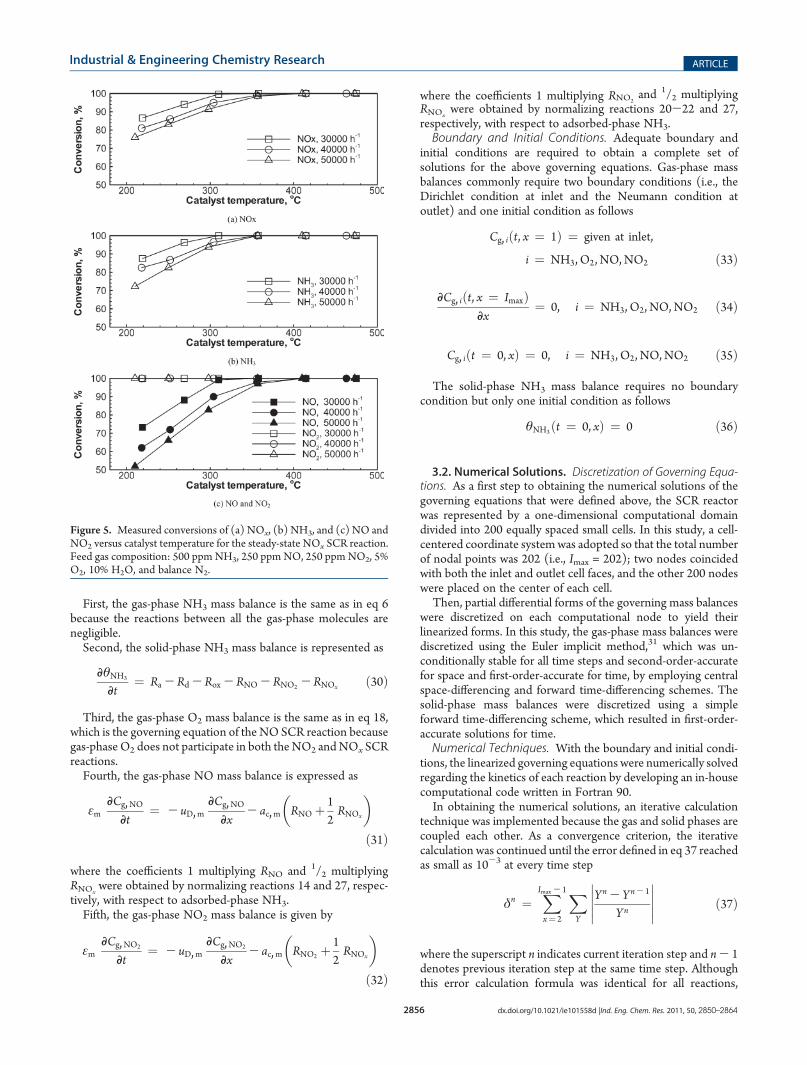
out monolith SCR catalyst, the concentrations of NO, NO2, andNH3 were measured at both the inlet and outlet of the catalystwith increasing temperature at constant space velocities of30000, 40000, and 50000 h-1. The experimental results aredisplayed in Figure 5, where a comparison of the NOx and NH3
conversions reveals that the NOx/NH3 consumption ratio isnearly 1:1. This strongly supports the (NO þ NO2)/NH3
stoichiometry given in reaction 27. For a more detailed examina-tion of the measured NOx conversion results, each conversionrate of NO and NO2 is separately displayed in Figure 5c, wherethe NO2 conversion performance exceeds that for NO: NO2
shows 100% conversion over the entire temperature range,whereas NO does not. This indicates that the consumption rateof NO2 is higher than that of NO.
29 This is because NO2 plays animportant role in reoxidizing the active site on the catalyst surfacereduced in the activation (N2-) of NH3. Note that NO2 is astronger oxidant than O2.
28,30
The model reaction of the NOx SCR reaction is4NH3 3 Sþ 2NOþ 2NO2 f 4N2 þ 6H2Oþ 4S ð27Þ
The rate expression of reaction 27 is written asRNOx ¼ kNOxCNOCNO2θNH3 ð28Þ
where the rate constant is modeled as the following Arrheniusform
kNOx ¼ koNOxexp -
ENOx
RuTs
� �ð29Þ
To simulate the NOx SCR process through the reactor,the mass balances of gas- and solid-phase NH3, gas-phaseO2, gas-phase NO, and gas-phase NO2 should be solvedsimultaneously.
Figure 4. Measured conversions of (a) NO2 and (b) NH3 versus catalysttemperature for the steady-stateNO2 SCR reaction. Feed gas composition:500 ppm NH3, 500 ppm NO2, 5% O2, 10% H2O, and balance N2.
Industrial & Engineering Chemistry Research ARTICLE
First, the gas-phase NH3 mass balance is the same as in eq 6because the reactions between all the gas-phase molecules arenegligible.Second, the solid-phase NH3 mass balance is represented as
DθNH3
Dt¼ Ra -Rd -Rox -RNO -RNO2 -RNOx ð30Þ
Third, the gas-phase O2 mass balance is the same as in eq 18,which is the governing equation of the NO SCR reaction becausegas-phase O2 does not participate in both the NO2 andNOx SCRreactions.Fourth, the gas-phase NO mass balance is expressed as
εmDCg, NO
Dt¼ - uD,m
DCg, NODx
- ac, m RNO þ 12RNOx
� �
ð31Þ
where the coefficients 1 multiplying RNO and 1/2 multiplyingRNOx
were obtained by normalizing reactions 14 and 27, respec-tively, with respect to adsorbed-phase NH3.Fifth, the gas-phase NO2 mass balance is given by
εmDCg, NO2
Dt¼ - uD,m
DCg, NO2
Dx- ac, m RNO2 þ
12RNOx
� �
ð32Þ
where the coefficients 1 multiplying RNO2and 1/2 multiplying
RNOxwere obtained by normalizing reactions 20-22 and 27,
respectively, with respect to adsorbed-phase NH3.Boundary and Initial Conditions. Adequate boundary and
initial conditions are required to obtain a complete set ofsolutions for the above governing equations. Gas-phase massbalances commonly require two boundary conditions (i.e., theDirichlet condition at inlet and the Neumann condition atoutlet) and one initial condition as follows
Cg, iðt, x ¼ 1Þ ¼ given at inlet,
i ¼ NH3, O2, NO, NO2 ð33Þ
DCg, iðt, x ¼ ImaxÞDx
¼ 0, i ¼ NH3, O2, NO, NO2 ð34Þ
Cg, iðt ¼ 0, xÞ ¼ 0, i ¼ NH3, O2, NO,NO2 ð35Þ
The solid-phase NH3 mass balance requires no boundarycondition but only one initial condition as follows
θNH3ðt ¼ 0, xÞ ¼ 0 ð36Þ
3.2. Numerical Solutions. Discretization of Governing Equa-tions. As a first step to obtaining the numerical solutions of thegoverning equations that were defined above, the SCR reactorwas represented by a one-dimensional computational domaindivided into 200 equally spaced small cells. In this study, a cell-centered coordinate systemwas adopted so that the total numberof nodal points was 202 (i.e., Imax = 202); two nodes coincidedwith both the inlet and outlet cell faces, and the other 200 nodeswere placed on the center of each cell.Then, partial differential forms of the governing mass balances
were discretized on each computational node to yield theirlinearized forms. In this study, the gas-phase mass balances werediscretized using the Euler implicit method,31 which was un-conditionally stable for all time steps and second-order-accuratefor space and first-order-accurate for time, by employing centralspace-differencing and forward time-differencing schemes. Thesolid-phase mass balances were discretized using a simpleforward time-differencing scheme, which resulted in first-order-accurate solutions for time.Numerical Techniques. With the boundary and initial condi-
tions, the linearized governing equations were numerically solvedregarding the kinetics of each reaction by developing an in-housecomputational code written in Fortran 90.In obtaining the numerical solutions, an iterative calculation
technique was implemented because the gas and solid phases arecoupled each other. As a convergence criterion, the iterativecalculation was continued until the error defined in eq 37 reachedas small as 10-3 at every time step
δn ¼XImax - 1
x¼ 2
XY
�����Yn - Yn- 1
Yn
����� ð37Þ
where the superscript n indicates current iteration step and n- 1denotes previous iteration step at the same time step. Althoughthis error calculation formula was identical for all reactions,
Figure 5. Measured conversions of (a) NOx, (b) NH3, and (c) NO andNO2 versus catalyst temperature for the steady-state NOx SCR reaction.Feed gas composition: 500 ppmNH3, 250 ppmNO, 250 ppmNO2, 5%O2, 10% H2O, and balance N2.
Industrial & Engineering Chemistry Research ARTICLE
the variable Y differed for each reaction, as summarized inTable 2.To prevent solution divergence, this study employed an
under-relaxation technique in which an under-relaxation factorof 0.2 was used in calculating each reaction rate except for theNOx SCR reaction (0.15 was employed for this reaction).Actually, these values were determined after many preliminarycalculations based on the tradeoff between speed and stability insolution convergence; a larger under-relaxation factor causesgreater speed but poorer stability, and vice versa.Setting an incremental time for obtaining simulation results
also required trial and error because there is a tradeoff betweensolution accuracy and computing duration. In simulating the
NH3 TPD analysis, a time increment of 1 s was used. In obtainingthe steady-state simulation results for NH3 oxidation, NO SCR,NO2 SCR, and NOx SCR, the transient calculations werecontinued until steady state was reached for each operatingcondition. Here, the time increment of transient simulationwas set to 10 s. Also, in obtaining transient simulation resultsfor the NOx SCR reaction, a time increment of 1 s was employed.
4. KINETIC PARAMETER ESTIMATION
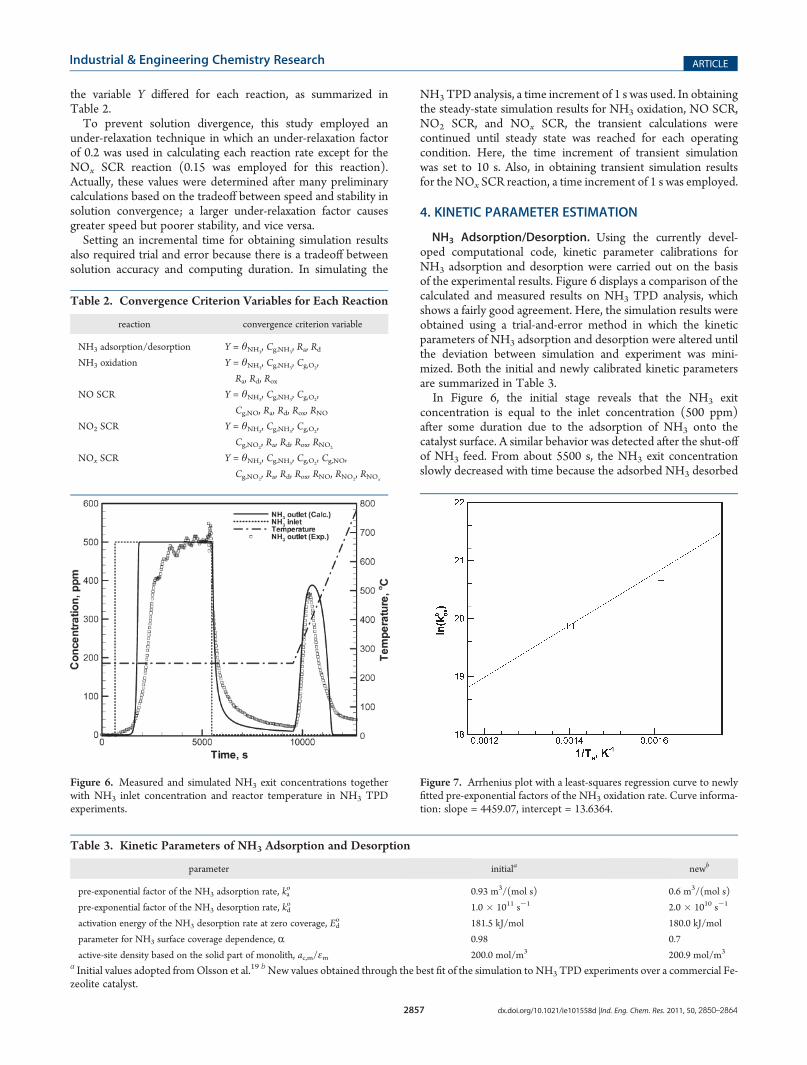
NH3 Adsorption/Desorption. Using the currently devel-oped computational code, kinetic parameter calibrations forNH3 adsorption and desorption were carried out on the basisof the experimental results. Figure 6 displays a comparison of thecalculated and measured results on NH3 TPD analysis, whichshows a fairly good agreement. Here, the simulation results wereobtained using a trial-and-error method in which the kineticparameters of NH3 adsorption and desorption were altered untilthe deviation between simulation and experiment was mini-mized. Both the initial and newly calibrated kinetic parametersare summarized in Table 3.In Figure 6, the initial stage reveals that the NH3 exit
concentration is equal to the inlet concentration (500 ppm)after some duration due to the adsorption of NH3 onto thecatalyst surface. A similar behavior was detected after the shut-offof NH3 feed. From about 5500 s, the NH3 exit concentrationslowly decreased with time because the adsorbed NH3 desorbed
Table 2. Convergence Criterion Variables for Each Reaction
reaction convergence criterion variable
NH3 adsorption/desorption Y = θNH3, Cg,NH3
, Ra, RdNH3 oxidation Y = θNH3
, Cg,NH3, Cg,O2
,
Ra, Rd, RoxNO SCR Y = θNH3
, Cg,NH3, Cg,O2
,
Cg,NO, Ra, Rd, Rox, RNONO2 SCR Y = θNH3
, Cg,NH3, Cg,O2
,
Cg,NO2, Ra, Rd, Rox, RNO2
NOx SCR Y = θNH3, Cg,NH3
, Cg,O2, Cg,NO,
Cg,NO2, Ra, Rd, Rox, RNO, RNO2
, RNOx
Figure 6. Measured and simulated NH3 exit concentrations togetherwith NH3 inlet concentration and reactor temperature in NH3 TPDexperiments.
Table 3. Kinetic Parameters of NH3 Adsorption and Desorption
parameter initiala newb
pre-exponential factor of the NH3 adsorption rate, kao 0.93 m3/(mol s) 0.6 m3/(mol s)
pre-exponential factor of the NH3 desorption rate, kdo 1.0 � 1011 s-1 2.0 � 1010 s-1
activation energy of the NH3 desorption rate at zero coverage, Edo 181.5 kJ/mol 180.0 kJ/mol
parameter for NH3 surface coverage dependence, R 0.98 0.7
active-site density based on the solid part of monolith, ac,m/εm 200.0 mol/m3 200.9 mol/m3
a Initial values adopted fromOlsson et al.19 bNew values obtained through the best fit of the simulation to NH3 TPD experiments over a commercial Fe-zeolite catalyst.
Figure 7. Arrhenius plot with a least-squares regression curve to newlyfitted pre-exponential factors of the NH3 oxidation rate. Curve informa-tion: slope = 4459.07, intercept = 13.6364.
Industrial & Engineering Chemistry Research ARTICLE
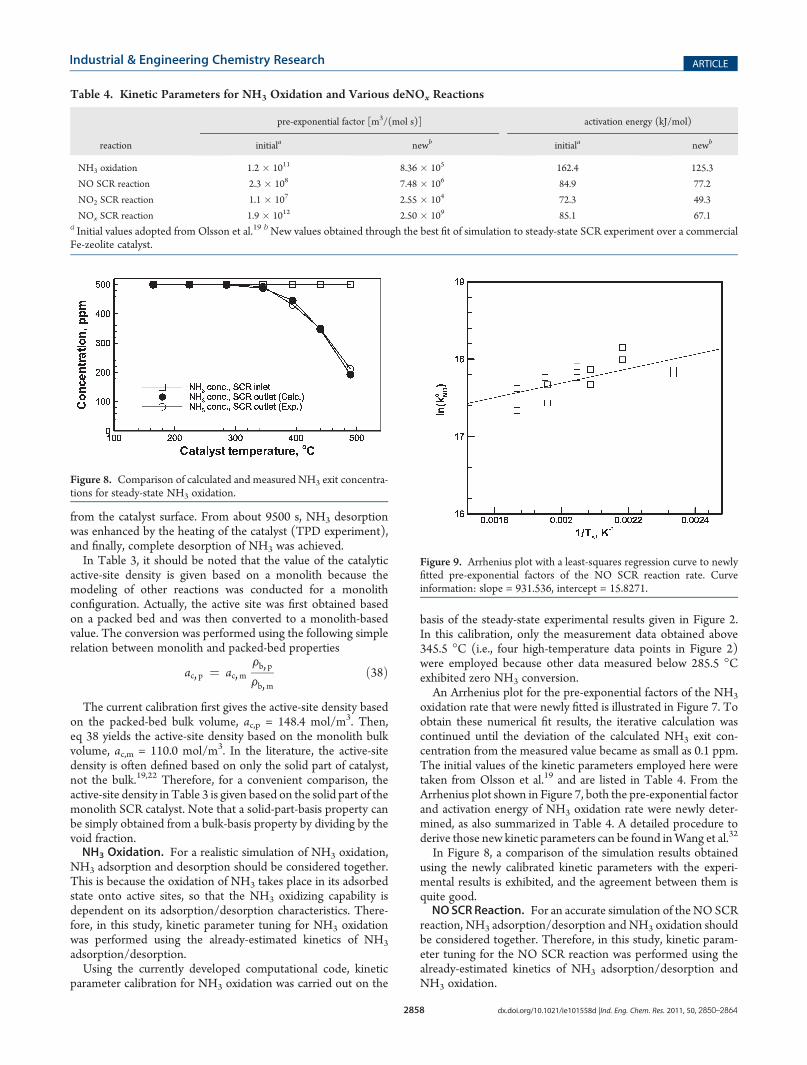
from the catalyst surface. From about 9500 s, NH3 desorptionwas enhanced by the heating of the catalyst (TPD experiment),and finally, complete desorption of NH3 was achieved.In Table 3, it should be noted that the value of the catalytic
active-site density is given based on a monolith because themodeling of other reactions was conducted for a monolithconfiguration. Actually, the active site was first obtained basedon a packed bed and was then converted to a monolith-basedvalue. The conversion was performed using the following simplerelation between monolith and packed-bed properties
ac, p ¼ ac, mFb, pFb,m
ð38Þ
The current calibration first gives the active-site density basedon the packed-bed bulk volume, ac,p = 148.4 mol/m3. Then,eq 38 yields the active-site density based on the monolith bulkvolume, ac,m = 110.0 mol/m3. In the literature, the active-sitedensity is often defined based on only the solid part of catalyst,not the bulk.19,22 Therefore, for a convenient comparison, theactive-site density in Table 3 is given based on the solid part of themonolith SCR catalyst. Note that a solid-part-basis property canbe simply obtained from a bulk-basis property by dividing by thevoid fraction.NH3 Oxidation. For a realistic simulation of NH3 oxidation,
NH3 adsorption and desorption should be considered together.This is because the oxidation of NH3 takes place in its adsorbedstate onto active sites, so that the NH3 oxidizing capability isdependent on its adsorption/desorption characteristics. There-fore, in this study, kinetic parameter tuning for NH3 oxidationwas performed using the already-estimated kinetics of NH3
adsorption/desorption.Using the currently developed computational code, kinetic
parameter calibration for NH3 oxidation was carried out on the
basis of the steady-state experimental results given in Figure 2.In this calibration, only the measurement data obtained above345.5 �C (i.e., four high-temperature data points in Figure 2)were employed because other data measured below 285.5 �Cexhibited zero NH3 conversion.An Arrhenius plot for the pre-exponential factors of the NH3
oxidation rate that were newly fitted is illustrated in Figure 7. Toobtain these numerical fit results, the iterative calculation wascontinued until the deviation of the calculated NH3 exit con-centration from the measured value became as small as 0.1 ppm.The initial values of the kinetic parameters employed here weretaken from Olsson et al.19 and are listed in Table 4. From theArrhenius plot shown in Figure 7, both the pre-exponential factorand activation energy of NH3 oxidation rate were newly deter-mined, as also summarized in Table 4. A detailed procedure toderive those new kinetic parameters can be found inWang et al.32
In Figure 8, a comparison of the simulation results obtainedusing the newly calibrated kinetic parameters with the experi-mental results is exhibited, and the agreement between them isquite good.NOSCRReaction. For an accurate simulation of theNO SCR
reaction, NH3 adsorption/desorption and NH3 oxidation shouldbe considered together. Therefore, in this study, kinetic param-eter tuning for the NO SCR reaction was performed using thealready-estimated kinetics of NH3 adsorption/desorption andNH3 oxidation.
Table 4. Kinetic Parameters for NH3 Oxidation and Various deNOx Reactions
pre-exponential factor [m3/(mol s)] activation energy (kJ/mol)
reaction initiala newb initiala newb
NH3 oxidation 1.2 � 1011 8.36 � 105 162.4 125.3
NO SCR reaction 2.3 � 108 7.48 � 106 84.9 77.2
NO2 SCR reaction 1.1 � 107 2.55 � 104 72.3 49.3
NOx SCR reaction 1.9 � 1012 2.50 � 109 85.1 67.1a Initial values adopted from Olsson et al.19 bNew values obtained through the best fit of simulation to steady-state SCR experiment over a commercialFe-zeolite catalyst.
Figure 8. Comparison of calculated and measured NH3 exit concentra-tions for steady-state NH3 oxidation.
Figure 9. Arrhenius plot with a least-squares regression curve to newlyfitted pre-exponential factors of the NO SCR reaction rate. Curveinformation: slope = 931.536, intercept = 15.8271.
Industrial & Engineering Chemistry Research ARTICLE
On the basis of the currently developed numerical tools, thekinetic parameters of the NO SCR reaction were calibrated usingthe steady-state experimental results given in Figure 3. In thiscalibration, both the data sets measured at 10000 and 15000 h-1
were simultaneously utilized. However, several high-temperaturedata were excluded because of their complete NO conversion.The exact magnitude of the reaction rate cannot be estimatedfrom the data with zero exit concentration because reaction rateslarger than a certain threshold value, corresponding to completeNO consumption exactly at the SCR exit, also yield zero NOemissions. In addition, some measurement data located far fromthe regression curve on the Arrhenius plot were also kept out ofthe calibration. In the end, four data points at 10000 h-1 andthree data points at 15000 h-1 were actually employed for thiscalibration.
Figure 9 presents an Arrhenius plot for the pre-exponentialfactors of the NO SCR reaction rate that were newly fitted. Toobtain each data point in Figure 9, an iterative calculation wasperformed while updating the pre-exponential factor. The stop-ping criterion was that the deviation between the calculated andmeasured species concentrations at the SCR exit became as smallas 0.1 ppm. In this study, because NO and NH3 were bothemployed for stopping criteria, two fitted data sets were pro-duced at one catalyst temperature. Analyzing the Arrhenius plotwith reference to Wang et al.32 gave a new pre-exponential factorand activation energy of the NO SCR reaction rate, as listed inTable 4. The initial values of the kinetic parameters used in thiscalibration were taken from Olsson et al.19 and are also summar-ized in Table 4.Figures 10 and 11 compare the calculated and measured
results for the NO SCR reaction at space velocities of 10000
Figure 10. Comparisons of calculated and measured exit concentra-tions and conversion rates of (a) NO and (b) NH3 for the steady-stateNO SCR reaction. Space velocity = 10000 h-1.
Figure 11. Comparisons of calculated and measured exit concentra-tions and conversion rates of (a) NO and (b) NH3 for the steady-stateNO SCR reaction. Space velocity = 15000 h-1.
Figure 12. Arrhenius plot with a least-squares regression curve to newlyfitted pre-exponential factors of the NO2 SCR reaction rate. Curveinformation: slope = 2767.15, intercept = 10.1469.
Figure 13. Comparisons of calculated and measured exit concentra-tions of (a) NO2 and (b) NH3 for the steady-state NO2 SCR reaction.Space velocity = 30000 h-1.
Industrial & Engineering Chemistry Research ARTICLE
and 15000 h-1, respectively. A good agreement is observed forboth species and for both space velocities. The simulation resultsshow that the conversion rate of NO reaches 100% above around300 �C, and then, it becomes slightly lower with further increasein temperature, which was not observed in the experiments. Thisdifference can be attributed to the fact that the rate of NH3
oxidation with O2 becomes appreciable in the correspondinghigh-temperature region and, therefore, the amount of NH3
required to react with NO is not sufficient there.NO2 SCRReaction. For a realistic simulation of the NO2 SCR
reaction, NH3 adsorption/desorption and NH3 oxidation shouldbe considered together. Therefore, in this study, kinetic param-eter tuning for the NO2 SCR reaction was conducted using thealready-estimated kinetics of NH3 adsorption/desorption andNH3 oxidation.
On the basis of the currently developed numerical tools,kinetic parameter calibration for the NO2 SCR reaction wascarried out using the steady-state experimental results given inFigure 4. In this calibration, the data measured at 30000, 40000,and 50000 h-1 were simultaneously employed. However, mea-surement data showing 100% conversion were excluded.
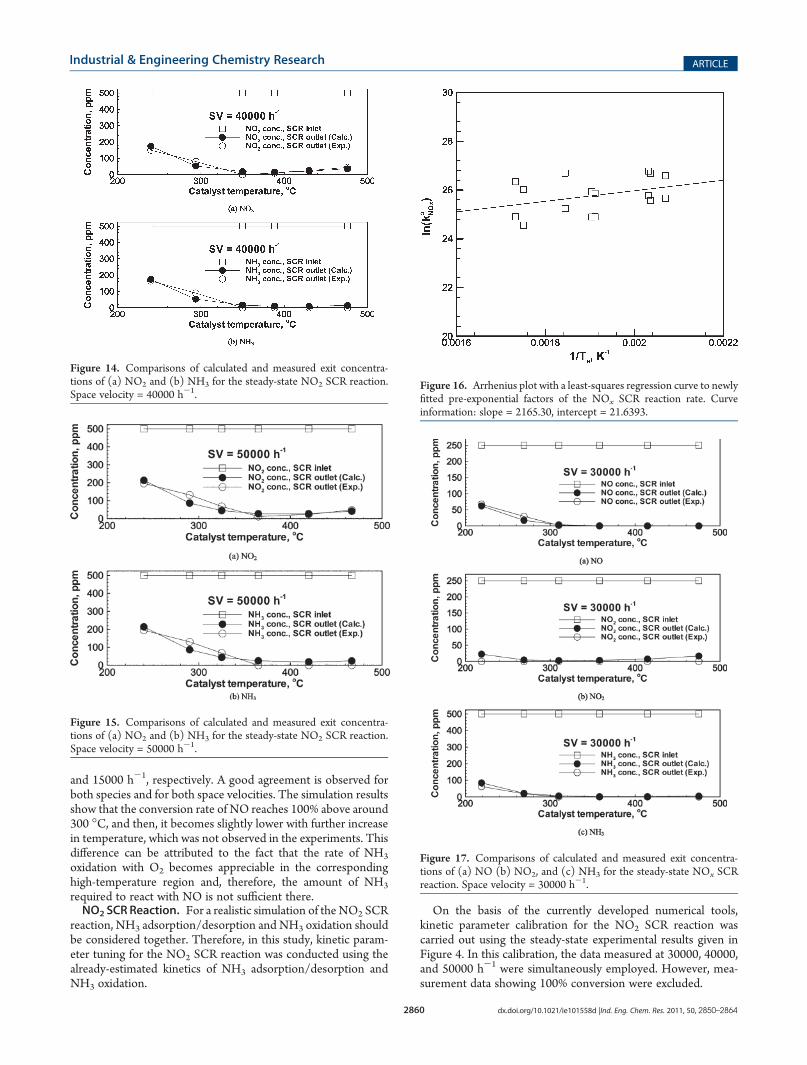
Figure 14. Comparisons of calculated and measured exit concentra-tions of (a) NO2 and (b) NH3 for the steady-state NO2 SCR reaction.Space velocity = 40000 h-1.
Figure 15. Comparisons of calculated and measured exit concentra-tions of (a) NO2 and (b) NH3 for the steady-state NO2 SCR reaction.Space velocity = 50000 h-1.
Figure 16. Arrhenius plot with a least-squares regression curve to newlyfitted pre-exponential factors of the NOx SCR reaction rate. Curveinformation: slope = 2165.30, intercept = 21.6393.
Figure 17. Comparisons of calculated and measured exit concentra-tions of (a) NO (b) NO2, and (c) NH3 for the steady-state NOx SCRreaction. Space velocity = 30000 h-1.
Industrial & Engineering Chemistry Research ARTICLE
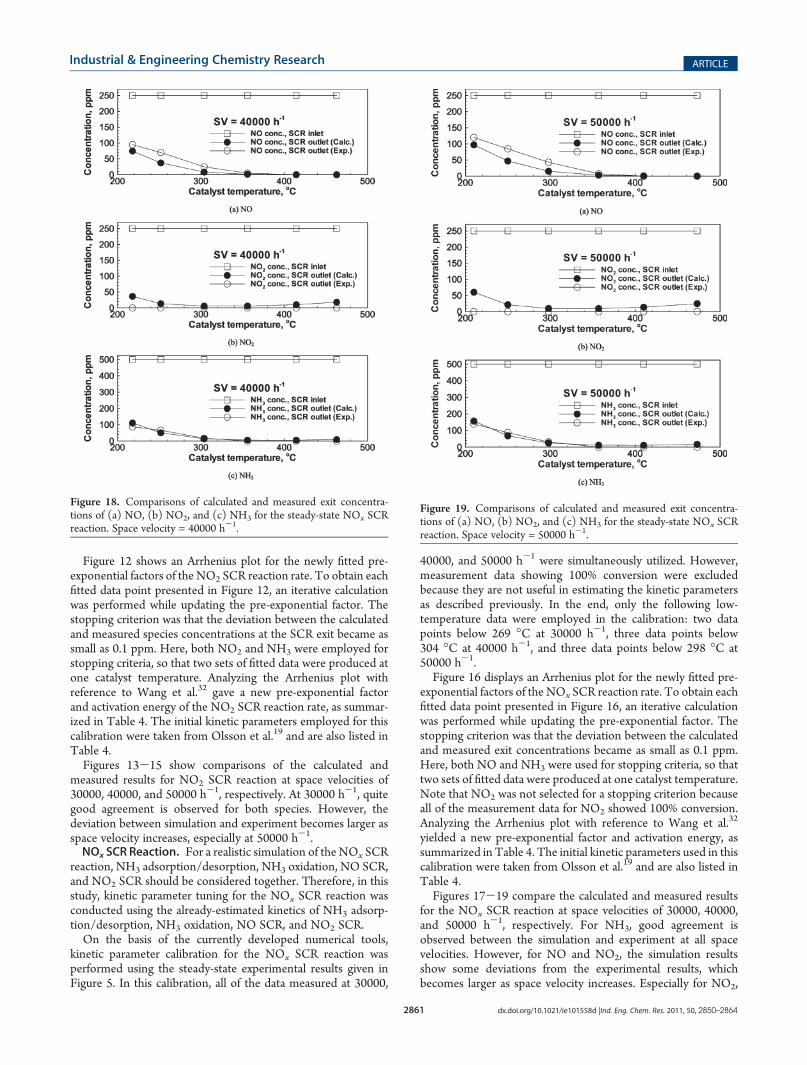
Figure 12 shows an Arrhenius plot for the newly fitted pre-exponential factors of the NO2 SCR reaction rate. To obtain eachfitted data point presented in Figure 12, an iterative calculationwas performed while updating the pre-exponential factor. Thestopping criterion was that the deviation between the calculatedand measured species concentrations at the SCR exit became assmall as 0.1 ppm. Here, both NO2 and NH3 were employed forstopping criteria, so that two sets of fitted data were produced atone catalyst temperature. Analyzing the Arrhenius plot withreference to Wang et al.32 gave a new pre-exponential factorand activation energy of the NO2 SCR reaction rate, as summar-ized in Table 4. The initial kinetic parameters employed for thiscalibration were taken from Olsson et al.19 and are also listed inTable 4.Figures 13-15 show comparisons of the calculated and
measured results for NO2 SCR reaction at space velocities of30000, 40000, and 50000 h-1, respectively. At 30000 h-1, quitegood agreement is observed for both species. However, thedeviation between simulation and experiment becomes larger asspace velocity increases, especially at 50000 h-1.NOx SCR Reaction. For a realistic simulation of the NOx SCR
reaction, NH3 adsorption/desorption, NH3 oxidation, NO SCR,and NO2 SCR should be considered together. Therefore, in thisstudy, kinetic parameter tuning for the NOx SCR reaction wasconducted using the already-estimated kinetics of NH3 adsorp-tion/desorption, NH3 oxidation, NO SCR, and NO2 SCR.On the basis of the currently developed numerical tools,
kinetic parameter calibration for the NOx SCR reaction wasperformed using the steady-state experimental results given inFigure 5. In this calibration, all of the data measured at 30000,
40000, and 50000 h-1 were simultaneously utilized. However,measurement data showing 100% conversion were excludedbecause they are not useful in estimating the kinetic parametersas described previously. In the end, only the following low-temperature data were employed in the calibration: two datapoints below 269 �C at 30000 h-1, three data points below304 �C at 40000 h-1, and three data points below 298 �C at50000 h-1.Figure 16 displays an Arrhenius plot for the newly fitted pre-
exponential factors of the NOx SCR reaction rate. To obtain eachfitted data point presented in Figure 16, an iterative calculationwas performed while updating the pre-exponential factor. Thestopping criterion was that the deviation between the calculatedand measured exit concentrations became as small as 0.1 ppm.Here, both NO and NH3 were used for stopping criteria, so thattwo sets of fitted data were produced at one catalyst temperature.Note that NO2 was not selected for a stopping criterion becauseall of the measurement data for NO2 showed 100% conversion.Analyzing the Arrhenius plot with reference to Wang et al.32
yielded a new pre-exponential factor and activation energy, assummarized in Table 4. The initial kinetic parameters used in thiscalibration were taken from Olsson et al.19 and are also listed inTable 4.Figures 17-19 compare the calculated and measured results
for the NOx SCR reaction at space velocities of 30000, 40000,and 50000 h-1, respectively. For NH3, good agreement isobserved between the simulation and experiment at all spacevelocities. However, for NO and NO2, the simulation resultsshow some deviations from the experimental results, whichbecomes larger as space velocity increases. Especially for NO2,
Figure 18. Comparisons of calculated and measured exit concentra-tions of (a) NO, (b) NO2, and (c) NH3 for the steady-state NOx SCRreaction. Space velocity = 40000 h-1.
Figure 19. Comparisons of calculated and measured exit concentra-tions of (a) NO, (b) NO2, and (c) NH3 for the steady-state NOx SCRreaction. Space velocity = 50000 h-1.
Industrial & Engineering Chemistry Research ARTICLE
the discrepancy becomes considerable in both the low- and high-temperature regions.
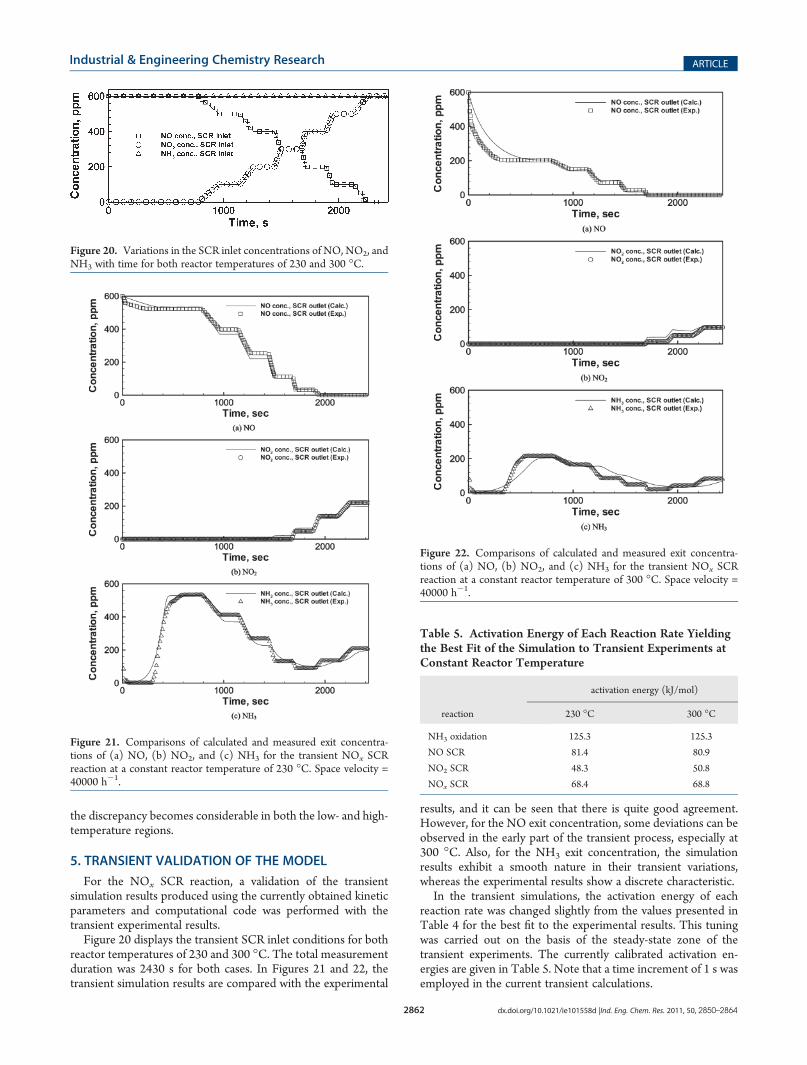
5. TRANSIENT VALIDATION OF THE MODEL
For the NOx SCR reaction, a validation of the transientsimulation results produced using the currently obtained kineticparameters and computational code was performed with thetransient experimental results.
Figure 20 displays the transient SCR inlet conditions for bothreactor temperatures of 230 and 300 �C. The total measurementduration was 2430 s for both cases. In Figures 21 and 22, thetransient simulation results are compared with the experimental
results, and it can be seen that there is quite good agreement.However, for the NO exit concentration, some deviations can beobserved in the early part of the transient process, especially at300 �C. Also, for the NH3 exit concentration, the simulationresults exhibit a smooth nature in their transient variations,whereas the experimental results show a discrete characteristic.
In the transient simulations, the activation energy of eachreaction rate was changed slightly from the values presented inTable 4 for the best fit to the experimental results. This tuningwas carried out on the basis of the steady-state zone of thetransient experiments. The currently calibrated activation en-ergies are given in Table 5. Note that a time increment of 1 s wasemployed in the current transient calculations.
Figure 21. Comparisons of calculated and measured exit concentra-tions of (a) NO, (b) NO2, and (c) NH3 for the transient NOx SCRreaction at a constant reactor temperature of 230 �C. Space velocity =40000 h-1.
Figure 20. Variations in the SCR inlet concentrations of NO, NO2, andNH3 with time for both reactor temperatures of 230 and 300 �C.
Figure 22. Comparisons of calculated and measured exit concentra-tions of (a) NO, (b) NO2, and (c) NH3 for the transient NOx SCRreaction at a constant reactor temperature of 300 �C. Space velocity =40000 h-1.
Table 5. Activation Energy of Each Reaction Rate Yieldingthe Best Fit of the Simulation to Transient Experiments atConstant Reactor Temperature
Industrial & Engineering Chemistry Research ARTICLE
6. CONCLUSIONS
In this study, an in-house computational code for simulatingthe performance of ammonia/urea SCR was developed. On thebasis of this numerical tool, kinetic parameter calibrations forvarious catalytic reactions were successfully conducted using thesteady-state experimental results obtained for a commercial ammo-nia/urea SCR washcoated Fe-ion-exchanged zeolite-based catalyst.Also, the transient simulation results were validatedwith experimentalresults. A summary of the main results of this study is as follows:
1. The NH3 TPD experimental results are nicely described bythe simulation results obtained using the newly calibratedkinetic parameters. Both adsorption and temperature-pro-grammed desorption of NH3 over SCR catalyst surface arewell-predicted.
2. At a space velocity of 10000 h-1, NH3 oxidation with O2
began at about 350 �C, and the conversion rate reachednearly 60% at 500 �C. For steady-state NH3 oxidation, thesimulation results obtained using the newly calibratedkinetic parameters showed quite good agreement withthe experimental results.
3. In the NO SCR experiments, complete NO conversion wasmaintained up to catalyst temperatures as high as 500 �C ata space velocity of 10000 h-1. For the steady-state NO SCRreaction, the simulation results obtained using the newlycalibrated kinetic parameters displayed excellent agreementwith the experimental results.
4. At space velocities of 30000 to 50000 h-1, NO2 removalthrough the NO2 SCR reaction was found to be enhancedwith increasing catalyst temperature up to around 350 �C.Above this temperature range, the NO2 conversion ratedecreased again because of the lack of NH3 by its oxidationwith O2. For the steady-state NO2 SCR reaction, the simula-tion results produced using the newly estimated kineticparameters closely followed the experimental results; however,the simulation error became larger as space velocity increased.
5. From the steady-state NOx SCR experiments, the consump-tion ratio of NOx, (NOþNO2)/NH3, appeared to be almost1:1. Also, it was observed that the conversion rate of NO2 washigher than that of NO. For the NH3 concentration, thesimulation results obtained using the newly estimated kineticparameters nicely predicted the experimental results. How-ever, for the NO and NO2 concentrations, some deviationswere found between the simulations and the experiments.
6. Transient NOx SCR reaction processes at constant re-actor temperatures of 230 and 300 �C were well-predicted bythe currently obtained kinetic parameters and numerical code.
Present Addresses‡Advanced Combustion & Engine Research Team, Institute ofTechnology, Doosan Infracore, 39-3 Sungbok-dong, Suji-gu,Yongin-si, Gyeonggi-do 448-795, Korea.3Energy Laboratory, Samsung Advanced Institute of Technol-ogy (SAIT), Samsung Electronics Co., Ltd., San 14, Nongseo-dong, Giheung-gu, Yongin-si, Gyeonggi-do 446-712, Korea.
’ACKNOWLEDGMENT
This work was supported by a Korea Science and EngineeringFoundation (KOSEF) grant funded by the Korean government(MEST) (2010-0000353).
’NOMENCLATUREac = catalytic active-site density (mol/m3)Ci = molar concentration of species i (mol/m3)Ea = activation energy of NH3 adsorption (J/mol)Ed = activation energy of NH3 desorption ( J/mol)Edo = activation energy of NH3 desorption at zero coverage
( J/mol)ka = rate constant of NH3 adsorption [m3/(mol s)]kao = pre-exponential factor of NH3 adsorption rate constant
[m3/(mol s)]kd = rate constant of NH3 desorption (s-1)kdo = pre-exponential factor of NH3 desorption rate constant
(s-1)ki = rate constant of reaction i [m3/(mol s)]kio = pre-exponential factor of rate of reaction i [m3/(mol s)]Ra = NH3 adsorption rate (s-1)Rd = NH3 desorption rate (s-1)RNO = NO SCR reaction rate (s-1)Rox = NH3 oxidation rate (s-1)Ru = universal gas constant [ J/(mol K)]t = time (s)T = temperature (K)uD = superficial velocity (m/s)x = axial position (m)Y = convergence criterion variable
Greek SymbolsR = parameter for the dependence of the ammonia surface
(1) Selective Catalytic Reduction. In DieselNet TechnologyGuide. Ecopoint Inc.: Mississauga, Ontario, Canada, 2002. Availableby subscription at http://www.dieselnet.com/tech/cat_scr.html(Accessed July 2010).
(2) Koebel, M.; Elsener, M.; Kleemann, M. Urea-SCR: A PromisingTechnique to Reduce NOx Emissions from Automotive Diesel Engines.Catal. Today 2000, 59, 335–345.
(3) Yim, S. D.; Kim, S. J.; Baik, J. H.; Nam, I. S.; Mok, Y. S.; Lee, J. H.;Cho, B. K.; Oh, S. H. Decomposition of Urea into NH3 for the SCRProcess. Ind. Eng. Chem. Res. 2004, 43, 4856–4863.
Industrial & Engineering Chemistry Research ARTICLE
(4) Seker, E.; Yasyerli, N.; Gulari, E.; Lambert, C.; Hammerle, R. H.NOx Reduction by Urea under Lean Conditions over Single StepSol-Gel Pt/Alumina Catalyst. Appl. Catal. B: Environ. 2002, 37, 27–35.(5) Fang, H. L.; DaCosta, H. F. M. Urea Thermolysis and NOx
Reduction with and without SCR Catalysts. Appl. Catal. B: Environ.2003, 46, 17–34.(6) Narayanaswamy, K.; He, Y. Modeling of Copper-Zeolite and
Iron-Zeolite Selective Catalytic Reduction (SCR) Catalysts at Steady Stateand Transient Conditions; SAE Paper 2008-01-0615; SAE International:Warrendale, PA, 2008.(7) Girard, J. W.; Montreuil, C.; Kim, J.; Cavataio, G.; Lambert, C.
Technical Advantages of Vanadium SCR Systems for Diesel NOx Control inEmerging Markets; SAE Paper 2008-01-1029; SAE International: War-rendale, PA, 2008.(8) Cavataio, G.; Girard, J.; Patterson, J. E.;Montreuil, C.; Cheng, Y.;
Lambert, C. K. Laboratory Testing of Urea-SCR Formulations to Meet Tier2 Bin 5 Emissions; SAE Paper 2007-01-1575; SAE International: Warren-dale, PA, 2007.(9) Johnson, T. V. Diesel Emission Control in Review; SAE Paper
2009-01-0121; SAE International: Warrendale, PA, 2009.(10) Fedeyko, J. M.; Chen, H. Y.; Ballinger, T. H.; Weigert, E. C.;
Chang, H. L.; Cox, J. P.; Andersen, P. J. Development of ThermallyDurable Cu/SCR Catalysts; SAE Paper 2009-01-0899; SAE Interna-tional: Warrendale, PA, 2009.(11) Gieshoff, J.; Sch€afer-Sindlinger, A.; Spurk, P. C.; Tillaart,
J. A. A.; Garr, G. Improved SCR Systems for Heavy Duty Applications;SAE Paper 2000-01-0189; SAE International: Warrendale, PA, 2000.(12) Girard, J.; Cavataio, G.; Snow, R.; Lambert, C. Combined
Fe-Cu SCR Systems with Optimized Ammonia to NOx Ratio for DieselNOx Control; SAE Paper 2008-01-1185; SAE International: Warrendale,PA, 2008.(13) Cavataio, G.; Jen, H. W.; Warner, J. R.; Girard, J. W.; Kim, J. Y.;
Lambert, C. K. Enhanced Durability of a Cu/Zeolite Based SCR Catalyst;SAE Paper 2008-01-1025; SAE International: Warrendale, PA, 2008.(14) Felix, S. P.; Savill-Jowitt, C.; Brown, D. R. Base Adsorption
Calorimetry for Characterising Surface Acidity: A Comparison betweenPulse Flow and Conventional “Static” Techniques. Thermochim. Acta2005, 433, 59–65.(15) Komatsu, T.; Nunokawa,M.;Moon, I. S.; Takahara, T.; Namba,
S.; Yashima, T. Kinetic Studies of Reduction of Nitric Oxide withAmmonia on Cu2þ-Exchanged Zeolites. J. Catal. 1994, 148, 427–437.(16) Olsson, L.; Sj€ovall, H.; Blint, R. J. Detailed Kinetic Modeling of
NOx Adsorption and NO Oxidation over Cu-ZSM-5. Appl. Catal. B:Environ. 2009, 87, 200–210.(17) Wurzenberger, J. C.; Wanker, R.Multi-Scale SCR Modeling, 1D
Kinetic Analysis and 3D System Simulation; SAE Paper 2005-01-0948;SAE International: Warrendale, PA, 2005.(18) Chatterjee, D.; Burkhardt, T.; Weibel, M.; Nova, I.; Grossale,
A.; Tronconi, E. Numerical Simulation of Zeolite- and V-Based SCRCatalytic Converters; SAE Paper 2007-01-1136; SAE International:Warrendale, PA, 2007.(19) Olsson, L.; Sj€ovall, H.; Blint, R. J. A KineticModel for Ammonia
Selective Catalytic Reduction over Cu-ZSM-5. Appl. Catal. B: Environ.2008, 81, 203–217.(20) Schuler, A.; Votsmeier, M.; Malmberg, S.; Gieshoff, J.; Drochner,
A.; Vogel, H.; Kiwic, P.Dynamic Model for the Selective Catalytic Reductionof NO with NH3 on Fe-Zeolite Catalysts; SAE Paper 2008-01-1323; SAEInternational: Warrendale, PA, 2008.(21) Tronconi, E.; Lietti, L.; Forzatti, P.; Malloggi, S. Experimental
and Theoretical Investigation of the Dynamics of the SCR - DeNOx
Dynamics of the SCR-DeNOx Reaction by the Transient-ResponseMethod. AIChE J. 1997, 43 (10), 2559–2570.(23) Schaub, G.; Unruh, D.; Wang, J.; Turek, T. Kinetic Analysis of
Selective Catalytic NOx Reduction (SCR) in a Catalytic Filter. Chem.Eng. Process 2003, 42, 365–371.
(24) Koebel, M.; Elsener, M.; Madia, G. Recent Advances in theDevelopment of Urea-SCR for Automotive Applications; SAE Paper 2001-01-3625; SAE International: Warrendale, PA, 2001.
(25) Baik, J. H.; Roh, J. H.; Yim, S. D.; Nam, I. -S.; Lee, J. -H.; Cho,B. K.; Oh, S. H. Synergistic Roles of NO and NO2 in Selective CatalyticReduction of NOx by NH3. Stud. Surf. Sci. Catal. 2006, 159, 441–444.
(26) Devadas, M.; Kr€ocher, O.; Elsener, M.; Wokaun, A.; S€oger, N.;Pfeifer, M.; Demel, Y.; Mussmann, L. Influence of NO2 on the SelectiveCatalytic Reduction of NO with Ammonia over Fe-ZSM5. Appl. Catal.B: Environ. 2006, 67, 187–196.
(27) Kato, A.; Matsuda, S.; Kamo, T.; Nakajima, F.; Kuroda, H.;Narita, T. Reaction between NOx and NH3 on Iron Oxide-TitaniumOxide Catalyst. J. Phys. Chem. 1981, 85, 4099–4102.
(28) Tuenter, G.; Leeuwen,W. F.; Snepvangers, L. J. M. Kinetics andMechanism of the NOx Reduction with NH3 on V2O5-WO3-TiO2
Catalyst. Ind. Eng. Chem. Prod. Res. Dev. 1986, 25 (4), 633–636.(29) Stevenson, S. A.; Vartuli, J. C.; Sharma, S. B. The Effects of
Steaming and Sodium Exchange on the Selective Catalytic Reduction ofNO and NO2 by NH3 over HZSM-5. J. Catal. 2002, 208, 106–113.
(30) Koebel, M.; Elsener, M.; Madia, G. Reaction Pathway in theSelective Catalytic Reduction Process with NO and NO2 at LowTemperatures. Ind. Eng. Chem. Res. 2001, 40, 52–59.
(31) Tannehill, J. C.; Anderson, D. A.; Pletcher, R. H.ComputationalFluid Mechanics and Heat Transfer, 2nd ed.; Taylor and Francis:Philadelphia, PA, 1997.
(32) Wang, T. J.; Baek, S. W.; Lee, J. H. Kinetic Parameter Estima-tion of a Diesel Oxidation Catalyst under Actual Vehicle OperatingConditions. Ind. Eng. Chem. Res. 2008, 47, 2528–2537.