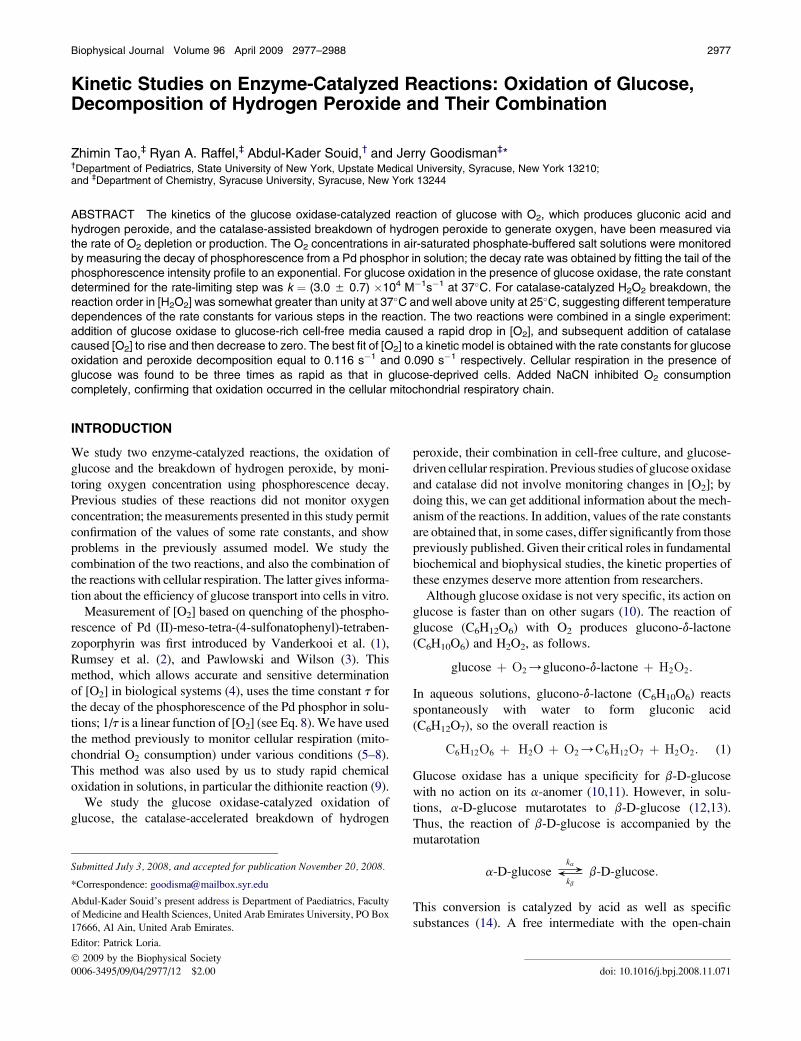
Kinetic Studies on Enzyme-Catalyzed Reactions: Oxidation of Glucose, Decomposition of Hydrogen Peroxide and Their Combination Zhimin Tao, ‡ Ryan A. Raffel, ‡ Abdul-Kader Souid, † and Jerry Goodisman ‡ * † Department of Pediatrics, State University of New York, Upstate Medical University, Syracuse, New York 13210; and ‡ Department of Chemistry, Syracuse University, Syracuse, New York 13244 ABSTRACT The kinetics of the glucose oxidase-catalyzed reaction of glucose with O 2 , which produces gluconic acid and hydrogen peroxide, and the catalase-assisted breakdown of hydrogen peroxide to generate oxygen, have been measured via the rate of O 2 depletion or production. The O 2 concentrations in air-saturated phosphate-buffered salt solutions were monitored by measuring the decay of phosphorescence from a Pd phosphor in solution; the decay rate was obtained by fitting the tail of the phosphorescence intensity profile to an exponential. For glucose oxidation in the presence of glucose oxidase, the rate constant determined for the rate-limiting step was k ¼ (3.0 5 0.7) 10 4 M 1 s 1 at 37 C. For catalase-catalyzed H 2 O 2 breakdown, the reaction order in [H 2 O 2 ] was somewhat greater than unity at 37 C and well above unity at 25 C, suggesting different temperature dependences of the rate constants for various steps in the reaction. The two reactions were combined in a single experiment: addition of glucose oxidase to glucose-rich cell-free media caused a rapid drop in [O 2 ], and subsequent addition of catalase caused [O 2 ] to rise and then decrease to zero. The best fit of [O 2 ] to a kinetic model is obtained with the rate constants for glucose oxidation and peroxide decomposition equal to 0.116 s 1 and 0.090 s 1 respectively. Cellular respiration in the presence of glucose was found to be three times as rapid as that in glucose-deprived cells. Added NaCN inhibited O 2 consumption completely, confirming that oxidation occurred in the cellular mitochondrial respiratory chain. INTRODUCTION We study two enzyme-catalyzed reactions, the oxidation of glucose and the breakdown of hydrogen peroxide, by moni- toring oxygen concentration using phosphorescence decay. Previous studies of these reactions did not monitor oxygen concentration; the measurements presented in this study permit confirmation of the values of some rate constants, and show problems in the previously assumed model. We study the combination of the two reactions, and also the combination of the reactions with cellular respiration. The latter gives informa- tion about the efficiency of glucose transport into cells in vitro. Measurement of [O 2 ] based on quenching of the phospho- rescence of Pd (II)-meso-tetra-(4-sulfonatophenyl)-tetraben- zoporphyrin was first introduced by Vanderkooi et al. (1), Rumsey et al. (2), and Pawlowski and Wilson (3). This method, which allows accurate and sensitive determination of [O 2 ] in biological systems (4), uses the time constant t for the decay of the phosphorescence of the Pd phosphor in solu- tions; 1/t is a linear function of [O 2 ] (see Eq. 8). We have used the method previously to monitor cellular respiration (mito- chondrial O 2 consumption) under various conditions (5–8). This method was also used by us to study rapid chemical oxidation in solutions, in particular the dithionite reaction (9). We study the glucose oxidase-catalyzed oxidation of glucose, the catalase-accelerated breakdown of hydrogen peroxide, their combination in cell-free culture, and glucose- driven cellular respiration. Previous studies of glucose oxidase and catalase did not involve monitoring changes in [O 2 ]; by doing this, we can get additional information about the mech- anism of the reactions. In addition, values of the rate constants are obtained that, in some cases, differ significantly from those previously published. Given their critical roles in fundamental biochemical and biophysical studies, the kinetic properties of these enzymes deserve more attention from researchers. Although glucose oxidase is not very specific, its action on glucose is faster than on other sugars (10). The reaction of glucose (C 6 H 12 O 6 ) with O 2 produces glucono-d-lactone (C 6 H 10 O 6 ) and H 2 O 2 , as follows. glucose þ O 2 /glucono-d-lactone þ H 2 O 2 : In aqueous solutions, glucono-d-lactone (C 6 H 10 O 6 ) reacts spontaneously with water to form gluconic acid (C 6 H 12 O 7 ), so the overall reaction is C 6 H 12 O 6 þ H 2 O þ O 2 /C 6 H 12 O 7 þ H 2 O 2 : (1) Glucose oxidase has a unique specificity for b-D-glucose with no action on its a-anomer (10,11). However, in solu- tions, a-D-glucose mutarotates to b-D-glucose (12,13). Thus, the reaction of b-D-glucose is accompanied by the mutarotation a-D-glucose % ka k b b-D-glucose: This conversion is catalyzed by acid as well as specific substances (14). A free intermediate with the open-chain Submitted July 3, 2008, and accepted for publication November 20, 2008. *Correspondence: [email protected]Abdul-Kader Souid’s present address is Department of Paediatrics, Faculty of Medicine and Health Sciences, United Arab Emirates University, PO Box 17666, Al Ain, United Arab Emirates. Editor: Patrick Loria. Ó 2009 by the Biophysical Society 0006-3495/09/04/2977/12 $2.00 doi: 10.1016/j.bpj.2008.11.071 Biophysical Journal Volume 96 April 2009 2977–2988 2977
Transcript
Kinetic Studies on Enzyme-Catalyzed Reactions: Oxidation of Glucose,Decomposition of Hydrogen Peroxide and Their Combination
Zhimin Tao,‡ Ryan A. Raffel,‡ Abdul-Kader Souid,† and Jerry Goodisman‡*†Department of Pediatrics, State University of New York, Upstate Medical University, Syracuse, New York 13210;and ‡Department of Chemistry, Syracuse University, Syracuse, New York 13244
ABSTRACT The kinetics of the glucose oxidase-catalyzed reaction of glucose with O2, which produces gluconic acid andhydrogen peroxide, and the catalase-assisted breakdown of hydrogen peroxide to generate oxygen, have been measured viathe rate of O2 depletion or production. The O2 concentrations in air-saturated phosphate-buffered salt solutions were monitoredby measuring the decay of phosphorescence from a Pd phosphor in solution; the decay rate was obtained by fitting the tail of thephosphorescence intensity profile to an exponential. For glucose oxidation in the presence of glucose oxidase, the rate constantdetermined for the rate-limiting step was k ¼ (3.0 5 0.7) �104 M�1s�1 at 37�C. For catalase-catalyzed H2O2 breakdown, thereaction order in [H2O2] was somewhat greater than unity at 37�C and well above unity at 25�C, suggesting different temperaturedependences of the rate constants for various steps in the reaction. The two reactions were combined in a single experiment:addition of glucose oxidase to glucose-rich cell-free media caused a rapid drop in [O2], and subsequent addition of catalasecaused [O2] to rise and then decrease to zero. The best fit of [O2] to a kinetic model is obtained with the rate constants for glucoseoxidation and peroxide decomposition equal to 0.116 s�1 and 0.090 s�1 respectively. Cellular respiration in the presence ofglucose was found to be three times as rapid as that in glucose-deprived cells. Added NaCN inhibited O2 consumptioncompletely, confirming that oxidation occurred in the cellular mitochondrial respiratory chain.
Biophysical Journal Volume 96 April 2009 2977–2988 2977
INTRODUCTION
We study two enzyme-catalyzed reactions, the oxidation of
glucose and the breakdown of hydrogen peroxide, by moni-
toring oxygen concentration using phosphorescence decay.
Previous studies of these reactions did not monitor oxygen
concentration; the measurements presented in this study permit
confirmation of the values of some rate constants, and show
problems in the previously assumed model. We study the
combination of the two reactions, and also the combination of
the reactions with cellular respiration. The latter gives informa-
tion about the efficiency of glucose transport into cells in vitro.
Measurement of [O2] based on quenching of the phospho-
rescence of Pd (II)-meso-tetra-(4-sulfonatophenyl)-tetraben-
zoporphyrin was first introduced by Vanderkooi et al. (1),
Rumsey et al. (2), and Pawlowski and Wilson (3). This
method, which allows accurate and sensitive determination
of [O2] in biological systems (4), uses the time constant t for
the decay of the phosphorescence of the Pd phosphor in solu-
tions; 1/t is a linear function of [O2] (see Eq. 8). We have used
the method previously to monitor cellular respiration (mito-
chondrial O2 consumption) under various conditions (5–8).
This method was also used by us to study rapid chemical
oxidation in solutions, in particular the dithionite reaction (9).
We study the glucose oxidase-catalyzed oxidation of
glucose, the catalase-accelerated breakdown of hydrogen
Submitted July 3, 2008, and accepted for publication November 20, 2008.
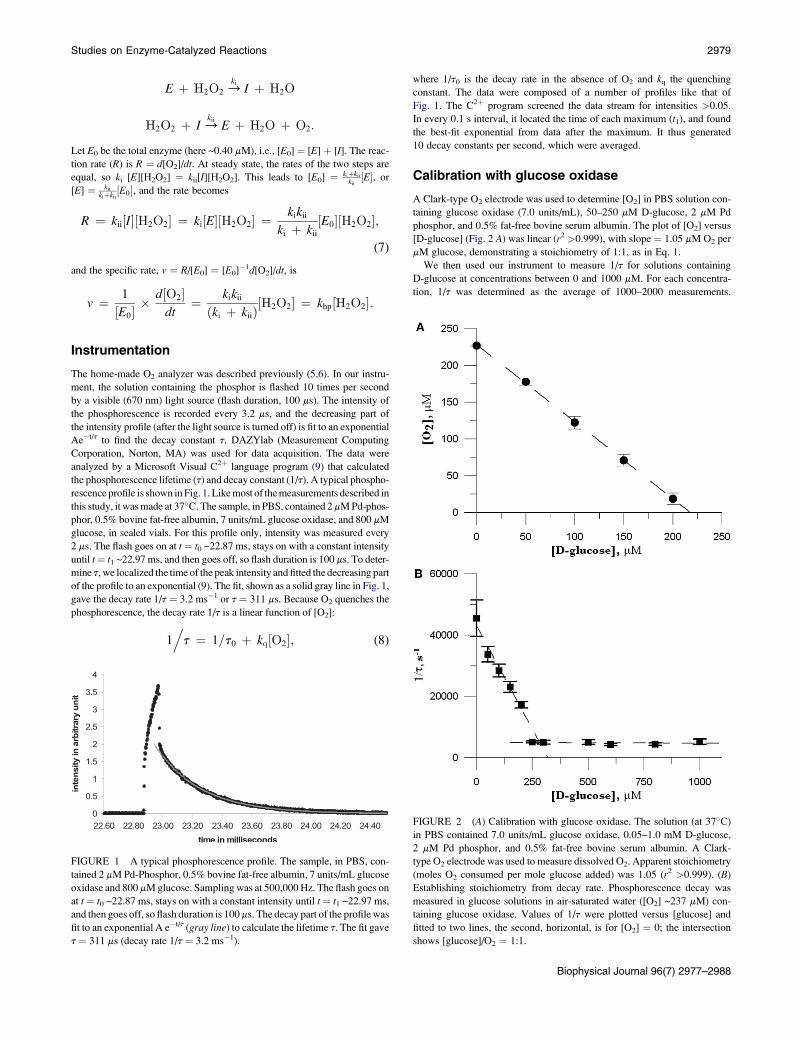
with a1 ¼ 43,844 s�1, b1 ¼ �146.7 mM�1s�1, and a2 ¼ 4788 s�1, whereas
the intersection is ([D-glucose], 1/t) ¼ (266.2 mM, 4788 s�1). Because [O2]
is 267 mM for air-saturated water at 25�C, this confirms the stoichiometry:
[D-glucose]/[O2] ¼ 1:1. It also determines the value of the quenching rate
constant, kq ¼ 134.5 � 14.3 mM�1 s�1, and the value of 1/t0, 5002 �437 s�1.
Stability of hydrogen peroxide
The stability of hydrogen peroxide was checked by high performance liquid
chromatography (HPLC). The analysis was carried out on a Beckman
reversed-phase HPLC system, which consisted of an automated injector
(model 507e) and a pump (model 125). The column, 4.6 � 250 mm Beck-
man Ultrasphere IP column, was operated at room temperature (25�C) at
a flow rate of 0.5 mL/min. The run time was 30 min and the mobile phase
was dH2O. Ten microliters 30 wt % H2O2 was diluted in 2 mL dH2O and
5–50 mL injections were run on HPLC, which corresponded to 260–2600
pmol H2O2. The detection wavelength was fixed at 250 nm. A typical
HPLC chromatogram is shown in Fig. 3 A.
A single peak was always observed at retention time ~5 min in all the
samples. The area of this peak was evaluated. Measurements were carried
out in two different days spanning the time period over which the H2O2 exper-
iments were carried out. The variations of H2O2 peak areas for the same injec-
tion were found to be between 1.8% and 6.7%. Thus, it is clear that the
hydrogen peroxide used in this study is stable. In addition, H2O2 peak areas
(A, arbitrary units) were proportional to the injected amount of H2O2. The
best linear fit to the results, shown in Fig. 3 B, was A � 10�6 ¼ (0.00337 �0.00012) (H2O2)þ (0.551� 0.184) where (H2O2) is in pmol and r2¼ 0.976.
RESULTS
Kinetics of glucose oxidase-catalyzedglucose oxidation
We first studied the glucose oxidase reaction at 37�C in the
presence of D-glucose. If Eqs. 2 and 3 are rate-controlling,
the specific rate is given by Eq. 6. This shows 1/n is a linear
function of both [b-D-glucose]�1 and [O2]�1. If the a–b
equilibration is not rapid, the a-to-b conversion reactions
must be taken into account. However, if the a-to-b equilibra-
tion is extremely slow, it may be neglected, provided that the
initial concentration of b-D-glucose only is considered. We
do this in the following.
In our experiments, D-glucose was first dissolved in PBS
(pH ~7.4) at 37�C, and then injected into PBS containing
glucose oxidase. Measured [O2] as a function of t is shown
in Fig. 4 A for 50 mM % [D-glucose] % 300 mM; the reac-
tion rate is the negative slope of the curve. Each experiment
was repeated 3–5 times; the representative plots are shown in
Fig. 4 A. Each data set is fit to an exponential Pe�Qt (Fig. 4 A,
lines). The initial rate vo ¼ �d[O2]/dt is then PQ. For the
lowest glucose concentration, the reaction rate is essentially
zero for t > 200 s, so the neglect of the mutarotation is not
justified. Thus, for experiments at 50 mM glucose, vo is
Biophysical Journal 96(7) 2977–2988
calculated from an exponential fit to only the first half of
the data (fit not shown in Fig. 4 A). Calculated vo are shown
in Fig. 4 B.
The initial specific rate should obey (Eq. 6)
1
v0
¼ A
½D-glucose�0þ B; (9)
where
A ¼ 1þ K
k1Kand B ¼ 1
k2
þ 1
k3
�O2
�þ 1
k4
:
A plot of 1/v0 versus 1/[D-glucose]0 with 50 % [D-
glucose]0 % 300 mM is shown in Fig. 4 B. It should be noted
FIGURE 3 Stability of H2O2 in solutions checked by HPLC. Samples were
run at room temperature (25�C) at a flow rate of 0.5 mL/min. The detection
wavelength was 250 nm, the run time was 30 min and the mobile phase
was dH2O. Ten mL of 30 wt. % H2O2 was diluted in 2 mL dH2O; 5–50 mL
injections, which corresponded to 260-2600 pmol H2O2, were then run on
HPLC. (A) Representative HPLC chromatograms of H2O2. The three plots,
from bottom to top, are due to independent injections of 530 (dotted line),
1060 (dashed line), and 2120 (solid line) pmol H2O2. A single peak was
observed at retention time ~300 seconds in three samples; the inset panel
shows the peak region. (B) H2O2 peak areas (A, arbitrary units) assumed
proportional to the injected amount of H2O2, are fitted to a linear function
A � 10�6 ¼ 0.00337 [H2O2] þ 0.551 (r2 ¼ 0.976). For each concentration,
measurements were taken in two different days covering H2O2 usage period.
The variations of H2O2 peak areas for the same injection were 1.8%–6.7%.
Studies on Enzyme-Catalyzed Reactions 2981
FIGURE 4 Kinetics of glucose oxidase.(A) D-glucose was injected into PBS containing glucose oxidase (pH ~7.4; 50 mM % [D-glucose] % 300 mM) at 37�C.
[O2] as a function of t (solid dots) was fit to an exponential function (gray solid line). (B) Plot of 1/v0 (v0¼ initial rate) versus 1/[D-glucose]0 (solid squares). Error
bars are the standard deviation from two to three experiments for each concentration. The data were fit to a line with slope ¼ 55.4 � 3.5 mM s
and intercept ¼ 0.032 � 0.003 s (r2 > 0.984). From the slope one gets the mutarotation equilibrium constant for glucose. (C) O2 consumption in the presence
of glucose oxidase. Glucose in excess over O2 is added at time zero. From left to right, [D-glucose] ¼ 10 mM (triangles), 5 mM (diamonds), 1 mM (circles),
respectively. The results are fit to Eq. 10 (solid lines).
that the small error bars on the points do not include the
errors inherent in the conversion of t to [O2]. The best linear
fit gives A¼ 55.4� 3.5 mM s and B¼ 0.032� 0.003 s (r2 >0.984). The value of B is essentially zero, implying k2, k3,
and k4 are very large. Using the determined value of Awith K ¼ 1.46 (15), we find the value of the rate constant
k1 ¼ 0.030 mM�1 s�1 at 37�C, comparable to the reported
0.016 mM�1s�1 (10).
Fig. 4 C shows the O2 consumption in the presence of
glucose oxidase when glucose is present in excess over O2
(from left to right, [D-glucose] ¼ 10, 5, and 1 mM, res-
pectively). With [glucose] >> [O2], the exact integral of
Eq. 6 from t0 to t is
a��
O2
�� ½O2�0
�þ b
�ln½O2� � ln½O2�0
�¼ �ðt � t0Þ:
(10)
Here, [O2]0 corresponds to [O2] in air-saturated PBS,
a ¼ 1
C
�1
k1½glucose� þk2 þ k4
k2k4
�;
and b ¼ (Ck3)�1. Using the Excel Solver function, we fit the
curves of Fig. 4 C to Eq. 10, obtaining {a, b} in {mM�1 s, s}
¼ (�0.034, 11.7), (0.025, 20.4), and (0.295, 22.1) from left
to right respectively. (Uncertainty about the zero of time may
be the reason the fits are not perfect: note that all the fits
could be improved by shifting the times for the experimental
points slightly to the left.) The value of a increases as
[glucose] decreases, whereas the value of b is relatively
constant.
From a linear plot of a versus 1/[glucose], we obtain 1/k1¼44.4� 3.0 mM s, so that k1¼ (2.3� 0.2)� 104 M�1 s�1, and
(k2 þ k4)/k2k4 ¼ �0.00734 � 0.00178 s. (The experiments
shown in Fig. 4, A and B, gave k1 ¼ 3.0 � 104 M�1 s�1.)
The very small value of (k2þ k4)/k2k4 implies large numerical
Biophysical Journal 96(7) 2977–2988
2982 Tao et al.
values for k2 and k4. Using the average value of b, 18.1� 5.6 s,
and enzyme concentration C ¼ 0.125 mM, k3 is calculated as
(4.4� 1.4)� 105 M�1 s�1. These results may be compared to
those reported by Gibson et al. (10), k1 ¼ 1.6� 104 M�1 s�1
and k3 ¼ 2.4 � 106 M�1 s�1 at 38�C.
The initial rate of reaction, obtained by differentiating Eq.
10, is
�d½O2�
dt
�0
¼ �V0 ¼ ��
a þ b
½O2�0
��1
: (11)
Using [O2]0¼ 225 mM in Eq. 11, we find, for [glucose]¼ 10,
5, and 1 mM, V0 ¼ 55.1, 8.7, and 2.5 mM s�1, respectively.
Kinetics of catalase-aided decompositionof hydrogen peroxide
As indicated in Eqs. 4 and 5, catalase reacts with one mole of
H2O2 to produce the intermediate I, which then reacts with
another mole of H2O2 to regenerate the enzyme and release
one mole of O2. The reaction rate R ¼ d[O2]/dt is given by
R ¼ kii½I�½H2O2� ¼ ki½E�½H2O2� ¼kikii
ki þ kii
½E0�½H2O2�:
Thus, the specific rate v ¼ R/[E0] ¼ [E0]�1d[O2]/dt, leading
to
v ¼ 1
½E0�� d½O2�
dt¼ kikii
ðki þ kiiÞ½H2O2� ¼ khp½H2O2�;
(12)
with khp ¼ð kikii
kiþkiiÞ. According to Eq. 12, n is proportional to
[H2O2] and the catalase-catalyzed decomposition of H2O2
is a first-order reaction with respect to H2O2.
To confirm the order of the reaction, we carried out the
following experiments. At 37�C, air-saturated PBS solutions
containing 2 mM Pd phosphor and 0.1 mg/mL catalase were
placed in sealed containers for oxygen measurement. A value
of 1/t was acquired every 0.1 s. Various H2O2 concentra-
tions were added at ~1 min and measurement was continued
until >3 min. The measured values of 1/t, which depends
linearly on [O2], are plotted versus t in Fig. 5 A. Each plot
corresponds to an experiment in which H2O2 at the indicated
concentration was added to air-saturated PBS. The rapid
climb in [O2] when H2O2 is injected is evident. Because
the reaction rate is independent of [O2], the plots show an
essentially linear increase in 1/t from t ¼ tl (l for low O2
level) to t ¼ th (h for high O2 level). To establish the order
with respect to H2O2 and to calculate rate constant khp, we
compare measured rates of reaction for different [H2O2].
The analysis used in this study is similar to that in previous
studies of dithionite kinetics (9).
For each plot, the values of 1/t before and after the rise in
[O2], 1/tl and 1/th, were obtained by averaging 600 measure-
ments at early (0 % t % tl) and late (th % t % 180 s) times,
respectively. The value of 1/tl should correspond to [O2] in
Biophysical Journal 96(7) 2977–2988
air-saturated PBS, which is 267 mM at 37�C, whereas the
value of 1/th corresponds to total [O2] after H2O2 decompo-
sition, i.e., the sum of original [O2] and [O2] produced by the
catalase-catalyzed decomposition of H2O2. Therefore,
the difference between the values of 1/tl and 1/th reflects
the produced O2. The white lines in Fig. 5 A are best fits
of the experimental data to the two-parameter function,
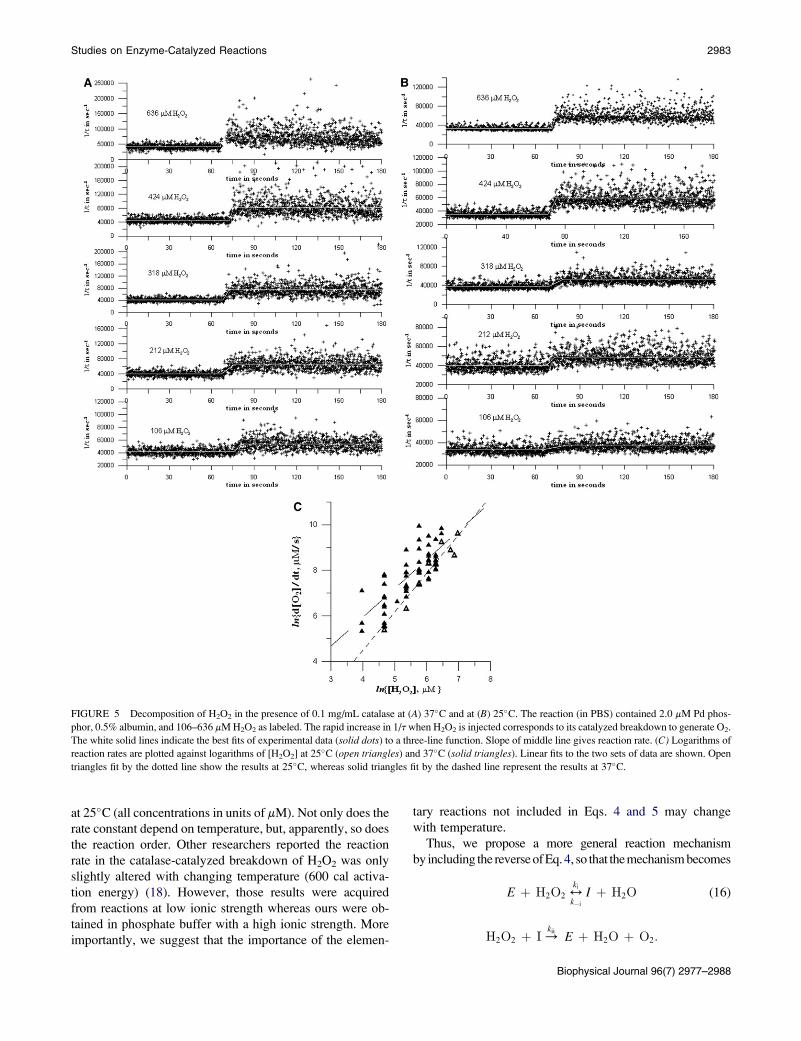
In contrast, the slope of the linear fit of ln(R) versus ln([H2O2])
is 1.69� 0.14 for 25�C, suggesting that the reaction becomes
1-1/2-order at the lower temperature. In particular,
R ¼ d½O2�dt¼ exp ð � 6:615 þ 1:692 ln½H2O2�Þ
z4:49 � 10�3½H2O2�1:5
Studies on Enzyme-Catalyzed Reactions 2983
FIGURE 5 Decomposition of H2O2 in the presence of 0.1 mg/mL catalase at (A) 37�C and at (B) 25�C. The reaction (in PBS) contained 2.0 mM Pd phos-
phor, 0.5% albumin, and 106–636 mM H2O2 as labeled. The rapid increase in 1/t when H2O2 is injected corresponds to its catalyzed breakdown to generate O2.
The white solid lines indicate the best fits of experimental data (solid dots) to a three-line function. Slope of middle line gives reaction rate. (C) Logarithms of
reaction rates are plotted against logarithms of [H2O2] at 25�C (open triangles) and 37�C (solid triangles). Linear fits to the two sets of data are shown. Open
triangles fit by the dotted line show the results at 25�C, whereas solid triangles fit by the dashed line represent the results at 37�C.
at 25�C (all concentrations in units of mM). Not only does the
rate constant depend on temperature, but, apparently, so does
the reaction order. Other researchers reported the reaction
rate in the catalase-catalyzed breakdown of H2O2 was only
slightly altered with changing temperature (600 cal activa-
tion energy) (18). However, those results were acquired
from reactions at low ionic strength whereas ours were ob-
tained in phosphate buffer with a high ionic strength. More
importantly, we suggest that the importance of the elemen-
tary reactions not included in Eqs. 4 and 5 may change
with temperature.
Thus, we propose a more general reaction mechanism
by including the reverse of Eq. 4, so that the mechanism becomes
E þ H2O2 4ki
k�i
I þ H2O (16)
H2O2 þ I /kii
E þ H2O þ O2:
Biophysical Journal 96(7) 2977–2988
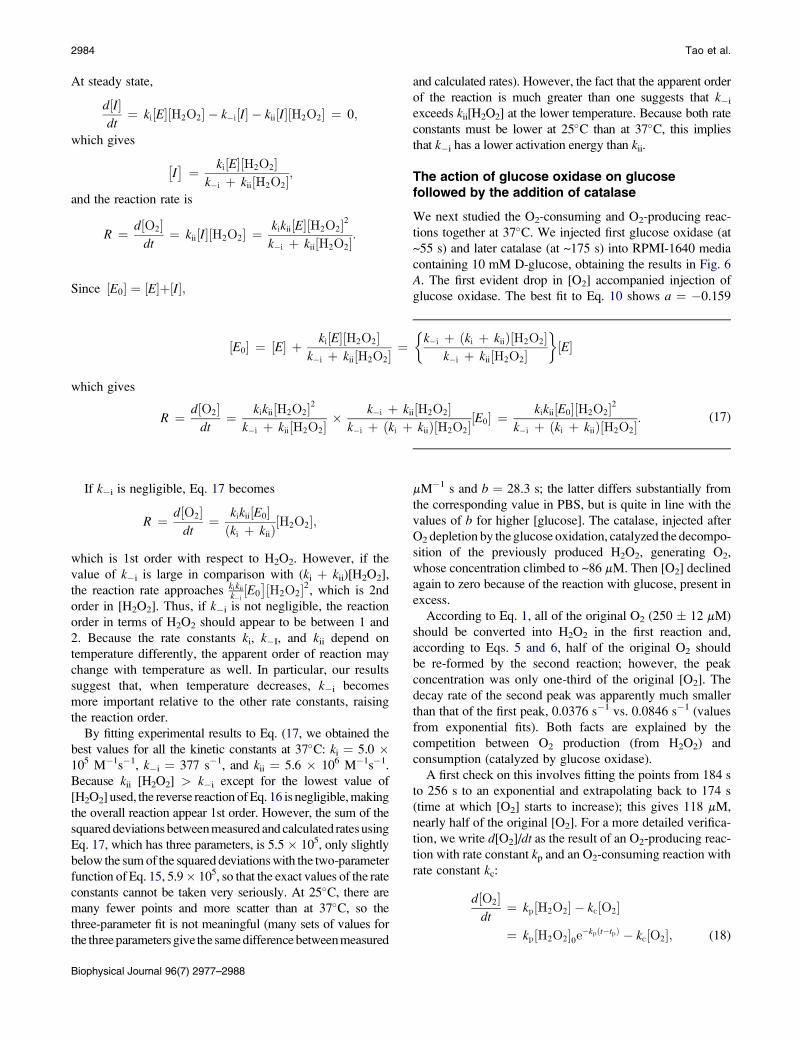
2984 Tao et al.
At steady state,
d½I�dt¼ ki½E�½H2O2� � k�i½I� � kii½I�½H2O2� ¼ 0;
which gives
�I�¼ ki½E�½H2O2�
k�i þ kii½H2O2�;
and the reaction rate is
R ¼ d½O2�dt¼ kii½I�½H2O2� ¼
kikii½E�½H2O2�2
k�i þ kii½H2O2�:
Since ½E0� ¼ ½E þ½I ;��
If k�i is negligible, Eq. 17 becomes
R ¼ d½O2�dt¼ kikii½E0�ðki þ kiiÞ
½H2O2�;
which is 1st order with respect to H2O2. However, if the
value of k�i is large in comparison with (ki þ kii)[H2O2],
the reaction rate approaches kikii
k�i½E0
�½H2O2�2, which is 2nd
order in [H2O2]. Thus, if k�i is not negligible, the reaction
order in terms of H2O2 should appear to be between 1 and
2. Because the rate constants ki, k�I, and kii depend on
temperature differently, the apparent order of reaction may
change with temperature as well. In particular, our results
suggest that, when temperature decreases, k�i becomes
more important relative to the other rate constants, raising
the reaction order.
By fitting experimental results to Eq. (17, we obtained the
best values for all the kinetic constants at 37�C: ki ¼ 5.0 �105 M�1s�1, k�i ¼ 377 s�1, and kii ¼ 5.6 � 106 M�1s�1.
Because kii [H2O2] > k�i except for the lowest value of
[H2O2] used, the reverse reaction of Eq. 16 is negligible, making
the overall reaction appear 1st order. However, the sum of the
squared deviations between measured and calculated rates using
Eq. 17, which has three parameters, is 5.5� 105, only slightly
below the sum of the squared deviations with the two-parameter
function of Eq. 15, 5.9� 105, so that the exact values of the rate
constants cannot be taken very seriously. At 25�C, there are
many fewer points and more scatter than at 37�C, so the
three-parameter fit is not meaningful (many sets of values for
the three parameters give the same difference between measured
½E0� ¼ ½E� þki½E�½H2O2�
k�i þ kii½H2O2�¼
which gives
R ¼ d½O2�dt¼ kikii½H2O2�2
k�i þ kii½H2O2�� k�i þ
k�i þ ðki
Biophysical Journal 96(7) 2977–2988
and calculated rates). However, the fact that the apparent order
of the reaction is much greater than one suggests that k�i
exceeds kii[H2O2] at the lower temperature. Because both rate
constants must be lower at 25�C than at 37�C, this implies
that k�i has a lower activation energy than kii.
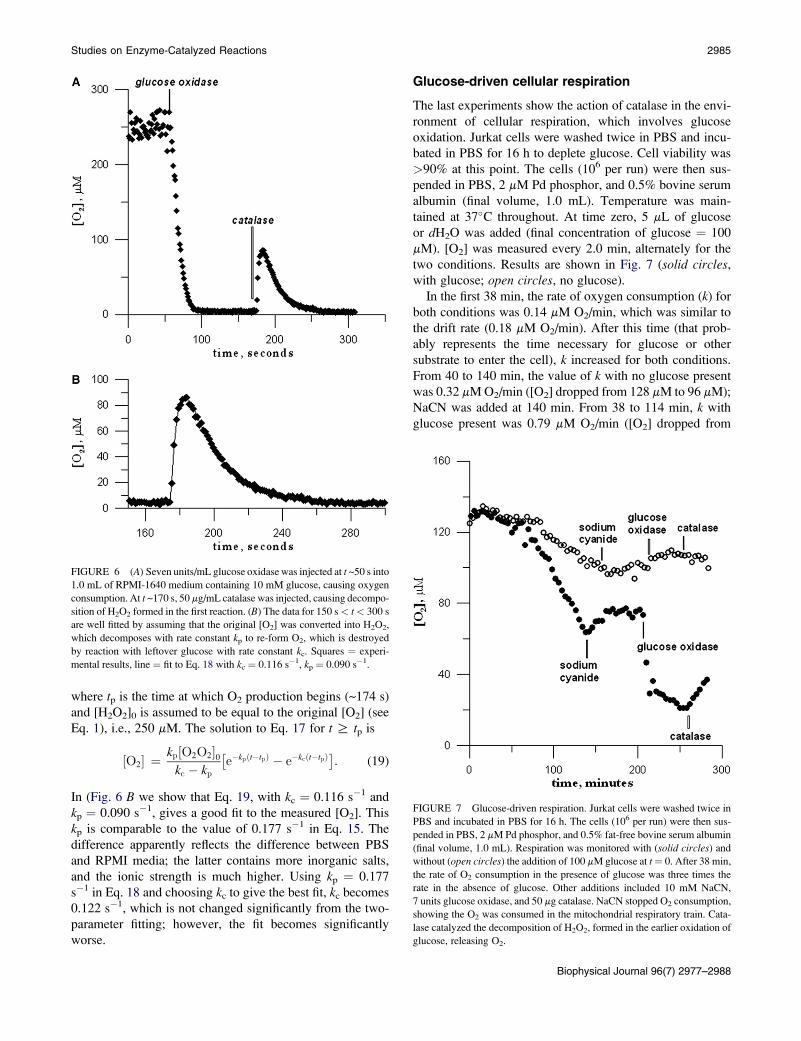
The action of glucose oxidase on glucosefollowed by the addition of catalase
We next studied the O2-consuming and O2-producing reac-
tions together at 37�C. We injected first glucose oxidase (at
~55 s) and later catalase (at ~175 s) into RPMI-1640 media
containing 10 mM D-glucose, obtaining the results in Fig. 6
A. The first evident drop in [O2] accompanied injection of
glucose oxidase. The best fit to Eq. 10 shows a ¼ �0.159
mM�1 s and b ¼ 28.3 s; the latter differs substantially from
the corresponding value in PBS, but is quite in line with the
values of b for higher [glucose]. The catalase, injected after
O2 depletion by the glucose oxidation, catalyzed the decompo-
sition of the previously produced H2O2, generating O2,
whose concentration climbed to ~86 mM. Then [O2] declined
again to zero because of the reaction with glucose, present in
excess.
According to Eq. 1, all of the original O2 (250 � 12 mM)
should be converted into H2O2 in the first reaction and,
according to Eqs. 5 and 6, half of the original O2 should
be re-formed by the second reaction; however, the peak
concentration was only one-third of the original [O2]. The
decay rate of the second peak was apparently much smaller
than that of the first peak, 0.0376 s�1 vs. 0.0846 s�1 (values
from exponential fits). Both facts are explained by the
competition between O2 production (from H2O2) and
consumption (catalyzed by glucose oxidase).
A first check on this involves fitting the points from 184 s
to 256 s to an exponential and extrapolating back to 174 s
(time at which [O2] starts to increase); this gives 118 mM,
nearly half of the original [O2]. For a more detailed verifica-
tion, we write d[O2]/dt as the result of an O2-producing reac-
tion with rate constant kp and an O2-consuming reaction with
rate constant kc:
d½O2�dt¼ kp½H2O2� � kc½O2�
¼ kp½H2O2�0e�kpðt�tpÞ � kc½O2�; (18)
�k�i þ ðki þ kiiÞ½H2O2�
k�i þ kii½H2O2�
½E�
kii½H2O2�þ kiiÞ½H2O2�
½E0� ¼kikii½E0�½H2O2�2
k�i þ ðki þ kiiÞ½H2O2�: (17)
Studies on Enzyme-Catalyzed Reactions 2985
where tp is the time at which O2 production begins (~174 s)
and [H2O2]0 is assumed to be equal to the original [O2] (see
Eq. 1), i.e., 250 mM. The solution to Eq. 17 for t R tp is
½O2� ¼kp½O2O2�0
kc � kp
�e�kpðt�tpÞ � e�kcðt�tpÞ
�: (19)
In (Fig. 6 B we show that Eq. 19, with kc ¼ 0.116 s�1 and
kp ¼ 0.090 s�1, gives a good fit to the measured [O2]. This
kp is comparable to the value of 0.177 s�1 in Eq. 15. The
difference apparently reflects the difference between PBS
and RPMI media; the latter contains more inorganic salts,
and the ionic strength is much higher. Using kp ¼ 0.177
s�1 in Eq. 18 and choosing kc to give the best fit, kc becomes
0.122 s�1, which is not changed significantly from the two-
parameter fitting; however, the fit becomes significantly
worse.
FIGURE 6 (A) Seven units/mL glucose oxidase was injected at t ~50 s into
1.0 mL of RPMI-1640 medium containing 10 mM glucose, causing oxygen
consumption. At t ~170 s, 50 mg/mL catalase was injected, causing decompo-
sition of H2O2 formed in the first reaction. (B) The data for 150 s< t< 300 s
are well fitted by assuming that the original [O2] was converted into H2O2,
which decomposes with rate constant kp to re-form O2, which is destroyed
by reaction with leftover glucose with rate constant kc. Squares ¼ experi-
mental results, line ¼ fit to Eq. 18 with kc ¼ 0.116 s�1, kp ¼ 0.090 s�1.
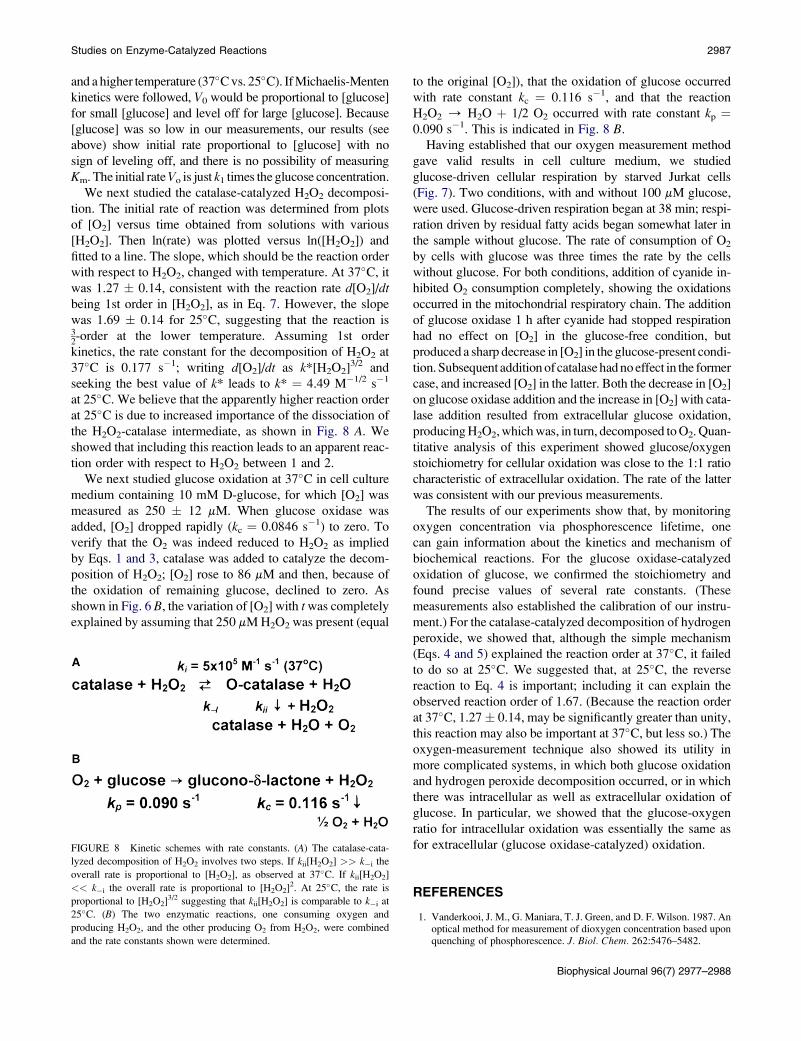
Glucose-driven cellular respiration
The last experiments show the action of catalase in the envi-
ronment of cellular respiration, which involves glucose
oxidation. Jurkat cells were washed twice in PBS and incu-
bated in PBS for 16 h to deplete glucose. Cell viability was
>90% at this point. The cells (106 per run) were then sus-
pended in PBS, 2 mM Pd phosphor, and 0.5% bovine serum
albumin (final volume, 1.0 mL). Temperature was main-
tained at 37�C throughout. At time zero, 5 mL of glucose
or dH2O was added (final concentration of glucose ¼ 100
mM). [O2] was measured every 2.0 min, alternately for the
two conditions. Results are shown in Fig. 7 (solid circles,
with glucose; open circles, no glucose).
In the first 38 min, the rate of oxygen consumption (k) for
both conditions was 0.14 mM O2/min, which was similar to
the drift rate (0.18 mM O2/min). After this time (that prob-
ably represents the time necessary for glucose or other
substrate to enter the cell), k increased for both conditions.
From 40 to 140 min, the value of k with no glucose present
was 0.32 mM O2/min ([O2] dropped from 128 mM to 96 mM);
NaCN was added at 140 min. From 38 to 114 min, k with
glucose present was 0.79 mM O2/min ([O2] dropped from
FIGURE 7 Glucose-driven respiration. Jurkat cells were washed twice in
PBS and incubated in PBS for 16 h. The cells (106 per run) were then sus-
pended in PBS, 2 mM Pd phosphor, and 0.5% fat-free bovine serum albumin
(final volume, 1.0 mL). Respiration was monitored with (solid circles) and
without (open circles) the addition of 100 mM glucose at t¼ 0. After 38 min,
the rate of O2 consumption in the presence of glucose was three times the
rate in the absence of glucose. Other additions included 10 mM NaCN,
7 units glucose oxidase, and 50 mg catalase. NaCN stopped O2 consumption,
showing the O2 was consumed in the mitochondrial respiratory train. Cata-
lase catalyzed the decomposition of H2O2, formed in the earlier oxidation of
glucose, releasing O2.
Biophysical Journal 96(7) 2977–2988
2986 Tao et al.
125 mM to 64 mM), 2-1/2 times as large; NaCN was added at
114 min. The decline in [O2] in the absence of glucose was
due to fatty acids in the albumin preparation used here,
which can also drive respiration. (Other experiments showed
that, with no albumin, the drop in [O2] is much smaller.) For
both conditions, O2 consumption was completely inhibited
by NaCN, confirming the oxidation occurred in the respira-
than the literature value of 2.4� 106 M�1 s�1 (10). Le Barc’H
et al. (15) used luminescence intensity to monitor [O2] during
the glucose oxidase-catalyzed oxidation of glucose. They re-
ported a Michaelis constant Km of 38 � 6 mM, as well as
some rate data. Direct comparison of our measured rates with
those of Le Barc’H et al. (15) is not possible because our
measurements were carried out using a different enzyme,
a lower enzyme concentration (0.02 vs. 0.8 mg/mL protein),
Studies on Enzyme-Catalyzed Reactions 2987
and a higher temperature (37�C vs. 25�C). If Michaelis-Menten
kinetics were followed, V0 would be proportional to [glucose]
for small [glucose] and level off for large [glucose]. Because
[glucose] was so low in our measurements, our results (see
above) show initial rate proportional to [glucose] with no
sign of leveling off, and there is no possibility of measuring
Km. The initial rate Vo is just k1 times the glucose concentration.
We next studied the catalase-catalyzed H2O2 decomposi-
tion. The initial rate of reaction was determined from plots
of [O2] versus time obtained from solutions with various
[H2O2]. Then ln(rate) was plotted versus ln([H2O2]) and
fitted to a line. The slope, which should be the reaction order
with respect to H2O2, changed with temperature. At 37�C, it
was 1.27 � 0.14, consistent with the reaction rate d[O2]/dtbeing 1st order in [H2O2], as in Eq. 7. However, the slope
was 1.69 � 0.14 for 25�C, suggesting that the reaction is32-order at the lower temperature. Assuming 1st order
kinetics, the rate constant for the decomposition of H2O2 at
37�C is 0.177 s�1; writing d[O2]/dt as k*[H2O2]3/2 and
seeking the best value of k* leads to k* ¼ 4.49 M�1/2 s�1
at 25�C. We believe that the apparently higher reaction order
at 25�C is due to increased importance of the dissociation of
the H2O2-catalase intermediate, as shown in Fig. 8 A. We
showed that including this reaction leads to an apparent reac-
tion order with respect to H2O2 between 1 and 2.
We next studied glucose oxidation at 37�C in cell culture
medium containing 10 mM D-glucose, for which [O2] was
measured as 250 � 12 mM. When glucose oxidase was
added, [O2] dropped rapidly (kc ¼ 0.0846 s�1) to zero. To
verify that the O2 was indeed reduced to H2O2 as implied
by Eqs. 1 and 3, catalase was added to catalyze the decom-
position of H2O2; [O2] rose to 86 mM and then, because of
the oxidation of remaining glucose, declined to zero. As
shown in Fig. 6 B, the variation of [O2] with t was completely
explained by assuming that 250 mM H2O2 was present (equal
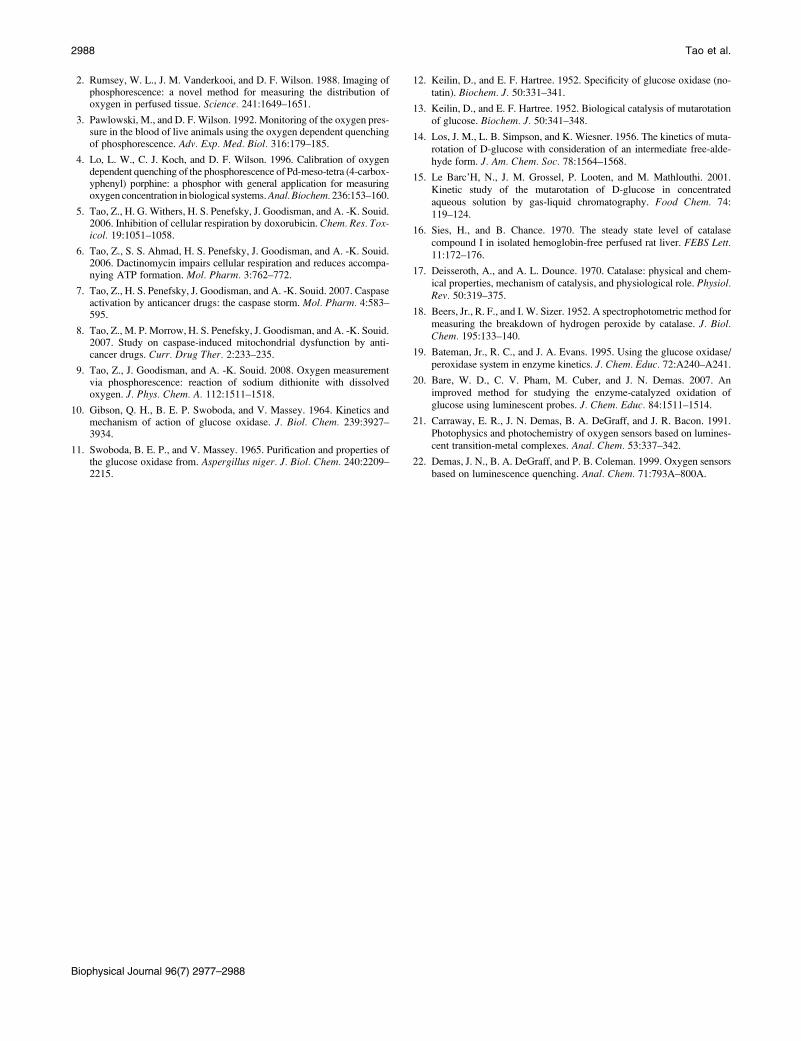
FIGURE 8 Kinetic schemes with rate constants. (A) The catalase-cata-
lyzed decomposition of H2O2 involves two steps. If kii[H2O2] >> k�i the
overall rate is proportional to [H2O2], as observed at 37�C. If kii[H2O2]
<< k�i the overall rate is proportional to [H2O2]2. At 25�C, the rate is
proportional to [H2O2]3/2 suggesting that kii[H2O2] is comparable to k�i at
25�C. (B) The two enzymatic reactions, one consuming oxygen and
producing H2O2, and the other producing O2 from H2O2, were combined
and the rate constants shown were determined.
to the original [O2]), that the oxidation of glucose occurred
with rate constant kc ¼ 0.116 s�1, and that the reaction
H2O2 / H2O þ 1/2 O2 occurred with rate constant kp ¼0.090 s�1. This is indicated in Fig. 8 B.
Having established that our oxygen measurement method
gave valid results in cell culture medium, we studied
glucose-driven cellular respiration by starved Jurkat cells
(Fig. 7). Two conditions, with and without 100 mM glucose,
were used. Glucose-driven respiration began at 38 min; respi-
ration driven by residual fatty acids began somewhat later in
the sample without glucose. The rate of consumption of O2
by cells with glucose was three times the rate by the cells
without glucose. For both conditions, addition of cyanide in-
hibited O2 consumption completely, showing the oxidations
occurred in the mitochondrial respiratory chain. The addition
of glucose oxidase 1 h after cyanide had stopped respiration
had no effect on [O2] in the glucose-free condition, but
produced a sharp decrease in [O2] in the glucose-present condi-
tion. Subsequent addition of catalase had no effect in the former
case, and increased [O2] in the latter. Both the decrease in [O2]
on glucose oxidase addition and the increase in [O2] with cata-
lase addition resulted from extracellular glucose oxidation,
producing H2O2, which was, in turn, decomposed to O2. Quan-
titative analysis of this experiment showed glucose/oxygen
stoichiometry for cellular oxidation was close to the 1:1 ratio
characteristic of extracellular oxidation. The rate of the latter
was consistent with our previous measurements.
The results of our experiments show that, by monitoring
oxygen concentration via phosphorescence lifetime, one
can gain information about the kinetics and mechanism of
biochemical reactions. For the glucose oxidase-catalyzed
oxidation of glucose, we confirmed the stoichiometry and
found precise values of several rate constants. (These
measurements also established the calibration of our instru-
ment.) For the catalase-catalyzed decomposition of hydrogen
peroxide, we showed that, although the simple mechanism
(Eqs. 4 and 5) explained the reaction order at 37�C, it failed
to do so at 25�C. We suggested that, at 25�C, the reverse
reaction to Eq. 4 is important; including it can explain the
observed reaction order of 1.67. (Because the reaction order
at 37�C, 1.27� 0.14, may be significantly greater than unity,
this reaction may also be important at 37�C, but less so.) The
oxygen-measurement technique also showed its utility in
more complicated systems, in which both glucose oxidation
and hydrogen peroxide decomposition occurred, or in which
there was intracellular as well as extracellular oxidation of
glucose. In particular, we showed that the glucose-oxygen
ratio for intracellular oxidation was essentially the same as
for extracellular (glucose oxidase-catalyzed) oxidation.
REFERENCES
1. Vanderkooi, J. M., G. Maniara, T. J. Green, and D. F. Wilson. 1987. Anoptical method for measurement of dioxygen concentration based uponquenching of phosphorescence. J. Biol. Chem. 262:5476–5482.
Biophysical Journal 96(7) 2977–2988
2988 Tao et al.
2. Rumsey, W. L., J. M. Vanderkooi, and D. F. Wilson. 1988. Imaging ofphosphorescence: a novel method for measuring the distribution ofoxygen in perfused tissue. Science. 241:1649–1651.
3. Pawlowski, M., and D. F. Wilson. 1992. Monitoring of the oxygen pres-sure in the blood of live animals using the oxygen dependent quenchingof phosphorescence. Adv. Exp. Med. Biol. 316:179–185.
4. Lo, L. W., C. J. Koch, and D. F. Wilson. 1996. Calibration of oxygendependent quenching of the phosphorescence of Pd-meso-tetra (4-carbox-yphenyl) porphine: a phosphor with general application for measuringoxygen concentration in biological systems. Anal. Biochem. 236:153–160.
5. Tao, Z., H. G. Withers, H. S. Penefsky, J. Goodisman, and A. -K. Souid.2006. Inhibition of cellular respiration by doxorubicin. Chem. Res. Tox-icol. 19:1051–1058.
6. Tao, Z., S. S. Ahmad, H. S. Penefsky, J. Goodisman, and A. -K. Souid.2006. Dactinomycin impairs cellular respiration and reduces accompa-nying ATP formation. Mol. Pharm. 3:762–772.
7. Tao, Z., H. S. Penefsky, J. Goodisman, and A. -K. Souid. 2007. Caspaseactivation by anticancer drugs: the caspase storm. Mol. Pharm. 4:583–595.
8. Tao, Z., M. P. Morrow, H. S. Penefsky, J. Goodisman, and A. -K. Souid.2007. Study on caspase-induced mitochondrial dysfunction by anti-cancer drugs. Curr. Drug Ther. 2:233–235.
9. Tao, Z., J. Goodisman, and A. -K. Souid. 2008. Oxygen measurementvia phosphorescence: reaction of sodium dithionite with dissolvedoxygen. J. Phys. Chem. A. 112:1511–1518.
10. Gibson, Q. H., B. E. P. Swoboda, and V. Massey. 1964. Kinetics andmechanism of action of glucose oxidase. J. Biol. Chem. 239:3927–3934.
11. Swoboda, B. E. P., and V. Massey. 1965. Purification and properties ofthe glucose oxidase from. Aspergillus niger. J. Biol. Chem. 240:2209–2215.
Biophysical Journal 96(7) 2977–2988
12. Keilin, D., and E. F. Hartree. 1952. Specificity of glucose oxidase (no-tatin). Biochem. J. 50:331–341.
13. Keilin, D., and E. F. Hartree. 1952. Biological catalysis of mutarotationof glucose. Biochem. J. 50:341–348.
14. Los, J. M., L. B. Simpson, and K. Wiesner. 1956. The kinetics of muta-rotation of D-glucose with consideration of an intermediate free-alde-hyde form. J. Am. Chem. Soc. 78:1564–1568.
15. Le Barc’H, N., J. M. Grossel, P. Looten, and M. Mathlouthi. 2001.Kinetic study of the mutarotation of D-glucose in concentratedaqueous solution by gas-liquid chromatography. Food Chem. 74:119–124.
16. Sies, H., and B. Chance. 1970. The steady state level of catalasecompound I in isolated hemoglobin-free perfused rat liver. FEBS Lett.11:172–176.
17. Deisseroth, A., and A. L. Dounce. 1970. Catalase: physical and chem-ical properties, mechanism of catalysis, and physiological role. Physiol.Rev. 50:319–375.
18. Beers, Jr., R. F., and I. W. Sizer. 1952. A spectrophotometric method formeasuring the breakdown of hydrogen peroxide by catalase. J. Biol.Chem. 195:133–140.
19. Bateman, Jr., R. C., and J. A. Evans. 1995. Using the glucose oxidase/peroxidase system in enzyme kinetics. J. Chem. Educ. 72:A240–A241.
20. Bare, W. D., C. V. Pham, M. Cuber, and J. N. Demas. 2007. Animproved method for studying the enzyme-catalyzed oxidation ofglucose using luminescent probes. J. Chem. Educ. 84:1511–1514.
21. Carraway, E. R., J. N. Demas, B. A. DeGraff, and J. R. Bacon. 1991.Photophysics and photochemistry of oxygen sensors based on lumines-cent transition-metal complexes. Anal. Chem. 53:337–342.
22. Demas, J. N., B. A. DeGraff, and P. B. Coleman. 1999. Oxygen sensorsbased on luminescence quenching. Anal. Chem. 71:793A–800A.