1 DOI: 10.7763/IJCEA.2013.V4.248 Abstract—Black liquor is a by-product of the pulping process in the manufacture of paper. It is a complex mixture of both organic and inorganic chemicals with both chemical value and energy content. To recover these two quantities, the black liquor is concentrated to around 60 – 85 % solids concentration and fired into a recovery boiler. In the boiler, the black liquor is sprayed in the form of droplets which fall through the atmosphere of the furnace to the bottom. During this process, the droplet undergoes drying, devolatilization and char burning in succession before coalescing with the smelt at the bottom. The modeling of these processes during the movement of the black liquor droplet is quite complex and in this paper, we attempt to simulate the weight loss during the devolatilization stage by studying the pyrolysis of dry black liquor solids in a muffle furnace. Experiments were carried out at temperatures varying from 973 to 1273 K and for residence times varying from 30 to 180 s. The kinetic scheme of dry black liquor solids decomposition by a single reaction giving gaseous volatiles and char is used. The proposed single reaction model is simulated and the best values of the kinetic parameters i.e. activation energy and Arrhenius constant are found by using the two-dimensional surface fitting non-linear regression algorithm. The results indicate good agreement between predicted and experimental data. Index Terms—Black liquor, pyrolysis, kinetic modeling, recovery boiler I. INTRODUCTION The production of paper utilizing the cellulose in wood is a very complicated and difficult to control process [1]. Black Liquor (BL), a by-product of the pulping process [2], results from the addition of inorganic chemicals like sodium hydroxide, sodium sulfide and sodium carbonate in the form of an aqueous solution called white liquor to the wood chips in a digester. Generally, one ton of dry wood requires around 200 ~ 250 kg of chemicals and after digestion, the resulting mixture consists of around 500 kg pulp plus 500 kg dissolved organics and 200 ~ 250 kg dissolved inorganics. After most of the pulp is separated from the stock solution, the resulting spent solution or black liquor contains a complex mixture of both organic and inorganic chemicals and has a dissolved solids concentration of 10 – 15%. This is not only an environmental hazard but also contains important inorganic chemicals that can be recovered and has energy value due to the dissolved organic solids. The concentration of dissolved Manuscript received September 29, 2012; revised November 27, 2012. The authors are with the Department of Chemical Engineering, Jaypee University of Engineering & Technology, A-B Road, Dt. Guna - 473226, M.P., INDIA. Tel: +91 7544 267310, Fax: +91 7544 267011 (e-mail: [email protected]). solids is very low for direct combustion. Therefore, it is concentrated in a multiple-effect evaporator system to raise the solids content in the black liquor. The concentrated black liquor, which contains around 65-85% solids content, is fired in the recovery boiler to recover inorganic chemicals and heat energy in the form of steam. The inorganic chemicals coming out from bottom of the recovery boiler is called as smelt which is treated with water and the resulting solution called as green liquor. Green liquor is further processed in the causticizing section to convert to white liquor and fed to digester in a recycle loop. Chemically, the concentrated black liquor consists of several constituents as indicated in Table I wherein the largest constituents are carbon, oxygen, sodium and sulphur [2]. TABLE I: TYPICAL COMPOSITION OF DRY BLACK LIQUOR SOLIDS (ADAPTED FROM [2]) Element w/w (%) C 36.4 H 3.5 O 34.3 N 0.14 Na 18.6 K 2.02 Cl 0.24 S 4.8 Total 100.00 A. Conversion of Black Liquor In order to recover the chemicals and energy in the black liquor efficiently, the black liquor has to be atomized into droplets and sprayed into the recovery boiler through nozzles. As the black liquor droplets enter the recovery boiler, they are exposed to hot air rising up and will undergo drying, pyrolysis and char conversion in succession. During these stages, the droplets undergo morphological changes which lead to changes in both the heat transfer and aerodynamic properties of the droplets [3]. Fig. 1 shows the conversion stages of a black liquor droplet. First, the black liquor droplet dries and loses its free moisture. The rate at which the material dries is controlled by the heat transfer. Thus, the droplet will dry faster at higher temperatures. Then the droplet goes through a devolatilization stage where the organic matter in the liquor degrades [3], forming various gaseous compounds from volatile substances. The result is a swollen, porous char particle, which contains about 25 % non-volatile organic coal material and about 75% inorganic salts. At this stage, the droplet volume might have increased by many folds. The final stage is char conversion, during which mostly gas phase species react with organic constituents in the char particle, converting them into gaseous species. At the end of the char Kinetics of Devolatilization of Black Liquor Droplets in Chemical Recovery Boilers - Pyrolysis of Dry Black Liquor Solids S. Ramesh, A. S. Chaurasia, H. Mahalingam, and N. J. Rao International Journal of Chemical Engineering and Applications, Vol. 4, No. 1, February 2013
Transcript
1DOI: 10.7763/IJCEA.2013.V4.248
Abstract—Black liquor is a by-product of the pulping process
in the manufacture of paper. It is a complex mixture of both organic and inorganic chemicals with both chemical value and energy content. To recover these two quantities, the black liquor is concentrated to around 60 – 85 % solids concentration and fired into a recovery boiler. In the boiler, the black liquor is sprayed in the form of droplets which fall through the atmosphere of the furnace to the bottom. During this process, the droplet undergoes drying, devolatilization and char burning in succession before coalescing with the smelt at the bottom. The modeling of these processes during the movement of the black liquor droplet is quite complex and in this paper, we attempt to simulate the weight loss during the devolatilization stage by studying the pyrolysis of dry black liquor solids in a muffle furnace. Experiments were carried out at temperatures varying from 973 to 1273 K and for residence times varying from 30 to 180 s. The kinetic scheme of dry black liquor solids decomposition by a single reaction giving gaseous volatiles and char is used. The proposed single reaction model is simulated and the best values of the kinetic parameters i.e. activation energy and Arrhenius constant are found by using the two-dimensional surface fitting non-linear regression algorithm. The results indicate good agreement between predicted and experimental data.
Index Terms—Black liquor, pyrolysis, kinetic modeling, recovery boiler
I. INTRODUCTION The production of paper utilizing the cellulose in wood is a
very complicated and difficult to control process [1]. Black Liquor (BL), a by-product of the pulping process [2], results from the addition of inorganic chemicals like sodium hydroxide, sodium sulfide and sodium carbonate in the form of an aqueous solution called white liquor to the wood chips in a digester. Generally, one ton of dry wood requires around 200 ~ 250 kg of chemicals and after digestion, the resulting mixture consists of around 500 kg pulp plus 500 kg dissolved organics and 200 ~ 250 kg dissolved inorganics. After most of the pulp is separated from the stock solution, the resulting spent solution or black liquor contains a complex mixture of both organic and inorganic chemicals and has a dissolved solids concentration of 10 – 15%. This is not only an environmental hazard but also contains important inorganic chemicals that can be recovered and has energy value due to the dissolved organic solids. The concentration of dissolved
Manuscript received September 29, 2012; revised November 27, 2012. The authors are with the Department of Chemical Engineering, Jaypee
University of Engineering & Technology, A-B Road, Dt. Guna - 473226, M.P., INDIA. Tel: +91 7544 267310, Fax: +91 7544 267011 (e-mail: [email protected]).
solids is very low for direct combustion. Therefore, it is concentrated in a multiple-effect evaporator system to raise the solids content in the black liquor. The concentrated black liquor, which contains around 65-85% solids content, is fired in the recovery boiler to recover inorganic chemicals and heat energy in the form of steam. The inorganic chemicals coming out from bottom of the recovery boiler is called as smelt which is treated with water and the resulting solution called as green liquor. Green liquor is further processed in the causticizing section to convert to white liquor and fed to digester in a recycle loop. Chemically, the concentrated black liquor consists of several constituents as indicated in Table I wherein the largest constituents are carbon, oxygen, sodium and sulphur [2].
TABLE I: TYPICAL COMPOSITION OF DRY BLACK LIQUOR SOLIDS (ADAPTED FROM [2])
Element w/w (%) C 36.4 H 3.5 O 34.3 N 0.14 Na 18.6 K 2.02 Cl 0.24 S 4.8 Total 100.00
A. Conversion of Black Liquor In order to recover the chemicals and energy in the black
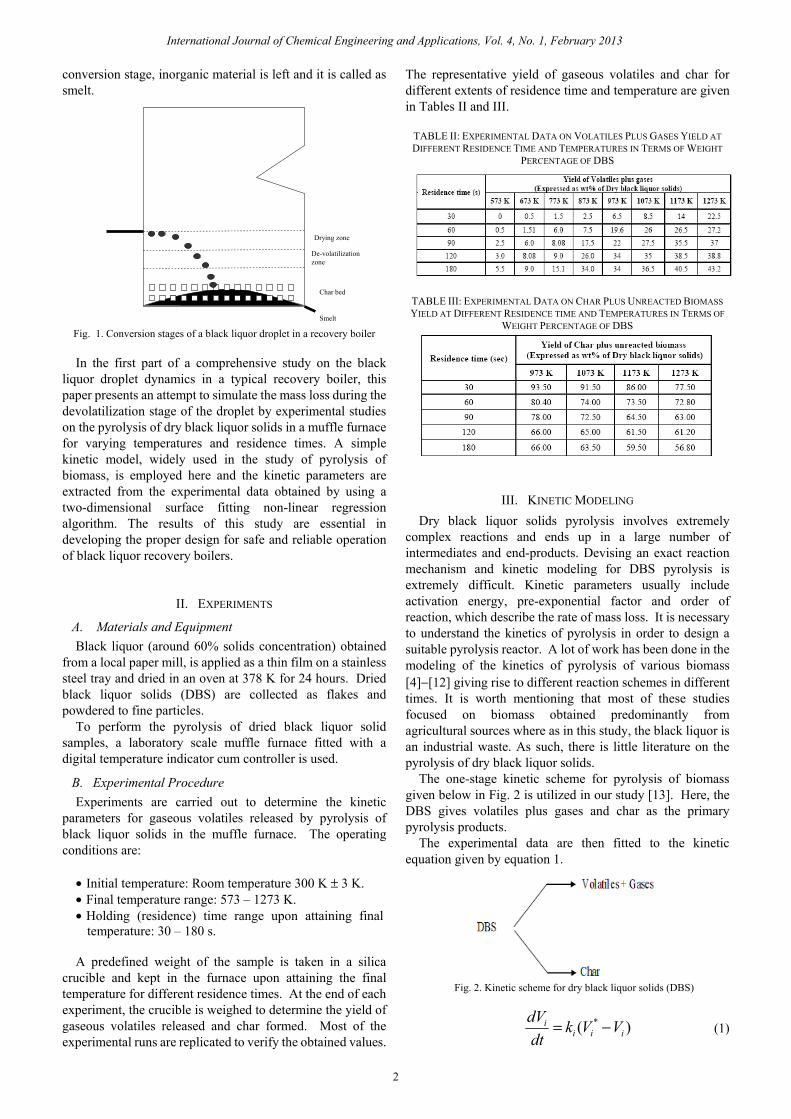
liquor efficiently, the black liquor has to be atomized into droplets and sprayed into the recovery boiler through nozzles. As the black liquor droplets enter the recovery boiler, they are exposed to hot air rising up and will undergo drying, pyrolysis and char conversion in succession. During these stages, the droplets undergo morphological changes which lead to changes in both the heat transfer and aerodynamic properties of the droplets [3]. Fig. 1 shows the conversion stages of a black liquor droplet.
First, the black liquor droplet dries and loses its free moisture. The rate at which the material dries is controlled by the heat transfer. Thus, the droplet will dry faster at higher temperatures. Then the droplet goes through a devolatilization stage where the organic matter in the liquor degrades [3], forming various gaseous compounds from volatile substances. The result is a swollen, porous char particle, which contains about 25 % non-volatile organic coal material and about 75% inorganic salts. At this stage, the droplet volume might have increased by many folds. The final stage is char conversion, during which mostly gas phase species react with organic constituents in the char particle, converting them into gaseous species. At the end of the char
Kinetics of Devolatilization of Black Liquor Droplets in Chemical Recovery Boilers - Pyrolysis of Dry Black
Liquor Solids
S. Ramesh, A. S. Chaurasia, H. Mahalingam, and N. J. Rao
International Journal of Chemical Engineering and Applications, Vol. 4, No. 1, February 2013
2
conversion stage, inorganic material is left and it is called as smelt.
Fig. 1. Conversion stages of a black liquor droplet in a recovery boiler
In the first part of a comprehensive study on the black
liquor droplet dynamics in a typical recovery boiler, this paper presents an attempt to simulate the mass loss during the devolatilization stage of the droplet by experimental studies on the pyrolysis of dry black liquor solids in a muffle furnace for varying temperatures and residence times. A simple kinetic model, widely used in the study of pyrolysis of biomass, is employed here and the kinetic parameters are extracted from the experimental data obtained by using a two-dimensional surface fitting non-linear regression algorithm. The results of this study are essential in developing the proper design for safe and reliable operation of black liquor recovery boilers.
II. EXPERIMENTS
A. Materials and Equipment Black liquor (around 60% solids concentration) obtained
from a local paper mill, is applied as a thin film on a stainless steel tray and dried in an oven at 378 K for 24 hours. Dried black liquor solids (DBS) are collected as flakes and powdered to fine particles.
To perform the pyrolysis of dried black liquor solid samples, a laboratory scale muffle furnace fitted with a digital temperature indicator cum controller is used.
B. Experimental Procedure Experiments are carried out to determine the kinetic
parameters for gaseous volatiles released by pyrolysis of black liquor solids in the muffle furnace. The operating conditions are:
• Initial temperature: Room temperature 300 K ± 3 K. • Final temperature range: 573 – 1273 K. • Holding (residence) time range upon attaining final
temperature: 30 – 180 s.
A predefined weight of the sample is taken in a silica crucible and kept in the furnace upon attaining the final temperature for different residence times. At the end of each experiment, the crucible is weighed to determine the yield of gaseous volatiles released and char formed. Most of the experimental runs are replicated to verify the obtained values.
The representative yield of gaseous volatiles and char for different extents of residence time and temperature are given in Tables II and III.
TABLE II: EXPERIMENTAL DATA ON VOLATILES PLUS GASES YIELD AT DIFFERENT RESIDENCE TIME AND TEMPERATURES IN TERMS OF WEIGHT
PERCENTAGE OF DBS
TABLE III: EXPERIMENTAL DATA ON CHAR PLUS UNREACTED BIOMASS YIELD AT DIFFERENT RESIDENCE TIME AND TEMPERATURES IN TERMS OF
WEIGHT PERCENTAGE OF DBS
III. KINETIC MODELING Dry black liquor solids pyrolysis involves extremely
complex reactions and ends up in a large number of intermediates and end-products. Devising an exact reaction mechanism and kinetic modeling for DBS pyrolysis is extremely difficult. Kinetic parameters usually include activation energy, pre-exponential factor and order of reaction, which describe the rate of mass loss. It is necessary to understand the kinetics of pyrolysis in order to design a suitable pyrolysis reactor. A lot of work has been done in the modeling of the kinetics of pyrolysis of various biomass [4]−[12] giving rise to different reaction schemes in different times. It is worth mentioning that most of these studies focused on biomass obtained predominantly from agricultural sources where as in this study, the black liquor is an industrial waste. As such, there is little literature on the pyrolysis of dry black liquor solids.
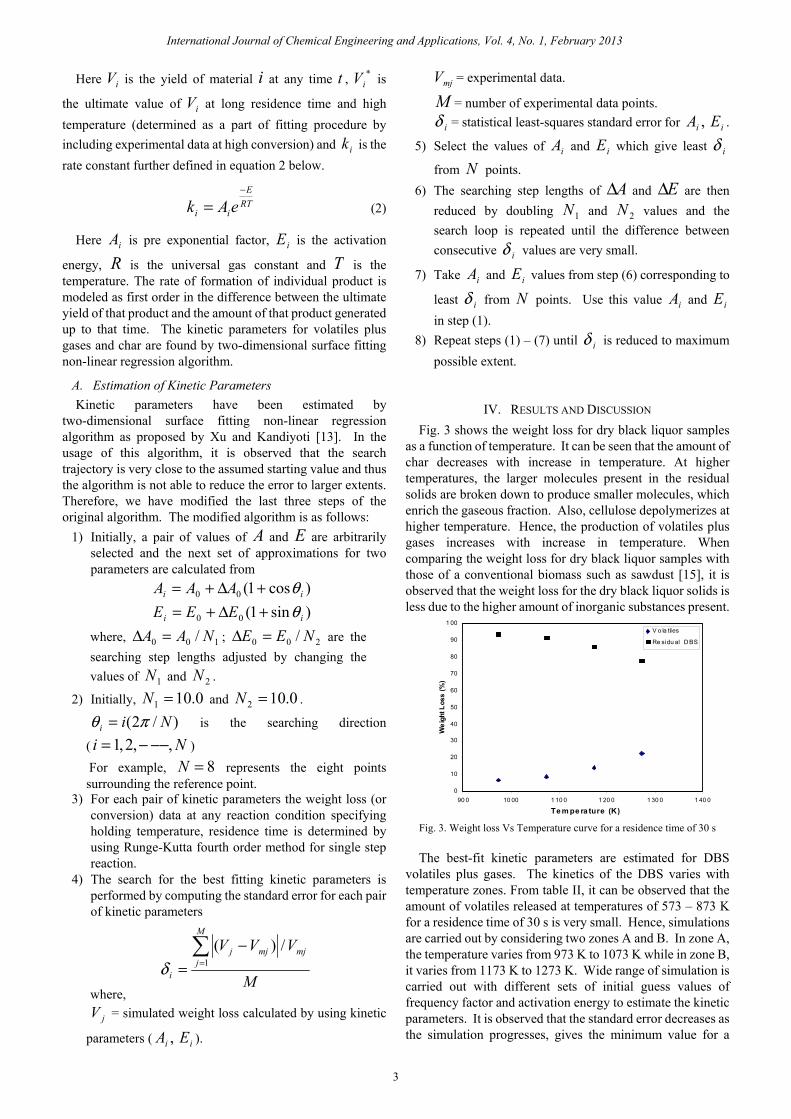
The one-stage kinetic scheme for pyrolysis of biomass given below in Fig. 2 is utilized in our study [13]. Here, the DBS gives volatiles plus gases and char as the primary pyrolysis products.
The experimental data are then fitted to the kinetic equation given by equation 1.
Fig. 2. Kinetic scheme for dry black liquor solids (DBS)
)( *iii
i VVkdtdV −= (1)
Drying zone
Char bed
Smelt
De-volatilization zone
International Journal of Chemical Engineering and Applications, Vol. 4, No. 1, February 2013
3
Here iV is the yield of material i at any time t , *iV is
the ultimate value of iV at long residence time and high temperature (determined as a part of fitting procedure by including experimental data at high conversion) and ik is the rate constant further defined in equation 2 below.
RTE
ii eAk−
= (2)
Here iA is pre exponential factor, iE is the activation
energy, R is the universal gas constant and T is the temperature. The rate of formation of individual product is modeled as first order in the difference between the ultimate yield of that product and the amount of that product generated up to that time. The kinetic parameters for volatiles plus gases and char are found by two-dimensional surface fitting non-linear regression algorithm.
A. Estimation of Kinetic Parameters Kinetic parameters have been estimated by
two-dimensional surface fitting non-linear regression algorithm as proposed by Xu and Kandiyoti [13]. In the usage of this algorithm, it is observed that the search trajectory is very close to the assumed starting value and thus the algorithm is not able to reduce the error to larger extents. Therefore, we have modified the last three steps of the original algorithm. The modified algorithm is as follows:
1) Initially, a pair of values of A and E are arbitrarily selected and the next set of approximations for two parameters are calculated from
)cos1(00 ii AAA θ+Δ+=
)sin1(00 ii EEE θ+Δ+=
where, 100 / NAA =Δ ; 200 / NEE =Δ are the searching step lengths adjusted by changing the values of 1N and 2N .
2) Initially, 0.101 =N and 0.102 =N .
)/2( Nii πθ = is the searching direction
( Ni ,,2,1 −−−= ) For example, 8=N represents the eight points
surrounding the reference point. 3) For each pair of kinetic parameters the weight loss (or
conversion) data at any reaction condition specifying holding temperature, residence time is determined by using Runge-Kutta fourth order method for single step reaction.
4) The search for the best fitting kinetic parameters is performed by computing the standard error for each pair of kinetic parameters
M
VVVM
jmjmjj
i
∑=
−= 1
/)(δ
jV = simulated weight loss calculated by using kinetic
parameters ( ii EA , ).
mjV = experimental data.
M = number of experimental data points. iδ = statistical least-squares standard error for ii EA , .
5) Select the values of iA and iE which give least iδ
from N points. 6) The searching step lengths of AΔ and EΔ are then
reduced by doubling 1N and 2N values and the search loop is repeated until the difference between consecutive iδ values are very small.
7) Take iA and iE values from step (6) corresponding to
least iδ from N points. Use this value iA and iE in step (1).
8) Repeat steps (1) – (7) until iδ is reduced to maximum possible extent.
IV. RESULTS AND DISCUSSION Fig. 3 shows the weight loss for dry black liquor samples
as a function of temperature. It can be seen that the amount of char decreases with increase in temperature. At higher temperatures, the larger molecules present in the residual solids are broken down to produce smaller molecules, which enrich the gaseous fraction. Also, cellulose depolymerizes at higher temperature. Hence, the production of volatiles plus gases increases with increase in temperature. When comparing the weight loss for dry black liquor samples with those of a conventional biomass such as sawdust [15], it is observed that the weight loss for the dry black liquor solids is less due to the higher amount of inorganic substances present.
Fig. 3. Weight loss Vs Temperature curve for a residence time of 30 s The best-fit kinetic parameters are estimated for DBS
volatiles plus gases. The kinetics of the DBS varies with temperature zones. From table II, it can be observed that the amount of volatiles released at temperatures of 573 – 873 K for a residence time of 30 s is very small. Hence, simulations are carried out by considering two zones A and B. In zone A, the temperature varies from 973 K to 1073 K while in zone B, it varies from 1173 K to 1273 K. Wide range of simulation is carried out with different sets of initial guess values of frequency factor and activation energy to estimate the kinetic parameters. It is observed that the standard error decreases as the simulation progresses, gives the minimum value for a
0
10
20
30
40
50
60
70
80
90
1 00
90 0 10 00 1 10 0 1 20 0 1 30 0 1 40 0
Te m pe ra ture (K)
Wei
ght L
oss
(%)
V o la tiles
Re sidu al D BS
where,
International Journal of Chemical Engineering and Applications, Vol. 4, No. 1, February 2013
4
particular set of initial guess value and then increases. Different sets are then compared to find the lowest possible standard error between the experimental value and model prediction as shown in Fig. 4a and Fig. 5a for zones A and B respectively of DBS volatiles. The kinetic parameters i.e. frequency factor and activation energy are then chosen from a set which has the lowest value of standard error. Fig. 4b and Fig. 5b shows the number of iterations required for frequency factor and activation energy which has lowest value of standard error for zones A and B respectively.
Fig. 4a. Standard error vs. activation energy (Arrhenius constant: 10000) in
the temperature range 973 K-1073 K
Fig. 4b. Standard error Vs Number of iterations in the temperature range 973
K-1073 K
The experimental and predicted values of gaseous volatiles for black liquor solids are shown in Table IV and Table V respectively for new values of frequency factor and activation energy which has the lowest value of standard error for zones A and B. Figs. 6 (a-d) show the comparison of experimental data and simulated results at new kinetic parameters. It is seen that predicted values are matching quite reasonably with the entire range of experimental data presented.
Fig. 5a. Standard error vs. Activation energy (Arrhenius constant :10000) in
the temperature range 1173 K-1273 K
Fig. 5b. Standard error Vs Number of iterations in the temperature range 973
K-1073 K
Fig. 6a. Experiments 1 and simulated data of volatiles Vs holding time period
at the temperature of 973k
Fig. 6b. Experim ental and sim ulated data of volatiles Vs holding time
period at the temperature of 1073k
Fig. 6c. Experimental and simulated data of volatiles vs holding time period
at the temperature of 1173k
28.6
28.8
29
29.2
29.4
29.6
29.8
30
70000 80000 90000 100000 110000 120000 130000Activation Energy J/mol
180 0.34 0.256558 0.365 0.361496 TABLE V: VOLATILES PLUS GASES YIELD AT DIFFERENT RESIDENCE TIMES AND TEMPERATURES (INITIAL GUESS VALUES: A = 104 S-1, E = 80000 J/MOL, NEW VALUES: ANEW= 114359 S-1, ENEW = 135661 J/MOL, Δ =14.14737)
V. CONCLUSIONS This paper presents the experimental investigations of the
pyrolysis of dry black liquor solids carried out at various temperatures and residence times. The kinetic scheme and two-dimensional surface fitting non-linear regression algorithm as outlined in [13] has been employed in this work to analyse the experimental data obtained over two temperature zones. The kinetic parameters have been estimated for both zones and the comparison of the experimental data with the predicted data show good agreement. It is observed that the value of kinetic parameters increases slightly with increase in the zone temperature. It is hoped that the results presented in this paper can help to predict the weight loss during the devolatilization stage of the black liquor droplets in a black liquor chemical recovery boiler.
REFERENCES [1] G. T. Austin, Shreve’s Chemical Process Industries, 3rd ed., Singapore:
Mc-Graw Hill, 1984, ch. 33, pp. 618-621. [2] M. Marklund. (October 2011). Black Liquor Recovery: How does it
[3] T. N. Adams and W. J. Frederick, Kraft recovery boiler physical and chemical processes, The American Paper Institute Inc., New York, 1988.
[4] A. Macek, “Research on combustion of black liquor drops,” in Energy and Combustion Science, vol. 25, pp. 275-304, June 1999.
[5] M. Jarvinen, R. Zevenhoven, E. Vakkilainen, and M. Forssen, “Black liquor devolatilisation and swelling - a detailed droplet model and experimental validation,” Biomass and Bioenergy, vol. 24, pp. 495-509, June 2003.
[6] N. Prakash, and T. Karunanithi, “Advances in modeling and simulation of biomass pyrolysis,” Asian J. Scientific Research, vol. 2, pp. 1-27, 2009.
[7] P. N. Sheth and B.V. Babu, “Kinetic modeling for pyrolysis of hazelnut shell: optimal parameter estimation using differential evolution (DE),” in Proc. International Symposium and 60th Annual Session of IIChE (CHEMCON-2007), Kolkata, 2007, pp. 33.
[8] P. N. Sheth, and B.V. Babu, “Kinetic modeling of the pyrolysis of biomass,” in Proc. National Conference on Environmental Conservation, BITS Pilani, India, 2006, pp. 453.
[9] M. F. Demirbas and M. Balat, “Biomass pyrolysis for liquid fuels and chemicals: a review,” J. Scientific and Industrial Research, vol. 66, pp. 797-804, October 2007.
[10] M. A. Olivella and F. X. C. D. L. Deras, “Evaluation of linear kinetic methods from pyrolysis data of Spanish oil shales and coals,” Oil shale, vol. 25, pp. 227-245, June 2008.
[11] T. Sonobe and N. Worasuwannarak, “Kinetic analyses of biomass pyrolysis using the distributed activation energy model,” Fuel, vol. 87, pp. 414-421, March 2008.
[12] B. V. Babu and A. S. Chaurasia, “Modeling, simulation and estimation of optimum parameters in pyrolysis of biomass,” Energy Conversion and Management, vol. 44, pp. 2135-2158, August 2003.
[13] B. Xu and R. Kandiyoti, “Two-stage kinetic model of primary coal liquefaction,” Energy and Fuels, vol. 10, pp. 1115-1127, 1996.
[14] M. L. Boroson, J. B. Howard, J. P. Longwell, and A.W. Peters, “Products yields and kinetics from the vapor phase cracking of wood pyrolysis tars,” AICHE J., vol. 35, pp. 120-128, 1989.
[15] L. L. Kapoor and A. S. Chaurasia, “Product Yields and Kinetics of Pyrolysis of Sawdust and Bagasse Particles,” Energy Education Science & Technology Part A: Energy Science and Research, vol. 29, pp. 419-426, 2012.
S. Ramesh is a Ph.D. scholar in the department of Chemical Engineering, Jaypee University of Engineering & Technology, Guna, M.P., India. He obtained his B.E. in Chemical Engineering from Andhra University in 1994 and has over 15 years experience in the chemical process industries. A. S. Chaurasia cal engineering from BITS Pilani in 2004. He was a post-doctoral researcher at NCL Pune and Imperial College, London. He has about 10 years teaching & research experience. Currently, he is Associate Professor, Department of Chemical Engineering Visweswaraya National Insitute of Technology, and Nagpur.
is currently an associate professor and Head, Department of Chemical Engineering, Jaypee University of Engineering & Technology, Guna, M.P., India. He secured his Ph.D. in Chemical Engineering from the National University of Singapore and was a post-doctoral researcher in France/Singapore. He obtained his B.Tech. and M.Tech. degrees in Chemical Engineering from Anna University, Chennai in 1994 & 1996 and has about 14 years of teaching & research experience. N. J. Rao is currently vice-chancellor, Jaypee University of Engineering & Technology, Guna, M.P., India. He was formerly Director of the Central Pulp & Paper research institute, Saharanpur as well as the Institute of Paper Technology, Indian Institute of Technology, Roorkee. He did his B.Tech. and M.Tech. in Chemical Engineering from the Indian Institute of Technology, Kharagpur in 1965 &1967 and was awarded Ph.D. in chemical engineering by the University of Roorkee in 1975. He has over 40 years of teaching, research & administrative experience.
H. Mahalingam
received his Ph.D. in chemi
International Journal of Chemical Engineering and Applications, Vol. 4, No. 1, February 2013