52
Kingdom of Cambodia Nation Religion King Ministry of Education, Youth and Sport Education Strategic Plan 2006-2010 December 2005
Kingdom of Cambodia Nation Religion King
Ministry of Education, Youth and Sport
Education Strategic Plan 2006-2010
December 2005

Education Strategic Plan 2006-10
i

Education Strategic Plan 2006-10
ii
ABBREVIATIONS AIDS Acquired Immune Deficiency syndrome BMC Budget Management Centre CAR Council for Administrative Reform CBCG Capacity Building Coordination Group CAR Council for Administrative Reform CG Consultative Group CLLC Community Lifelong Learning Centre CDP Cambodia Development Plan DGAF Directorate General of Administration and Finance DGE Directorate General of Education DGHE/TVET Directorate General of Higher Education and TVET ECCD Early Childhood Care and Development EFA Education for All EFMC Education Finance Management Committee EMIS Education Management Information System ESP Education Strategic Plan ESSP Education Sector Support Program ESWG Education Sector Working Group FTI Fast-Track Initiative HEI Higher education institutions HIV Human immunodeficiency virus ICT Information Communication Technology IEC Information, Education, Communication IFAPER Integrated Fiduciary Assessment Public Expenditure Review IG Inspectorate General INSET In-service training MDG Millennium Development Goals MoEF Ministry of Economics and Finance MoEYS Ministry of Education, Youth and Sports MoH Ministry of Health MoI Ministry of the Interior MoP Ministry of Planning MoWA Ministry of Women's Affairs MoLVT Ministry of Labour and Vocational Training NIE National Institute of Education MTEF Medium Term Expenditure Framework MTEP Medium Term Expenditure Plan [for education] NCSC National Council for Support for Communes NFE Non formal education NEP NGO Education Partnership NPAR National Program for Administrative Reform NPRS National Poverty Reduction Strategy PAI Public Administrative Institution PAP Priority Action Program PEEC Public enterprise with economic characteristics PDH Publishing and Distribution House PFM Public Financial Management PNTR Pupil/Non teaching staff ratio PRESET Pre-service teacher training PSTTC Pre-school teacher training college PTR Pupil teacher ratio PTC Provincial Training Center PTTC Provincial teacher training College RTTC Regional Teacher Training College SEDP Socio-Economic Development Plan TTD Teacher training department [MoEYS] TTC Teacher Training College WTO World Trade Organization

Education Strategic Plan 2006-10
iii
Content
1. Introduction: Education Sector Development Perspectives…………………..………………….1
1.1. Responding to Broader National Development Policies and Priorities……...…….……1
1.2. Overarching Policies of the Education Sector …….…….………………...…….……...1
1.3. ESP 2006-10 Formulation and Consultation Process…….…….……………..….……. 2
2. Education Sector Performance 2001-2005 ………..…….…….…...….…….…….…….…….…3
2.1. Equitable Access to Education Services …….…….………………….…….…….……3
2.2. Quality and Efficiency of Education Services …….…….…………….…….…….....4
2.3. Institutional Development and Capacity Building for Decentralisation.………..……....6
3. Strategic Framework of The Education Strategic Plan 2006/10.…….….…….… .…………...…8
3.1. Institutional Framework and the Strategies of the Royal Government of Cambodia.…..8
4. Education Policies and Strategies 2006- 2010………………………………………………..10
4.1 Equitable Access to Education Services………………………………………………..10
4.2. Quality and Efficiency of Education Services…………………..……………………..13
4.3. Institutional Development and Capacity Building for Decentralization….……………15
4.4. Strategies for Addressing Crosscutting Issues……………………………..…………..16
5. Pro-poor Financial Planning and Management…………………………………….……….18
5.1. Budgetary Forecast for the Education Sector………………………………………….18
5.2. Projected Total Financing Needs and Available Resources…………………...………19
5.3. Improved Financial Management and Monitoring Systems……………………..…….20
6. Indicative ESSP 2006-2010 Framework…………………………………………………………22
6.1. Recurrent Program Priorities…………………………………………………………..22
6.2. Capital Program Priorities……………………………………………………………...24
7. Results-Oriented Sector Performance Monitoring/Review………………………...……………27
7.1. Improved Results-Focus in Sector Monitoring…………………………….………….27
7.2. Strengthening Joint Annual Sector Performance Review Processes……….………….28
Annexes…………………………………………………………………………………...………...31
Tables………………………………………………………………………………………...……..32
Annex 1: ………………………………………………………………………………...……….... 39
Annex 2: ………………………………………………………………………………...……….... 41
Annex 3: ………………………………………………………………………………...……….... 43
Annex 4: ………………………………………………………………………………...……….... 45

Education Strategic Plan 2006-10
1
1. INTRODUCTION: EDUCATION SECTOR DEVELOPMENT PERSPECTIVES
1.1. Responding to Broader National Development Policies and Priorities
The formulation of the Education Strategic Plan 2006-10 (ESP 2006-10) reflects the high degree of responsibility the Ministry of Education Youth and Sport (MoEYS) takes in Cambodia’s development through capacity building and human resources development. This ESP 2006-2010 has been drawn up based on the lessons learnt from the implementation of ESP 2001-05 as well as the recently revised results of ESP 2004-08 in order to build realism and applicability. Capacity building and human resource development is one of the main strategies of the Rectangular Strategy of the Royal Government of Cambodia in the third mandate of the National Assembly. MoEYS continues to put emphasis on education quality improvement at all levels, Basic, Post Basic and Higher Education. The policies and strategies presented in the ESP 2006-10 are notable in order to accelerate the speed of education reform towards achieving all defined targets in the National Development Strategic Plan 2006-10, Cambodia Millennium Development Goals, and the Education for All National Plan 2003-2015. Emphasis is also put on strengthening the partnership between the public and private sectors for more effective resource mobilization and utilization.
1.2. Overarching Policies of the Education Sector
The MoEYS vision is to establish and develop human resources of the very highest quality and ethics in order to develop a knowledge-based society within Cambodia. The MoEYS mission: In order to achieve the above vision, MoEYS has the mission of leading, managing and developing the Education, Youth and Sport sector in Cambodia in responding to the socio-economic and cultural development needs and the reality of globalization. The Ministry’s long-term mission is to ensure that all Cambodian children and youth have equal opportunity to access quality education consistent with the Constitution and the Royal Government’s commitment to the U.N convention on the Rights of the Child, regardless of social status, geography, ethnicity, religion, language, gender and physical form. The Ministry envisages a time when graduates from all its institutions will meet international and regional standards and will be competitive in the job markets worldwide and act as engines for social and economic development in Cambodia. An overarching objective of the MoEYS is to achieve the holistic development of Cambodia's young people for all sectors. In addition, the Ministry intends to engender a sense of national and civic pride, high standards of morals and ethics and a strong belief in being responsible for the country and its citizens. Ministry of Education, Youth and Sport has defined three main policies as follows:
- Equitable Access to Education Services.
- Quality and Efficiency of Education Services.
- Institutional Development and Capacity Building for Decentralisation.

Education Strategic Plan 2006-10
2
1.3. ESP 2006-10 Formulation and Consultation Process
Experiences from the implementation of education reform through Sector Wide Approach (SWAp) have provided good results in the process of consultation between the Royal Government of Cambodia (RGC), donors, NGOs and other stakeholders in the ESP formulation. The shift from donorship to partnership and towards government ownership demonstrates good collaboration from all stakeholders. The Ministry has been successful in establishing partnerships in the context of harmonization of external assistance. A clear and scheduled consultation mechanism has been established through the Joint Technical Working Group (JTWG) in Education, which consists of MoEYS officials, inter-ministerial officials and staff as well as Donors and NGOs represented in the Education Sector Working Group. In order to establish and achieve the education policies and strategies for the future, MOEYS has initiated consultation processes:
- Within MoEYS itself and with its provincial offices to ensure that this ESP is formulated with the intention of achieving targets mentioned in the Education for All national plan 2003-2015.
- With line ministries, especially with the Ministry of Planning, to ensure that this ESP responds to the Rectangular Strategy of the Royal Government of Cambodia;, contributes to the National Strategic Development Plan (NSDP) 2006-2010; and corresponds to the National Poverty Reduction Strategy (NPRS) as well as the Cambodia Millennium Development Goals (CMDGs).
- With the Ministry of Economy and Finance, to ensure that the budget envisaged in this ESP 2006-2010 will be realistic, sufficient and supported.
- With the Council for Administrative Reform (CAR), to ensure that the process of the education sector reform will actually respond to the public administrative reform objectives, both regarding educational staff employment and salary scale arrangements.
- With stakeholder ministries, to ensure that all related inter-ministerial issues will be strongly taken into account, especially HIV/AIDS, disability and Gender issues.
- With JTWG, to ensure that the views of donors and NGOs active in the field of education are heard.
Four regional meetings were conducted on the ESP (in combination with the ESSP) formulation to enable all levels to be informed of the key priority policies as well as to provide input to the programmes. The ESP 2006-2010 will be officially approved and distributed nationally, produced as a CD in both Khmer and English and published on the MoEYS website (www.moeys.gov.kh).

Education Strategic Plan 2006-10
3
2. EDUCATION SECTOR PERFORMANCE 2001-2005
This section summarizes what the Cambodian education sector has achieved in terms of access, quality and institutional/capacity development against the indicators and targets set out in the ESP 2004-2008. 2.1. Equitable Access to Education Services
Table 1 and Figure 1 below show that primary net enrolment ratio (NER) nearly achieved the set target of 92% for total and 91% for female. It is worth noting that the NER increases were especially significant in rural and remote areas. Comparing school year 2000-01 with school year 2004-05, nationally and in rural areas NER rose by more than 8 percentage points, in remote areas the rise was over 20 percentage points, while the increase in urban areas during the same period was around 5 percentage points. The expansion in access to lower secondary has also been significant with over 66% more students being enrolled in 2004-05 than in 2000-01. However, this expansion has fallen short of the ambitious target of 40% NER by the 2004-05 school year (see Figure 1). An examination of student numbers in each primary grade leading up to lower secondary indicates that a more comprehensive assessment of expected primary completion and transition rates should be used to inform future lower secondary targets. That said, in remote areas NER remains low at 3.90%, i.e. that more than 95% of children aged 12-14 from these areas are not enrolled in secondary schools within their districts, which implies that there still exists an acute shortage of secondary school in these areas. Among 1,621 communes in the country, only 749 have lower secondary schools. At upper secondary level, expansion of access has been slow as well: NER there increased by only 1.6 percentage points in the past five years. Access to non-formal and higher education has not reached the levels envisaged in the ESP 2004-08, as Table 1 indicates. It should be noted, however, that the number of students enrolled in private higher education institutions has been increasing rapidly: private enrolment more than doubled from 18,000 to nearly 39,000 in the past five years, while public institutions recorded less than 10% enrolment increase during the same period. In fact, the number of female fee-paying students in higher education surpassed the pre-defined target of 10,800 in the 2004-05 school year. In order to achieve the yearly targets of the ESP and eventually meet the longer-term goals of CMDG and EFA, greater efforts are required, especially in further boosting coverage of and access to post-primary education. Table 1: Actual achievement against target on equitable access
Indicator Actual 2000-01
Actual 2004-05
Target 2004-05
Total Female Total Female Total Female Admission rate 76.4% 74.9% 81.0% 79.5% 90% 90%
Net enrolment ratio Primary: nationwide Primary: urban area Primary: rural area Primary: remote area Lower secondary: nationwide Lower secondary: urban Lower secondary: rural area Lower secondary: remote area Upper secondary
83.8% 86.4% 84.1% 62.3% 16.6% 29.5% 14.1%
1.2% 7.7%
80.7% 83.2% 81.0% 58.2% 13.7% 26.8% 11.0% 1.0% 5.4%
91.9% 91.6% 92.4% 82.5% 26.1% 41.3% 23.7%
3.9% 9.3%
90.7% 90.4% 91.2% 79.4% 24.8% 40.5% 22.2%
4.1% 7.9%
92% 95% 92% 76% 40% 50% 35% 15% 15%
91% 94% 91% 75% 39% 49% 34% 15% 14%

Education Strategic Plan 2006-10
4
Transition rate To lower secondary To upper secondary.
77.3% 56.2%
71.1% 57.9%
81.9% 56.1%
79.6% 58.0%
87% 64%
85% 66%
Number of students in NFE/CLLC programs (full time equivalent)
- - 141,561 80,171 220,000 132,000
Number of students in public higher education institutions - Number of scholarship students
7,291
-
1.890
-
7,953
…
2,802
…
20,000
8,500
6,000
3,000 Number of private supported students in higher education
18,125 5,060 38,882 12,685 49,000 10,800
Number of students in teacher training 8,302 3,377 6,520 2,512 10,000 3,600
0%
10%
20%
30%
40%
50%
60%
70%
80%
90%
100%
Total Urban Rural Remote Total Urban Rural Remote Total
Primary Lower Secondary UpperSecondary
Figure 1: Actual achievement vs. target in NER in SY2004-05
Actual
Target
2.2. Quality and Efficiency of Education Services
Table 2 below shows the achievement of several indicators related to quality and efficiency of education against the targets set out in the ESP 2004-2008. As a system for standardised learning assessment has yet to be established measuring actual achievement in quality and outcomes of teaching and learning is a challenge. However, some proxy indicators show that progress has fallen far short of the set targets. For instance, grade promotion rates are much lower than the target, especially in grade 1, and with the current pace of progress, achieving the long-term targets will not be viable (see Figure 2). Similarly, repetition rates continue to be high, again particularly in grade 1, and progress has been slow. During the past five years the rates decreased only by 4.9 percentage points, 1.5 percentage points and 2.8 percentage points in grade 1, grade 2, and grade 3 respectively. With this rate, meeting the long-term EFA goals is not possible. On the other hand, significant improvement in the education level of teaching staff has occurred in the past five years, as Table 2 also shows. The proportion of teachers who have at least lower secondary diplomas increased from 26% in the 2000-01 school year to 36% in the 2004-05 school year. This advancement does not live up to the ESP target of 51% however. In any event, in order to measure systematically the progress in quality and efficiency of education services, it is necessary to develop and collect better sets of indicators and data. Introduction of a standardized student learning assessment system as well as school report cards is expected to enable more rigorous and systematic monitoring of the quality of education services from the 2006-07 school year onwards.

Education Strategic Plan 2006-10
5
Table 2: Actual achievement against target on quality and efficiency
Indicator
Actual 2000-01
Actual 2004-05
Target 2004-05
Pupil teacher ratio- Primary
- Lower secondary - Upper secondary
53.318.325.3
53.5 27.7 29.4
51.026.028.0
Total(1999-00)
Female Total(2003-04)
Female Total FemalePromotion rateGrade 1Grade 2Grade 3
60.9%71.5%73.9%
60.9%72.4%75.0%
64.8%73.4%77.3%
65.4% 74.8% 78.9%
88% 89% 88%
88%89%89%
Total (1999-00)
Female Total (2003-04)
Female Total FemaleRepetition rateGrade 1Grade 2Grade 3
28.5%17.6%15.0%
27.5%16.4%13.5%
23.6%16.1%13.2%
22.4% 14.4% 11.3%
6% 5% 5%
6%4%5%
Expenditure on core instructional materials per pupil (Riels)
- - 5,800
Number of incomplete primary schools 2,484 1,934 1,800% of teachers attending grades 10-12
or above26.0% 36.0% 51%
Number of new remote/difficult teacher postings
- … 4,500
Number of students passing grade 12 examination
17,713 18,883 25,000
Number of students re-entering grades 3-9
… … 30,000
% of accredited public/private HE institutions
- … 15%
No. of schools/TTCs with new science and ICT facilities
- … 10
0%
10%
20%
30%
40%
50%
60%
70%
80%
90%
Grade 1 Grade 2 Grade 3 Grade 1 Grade 2
Promotion Rate Repetition Rate
FIGURE 2: ACTUAL ACHIEVEMENT VS. TARGET IN PROMOTION AND REPETITION RATES
Actual
Target
Grade 3

Education Strategic Plan 2006-10
6
2.3. Institutional Development and Capacity Building for Decentralisation
In terms of institutional development and capacity building, the following are major achievements in the past five years:
- A cohesive planning and implementation mechanism of capacity building activities established through the Capacity Building Coordination Groups (CBCGs) under both DGE and DGAF
- Education Law drafted and submitted for approval to the National Assembly - Capacity building programs expanded to decentralized levels (provinces, districts, and
schools) in financial reporting, program monitoring, and information management - The use of ICT extended through MOEYS website, advocacy campaigns, and management
information systems (MISs) - Functions of the Internal Audit Department strengthened and sample audits for provincial,
district and school BMCs conducted - Development of ECE, basic education, and life skills indicators standards for monitoring
and evaluating the quality. - Results-based sector performance monitoring strengthened based on EMIS and other data - Regulations for budget management and execution under preparation - Consultative meetings with province and districts especially on PAP management and
implementation regularly organized - Technical capacity in developing and implementing new curriculum strengthened at central
and provincial levels - Planning and management skills and knowledge enhanced among school principals and
school cluster staff - Capacity in examination administration and management strengthened - Understanding of the concept and practice of child-friendly schools extended at central,
provincial, district and school levels - The management system of some PAPs revised - Coordination between the Government and donors and NGOs strengthened through regular
meetings of the Joint Technical Working Group (JTWG) for Education
Table 3 below shows some quantitative results related to institutional development and capacity building against targets set out in the ESP 2004-08, mostly concerning financial performance. Firstly, the education sector share of total government budget substantially increased from 13.9% in 2000-01 to 17.3% in 2004-05, although the share is still short of the ESP target of 19.5%. The PAP share within total education budget also increased rapidly in the past five years from 5.5% to 27.9%. The share has nearly reached the ESP target. Another indicator for which data is available is staff share of total education staff. It shows no decreasing trend in the past five years, however. In order to assess the results of sector-wide capacity and institutional development efforts more systematically it will again be essential to identify additional sets of indicators. The ESP 2006-2010 and the ESSP 2006-2010 should provide an improved monitoring framework that enables more rigorous and regular assessment of individual, organizational and institutional capacity of the education sector as the indicators have been revised.

Education Strategic Plan 2006-10
7
Table 3: Actual achievement against target on institutional development and capacity building
Indicator Actual 2000-01
Actual 2004-05
Target 2004-05
Education share of total government recurrent budget
13.9% 17.3% 19.5%
Non personnel share of total recurrent spending
… 43% 40%
Priority Action Program share of total education budget
5.5% 27.9% 29%
Expenditure on monitoring of PAP in billion Riels
… 3.6 6.8
Disbursement rate for recurrent priority programs
… 69% 93%
Number of operational BMCs - % of BMCs with trained accountancy staff - % of BMCs with ICT-based MIS
64……
194……
230 20% 40%
Number of BMCs subject to internal audit annually - % of schools/institutions audited annually
…
…
…
…
60
5% Non teaching staff share of total education sector workforce*
18.1% 18.8% 16%
* Excluding central staff
0%
5%
10%
15%
20%
25%
30%
Education share of total governmentrecurrent budget
Priority Action Program share of totalrecurrent education spending
Figure 3: Actual achievement vs. target on education sector financing
Actual
Target

Education Strategic Plan 2006-10
8
3. STRATEGIC FRAMEWORK OF THE EDUCATION STRATEGIC PLAN 2006/10
3.1. Institutional Framework and the Strategies of the Royal Government of Cambodia
The Rectangular Strategy of the Royal Government of Cambodia plays an important role in supporting the implementation of the political platform of the Royal Government in the third legislature of the National Assembly. The Rectangular Strategy is an integrated structure of interlocking rectangles, as follows: 1) enhancement of agricultural sector; 2) further rehabilitation and construction of physical infrastructure; 3) private sector development and employment generation; and 4) capacity building and human resource development. The Royal Government regards good governance as the core of the Rectangular Strategy. The MoEYS is in particular involved with the rectangle’s fourth part concerning Capacity Building and Human Resources Development: Enhancing capacity of human resources with high technical and scientific skills that effectively respond to labour market needs in term of entrepreneurship, high creativity, responsibility, discipline, morality, virtue, professional ethics, and honesty in an effort to promote development. In addition, the first rectangle on improving the agricultural sector includes life skills development which is also of concern for the Ministry. The successful implementation of the strategies laid out in this paper is dependent on the larger on-going reforms within the public administration. The Public Financial Management Reform aims at achieving higher standards of management and accountability in government spending and revenue collection. MoEYS is committed to improving its financial management and monitoring systems of ESP programs and it anticipates being a pilot ministry for the PFM reform. The Public Administrative Reform focuses on delivering public services to the people with quality and effectiveness and on creating a neutral, transparent, professional, responsive and responsible civil service. Special attention will be on moving public administration closer to the people consistent with strategy of decentralization and de-concentration and with the transfer of authority from upper to lower levels of the bureaucracy. This measure shall be facilitated by a clear definition of the roles, powers and responsibilities of the various authorities at the levels of the province, city, district and commune, as well as the introduction of information technology. Another aspect of this reform is to gradually raise the salaries of all civil servants by 10 to 15 per cent per year.

Education Strategic Plan 2006-10
9
These general reforms are essential in order for the MoEYS to achieve its ambitious goals set out in the ESP/ESSP 2006-10, as for example increasing staff remuneration and improving performance monitoring and accountability of operational budgets. The Royal Government recognizes that moving authority closer to the people can improve the quality of public services and increase participation. Key priorities in local governance are to build local management capacity, to provide reasonable levels of financial resources to the communes.
Education Strategic Plan 2006-10
10
4. EDUCATION POLICIES AND STRATEGIES 2006- 2010
The Ministry of Education, Youth and Sport recognizes that although there were significant efforts in the last few years, education sector performance could not reach the policy targets set in ESP 2001-05 as well as in ESP 2004-08. In the period of ESP 2006-10 the Ministry commits itself to achieving the existing priority policies, which are consistent with EFA 2003-15, the Cambodia Millennium Development Goals 2015 and the National Strategic Development Plan 2006-2010. The priority policies in the ESP 2006-10 are as follows: 1) ensuring equitable access to education; 2) increasing quality and efficiency of the education services; and 3) institutional development and capacity building for decentralization.
4.1 Equitable Access to Education Services
The second Cambodian Millennium Development Goal is to achieve universal 9 year basic education with the three targets set at 1) ensuring all children complete primary schooling by 2010 and basic schooling by 2015 2) eliminating gender inequality in 9 year basic education by 2010 3) reducing significantly gender inequality and disparity between urban and rural areas in upper secondary education and tertiary education. Further the Royal Government is committed to achieving the goals of “Education for All” ensuring nine years of basic education for all children. It will expand access to further education to youth from poor families by providing scholarships to students from poor families and constructing school buildings. The focus of these goals is on access to education and this is one of the major challenges for the Royal Government. Another priority of the ESSP 2006-2010 is to take early and urgent action to expand education and training opportunities for the number of young people aged between 12 and 24 years who currently are school drop-outs or have limited access to post- primary education and training opportunities. Strategies to achieve the outcome and targets of the Equitable Access policy:
Expand access to ECE programmes for 5 year olds targeted on those communes with low new admission rates and high repetition rates in primary schools.
• Target: Progress review of effectiveness of ECE strategy in 2008.
Ensure entry of all 6 year olds into primary school by performing regular population census and by issuing a decree and guidelines for 6 years as age of entry to primary school.
• Target: Decree and guidelines issued for 6 years as age of entry into primary school, linked with expanded ECE for 5 year olds in 2006.
• Target: Impact survey of new decree and implications for ECE strategy in 2010.
Reduce parental costs barriers (such as informal payments) by increasing operational budgets for schools and teachers’ salaries.
• Target: Abolish informal payments in grade 1-9 nationwide by the end of 2008.
• Target: Regulations and guidelines issued for the management and accounting of any contributions from parents by 2008.
• Target: Review of overall primary and secondary school budget outturns 2006-10 in 2010.

Education Strategic Plan 2006-10
11
Reduce repetition and drop-outs levels in all grades, with the priority for improvements in grades 1–6 by improved and more relevant school curriculum, expanded and more effective remedial classes during the school year, alongside periodic and continuous student assessment and standards monitoring.
• Target: Guidelines and action plan issued for grades 3-9 school re-entry programs for school dropouts in 2006.
• Target: Progress review of grades 3-9 re-entry programs in 2008.
• Target: Impact study on re-entry program and implications for future expansion and targeting in 2010.
Enable Greater Private/Community involvement in all stages of schooling in order to increase understanding of importance of education as well as achieving greater transparency and accountability in the structures.
• Target: Study on the involvement of commune councils and parent committees in school activities in 2008.
Continued provision of new schools or additional facilities to incomplete primary schools as well as locating school facilities closer to home thus reducing direct and opportunity costs for families.
• Target: Facilities development plan for primary schools, including incomplete schools in 2006.
• Target: Progress review of facilities coverage in 2008.
• Target: Impact study of the effectiveness of the facilities development in 2010.
Increase enrolment of students in grades 7-9 by constructing lower secondary school facilities in currently under-served areas.
• Target: Facilities development plan for grades 7-9 in 2006.
• Target: Progress review on grades 7-9 expansion, including review of targeting criteria, in 2008.
• Target: Impact review on grades 7-9 expansion in 2010.
Increase enrolment of students in grades 10-12 by constructing upper secondary school facilities in currently under-served areas.
• Target: Facilities development plan for grades 10-12 in 2006.
• Target: Progress review on grades 10-12 expansion, including review of targeting criteria, in 2008.
• Target: Impact review on grades 10-12 expansion in 2010.
Ensure teacher provision in remote and disadvantaged areas by recruiting teacher trainees from these areas through particular recruitment criteria. Improve the efficiency of staff deployment by provision of additional incentives for teachers working in disadvantaged, remote or ethnic minority areas, for example by constructing teachers’ houses.

Education Strategic Plan 2006-10
12
• Target: Action plan for introduction of multi-grade teaching and other strategies in border, remote and/or ethnic minority areas in 2006.
• Target: Action plan for deployment and redeployment, including appropriate incentives, of teaching and non-teaching staff to understaffed and new schools, in 2006.
• Target: Progress review on the staff deployment strategy in 2008.
Ensure widely expanded provision of quality upper secondary education based on merit and result of grade 9 examinations, in response to the needs for national development, and local, regional and global labour market.
• Target: Impact review of post-secondary admissions in 2010.
Increase the number of scholarships for youth from poor families, especially girls, to ensure their access to primary, secondary and post-secondary schools and introduce new merit-driven support programs for post-basic students from poor families, girls, ethnic minorities and other disadvantaged groups. Ensure better poverty targeted primary school feeding and grades 7-9 incentives programs.
• Target: MoEYS/MoEF agreement on Government contributions for scholarship programs for grades 1-12 in 2006.
• Target: Report on the amount of money given to each HEI against the number of non-fee paying students accepted in 2006.
• Target: Expansion of scholarship program for secondary and post-secondary students in 2008.
• Target: Impact study of program in 2010 by poverty/gender enrolment patterns.
Expand provision of quality higher education with equity through promoting public/private partnerships and through institutional and financial reforms that allow reforms for greater operational autonomy and income generating authority for higher education institutions.
• Target: Plan for phased expansion of higher education institutions in 2008.
• Target: All public higher education institutions transferred to become Public Administrative Institutions by 2008.
• Target: Impact study of HEI expansion programs including expansion of provincial HEIs in 2010.
Expand public/NGO/ community partnerships in non-formal education in border, remote and disadvantaged areas as well as increased support for provision of local life skills and vocational training and basic/required professional skills responsive to the needs of the social and labour market.
• Target: Progress review of youth skills training in 2008.
• Target: Progress review of NFE programs in 2008.
• Target: Impact study of the NFE programs in 2010.

Education Strategic Plan 2006-10
13
4.2. Quality and Efficiency of Education Services
As important as improving access to education is improving the quality and efficiency of the education services provided. In order to do this an accountable and effective institutional and governance framework that ensures standards improvement and quality services needs to be put in place at central, provincial, and district and school level. Previous ESP reviews have put focus on the importance of teacher remuneration. The ESP 2006-2010 proposes increases in teacher remuneration and quality oriented priority programs (e.g. instructional materials, teacher development and service efficiency). These programs will be linked to a range of measures that demand stronger accountability (e.g. staff performance appraisal), improved transparency and a greater focus on achieving results. Strategies to achieve the outcome and targets of the policy:
Increase service remuneration and incentives linked to performance by agreeing on a reform plan for teacher salary/allowances against performances and responsibilities in co-operation with MoEF.
• Target: Agreed plan with MoEF and CAR on yearly increases in classroom teacher salary/allowances against agreed criteria and responsibilities in 2006.
• Target: Joint MoEYS/CAR/MoEF review of the effectiveness of remuneration reform and agreed follow-up actions in 2008.
• Target: Impact study of the impact of educational staff remuneration reform on service quality and effectiveness in 2010.
Improve the quality of teaching and learning through nationwide implementation of child-friendly school and school readiness programs aimed at holistic development of schools including inclusive education, child-centred teaching and learning, conducive and gender-responsive learning environment, family/community participation and effective education management systems.
• Target: Child-friendly school policy and national CFS operational plan formulated
and adopted in 2006. • Target: CFS programs initiated in all 24 provinces by school year 2007-08.
Increase the schools’ and training institutions’ operational autonomy and accountability
regarding operational budgets and decisions on programs by establishing new financial planning and accountability mechanisms for school operating budgets in primary and secondary schools, with guidelines for involvement of joint school, parents and community management as well as expanding internal audit operations to cover selected departments.
• Target: Revised guidelines and performance indicators for use of operational budgets, including budgets in 2006.
• Target: Progress review on the effect of increased budget allocations on school and institutional performance in 2008.

Education Strategic Plan 2006-10
14
Implement the new Curriculum Policy, including Primary and Lower Secondary education curriculum, with a focus on learning achievement standards at Grades 3 and 6 and 9 and the introduction of Local Life Skills Programs.
• Target: Full implementation by 2007.
• Target: Progress review on the new curriculum policy in 2010.
Improve pre-service and in-service teacher development and introduce staff performance appraisal systems at every level of the education system, including appropriate reporting procedures.
• Target: Action plan for expanding INSET provision, including delegating greater authority to provinces for INSET planning in 2006.
• Target: Finalize revised teacher supply and demand strategy, including revised roles of TTCs and measures to improve TTC staff and facilities efficiency in 2006.
• Target: Progress review of INSET programs, including impact on teacher effectiveness and need for additional TTCs in currently under-served provinces in 2008.
Strengthening teaching and learning quality to ensure primary and secondary teachers with pedagogy and ICT awareness.
• Target: Train 5,000 teachers at all levels per annum, with ICT training included in their training from 2006.
• 10,000 new teachers trained at all levels since 2006, with ICT training included in their training.
• 10,000 new teachers trained at all levels since 2008.
Implement the minimum standards of student achievement for grades 3, 6 and 9 nationwide, assure a shared understanding of minimum standards amongst teachers, parents and other stakeholders and follow up on the results of the tests in the nationwide school report cards.
• Target: Public dissemination of the results of the standard testing from 2005-06.
• Public dissemination of the results of the yearly standard testing by mid 2008 onward.
Increase transparency and improve performance monitoring and accountability of teachers, schools and post-secondary institutions by disseminating the result of students' achievements to the public and education authorities at all levels, and through a clear definition of the roles and responsibility of education inspection and inspectors at central, provincial and district levels. The role of commune councils in school performance monitoring and oversight should be promoted.
• Target: Action plan for introducing improved performance monitoring systems with instructions on oversight responsibilities in 2006.
• Target: Public dissemination of the status of HEI standards met in public and private institutions in 2008.
Education Strategic Plan 2006-10
15
• Target: Development of education quality standards for all aspects to ensure effective performance in 2006.
• Target: Report to National Assembly on progress in improving education standards at all levels including MoEYS’ role in quality assurance in 2010.
• Target: Enforcement of the criteria for establishing HEIs and the accreditation of all HEIs gradually by 2010 for quality assurance.
4.3. Institutional Development and Capacity Building for Decentralization
Improving the performance of all stakeholders involved in providing education services is essential in order to achieve the targets set out in ESP. The Ministry’s on-going policy priority is to enable greater delegation of authority and responsibilities to provincial, district, commune and school level. Central MoEYS departments will increasingly implement policy and strategy development and sector and program performance monitoring. A priority for ESP 2006-10 is to consolidate and extend measures that build up capacity for decentralized education service management at province, district and school level.
The proposed broadening and deepening of public/private partnership will also necessitate systematic institution and capacity building. Another strategic priority will be to secure predictability of program financing from public, private, community and external sources. In order to re-assure these various stakeholders, the Ministry will give priority to strengthening governance, accounting and internal audit systems.
Strategies to achieve the outcome and targets of the policy:
Provide a clearly defined legislative, regulatory framework to the sector and the sub-sectors through the adoption of the Education Law by end of 2006.
• Target: Adoption of Education law by end of 2006.
Improved predictability for Medium term financial planning and decentralized management and improved Governance and Regulatory Systems by increasing transparency and accountability of resources, including external assistance.
• Target: Council of Ministers and MoEF approve a five-year recurrent and capital expenditure framework for education within MTEF by 2006. Update on budget execution in the Joint Government-Donor Working Group in every three months.
• Target: Progress review on the financial performance by government/MoEYS in 2008.
• Target: Progress review on donor budget support to assist financial predictability in 2008.
Strengthening education system performance monitoring and impact systems, including ESP-ESSP review processes.
• Target: Annual action plan for each PAP drawn up by each technical department made available to stakeholders.
• Target: Follow-up of policy actions throughout the year through reporting on progress in the JTWG-Ed every 6 months.

Education Strategic Plan 2006-10
16
Strengthening Central, Provincial and District Financial Monitoring Systems by increased access to training for BMCs.
• Target: Prepare comprehensive capacity building programme for all BMCs in 2006 to strengthen their program and financial planning, monitoring and audit skills, especially in public accounting.
• Target: Central, provincial and district BMCs produce comprehensive program- and financial reports as a basis for internal audit in 2006.
• Target: Enabling Ministry-wide system of public accounting of Government funds for education by 2008.
Assuring that all designated Budget Management Centres (BMC) become operational and effective, and that District and School/Institutional Management Systems are enhanced to ensure quality education.
• Target: Prepare training programme for provincial, district and school levels in management in 2006.
• Target: Preparation of revised guidelines for district BMCs and schools in management responsibilities in 2006.
Strengthen personnel management and monitoring systems.
• Target: Implementing ICT based central and provincial personnel MIS, in co-ordination with CAR, in 2006.
• Target: Develop action plan for ICT based information management at all levels in 2006.
Improved Higher Education Institutional Development and Capacity through institutional and financial reforms that allow greater operational autonomy and income generating authority for higher education institutions.
• Target: A strategic plan for Higher Education developed by 2008, including capacity building for HE Department and the management of information systems.
4.4. Strategies for Addressing Crosscutting Issues
When implementing the policies and strategies in this ESP special attention needs to be given to certain issues in order to assure that the measures reach also the weaker groups in society. Therefore, additional measures to provide education and training in the border areas, including measures to address the vulnerability of out-of-school youth to cross-border social problems, including HIV/AIDS and child labour and trafficking, and to ethnic minorities, need to be incorporated. An equal balance of gender at all levels of MoEYS management is encouraged. A strategy of affirmative action will be utilized when it comes to promotion and training opportunities within the Ministry. In the same way, MoEYS strives for increasing the number of girl students at all levels of schooling, in conformity with the CMDGs. Table 1: Crosscutting Issues and Strategies of the ESP
Cross-Cutting Issues ESP Strategy and Interventions Gender Specific gender policies and strategies, drawing on MoEYS gender mainstreaming committee
recommendations, guided by MDG equity targets Ethnic minorities Targeted facilities programs and curriculum reform for ethnic minorities; special incentives
for minority area staff deployment

Education Strategic Plan 2006-10
17
Disabled learners Formulation of national policy and strategies to assure equitable access to education opportunities including specific program interventions e.g. school buildings designs, specialized teaching/ learning materials
HIV/AIDS Specific HIV/ AIDS policy and strategy paper, incorporating targeted interventions for HIV/AIDS, sexual health and reproductive care, and drugs awareness raising for in-school and out-of-school youth and for vulnerable groups (e.g., cross-border areas)
Environment/Sanitation Rigorous environmental impact assessment as part of facilities planning program; inclusion in Life Skills curriculum for schools and teacher training colleges
Information Communication Technology (ICT)
New MoEYS ICT policy and strategy framework, focusing on initial interventions in upper secondary schools and TTCs and partnership with private ICT providers
Border Areas Specific border areas education strategy being developed, including service expansion as means of reducing vulnerability (e.g., HIV/AIDS, drugs, infectious disease, child labour, and trafficking)
Part of the Ministry's crosscutting strategy is to carefully integrate education, youth development, physical education and sports strategies as part of ESP and ESSP. Key strategies will include: 1) expansion of civics and moral education in the curriculum; 2) extension of student volunteer contributions, such as peer tutoring, village literacy tutoring; 3) student part-time assistance for village health care support, kindergarten class support, and helping the aged, 4) promotion of volunteers campaigns from the universities, teachers colleges and upper secondary schools to offer their skills to rural and remote areas, particularly in non-formal education and literacy; and 5) expansion of physical education programs and community sports facilities nationwide. As part of this strategy, MoEYS intends to forge new partnerships with the private sector, community groups and international community.

Education Strategic Plan 2006-10
18
5. PRO-POOR FINANCIAL PLANNING AND MANAGEMENT
5.1. Budgetary Forecast for the Education Sector
The long-term policy goal for education financing is that no potential students will be excluded from access to education and training opportunities due to inability to pay formal or informal charges or contributions. A fair and equitable financing mechanism must therefore be put in place taking account of affordability to Government, parents and other potential contributors. It is also important to ensure sufficient information to all contributors to education costs in order for them to effectively judge on the value of current and future investments in the sector. An associated objective is to forge accountability on Government, parents, private sector and individual service users in the financing of education at all levels. The ESP 2006-10 is based on an analysis of recurrent and capital unit costs as well as on projections of total operational recurrent and capital costs designed in order to optimize the use of public and non-public education resources.
Table 2: Medium Term ESP Financing Plan, 2006-2010
(million riels) 2005 2006 2007 2008 2009 2010
Total Recurrent Expenditures 399,487 449,423 550,872 600,260 667,826 717,895
- Personnel costs 244,294 280,988 369,345 401,996 461,984 504,712
- Non personnel costs 155,193 168,435 181,528 198,264 205,842 213,184 Total Capital Expenditures 113,400 98,920 91,440 84,000 82,000 Grand Total 562,823 649,792 691,700 751,826 799,895
The overriding principle within the ESP is that the education budget will be a pro-poor instrument targeting an increased share and volume of recurrent and capital expenditure on the poorest communes and for areas where there is under-enrolment, particularly of girls. Key financing tables are attached in Tables A-E.
The key features are:
1) Increased Government spending on basic education with the percentage of recurrent spending on basic education, where the participation of the poorest is the greatest, increasing from 68% to 71% over the period (from Riels 306 billion in 2006 to around Riels 507 billion by 2010, mainly for increasing school operational budgets.) Target: 20.85% share of discretionary recurrent spending with 70% share for basic education. 2) Sustained capital spending on basic education facilities development and selective capital spending on post-basic facilities development. Building additional primary and secondary schools for the poorest, underserved areas, amounts to around 2/3 of projected capital spending. The capital budget for these programs is over Riels 470 billion (around Riels 93 billion/year). (see Table B). Target: around Riels 100 billion per annum, including basic education share of around 75%. 3) Reduction/elimination of parental contributions to basic education costs, Table C. The share of spending by parents for basic education is projected to fall from the current estimated level of 14.8% to 12.5% especially, on uniform, tuition fees and transportation over the period. Increase in per student spending by Government on basic education projected from 251,000 Riels/student/year to 335,000 Riels by 2010. This significant increase in overall per student spending will also help implement quality improvement strategies, despite the proposed enrolment expansion. The overall projections in enrolment growth, which underpinned the financial analysis, are shown in Table A.

Education Strategic Plan 2006-10
19
4) Phased performance-based pay reform, linked to access and quality improvements, Table D. The elimination of informal contributions, offset by improved performance-based teacher salaries and allowances is designed to create a climate within which Government and communities are prepared to hold school directors and teaching and non-teaching staff accountable. The priority is to substantially increase classroom teacher remuneration and allowances, including the expanded priority action program, guided by broader Government pay reform, in order to create a more effective institutional framework for pro-poor access, as well as quality improvement. Personnel costs are projected to increase from Riels 281 billion in 2006 to around Riels 504 billion by 2010, alongside continuation of special incentives under a priority action program. The projected decrease in non-personnel cost share from 37% in 2006 to 30% by 2010 is designed to enable a more balanced and effective financing strategy. To assure optimum impact of the projected remuneration strategy, pay rises will be rigorously linked to more efficient deployment, introduction of annual staff performance appraisal as a basis for pay rises and promotion and strengthened teacher supervision at the school level. 5) Increased non-Government/private spending share on higher education, alongside targeted Government scholarships and waivers for the poor. Target: minimum 40% non-public spending shares by 2008, including Government contributions to salaries and scholarships from 2006.
6) The plan for external assistance is to extend the mix of modalities including recurrent budget support, capital investment and technical assistance. Appropriate modalities will be negotiated on the basis of effectiveness in implementing ESP policies. The high transitional recurrent costs of the proposed reforms argue for a greater share of budget support within the external assistance program. Target: 50% of external assistance for education in budget support ranged Riels 75-125 billion per annum. 7) Demand-led development funds for higher education and MoEYS staff accommodation through greater public/private partnerships. Capital spending on upper secondary and higher education facilities expansion is estimated Riels 170 billion over the next five years. The MoEYS recognizes that implementing the strategies for higher education will require a continued contribution from parents, communities and the private sector. The financing plan projects an increasing share of spending by parents at this level, but with scholarships provided for successful students from poor families. The Ministry will regulate user charges for post-secondary education. Target: 25% of capital spending through such facilities.) The Ministry’s policy for capital spending on education will be to strengthen policy linkage through an increasingly demand side approach to investment, especially for post-basic education services. An associated policy is, on the other hand, to enable equitable access to capital development to both public and private providers, with eligibility criteria based on agreed policy priorities.
5.2. Projected Total Financing Needs and Available Resources
The Ministry recognizes that effective implementation of ESP policy and strategy will require predictability of available resources. The Ministry will therefore continue to work closely with the Ministry of Economy and Finance and CAR to ensure that medium term expenditure planning for education is consistent with the broader MTEF process and ongoing public financial management reform. Strengthening both MoEYS and inter-ministerial collaborative mechanisms, in particular between MoEYS and MoEF through the Education Finance Management Committee (EFMC) at both policy and technical levels will also be a focus.

Education Strategic Plan 2006-10
20
The Ministry will make every effort to ensure that the projected recurrent budget requirements are derived from Government revenues and other resources. The Government commitment to increase spending on education is evidenced by the increased education share of recurrent expenditure, which is currently around 17.3% in 2004/05. In order to assess the realism and sustainability of the ESP financing plan, the Ministry has drawn on broad macro-economic and MTEF projections shown in Table E. It is projected that the education share of recurrent spending will need to be immediately increased and sustained at around 20.85% over the ESP 2006-10 period, primarily to facilitate front-loaded increases in performance based teacher remuneration. As part of the ESP design, the Ministry has prepared an alternative scenario, which is based on stagnation in the education budget at 17.74% up to 2010 (see table 3).
Table 3: ESP Financing Scenarios
(Riels Billions) 2006 2007 2008 2009 2010
Projected Current Expenditures 2,534 2,866 3,047 3,238 3,443
ESP Projection % Education Share 17.74% 19.22% 19.70% 20.62% 20.85%
Alternative Scenario: %Education Share 17.74% 17.74% 17.74% 17.74% 17.74%
Alternative Scenario: Potential Shortfall 0 43 60 93 107 On this basis, the alternative scenario projects a potential recurrent budget shortfall of around 303 billion Riels over the next five years. The Ministry would therefore seek an increase in policy-led recurrent budget support from the international community in order to mitigate any risk of financing shortfalls in order to secure a predictable financial base for the sustained ESP reforms. The projected overall capital budget requirements amount to around 470 billion Riels over the next five years. Once again, the Ministry will make every effort to secure increased capital expenditure from Government while recognizing the current financial constraints. The Ministry would anticipate significant support from the donor community to fill this potential shortfall with a broad target of 50% external assistance for budget support and 50% for facilities development and capacity building. Overall, against the alternative Government financing scenario, the potential total financing gap could amount to around 773 billion Riels (US$ 193 million) over the ESP 2006-10 implementation period. In other words, the total potential financing gap could amount to around 155 billion Riels per annum (US$39 million). In order to ensure greater predictability of external assistance, the Ministry proposes a number of measures including: a) confirmation from donors and NGOs on budget providing for the current programming implementation; b) early negotiation on additional assistance as part of the ESP/ESSP review process; and c) negotiation on greater flexibility in the mix of external assistance modality to cover transitional costs of reform. As part of the process, the Ministry will seek the further cooperation and commitment from the ESWG and NEP for attaining EFA FTI status.
5.3. Improved Financial Management and Monitoring Systems
The current Government financial systems will be consolidated and extended as part of ESP 2006-10, with particular emphasis on further improvements in financial management, accounting and audit procedures. The Ministry will ensure transparency and accountability of all sources of

Education Strategic Plan 2006-10
21
financial support for education, including external assistance, and will closely monitor and report on expenditures, as well as on releases and disbursements. The Ministry proposes that the following recurrent financial planning management mechanisms are used for the various priority programs, including:
Education service pay reform programs and performance incentive schemes.
Improved guidelines on budget use for Provincial and district education service monitoring.
That central MoEYS department and post secondary institutions operational budgets be
managed through specific and delegated budget allocations.
Majority of priority action programs of sub-sectoral, institutions and provincial budget allocations?
Budget allocations to provincial and sub-sectoral of scholarship programs implementation
for the poor, alongside additional support under the capital budget framework.
The Ministry recognizes that the proposed financial management/monitoring system for ESP 2006-10 may have to be adjusted over the next five years and anticipates a gradual shift to broader program-based budgeting and management systems. As a designated priority ministry, MoEYS anticipates being a pilot ministry for any PFM reforms related to line ministries. The details of both recurrent and capital priority programs are outlined in Section 6. The Ministry has gained significant experience and capability in managing capital programs, especially for school construction and capacity building technical assistance. It is anticipated that the management of these programs will be designed on a case-by-case basis, including greater decentralization of facilities development finance to the provinces. The Ministry will also investigate with potential donors the scope for developing pooled funding and management arrangements for facilities programs in order to optimise existing facilities management capacity within MoEYS. The Ministry proposes significant expansion of capacity building in financial monitoring systems and procedures as part of ESP 2006-10. Focus will be on strengthening provincial and district accounting and reporting systems through the new PFMIS; improving coordination and consolidation of program financial reports within central MoEYS directorates and departments; and on expanding internal audit operations for BMCs and programs, with a target of annual audit of around 200 units. Financial management, including audit and accounting, of these capacity building programs will continue to be designed on a case-by-case basis, depending on the scale and complexity of the programs, in negotiation with donors and NGOs. Once again, the Ministry's guiding principle will be to use Government financial planning and management systems. MoEYS’ Finance Department and, in some instances, individual MoEYS departments will have increased use of dedicated accounts in the Government Treasury. The Ministry intends to broaden the scope of the financial performance report prepared as part of the ESSP review process. The target will be to provide up-to-date information on disbursement and spending for all recurrent/capital priority programs, including provincial disaggregating. In addition, the performance report will incorporate key features including: a) a summary of recommendations and internal audit findings; and b) an analysis of trends and impact related to pro-poor and pro-gender equity expenditures.

Education Strategic Plan 2006-10
22
6. INDICATIVE ESSP 2006-2010 FRAMEWORK
6.1. Recurrent Program Priorities
The five years of ESP implementation achieved significant success in directly linking policy and strategic priorities with a number of recurrent priority programs and budget allocations. These priority programs also set out results and performance indicators as a basis for policy and program monitoring. Some support from donors/NGOs for various activities supporting the ESP/ESSP plan are not included in the funds budgeted below. The Ministry recognizes that a number of medium term crosscutting strategies need to be implemented and expanded depending on resources available. It is proposed that the important HIV/AIDS, infectious diseases and drug addiction prevention, sanitation, and nutrition awareness program will be managed through the capital budget mechanism in collaboration with other stakeholder ministries. It is envisaged that the ECE and scholarships for the poor program could be further expanded through parallel capital budget support. The education service efficiency program outcome will be to ensure equitable access to education services through eliminating informal payments by parents in grades 1-9, offset by improved and performance based staff remuneration. Another outcome will be the improved equity and efficiency in the deployment of teaching and non-teaching staff, responding to targeted expansion of primary and secondary education opportunities. The main activities include performance-based incentives to key groups, including school directors, staff working in remote and difficult circumstances and double shift and multi grade teachers. The MoEYS will review guidelines for targeting and allocation of these allowances. The program will be initially managed through provincial BMCs based on agreed staffing regulations with monitoring by Head Quarter Personnel Department with phased delegation to district education offices. The early childhood education (ECE) program outcome will be to expand equitable access to ECE programs especially for 5 year-old children, targeted on those communes with low net admission rates and high repetition rates in primary schools. The broad strategic direction will be to expand community-based and home-based approach, which offers better prospects of increased coverage and affordability than the current pre-school system. It is anticipated that this program will be complemented by other donor and NGO financed pilot innovations, including commune council managed ECE initiatives and alternative parental home-based approaches. The Department of Early Childhood Education will have responsibility for strategic oversight and quality assurance. The primary education access, quality and efficiency improvement program outcome will be to enhance access, quality and efficiency through continuing to increase Government support for school operational costs, alongside the provision of remedial classes and the expansion of child-friendly schooling. The first component will be to gradually expand provision of school operating budgets for primary schools nation wide. The second component will be the development of child-friendly schools in all provinces, thirdly strengthening the quality of teaching-learning through remedial classes every Thursday and constantly helping the students during class, especially those who didn’t have reception class. The Department of Primary Education will manage the overall monitoring of the program. The lower secondary education access, quality and efficiency improvement program objectives will be to reduce access barriers for students, and improve quality and efficiency through increased grades 7-9 survival and grade 10 transition rates. The first component will be to further offset direct costs to families through increased school operating budgets for lower secondary schools nation-wide. This component will be complemented by the scholarships/incentives program (PAP

Education Strategic Plan 2006-10
23
12) to provide poverty-targeted scholarships for grades 7 to 9 students to further reduce the cost burden on poor families. The second component will be to strengthen teaching/learning capacity through strengthening of the grade 9 examination systems, introduction of minimum standards on student assessment, introduction of the school performance monitoring and report card system, and remedial classes for under-performing students. This program will be linked to planned expansion of lower secondary facilities and teacher deployment and training reforms. Program funds will be managed and channelled to schools by over 185 district BMCs. The HQ Department of Secondary Education will manage the monitoring of the program.
The upper secondary access and equity program’s primary objectives will be to assure equitable access to upper secondary education and to ensure that proposed user charges are no barriers for academically promising grade 9 graduates from poor families. The first component of this program will be to provide poverty indexed operating grants to upper secondary schools primarily for instructional materials and school maintenance against agreed guidelines. The second component will be continuous extension of Academically Gifted Students program through specific subjects teaching and instructional material procurement. Funds will be managed through new school /community governing bodies, channelled through provincial BMCs. The HQ Department of Secondary Education will manage the monitoring of the program. The higher education access and equity program objective will be to enable increased participation in higher education by highly motivated students from poor families through the use of government-funded merit driven scholarships. Priority target groups will be poor students graduating from the model and rural secondary schools qualifying for admission into Phnom Penh-based universities. Some priorities will be given to students enrolling for less market oriented and more socially beneficial programs, especially education, health, agriculture, science and mathematics education (RUPP/NIE). This program will be linked to the proposed higher education capital development fund and possible introduction of a higher education student loan scheme. The funds will be directly managed through selected higher education institutions, against agreed annual scholarship allocations. Department of Higher Education will be responsible for accreditation quality assurance and monitoring1. The teacher development program objective will be to ensure an efficient supply of basic cycle and upper secondary school teachers for system expansion and to upgrade TTC trainers, school directors and other key MoEYS personnel. A second objective will be ensuring that TTC intakes and subsequent trained teacher deployment respond to growing demands in rural/remote and disadvantaged areas, especially by recruiting teacher trainees from remote and ethnic minority areas. A third objective will be to provide in-service teacher training. The first component will be to provide annual operational budgets to the Centre of Preschool and Pedagogic, 18 PTTCs, 6 RTTCs, and six new resource centres. The second component will be TTC staff development. The third component will be capacity building of primary and secondary school directors and the fourth will be continuous teacher development through various in-service training programs. Operational budgets of individual institutions channelled appropriately through provincial BMCs and central Teacher Training Department. The Department of Teacher Training will be responsible for quality assurance and monitoring. The sustainable supply of core instructional materials program aims to ensure adequate provision of textbooks nationwide and to offer schools a choice of textbooks in each subject. The program contributes to the achievement of policy objectives on the improvement of the quality of primary and secondary education through ensuring timely and sufficient provision of quality learning materials. This will enable the implementation of the new learning standards in grade 3, 6 and 9 1 Department of Higher Education will collaborate with ACC for accreditation.

Education Strategic Plan 2006-10
24
based on the Policy for General Education Curriculum Development 2005-09. The program aims to provide budget allocations to primary and lower secondary schools for instructional materials procurement to maintain a student/textbook ratio of 1:1. Program funds will be managed and channelled to schools by over 185 district BMCs. The Pedagogical Research Department (PRD) will manage the monitoring of the program. The non-formal education expansion program outcome will be to provide cost efficient re-entry and targeted complementary schooling and programs and selected non-formal community literacy and skills development programs. The primary target group will be students who have dropped out of school for less than three years, alongside severely vulnerable groups in remote, minority and border areas. The first component will be operational budget support for expansion of re-entry programs for school dropouts and update curriculum and textbook. The second component will be operational funding for expanded complementary education and life skills. The Department of Non Formal Education will be responsible for program quality assurance and monitoring. The youth and sport development program objective is to ensure the development of healthy youth by ensuring access to the development of socio-economics and culture. The first activity will be to prepare of detailed youth policy, strategy and programs including partnership and institutional arrangements. The second activity will be to continue training programs for specialist physical education staff and coaches/referees. The third activity will be to continue identifying priorities for new and upgraded sports playing fields, especially in under-served rural areas. A further activity will be to facilitate cooperation with the private sector in funding international, regional and national sports competitions. The departments under Directorate General of Youth and Sport will be responsible for this program through each BMC. The strengthened monitoring systems program’s first objective will be to improve technical and financial monitoring at all levels for strengthened policy, strategy and program development, management and evaluation. A priority activity over the period will be to strengthen capacity for financial management, accounting and internal audit. In addition, the program aims to enhance sector performance monitoring through strengthening the quality assurance standard, sector efficiency and stakeholders’ participation. The program will be managed through central BMCs in the Finance, Planning and Internal Audit departments/offices. Program monitoring and quality assurance will be a joint responsibility of Directorate General of Administration and Finance and Inspectorate General. The secondary schools scholarships program objectives will be to ensure increased education opportunities for students with high academic merit from the poorest and disadvantaged families, especially girls and ethnic minorities, through a gradual increase in the number of targeted scholarships for the poor. The first component will be to provide scholarships for disadvantaged poor groups for grades 7-9. The second component will be to provide merit driven scholarships for the poor in both urban and rural schools, based on the poverty indexes with higher stipends for model school admission. The Directorate General of Education will delegate this work to HQ departments in charge of planning, management and accounting. The Provincial Education Offices will form student scholarship management teams to manage and monitor their activities with technical support to schools and communities.
6.2. Capital Program Priorities
The key Ministry objective will be to strengthen the linkage between recurrent and capital budget programs through review of planning preparation and management and monitoring.

Education Strategic Plan 2006-10
25
The capital investment programs for 2006-10 are detailed in the table below, including facilities development and logistical support with equipment for experiments and ICT and staff development and capacity building. In addition, the Ministry expected additional support from donors, NGOs to fulfil the shortage such as ECCD, HIV/AIDS awareness, infected disease, drag abuse, hygiene, nutrition, and incentive and scholarship program for the poor. A key feature of this investment is the expansion and efficient use of basic-education facilities in order to meet growing demand and enable Education for All. Another key feature is to meet the access and quality improvement at upper secondary through facilities investment against the needs. Another key feature is to enable demand led growth of Higher Education by strengthened public-private partnership. Table 4: Projected Capital Investment Budget, 2006-2010
The incomplete school expansion program outcome will be to reduce drop out and to improve progression in incomplete primary schools, especially annex schools and those in remote and disadvantage areas. The main activities will be to construct 1, 2 or 3 classroom blocks and provide furniture. The program will be linked to strategies including staff deployment and incentives, targeted programs for poor students (e.g. school feeding), use of multi-grade or double-shift teaching and strategies for expanding equitable access throughout basic education. The indicative costs will be Riels 11 billion over the 5-year period. The lower secondary school expansion program outcome will be to enable sufficient grade 7-9 capacities for projected demand increases over the 5-year period. The first component of this program will be to create basic education schools offering grades 1-9 in existing primary schools with under-utilized facilities. The second component will be to provide new grade 7-9 facilities in un-served communes at existing primary school sites. The third component of the program will be demand-based expansion of existing grade 7-9 facilities. The final component will be to provide dormitory and grade 7-9 facilities in areas with low or sparse populations (e.g. ethnic minority areas). The broad strategy of facilities provision will be to provide around 50% of the ministry's standard classroom designs in urban areas and around 50% of mini-school designs in rural and remote and disadvantage areas. The indicative costs will be Riels 125 billion over the 5-year period. The upper secondary school expansion program outcome will be to enable sufficient grade 10-12 capacity for projected demand increases over the 5-year period. The first component will be to establish 30 model schools through upgrading existing upper secondary schools covering all 24 provinces. These model schools would provide high standard facilities and teaching staff. The second component will be to gradually expand the number of rural upper secondary facilities through a mix of expanding existing schools and provision of additional schools in underserved
Component Riels (Million)
US$ (US Million)
01 Incomplete School Expansion 11,000 2.8 02 Lower Secondary Expansion 125,000 31.3 03 Upper Secondary Expansion 100,000 25.0 04 Science, Technology and ICT Facilities Expansion 21,960 5.5 05 Education Staff Development 32,800 8.2 06 Education Staff Accommodation 20,000 5.0 07 HE Facilities Development Fund 49,000 12.3 08 Capacity Building Program 110,000 27.5 - Program Management and Monitoring 55,000 13.8 - Sector Wide Management 55,000 13.8 Total: 469,760 117.4

Education Strategic Plan 2006-10
26
areas with high potential demand. The indicative costs will be Riels 100 billion over the 5-year period. The science, technology and ICT facilities expansion program has the main objective of enhancing quality education outcomes through provision of appropriate specialist teaching and learning facilities. The program will provide these facilities in upper secondary schools and higher education institutions. The indicative costs will be Riels 22 billion over the 5-year period. The education staff development program will have the main outcomes of enabling increased quality of teaching, greater responsiveness to changing sub-sector teacher demand and improved education strategic and financial planning and management. The first component of this program will be the introduction of mini teacher training facilities in the six provinces without PTTCs in order to accommodate any re-training of basic cycle teachers needed. The second component will be to upgrade NIE, RTTCs and PTTCs to more flexible response to MoEYS staff development and teacher training needs, alongside addition of specialist facilities and classrooms (e.g. science, maths, technology/ICT and foreign languages). The indicative costs will be Riels 33 billion over the 5-year period. The education staff accommodation program will have the outcome of facilitating increased deployment and retention of staff, particularly in remote or difficult areas, through the provision of incentives, including a housing loan scheme and highly selective MoEYS provided accommodation possibly focusing on housing for transferable provincial directors of education. The indicative costs will be Riels 20 billion over the 5-year period. The HE facilities development fund program will have the main outcome of expanding nationwide access to public and private higher education institutions. This program will be to create a HE development financing facility for access by both public and private institutions, alongside development of eligibility criteria. The indicative costs will be Riels 49 billion over the 5-year period. The program management/monitoring capacity building program will have the main outcome of continuing to strengthen MoEYS capability at HQ and provincial levels to monitor and evaluate the progress and impact of education reforms. The main activities will be to continue improving processes, training and other capacities (e.g. increased use of ICT) of HQ and provincial level staff in monitoring and evaluation techniques. The monitoring programs will be managed through a number of departmental BMCs for various programs. The estimated cost is around Riels 55 billion over the 5-year period. The sector wide management capacity building program will have the main outcome of continuing to strengthen planning, management and monitoring systems for the various priority programs. Capacity building will include organizational development, equipment, other logistical support, advisory services and training programs for MoEYS departments, provincial and district authorities and schools. The budget management centre for the capacity building programs will be the Capacity Building Coordination Groups (CBCGs) within the respective directorates. The cost of the program is an estimated Riels 55 billion over the 5-year period.

Education Strategic Plan 2006-10
27
7. RESULTS-ORIENTED SECTOR PERFORMANCE MONITORING/REVIEW
7.1. Improved Results-Focus in Sector Monitoring
A key lesson learned from the past ESP implementation is the need to prioritize and simplify the policy action matrix and targets in order to enhance the focus of the reform agenda. It is also hard to predict the time needed for policy actions to translate into outcomes in a yearly basis. Policy and strategic targets setting therefore should be seen as an articulation of the spirit and ambition of education reform and should be used as targets for evaluation on trends in sector performance. ESP 2001-05 and ESP 2004-08, incorporated performance indicators and policies as measures for achieving equitable access, quality improvement and effectiveness of education service and institutional development and capacity building for decentralization. The revised performance monitoring framework in ESP 2006-10 is incorporated some changes such as (i) indicator of access to non-formal training, (ii) quality and efficiency indicator of re-entry program, teacher merit and deployment, institutional and student learning performance, (iii) institutional development indicator related to accounting and auditing at BMCs including staff development. The revised ESP policy monitoring matrix lay out in the table below. Table 5 : ESP Policy Monitoring Matrix
Dimensions Key Indicators 1. Equitable Access (with gender targets)
National, provincial and district enrolment trends Gender and urban/rural enrolment balance Representation of students from poorest families Number of incomplete primary schools Basic education student progression rates Basic education student repetition rates Net intake of age 6 in primary grade 1 Higher education enrolment patterns Pre-service teacher training enrolment
2. Education Quality and Efficiency
Student performance standards in primary grades 3 and 6, lower secondary grade 9 and upper secondary grade 12
Availability of instructional materials and trained teachers Pupil-Teacher Ratio CFS coverage by province Quality standards available for all levels of education Remote difficult school teacher postings Number of students re-entering grades 3-9 Proportion/Number of teachers with grades 10-12 or above Coverage of science, technology and ICT facilities
3. Institutional Development and Capacity Building
Education budget volume and share Basic education spending share Priority programs spending patterns and disbursement Coverage of internal audit system Salary and non-salary allocations and spending ratios Percentage of teachers qualifying for merit payments Teaching and non-teaching staff deployment rates Operational capacity of budget management centres MoEYS output from various training programs Number of accredited public/private higher education
institutions Enrolment in public/private accredited HEI
Selected performance targets are defined in the sector performance matrix showing key milestones over the period 2006-2010 (see Annex 2).

Education Strategic Plan 2006-10
28
The ESP 2006-2010 monitoring process is designed to strengthen linkages with broader governance and accountability strategy. Therefore MoEYS will provide a range of more specific reports to various stakeholders, including: a) an annual report to the National Assembly; b) provincial education performance reports; c) individual program progress reports; d) departmental activity reports; e) specially commissioned operational research; and f) annual internal audit reports on BMCs, schools and programs. MoEYS recognizes that a limitation of the past ESP monitoring processes has been insufficient evidence of school and student performance standards. The proposed introduction of nationwide school report cards and nationwide student testing at selected grades will address this issue. The Ministry will publicly disseminate information on school/student standards in order to inform parents and other decision makers as well as strengthened stakeholders. The organization of the ESP monitoring system will be based on the following levels of responsibility:
Sector Implementation Monitoring: by the District Education Office officers, School Support Committee, and Commune National EFA Committee.
Program Progress Monitoring: by provincial education officers, especially planning office
and inspection office, and Provincial Finance Office, and technical departments within MoEYS for priorities program and its other program.
Sector Performance Monitoring: by Education Inspectorate in cooperation with Planning
Department, National EFA Committee, Technical Departments and Concerned Organizations within MoEYS.
Program Impact Monitoring: by Planning Department in cooperation with individual
central MoEYS departments, and Concerned Organizations.
System Performance Audit: by Administration and Finance Inspectorate, Audit Department and National Audit Authority.
The finding during ESSP 2005-09 review are capacity in planning, information management on
limited performance. In other hand, performance reporting is not on time and incomplete, especially financial report. So that, the priority is to strengthen and expend capacity building in planning, information management based information technology at all level, especially at district level, school, and remote, border, disadvantaged areas.
7.2. Strengthening Joint Annual Sector Performance Review Processes
Before the annual ESSP and ESP review, Ministry commits to leading a transparent joint sector performance monitoring and reporting. The prime objective of the ESSP review process is to report on the annual progress to achieve the targets set out in the ESP/ESSP strategies. It is also an opportunity to learn lessons for policy- and strategic adjustments if needed and a forum for collaborative work planning with donors, NGOs and other stakeholders. The Ministry is therefore committed to strengthen ongoing consultative mechanisms with donors, NGOs and other stakeholders. So that ESP review will continue coordinating approaches in the flexible rolling program reform. In addition to the education sector review, the Ministry continue strengthening other consolations including the following:

Education Strategic Plan 2006-10
29
The Joint Technical Working Group (JTWG): meet every 2 months with donors and NGO representatives to provide progress monitoring reports on key issues and agree on necessary actions.
Strengthening coordination arrangements with high level Government and donor groups,
through progress reports and meetings with the Social Sector Working Group and National Council for Social Development as part of Consultative Group preparation.
Strengthened Capacity building for Planning Department is the most important especially
in reporting such as 1) annual education performance report 2) annual donors report and 3) annual NGOs report.
National EFA committee is also one of organization in strengthened education performance
monitoring. National EFA committee needs to prepare annual EFA report focusing on inter-coordination for each program such as ECCD, and the committee activities in all levels. This report will be included in inter-ministries planning and governance report. Ministry will review the schedule for and annual provincial and national meeting in order to link with the ESSP review.
Experience gained from ESSP review in past years gave the good opportunity for discussion and negotiation with donors and NGOs on external assistance now and in future. So that, ministry of education proposed the use ESP review for the forum for coordination and smooth to the program formulation, and evaluation of the donors and individual NGOs. Such implementation will reduce important transactional cost of the various program implementations of the donors and NGOs.

Education Strategic Plan 2006-10
30
Broader National Dev’t Framework - Rectangular Strategy of the Government
- Public Finance Management Reform - Public Administration Reform
- Decentralization - CMDGs, NSDP, EFA
Equitable Access to Education Services
- Broad policy statement and major outcomes
- Main strategies and targets
Institutional Development and Capacity Building for Decentralisation
- Broad policy statement and major outcomes
- Main strategies and targets
Quality and Efficiency of Education Services
- Broad policy statement and major outcomes
- Main strategies and targets
ESP Policy Priorities
For each PAP and Education Facilities Development Program:- Objectives and justification - Key indicators and targets - Strategy and coverage - Main programs and activities - Program management and monitoring - Financing plan - Capacity building needs - Policy Actions
Priority Program
Education
Service Efficiency
Priority Program
Primary
Education Quality and Efficiency
Priority Program
Lower
Secondary Education
Access, Quality & Efficiency
Priority Program
Upper
Secondary Education Access and
Equity
Priority Program
Higher
Education Quality,
Efficiency, and Equity
Priority Program
Continuous
Teacher Education
Priority Program
Core
Instructional Materials
Priority Program
Non-formal Education Expansion
Priority Program Youth and
Sport Development
Priority Program
Early
Childhood Education
Priority Program
Strengthened Monitoring
Systems
Priority Program Secondary
Scholarship for the Poor
Education Facilities
Development Program
Institutional Development and Capacity
Building
PAP Education Service Efficiency
PAP Primary
Education Quality and Efficiency
PAP Lower Secondary Education Access, Quality & Efficiency
PAP Upper
Secondary Education Access and
Equity
PAP Higher
Education Quality,
Efficiency, and Equity
PAP Continuous
Teacher Education
PAP Core
Instructional Materials
PAP Non-formal Education Expansion
PAP Youth and
Sport Development
PAP Early Childhood Education
PAP Strengthened Monitoring
Systems
PAP Secondary
Scholarship for the Poor
Education Facilities
Development Program
Institutional Development and Capacity
Building
Priority Action Program: PAP
ESSP 2006-10
ESP 2006-10

Education Strategic Plan 2006-10
31
Annexes
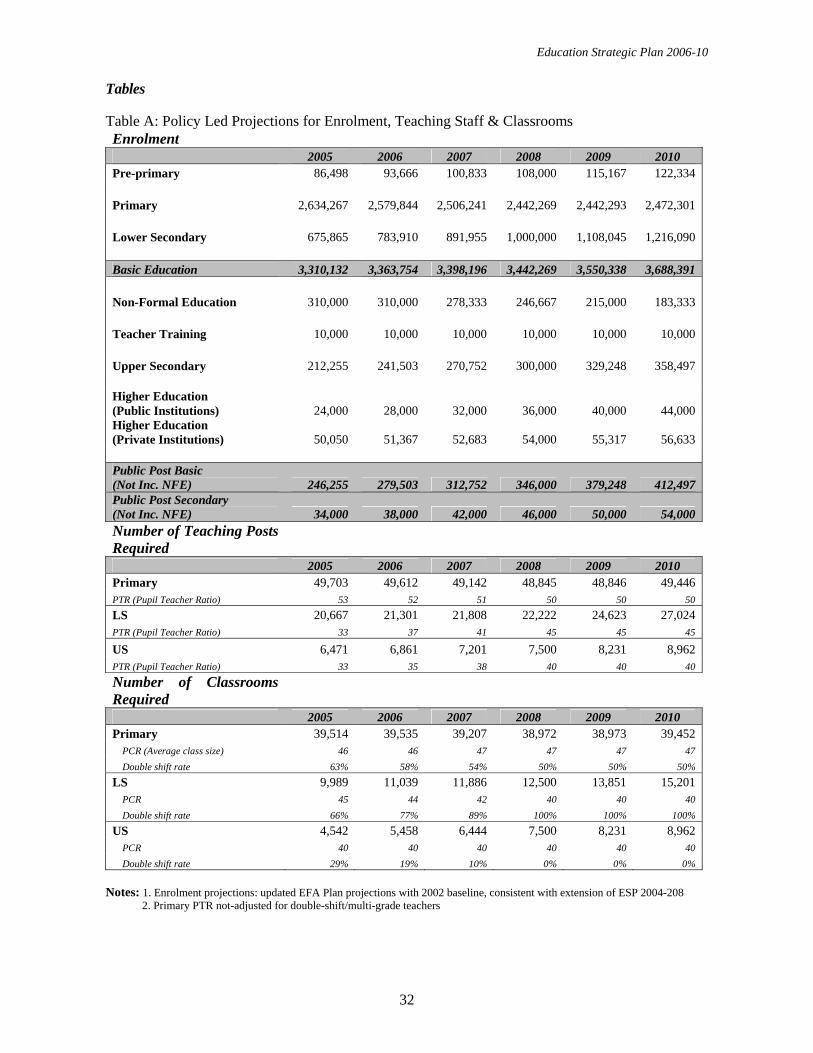
Education Strategic Plan 2006-10
32
Tables
Table A: Policy Led Projections for Enrolment, Teaching Staff & Classrooms Enrolment 2005 2006 2007 2008 2009 2010 Pre-primary 86,498 93,666 100,833 108,000 115,167 122,334 Primary 2,634,267 2,579,844 2,506,241 2,442,269 2,442,293 2,472,301 Lower Secondary 675,865 783,910 891,955 1,000,000 1,108,045 1,216,090 Basic Education 3,310,132 3,363,754 3,398,196 3,442,269 3,550,338 3,688,391 Non-Formal Education 310,000 310,000 278,333 246,667 215,000 183,333 Teacher Training 10,000 10,000 10,000 10,000 10,000 10,000 Upper Secondary 212,255 241,503 270,752 300,000 329,248 358,497 Higher Education (Public Institutions) 24,000 28,000 32,000 36,000 40,000 44,000 Higher Education (Private Institutions) 50,050 51,367 52,683 54,000 55,317 56,633 Public Post Basic (Not Inc. NFE) 246,255 279,503 312,752 346,000 379,248 412,497 Public Post Secondary (Not Inc. NFE) 34,000 38,000 42,000 46,000 50,000 54,000 Number of Teaching Posts Required 2005 2006 2007 2008 2009 2010 Primary 49,703 49,612 49,142 48,845 48,846 49,446 PTR (Pupil Teacher Ratio) 53 52 51 50 50 50 LS 20,667 21,301 21,808 22,222 24,623 27,024 PTR (Pupil Teacher Ratio) 33 37 41 45 45 45
US 6,471 6,861 7,201 7,500 8,231 8,962 PTR (Pupil Teacher Ratio) 33 35 38 40 40 40
Number of Classrooms Required 2005 2006 2007 2008 2009 2010 Primary 39,514 39,535 39,207 38,972 38,973 39,452
PCR (Average class size) 46 46 47 47 47 47 Double shift rate 63% 58% 54% 50% 50% 50%
LS 9,989 11,039 11,886 12,500 13,851 15,201 PCR 45 44 42 40 40 40 Double shift rate 66% 77% 89% 100% 100% 100%
US 4,542 5,458 6,444 7,500 8,231 8,962 PCR 40 40 40 40 40 40 Double shift rate 29% 19% 10% 0% 0% 0%
Notes: 1. Enrolment projections: updated EFA Plan projections with 2002 baseline, consistent with extension of ESP 2004-208 2. Primary PTR not-adjusted for double-shift/multi-grade teachers

Education Strategic Plan 2006-10
33
Table B: Total MoEYS Funding
(Riels Millions) 2006 2007 2008 2009 2010 Total Recurrent 449,423 550,872 600,260 667,826 717,895
Administration 70,069 71,795 74,455 76,176 78,060 Centre 30,822 27,298 23,959 24,593 25,292 Provinces 16,975 18,699 20,685 21,155 21,669 Districts 22,272 25,798 29,811 30,428 31,099
Broad sub-sectors 379,354 479,077 525,805 591,649 639,835 Pre-primary 7,137 9,722 11,269 12,999 14,394 Basic Education 306,474 386,562 421,825 471,744 507,983 Non Formal Education 10,760 11,609 13,205 13,751 12,771 Teacher Training 11,742 12,686 13,227 13,421 13,499 Post Basic (US & HE) 43,240 58,498 66,279 79,734 91,188
Recurrent Shares Pre-primary 2% 2% 2% 2% 2% Basic Education 68% 70% 70% 71% 71% Non Formal Education 2% 2% 2% 2% 2% Teacher Training 3% 2% 2% 2% 2% Post Basic (US & HE) 10% 11% 11% 12% 13% Total admin 16% 13% 12% 11% 11%
Admin HQ 7% 5% 4% 4% 4% Admin Provinces 4% 3% 3% 3% 3% Admin Provinces 5% 5% 5% 5% 4%
(Riels Millions) 2006 2007 2008 2009 2010 Total Capital 113,400 98,920 91,440 84,000 82,000
Administration 30,000 20,000 20,000 20,000 20,000 Centre 7,500 5,000 5,000 5,000 5,000 Provinces 22,500 15,000 15,000 15,000 15,000
Broad sub-sectors 83,400 78,920 71,440 64,000 62,000 Basic Education 30,000 29,000 27,000 25,000 25,000 Education Staff Development 13,500 11,600 9,700 9,000 9,000 Post Basic (US & HE) 39,900 38,320 34,740 30,000 28,000
Broad programmes 113,400 98,920 91,440 84,000 82,000 Expansion 83,400 78,920 71,440 64,000 62,000 Capacity building 30,000 20,000 20,000 20,000 20,000
Programme Shares Expansion 74% 80% 78% 76% 76% Capacity building 26% 20% 22% 24% 24%
(Riels Millions) 2006 2007 2008 2009 2010 Total Recurrent and Capital MoEYS Funding
Resource requirements Recurrent 449,423 550,872 600,260 667,826 717,895 Capital 113,400 98,920 91,440 84,000 82,000
Ratio capital/ recurrent 25% 18% 15% 13% 11% Grand Total Public 562,823 649,792 691,700 751,826 799,895
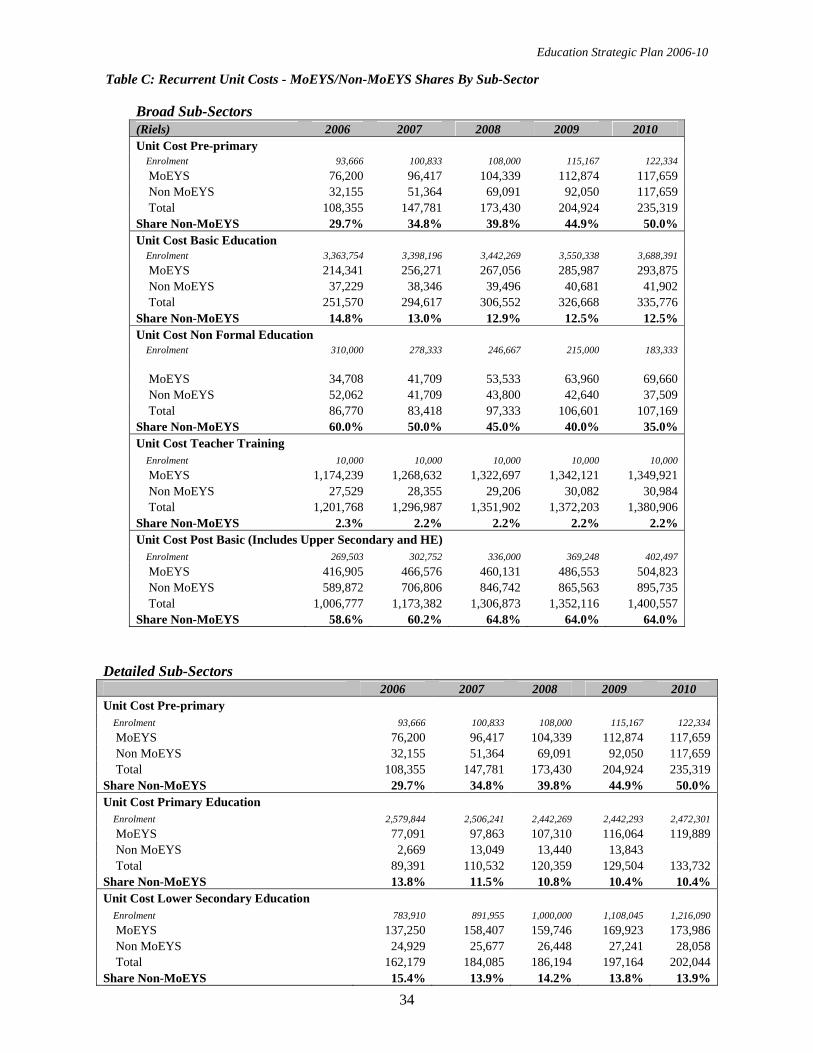
Education Strategic Plan 2006-10
34
Table C: Recurrent Unit Costs - MoEYS/Non-MoEYS Shares By Sub-Sector
Broad Sub-Sectors (Riels) 2006 2007 2008 2009 2010 Unit Cost Pre-primary
Enrolment 93,666 100,833 108,000 115,167 122,334 MoEYS 76,200 96,417 104,339 112,874 117,659 Non MoEYS 32,155 51,364 69,091 92,050 117,659 Total 108,355 147,781 173,430 204,924 235,319
Share Non-MoEYS 29.7% 34.8% 39.8% 44.9% 50.0% Unit Cost Basic Education
Enrolment 3,363,754 3,398,196 3,442,269 3,550,338 3,688,391 MoEYS 214,341 256,271 267,056 285,987 293,875 Non MoEYS 37,229 38,346 39,496 40,681 41,902 Total 251,570 294,617 306,552 326,668 335,776
Share Non-MoEYS 14.8% 13.0% 12.9% 12.5% 12.5% Unit Cost Non Formal Education
Enrolment 310,000 278,333 246,667 215,000 183,333 MoEYS 34,708 41,709 53,533 63,960 69,660 Non MoEYS 52,062 41,709 43,800 42,640 37,509 Total 86,770 83,418 97,333 106,601 107,169
Share Non-MoEYS 60.0% 50.0% 45.0% 40.0% 35.0% Unit Cost Teacher Training
Enrolment 10,000 10,000 10,000 10,000 10,000 MoEYS 1,174,239 1,268,632 1,322,697 1,342,121 1,349,921 Non MoEYS 27,529 28,355 29,206 30,082 30,984 Total 1,201,768 1,296,987 1,351,902 1,372,203 1,380,906
Share Non-MoEYS 2.3% 2.2% 2.2% 2.2% 2.2% Unit Cost Post Basic (Includes Upper Secondary and HE)
Enrolment 269,503 302,752 336,000 369,248 402,497 MoEYS 416,905 466,576 460,131 486,553 504,823 Non MoEYS 589,872 706,806 846,742 865,563 895,735 Total 1,006,777 1,173,382 1,306,873 1,352,116 1,400,557
Share Non-MoEYS 58.6% 60.2% 64.8% 64.0% 64.0% Detailed Sub-Sectors
2006 2007 2008 2009 2010 Unit Cost Pre-primary
Enrolment 93,666 100,833 108,000 115,167 122,334 MoEYS 76,200 96,417 104,339 112,874 117,659 Non MoEYS 32,155 51,364 69,091 92,050 117,659 Total 108,355 147,781 173,430 204,924 235,319
Share Non-MoEYS 29.7% 34.8% 39.8% 44.9% 50.0% Unit Cost Primary Education
Enrolment 2,579,844 2,506,241 2,442,269 2,442,293 2,472,301 MoEYS 77,091 97,863 107,310 116,064 119,889 Non MoEYS 2,669 13,049 13,440 13,843 Total 89,391 110,532 120,359 129,504 133,732
Share Non-MoEYS 13.8% 11.5% 10.8% 10.4% 10.4% Unit Cost Lower Secondary Education
Enrolment 783,910 891,955 1,000,000 1,108,045 1,216,090 MoEYS 137,250 158,407 159,746 169,923 173,986 Non MoEYS 24,929 25,677 26,448 27,241 28,058 Total 162,179 184,085 186,194 197,164 202,044
Share Non-MoEYS 15.4% 13.9% 14.2% 13.8% 13.9%
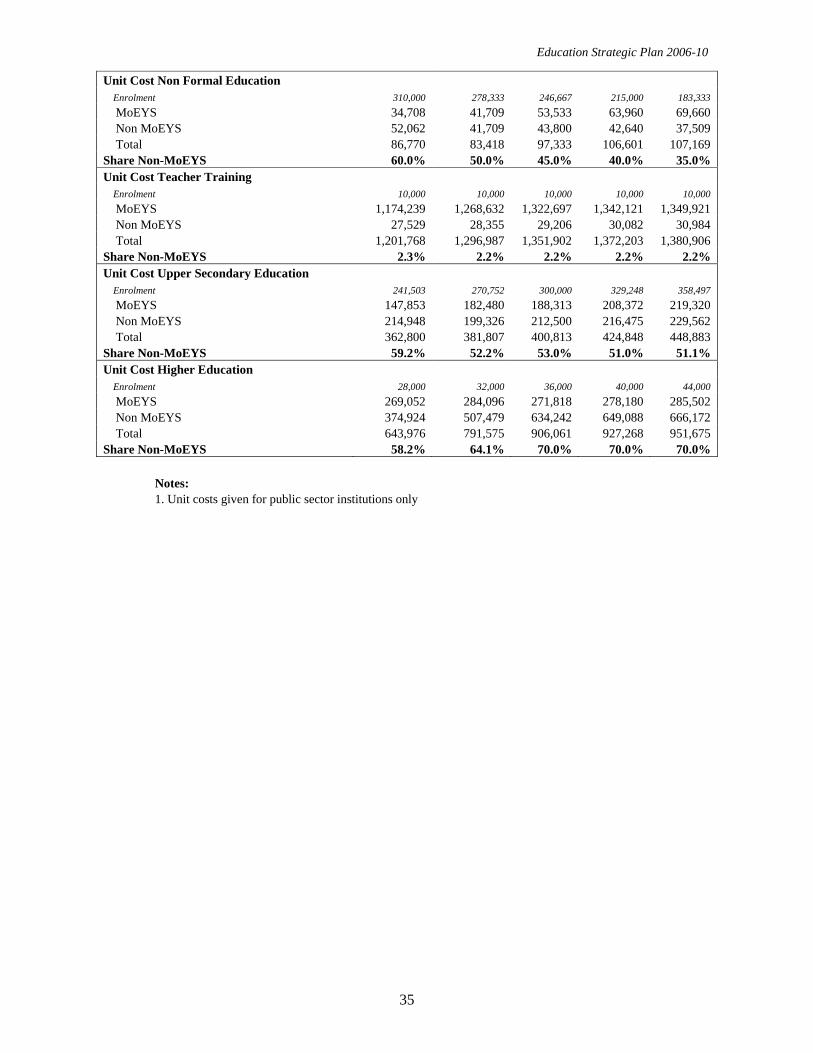
Education Strategic Plan 2006-10
35
Unit Cost Non Formal Education Enrolment 310,000 278,333 246,667 215,000 183,333 MoEYS 34,708 41,709 53,533 63,960 69,660 Non MoEYS 52,062 41,709 43,800 42,640 37,509 Total 86,770 83,418 97,333 106,601 107,169
Share Non-MoEYS 60.0% 50.0% 45.0% 40.0% 35.0% Unit Cost Teacher Training
Enrolment 10,000 10,000 10,000 10,000 10,000 MoEYS 1,174,239 1,268,632 1,322,697 1,342,121 1,349,921 Non MoEYS 27,529 28,355 29,206 30,082 30,984 Total 1,201,768 1,296,987 1,351,902 1,372,203 1,380,906
Share Non-MoEYS 2.3% 2.2% 2.2% 2.2% 2.2% Unit Cost Upper Secondary Education
Enrolment 241,503 270,752 300,000 329,248 358,497 MoEYS 147,853 182,480 188,313 208,372 219,320 Non MoEYS 214,948 199,326 212,500 216,475 229,562 Total 362,800 381,807 400,813 424,848 448,883
Share Non-MoEYS 59.2% 52.2% 53.0% 51.0% 51.1% Unit Cost Higher Education
Enrolment 28,000 32,000 36,000 40,000 44,000 MoEYS 269,052 284,096 271,818 278,180 285,502 Non MoEYS 374,924 507,479 634,242 649,088 666,172 Total 643,976 791,575 906,061 927,268 951,675
Share Non-MoEYS 58.2% 64.1% 70.0% 70.0% 70.0%
Notes: 1. Unit costs given for public sector institutions only

Education Strategic Plan 2006-10
36
Table D: Wage and Non-Wage in Recurrent MoEYS Funding
Administration
(Riels Millions) 2006 2007 2008 2009 2010 Central admin 30,822 27,298 23,959 24,593 25,292
Salary costs 5,671 6,000 6,489 6,961 7,496 Non wage 25,152 21,298 17,469 17,632 17,796
Ratio non wage/ total 82% 78% 73% 72% 70% Provincial admin 16,975 18,699 20,685 21,155 21,669
Salary costs 4,678 4,500 4,380 4,699 5,060 Non wage 12,296 14,199 16,305 16,456 16,610
Ratio non wage/ total 72% 76% 79% 78% 77% District Admin 22,272 25,798 29,811 30,428 31,099
Salary costs 3,828 4,500 5,354 5,743 6,184 Non wage 18,445 21,298 24,457 24,685 24,914
Ratio non wage/ total 83% 83% 82% 81% 80%
Broad Sub-Sectors (Riels Millions) 2006 2007 2008 2009 2010
Pre-primary 7,137 9,722 11,269 12,999 14,394 Salary costs 6,337 8,922 10,269 11,999 13,194 Non wage 800 800 1,000 1,000 1,200
Ratio non wage/ total 11% 8% 9% 8% 8% Basic Education 306,474 386,562 421,825 471,744 507,983
Salary costs 222,152 291,550 314,663 358,385 387,800 Non wage 84,322 95,012 107,162 113,359 120,183
Ratio non wage/ total 28% 25% 25% 24% 24% Non Formal Education 10,760 11,609 13,205 13,751 12,771
Salary costs 4,060 5,309 5,705 6,251 6,471 Non wage 6,700 6,300 7,500 7,500 6,300
Ratio non wage/ total 62% 54% 57% 55% 49% Teacher Training 11,742 12,686 13,227 13,421 13,499
Salary costs 1,442 1,886 2,027 2,221 2,299 Non wage 10,300 10,800 11,200 11,200 11,200
Ratio non wage/ total 88% 85% 85% 83% 83% Post Basic (US and HE) 43,240 58,498 66,279 79,734 91,188
Salary costs 32,820 46,678 53,109 65,724 76,207 Non wage 10,420 11,820 13,170 14,010 14,981
Ratio non wage/ total 24% 20% 20% 18% 16%
Detailed Sub-Sectors (Riels Millions) 2006 2007 2008 2009 2010
Pre-primary 7,137 9,722 11,269 12,999 14,394 Salary costs 6,337 8,922 10,269 11,999 13,194 Non wage 800 800 1,000 1,000 1,200
Ratio non wage/ total 11% 8% 9% 8% 8% Primary Education 198,883 245,269 262,079 283,461 296,401
Salary costs 145,037 187,610 200,095 219,272 229,761 Non wage 53,845 57,659 61,984 64,189 66,639
Ratio non wage/ total 27% 24% 24% 23% 22% Lower Secondary Education 107,591 141,292 159,746 188,282 211,583
Salary costs 77,115 103,939 114,568 139,112 158,039 Non wage 30,477 37,353 45,178 49,170 53,544
Ratio non wage/ total 28% 26% 28% 26% 25%

Education Strategic Plan 2006-10
37
Non Formal Education 10,760 11,609 13,205 13,751 12,771 Salary costs 4,060 5,309 5,705 6,251 6,471 Non wage 6,700 6,300 7,500 7,500 6,300
Ratio non wage/ total 62% 54% 57% 55% 49% Teacher Training 11,742 12,686 13,227 13,421 13,499
Salary costs 1,442 1,886 2,027 2,221 2,299 Non wage 10,300 10,800 11,200 11,200 11,200
Ratio non wage/ total 88% 85% 85% 83% 83% Upper Secondary Education 35,707 49,407 56,494 68,606 78,626
Salary costs 30,787 43,587 49,324 60,596 69,645 Non wage 4,920 5,820 7,170 8,010 8,981
Ratio non wage/ total 14% 12% 13% 12% 11% Higher Education 7,533 9,091 9,785 11,127 12,562
Salary costs 2,033 3,091 3,785 5,127 6,562 Non wage 5,500 6,000 6,000 6,000 6,000
Ratio non wage/ total 73% 66% 61% 54% 48% Overall Totals
(Riels Millions) 2006 2007 2008 2009 2010 Total sub-sectors 379,354 479,077 525,805 591,649 639,835
Salary costs 266,812 354,345 385,773 444,580 485,971 Non wage 112,542 124,732 140,032 147,069 153,864
Ratio non wage/ total 30% 26% 27% 25% 24% Grand total 449,423 550,872 600,260 667,826 717,895
Salary costs 280,988 369,345 401,996 461,984 504,712 Non wage 168,435 181,528 198,264 205,842 213,184
Ratio non wage/ total 37% 33% 33% 31% 30% Notes: 1. HE total recurrent funding includes scholarships for students in public sector institutions

Education Strategic Plan 2006-10
38
Table E: ESP Financing Plan Against Macro Economic Projections
(Riels Billions) 2006 2007 2008 2009 2010 Nominal GDP 21,294 23,301 24,769 26,329 27,988
% Change 8.5% 9.4% 6.3% 6.3% 6.3% Total Expenditures 3,961 4,450 4,706 5,003 5,318
% GDP 18.6% 19.1% 19.0% 19.0% 19.0% Current 2,534 2,866 3,047 3,238 3,443
% GDP 11.9% 12.3% 12.3% 12.3% 12.3% Current (Discretionary) 2,194 2,465 - - -
Education 449 551 600 668 718 % GDP 2.1% 2.4% 2.4% 2.5% 2.6% % Total Current 17.7% 19.2% 19.7% 20.6% 20.9% % Current Discretionary 20.5% 22.3% - - -
Capital 1,427 1,561 1,660 1,764 1,875 % GDP 6.7% 6.7% 6.7% 6.7% 6.7% Education 113 99 91 84 82
% GDP 0.53% 0.42% 0.37% 0.32% 0.29% % Total Capital 7.95% 6.34% 5.51% 4.76% 4.37%
Total Education 563 650 692 752 800% Total Expenditures 14.21% 14.60% 14.70% 15.03% 15.04%
Notes: 1. 2006-2007 GDP Estimates and Shares Based on Draft MTEF, January 2004 2. 2008-2010 macro estimates based on 2007 shares and growth
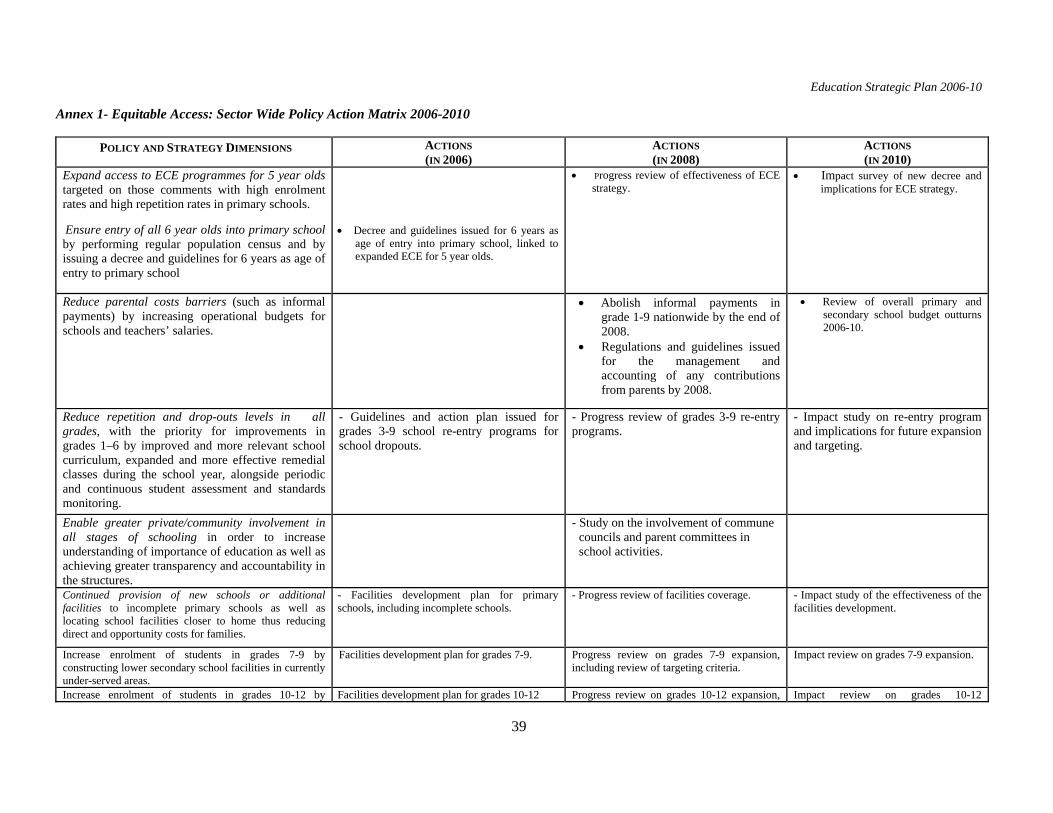
Education Strategic Plan 2006-10
39
Annex 1- Equitable Access: Sector Wide Policy Action Matrix 2006-2010
POLICY AND STRATEGY DIMENSIONS ACTIONS (IN 2006)
ACTIONS (IN 2008)
ACTIONS (IN 2010)
Expand access to ECE programmes for 5 year olds targeted on those comments with high enrolment rates and high repetition rates in primary schools.
Ensure entry of all 6 year olds into primary school by performing regular population census and by issuing a decree and guidelines for 6 years as age of entry to primary school
• Decree and guidelines issued for 6 years as
age of entry into primary school, linked to expanded ECE for 5 year olds.
• Progress review of effectiveness of ECE strategy.
• Impact survey of new decree and implications for ECE strategy.
Reduce parental costs barriers (such as informal payments) by increasing operational budgets for schools and teachers’ salaries.
• Abolish informal payments in grade 1-9 nationwide by the end of 2008.
• Regulations and guidelines issued for the management and accounting of any contributions from parents by 2008.
• Review of overall primary and secondary school budget outturns 2006-10.
Reduce repetition and drop-outs levels in all grades, with the priority for improvements in grades 1–6 by improved and more relevant school curriculum, expanded and more effective remedial classes during the school year, alongside periodic and continuous student assessment and standards monitoring.
- Guidelines and action plan issued for grades 3-9 school re-entry programs for school dropouts.
- Progress review of grades 3-9 re-entry programs.
- Impact study on re-entry program and implications for future expansion and targeting.
Enable greater private/community involvement in all stages of schooling in order to increase understanding of importance of education as well as achieving greater transparency and accountability in the structures.
- Study on the involvement of commune councils and parent committees in school activities.
Continued provision of new schools or additional facilities to incomplete primary schools as well as locating school facilities closer to home thus reducing direct and opportunity costs for families.
- Facilities development plan for primary schools, including incomplete schools.
- Progress review of facilities coverage.
- Impact study of the effectiveness of the facilities development.
Increase enrolment of students in grades 7-9 by constructing lower secondary school facilities in currently under-served areas.
Facilities development plan for grades 7-9. Progress review on grades 7-9 expansion, including review of targeting criteria.
Impact review on grades 7-9 expansion.
Increase enrolment of students in grades 10-12 by Facilities development plan for grades 10-12 Progress review on grades 10-12 expansion, Impact review on grades 10-12
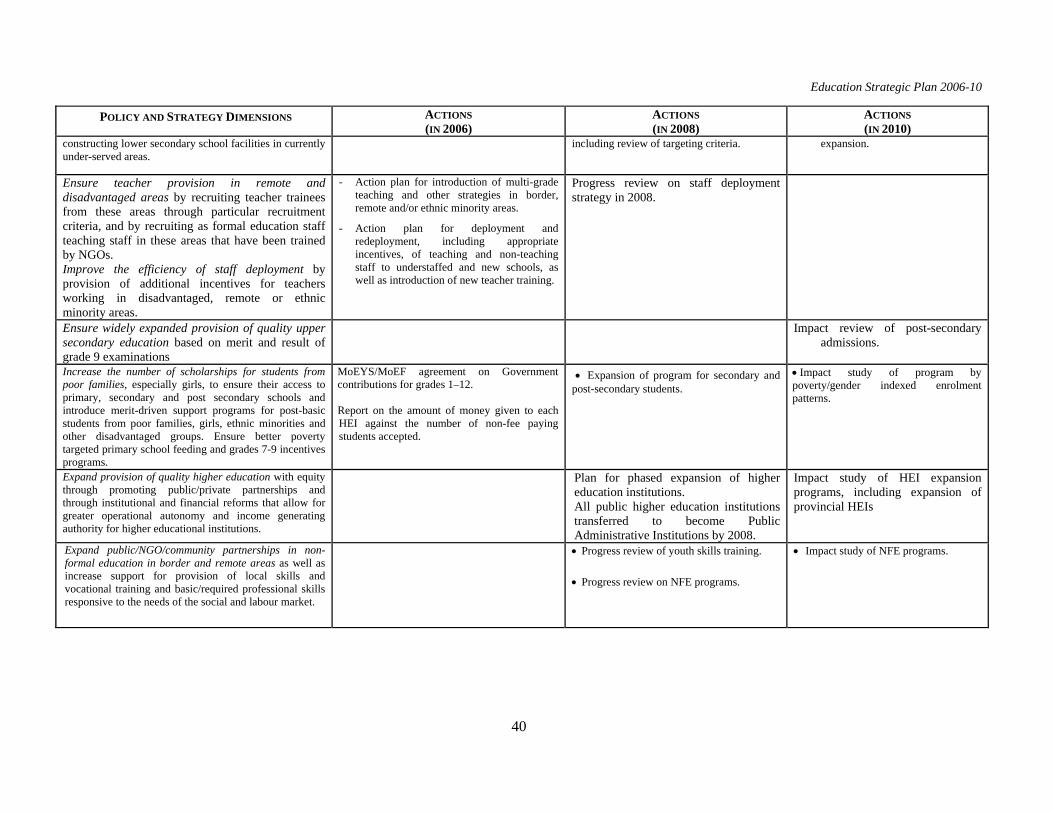
Education Strategic Plan 2006-10
40
POLICY AND STRATEGY DIMENSIONS ACTIONS (IN 2006)
ACTIONS (IN 2008)
ACTIONS (IN 2010)
constructing lower secondary school facilities in currently under-served areas.
including review of targeting criteria. expansion.
Ensure teacher provision in remote and disadvantaged areas by recruiting teacher trainees from these areas through particular recruitment criteria, and by recruiting as formal education staff teaching staff in these areas that have been trained by NGOs. Improve the efficiency of staff deployment by provision of additional incentives for teachers working in disadvantaged, remote or ethnic minority areas.
- Action plan for introduction of multi-grade teaching and other strategies in border, remote and/or ethnic minority areas.
- Action plan for deployment and redeployment, including appropriate incentives, of teaching and non-teaching staff to understaffed and new schools, as well as introduction of new teacher training.
Progress review on staff deployment strategy in 2008.
Ensure widely expanded provision of quality upper secondary education based on merit and result of grade 9 examinations
Impact review of post-secondary admissions.
Increase the number of scholarships for students from poor families, especially girls, to ensure their access to primary, secondary and post secondary schools and introduce merit-driven support programs for post-basic students from poor families, girls, ethnic minorities and other disadvantaged groups. Ensure better poverty targeted primary school feeding and grades 7-9 incentives programs.
MoEYS/MoEF agreement on Government contributions for grades 1–12. Report on the amount of money given to each HEI against the number of non-fee paying students accepted.
• Expansion of program for secondary and post-secondary students.
• Impact study of program by poverty/gender indexed enrolment patterns.
Expand provision of quality higher education with equity through promoting public/private partnerships and through institutional and financial reforms that allow for greater operational autonomy and income generating authority for higher educational institutions.
Plan for phased expansion of higher education institutions. All public higher education institutions transferred to become Public Administrative Institutions by 2008.
Impact study of HEI expansion programs, including expansion of provincial HEIs
Expand public/NGO/community partnerships in non-formal education in border and remote areas as well as increase support for provision of local skills and vocational training and basic/required professional skills responsive to the needs of the social and labour market.
• Progress review of youth skills training. • Progress review on NFE programs.
• Impact study of NFE programs.

Education Strategic Plan 2006-10
41
Annex 2- Quality and Efficiency: Sector Wide Policy Action Matrix 2006-2010 POLICY AND STRATEGY DIMENSIONS ACTIONS
(BY EARLY 2006) ACTIONS
(BY MID 2008) ACTIONS
(BY EARLY 2010) Increase service remuneration and incentives linked to performance by agreeing on a reform plan for teacher salary/allowances against performances and responsibilities in co-operation with MoEF.
- Agreed plan with MoEF and CAR on yearly increases in classroom teacher salary/allowances against agreed criteria and responsibilities.
- Joint MoEYS/CAR/MoEF review of the effectiveness of remuneration reform and agreed follow-up actions.
- Impact study of the impact of educational staff remuneration reform on service quality and effectiveness.
Improve the quality of teaching and learning through nationwide implementation of child-friendly schools, and school readiness programs aimed at holistic development of schools including inclusive education, child-centred teaching and learning, conducive and gender-responsive learning environment, family/community participation and effective education management systems.
- Child-friendly school policy and national CFS operational plan formulated and adopted.
- CFS programs initiated in all 24 provinces by school year 2007-08.
Increase the schools’ and training institutions’ operational autonomy and accountability regarding operational budgets and decisions on programs by establishing new financial planning and accountability mechanisms for school operating budgets in primary and secondary schools, with guidelines for involvement of joint school, parents and community management as well as expanding internal audit operations to cover selected departments.
- Revised guidelines and performance indicators for use of operational budgets, including budgets.
- Progress review on the effect of increased budget allocations on school and institutional performance.
- Implement the new Curriculum Policy, including implementation of Primary and Lower Secondary component of new basic education curriculum, with a focus on learning achievement standards at Grades 3 and 6 and 9 and the introduction of Local Life Skills Programs.
- Full implementation by 2007.
- Progress review on the new curriculum policy in 2010.
- Improve pre-service and in-service teacher development and introduce staff performance appraisal systems at every level of the education system, including appropriate reporting procedures.
- Action plan for expanding INSET provision, including delegating greater authority to provinces for INSET planning.
- Finalize revised teacher supply and demand strategy, including revised roles of TTCs and measures to improve TTC staff and facilities efficiency.
- Progress review of INSET programs, including impact on teacher effectiveness and need for additional TTCs in currently under-served provinces.

Education Strategic Plan 2006-10
42
POLICY AND STRATEGY DIMENSIONS ACTIONS (BY EARLY 2006)
ACTIONS (BY MID 2008)
ACTIONS (BY EARLY 2010)
- Strengthening teaching and learning quality to ensure primary and secondary teachers with pedagogy and ICT awareness.
5,000 teachers trained at all levels per annum, with ICT training included in their training.
10,000 new teachers trained at all levels since 2006, with ICT training included in their training.
10,000 new teachers trained at all levels since 2008.
Implement the minimum standards of student achievement for grades 3, 6 and 9 nationwide, assure a shared understanding of minimum standards amongst teachers, parents and other stakeholders and follow up on the results of the tests in the nationwide school report cards.
- Public dissemination of the results of the standard testing from 2005-06.
- Public dissemination of the results of the yearly standard testing.
- Public dissemination of the results of the yearly standard testing.
Increase transparency and improve performance monitoring and accountability of teachers, schools and post-secondary institutions by disseminating the result of students' achievements to the public and education authorities at all levels, and through a clear definition of the roles and responsibility of education inspection and other departments at central, provincial and district inspectors. The role of commune councils in school performance monitoring and oversight should be promoted.
- Action plan for introducing improved performance-monitoring systems with instructions on oversight responsibilities.
- Setting up the detailed criteria for establishing HEI.
- Public dissemination of HE standards in public and private institutions.
- Report to National Assembly on progress in improving education standards at all levels including MoEYS’ role in quality assurance.
- Enforcement of the criteria for establishing HEIs and the accreditation of all HEIs gradually by 2010.

Education Strategic Plan 2006-10
43
Annex 3: Institution and Capacity Building: Sector Wide Policy Action Matrix, 2006-2010 POLICY AND STRATEGY DIMENSIONS ACTIONS
(BY EARLY 2006) ACTIONS
(BY MID 2008) ACTIONS
(BY EARLY 2010) Provide a clearly defined legislative, regulatory framework to the sector and the sub-sectors through the adoption of the Education Law.
- Adoption of Education law by end of 2006.
Improved predictability for Medium term financial planning and decentralized management and monitoring and improved Governance and Regulatory Systems by increasing transparency and accountability of resources, including external assistance.
- Council of Ministers and MoEF approve a five-year recurrent and capital expenditure framework for education within MTEF by 2006.
Update on budget execution in JTWG-Ed every three months.
- Progress review on the financial performance by government/MoEYS.
- Progress review on donor budget support to assist financial predictability.
Update on budget execution in JTWG-Ed every three months.
Update on budget execution in JTWG-Ed every three months.
Strengthening education system performance monitoring and impact systems, including ESP-ESSP review processes.
- Annual action plan for each PAP drawn up by each technical department made available to stakeholders.
- Follow-up of policy actions throughout the year through reporting on progress in the JTWG-Ed every 6 months.
- Annual action plan for each PAP drawn up by each technical department made available to stakeholders.
- Follow-up of policy actions throughout the year through reporting on progress in the JTWG-Ed every 6 months.
- Annual action plan for each PAP drawn up by each technical department made available to stakeholders.
- Follow-up of policy actions throughout the year through reporting on progress in the JTWG-Ed every 6 months.
Strengthening Central, Provincial and District Financial Monitoring Systems by increased access to training for BMCs.
- Prepare comprehensive capacity building programme for all BMCs in 2006 to strengthen their program and financial planning, monitoring and audit skills, especially in public accounting.
- Central, provincial and district BMCs produce comprehensive financial reports as a basis for internal audit.
- Enabling Ministry-wide system of public accounting of Government funds for education by 2008.
Assuring that all designated Budget Management Centres (BMC) become operational and effective, and that District and School/Institutional Management Systems are enhanced to ensure quality education.
- Prepare training programme for provincial, district and school levels in management.
- Preparation of revised guidelines for district BMCs and schools in management

Education Strategic Plan 2006-10
44
POLICY AND STRATEGY DIMENSIONS ACTIONS (BY EARLY 2006)
ACTIONS (BY MID 2008)
ACTIONS (BY EARLY 2010)
responsibilities.
Strengthened personnel management and monitoring systems.
- Implementing ICT based central and provincial personnel MIS, in co-ordination with CAR.
- Develop action plan for ICT based information management at all levels.
Improved Higher Education Institutional Development and Capacity through institutional and financial reforms that allow greater operational autonomy and income generating authority for higher education institutions.
- A strategic plan for Higher Education developed by 2008, including capacity building for HE department and the management of information systems.

Education Strategic Plan 2006-10
45
Annex 4: Revised Sector Performance Milestones and Targets: 2006 - 2010
Table I: Equitable Access Actual Target Target Target Target Target
Indicator 2004-05 2005-06 2006-07 2007-08 2008-09 2009-10
Total Female Male Total Female Male Total Female Total Female Total Female Total Female
Source of Data
Net Admission rate 81.0% 79.5% 82.5% 90% 90% 90% 92% 92% 93% 93% 94% 94% 95% 95% EMIS
Net enrolment ratio:
Primary: nationwide 91.9% 90.7% 93.1% 92% 91% 93% 93% 92% 94% 94% 95% 95% 96% 96% EMIS
Primary: urban area 91.6% 90.4% 92.8% 95% 94% 96% 97% 96% 98% 98% 99% 98% 100% 100% Primary: rural area 92.4% 91.2% 93.5% 92% 91% 93% 93% 92% 94% 94% 95% 95% 96% 96% Primary: remote area 82.5% 79.4% 85.4% 84% 81% 86% 85% 83% 87% 85% 90% 89% 92% 92% Lower secondary: nationwide 26.10% 24.80% 27.30% 29.00% 27.70% 30.20% 33% 31% 39% 38% 44% 43% 50% 50%
Lower secondary: urban 41.3% 40.5% 42.1% 45.0% 44.4% 45.7% 48.8% 48.3% 52.5% 52.2% 56.3% 56.1% 60% 60% Lower secondary: rural area 23.7% 22.2% 25.1% 29.0% 27.8% 30.2% 34.2% 33.3% 39.5% 38.9% 44.7% 44.4% 50% 50% Lower secondary: remote area 3.9% 4.1% 3.8% 11.1% 11.3% 11.0% 18.3% 18.5% 25.6% 25.6% 32.8% 32.8% 40% 40% Upper secondary 9.30% 7.90% 10.60% 10.0% 8.6% 11.4% 14.0% 11.0% 18.0% 15.0% 23.0% 20.0% 28% 25% Transition rate (03-04)
To lower secondary 81.9% 79.6% 83.9% 87% 85% 89% 90% 88% 93% 90% 95% 93% 97% 95%
To upper secondary. 56.1% 58.0% 54.9% 64% 66% 62% 65% 67% 71% 71% 75% 74% 78% 76%
EMIS
Number of students in public higher education institutions 7,963 2,802 5,161 20,000 6,000 14,000 24,000 7,500 28,000 9,000 32,000 10,500 36,000 12,000
Number of scholarship students … … … 8,500 3,000 5500 9,000 3,500 10,000 4,000 12,000 6,000 15,000 7,500
Higher Ed. Dep.
Number of private supported students in higher education 38,882 12,685 26,197 49,000 10,800 5,500 50,000 14,000 51,400 21,000 52,700 24,000 54,000 24,000 Higher Ed.
Dep.
Number of students in teacher training 6,520 2,512 4,008 10,000 3,600 6,400 10,000 3,700 10,000 3,800 10,000 3,900 10,000 4,000 TTD
Proportion of 6-14 years old out of school 12.1% 16.1% 8.2% 11.24 13.88 7.5 10.2 10.5 9.4 9.2 8.6 8.4 8 7.6 EMIS
Number of students enrolled in re-entry program in grades 3-9 19,476 25,000 25,000 30,000 30,000 30,000 NFE

Education Strategic Plan 2006-10
46
Number of students enrolled in equivalency program 5,000 30,000 30,000 30,000 30,000 30,000 NFE
Number of students enrolled in literacy, life-skills and income generation programs
112,557 120,000 120,000 120,000 120,000 120,000 NFE
Table II: Quality and Efficiency (Promotion and repetition 2003-04 rate are used for baseline 2004-05)
Baseline Target Target Target Target Target Indicator 2004-05 2005-06 2006-07 2007-08 2008-09 2009-10 Source:
Pupil teacher ratio EMIS - Primary 53.5 51.0 50.0 50.0 50.0 50.0 - Lower Secondary 27.7 37 41 45 45 45 - Upper Secondary 29.4 35 38 40 40 40 Promotion rate Total Female Male Total Female Male Total Female Total Female Total Female Total Female EMIS - Grade 1 64.8% 65.4% 64.2% 92% 92% 92% 93% 93% 94% 94% 95% 95% 95% 95% - Grade 3 77.3% 78.9% 75.7% 93% 93% 93% 93% 93% 94% 94% 95% 95% 95% 95% - Grade 6 86.6% 86.3% 86.9% 93% 93% 93% 93% 93% 94% 94% 95% 95% 95% 95%
Repetition rate Total Female Male Total Female Male Total Female Total Female Total Female Total Female EMIS - Grade 1 23.6% 22.4% 24.9% 6% 6% 6% 5% 5% 4% 4% 4% 4% 4% 4% - Grade 3 13.2% 11.3% 15.4% 6% 6% 6% 5% 5% 4% 4% 4% 4% 4% 4% - Grade 6 2.6% 2.2% 3.1% 2% 2% 2% 2% 2% 2% 2% 1% 1% 1% 1% Completion rate Total Female Male Total Female Male Total Female Total Female Total Female Total Female EMIS - Primary 46.8% 45.7% 47.9% 60% 60% 60% 70% 70% 80% 80% 90% 90% 100% 100% - Lower secondary 20.6% 20.0% 21.2% 30% 30% 30% 40% 40% 50% 50% 60% 60% 75% 75% Literacy rate 67.1% 60.3% 74.7% 70% 67% 73.1% 75% 73% 80% 78% 85% 84% 90% 90% Expenditure on core instructional materials per pupil (Riels)
… 5,800 6,300 6,800 7,000 7,200
Textbook pupil ratio in primary (total textbooks of all subjects/pupil)
2.7 3.0 3.2 3.5 3.8 4.0 EMIS
Number of incomplete primary schools 1,934
1,800 (donor support
required)
1,500 (donor support
required)
1,000 (donor support
required)
500 (donor support
required) 0
EMIS
% of primary teachers completed lower secondary 93.2 93.4 93.6 93.9 94.1 94.3
HRMIS
Number of new remote/difficult teacher postings as percentage of new postings
- 70% 70% 95% 95% 95% HRMIS

Education Strategic Plan 2006-10
47
Number of students passing grade 12 examination 33,834 37,500 40,000 50,000 60,000 70,000
EMIS
% of students meeting curriculum standards in Khmer Language based on standardized test at:
PRD/DGE
- Grade 3 to be determined to be determined to be determined to be determined to be determined
- Grade 6 to be determined to be determined to be determined to be determined to be determined
- Grade 9 to be determined to be determined to be determined to be determined to be determined % of students meeting curriculum standards in Mathematics based on standardized test at:
PRD/DGE
- Grade 3 to be determined to be determined to be determined to be determined to be determined
- Grade 6 to be determined to be determined to be determined to be determined to be determined
- Grade 9 to be determined to be determined to be determined to be determined to be determined
% of accredited public/private HE institutions … 15% 30% 45% 65% 80%
No. of schools/TTCs with new science and ICT facilities … 10 25 50 75 100
Table III: Institutional Development and Capacity Building
Baseline Target Target Target Target Target Target Source: Indicator 2004 2005 2006 2007 2008 2009 2010
Education share of total government recurrent budget
17.49% 19.5% 18.5% 18.5% 19.0% 20.0% 20.0%
Non personnel share of total recurrent spending
43.25% 40.0% 38.8% 37.5% 33.0% 33.0% 30.8%
FMIS
% of actual education expenditure vs total education budget allocation
26.91%
29.0% 33.26% 28.32% 28.18% 25.21% 25.02%
FMIS
% of actual PAP expenditure vs total PAP budget 93% 95% 100% 100% 100% 100%
FMIS
Expenditure on monitoring of PAP in billion Riels 3.6 6.8 7 7 7 7 7
Disbursement rate for recurrent priority programs 96% 93% 95% 100% 100% 100% 100%
Number of operational BMCs
PFMIS
- % of BMCs with trained accountancy staff 20% 40% 60% 80% 100% 100%
- % of BMCs with ICT-based MIS
194
40% 60% 80% 100% 100% 100%
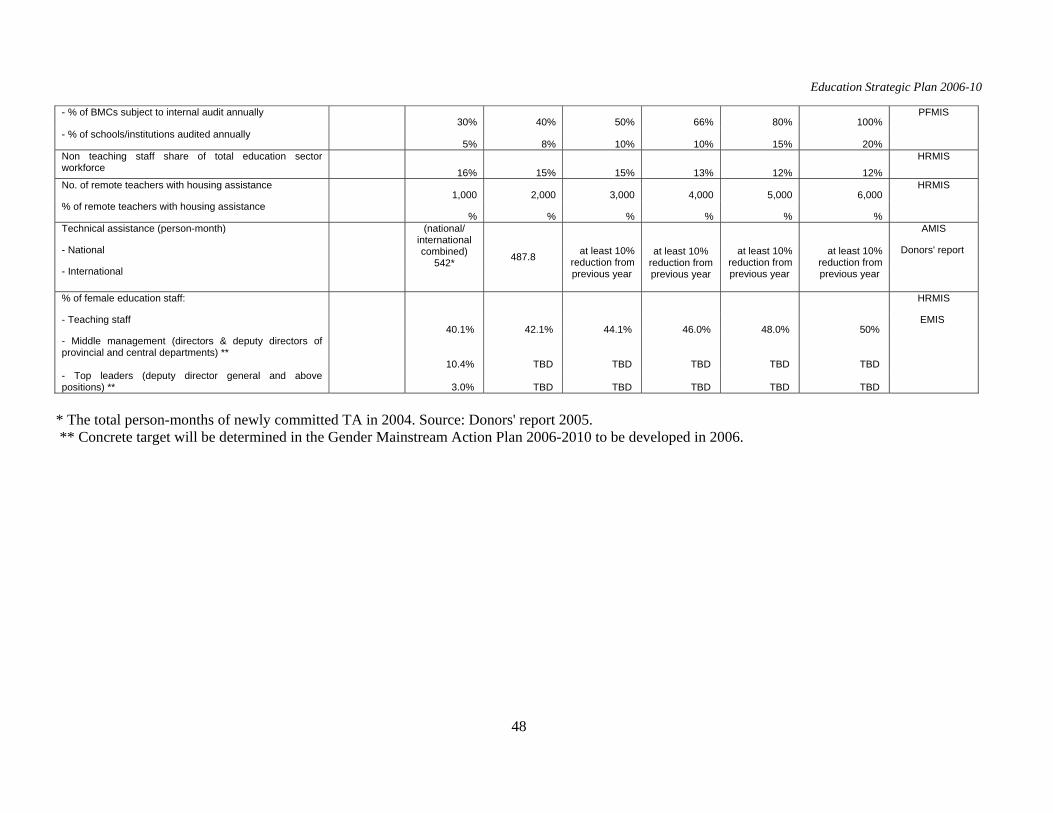
Education Strategic Plan 2006-10
48
- % of BMCs subject to internal audit annually 30% 40% 50% 66% 80% 100%
PFMIS
- % of schools/institutions audited annually
5% 8% 10% 10% 15% 20%
Non teaching staff share of total education sector workforce
16% 15% 15% 13% 12% 12%
HRMIS
No. of remote teachers with housing assistance 1,000 2,000 3,000 4,000 5,000 6,000
HRMIS
% of remote teachers with housing assistance % % % % % %
Technical assistance (person-month) AMIS
- National Donors' report
- International
(national/ international combined)
542*
487.8
at least 10%
reduction from previous year
at least 10%
reduction from previous year
at least 10% reduction from previous year
at least 10% reduction from previous year
% of female education staff:
HRMIS
- Teaching staff 40.1% 42.1% 44.1% 46.0% 48.0% 50%
EMIS
- Middle management (directors & deputy directors of provincial and central departments) **
10.4% TBD TBD TBD TBD TBD
- Top leaders (deputy director general and above positions) **
3.0% TBD TBD TBD TBD TBD
* The total person-months of newly committed TA in 2004. Source: Donors' report 2005. ** Concrete target will be determined in the Gender Mainstream Action Plan 2006-2010 to be developed in 2006.


