Tweed River Entrance Sand Bypassing Project Kirra Reef Marine Biota Monitoring 2015 Prepared for: The New South Wales Government, Department of Primary Industries, LandsJ and the Queensland Government Department of Science, Information Technology and Innovation frc environmental PO Box 2363, Wellington Point QLD 4160 Telephone: + 61 3286 3850 Facsimile: + 61 3821 7936 frc reference: 150211
Client The New South Wales Government Department of Primary Industries LandsR and the QueenslandGovernmentDepartmentofScienceInformationTechnologyandInnovation
The New South Wales Government Department of Primary Industries LandsR and the QueenslandGovernmentDepartmentofScienceInformationTechnologyandInnovation commissionedfrcenvironmentalonbehalfoftheTweedRiverEntranceSandBypassing Project (TRESBP) to monitor the condition and biodiversity of benthic and fish assemblages at Kirra Reef and to assess potential impacts of the project on those assemblages The purpose of the TRESBP is to maintain a navigable entrance to the Tweed River and to provide a continuing supply of sand to the southern Gold Coast beaches consistent with the natural rate of longshore drift This report discusses the results of ecological monitoring of the benthic fauna flora and fish of Kirra Reef completedinMarch2015
Ongoing monitoring of Kirra Reef is required under the Environmental Management System(EMS)SubgtPlanB14KirraReefManagementPlanpreparedbytheTRESBPin February 2001 The methods used in the March 2015 survey (ie surveys of benthic cover and fish abundance) were those developed for the Stage I survey completed in 1995andhavebeenused in thesubsequentsurveys in19962001200320042005 20102012and2014
ImpactsoftheSandBypassingSystemonKirraReef
The extent of the three major outcrops of Kirra Reef (northern southern and eastern sections)varynaturallydependingonwaterandsandmovementsDuringtheearlyyears of theTRESBP operation largeamounts of sandwere deposited on thesouthern Gold Coast beaches This was done to provide a lsquocatch uprsquo quantity of sand to the badly erodedbeachesreducetheTweedRiverentrancebarandclearasandtrapinthevicinity ofthesandcollectionjettytoincreasetheefficiencyofthebypassingsystemDuringthe initialperiodofincreaseddepositionthevolumeofsanddeliveredexceededtheamount that was transported north through natural mechanisms A large volume of sand was deposited on the southern Gold Coast beaches and wave action and tidal currents redistributed some of this sand over Kirra Reef This resulted in a decline in the areal extentofKirraReefwiththereefalmostcompletelycovered(lt100m2exposed)in2006 The projectrsquos Environmental Impact Statement (EIS) predicted that impacts associated withthegradualaccumulationofsandaroundthebaseofKirraReefwereunavoidable
Sincethedeliveryoflargequantitiesofsandwascompletedin2008thevolumeofsand delivered by the project has declined and now closely matches the natural rate of northwardsandtransportHowevertherewasasubstantiallagbetweenthereductionin sanddeliveryandtransportofthesandfurthernorthduetoaperiodofcalmerthanusual
TRESBPKirraReefMarineBiotaMonitoring2015 i
frc environmental
conditionswith reduced storm activity from the north`east Assuchdispersion of sand from Kirra Beach and reduction in the sand levels around the reef was slower than predictedbetween2005and2009
BetweenFebruary2010andJuly2012 therewasa large(50) increase in theareaof exposedrockinthenorthernsectionofKirraReefThiswaslikelytoberelatedtosevere storms in late 2009 moving sand further north andor to the manual removal of 140000m3ofsandfromKirraBeachin2009
InDecember2013KirraPointgroynewasextendedby30mby theCityofGoldCoast with the expectation that the beach bar would move seaward as a consequence At present theKirraPointgroyneestension in2013isunlikelytohavehadamajor impact onthearealextentofKirraReef
Thereefhasbeenrelativelystablesince2013withminor(lt5)changesintheamount of reefexposed Nonetheless thearealextentofKirraReef remains less than50of the extent recorded in 1962 and in 1995 before the TRESBP began In 2015 the reef comprisesthenorthernsectionandapartof theeasternsectionof thereefasrecorded pre`TRESBP(allthesouthernsectionofthereefremainsburied)
ChangestotheEcologicalConditionofKirraReef
The Projectrsquos EIS did not consider the ecological consequences of the reduced areal extentofreefalhabitatandincreasedwaveenergy(aconsequenceofdecreaseddepth) thatwouldoccurasaresultoftheaccretionofsandaroundKirraReefHoweverasthe TRESBPbettermimicednaturalpatternsofsandtransportsince2009theEISpredicted that the reefrsquos benthic floral and faunal assemblages would return to the conditions exhibitedpriortotheextensionoftheTweedRivertrainingwallsinthemid1960s
Sincemonitoringcommenced thegreatestchangeto the floralandfaunalassemblages of Kirra Reef has been due to the loss of reefal habitat In addition to a reduction in overall abundance of taxa the redistribution of sand mediated through complex interactions between physical disturbance (associated with wave action suspended sedimentssedimentdepositionandburial)foodavailabilityandcompetitionhasresulted inavarietyofsmall`scalechangestothedistributionandabundanceofthereefrsquosbenthic assemblages
InApril2014andMarch2015thediversityofassemblageshadincreasedrelativetoJuly 2012as had thecoverof macroalgae (though it remained well below the peakof 60 coverrecordedinJanuary2001)Thisismostlikelyduetonaturalsuccessionwithmore mature communities being established between 2012 and 2015 when the extent of exposedrockwasrelativelystableNeverthelessthebenthicassemblageonKirraReef
TRESBPKirraReefMarineBiotaMonitoring2015 ii
frc environmental
exhibited signs of ongoing stress from physical disturbance such as storm and wave disturbancephysicalabrasionandburialbysandRincludinglowpercentagecoverofhard coralandsoftcoralThisisconsideredessentiallynaturalandcharacteristicofshallow inshorereefsChronicphysicaldisturbancekeepsthebenthicassemblagesofKirraReef inastateofearlysuccession Thediversity(and insomecasesabundnace)ofareefrsquos benthic assemblage is predicted to increase where the extent of reef remains stable or increases and where the frequency and severity of storm conditions are less than the long`term average This was evident in 2014 and 2015 with a relative high cover of spongesandascidians
InMarch2015amorediverseassemblageoffishwasfoundonKirraReefthanonPalm Beach Reef As fish are mobile they can move more easily to areas that are less disturbed or that exhibit more suitable conditions While the composition of the assemblagedifferedfromprevioussurveyeventsthedifferencesweremorelikelydueto the effects of seasonal changes in water temperature and the effects of prevailing conditions at the time of the survey rather than any substantial effect of the bypassing project
Despite some impacts from the TRESBP (with sand covering much of the reef area) overall the composition of the flora and fauna assemblages on Kirra Reef were more similar to that found at nearby Palm Beach Reef than in previous years Kirra Reef therefore continues to provide habitat to a range of flora and fauna and provides important marine ecological functions and services in the region It is possible that as sandlevelshavestabilisedoverthepastthreeyearsassemblagesareslowlybeginning tobecomemoresimilartothoserecordedpriortoimplementationoftheTRESBPandto thoseatnearbyPalmBeachReef
ImpactsofStormsampSeasonalityonKirraReef
The large quantities of sand that were initially delivered by the project caused a substantialshallowingofthenear`shoreareaaroundthereefThisincreaseinbedlevels wasresponsibleforcoveringasubstatialamountofthereefandsubsequentlyincreasing the incidenceof wavedisturbance and sand scouringaround the reef which negatively impactedthebenthicfaunaandflora
As the delivery of sand through the bypassing system now more closely matches the naturalrateofnorthernlongshoresandtransportshort`termandseasonalchangesinthe areal extent of the reef are more likely the result of natural processes than a discrete impactof thesandbypassingactivity Short`term fluctuations that result fromstormsor changesinthecoastalsandsupplywouldhavebeenacomponentofthenaturalrangeof ecologicalconditionsobservedpriortotheextensionofthetrainingwalls
TRESBPKirraReefMarineBiotaMonitoring2015 iii
frc environmental
Thereappearstobearelationshipbetweentheareaandordistributionofrockexposed andstormeventsatKirraReefNotablyaseriesofstormsin2009andstormyconditions between late 2011 and 2012 correspond to large areas of rock becoming exposed Furtherstormsinearly2013correspondstoaclearchangeinthedistributionofrockat Kirra Reef Since 2013 storm conditions have been calm to moderate and there has beenlittlechangeinthearealextentanddistrubtionofexposedrockatKirraReef
Thecloseproximityofthereeftothecoastcontinuestosubjectthebenthicassemblages tosandabrasionwavedisturbanceandsandsmotheringGreaterbalancebetween the deliveryofsandthroughtheprojectandthenaturalmovementofsandonandoffshoreis likely to result inbetterecologicaloutcomes for thebenthicassemblages foundonKirra Reefandgreaterconsistencyintheextentofreefhabitatthatisuncovered
frcenvironmental expect that the area of reef uncovered will continue to change due to seasonal shifts in sand delivery and stormsR however the diversity of flora and fauna assemblagesonKirraReefshouldincreasegraduallyovertimeespeciallyiftheextentof the rocky reef that remains uncovered is consistent andor increases over time to become moresimilarwith that foundprior to the extension of the trainingwalls In this scenario itwasexpectedthat thatnewlyexposedareasofKirraReef in2012thatwere dominated by turf algae would be colonised by other organisms including macroalgae spongesascidiansandpotentiallyhardandsoftcoralovertimeTheresultsfrom2014 and2015indicatethatthisprocessisslowlyoccurringonKirraReef
The change in areal extent between 2014 and 2015 was approximately 85 in the northern section of Kirra Reef A small area of the eastern section of Kirra Reef also became exposed between 2014 and 2015 Ongoing monitoring will provide insight into therateoflsquorecoveryrsquoofcommunitiesHowevergiventhesmallchangeinarealextentof KirraReefandrealtivelysimilarfloraandfaunacommunitiessurveyedin2014and2015 monitoringcouldbereducedtobiannuallyIfmonitoringisreducedasubstantialchange (eg 15) in the extent of the exposed reef should be used to triggered annual monitoring
TRESBPKirraReefMarineBiotaMonitoring2015 iv
frc environmental
1 Introduction
frcenvironmentalwascommissionedbytheNewSouthWalesGovernmentDepartment ofPrimary IndustriesLandsR and theQueenslandGovernmentDepartmentofScience Information Technology and Innovation on behalf of the Tweed River Entrance Sand BypassingProject(TRESBP)tomonitortheconditionabundanceandbiodiversityoffloral and faunal communities at Kirra Reef This report presents results of the survey of benthicfloramacro`invertebratefaunaandfishatsitesonKirraReefandatcomparative sitesonPalmBeachReefinMarch2015
The current condition of Kirra Reef was compared with the current condition of nearby Palm Beach Reef and with changes to the Kirra Reef community over time ie with previousassessmentsofKirraReefundertaken in199519962001200320042005 20102012and2014(frcenvironmental2014)
The TRESBP was established in 1995 as a joint initiative of the NSW and Queensland GovernmentstoimproveandmaintainnavigationconditionsattheTweedRiverentrance andtoprovideacontinuingsupplyofsandtothesouthernGoldCoastbeachesconsistent withthenaturalrateoflongshoredriftTheprojectwascarriedoutintwostages
sdot Stage2Implementation of a sand bypassing system to maintain the improvementsachievedduringStage1(fromMay2001onwards)
DuringStage1approximatelythreemillioncubicmetres(m3)ofcleanmarinesand(with lessthan3fines)weredredgedfromtheTweedRiverentranceMostofthedredging materialwasdeliveredout to`10mmeanwaterdepthfromPointDangertoNorthKirra withapproximately600000m3ofcleanmarinesandbeingplacedontheupperbeaches fromRainbowBaytoNorthKirraFromApril2000toFebruary2001additionaldredging activities were undertaken to maintain a clear navigation channel at the Tweed River entrance Prior to the establishment of the permanent sand bypassing system a further 480000m3of clean marine sandwas placed innear`shore areas from PointDanger to CoolangattaBeach
Stage2commissioning trialscommenced in March 2001 and full scale operationof the sand bypassing system commenced in May 2001 Since this time approximately 70millionm3ofpumpedsandand14millionm3ofdredgedsand(derivedfromdredging
TRESBPKirraReefMarineBiotaMonitoring2015 1
frc environmental
oftheTweedRivermouth)havebeendepositedalongthesouthernGoldCoastbeaches Mostofthesanddeliveredthroughpumpinganddredginghasbeenplacedintheprimary placementareasoutheastofSnapperRocks Sand isalsodischarged fromoutletsat Duranbah Beach and occasionally at Snapper Rocks West There is an outlet at Kirra BeachRhowever thishasnotbeenusedsinceDecember2003 Aplacementexclusion zone has been established around Kirra Reef extending a minimum of 100m from the reefedge(1995extent)topreventdirectplacementofsandincloseproximitytothereef (Lawsonetal2001)
sdot provide much needed sand nourishment to the severely eroded southern Gold Coastbeaches
sdot reducetheTweedEntranceBarand
sdot clear a sand trap in the vicinity of the jetty to improve the efficiently of the sand bypasssystem
These project objectives were achieved and the quantity of sand delivered since 2008 has been more consistent with the natural quantity of sand movement along the coast (average natural net longshore sand drfit is estimated to be 500000m3 per year in a northward direction) In 2014 a total of 450232m3 was pumped through the sand bypassing system to the primary placement area at Danger Point From January to February2015anadditional105119m3ofsandwaspumpedthroughthesystem
In 2009 the Queensland government removed approximately 140000m3 of sand from KirraBeachintertidalzonetothelowprofilebackdunesIn2013theCityofGoldCoast extendedKirragroyneby30m
12 HistoricalContextforKirraReefMonitoring
Kirra Reef is the collective name given to the complex of rocky outcrops located a few hundredmetresoffshoreofKirraBeachatbetween`3and`10mandwithintheinfluence
TRESBPKirraReefMarineBiotaMonitoring2015 2
frc environmental
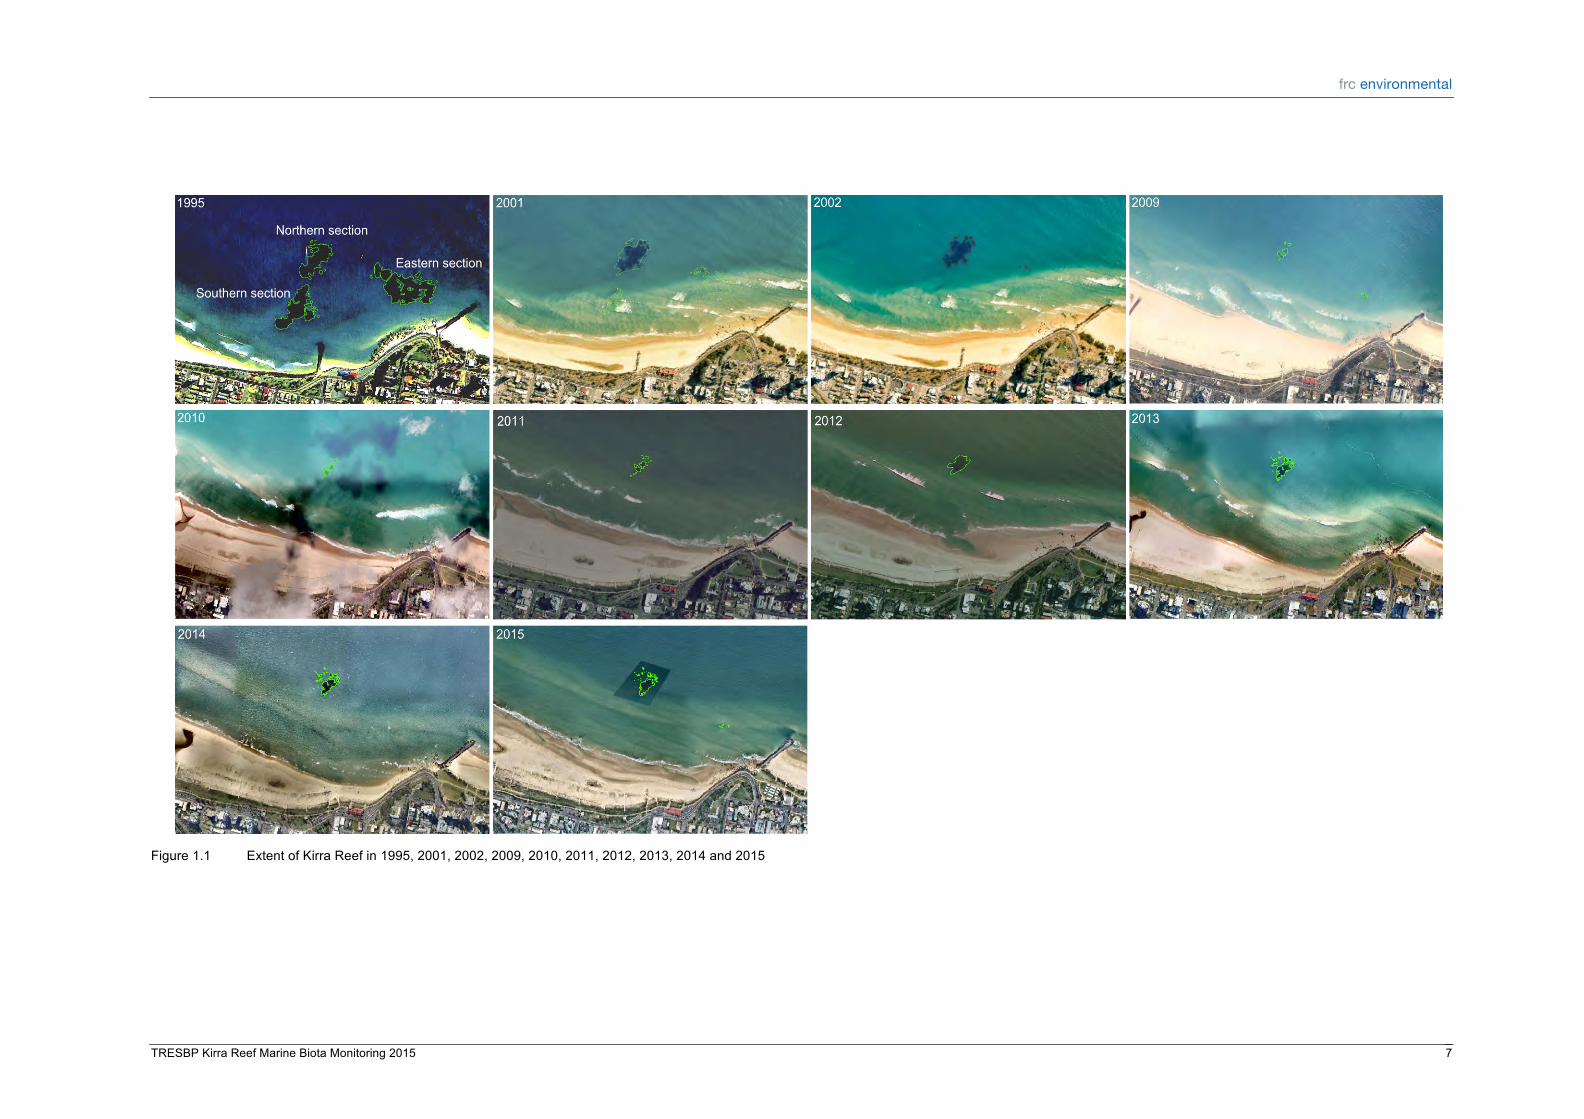
of wave action It is subject to naturally shifting sands that intermittently cover and uncover the reefrsquos rocky outcrops (TRESBP 2015a) The exposed extent of Kirra Reef hasvariedoverthepast50yearsduetonaturalstormeventsandchangestothecoastal environmentsuchastheextensionoftheTweedRivertrainingwallsinthemid`1960sand commencementoftheTRESBP(TRESBP2015a)Therearethreemajoroutcropsofthe reefthenorthernsouthernandeasternsectionswhichhavebeenvariouslyexposedin thepast(refertoTable11andFigure11)
MonitoringofKirraReef is requiredunderaproject`specificEnvironmentalManagement System (EMS) prepared by the TRESBP in February 20011 Under EMS SubgtPlan B14 KirraReefManagementPlaniftheareaofexposedreefonaerialphotographsissmaller thantherangeofareasshownonaerialphotographsfrom1962to1965thenmonitoring ofthemarinebiotaofKirraReefisrequired
frcenvironmentalcompletedabaselineassessmentofKirraReefinAprilandJune1995 (FisheriesResearchConsultants1995a)(FisheriesResearchConsultants1995b)andhas undertaken nine subsequent ecological monitoring surveys of the reef on behalf of TRESBP in February 1996 January 2001 May 2003 March 2004 February 2005 February 2010 July 2012 April 2014 (Fisheries Research Consultants 1996R frc environmental2001R2003R2004R2005R2010)andthecurrentsurveyinMarch2015
13 TemporalChangesintheAreaofExposedReef
AreductionintheexposedextentofKirraReefwaspredictedintheprojectrsquosEIS(Hyder Consulting 1997) It was also expected that Kirra Reef would return to pre`1960rsquos conditions before the extension of the Tweed River breakwaters that interrupted the northerlymovementofsandwereconstructed(Lawsonetal2001)
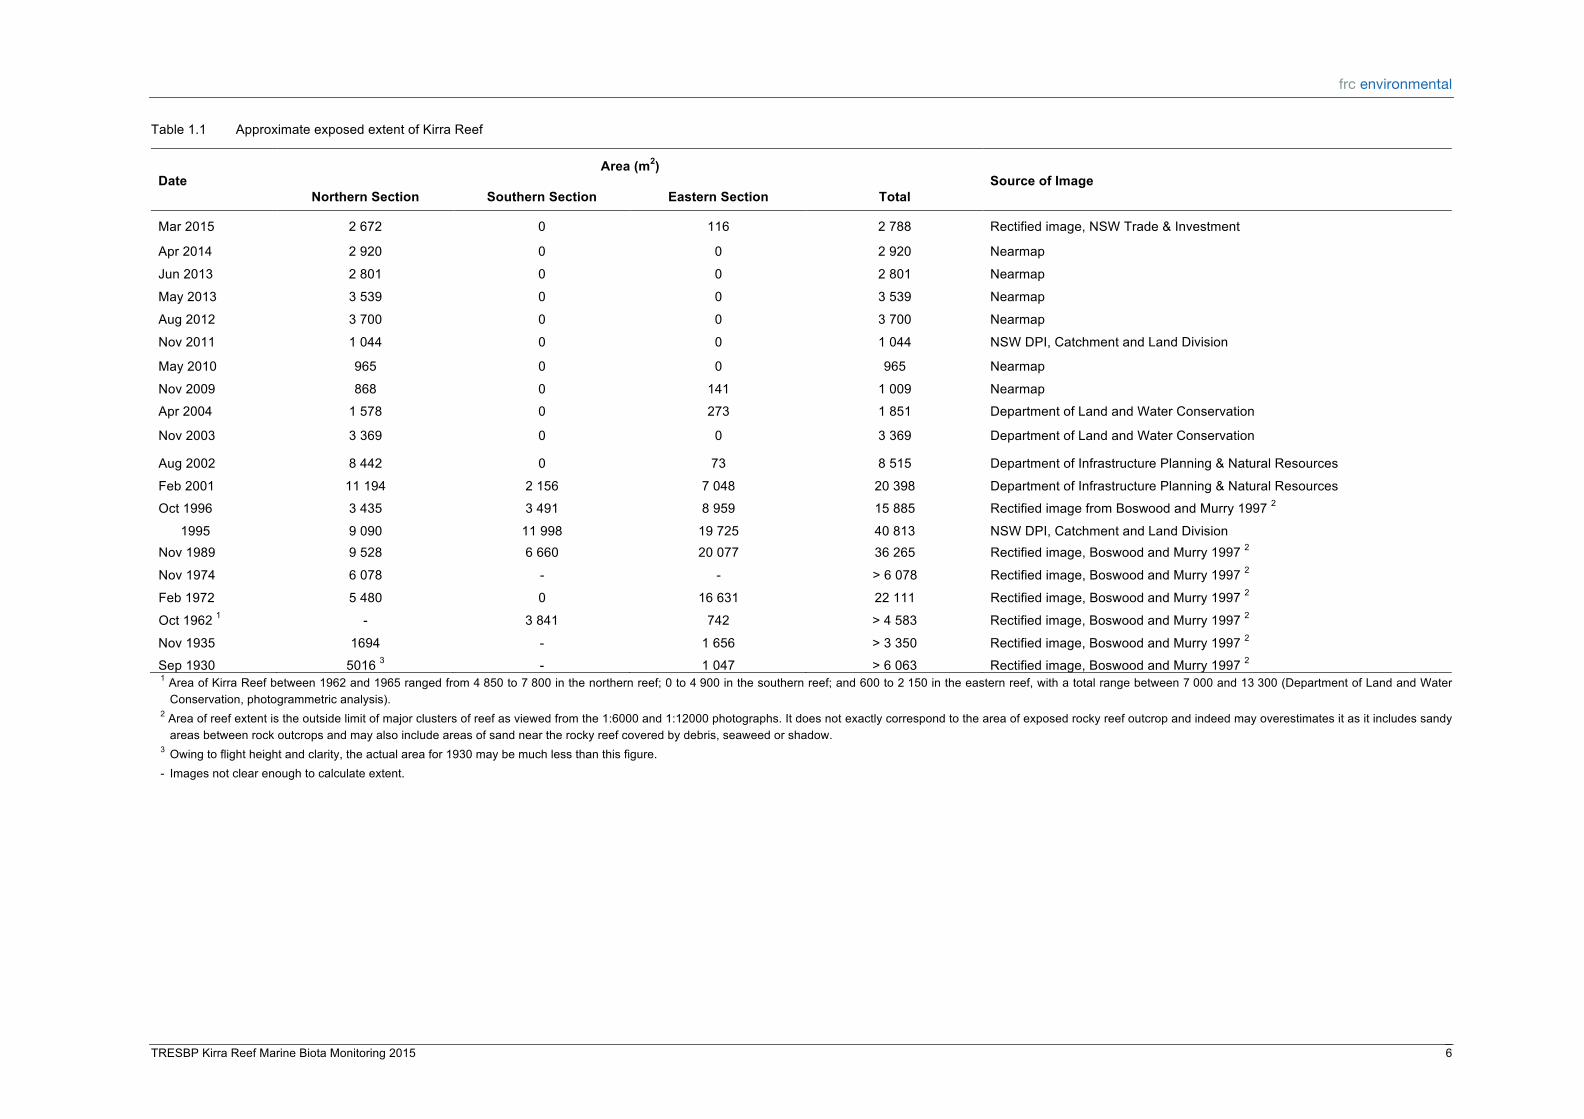
Prior to 1960 Kirra Reef was partially covered by sand which varied naturally with the naturalsupplyofsandandwaveenergyDuringthe1960rsquosfollowingtheextensionofthe Tweed River training walls between 1962 and 1965 Kirra Reef became increasingly exposed due to the depleted sand supply (note the increase in area of Kirra Reef from 1962 to1972 inTable11) Following theKirraPointgroynecontruction in1972 there was further depletion of sand supply and Kirra Reef was perennially exposed (note the increaseinareaofKirraReeffrom1972to1995inTable11RrefertoFigure11forthe extentofreefin1995)Kirrareefgroynewasshortened(from175mto145m)in1996
1 The ongoing reef monitoring also incorporates additional monitoring activities implemented by the
TRESBPinAugust2004
TRESBPKirraReefMarineBiotaMonitoring2015 3
frc environmental
AccumulationofsandonKirraReefwasobservedasaresultofindirectsandnourishment bytheTRESBP(notethedecreaseinareaofKirraReefafter1995inTable11)Aerial photographs taken in 2003 and 2004 showed the reef to be of significantly less extent than the range of extent observed in 1962 and 1965 (Table 11) Loss of reef area continuedforsomeyearsandbyearly2006theareaofexposedreefhadbeenreduced to lt100m2 There was a substantial lag between the reduction in sand delivery and transportof thesand furthernorthdue toaperiodofcalmer thanusualconditionswith reducedstormactivityfromthenorth`eastAssuchdispersionofsandfromKirraBeach andreductioninthesandlevelsaroundthereefbetween2005and2009wasslowerthan predicted (refer to Figure 11 for the extent of reef in 2009) As a consequence of the extensiveburialofthereefsimplevisualinspectionsofthereefwereundertakeninplace offullecologicalsurveysbetween2006and20102
In2009eightyearsaftertheinitiationofsandpumpingbytheTRESBPbeganaseriesof storms shifted approximately 200000 m3 of sand from Kirra Beach to the north This storm was the worst protracted storm for east facing beahes in at least 14 years with significant wave heights remaining for four days (TRESBP 2014) This along with the removalofapproximately140000m3ofsandfromtheKirraBeachintertidalzoneagain uncoveredpartsofKirraReef (TRESBP2015a) Since2008sanddeliveryvolumesof the TRESBP have been more consistent with the natural quantity of sand movement alongthecoastEcologicalsurveysrecommencedin2010astheexposedareasofKirra Reefincreasedinextent
Between November 2011 and August 2012 there was a large increase in the northern section of Kirra Reef when the area of exposed rock more than doubled (Table 11R Figure11) This corresponds to a lsquostormy yearrsquowith one severe storm and twomajor storms recorded (TRESBP 2015b) Further stormy conditions were recorded in early 2013withoneextremestorm(approximately110yearevent)inJanuaryandonemajor storminFebruary(TRESBP2015)Therewaslittlechangeinthetotalareaofexposed reefduring this time (note thesimilarareaofAugust2012andMay2013 inTable11) Howevertherewascleardistributionchangesintheareasofexposedrock(Figure11) Thereefareahasremainedrelativelystablesince2013withminorchangesintheareaof rock exposed (Table 11R Figure 11) Wave height data since 2013 indicates calm to moderate conditions with only minor storms recorded except in May 2015 when there wasaseverestorm(TRESBP2015)Inlate2013KirraPointgroynewasreinstatedby 30mtoitsorginalconstructedlengthGiventheminorchangesintheexposedrocksince
2 Underwater visual inspections were completed by Gilbert Diving and Gold Coast City Council from
In2014KirraReefcoveredanareaof2920m2Rpredominantlyinthenorthernsectionof thereefInMarch2015thisnorthernsectioncoveredanareaofapproximately2672m2 (Figure11andFigure12)an85decreaseintheexposedextentbetween2014and 2015 In March 2015 the rocky outcrops were typically between 1 and 2m above the cleanmobilesandwithseveraloutcropsextendingtomorethan2mabovethesandA small section (116m2) of the eastern reef wasalsoexposed inMarch 2015 (Figure 11 andFigure12)Howeverthereefarearemainslessthan50oftheextentrecordedin 1962and1995beforetheTRESBPbegan(Table11Rreefareabetween1962and1965 was between 7000 and 13300 Department of Land and Water Conservation photogrammetricanalysis)
TRESBPKirraReefMarineBiotaMonitoring2015 5
frc environmental
Table11 ApproximateexposedextentofKirraReef
Area(m2) Date SourceofImage
NorthernSection SouthernSection EasternSection Total
The southeast Queensland (SEQ) region comprises five subregions the Gold Coast Inner Moreton Bay Outer Moreton Bay Sunshine Coast and Fraser Coast Coral communities within SEQ are diverse with an extensive range of coral growth forms (Harrison et al 1998) The greatest diversity of coral species are typically found at offshoresites likeFlindersReefswhere119differentcoralspecieshavebeen recorded (Harrisonetal1998)
Subtidal rocky reefs of the Gold Coast region comprise remnants of highly eroded volcanic substratum isolated by wide variable expanses of soft sediment (Edwards amp Smith 2005) They support community assemblages that are indicative of a transition between the tropical waters of the Great Barrier Reef and the temperate waters characteristicofthemidNewSouthWalescoast(Done1982XCannonetal1987)
GoldCoastreefcommunitiesarebroadlysimilartoareasofcomparabletopographytothe north(InnerGneeringsoffshorefromMooloolabaandoffshoreofMoretonBay)andtothe south (Julian Rocks offshore of Byron Bay) that are dominated by macroalgae and sessile invertbrates(FisheriesResearchConsultants1991XHarriottetal1999XEdwards amp Smith 2005X Baronio amp Butcher 2008X Fellegara 2008X SchlacherHoenlinger et al 2009)ManyoftheGoldCoastsreefslocatedclosetoshoreareoftenaffectedbyhuman activities (Noriega 2007)and typicallyhave lesscoralcover Ina2013surveyofSEQ reefsGoldCoastreefshadthelowesthardcoralcoverat9(Hutchinsonetal2013)
Fish of the Gold Coast region are similar in community composition to that recorded offshore of Moreton Bay at Julian Rocks and the Solitary Islands offshore of Coffs Harbourandtoa lesserextentat theexHMASBrisbanenearMooloolaba(Robinsonamp Pollard 1982X Parker 1995X Parker 1999X Edwards amp Smith 2005X Malcolm et al 2009X SchlacherHoenlingeretal2009) The smaller inshore reefsof theGoldCoast region suchasKirraReeftypicallysupportalowerabundanceanddiversityoffishes(Edwards ampSmith2005Xfrcenvironmental2005)
Kirra$Reef$
ThebenthicassemblagesofKirraReefarecharacterisedbyahighcoverofmacroalgae andturfalgaeandamoderatecoverofsessilebenthicinvertebratesincludingafewhard corals(EdwardsampSmith2005Xfrcenvironmental2005)Turfalagecoversthemajorityof the reef substrate Crinoids (feather stars) ascidians (sea squirts) and sponges are typically themostabundantbenthic faunawhilstanemonessoftcoralsandurchinsare present in low numbers (frc environmental 2014) The composition of benthic assemblagesatKirraReef isbroadlysimilar to thatdescribed fromadjacent rockyreefs
Exposuretowaveactionsandscouringandsmotheringareimportantfactorsinfluencing the distribution and abundance of sessile species on rocky reefs (Kay amp Keough 1981X McGuinness1987)ChangeintheheightofsandaroundthebaseofKirraReefappears to be a major factor influencing the abundance (cover) of benthic flora and fauna periodically resulting in a bare stratum on rocks within 08 to 1m of the seafloor Outcropsontheeasternsectionof thereefcomplexwherewaveactionand likelysand abrasion are greatest have historically supported a lower abundance of benthic fauna than outcrops on the northern section (Fisheries Research Consultants 1995a)X (Fisheries Research Consultants 1995b)X (Fisheries Research Consultants 1996)X (frc environmental 2003)X (frc environmental 2004)X (frc environmental 2005)X (frc environmental2010)
Strong wave action results in sustained abrasion of the dominant brown macroalgae (Sargassum(flavicans(andEcklonia( radiata)causing the fronds tobreak Thecontinual resuspensionofalgal fragments(commonlyreferredtoas lsquocornflakesrsquo)candramatically reducewaterclarityandvisibility Algal fragmentswere largelyabsent inJuly2012and April2014surveyslikelyduetolongperiodsofrelativelybenignseaconditionsInMarch 2015amoderateamountofalgalfragmentswasobservedlikelyduetostormactivityin theweeksproceedingthesurvey(egmoderateseas11to14Februaryandminorstorm over1922February)
RecentsurveysatPalmBeachReefcompletedbyReefCheckrecordedadeclineinhard coralcover from2008to2013(Hutchinsonetal2013) Sessile invertebrates including spongescoralsandascidianstypicallydominatethebenthicassemblageofPalmBeach Reef(EdwardsampSmith2005X frcenvironmental2005XReefCheck2010) Thecoverof sessileinvertebrateshashistoricallybeensimilartothatrecordedfromtheoutersections of Kirra Reef However the cover of macroalgae has consistently been loweron Palm BeachReefthanonKirraReefTheproximityofPalmBeachReeftotwocreekmouths andtheabsenceofstrongcurrentsintheareatypicallyresultsinahighlevelofturbidity Elevated turbidity together with greater water depth and a high abundance of grazing
TRESBPKirraReefMarineBiotaMonitoring2015 10
frc environmental
speciessuchasurchinsislikelytocontributetoarelativelylowcoverofmacroalgaeand abundant suspension feeding organisms such as ascidians sponges hydrozoans and crinoidsatPalmBeachReef(Smithetal2005)
PalmBeachhasa lowerabundanceanddiversityof benthicdemersaland pelagic fish comparedtoKirraReef(Smithetal2005)ThegreaterdensityoffishatKirraReefmay beaconsequenceof the lossof reef forcingmore fish intoasmallerarea (Smithetal 2005)PalmbeachrecordedaslightlylowerdiversityoffishthanKirraReefin2012and 2014surveys(frcenvironmental2012Xfrcenvironmental2014)
TRESBPKirraReefMarineBiotaMonitoring2015 11
frc environmental
2$ Methods$
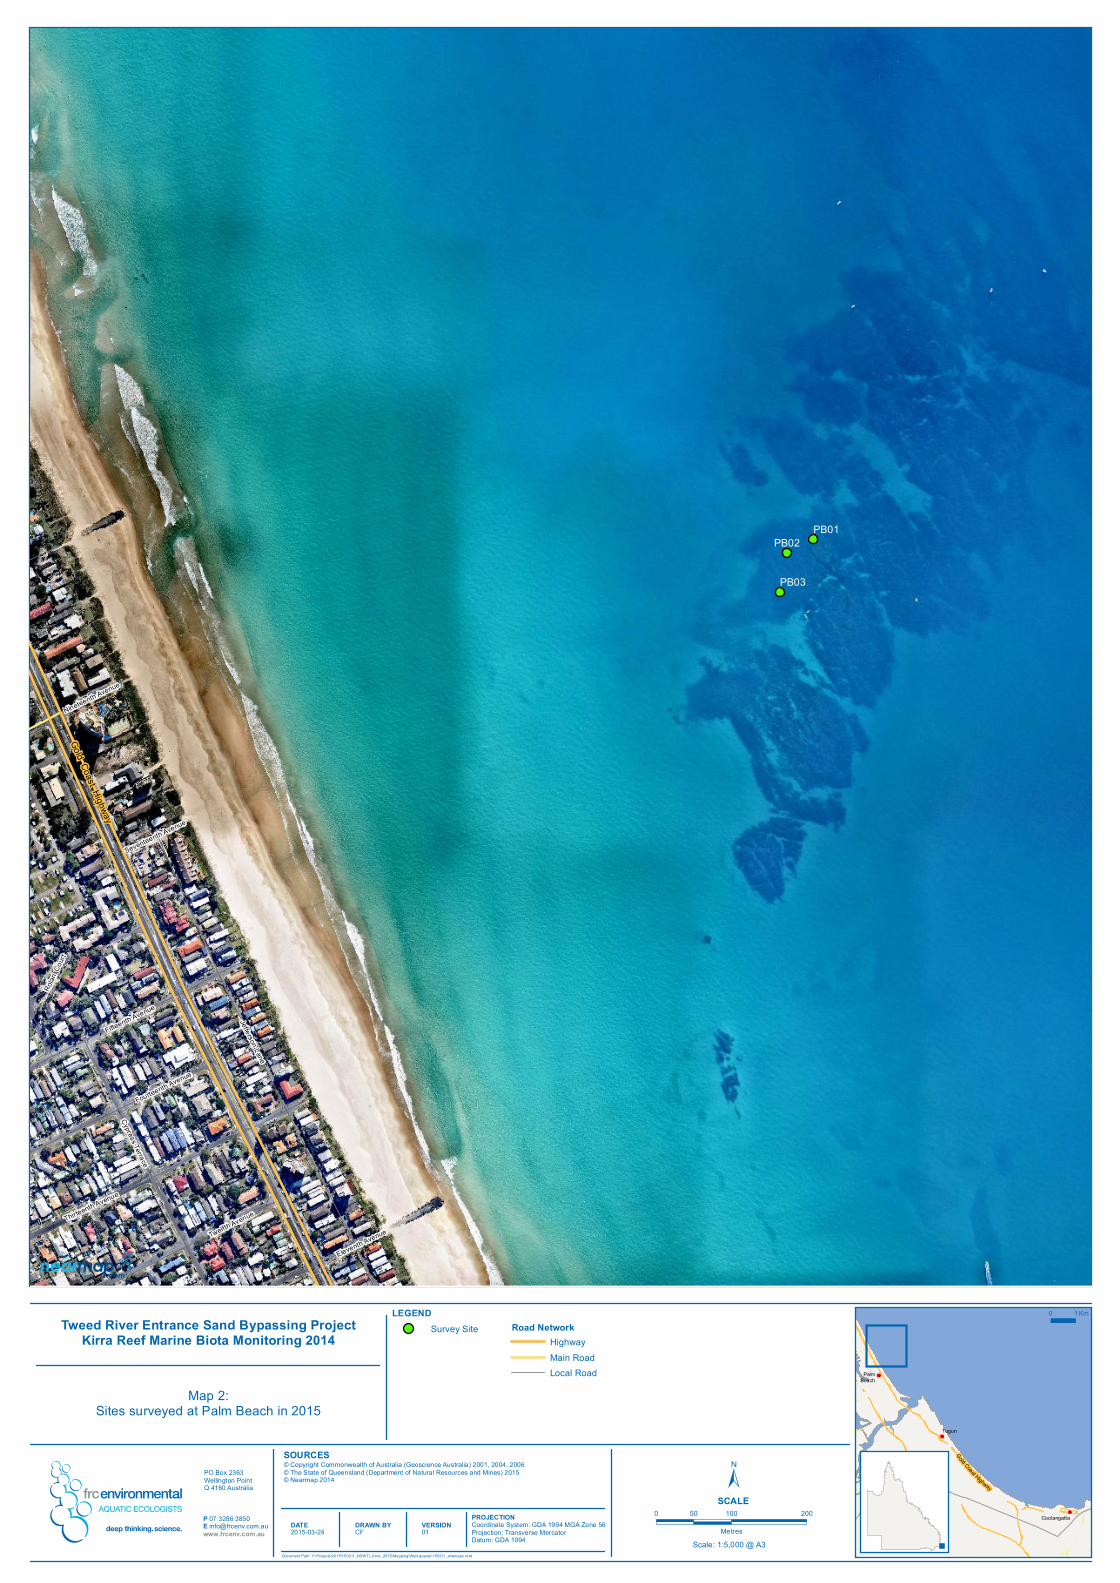
The methods used in the March 2015 survey were developed for the Stage I survey completed in April and June 1995 and used for subsequent surveys February 1996 January 2001 May 2003 March 2004 February 2005 February 2010 July 2012 and April2014 Datawere collected from KirraReef (2816251535309) andPalmBeach Reef(2810751534774)locatedapproximately9kmnorth(Figure21)
Themainobjectiveof the monitoring was to investigateanychange in the marinebiota and habitat of Kirra Reef compared to Palm Beach Reef (comparative reef) in order to assesstheeffectofthesandbypassproject(andsubsequentincreasesinsandload)on theecologyofKirraReef
0 2 41
Kilometres
Service Layer Credits Sources Esri HERE DeLorme Intermap increment P Corp GEBCO USGS FAO NPS NRCAN GeoBase IGN Kadaster NL Ordnance
0 2 41
Kilometres
Service Layer Credits Sources Esri HERE DeLorme Intermap increment P Corp GEBCO USGS FAO NPS NRCAN GeoBase IGN Kadaster NL Ordnance
Threesites(KRN1KRN2KRO3)atKirraReef(waterdepth5to8m)weresurveyedin March 2015 (Map 1) The remainder of the sites previously surveyed were covered by sand(refertoappendixAforahistoryofsitespreviouslysurveyed)Threecomparative sites (PB1 PB2 and PB3) were also surveyed at Palm Beach Reef (water depth 12 to 17m)(Map2)
TRESBPKirraReefMarineBiotaMonitoring2015 12
orth NetreStkicrraG
Marine Parade
t eertS ickr
M rarin ae Pa Grade
Musgrave St
t
re ee e Powel t r lt CrescenS t t es eel ri tM S
t ee ge drt u tleS d Rro MuL sgrave Street
LEGEND 0 1 Km Tweed River E ntrance Sand Bypassing Project Survey Site Road Network
copy Copyright Commonwealth of Australia (Geoscience Australia) 2001 2004 2006copy The State of Queensland (Department of Natural Resources and Mines) 2015copy Nearmap 2014
DATE2015-03-24
DRAWN BYCF
VERSION01
PROJECTIONCoordinate System GDA 1994 MGA Zone 56Projection Transverse MercatorDatum GDA 1994
plusmn SCALE
0 50 100 200
Metres
Scale 15000 A3
Gold Coast Highway
i
PalmBeach
Tugun
Coolangatta
0 1 Km
frc environmental
22$ Benthic$Flora$and$Macroinvertebrates$
At each site benthic assemblages were surveyed in fifteen 025m2 quadrats with the percentcoverofbenthicmacroalgaeturfalgaespongesascidianshardcoralsandsoft coralsassessedvisually(Figure22)Quadratswereplacedhaphazardlywhichincluded horizontal and sloping surfaces The minimum distance between quadrats was approximately2m Thenumberof largeascidians (Pyurastolonifera)crinoids (feather stars)barnaclesurchinstubewormspolychaeteshydroidszoanthidsandcowriesand the dominant species of macroalgae were also recorded and quantitative notes were madeontheapparenthealthofeachtaxonomicgroup
ThespeciesrichnessandrelativeabundanceoffishatKirraReefandPalmBeachReef were assessed using a combination of underwater visual census (UVC) and video surveys The combination of these techniques represents the most costeffective and efficientmeansofobtainingdataonthestructureoffishassemblagesindifferenthabitats (Murphy amp Jenkins 2010) A baited remote underwater video (BRUVX baited with pilchards) and footage captured by a diver swimming hapazard trasects over the reef wererecorded
Video footage from each BRUV (approximately 20minutes) and video transects (approximately 35 minutes) was reviewed by an ecologist experienced in marine fish identification
24$ Data$Analysis$
Permutational multivariate analysis of variance (PERMANOVA) was used to determine differences in the composition (cover of benthic fauna and taxonomic group) of benthic assemblagesbetweenKirraReefandPalmBeachReefover time PERMANOVAuses permutational methods (PsuedoAF) to derive statistical significance which require fewer assumptionstobemetthananalogousmethodssuchasmultivariateanalysisofvariance (MANOVA) (Anderson 2001X Anderson et al 2008) This analysis enables an examinationofchangesinthecommunityasawhole
A three factor PERMANOVA was used to examine differences in the composition of benthic assemblages with survey (fixed factor) locations (Palm Beach Reef and Kirra Reeffixedfactor)andsites(nestedinlocationsasarandomfactor)asthefactorsData weresquareroot transformedtodownweightdominatingspeciesabundanceXconverted toaBrayCurtisdistancematrixXandtestedforsignificanceusingasmanypermutations as allowed (9800 to 9937 unique permuations achieved for all factors and factor combinationsXexceptlocationwhere10uniquepermutationswereachieved))Posthoc pairwisetestwasusedtodeterminethemagnitudeofdifference
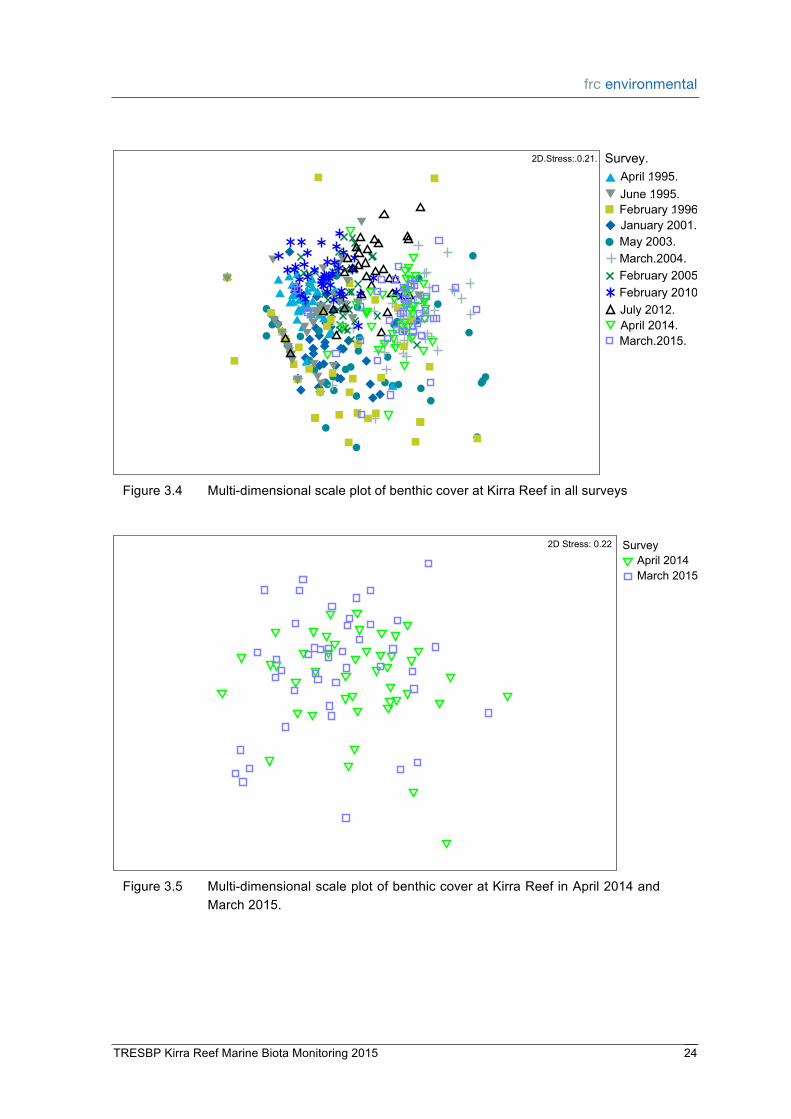
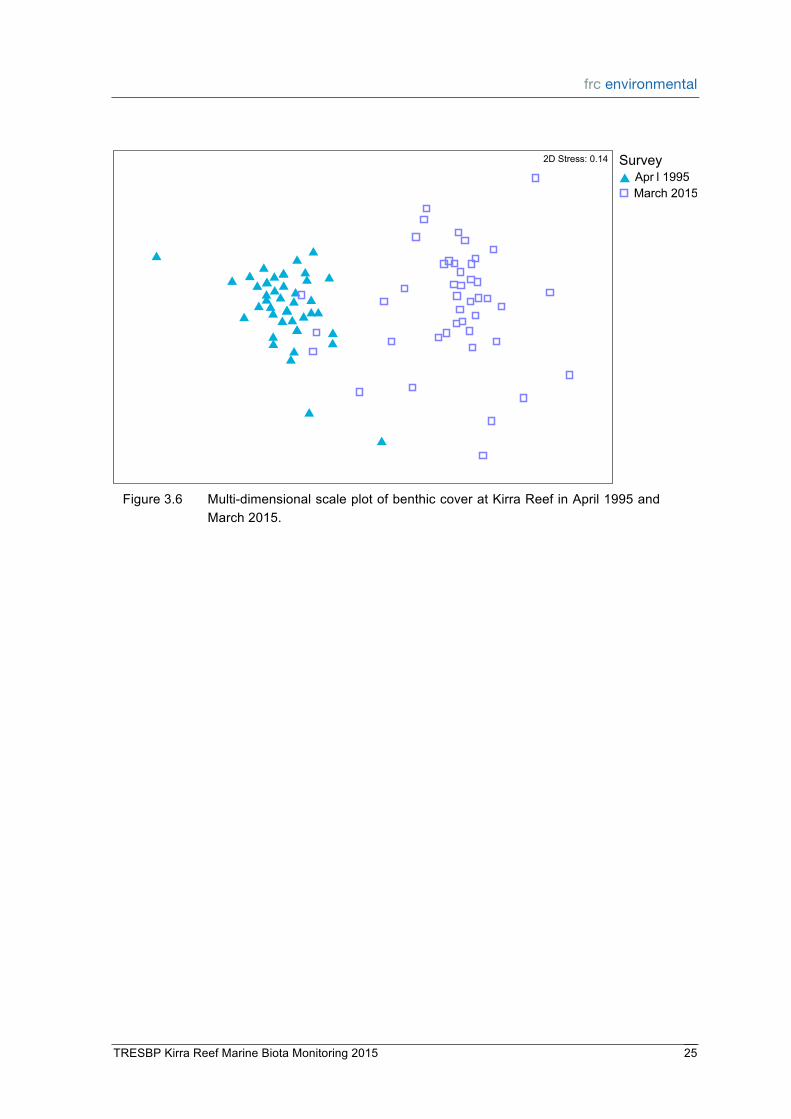
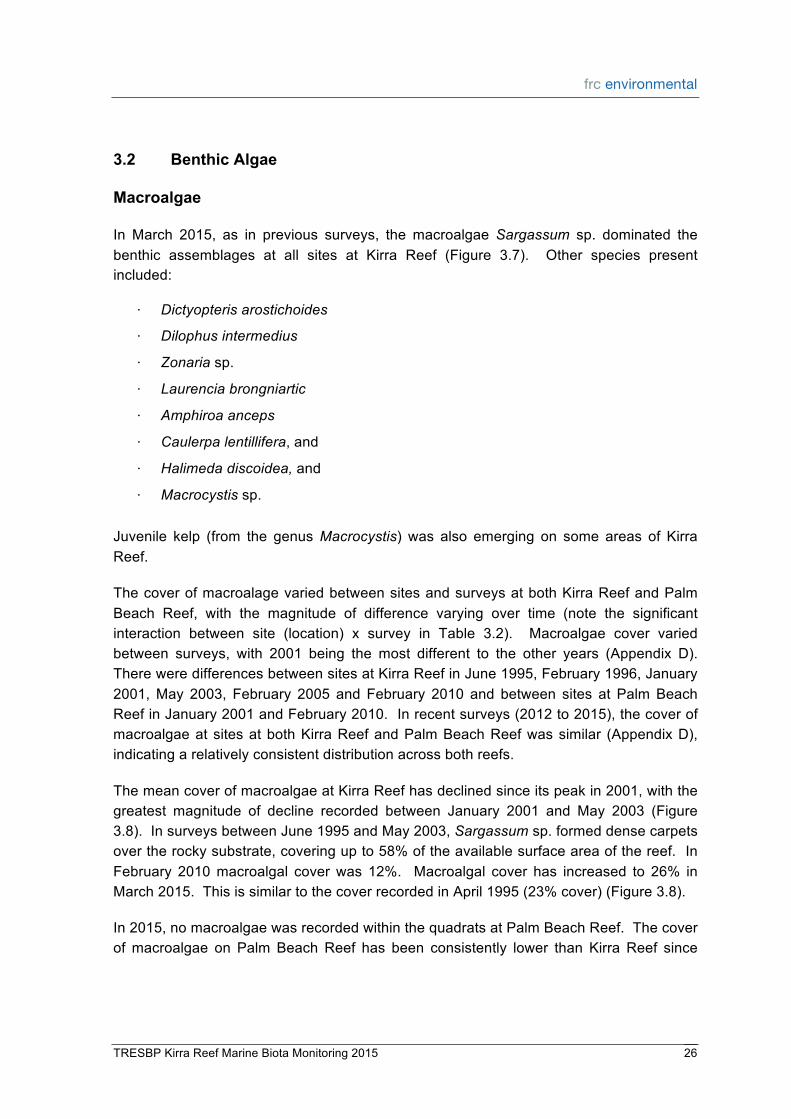
Nonmetricmultidimensionalscaling (nMDS)ordinationswereused tovisually represent the variation in the composition of assemblages between reefs separately for each survey nMDS ordinations were also used to visually represent the variation in the compositionofassemblagessurveysatKirraReefforallsurveysXbaselinesurveyinApril 1995andMarch2015XandApril2014andMarch2015
Separate univariate PERMANOVAs were used to compare differences in the cover of macroalgae turf algae and the abundance of crinoids and ascidians Data were
TRESBPKirraReefMarineBiotaMonitoring2015 16
frc environmental
converted to a eucildean distances matrixX and tested for significance using as many permutations as allowed (998 to 999 unique permuations achieved for all factors and factor combinationsX except location where 10 unique permutations were achieved) Factors were survey (fixed factor) locations (Palm Beach Reef and Kirra Reef fixed factor)andsites (nested in locationsanda random factor) Posthoc pairwise testwas used to determine the magnitude of difference Monte Carlo procedures were used to calculateempiricalPvaluesforthesurveyxlocationtest
Further information on the use and interpretation of PERMANOVA and other analyses usedinthisreportisprovidedinAppendixB
TRESBPKirraReefMarineBiotaMonitoring2015 17
frc environmental
3$ Results$
31$ Cover$of$Benthic$Assemblages$
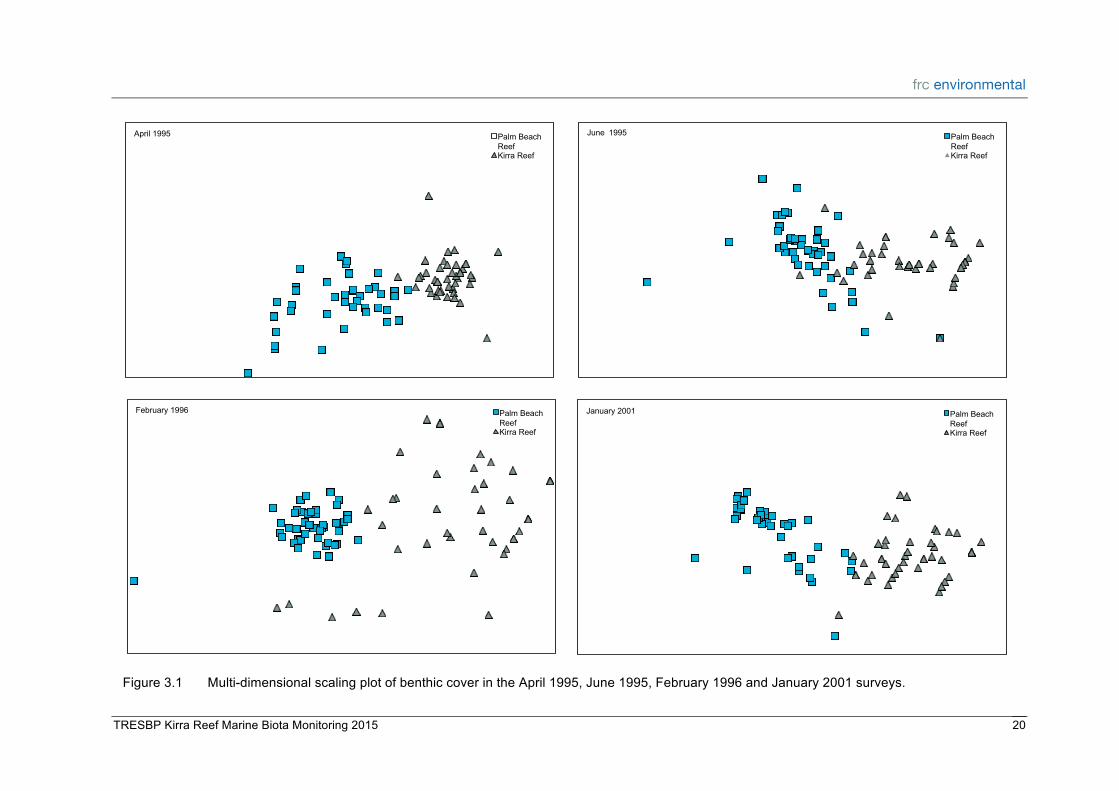
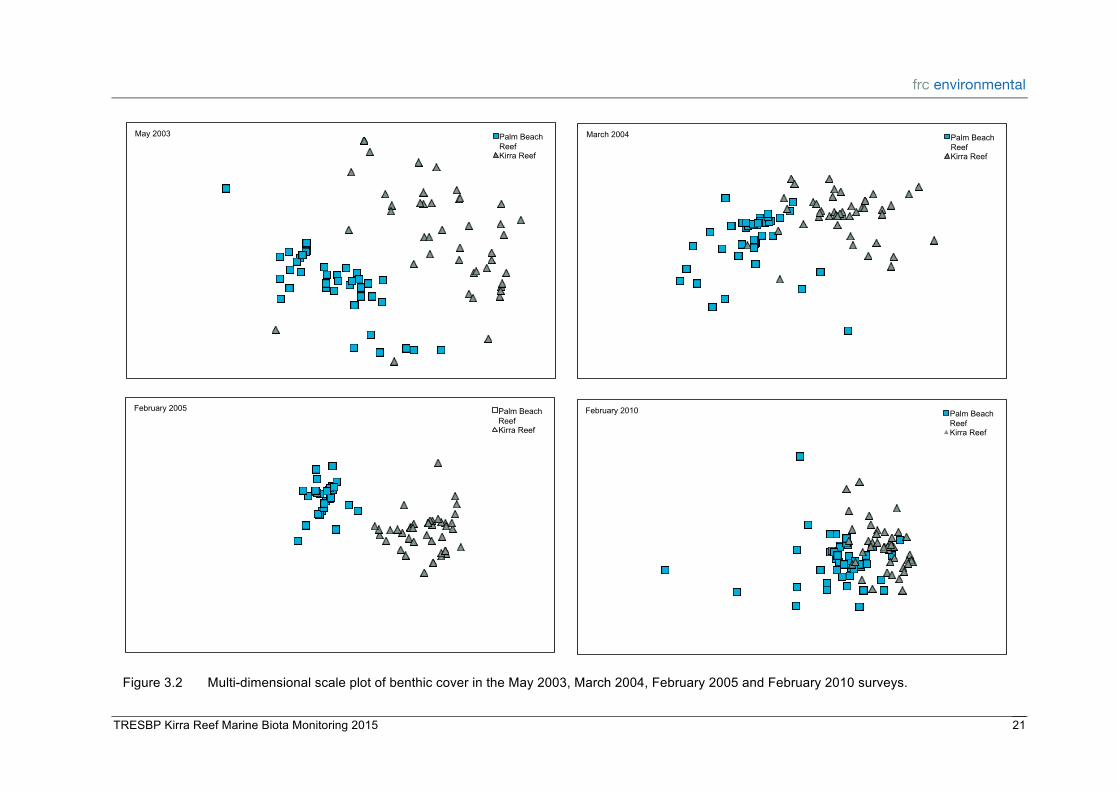
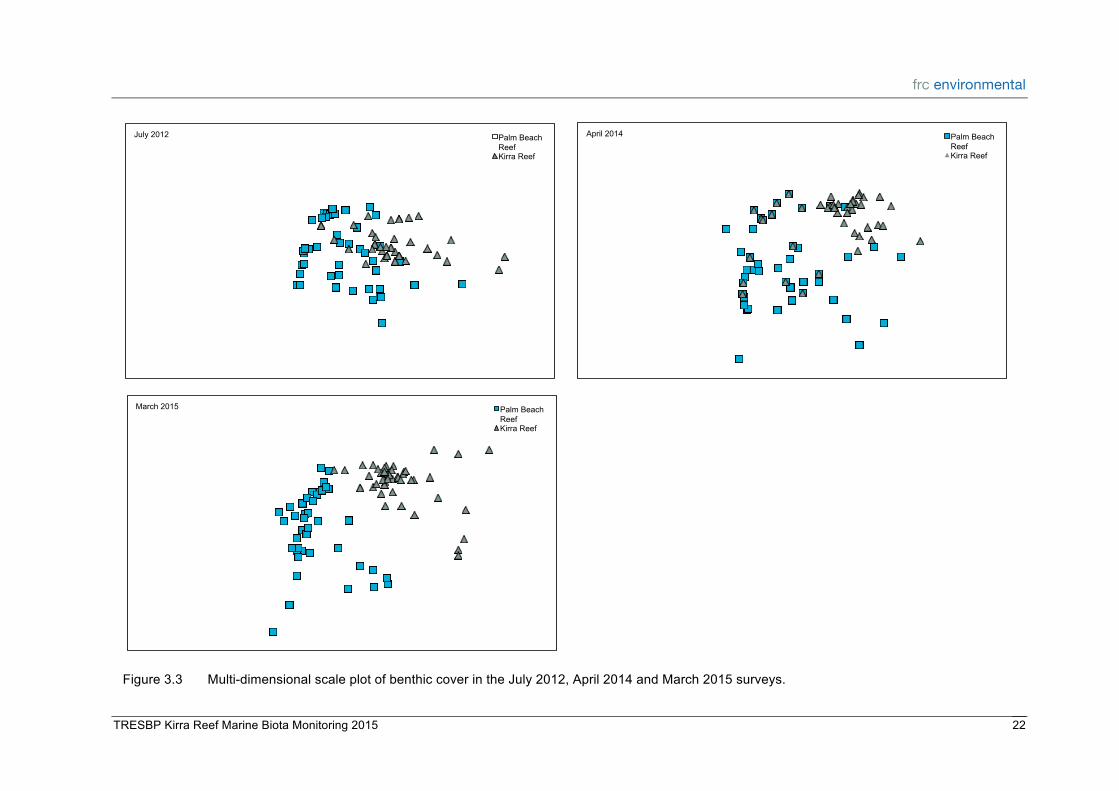
The composition of benthic fauna and flora ( cover and type combined Appendix C) variedbetweenmostsitesatbothKirraReefandPalmBeachReefandbetweennearly allsurveysateachsite(notethesignificantinteractionofsite(location)xsurveyinTable 31X Appendix D) Nevertheless there appeared to be substantial differences in the compositionofthebenthicassemblagesbetweenthetworeefsineachsurveyfrom1995 to2015(Figure31toFigure33)
In2015 therewassomeoverlap in thecompositionofassemblagesonKirraandPalm Beach Reefs (Figure 33) However there was also some clear patterns of difference including
Benthic assemblages at Kirra Reef appeared to show some overlap between surveys (Figure34H) HowevernearlyallsurveysweredifferentateachsiteatbothKirraReef andPalmBeachReef(AppendixD)BenthicassemblagesinMarch2015andApril2014 wereverysimilarcomparedtobenthicassemblages inthebaselinesurvey inApril1995 andMarch2015(notethegreateroverlapinFigure35comparedtoFigure36)
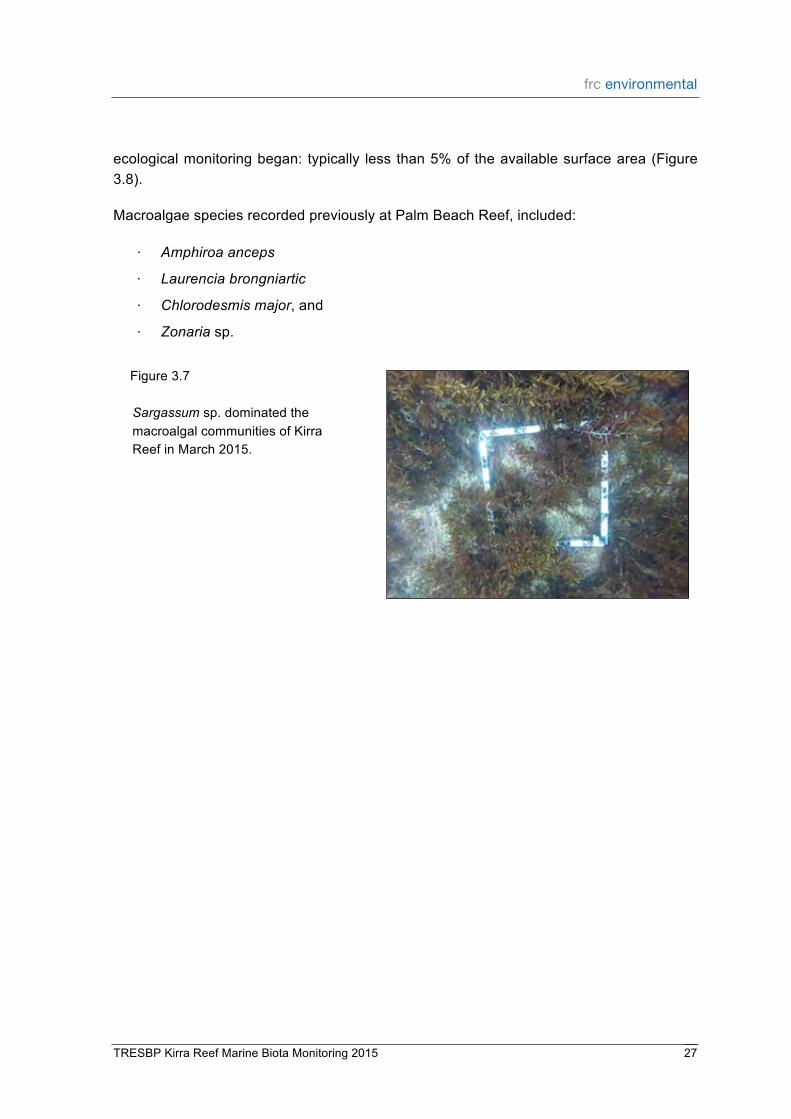
In March 2015 as in previous surveys the macroalgae Sargassum sp dominated the benthic assemblages at all sites at Kirra Reef (Figure 37) Other species present included
sdot Dictyopteris0arostichoides0
sdot Dilophus0intermedius00
sdot Zonariasp
sdot Laurencia0brongniartic0
sdot Amphiroa0anceps0
sdot Caulerpa0lentilliferaand
sdot Halimeda0discoideaand
sdot Macrocystissp
Juvenile kelp (from the genus Macrocystis) was also emerging on some areas of Kirra Reef
ThecoverofmacroalagevariedbetweensitesandsurveysatbothKirraReefandPalm Beach Reef with the magnitude of difference varying over time (note the significant interaction between site (location) x survey in Table 32) Macroalgae cover varied between surveys with 2001 being the most different to the other years (Appendix D) ThereweredifferencesbetweensitesatKirraReefinJune1995February1996January 2001 May 2003 February 2005 and February 2010 and between sites at Palm Beach ReefinJanuary2001andFebruary2010Inrecentsurveys(2012to2015)thecoverof macroalgaeatsitesatbothKirraReefandPalmBeachReefwassimilar (AppendixD) indicatingarelativelyconsistentdistributionacrossbothreefs
ThemeancoverofmacroalgaeatKirraReefhasdeclinedsinceitspeakin2001withthe greatest magnitude of decline recorded between January 2001 and May 2003 (Figure 38)InsurveysbetweenJune1995andMay2003Sargassumspformeddensecarpets overtherockysubstratecoveringupto58oftheavailablesurfaceareaofthereefIn February 2010 macroalgal cover was 12 Macroalgal cover has increased to 26 in March2015ThisissimilartothecoverrecordedinApril1995(23cover)(Figure38)
In2015nomacroalgaewasrecordedwithinthequadratsatPalmBeachReefThecover of macroalgae on Palm Beach Reef has been consistently lower than Kirra Reef since
TRESBPKirraReefMarineBiotaMonitoring2015 26
frc environmental
ecologicalmonitoringbegan typically lessthan5of theavailablesurfacearea(Figure 38)
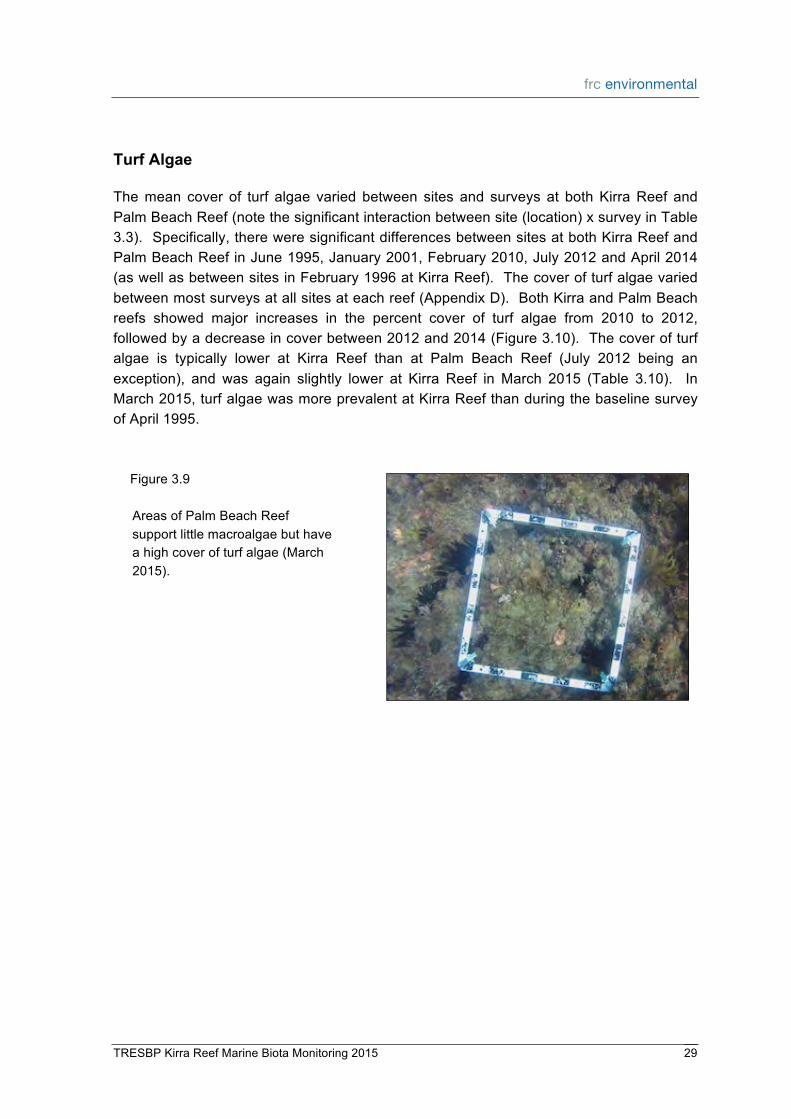
The mean cover of turf algae varied between sites and surveys at both Kirra Reef and PalmBeachReef(notethesignificantinteractionbetweensite(location)xsurveyinTable 33)SpecificallythereweresignificantdifferencesbetweensitesatbothKirraReefand PalmBeachReefinJune1995January2001February2010July2012andApril2014 (aswellasbetweensitesinFebruary1996atKirraReef)Thecoverofturfalgaevaried betweenmostsurveysatallsitesateachreef(AppendixD)BothKirraandPalmBeach reefs showed major increases in the percent cover of turf algae from 2010 to 2012 followedbyadecreaseincoverbetween2012and2014(Figure310)Thecoverofturf algae is typically lower at Kirra Reef than at Palm Beach Reef (July 2012 being an exception) and was again slightly lower at Kirra Reef in March 2015 (Table 310) In March2015turfalgaewasmoreprevalentatKirraReefthanduringthebaselinesurvey ofApril1995
ThemeancoverofspongesatsomesitesatbothKirraReefandPalmBeachReefhas varied significantly during some surveys (note the significant interaction between site (location)xsurvey inTable34HFigure311) However thecoverofspongestendedto bemore temporallyvariable atKirraReef than at Palm Beach Reef (Figure312) The cover of sponges at Kirra Reef varied between sites in February 1996 January 2001 March2004July2012andApril2014 However thecoverofspongesatPalmBeach Reefonlyvariedbetweensites inJanuary2001andFebruary2010 (AppendixD) The cover of sponges varied between survey at each site with 1995 1996 and 2001 most differenttootheryears(AppendixD)
ThemeancoverofspongesatKirraReefdeclinedbetweenMarch2004(20cover)and February 2010 (less than 1 cover) Since 2010 the cover of sponges has increased slightly with sponges covering 8 of the reef in March 2015 (Figure 312) In March 2015thecoverofspongeswashigherthanrecordedduringthebaselinesurveyinApril 1995(3cover)(Figure312)
Figure312 Mean cover of sponges (plusmnSE) at Kirra Reef and Palm Beach Reef on all
surveys
Table34 Univariate PERMANOVA results for differences in the cover of sponges betweensurveysandlocations
Factor$ df$ MS$effect$ PseudoF$ p$(perm)$
survey 10 18576 276 0018
location 1 39671 589 0210
site(location) 4 67354 477 0001
locationxsurvey 10 1490 221 0032
site(location)xsurvey 40 67331 477 0001
error 924 14108
Shadingdenotessignificanceatplt005
TRESBPKirraReefMarineBiotaMonitoring2015 32
frc environmental
Ascidians$
ThemeanabundanceofallascidiansotherthanPyura0stoloniferahasvariedsignifcantly between sites at Kirra Reef and Palm Beach Reef and between surveys at each site (Figure314andnotethesignificantinteractionbetweensite(location)xsurveyinTable 35) The abundance of ascidians was different between sites at Kirra Reef in January 2001May2003March2004February2005andApril2014HanddifferentatPalmBeach ReefinJanuary2001February2005February2010andMarch2015Theabundance ofascidiansvariedbetweensurveysateachsitewith1995beingmostdifferentwhenthe abundanceofascidianswaslow(AppendixD)InMarch2015theabundanceofallother ascidiansonKirraReefandPalmBeachReefwashigherthanpreviouslyreportedinthe baselinesurveyinApril1995(whennoascidianswererecorded)Themeanabundance washigheratKirraReefthanatPalmBeachReef(Figure314)
ThemeanabundanceofPyura0stoloniferahasvariedconsiderablybetweensitesatKirra Reef and Palm Beach Reef over time (note the significant interaction between site (location) x survey in Table 36) In March 2015 the mean abundance (individual per 025m2plusmnSE)of theascidianPstolonifera (Figure313)wassimilaratKirraReefand PalmBeachReef(Figure315)ThemeanabundanceofP0stoloniferahasrangedfrom 02to17individualsper025m2atbothreefssinceMay2003
Figure315 Mean abundance of ascidians (Pyura0 stolonifera) (individuals025m2)
(plusmnSE)atKirraReefandPalmBeachReefinallsurveys
TRESBPKirraReefMarineBiotaMonitoring2015 34
frc environmental
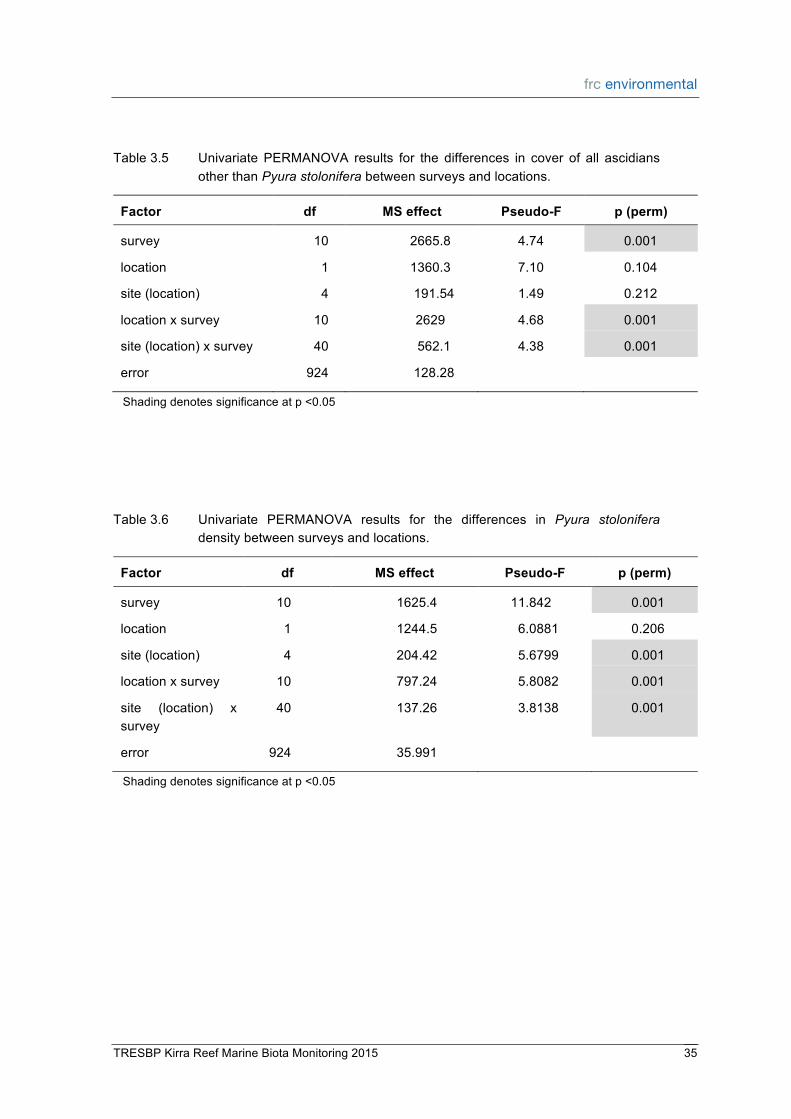
Table35 Univariate PERMANOVA results for the differences in cover of all ascidians otherthanPyura0stolonifera0betweensurveysandlocations
Factor$ df$ MS$effect$ PseudoF$ p$(perm)$
survey 10 26658 474 0001
location 1 13603 710 0104
site(location) 4 19154 149 0212
locationxsurvey 10 2629 468 0001
site(location)xsurvey 40 5621 438 0001
error 924 12828
Shadingdenotessignificanceatplt005
Table36 Univariate PERMANOVA results for the differences in Pyura0 stolonifera densitybetweensurveysandlocations
Factor$ df$ MS$effect$ PseudoF$ p$(perm)$
survey 10 16254 11842 0001
location 1 12445 60881 0206
site(location) 4 20442 56799 0001
locationxsurvey 10 79724 58082 0001
site (location) x 40 13726 38138 0001 survey
error 924 35991
Shadingdenotessignificanceatplt005
$
TRESBPKirraReefMarineBiotaMonitoring2015 35
frc environmental
Hard$Coral$
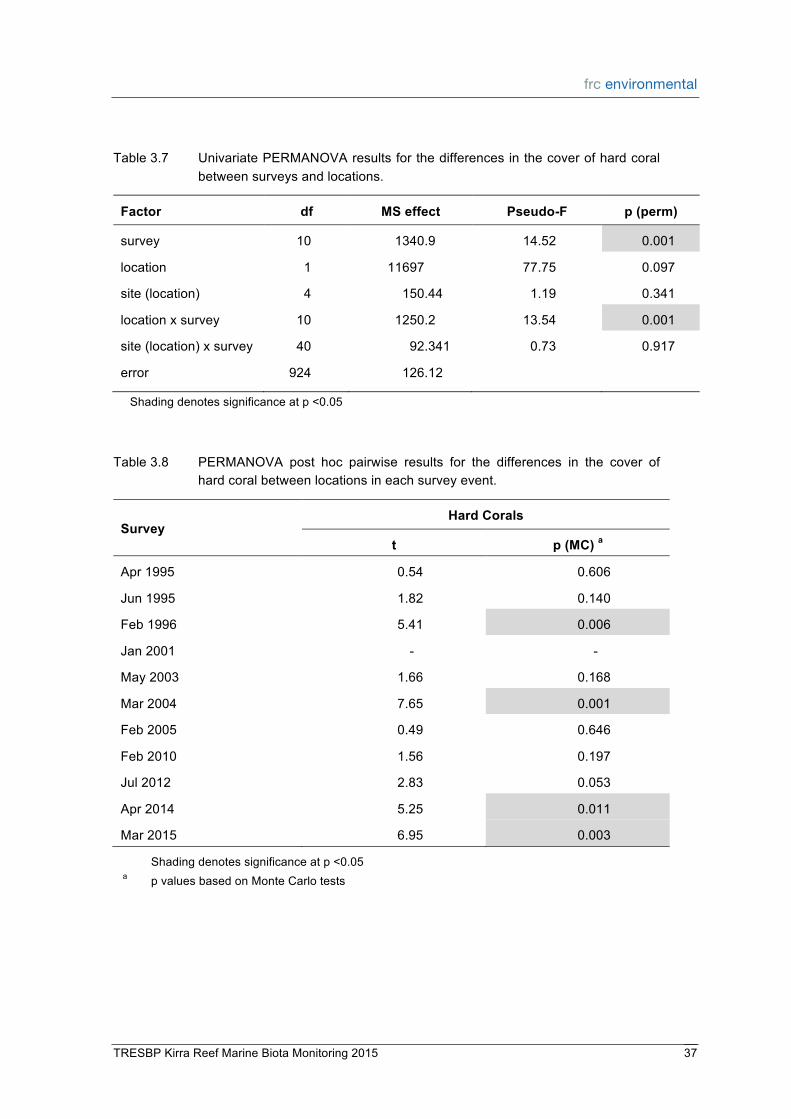
There was a significant difference between the cover of hard corals at Kirra Reef and PalmBeachReefduringsomesurveys(notethesignificantinteractionbetweenlocationx surveyinTable37)SpecificallytherewassignificantlymorehardcoralatPalmBeach Reef thanKirraReef inFebraury1996March2004April2014andMarch2015(Table 38)
ThecoverofhardcoralistypicallylowonKirraReefaccountingforlessthan2ofthe availablesubstrateInMarch2015hardcoralcoveredlessthan1oftheareaofKirra Reef which was less than the cover recorded during the baseline survey in April 1995 (Figure 316) In contrast hard coral covered 11 of the surface area at Palm Beach ReefwhichwasgreaterthanthecoverrecordedinApril1995(Figure316)
The cover of hard corals at Palm Beach Reef has been more variable over time comparedtothecoverofhardcoralatKirraReef(Figure316)Withtheexceptionofthe surveys inApril1995andJanuary2001when thecoverofhardcoralwas lowonboth reefshardcoralsaretypicallymoreprevalentatPalmBeachReef(Figure316)
Table38 PERMANOVA post hoc pairwise results for the differences in the cover of hardcoralbetweenlocationsineachsurveyevent
Hard$Corals$ Survey$
t$ p$(MC)$a$
Apr1995 054 0606
Jun1995 182 0140
Feb1996 541 0006
Jan2001 R R
May2003 166 0168
Mar2004 765 0001
Feb2005 049 0646
Feb2010 156 0197
Jul2012 283 0053
Apr2014 525 0011
Mar2015 695 0003 Shadingdenotessignificanceatplt005 a pvaluesbasedonMonteCarlotests
TRESBPKirraReefMarineBiotaMonitoring2015 37
60
50
40
30
20
10
0
Soft
Cor
al C
over
()
Kirra Reef Palm Beach Reef
frc environmental
Soft$Coral$
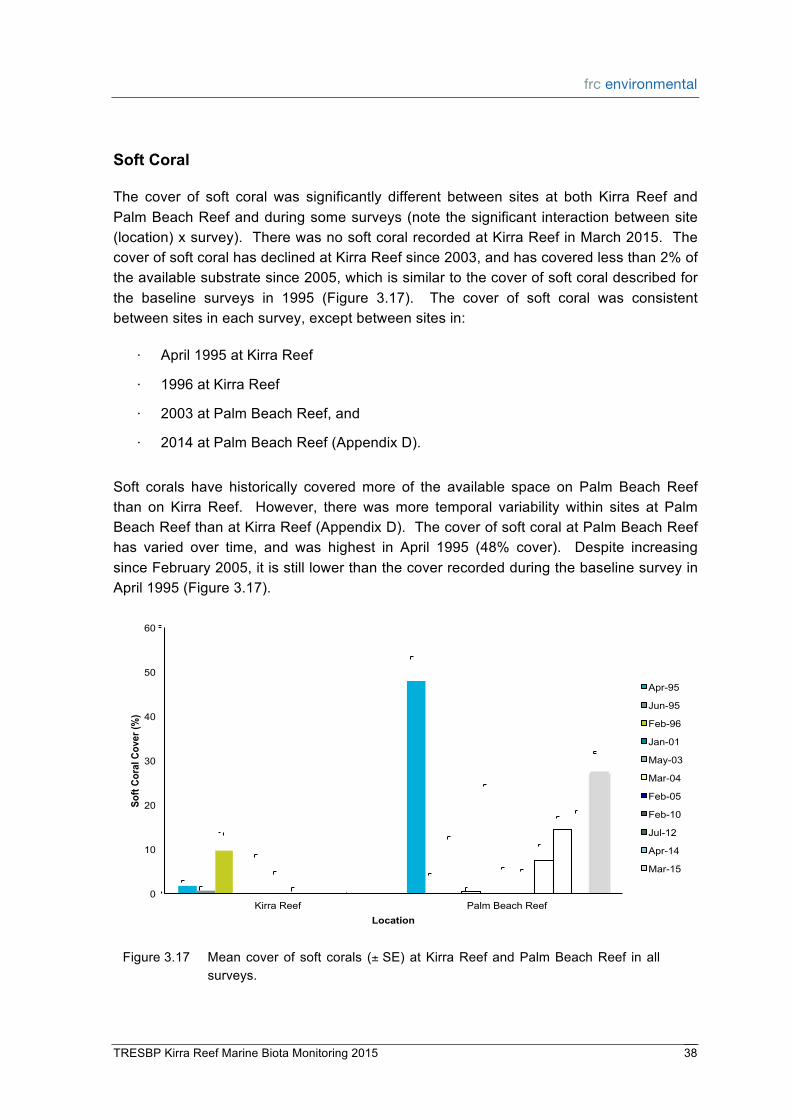
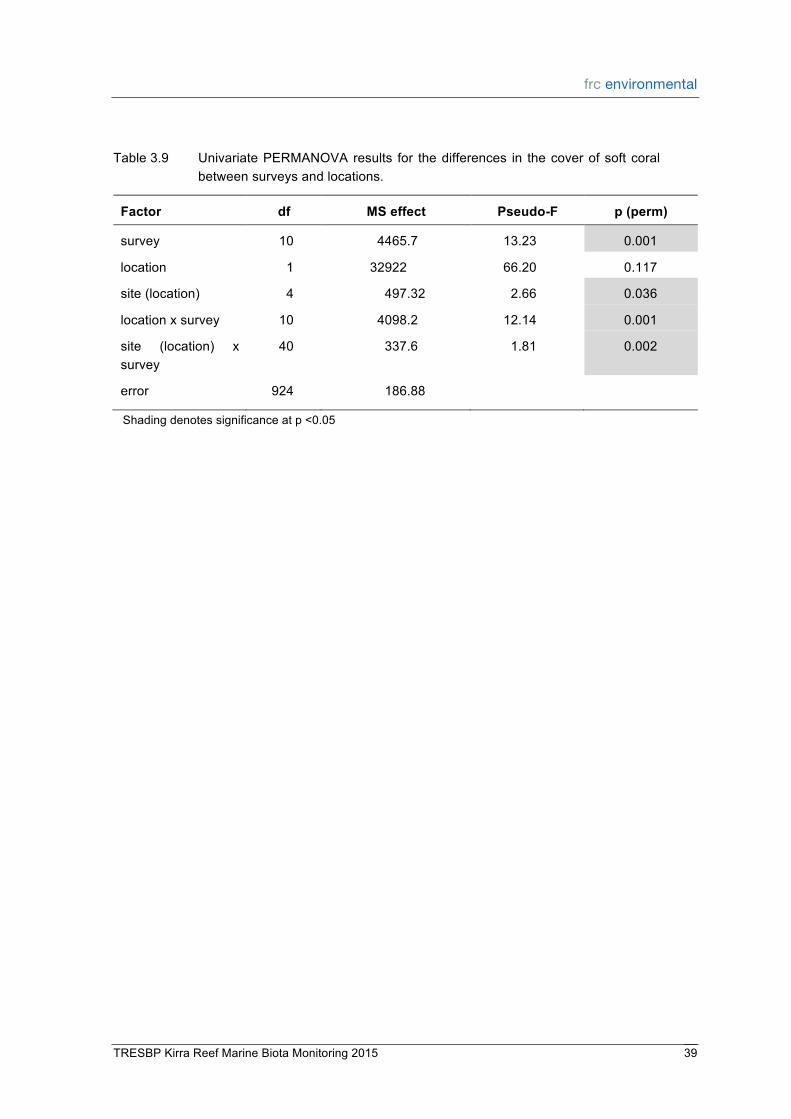
The cover of soft coral was significantly different between sites at both Kirra Reef and PalmBeachReefandduringsomesurveys(notethesignificant interactionbetweensite (location)xsurvey)TherewasnosoftcoralrecordedatKirraReefinMarch2015The coverofsoftcoralhasdeclinedatKirraReefsince2003andhascoveredlessthan2of theavailablesubstratesince2005whichissimilartothecoverofsoftcoraldescribedfor the baseline surveys in 1995 (Figure 317) The cover of soft coral was consistent betweensitesineachsurveyexceptbetweensitesin
sdot April1995atKirraReef
sdot 1996atKirraReef
sdot 2003atPalmBeachReefand
sdot 2014atPalmBeachReef(AppendixD)
Soft corals have historically covered more of the available space on Palm Beach Reef than on Kirra Reef However there was more temporal variability within sites at Palm BeachReefthanatKirraReef(AppendixD)ThecoverofsoftcoralatPalmBeachReef has varied over time and was highest in April 1995 (48 cover) Despite increasing sinceFebruary2005itisstilllowerthanthecoverrecordedduringthebaselinesurveyin April1995(Figure317)
Table39 UnivariatePERMANOVAresults for thedifferences in thecoverofsoft coral betweensurveysandlocations
Factor$ df$ MS$effect$ PseudoF$ p$(perm)$
survey 10 44657 1323 0001
location 1 32922 6620 0117
site(location) 4 49732 266 0036
locationxsurvey 10 40982 1214 0001
site (location) x 40 3376 181 0002 survey
error 924 18688
Shadingdenotessignificanceatplt005
$
TRESBPKirraReefMarineBiotaMonitoring2015 39
frc environmental
Crinoids$
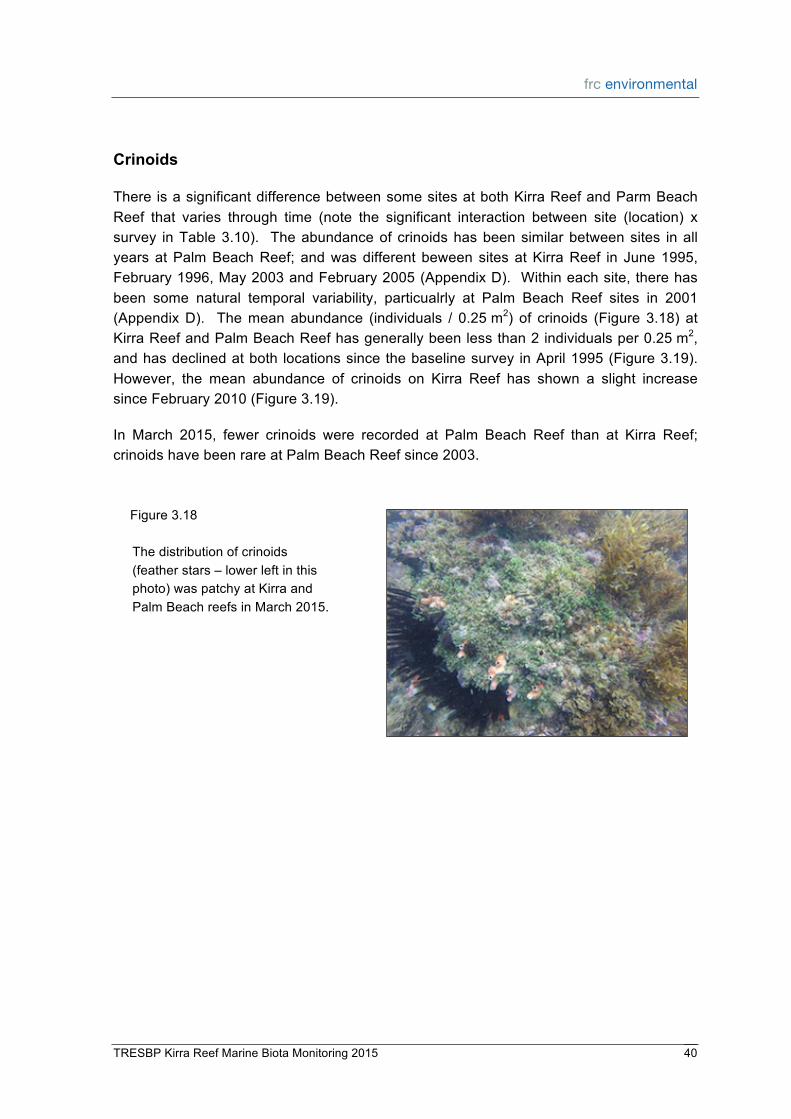
ThereisasignificantdifferencebetweensomesitesatbothKirraReefandParmBeach Reef that varies through time (note the significant interaction between site (location) x survey inTable310) Theabundanceofcrinoidshasbeensimilarbetweensites inall years at Palm Beach ReefH and was different beween sites at Kirra Reef in June 1995 February1996May2003andFebruary2005(AppendixD)Withineachsitetherehas been some natural temporal variability particualrly at Palm Beach Reef sites in 2001 (Appendix D) The mean abundance (individuals 025m2) of crinoids (Figure 318) at KirraReefandPalmBeachReefhasgenerallybeenlessthan2individualsper025m2 andhasdeclinedatboth locationssincethebaselinesurvey inApril1995(Figure319) However the mean abundance of crinoids on Kirra Reef has shown a slight increase sinceFebruary2010(Figure319)
In March 2015 fewer crinoids were recorded at Palm Beach Reef than at Kirra ReefH crinoidshavebeenrareatPalmBeachReefsince2003
The species richness of fish recorded from Kirra Reef across all monitoring events has rangedfrom14to57 InMarch201557specieswereidentifiedat thereefwhichwas similar to April 2014 (53) and higher than previous surveys (Figure 320) Species richnessatPalmBeachReefwas lower(34species)andgenerallyvaried lessbetween surveyscomparedtoKirraReef
InMarch2015 the assemblage of fish at KirraReef comprised species fromall trophic levelsincludingdetritivoresplanktivoresherbivoresandcarnivores(AppendixE)Asin previous surveys the assemblage was dominated by herbivores and planktivores Yellowtail (Trachurus0 novaezelandiae) and striped sea pike (Sphyraena0 obtusata) were the dominant species present in large schools (Figure 321) Australian mado (Atypichthys0 strigatus) ringRtailed surgeon (Acanthurus0 blochii) silver trevally (Pseudocaranx0 georgianus) eastern pomfred (Schuettea0 scalaripinnis) sweep (Scorpis0 lineolatus) and various wrasses were also very abundant releative to other species (AppendixE)
Two new species were observed at Kirra Reef the orangeRband surgeon (Acanthurus0 olivaceus) and the unicornfish (Naso0 sp) Five new species were recorded at Palm BeachReef
No threatened or protected fish species listed under the Queenslandrsquos Nature0 Conservation0Act01992ornationallyundertheEnvironmental0Protection0and0Biodiversity0 Conservation0 Act0 1999 were observed The complete list of species recorded and the relativeabundanceispresentedinAppendixE
TRESBPKirraReefMarineBiotaMonitoring2015 42
60
0
10
20
30
40
50
Num
ber
of F
ish
Spe
cies
Apr-95
Jun-95
Feb-96
Jan-01
May-03
Mar-04
Feb-05
Feb-10
Jul-12
Apr-14
Mar-15
Kirra Reef Palm Beach Reef Location
frc environmental
Figure320 Number of fish species recorded at Kirra Reef and Palm Beach Reef on
ThegreatestchangetotheecologicalconditionofKirraReefsincethebaselinesurveyin 1995 has been the loss of large areas of hard substrate that support benthic flora and faunaThedeliveryoflargesandvolumesduringthestage1dredgingoperations(1995 to1998)andtheinitialoperationofthesandbypasssystem(2001to2008)resultedinan increaseinwaveactionandtidalcurrentsredistributingthissandoverKirraReef
The three major outcrops of Kirra Reef (northern southern and eastern sections) are naturally exposed and covered depending on water and sand movements In March 2015 the rocky outcrops in the northern section of Kirra Reef were exposed and supportedamoderatelydiversebenthicassemblagedominatedbyturfalgaeTherewas arelativelyhighfishdiversityatKirraReefTheecologicalassemblageexhibitedsignsof ongoingstressfromphysicaldisturbanceincludingtheabsenceofsoftcoralsandrarityof hardcoral(MumbyampSteneck2008)HoweverKirraReefhasarelativelyhighcoverof sponges and ascidians Sponges ascidians and crinoids were more abundant at Kirra ReefthanatPalmBeachReefinMarch2015
KirraReefcontinues toprovidehabitatandsupport importantecological functions in the region providing hard substrate for the colonisation of algae and benthic invertebrates and food and refuge for fish As sand levels have stabilised since 2008 assemblages have becomemoresimilar to those recordedprior to implementationof the TRESBP in April1995 Forexamplemacroalgalcover inApril1995andMarch2015wasrelatively similarHoweverassemblagecompositionisstillsignificantlydifferenttothatrecordedin thebaselinesurveysmostnoticeablyduetoa lowercoverofbaresubstrateandhigher coverofturfalgaeandascidianssincesurveyshavebeenperformed
Benthic$Macroalgae$
The cover of macroalgae at Kirra Reef was relatively similar during the 2014 and 2015 surveys and remained well below the peak of nearly 60 cover recorded in January 2001TherewasasteepdeclineinthecoverofmacroalgaebetweenJanuary2001and May2003whichappearedtobestronglyassociatedwith thedecline inreefareaduring that time as well as a decline in the cover of Sargassum sp (an important indicator speciesonKirraReef) SimilardeclineswereevidentatPalmBeachReefbetween the January2001andMay2003surveys
TRESBPKirraReefMarineBiotaMonitoring2015 45
frc environmental
The cover ofmacroalgae at Palm Beach Reef was much lower thanat Kirra Reef over time There are several possible reasons for the lower cover of macroalgae at Palm Beach
sdot PalmBeachReefisdeeperthanKirraReefandgenerallyhashigherturbidityand therefore greater light attenuation The quantity and quality of available light affectsthedistributionandgrowthofmacroalgae(MillerampEtter2008)
sdot Differences in the pattern of recruitment of algal species to the reefs due to differentwatercurrentsandtimingofthesurveys(Kennelly1987b)
sdot Increased competition with turf algae and sessile benthic invertebrates which competeforspacewithmacroalgae(Kennelly1987aHMillerampEtter2008)
sdot PresenceofdifferentspeciesandhigherdensityofherbivoresatPalmBeachReef (particularly sea urchins and herbivorous fish) which graze on macroalgae (McCook1997HJompaampMcCook2002)
Biological assemblages exposed to physical stress typically exhibit greater levels of temporalandspatialvariability(WarwickampClarke1993HChapmanetal1995)Temporal variationinthecoverofmacroalgaeatKirraReefislikelytobeprincipallyduetotheeffect ofphysicaldisturbance fromwaveactionaswellas theassociatedassociatedabrasion andsmotheringbysandTheeffectsofthesephysicaldisturbanceswouldincreasewith thereductionofKirraReefasedgeeffectsarepronouncedandwaterdepth isreduced Increasedsmotheringbysandcanalsoreducediversity(Hatcheretal1989)abundance recruitment growth survival and seasonal regeneration of macroalgae (Umar amp Price 1998HCheshireetal1999)
Changes in the cover of macroalgae on Kirra Reef over time are also likely due to the extentofthereefchangingHthefishandmobileinvertbratesassociatedwiththereefmay have concentrated which would in turn increase grazing pressure Increased grazing pressure from fish and mobile invertebrates can reduce the coverage and diversity of macroalgaeonreefs(McCook1997HJompaampMcCook2002)
Thecoverof turfalgaeatbothKirraReefandPalmBeachReefhasvariedsignificantly betweensurveysPriorto2005turfalgaetypicallycoveredlessoftheavailablesurface areaonKirraReefthanPalmBeachReefInMarch2015themeancoverofturfalgae hasincreasedsincebaselinesurveysin1995andwasrelativelysimilarbetweenreefs(40 plusmn4atKirraReefcomparedto48plusmn4atPalmBeachReef)Thecoverofturfalgaeat Kirra Reef was similar in 2014 and 2015 which was generally higher than previous surveysexceptduringJuly2012whencoverofturfalgaepeakedat67plusmn4
TRESBPKirraReefMarineBiotaMonitoring2015 46
frc environmental
Turfalgaearebecomingadominantcomponentofcommunitiesaroundtheworld likely the result of rapid colonisation of openspace after a disturbance (eg storms) nutrient enrichment andor changes in grazing pressures Turf algae can also reflect a more physically robust growth form suited to high wave energy environments (than foliose macroRalgae)TurfalgaepeakedintheJuly2012surveylikelyrelatedtotheincreasein bare reef exposure following a stormy conditions in early 2009 and between December 2011 and June 2012 Turf algae have been the dominant form of algae on Kirra Reef sincethistimealbeitthecoverlowerthanthe2012survey
Increased cover of turf algae is typically related to good light conditions high concentrationsofnutrientsandlownumbersofgrazerssuchasfish(orconstantgrazing pressure preventing macroalgae colonisation) However the relationship between algal dynamics physical disturbance water quality and herbivore grazing activity is complex andthecoverof turfalgaecanexhibitextremetemporalvariabilityasaconsequenceof the interactionbetween topRdownandbottomRupprocesses (Russ2003HBellwoodetal 2006H Hughes et al 2007H Albert et al 2008H Hoey amp Bellwood 2008H Mumby 2009) Furtherinvestigationwouldberequiredtoreliablydeterminethemechanismsofchangein bothmacroalgaeandturfalgaeassemblagesonthesereefs
Benthic$Macroinvertebrates$
AtKirraReeftheburialandreRemergenceofrockyoutcrops(influencedbytheTRESBP) islikelytohaveincreasedtemporalvariabilityinthedistributionandabundanceofbenthic macroinvertebrates Additional perturbations such as wave action and sand abrasion (each influenced through changes in bathymetry seabed topography and water depth) are likely to have resulted in the decline in cover and diversity of the benthic macroinvertebratesatKirraReefbetweensurveysparticularlybetweenMarch2004and February2005andduringtheseverestormsof2009Benthicmacroinvertebratessuch asascidiansspongeshardcoralandsoftcoralarehighlysusceptible to theeffectsof stormandwavedisturbancephysicalabrasionandburialbysand(KayampKeough1981H Walker et al 2008) which can affect settlement growth rate and survival (Dodge amp Vaisnys1977HRogers1990)
Physical disturbance from sand burial sand abrasion and the action of storm waves appeartokeepthebenthicassemblagesofKirraReefinastateofearlysuccessionItis commonforearlypioneerspeciessuchassomemacroalgaetorecruitrapidlytoahard surface in large numbers allowing these species to dominate assemblages early in the successionaltrajectory(Walkeretal2007)
Afurther indicatorof theearlystateofsuccessionatKirraReef isthatthecoverofhard and soft coral has remained very low (generally lt 5) In March 2015 less than 1
Benthic macroinvertebrate cover may also be affected indirectly through increased competitionwithmacroalgaeforspaceThepresenceoflargemacroalgaecanaffectthe recruitment and survival of sessile benthic invertebrates as fronds moving with wave action sweep and abrade the surface of rocks killing new recruits especially corals (Kennelly1989HMcCooketal2001)Itcantakeseveralyearsforhardandsoftcoralto become dominant on reefs in the SEQ region (SchlacherRHoenlinger et al 2009) Therefore hard coral is not expected to become abundant until several years after the reefhasbeenuncoveredandonlyifthephysicaldisturbanceregimeandsupplyofnew recruitsissufficienttosupportsurvivalandgenerationalsuccessionofthesespeciesThe coverofhardandsoftcoralsatKirraReefwerebothverylowandpatchypriortothestart oftheTRESBP
Sponges and ascidians are highly susceptible to smothering and sand abrasion unless theyhaveathicktunic(outercoveringmadeofkeratin)liketheascidianP0stolonifera0or strong internal keratin silicon or calcareous structures in the case of some species of sponges0(KayampKeough1981HMcGuinness1987HWalkeretal2008)Duetoincreased wave action and sedimentation (which can be influenced by the TRESBP) the mean coverofascidiansandspongeswasexpectedtobemuchloweronKirraReefthanPalm Beach Reef However in March 2015 the cover of sponges was similar between the reefsandthecoverofascidians(otherthanP0stolonifera)wasgreateratKirraReefthan at Palm Beach Reef This suggests that Kirra Reef is slowly recovering from the increasedstressofphysicaldisturbancesuchas increasedwaveactionandsandscour andorthatwaveandstormconditionshavebeenlesssevereinthepastfewyears
Fish$
KirraReefcontinuestosupportahighdiversityofreefRassociatedandpelagic(ienonR reefassociated) fishspecies Despite itsdiminishedsizecompared to1995KirraReef continuestoprovidevaluablehabitatforanumberoffishspeciesfromdifferentfunctional groups
ThereisahighdegreeofinterRannualvariabilityinthespeciesandabundanceofthefish present at Kirra Reef compared with the assemblage at Palm Beach Reef This likely reflectsthetemporalvariabilityintheavailablehabitatasaconsequenceofreefburialand reRemergenceThediversityqualityandarealextentofreefhabitatareimportantfactors influencing the distribution abundance biomass and diversity of reef fish (Bellwood amp Hughes2001HFriedlanderetal2003)Diversityandabundanceoffishcanincreasewith
TRESBPKirraReefMarineBiotaMonitoring2015 48
frc environmental
greaterstructuralcomplexityandincreasedheterogeneityofavailablehabitats(Bellwood ampHughes2001)Thissuggeststhatperiodsofreefburialreducetheoveralldiversityof reefRassociated fish species at Kirra Reef Despite the reduction in overall reef space therewasalargervarietyofhabitats(suchasmarcoalgaeandturfalgae)in2015which was likely to be related to the high diversity of fish assemblages This is particularly importantforseveralspeciesthatdependonthepresenceoflsquostructurersquosuchasprovided by reef habitat (ie oldwife moray eels damselfish and Australian mado that were recordedinMarch2015butwerenotrecordedinJuly2012)
Theabundanceanddiversityof fishare likelytobenegativelyaffectedfollowingperiods of severe weather which create unfavourable conditions for many species and may further exacerbate the affects of abrasion and sedimentation The biomass of fish is knowntodecreasewithincreasingexposuretophysicaldisturbancefromwaveactionand strong currents (Friedlander et al 2003) As our surveys have been undertaken at different times of the year variation in the prevailing conditions at the time of sampling could also influence the types of fish observed (and the amount of reef habitat that is availableatanytime)Manyofthespeciesmayalsobeaffectedbyseasonalchangesin the water temperature such as damselfish which are less abundant in cool waters However theoveralldiversityof the fishassemblageatKirraReef is likely toreflect the sizeoftheoutcropsexposedwithagreaterphysicaldisturbance(fromseaconditionsand sandmovement)andcompetitionHandlesserfoodavailablewhenthereefiscovered
ThepredictedimpactstoKirraReefasaresultoftheTRESBPincludedaccretionofsand around the base of the rock outcrops causing a reduction in extent of reef It was predictedthatsanddeliveryaspartoftheprojectwouldeventuallymimiclsquonaturalrsquopatterns ofsanddispersalandthatthereefwouldreturntoitsnaturalextent(ietheextentpriorto extension of the Tweed River training walls in 1962) The benthic flora and fauna assemblages of the reef the historical reef extent and natural sand transport patterns wereexpectedtoreturntoconditionsobservedbeforetheextensionofthetrainingwalls between 1962 and 1965 However the Environmental Impact Study did not predict the ecologicalconsequencesofboththereducedarealextentandincreasedwaveenergy(a consequenceofdecreaseddepth)thathavebeenrecorded
ThecurrentextentofKirraReef remains less than50of that recorded in1962and in 1995beforethesanddeliverybytheTRESBPcommencedHowevertheextentofreef in1995 wasstrongly influenced by adepletion in sand following the construction of the Tweed River training walls and the Kirra Point groyne Accumulation of sand on Kirra ReefwasobservedtoincreaseasaresultofindirectsandnourishmentbytheTRESBP and the reef has been extensively covered (particuarly between 2005 and 2010) as a result
Whiletheextentofthereefcontinuestochangeovertimethedeliveryofsandaspartof the project now more closely matches the natural rate of longshore sand transport ShortRtermandseasonalchangesintheextentofthereefarenowlikelytobetheresultof waveandcurrentaction(particularlyduringservereweatherevents)thanadirectimpact of the TRESBP Therefore the extent of Kirra Reef in March 2015 is broadly in accordancewithpredictionsmadeintheEISwhichpredictedthatthereefwouldreturnto a condition similar to that exhibited in the preR1960rsquos ie before the extension of the TweedRiverbreakwatersthatinterruptedlittoralsandsupplytothesebeaches
InDecember2013KirraPointgroynewasextendedby30mwiththeexpectationthatthe beach bar would move seaward as a consequence At present Kirra Point groyne is unlikelytohavehadamajorimpactonthearealextentofKirraReefHoweverongoing monitoringbasedonaerialphotographsmayprovidefurtherinsight
Sessile benthic assemblages on Kirra Reef are highly susceptible to the influence of storms and associated wave action (Kay amp Keough 1981H Walker et al 2008) The shallowreefissurroundedbymobilesandwhichcanshiftnaturallyinresponsetowave action during storms causing burial of large sections of Kirra Reef This effect has reduced the availability of rocky substrate for colonisation and the availability of refuge
Fromanexaminationof theextentofKirraReef fromarealmapsandwaveheightdata thereappears tobea relationshipbetween theareaof rockexposedandstormevents Notably in a series of storm events in May 2009 corresponds with large areas of rock becoming exposed (with the reef approximately 100m2 in 2006 and approximately in 1009m2 2009) Further a stormy conditions between December 2011 and July 2012 correspondstotheareaofexposedrockmorethandoublinginsizeWhiletherewasno changetothetotalareaofexposedrockfollowingstormyconditionsinearly2013there wasaclearchangeinthedistibutionofexposedrockduringthistimeSince2013storm conditions have been calm to moderate and there has been little change in the areal extentanddistrubtionofexposedrockatKirraReef
WaveheighttypicallyincreasesduringstormeventsandgiventheshallowdepthofKirra Reef waves are more likely to shoal and break across the reef during storms This increases thephysicaldisturbanceabrasionandsedimentationofbenthicassemblages onKirraReefStormdisturbancecancauselocalreductionsinthespeciesrichnessand abundanceofcoral(Woodleyetal1981HMasselampDone1993HHughes1994HConnellet al 1997) and can alter fish assemblages indirectly through habitat modifications (Kaufman1983HJonesampSyms1998)ordirectlybyincreasingfishmortality(Lassig1983) The hydrodynamic forces produced by wave action are an important source of disturbance in subtidal habitats inflicting damage through direct physical impact and abrasion(UnderwoodampKennelly1990)DirectimpactsfromphysicaldisturbanceatKirra Reefareevidentduringsurveyeventswhenlargefragmentsofmacroalgaearepresentin thewatercolumnoverthereef
Storm and wave action (and associated sedimentation and abrasion) continue to be importantforcesshapingthedistributionandabundanceofbenthicspeciesatKirraReef Increased magnitude and frequency of physical disturbance resulting from increased exposureorsusceptibility tostormsandassociatedwaveaction (asonKirraReef)can lead to a decrease in the diversity of sessile invertebrate assemblages DisturbanceR drivenreductionsinbiodiversityhavethepotentialtoimpactnegativelyonthehealthand productivity of reef ecosystems (Walker et al 2008) Biodiversity is important to reef health given that many of these species (eg sponges bryozoans and ascidians) contribute a range of vital ecosystem services to reefs including nutrient cycling (Scheffers et al 2004) trophic interactions and food webs (Lesser 2006H Pawlik et al 2007) bioRerosion (Rutzler 2002H LopezRVictoria et al 2006) and stabilizing substrata (DiazampRutzler2001HWulff2001)
Theimpactsof increasedwaveactionandsedimentationonthebenthicassemblagesat Kirra Reef are likely to be greatest during and immediately following storm conditions
TRESBPKirraReefMarineBiotaMonitoring2015 51
frc environmental
Partitioningtheinfluenceofstormandwavedrivendisturbancefromthatoftheoperation oftheTRESBPwouldrequireamuchmorestatisticallypowerfulandtemporilyreplicated experimental design Given there is a large collection of wave and storm data by TRESBP this would involve greater temporal sampling of Kirra Reef including event samplingfollowingseverewaveandstormactivity
The data generated by this Kirra Reef biota monitoring program doesnrsquot support statistically rigorous consideration of seasonality (monitoring has been at its most frequentannual)
InApril2014andMarch2015KirraReefcoveredlessthan50ofthereefrsquosextentprior to theoperationof theTRESBP The lossof reefhabitathasreducedtheavailabilityof hard substratum available for colonisation and consequently the abundance of benthic sessileassemblages
The reduced depth of water resulting from the accumulation of sand exacerbates the effects of storms and wave action It is likley that as a consequnece the biological communities of Kirra Reef will reflect earlyRstage succession more frequently and for longerperiods
While there is sufficient structure available frcenvironmentalexpect that Kirra Reef will continuetoprovideimportanthabitatforadiverseassemblageoffishes
TRESBPKirraReefMarineBiotaMonitoring2015 52
frc environmental
5$ Conclusions$
Although there is still a substantial portion of the reef covered compared to before the extension of the Tweed River entrance breakwaters the current extent of Kirra Reef is broadly inaccordancewithpredictionsmadein theEIS Initial lsquocatchRuprsquobypassingand dredgeplacementofsand(between2001and2008)resulted in theburialofKirraReef Subsequentsanddelivery(since2008onwards)morecloselyreflectsnaturalpatternsof longRshoresandtransportandisthereefhasslowlyreRemerged
Theextentofthereefhasbeenrelativelystablesince2013Thishasallowedforsome succession in the benthic assemblages including a relatively high cover of sponges ascidiansandcrinoidsWiththedeliveryofsandmorecloselymatchingthenaturalrateit isexpected the reef willundergoshortRtermchanges in extentdue toseasonal shifts in sand deliveryH however the diversity of benthic assemblages on Kirra Reef is likely to increaseovertimeThiswouldcreatemorespaceforspeciestorecruitandreducesthe influence of sand abrasion and wave damage It was predicted that the areas of Kirra Reef newly exposed in 2012 would undergo a shift from turfRdominated communities to more diverse communities that could include macroalgae sponges ascidians and potentiallyhardandsoftcoralWiththeexceptionofhardandsoftcoralsthisprediction wasconfirmedbytheresultsoftheApril2014andMarch2015surveys
ThediversityoffishesassociatedwithKirraReefisbroadlysimilartothatrecordedprior tothecommencementofsandbypassingin1995Giventhatfisharemobilethegreatest impacts on fish assemblages are likely to be shortRterm changes due to both the prevailingconditionsandchangestheextentofavailablehabitatthatprovidesshelterand foodforavarietyofdifferentspeciesIfKirraReefincreasesinsizethereislikelytobea greater proportion of cryptic benthic species as these species are more typical of assemblagesinalaterstageofsuccession(eg(WillisampAnderson2003))
Assuming a broadly stable delivery rate of sand and consequent stable extent of Kirra ReeflsquorecoveryrsquoislikleytobesubstantivelycompleteFloralandfaunalcommunitieswill undergo succession between severe storm events but are likley to remain relatively dynamic
Albert S Udy J amp Tibbetts I 2008 Responses of algal communities to gradients in herbivorebiomassandwaterqualityinMarovoLagoonSolomonIslandsCoral0 Reefs2773R82
Anderson MJ 2001 A new method for nonRparametric multivariate analysis of varianceAustral0Ecology2632R46
Anderson MJ 2004 PERMDISP0 a0 FORTRAN0 computer0 program0 for0 permutatinoal0 analysis0 of0 multivariate0 dispersions0 (for0 any0 twoSfactor0 ANOVA0 design)0 using0 permutational0 tests Department of Statistics University of Auckland New Zealand
Cannon LR Goeden GB amp Campbell P 1987 Community patterns revealed by trawling in the interRreef regions of the Great Barrier Reef Memoirs0 of0 the0 Queensland0Museum2545R70
Chapman MG Underwood AJ amp Skilleter GA 1995 Variability at different spatial scalesbetweenasubtidalassemblageexposedtothedischargeofsewageand two control assemblages Journal0 of0 Experimental0 Biology0 and0 Ecology 189 103R122
Cheshire AC Miller DJ amp Stewart R (1999) Effect0 of0 dispersed0 sediment0 plumes0 from0beach0sand0replenishment0dredging0on0recruitment0of0phaeophycean0algae0 to0rocky0reefs0in0Gulf0St0Vincent0South0Australia0The0Impact0of0Sand0Dredging0 on0 Benthic0 Community0 Structure0 at0 the0 Port0 Stanvac0 Dredge0 Site0 20 1S39 UniversityofAdelaideAdelaide
ConnellJHHughesTPampWallaceCC1997A30Ryearstudyofcoralabundance recruitment and disturbance at several scales in space and time Ecological0 Monographs67461R488
Diaz MC amp Rutzler K 2001 Sponges an essential component of Caribbean coral reefsBulletin0of0Marine0Science69535R546
DodgeREampVaisnysJR1977Coralpopulationsandgrowthpatternsresponsesto sedimentation and turbidity associated with dredging Journal0 of0 Marine0 Research35715R730
Done TJ 1982 Patterns in the distribution of coral communities across the central GreatBarrierReefCoral0Reefs195R107
Edwards RA amp Smith DA 2005 Subtidal assemblages associated with a geotextile reef insouthReastQueenslandAustraliaMarine0and0Freshwater0Research56 133R142
FisheriesResearchConsultants1991Survey0of0the0Intertidal0and0Subtidal0Rocky0Reefs0 of0 the0 Sunshine0 Coast report prepared for Queensland National Parks and WildlifeService
HarrisonPHarriotVBanksSampHolmesN1998ThecoralcommunitiesofFlinders Reef andMyora Reef in theMoretonBay MarineParkQueensland Australia In Moreton0 Bay0 and0 Catchment Tibbits I Hall N amp Dennison W (Eds) SchoolofMarineScienceUniversityofQueenslandStLuciapp525R536
Hatcher B Johannes R amp Robertson A 1989 Review of research relevant to the conservationofshallowtropicalmarineecosystemsOceanography0and0Marine0 Biology0an0Annual0Review27337R414
Hoey A amp Bellwood D 2008 CrossRshelf variation in the role of parrotfishes on the GreatBarrierReefCoral0Reefs37R47
TRESBPKirraReefMarineBiotaMonitoring2015 56
frc environmental
Hollingsworth P 1975 Environmental Investigation Report Crown Reserve R R68 Currumbin Creek City of the Gold Coast Land Administration Commission unpublishedreport
Hughes TP 1994 Catastrophes phase shifts and large scale degradation of a CaribbeancoralreefScience2651547R1551
Hughes TP Rodrigues MJ Bellwood DR Ceccarelli D HoeghRGuldberg O McCook L Moltschaniwskvi N Pratchett MS Steneck RS amp Willis B 2007Phaseshiftsherbivoryandtheresilienceofcoralreefstoclimatechange Current0Biology17360R365
Hutchinson A Rempel C Taveras V Loder J amp Salmond J 2013 Reef0 Check0 Australia0 South0 East0 Queensland0 Summary0 Report0 2013 report prepared for ReefCheckFoundationLimited
Hyder Consulting 1997 Tweed0 River0 Entrance0 Sand0 Bypassing0 Project0 Permanent0 Bypassing0 System0 0 Environmental0 Impact0 Statement0 0 Impact0 Assessment0 Study report prepared for New South Wales Department of Land and Water Conservation
Jompa J amp McCook LJ 2002 Effects of competition and herbivory on interactions betweenahardcoralandabrownalgaJournal0of0Experimental0Marine0Biology0 and0Ecology27125R39
KayAMampKeoughMJ1981Occupationofpatchesintheepifaunalcommunitieson pier pilings and the bivalve Pinna bicolor at Edithburgh South Australia Oecologia48123R130
KennellyS1987aInhibitionofkelprecruitmentbyturfingalgaeandconsequencesfor an Australian kelp community Journal0 of0 Experimental0 Marine0 Biology0 and0 Ecology11249R60
Kennelly S 1987b Physical disturbances in an Australian kelp community I temporal effectsMarine0Ecology0Progress0Series40145R153
TRESBPKirraReefMarineBiotaMonitoring2015 57
frc environmental
Kennelly S 1989 Effects of kelp canopies on understory species due to shade and scourMarine0Ecology0Progress0Series50215R224
Lassig BR 1983 The effects of a cyclonic storm on coral reef fish assemblages Environmental0Biology0of0Fishes955R63
Lawson S McMahon J amp Boswood P 2001 Environmental management of the construction and operation of a sand bypassing system at the Tweed River EntranceInThe15thAustralasianCoastalandOceanEngineeringConference the 8th Australasian Port and Harbour Conference 25 R 28 September 2001 QueenslandAustralia
Lesser MP 2006 BenthicRpelagic coupling on coral reefs feeding and growth of Caribbean sponges Journal0 of0 Experimental0 Marine0 Biology0 amp0 Ecology 328 277R288
LopezRVictoriaM ZeaSampWei E2006 Competition for spacebetweenencrusting excavatingCaribbeanspongesandothercoral reeforganismsMarine0Ecology0 Progress0Series312113R121
MalcolmHASmithSDAampJordanA2009Usingpatternsofreeffishassemblages to refine a Habitat Classification System for marine parks in NSW Australia Aquatic0Conservation0Marine0and0Freshwater0Ecosystems2083R92
Massel SR amp Done TJ 1993 Effects of cyclone waves on massive coral assemblages on the Great Barrier Reef meteorology hydrodynamics and demographyCoral0Reefs12153R166
Mumby PJ amp Steneck RS 2008 Coral reef management and conservation in light of rapidly evolving ecological paradigms Trends in Ecology amp Evoution 23 555 -563
Murphy HM amp Jenkins GP 2010 Observational methods used in marine spatial monitoring of fishes and associated habitats a review Marine and Freshwater Research 61 236-252
Noriega R 2007 An Overview of Available Information on Sandy Beach Ecology Coastal Sand Dunes Rocky Reefs and Associated Biota on the Gold Coast Griffith Centre for Coastal Management Research Report No 85 report prepared for Griffith University
Parker P (1995) Structure to Reef Fish Assemblages at Julian Rocks Northern New South Wales Masters Thesis Griffith University
Parker PG 1999 Fish assemblages at Julian Rocks and the adjacent waters of northern New South Wales Australia Australian Zoologist 31 134 - 160
Pawlik JR Steindler L Henkel TP Beer S amp Ilan M 2007 Chemical warfare on coral reefs sponge metabolites differentially affect coral symbiosis in situ Limnology and Oceanography 52 907-911
Reef Check 2010 httpwwwreefcheckaustraliaorgdatahtml accessed December 2015
Robinson KI amp Pollard DA 1982 Marine and estuarine reserves in Australia with particular reference to New South Wales Wetlands 2 17 - 26
Rogers CS 1990 Responses of coral reefs and reef organisms to sedimentation Marine Ecology Progress Series 62 185-202
Russ GR 2003 Grazer biomass correlates more strongly with production than with biomass of algal turfs on a coral reef Coral Reefs 22 63-67
Rutzler K 2002 Impact of crustose clionid sponges on Caribbean reef corals Acta Geologica Hispanica 37 61-72
Scheffers SR Nieuwland G Bak RPM amp van Duyl FC 2004 Removal of bacteria and nutrient dynamics within the coral reef framework of Curacao (Netherlands Antilles) Coral Reefs 23 413-422
TRESBP Kirra Reef Marine Biota Monitoring 2015 59
frc environmental
Schlacher-Hoenlinger M Walker S Johnson J Schlacher T amp Hooper J 2009 Biological Monitoring of the Ex-HMAS Brisbane Artificial Reef Phase II - Habitat Values report prepared for Environmental Protection Agency (EPA)
Smith KA 2003 A simple multivariate technique to improve the design of a sampling strategy for age-based fishery monitoring Fisheries Research 64 79-85
Smith S Edwards R Dalton S amp Harrison M 2005 Biological assessment of fish and benthic communities at Palm Beach Bait Reef Gold Coast Queensland report prepared for University of New England
TRESBP 2014 Autum 2009 storms httpwwwtweedsandbypassnswgovauarticles-and-studiesinteresting-itemsautumn-2009-storm updated 4 May 2014 accessed December 2015
TRESBP 2015a Tweed Sand Bypassing Restoring Coastal Sand Drift Improving Boating Access ndash Techinical information httpwwwtweedsandbypassnswgovau__dataassetspdf_file0004552055kir ra-feb-2015pdf acessed December 2015
TRESBP 2015b Waves httpwwwtweedsandbypassnswgovauenvironmental-monitoringcoastal-conditionswaves updated 30 September 2015 accessed December 2015
Umar MJMLJ amp Price IR 1998 Effects of sediment deposition on the seaweed Sargassum on a fringing coral reef Coral Reefs 17 169-177
Underwood AJ amp Kennelly SJ 1990 Ecology of marine algae on rocky shores and subtidal reefs in temperate Australia Hydrobiologia 192 3-20
Walker S Schlacher T amp Schlacher-Hoenlinger M 2007 Spatial heterogeneity of epibenthos on artificial reefs fouling communities in the early stages of colonization on an East Australian shipwreck Marine Ecology 28 435-445
Walker SJ Degnan BM Hooper JNA amp Skilleter GA 2008 Will increased storm intensity from climate change affect biodiversity in non-scleractinian sessile fauna on coral reefs Global Change Biology 14 2755-2770
Warwick RM amp Clarke KR 1993 Increased variability as a symptom of stress in marine communtities Journal of Experimental Marine Biology and Ecology 172 215-216
Thenumberofsitessurveyedhasvariedover timeasaresultof the fluctuating levelof sandcoveringKirraReef
Prior to May 2003 three sites were assessed along the eastern and northern edge of KirraReef(KirraReefOutersites1to3)andthreesiteswereexaminedalongtheinshore marginof the reef (KirraReef Inner sites1 to 3)(MapA1) ReefRedge (ieKirraOuter) siteswerechosentoprovideearlywarningofimpactsfromoffshoreplacementofdredged sandwhilst inshoresites(ieKirraInner)werechosentoindicatewhetherimpactsfrom inshore beach profile development were affecting the reef platform In May 2003 the threeeasternsitesatKirraReef (ieKRO1KRO2andKRI1)werecompletelycovered with bare mobile sand Consequently only the three western sites at Kirra Reef (ie KRO3KRI2andKRI3)supportedbenthicfloraandfaunaInMarch2004theextentof the remainingwesternoutcropof KirraReef had been further reduced so that all inner reefsiteswerecompletelycoveredwithmobilesandConsequentlyonlyasingleoriginal reefsite(ieKRO3)couldbesurveyed(Figure23)Thereforetoprovideanindicationof the condition of the remaining reef two new sites were established (ie KRN1 and KRN2)(Figure23)andsurveyedinMarch2004Theextentofthewesternreefhadbeen further reduced by February 2005 and a third new site (ie KRN3) was established (Figure23)Consequentlyfoursites(KRO3KRN1KRN2andKRN3)weresurveyedin February2005
InFebruary2010fourKirraReefsites(ieKRO3KRO1KRN1andKRN2)wereclearof thesurroundingsandandsupportedbenthic floraand fauna Inaddition several rocks protruded from the sand in the vicinity of site KRI2H these were assessed to provide a quantitativeindicationofbroadRscaletemporalchangestotheinshorereefcommunities
SOURCEScopy Copyright Commonwealth of Australia (Geoscience Australia) 2001 2004 2006copy The State of Queensland (Department of Natural Resources and Mines) 2015copy Nearmap 2014 2015
DATE2015-09-09
DRAWN BYCF
VERSION02
PROJECTIONCoordinate System GDA 1994 MGA Zone 56Projection Transverse MercatorDatum GDA 1994
plusmn SCALE
0 50 100
Metres
Scale 12500 A3
frc environmental
Appendix$B$ Introduction$to$Data$Analysis$Used$
Multivariate$Analyses$
Multivariate statistical techniques are widely used in ecology to assess the similarities relationshipsbetweenassemblagesWhereasunivariateanalysescanonlycompareone variable at a time (eg an index of community structure such as a diversity index or a singleindicatorspecies)multivariateanalysescancomparesamplesbasedontheextent thatassemblagesshareparticulartaxaandabundances(ClarkeampWarwick2001)
Thefirststepofmultivariateanalysisusuallyinvolvesthecreationofamatrixofsimilarity coefficients computed between every pair of samples The coefficient is usually a measureofhowclose theabundance is foreachspecies (definedso that100= total similarity and 0=complete dissimilarity) The Bray Curtis similarity measure is commonlythemostappropriateforbiologicaldata(ClarkeampWarwick2001)
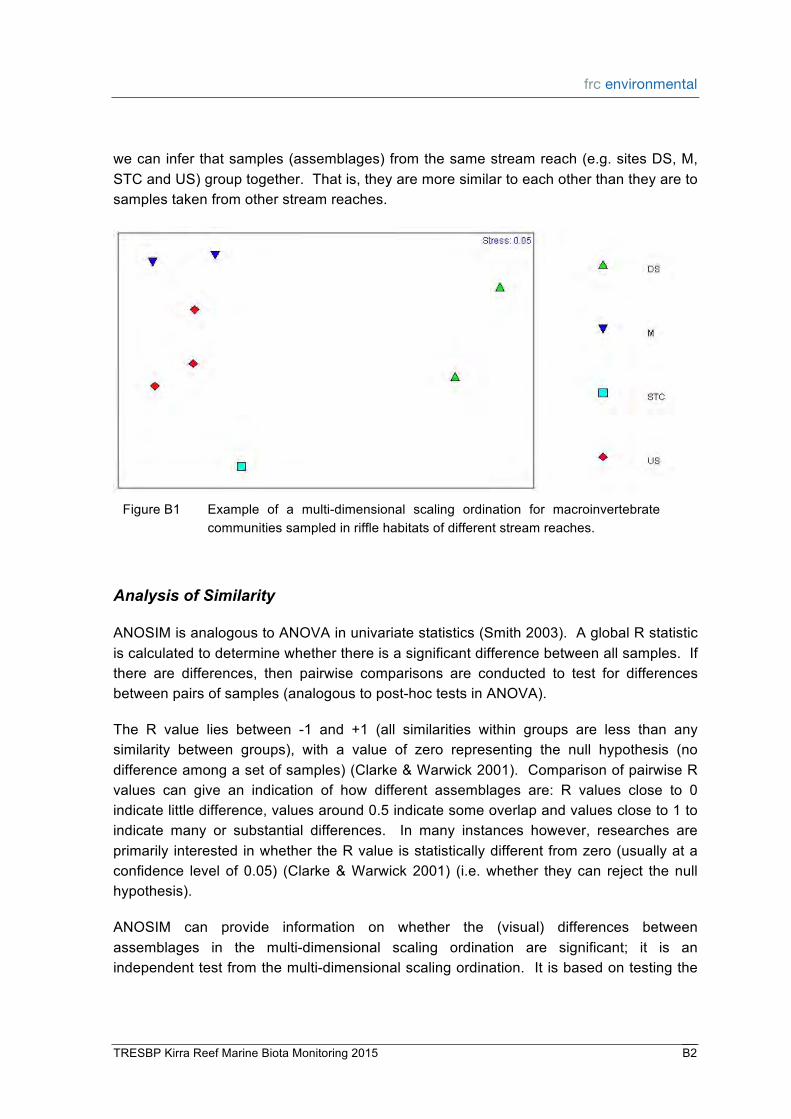
MultidimensionalScaling
NonRmetricmultiRdimensionalscalingordinations(nMDS)attempttoplacesamplesintwo dimensionalspacesothattherankorderofthedistancesbetweensamplesmatchesthe rankorderofthematchingsimilaritiesfromthesimilaritymatrix(ClarkeampWarwick2001) Thisprovidesavisualrepresentationofthesimilaritiesbetweenassemblageswithineach sampleEachoftheaxesisnotrelatedtoanyparticularvalueHinfactaxescanberotated toprovide thebestvisual representationof thedata Ordinationsareparticularlyuseful tools for analysing and visually presenting differences between assemblages Ordinationsareessentiallymapsofsamples inwhich theplacementofsampleson the mapreflectsthesimilarlyofthecommunitytothecommunitiesinothersamples(Clarkeamp Warwick 2001) Distances between samples on an ordination attempt to match the similarities inassemblagestructurenearbypoints representassemblageswithvery few attributes(speciesorabundanceofspecies)Hpoints faraparthavevery fewattributes in common(ClarkeampWarwick2001)
A stress coefficient is calculated to reflect the extent to which the multiRdimensional scalingordinationandthesimilaritymatrixagree(ClarkeampWarwick2001)(iehowwell the multiRdimensional scaling ordination accurately reflects the relationship between samples)Stressvaluesoflt015aregenerallyacceptable
In Figure A1 each freshwater macroinvertebrate sample is represented on the multiRdimensionalscalingordination By lookingat thedistancesbetweeneachsample
ANOSIMisanalogoustoANOVAinunivariatestatistics(Smith2003)AglobalRstatistic iscalculatedtodeterminewhetherthereisasignificantdifferencebetweenallsamplesIf there are differences then pairwise comparisons are conducted to test for differences betweenpairsofsamples(analogoustopostRhoctestsinANOVA)
The R value lies between R1 and +1 (all similarities within groups are less than any similarity between groups) with a value of zero representing the null hypothesis (no differenceamongasetofsamples)(ClarkeampWarwick2001)ComparisonofpairwiseR values can give an indication of how different assemblages are R values close to 0 indicatelittledifferencevaluesaround05indicatesomeoverlapandvaluescloseto1to indicate many or substantial differences In many instances however researches are primarily interestedinwhethertheRvalueisstatisticallydifferentfromzero(usuallyata confidence level of 005) (Clarke amp Warwick 2001) (ie whether they can reject the null hypothesis)
ANOSIM can provide information on whether the (visual) differences between assemblages in the multiRdimensional scaling ordination are significantH it is an independenttestfromthemultiRdimensionalscalingordinationItisbasedontestingthe
TRESBPKirraReefMarineBiotaMonitoring2015 B2
frc environmental
differences between the rank similarities in the similarity matrix not on the distances betweensamplesinthemultiRdimensionalscalingordination(ClarkeampWarwick2001)
PermutationalMultivariateAnalysisofVariance
PERMANOVAisusedtotestsimultaneousresponsesofoneormorevariablestooneor more factors in an a0 priori0 structured design using random permutation of the data to assess significance (Anderson 2004) PERMANOVA generates a pseudo FRstatistic similar to traditional ANOVA but pRvalues are calculated with permutations which does notassumenormaldatadistribution PERMANOVAcanprovide informationonwhether the (visual) differences between assemblages in a multiRdimensional scaling ordination are significantH however it is an independent test from the multiRdimensional scaling ordination
Thelevelofmultivariatedispersionamongsampleswithineachofthetestgroupscanbe examined using the permutational analysis of multivariate dispersions (PERMDISP) routine(Anderson2004)Intraditionalimpactassessmentachangeinthedispersionof datacanalsoindicateanimpact
SimilarityPercentagendashSpeciesContributions
SIMPER analysis provides information on how dissimilar assemblages from various groups are (eg how similar all of the macroinvertebrate samples taken for a particular habitatwithinastreamreachare)andhowsimilareachgroup(egreach)istoanyother group SIMPER analysis also identifies the species taxa that are contributing to the dissimilarity between two assemblages in rank order (ie it identifies which species is contributingthemosttothedifferences)SIMPERanalysismayhelptoidentifypotential lsquoindicatorrsquospeciesForexampleifaparticularspeciesconsistentlycontributesgreatlyto the differences between impacted and unimpacted assemblages it may be a useful indicator Theabundanceofthis indicatorspeciescanthenbecomparedbetweensites usingunivariatetechniquessuchasANOVA
Data is available on request from tresbpprojectofficecrownlandnswgov
TRESBPKirraReefMarineBiotaMonitoring2015 C1
frc environmental
Appendix(D( Pairwise( PERMANOVA( Results
Data is available on request from tresbpprojectofficecrownlandnswgov
TRESBPKirraReefMarineBiotaMonitoring2015 D1
frc environmental
Appendix(E( Relative(Abundance(of(Fish(found(at(Kirra(( ( and(Palm(Beach(Reefs(in(Each(Survey((Data is available on request from tresbpprojectofficecrownlandnswgovau
TRESBPKirraReefMarineBiotaMonitoring2015 E1
Structure Bookmarks
0 50 100 Metres Scale 12500 A3
0 50 100 200 Metres Scale 15000 A3
Kirra Reef
Kirra Reef
Kirra Reef
Kirra Reef
Kirra Reef
Kirra Reef
Map A1Location of Kirra Reef monitoring sites
Table D8 Pairwise comparison of macroalgae cover between sites in each year
Table D15 Pairwise comparison of turf algae cover between sites in each year
Table D29 Pairwise comparison of ascidian cover between sites in each year
Table D43 Pairwise comparison of soft coral cover between sites in each year
Client The New South Wales Government Department of Primary Industries LandsR and the QueenslandGovernmentDepartmentofScienceInformationTechnologyandInnovation
The New South Wales Government Department of Primary Industries LandsR and the QueenslandGovernmentDepartmentofScienceInformationTechnologyandInnovation commissionedfrcenvironmentalonbehalfoftheTweedRiverEntranceSandBypassing Project (TRESBP) to monitor the condition and biodiversity of benthic and fish assemblages at Kirra Reef and to assess potential impacts of the project on those assemblages The purpose of the TRESBP is to maintain a navigable entrance to the Tweed River and to provide a continuing supply of sand to the southern Gold Coast beaches consistent with the natural rate of longshore drift This report discusses the results of ecological monitoring of the benthic fauna flora and fish of Kirra Reef completedinMarch2015
Ongoing monitoring of Kirra Reef is required under the Environmental Management System(EMS)SubgtPlanB14KirraReefManagementPlanpreparedbytheTRESBPin February 2001 The methods used in the March 2015 survey (ie surveys of benthic cover and fish abundance) were those developed for the Stage I survey completed in 1995andhavebeenused in thesubsequentsurveys in19962001200320042005 20102012and2014
ImpactsoftheSandBypassingSystemonKirraReef
The extent of the three major outcrops of Kirra Reef (northern southern and eastern sections)varynaturallydependingonwaterandsandmovementsDuringtheearlyyears of theTRESBP operation largeamounts of sandwere deposited on thesouthern Gold Coast beaches This was done to provide a lsquocatch uprsquo quantity of sand to the badly erodedbeachesreducetheTweedRiverentrancebarandclearasandtrapinthevicinity ofthesandcollectionjettytoincreasetheefficiencyofthebypassingsystemDuringthe initialperiodofincreaseddepositionthevolumeofsanddeliveredexceededtheamount that was transported north through natural mechanisms A large volume of sand was deposited on the southern Gold Coast beaches and wave action and tidal currents redistributed some of this sand over Kirra Reef This resulted in a decline in the areal extentofKirraReefwiththereefalmostcompletelycovered(lt100m2exposed)in2006 The projectrsquos Environmental Impact Statement (EIS) predicted that impacts associated withthegradualaccumulationofsandaroundthebaseofKirraReefwereunavoidable
Sincethedeliveryoflargequantitiesofsandwascompletedin2008thevolumeofsand delivered by the project has declined and now closely matches the natural rate of northwardsandtransportHowevertherewasasubstantiallagbetweenthereductionin sanddeliveryandtransportofthesandfurthernorthduetoaperiodofcalmerthanusual
TRESBPKirraReefMarineBiotaMonitoring2015 i
frc environmental
conditionswith reduced storm activity from the north`east Assuchdispersion of sand from Kirra Beach and reduction in the sand levels around the reef was slower than predictedbetween2005and2009
BetweenFebruary2010andJuly2012 therewasa large(50) increase in theareaof exposedrockinthenorthernsectionofKirraReefThiswaslikelytoberelatedtosevere storms in late 2009 moving sand further north andor to the manual removal of 140000m3ofsandfromKirraBeachin2009
InDecember2013KirraPointgroynewasextendedby30mby theCityofGoldCoast with the expectation that the beach bar would move seaward as a consequence At present theKirraPointgroyneestension in2013isunlikelytohavehadamajor impact onthearealextentofKirraReef
Thereefhasbeenrelativelystablesince2013withminor(lt5)changesintheamount of reefexposed Nonetheless thearealextentofKirraReef remains less than50of the extent recorded in 1962 and in 1995 before the TRESBP began In 2015 the reef comprisesthenorthernsectionandapartof theeasternsectionof thereefasrecorded pre`TRESBP(allthesouthernsectionofthereefremainsburied)
ChangestotheEcologicalConditionofKirraReef
The Projectrsquos EIS did not consider the ecological consequences of the reduced areal extentofreefalhabitatandincreasedwaveenergy(aconsequenceofdecreaseddepth) thatwouldoccurasaresultoftheaccretionofsandaroundKirraReefHoweverasthe TRESBPbettermimicednaturalpatternsofsandtransportsince2009theEISpredicted that the reefrsquos benthic floral and faunal assemblages would return to the conditions exhibitedpriortotheextensionoftheTweedRivertrainingwallsinthemid1960s
Sincemonitoringcommenced thegreatestchangeto the floralandfaunalassemblages of Kirra Reef has been due to the loss of reefal habitat In addition to a reduction in overall abundance of taxa the redistribution of sand mediated through complex interactions between physical disturbance (associated with wave action suspended sedimentssedimentdepositionandburial)foodavailabilityandcompetitionhasresulted inavarietyofsmall`scalechangestothedistributionandabundanceofthereefrsquosbenthic assemblages
InApril2014andMarch2015thediversityofassemblageshadincreasedrelativetoJuly 2012as had thecoverof macroalgae (though it remained well below the peakof 60 coverrecordedinJanuary2001)Thisismostlikelyduetonaturalsuccessionwithmore mature communities being established between 2012 and 2015 when the extent of exposedrockwasrelativelystableNeverthelessthebenthicassemblageonKirraReef
TRESBPKirraReefMarineBiotaMonitoring2015 ii
frc environmental
exhibited signs of ongoing stress from physical disturbance such as storm and wave disturbancephysicalabrasionandburialbysandRincludinglowpercentagecoverofhard coralandsoftcoralThisisconsideredessentiallynaturalandcharacteristicofshallow inshorereefsChronicphysicaldisturbancekeepsthebenthicassemblagesofKirraReef inastateofearlysuccession Thediversity(and insomecasesabundnace)ofareefrsquos benthic assemblage is predicted to increase where the extent of reef remains stable or increases and where the frequency and severity of storm conditions are less than the long`term average This was evident in 2014 and 2015 with a relative high cover of spongesandascidians
InMarch2015amorediverseassemblageoffishwasfoundonKirraReefthanonPalm Beach Reef As fish are mobile they can move more easily to areas that are less disturbed or that exhibit more suitable conditions While the composition of the assemblagedifferedfromprevioussurveyeventsthedifferencesweremorelikelydueto the effects of seasonal changes in water temperature and the effects of prevailing conditions at the time of the survey rather than any substantial effect of the bypassing project
Despite some impacts from the TRESBP (with sand covering much of the reef area) overall the composition of the flora and fauna assemblages on Kirra Reef were more similar to that found at nearby Palm Beach Reef than in previous years Kirra Reef therefore continues to provide habitat to a range of flora and fauna and provides important marine ecological functions and services in the region It is possible that as sandlevelshavestabilisedoverthepastthreeyearsassemblagesareslowlybeginning tobecomemoresimilartothoserecordedpriortoimplementationoftheTRESBPandto thoseatnearbyPalmBeachReef
ImpactsofStormsampSeasonalityonKirraReef
The large quantities of sand that were initially delivered by the project caused a substantialshallowingofthenear`shoreareaaroundthereefThisincreaseinbedlevels wasresponsibleforcoveringasubstatialamountofthereefandsubsequentlyincreasing the incidenceof wavedisturbance and sand scouringaround the reef which negatively impactedthebenthicfaunaandflora
As the delivery of sand through the bypassing system now more closely matches the naturalrateofnorthernlongshoresandtransportshort`termandseasonalchangesinthe areal extent of the reef are more likely the result of natural processes than a discrete impactof thesandbypassingactivity Short`term fluctuations that result fromstormsor changesinthecoastalsandsupplywouldhavebeenacomponentofthenaturalrangeof ecologicalconditionsobservedpriortotheextensionofthetrainingwalls
TRESBPKirraReefMarineBiotaMonitoring2015 iii
frc environmental
Thereappearstobearelationshipbetweentheareaandordistributionofrockexposed andstormeventsatKirraReefNotablyaseriesofstormsin2009andstormyconditions between late 2011 and 2012 correspond to large areas of rock becoming exposed Furtherstormsinearly2013correspondstoaclearchangeinthedistributionofrockat Kirra Reef Since 2013 storm conditions have been calm to moderate and there has beenlittlechangeinthearealextentanddistrubtionofexposedrockatKirraReef
Thecloseproximityofthereeftothecoastcontinuestosubjectthebenthicassemblages tosandabrasionwavedisturbanceandsandsmotheringGreaterbalancebetween the deliveryofsandthroughtheprojectandthenaturalmovementofsandonandoffshoreis likely to result inbetterecologicaloutcomes for thebenthicassemblages foundonKirra Reefandgreaterconsistencyintheextentofreefhabitatthatisuncovered
frcenvironmental expect that the area of reef uncovered will continue to change due to seasonal shifts in sand delivery and stormsR however the diversity of flora and fauna assemblagesonKirraReefshouldincreasegraduallyovertimeespeciallyiftheextentof the rocky reef that remains uncovered is consistent andor increases over time to become moresimilarwith that foundprior to the extension of the trainingwalls In this scenario itwasexpectedthat thatnewlyexposedareasofKirraReef in2012thatwere dominated by turf algae would be colonised by other organisms including macroalgae spongesascidiansandpotentiallyhardandsoftcoralovertimeTheresultsfrom2014 and2015indicatethatthisprocessisslowlyoccurringonKirraReef
The change in areal extent between 2014 and 2015 was approximately 85 in the northern section of Kirra Reef A small area of the eastern section of Kirra Reef also became exposed between 2014 and 2015 Ongoing monitoring will provide insight into therateoflsquorecoveryrsquoofcommunitiesHowevergiventhesmallchangeinarealextentof KirraReefandrealtivelysimilarfloraandfaunacommunitiessurveyedin2014and2015 monitoringcouldbereducedtobiannuallyIfmonitoringisreducedasubstantialchange (eg 15) in the extent of the exposed reef should be used to triggered annual monitoring
TRESBPKirraReefMarineBiotaMonitoring2015 iv
frc environmental
1 Introduction
frcenvironmentalwascommissionedbytheNewSouthWalesGovernmentDepartment ofPrimary IndustriesLandsR and theQueenslandGovernmentDepartmentofScience Information Technology and Innovation on behalf of the Tweed River Entrance Sand BypassingProject(TRESBP)tomonitortheconditionabundanceandbiodiversityoffloral and faunal communities at Kirra Reef This report presents results of the survey of benthicfloramacro`invertebratefaunaandfishatsitesonKirraReefandatcomparative sitesonPalmBeachReefinMarch2015
The current condition of Kirra Reef was compared with the current condition of nearby Palm Beach Reef and with changes to the Kirra Reef community over time ie with previousassessmentsofKirraReefundertaken in199519962001200320042005 20102012and2014(frcenvironmental2014)
The TRESBP was established in 1995 as a joint initiative of the NSW and Queensland GovernmentstoimproveandmaintainnavigationconditionsattheTweedRiverentrance andtoprovideacontinuingsupplyofsandtothesouthernGoldCoastbeachesconsistent withthenaturalrateoflongshoredriftTheprojectwascarriedoutintwostages
sdot Stage2Implementation of a sand bypassing system to maintain the improvementsachievedduringStage1(fromMay2001onwards)
DuringStage1approximatelythreemillioncubicmetres(m3)ofcleanmarinesand(with lessthan3fines)weredredgedfromtheTweedRiverentranceMostofthedredging materialwasdeliveredout to`10mmeanwaterdepthfromPointDangertoNorthKirra withapproximately600000m3ofcleanmarinesandbeingplacedontheupperbeaches fromRainbowBaytoNorthKirraFromApril2000toFebruary2001additionaldredging activities were undertaken to maintain a clear navigation channel at the Tweed River entrance Prior to the establishment of the permanent sand bypassing system a further 480000m3of clean marine sandwas placed innear`shore areas from PointDanger to CoolangattaBeach
Stage2commissioning trialscommenced in March 2001 and full scale operationof the sand bypassing system commenced in May 2001 Since this time approximately 70millionm3ofpumpedsandand14millionm3ofdredgedsand(derivedfromdredging
TRESBPKirraReefMarineBiotaMonitoring2015 1
frc environmental
oftheTweedRivermouth)havebeendepositedalongthesouthernGoldCoastbeaches Mostofthesanddeliveredthroughpumpinganddredginghasbeenplacedintheprimary placementareasoutheastofSnapperRocks Sand isalsodischarged fromoutletsat Duranbah Beach and occasionally at Snapper Rocks West There is an outlet at Kirra BeachRhowever thishasnotbeenusedsinceDecember2003 Aplacementexclusion zone has been established around Kirra Reef extending a minimum of 100m from the reefedge(1995extent)topreventdirectplacementofsandincloseproximitytothereef (Lawsonetal2001)
sdot provide much needed sand nourishment to the severely eroded southern Gold Coastbeaches
sdot reducetheTweedEntranceBarand
sdot clear a sand trap in the vicinity of the jetty to improve the efficiently of the sand bypasssystem
These project objectives were achieved and the quantity of sand delivered since 2008 has been more consistent with the natural quantity of sand movement along the coast (average natural net longshore sand drfit is estimated to be 500000m3 per year in a northward direction) In 2014 a total of 450232m3 was pumped through the sand bypassing system to the primary placement area at Danger Point From January to February2015anadditional105119m3ofsandwaspumpedthroughthesystem
In 2009 the Queensland government removed approximately 140000m3 of sand from KirraBeachintertidalzonetothelowprofilebackdunesIn2013theCityofGoldCoast extendedKirragroyneby30m
12 HistoricalContextforKirraReefMonitoring
Kirra Reef is the collective name given to the complex of rocky outcrops located a few hundredmetresoffshoreofKirraBeachatbetween`3and`10mandwithintheinfluence
TRESBPKirraReefMarineBiotaMonitoring2015 2
frc environmental
of wave action It is subject to naturally shifting sands that intermittently cover and uncover the reefrsquos rocky outcrops (TRESBP 2015a) The exposed extent of Kirra Reef hasvariedoverthepast50yearsduetonaturalstormeventsandchangestothecoastal environmentsuchastheextensionoftheTweedRivertrainingwallsinthemid`1960sand commencementoftheTRESBP(TRESBP2015a)Therearethreemajoroutcropsofthe reefthenorthernsouthernandeasternsectionswhichhavebeenvariouslyexposedin thepast(refertoTable11andFigure11)
MonitoringofKirraReef is requiredunderaproject`specificEnvironmentalManagement System (EMS) prepared by the TRESBP in February 20011 Under EMS SubgtPlan B14 KirraReefManagementPlaniftheareaofexposedreefonaerialphotographsissmaller thantherangeofareasshownonaerialphotographsfrom1962to1965thenmonitoring ofthemarinebiotaofKirraReefisrequired
frcenvironmentalcompletedabaselineassessmentofKirraReefinAprilandJune1995 (FisheriesResearchConsultants1995a)(FisheriesResearchConsultants1995b)andhas undertaken nine subsequent ecological monitoring surveys of the reef on behalf of TRESBP in February 1996 January 2001 May 2003 March 2004 February 2005 February 2010 July 2012 April 2014 (Fisheries Research Consultants 1996R frc environmental2001R2003R2004R2005R2010)andthecurrentsurveyinMarch2015
13 TemporalChangesintheAreaofExposedReef
AreductionintheexposedextentofKirraReefwaspredictedintheprojectrsquosEIS(Hyder Consulting 1997) It was also expected that Kirra Reef would return to pre`1960rsquos conditions before the extension of the Tweed River breakwaters that interrupted the northerlymovementofsandwereconstructed(Lawsonetal2001)
Prior to 1960 Kirra Reef was partially covered by sand which varied naturally with the naturalsupplyofsandandwaveenergyDuringthe1960rsquosfollowingtheextensionofthe Tweed River training walls between 1962 and 1965 Kirra Reef became increasingly exposed due to the depleted sand supply (note the increase in area of Kirra Reef from 1962 to1972 inTable11) Following theKirraPointgroynecontruction in1972 there was further depletion of sand supply and Kirra Reef was perennially exposed (note the increaseinareaofKirraReeffrom1972to1995inTable11RrefertoFigure11forthe extentofreefin1995)Kirrareefgroynewasshortened(from175mto145m)in1996
1 The ongoing reef monitoring also incorporates additional monitoring activities implemented by the
TRESBPinAugust2004
TRESBPKirraReefMarineBiotaMonitoring2015 3
frc environmental
AccumulationofsandonKirraReefwasobservedasaresultofindirectsandnourishment bytheTRESBP(notethedecreaseinareaofKirraReefafter1995inTable11)Aerial photographs taken in 2003 and 2004 showed the reef to be of significantly less extent than the range of extent observed in 1962 and 1965 (Table 11) Loss of reef area continuedforsomeyearsandbyearly2006theareaofexposedreefhadbeenreduced to lt100m2 There was a substantial lag between the reduction in sand delivery and transportof thesand furthernorthdue toaperiodofcalmer thanusualconditionswith reducedstormactivityfromthenorth`eastAssuchdispersionofsandfromKirraBeach andreductioninthesandlevelsaroundthereefbetween2005and2009wasslowerthan predicted (refer to Figure 11 for the extent of reef in 2009) As a consequence of the extensiveburialofthereefsimplevisualinspectionsofthereefwereundertakeninplace offullecologicalsurveysbetween2006and20102
In2009eightyearsaftertheinitiationofsandpumpingbytheTRESBPbeganaseriesof storms shifted approximately 200000 m3 of sand from Kirra Beach to the north This storm was the worst protracted storm for east facing beahes in at least 14 years with significant wave heights remaining for four days (TRESBP 2014) This along with the removalofapproximately140000m3ofsandfromtheKirraBeachintertidalzoneagain uncoveredpartsofKirraReef (TRESBP2015a) Since2008sanddeliveryvolumesof the TRESBP have been more consistent with the natural quantity of sand movement alongthecoastEcologicalsurveysrecommencedin2010astheexposedareasofKirra Reefincreasedinextent
Between November 2011 and August 2012 there was a large increase in the northern section of Kirra Reef when the area of exposed rock more than doubled (Table 11R Figure11) This corresponds to a lsquostormy yearrsquowith one severe storm and twomajor storms recorded (TRESBP 2015b) Further stormy conditions were recorded in early 2013withoneextremestorm(approximately110yearevent)inJanuaryandonemajor storminFebruary(TRESBP2015)Therewaslittlechangeinthetotalareaofexposed reefduring this time (note thesimilarareaofAugust2012andMay2013 inTable11) Howevertherewascleardistributionchangesintheareasofexposedrock(Figure11) Thereefareahasremainedrelativelystablesince2013withminorchangesintheareaof rock exposed (Table 11R Figure 11) Wave height data since 2013 indicates calm to moderate conditions with only minor storms recorded except in May 2015 when there wasaseverestorm(TRESBP2015)Inlate2013KirraPointgroynewasreinstatedby 30mtoitsorginalconstructedlengthGiventheminorchangesintheexposedrocksince
2 Underwater visual inspections were completed by Gilbert Diving and Gold Coast City Council from
In2014KirraReefcoveredanareaof2920m2Rpredominantlyinthenorthernsectionof thereefInMarch2015thisnorthernsectioncoveredanareaofapproximately2672m2 (Figure11andFigure12)an85decreaseintheexposedextentbetween2014and 2015 In March 2015 the rocky outcrops were typically between 1 and 2m above the cleanmobilesandwithseveraloutcropsextendingtomorethan2mabovethesandA small section (116m2) of the eastern reef wasalsoexposed inMarch 2015 (Figure 11 andFigure12)Howeverthereefarearemainslessthan50oftheextentrecordedin 1962and1995beforetheTRESBPbegan(Table11Rreefareabetween1962and1965 was between 7000 and 13300 Department of Land and Water Conservation photogrammetricanalysis)
TRESBPKirraReefMarineBiotaMonitoring2015 5
frc environmental
Table11 ApproximateexposedextentofKirraReef
Area(m2) Date SourceofImage
NorthernSection SouthernSection EasternSection Total
The southeast Queensland (SEQ) region comprises five subregions the Gold Coast Inner Moreton Bay Outer Moreton Bay Sunshine Coast and Fraser Coast Coral communities within SEQ are diverse with an extensive range of coral growth forms (Harrison et al 1998) The greatest diversity of coral species are typically found at offshoresites likeFlindersReefswhere119differentcoralspecieshavebeen recorded (Harrisonetal1998)
Subtidal rocky reefs of the Gold Coast region comprise remnants of highly eroded volcanic substratum isolated by wide variable expanses of soft sediment (Edwards amp Smith 2005) They support community assemblages that are indicative of a transition between the tropical waters of the Great Barrier Reef and the temperate waters characteristicofthemidNewSouthWalescoast(Done1982XCannonetal1987)
GoldCoastreefcommunitiesarebroadlysimilartoareasofcomparabletopographytothe north(InnerGneeringsoffshorefromMooloolabaandoffshoreofMoretonBay)andtothe south (Julian Rocks offshore of Byron Bay) that are dominated by macroalgae and sessile invertbrates(FisheriesResearchConsultants1991XHarriottetal1999XEdwards amp Smith 2005X Baronio amp Butcher 2008X Fellegara 2008X SchlacherHoenlinger et al 2009)ManyoftheGoldCoastsreefslocatedclosetoshoreareoftenaffectedbyhuman activities (Noriega 2007)and typicallyhave lesscoralcover Ina2013surveyofSEQ reefsGoldCoastreefshadthelowesthardcoralcoverat9(Hutchinsonetal2013)
Fish of the Gold Coast region are similar in community composition to that recorded offshore of Moreton Bay at Julian Rocks and the Solitary Islands offshore of Coffs Harbourandtoa lesserextentat theexHMASBrisbanenearMooloolaba(Robinsonamp Pollard 1982X Parker 1995X Parker 1999X Edwards amp Smith 2005X Malcolm et al 2009X SchlacherHoenlingeretal2009) The smaller inshore reefsof theGoldCoast region suchasKirraReeftypicallysupportalowerabundanceanddiversityoffishes(Edwards ampSmith2005Xfrcenvironmental2005)
Kirra$Reef$
ThebenthicassemblagesofKirraReefarecharacterisedbyahighcoverofmacroalgae andturfalgaeandamoderatecoverofsessilebenthicinvertebratesincludingafewhard corals(EdwardsampSmith2005Xfrcenvironmental2005)Turfalagecoversthemajorityof the reef substrate Crinoids (feather stars) ascidians (sea squirts) and sponges are typically themostabundantbenthic faunawhilstanemonessoftcoralsandurchinsare present in low numbers (frc environmental 2014) The composition of benthic assemblagesatKirraReef isbroadlysimilar to thatdescribed fromadjacent rockyreefs
Exposuretowaveactionsandscouringandsmotheringareimportantfactorsinfluencing the distribution and abundance of sessile species on rocky reefs (Kay amp Keough 1981X McGuinness1987)ChangeintheheightofsandaroundthebaseofKirraReefappears to be a major factor influencing the abundance (cover) of benthic flora and fauna periodically resulting in a bare stratum on rocks within 08 to 1m of the seafloor Outcropsontheeasternsectionof thereefcomplexwherewaveactionand likelysand abrasion are greatest have historically supported a lower abundance of benthic fauna than outcrops on the northern section (Fisheries Research Consultants 1995a)X (Fisheries Research Consultants 1995b)X (Fisheries Research Consultants 1996)X (frc environmental 2003)X (frc environmental 2004)X (frc environmental 2005)X (frc environmental2010)
Strong wave action results in sustained abrasion of the dominant brown macroalgae (Sargassum(flavicans(andEcklonia( radiata)causing the fronds tobreak Thecontinual resuspensionofalgal fragments(commonlyreferredtoas lsquocornflakesrsquo)candramatically reducewaterclarityandvisibility Algal fragmentswere largelyabsent inJuly2012and April2014surveyslikelyduetolongperiodsofrelativelybenignseaconditionsInMarch 2015amoderateamountofalgalfragmentswasobservedlikelyduetostormactivityin theweeksproceedingthesurvey(egmoderateseas11to14Februaryandminorstorm over1922February)
RecentsurveysatPalmBeachReefcompletedbyReefCheckrecordedadeclineinhard coralcover from2008to2013(Hutchinsonetal2013) Sessile invertebrates including spongescoralsandascidianstypicallydominatethebenthicassemblageofPalmBeach Reef(EdwardsampSmith2005X frcenvironmental2005XReefCheck2010) Thecoverof sessileinvertebrateshashistoricallybeensimilartothatrecordedfromtheoutersections of Kirra Reef However the cover of macroalgae has consistently been loweron Palm BeachReefthanonKirraReefTheproximityofPalmBeachReeftotwocreekmouths andtheabsenceofstrongcurrentsintheareatypicallyresultsinahighlevelofturbidity Elevated turbidity together with greater water depth and a high abundance of grazing
TRESBPKirraReefMarineBiotaMonitoring2015 10
frc environmental
speciessuchasurchinsislikelytocontributetoarelativelylowcoverofmacroalgaeand abundant suspension feeding organisms such as ascidians sponges hydrozoans and crinoidsatPalmBeachReef(Smithetal2005)
PalmBeachhasa lowerabundanceanddiversityof benthicdemersaland pelagic fish comparedtoKirraReef(Smithetal2005)ThegreaterdensityoffishatKirraReefmay beaconsequenceof the lossof reef forcingmore fish intoasmallerarea (Smithetal 2005)PalmbeachrecordedaslightlylowerdiversityoffishthanKirraReefin2012and 2014surveys(frcenvironmental2012Xfrcenvironmental2014)
TRESBPKirraReefMarineBiotaMonitoring2015 11
frc environmental
2$ Methods$
The methods used in the March 2015 survey were developed for the Stage I survey completed in April and June 1995 and used for subsequent surveys February 1996 January 2001 May 2003 March 2004 February 2005 February 2010 July 2012 and April2014 Datawere collected from KirraReef (2816251535309) andPalmBeach Reef(2810751534774)locatedapproximately9kmnorth(Figure21)
Themainobjectiveof the monitoring was to investigateanychange in the marinebiota and habitat of Kirra Reef compared to Palm Beach Reef (comparative reef) in order to assesstheeffectofthesandbypassproject(andsubsequentincreasesinsandload)on theecologyofKirraReef
0 2 41
Kilometres
Service Layer Credits Sources Esri HERE DeLorme Intermap increment P Corp GEBCO USGS FAO NPS NRCAN GeoBase IGN Kadaster NL Ordnance
0 2 41
Kilometres
Service Layer Credits Sources Esri HERE DeLorme Intermap increment P Corp GEBCO USGS FAO NPS NRCAN GeoBase IGN Kadaster NL Ordnance
Threesites(KRN1KRN2KRO3)atKirraReef(waterdepth5to8m)weresurveyedin March 2015 (Map 1) The remainder of the sites previously surveyed were covered by sand(refertoappendixAforahistoryofsitespreviouslysurveyed)Threecomparative sites (PB1 PB2 and PB3) were also surveyed at Palm Beach Reef (water depth 12 to 17m)(Map2)
TRESBPKirraReefMarineBiotaMonitoring2015 12
orth NetreStkicrraG
Marine Parade
t eertS ickr
M rarin ae Pa Grade
Musgrave St
t
re ee e Powel t r lt CrescenS t t es eel ri tM S
t ee ge drt u tleS d Rro MuL sgrave Street
LEGEND 0 1 Km Tweed River E ntrance Sand Bypassing Project Survey Site Road Network
copy Copyright Commonwealth of Australia (Geoscience Australia) 2001 2004 2006copy The State of Queensland (Department of Natural Resources and Mines) 2015copy Nearmap 2014
DATE2015-03-24
DRAWN BYCF
VERSION01
PROJECTIONCoordinate System GDA 1994 MGA Zone 56Projection Transverse MercatorDatum GDA 1994
plusmn SCALE
0 50 100 200
Metres
Scale 15000 A3
Gold Coast Highway
i
PalmBeach
Tugun
Coolangatta
0 1 Km
frc environmental
22$ Benthic$Flora$and$Macroinvertebrates$
At each site benthic assemblages were surveyed in fifteen 025m2 quadrats with the percentcoverofbenthicmacroalgaeturfalgaespongesascidianshardcoralsandsoft coralsassessedvisually(Figure22)Quadratswereplacedhaphazardlywhichincluded horizontal and sloping surfaces The minimum distance between quadrats was approximately2m Thenumberof largeascidians (Pyurastolonifera)crinoids (feather stars)barnaclesurchinstubewormspolychaeteshydroidszoanthidsandcowriesand the dominant species of macroalgae were also recorded and quantitative notes were madeontheapparenthealthofeachtaxonomicgroup
ThespeciesrichnessandrelativeabundanceoffishatKirraReefandPalmBeachReef were assessed using a combination of underwater visual census (UVC) and video surveys The combination of these techniques represents the most costeffective and efficientmeansofobtainingdataonthestructureoffishassemblagesindifferenthabitats (Murphy amp Jenkins 2010) A baited remote underwater video (BRUVX baited with pilchards) and footage captured by a diver swimming hapazard trasects over the reef wererecorded
Video footage from each BRUV (approximately 20minutes) and video transects (approximately 35 minutes) was reviewed by an ecologist experienced in marine fish identification
24$ Data$Analysis$
Permutational multivariate analysis of variance (PERMANOVA) was used to determine differences in the composition (cover of benthic fauna and taxonomic group) of benthic assemblagesbetweenKirraReefandPalmBeachReefover time PERMANOVAuses permutational methods (PsuedoAF) to derive statistical significance which require fewer assumptionstobemetthananalogousmethodssuchasmultivariateanalysisofvariance (MANOVA) (Anderson 2001X Anderson et al 2008) This analysis enables an examinationofchangesinthecommunityasawhole
A three factor PERMANOVA was used to examine differences in the composition of benthic assemblages with survey (fixed factor) locations (Palm Beach Reef and Kirra Reeffixedfactor)andsites(nestedinlocationsasarandomfactor)asthefactorsData weresquareroot transformedtodownweightdominatingspeciesabundanceXconverted toaBrayCurtisdistancematrixXandtestedforsignificanceusingasmanypermutations as allowed (9800 to 9937 unique permuations achieved for all factors and factor combinationsXexceptlocationwhere10uniquepermutationswereachieved))Posthoc pairwisetestwasusedtodeterminethemagnitudeofdifference
Nonmetricmultidimensionalscaling (nMDS)ordinationswereused tovisually represent the variation in the composition of assemblages between reefs separately for each survey nMDS ordinations were also used to visually represent the variation in the compositionofassemblagessurveysatKirraReefforallsurveysXbaselinesurveyinApril 1995andMarch2015XandApril2014andMarch2015
Separate univariate PERMANOVAs were used to compare differences in the cover of macroalgae turf algae and the abundance of crinoids and ascidians Data were
TRESBPKirraReefMarineBiotaMonitoring2015 16
frc environmental
converted to a eucildean distances matrixX and tested for significance using as many permutations as allowed (998 to 999 unique permuations achieved for all factors and factor combinationsX except location where 10 unique permutations were achieved) Factors were survey (fixed factor) locations (Palm Beach Reef and Kirra Reef fixed factor)andsites (nested in locationsanda random factor) Posthoc pairwise testwas used to determine the magnitude of difference Monte Carlo procedures were used to calculateempiricalPvaluesforthesurveyxlocationtest
Further information on the use and interpretation of PERMANOVA and other analyses usedinthisreportisprovidedinAppendixB
TRESBPKirraReefMarineBiotaMonitoring2015 17
frc environmental
3$ Results$
31$ Cover$of$Benthic$Assemblages$
The composition of benthic fauna and flora ( cover and type combined Appendix C) variedbetweenmostsitesatbothKirraReefandPalmBeachReefandbetweennearly allsurveysateachsite(notethesignificantinteractionofsite(location)xsurveyinTable 31X Appendix D) Nevertheless there appeared to be substantial differences in the compositionofthebenthicassemblagesbetweenthetworeefsineachsurveyfrom1995 to2015(Figure31toFigure33)
In2015 therewassomeoverlap in thecompositionofassemblagesonKirraandPalm Beach Reefs (Figure 33) However there was also some clear patterns of difference including
Benthic assemblages at Kirra Reef appeared to show some overlap between surveys (Figure34H) HowevernearlyallsurveysweredifferentateachsiteatbothKirraReef andPalmBeachReef(AppendixD)BenthicassemblagesinMarch2015andApril2014 wereverysimilarcomparedtobenthicassemblages inthebaselinesurvey inApril1995 andMarch2015(notethegreateroverlapinFigure35comparedtoFigure36)
In March 2015 as in previous surveys the macroalgae Sargassum sp dominated the benthic assemblages at all sites at Kirra Reef (Figure 37) Other species present included
sdot Dictyopteris0arostichoides0
sdot Dilophus0intermedius00
sdot Zonariasp
sdot Laurencia0brongniartic0
sdot Amphiroa0anceps0
sdot Caulerpa0lentilliferaand
sdot Halimeda0discoideaand
sdot Macrocystissp
Juvenile kelp (from the genus Macrocystis) was also emerging on some areas of Kirra Reef
ThecoverofmacroalagevariedbetweensitesandsurveysatbothKirraReefandPalm Beach Reef with the magnitude of difference varying over time (note the significant interaction between site (location) x survey in Table 32) Macroalgae cover varied between surveys with 2001 being the most different to the other years (Appendix D) ThereweredifferencesbetweensitesatKirraReefinJune1995February1996January 2001 May 2003 February 2005 and February 2010 and between sites at Palm Beach ReefinJanuary2001andFebruary2010Inrecentsurveys(2012to2015)thecoverof macroalgaeatsitesatbothKirraReefandPalmBeachReefwassimilar (AppendixD) indicatingarelativelyconsistentdistributionacrossbothreefs
ThemeancoverofmacroalgaeatKirraReefhasdeclinedsinceitspeakin2001withthe greatest magnitude of decline recorded between January 2001 and May 2003 (Figure 38)InsurveysbetweenJune1995andMay2003Sargassumspformeddensecarpets overtherockysubstratecoveringupto58oftheavailablesurfaceareaofthereefIn February 2010 macroalgal cover was 12 Macroalgal cover has increased to 26 in March2015ThisissimilartothecoverrecordedinApril1995(23cover)(Figure38)
In2015nomacroalgaewasrecordedwithinthequadratsatPalmBeachReefThecover of macroalgae on Palm Beach Reef has been consistently lower than Kirra Reef since
TRESBPKirraReefMarineBiotaMonitoring2015 26
frc environmental
ecologicalmonitoringbegan typically lessthan5of theavailablesurfacearea(Figure 38)
The mean cover of turf algae varied between sites and surveys at both Kirra Reef and PalmBeachReef(notethesignificantinteractionbetweensite(location)xsurveyinTable 33)SpecificallythereweresignificantdifferencesbetweensitesatbothKirraReefand PalmBeachReefinJune1995January2001February2010July2012andApril2014 (aswellasbetweensitesinFebruary1996atKirraReef)Thecoverofturfalgaevaried betweenmostsurveysatallsitesateachreef(AppendixD)BothKirraandPalmBeach reefs showed major increases in the percent cover of turf algae from 2010 to 2012 followedbyadecreaseincoverbetween2012and2014(Figure310)Thecoverofturf algae is typically lower at Kirra Reef than at Palm Beach Reef (July 2012 being an exception) and was again slightly lower at Kirra Reef in March 2015 (Table 310) In March2015turfalgaewasmoreprevalentatKirraReefthanduringthebaselinesurvey ofApril1995
ThemeancoverofspongesatsomesitesatbothKirraReefandPalmBeachReefhas varied significantly during some surveys (note the significant interaction between site (location)xsurvey inTable34HFigure311) However thecoverofspongestendedto bemore temporallyvariable atKirraReef than at Palm Beach Reef (Figure312) The cover of sponges at Kirra Reef varied between sites in February 1996 January 2001 March2004July2012andApril2014 However thecoverofspongesatPalmBeach Reefonlyvariedbetweensites inJanuary2001andFebruary2010 (AppendixD) The cover of sponges varied between survey at each site with 1995 1996 and 2001 most differenttootheryears(AppendixD)
ThemeancoverofspongesatKirraReefdeclinedbetweenMarch2004(20cover)and February 2010 (less than 1 cover) Since 2010 the cover of sponges has increased slightly with sponges covering 8 of the reef in March 2015 (Figure 312) In March 2015thecoverofspongeswashigherthanrecordedduringthebaselinesurveyinApril 1995(3cover)(Figure312)
Figure312 Mean cover of sponges (plusmnSE) at Kirra Reef and Palm Beach Reef on all
surveys
Table34 Univariate PERMANOVA results for differences in the cover of sponges betweensurveysandlocations
Factor$ df$ MS$effect$ PseudoF$ p$(perm)$
survey 10 18576 276 0018
location 1 39671 589 0210
site(location) 4 67354 477 0001
locationxsurvey 10 1490 221 0032
site(location)xsurvey 40 67331 477 0001
error 924 14108
Shadingdenotessignificanceatplt005
TRESBPKirraReefMarineBiotaMonitoring2015 32
frc environmental
Ascidians$
ThemeanabundanceofallascidiansotherthanPyura0stoloniferahasvariedsignifcantly between sites at Kirra Reef and Palm Beach Reef and between surveys at each site (Figure314andnotethesignificantinteractionbetweensite(location)xsurveyinTable 35) The abundance of ascidians was different between sites at Kirra Reef in January 2001May2003March2004February2005andApril2014HanddifferentatPalmBeach ReefinJanuary2001February2005February2010andMarch2015Theabundance ofascidiansvariedbetweensurveysateachsitewith1995beingmostdifferentwhenthe abundanceofascidianswaslow(AppendixD)InMarch2015theabundanceofallother ascidiansonKirraReefandPalmBeachReefwashigherthanpreviouslyreportedinthe baselinesurveyinApril1995(whennoascidianswererecorded)Themeanabundance washigheratKirraReefthanatPalmBeachReef(Figure314)
ThemeanabundanceofPyura0stoloniferahasvariedconsiderablybetweensitesatKirra Reef and Palm Beach Reef over time (note the significant interaction between site (location) x survey in Table 36) In March 2015 the mean abundance (individual per 025m2plusmnSE)of theascidianPstolonifera (Figure313)wassimilaratKirraReefand PalmBeachReef(Figure315)ThemeanabundanceofP0stoloniferahasrangedfrom 02to17individualsper025m2atbothreefssinceMay2003
Figure315 Mean abundance of ascidians (Pyura0 stolonifera) (individuals025m2)
(plusmnSE)atKirraReefandPalmBeachReefinallsurveys
TRESBPKirraReefMarineBiotaMonitoring2015 34
frc environmental
Table35 Univariate PERMANOVA results for the differences in cover of all ascidians otherthanPyura0stolonifera0betweensurveysandlocations
Factor$ df$ MS$effect$ PseudoF$ p$(perm)$
survey 10 26658 474 0001
location 1 13603 710 0104
site(location) 4 19154 149 0212
locationxsurvey 10 2629 468 0001
site(location)xsurvey 40 5621 438 0001
error 924 12828
Shadingdenotessignificanceatplt005
Table36 Univariate PERMANOVA results for the differences in Pyura0 stolonifera densitybetweensurveysandlocations
Factor$ df$ MS$effect$ PseudoF$ p$(perm)$
survey 10 16254 11842 0001
location 1 12445 60881 0206
site(location) 4 20442 56799 0001
locationxsurvey 10 79724 58082 0001
site (location) x 40 13726 38138 0001 survey
error 924 35991
Shadingdenotessignificanceatplt005
$
TRESBPKirraReefMarineBiotaMonitoring2015 35
frc environmental
Hard$Coral$
There was a significant difference between the cover of hard corals at Kirra Reef and PalmBeachReefduringsomesurveys(notethesignificantinteractionbetweenlocationx surveyinTable37)SpecificallytherewassignificantlymorehardcoralatPalmBeach Reef thanKirraReef inFebraury1996March2004April2014andMarch2015(Table 38)
ThecoverofhardcoralistypicallylowonKirraReefaccountingforlessthan2ofthe availablesubstrateInMarch2015hardcoralcoveredlessthan1oftheareaofKirra Reef which was less than the cover recorded during the baseline survey in April 1995 (Figure 316) In contrast hard coral covered 11 of the surface area at Palm Beach ReefwhichwasgreaterthanthecoverrecordedinApril1995(Figure316)
The cover of hard corals at Palm Beach Reef has been more variable over time comparedtothecoverofhardcoralatKirraReef(Figure316)Withtheexceptionofthe surveys inApril1995andJanuary2001when thecoverofhardcoralwas lowonboth reefshardcoralsaretypicallymoreprevalentatPalmBeachReef(Figure316)
Table38 PERMANOVA post hoc pairwise results for the differences in the cover of hardcoralbetweenlocationsineachsurveyevent
Hard$Corals$ Survey$
t$ p$(MC)$a$
Apr1995 054 0606
Jun1995 182 0140
Feb1996 541 0006
Jan2001 R R
May2003 166 0168
Mar2004 765 0001
Feb2005 049 0646
Feb2010 156 0197
Jul2012 283 0053
Apr2014 525 0011
Mar2015 695 0003 Shadingdenotessignificanceatplt005 a pvaluesbasedonMonteCarlotests
TRESBPKirraReefMarineBiotaMonitoring2015 37
60
50
40
30
20
10
0
Soft
Cor
al C
over
()
Kirra Reef Palm Beach Reef
frc environmental
Soft$Coral$
The cover of soft coral was significantly different between sites at both Kirra Reef and PalmBeachReefandduringsomesurveys(notethesignificant interactionbetweensite (location)xsurvey)TherewasnosoftcoralrecordedatKirraReefinMarch2015The coverofsoftcoralhasdeclinedatKirraReefsince2003andhascoveredlessthan2of theavailablesubstratesince2005whichissimilartothecoverofsoftcoraldescribedfor the baseline surveys in 1995 (Figure 317) The cover of soft coral was consistent betweensitesineachsurveyexceptbetweensitesin
sdot April1995atKirraReef
sdot 1996atKirraReef
sdot 2003atPalmBeachReefand
sdot 2014atPalmBeachReef(AppendixD)
Soft corals have historically covered more of the available space on Palm Beach Reef than on Kirra Reef However there was more temporal variability within sites at Palm BeachReefthanatKirraReef(AppendixD)ThecoverofsoftcoralatPalmBeachReef has varied over time and was highest in April 1995 (48 cover) Despite increasing sinceFebruary2005itisstilllowerthanthecoverrecordedduringthebaselinesurveyin April1995(Figure317)
Table39 UnivariatePERMANOVAresults for thedifferences in thecoverofsoft coral betweensurveysandlocations
Factor$ df$ MS$effect$ PseudoF$ p$(perm)$
survey 10 44657 1323 0001
location 1 32922 6620 0117
site(location) 4 49732 266 0036
locationxsurvey 10 40982 1214 0001
site (location) x 40 3376 181 0002 survey
error 924 18688
Shadingdenotessignificanceatplt005
$
TRESBPKirraReefMarineBiotaMonitoring2015 39
frc environmental
Crinoids$
ThereisasignificantdifferencebetweensomesitesatbothKirraReefandParmBeach Reef that varies through time (note the significant interaction between site (location) x survey inTable310) Theabundanceofcrinoidshasbeensimilarbetweensites inall years at Palm Beach ReefH and was different beween sites at Kirra Reef in June 1995 February1996May2003andFebruary2005(AppendixD)Withineachsitetherehas been some natural temporal variability particualrly at Palm Beach Reef sites in 2001 (Appendix D) The mean abundance (individuals 025m2) of crinoids (Figure 318) at KirraReefandPalmBeachReefhasgenerallybeenlessthan2individualsper025m2 andhasdeclinedatboth locationssincethebaselinesurvey inApril1995(Figure319) However the mean abundance of crinoids on Kirra Reef has shown a slight increase sinceFebruary2010(Figure319)
In March 2015 fewer crinoids were recorded at Palm Beach Reef than at Kirra ReefH crinoidshavebeenrareatPalmBeachReefsince2003
The species richness of fish recorded from Kirra Reef across all monitoring events has rangedfrom14to57 InMarch201557specieswereidentifiedat thereefwhichwas similar to April 2014 (53) and higher than previous surveys (Figure 320) Species richnessatPalmBeachReefwas lower(34species)andgenerallyvaried lessbetween surveyscomparedtoKirraReef
InMarch2015 the assemblage of fish at KirraReef comprised species fromall trophic levelsincludingdetritivoresplanktivoresherbivoresandcarnivores(AppendixE)Asin previous surveys the assemblage was dominated by herbivores and planktivores Yellowtail (Trachurus0 novaezelandiae) and striped sea pike (Sphyraena0 obtusata) were the dominant species present in large schools (Figure 321) Australian mado (Atypichthys0 strigatus) ringRtailed surgeon (Acanthurus0 blochii) silver trevally (Pseudocaranx0 georgianus) eastern pomfred (Schuettea0 scalaripinnis) sweep (Scorpis0 lineolatus) and various wrasses were also very abundant releative to other species (AppendixE)
Two new species were observed at Kirra Reef the orangeRband surgeon (Acanthurus0 olivaceus) and the unicornfish (Naso0 sp) Five new species were recorded at Palm BeachReef
No threatened or protected fish species listed under the Queenslandrsquos Nature0 Conservation0Act01992ornationallyundertheEnvironmental0Protection0and0Biodiversity0 Conservation0 Act0 1999 were observed The complete list of species recorded and the relativeabundanceispresentedinAppendixE
TRESBPKirraReefMarineBiotaMonitoring2015 42
60
0
10
20
30
40
50
Num
ber
of F
ish
Spe
cies
Apr-95
Jun-95
Feb-96
Jan-01
May-03
Mar-04
Feb-05
Feb-10
Jul-12
Apr-14
Mar-15
Kirra Reef Palm Beach Reef Location
frc environmental
Figure320 Number of fish species recorded at Kirra Reef and Palm Beach Reef on
ThegreatestchangetotheecologicalconditionofKirraReefsincethebaselinesurveyin 1995 has been the loss of large areas of hard substrate that support benthic flora and faunaThedeliveryoflargesandvolumesduringthestage1dredgingoperations(1995 to1998)andtheinitialoperationofthesandbypasssystem(2001to2008)resultedinan increaseinwaveactionandtidalcurrentsredistributingthissandoverKirraReef
The three major outcrops of Kirra Reef (northern southern and eastern sections) are naturally exposed and covered depending on water and sand movements In March 2015 the rocky outcrops in the northern section of Kirra Reef were exposed and supportedamoderatelydiversebenthicassemblagedominatedbyturfalgaeTherewas arelativelyhighfishdiversityatKirraReefTheecologicalassemblageexhibitedsignsof ongoingstressfromphysicaldisturbanceincludingtheabsenceofsoftcoralsandrarityof hardcoral(MumbyampSteneck2008)HoweverKirraReefhasarelativelyhighcoverof sponges and ascidians Sponges ascidians and crinoids were more abundant at Kirra ReefthanatPalmBeachReefinMarch2015
KirraReefcontinues toprovidehabitatandsupport importantecological functions in the region providing hard substrate for the colonisation of algae and benthic invertebrates and food and refuge for fish As sand levels have stabilised since 2008 assemblages have becomemoresimilar to those recordedprior to implementationof the TRESBP in April1995 Forexamplemacroalgalcover inApril1995andMarch2015wasrelatively similarHoweverassemblagecompositionisstillsignificantlydifferenttothatrecordedin thebaselinesurveysmostnoticeablyduetoa lowercoverofbaresubstrateandhigher coverofturfalgaeandascidianssincesurveyshavebeenperformed
Benthic$Macroalgae$
The cover of macroalgae at Kirra Reef was relatively similar during the 2014 and 2015 surveys and remained well below the peak of nearly 60 cover recorded in January 2001TherewasasteepdeclineinthecoverofmacroalgaebetweenJanuary2001and May2003whichappearedtobestronglyassociatedwith thedecline inreefareaduring that time as well as a decline in the cover of Sargassum sp (an important indicator speciesonKirraReef) SimilardeclineswereevidentatPalmBeachReefbetween the January2001andMay2003surveys
TRESBPKirraReefMarineBiotaMonitoring2015 45
frc environmental
The cover ofmacroalgae at Palm Beach Reef was much lower thanat Kirra Reef over time There are several possible reasons for the lower cover of macroalgae at Palm Beach
sdot PalmBeachReefisdeeperthanKirraReefandgenerallyhashigherturbidityand therefore greater light attenuation The quantity and quality of available light affectsthedistributionandgrowthofmacroalgae(MillerampEtter2008)
sdot Differences in the pattern of recruitment of algal species to the reefs due to differentwatercurrentsandtimingofthesurveys(Kennelly1987b)
sdot Increased competition with turf algae and sessile benthic invertebrates which competeforspacewithmacroalgae(Kennelly1987aHMillerampEtter2008)
sdot PresenceofdifferentspeciesandhigherdensityofherbivoresatPalmBeachReef (particularly sea urchins and herbivorous fish) which graze on macroalgae (McCook1997HJompaampMcCook2002)
Biological assemblages exposed to physical stress typically exhibit greater levels of temporalandspatialvariability(WarwickampClarke1993HChapmanetal1995)Temporal variationinthecoverofmacroalgaeatKirraReefislikelytobeprincipallyduetotheeffect ofphysicaldisturbance fromwaveactionaswellas theassociatedassociatedabrasion andsmotheringbysandTheeffectsofthesephysicaldisturbanceswouldincreasewith thereductionofKirraReefasedgeeffectsarepronouncedandwaterdepth isreduced Increasedsmotheringbysandcanalsoreducediversity(Hatcheretal1989)abundance recruitment growth survival and seasonal regeneration of macroalgae (Umar amp Price 1998HCheshireetal1999)
Changes in the cover of macroalgae on Kirra Reef over time are also likely due to the extentofthereefchangingHthefishandmobileinvertbratesassociatedwiththereefmay have concentrated which would in turn increase grazing pressure Increased grazing pressure from fish and mobile invertebrates can reduce the coverage and diversity of macroalgaeonreefs(McCook1997HJompaampMcCook2002)
Thecoverof turfalgaeatbothKirraReefandPalmBeachReefhasvariedsignificantly betweensurveysPriorto2005turfalgaetypicallycoveredlessoftheavailablesurface areaonKirraReefthanPalmBeachReefInMarch2015themeancoverofturfalgae hasincreasedsincebaselinesurveysin1995andwasrelativelysimilarbetweenreefs(40 plusmn4atKirraReefcomparedto48plusmn4atPalmBeachReef)Thecoverofturfalgaeat Kirra Reef was similar in 2014 and 2015 which was generally higher than previous surveysexceptduringJuly2012whencoverofturfalgaepeakedat67plusmn4
TRESBPKirraReefMarineBiotaMonitoring2015 46
frc environmental
Turfalgaearebecomingadominantcomponentofcommunitiesaroundtheworld likely the result of rapid colonisation of openspace after a disturbance (eg storms) nutrient enrichment andor changes in grazing pressures Turf algae can also reflect a more physically robust growth form suited to high wave energy environments (than foliose macroRalgae)TurfalgaepeakedintheJuly2012surveylikelyrelatedtotheincreasein bare reef exposure following a stormy conditions in early 2009 and between December 2011 and June 2012 Turf algae have been the dominant form of algae on Kirra Reef sincethistimealbeitthecoverlowerthanthe2012survey
Increased cover of turf algae is typically related to good light conditions high concentrationsofnutrientsandlownumbersofgrazerssuchasfish(orconstantgrazing pressure preventing macroalgae colonisation) However the relationship between algal dynamics physical disturbance water quality and herbivore grazing activity is complex andthecoverof turfalgaecanexhibitextremetemporalvariabilityasaconsequenceof the interactionbetween topRdownandbottomRupprocesses (Russ2003HBellwoodetal 2006H Hughes et al 2007H Albert et al 2008H Hoey amp Bellwood 2008H Mumby 2009) Furtherinvestigationwouldberequiredtoreliablydeterminethemechanismsofchangein bothmacroalgaeandturfalgaeassemblagesonthesereefs
Benthic$Macroinvertebrates$
AtKirraReeftheburialandreRemergenceofrockyoutcrops(influencedbytheTRESBP) islikelytohaveincreasedtemporalvariabilityinthedistributionandabundanceofbenthic macroinvertebrates Additional perturbations such as wave action and sand abrasion (each influenced through changes in bathymetry seabed topography and water depth) are likely to have resulted in the decline in cover and diversity of the benthic macroinvertebratesatKirraReefbetweensurveysparticularlybetweenMarch2004and February2005andduringtheseverestormsof2009Benthicmacroinvertebratessuch asascidiansspongeshardcoralandsoftcoralarehighlysusceptible to theeffectsof stormandwavedisturbancephysicalabrasionandburialbysand(KayampKeough1981H Walker et al 2008) which can affect settlement growth rate and survival (Dodge amp Vaisnys1977HRogers1990)
Physical disturbance from sand burial sand abrasion and the action of storm waves appeartokeepthebenthicassemblagesofKirraReefinastateofearlysuccessionItis commonforearlypioneerspeciessuchassomemacroalgaetorecruitrapidlytoahard surface in large numbers allowing these species to dominate assemblages early in the successionaltrajectory(Walkeretal2007)
Afurther indicatorof theearlystateofsuccessionatKirraReef isthatthecoverofhard and soft coral has remained very low (generally lt 5) In March 2015 less than 1
Benthic macroinvertebrate cover may also be affected indirectly through increased competitionwithmacroalgaeforspaceThepresenceoflargemacroalgaecanaffectthe recruitment and survival of sessile benthic invertebrates as fronds moving with wave action sweep and abrade the surface of rocks killing new recruits especially corals (Kennelly1989HMcCooketal2001)Itcantakeseveralyearsforhardandsoftcoralto become dominant on reefs in the SEQ region (SchlacherRHoenlinger et al 2009) Therefore hard coral is not expected to become abundant until several years after the reefhasbeenuncoveredandonlyifthephysicaldisturbanceregimeandsupplyofnew recruitsissufficienttosupportsurvivalandgenerationalsuccessionofthesespeciesThe coverofhardandsoftcoralsatKirraReefwerebothverylowandpatchypriortothestart oftheTRESBP
Sponges and ascidians are highly susceptible to smothering and sand abrasion unless theyhaveathicktunic(outercoveringmadeofkeratin)liketheascidianP0stolonifera0or strong internal keratin silicon or calcareous structures in the case of some species of sponges0(KayampKeough1981HMcGuinness1987HWalkeretal2008)Duetoincreased wave action and sedimentation (which can be influenced by the TRESBP) the mean coverofascidiansandspongeswasexpectedtobemuchloweronKirraReefthanPalm Beach Reef However in March 2015 the cover of sponges was similar between the reefsandthecoverofascidians(otherthanP0stolonifera)wasgreateratKirraReefthan at Palm Beach Reef This suggests that Kirra Reef is slowly recovering from the increasedstressofphysicaldisturbancesuchas increasedwaveactionandsandscour andorthatwaveandstormconditionshavebeenlesssevereinthepastfewyears
Fish$
KirraReefcontinuestosupportahighdiversityofreefRassociatedandpelagic(ienonR reefassociated) fishspecies Despite itsdiminishedsizecompared to1995KirraReef continuestoprovidevaluablehabitatforanumberoffishspeciesfromdifferentfunctional groups
ThereisahighdegreeofinterRannualvariabilityinthespeciesandabundanceofthefish present at Kirra Reef compared with the assemblage at Palm Beach Reef This likely reflectsthetemporalvariabilityintheavailablehabitatasaconsequenceofreefburialand reRemergenceThediversityqualityandarealextentofreefhabitatareimportantfactors influencing the distribution abundance biomass and diversity of reef fish (Bellwood amp Hughes2001HFriedlanderetal2003)Diversityandabundanceoffishcanincreasewith
TRESBPKirraReefMarineBiotaMonitoring2015 48
frc environmental
greaterstructuralcomplexityandincreasedheterogeneityofavailablehabitats(Bellwood ampHughes2001)Thissuggeststhatperiodsofreefburialreducetheoveralldiversityof reefRassociated fish species at Kirra Reef Despite the reduction in overall reef space therewasalargervarietyofhabitats(suchasmarcoalgaeandturfalgae)in2015which was likely to be related to the high diversity of fish assemblages This is particularly importantforseveralspeciesthatdependonthepresenceoflsquostructurersquosuchasprovided by reef habitat (ie oldwife moray eels damselfish and Australian mado that were recordedinMarch2015butwerenotrecordedinJuly2012)
Theabundanceanddiversityof fishare likelytobenegativelyaffectedfollowingperiods of severe weather which create unfavourable conditions for many species and may further exacerbate the affects of abrasion and sedimentation The biomass of fish is knowntodecreasewithincreasingexposuretophysicaldisturbancefromwaveactionand strong currents (Friedlander et al 2003) As our surveys have been undertaken at different times of the year variation in the prevailing conditions at the time of sampling could also influence the types of fish observed (and the amount of reef habitat that is availableatanytime)Manyofthespeciesmayalsobeaffectedbyseasonalchangesin the water temperature such as damselfish which are less abundant in cool waters However theoveralldiversityof the fishassemblageatKirraReef is likely toreflect the sizeoftheoutcropsexposedwithagreaterphysicaldisturbance(fromseaconditionsand sandmovement)andcompetitionHandlesserfoodavailablewhenthereefiscovered
ThepredictedimpactstoKirraReefasaresultoftheTRESBPincludedaccretionofsand around the base of the rock outcrops causing a reduction in extent of reef It was predictedthatsanddeliveryaspartoftheprojectwouldeventuallymimiclsquonaturalrsquopatterns ofsanddispersalandthatthereefwouldreturntoitsnaturalextent(ietheextentpriorto extension of the Tweed River training walls in 1962) The benthic flora and fauna assemblages of the reef the historical reef extent and natural sand transport patterns wereexpectedtoreturntoconditionsobservedbeforetheextensionofthetrainingwalls between 1962 and 1965 However the Environmental Impact Study did not predict the ecologicalconsequencesofboththereducedarealextentandincreasedwaveenergy(a consequenceofdecreaseddepth)thathavebeenrecorded
ThecurrentextentofKirraReef remains less than50of that recorded in1962and in 1995beforethesanddeliverybytheTRESBPcommencedHowevertheextentofreef in1995 wasstrongly influenced by adepletion in sand following the construction of the Tweed River training walls and the Kirra Point groyne Accumulation of sand on Kirra ReefwasobservedtoincreaseasaresultofindirectsandnourishmentbytheTRESBP and the reef has been extensively covered (particuarly between 2005 and 2010) as a result
Whiletheextentofthereefcontinuestochangeovertimethedeliveryofsandaspartof the project now more closely matches the natural rate of longshore sand transport ShortRtermandseasonalchangesintheextentofthereefarenowlikelytobetheresultof waveandcurrentaction(particularlyduringservereweatherevents)thanadirectimpact of the TRESBP Therefore the extent of Kirra Reef in March 2015 is broadly in accordancewithpredictionsmadeintheEISwhichpredictedthatthereefwouldreturnto a condition similar to that exhibited in the preR1960rsquos ie before the extension of the TweedRiverbreakwatersthatinterruptedlittoralsandsupplytothesebeaches
InDecember2013KirraPointgroynewasextendedby30mwiththeexpectationthatthe beach bar would move seaward as a consequence At present Kirra Point groyne is unlikelytohavehadamajorimpactonthearealextentofKirraReefHoweverongoing monitoringbasedonaerialphotographsmayprovidefurtherinsight
Sessile benthic assemblages on Kirra Reef are highly susceptible to the influence of storms and associated wave action (Kay amp Keough 1981H Walker et al 2008) The shallowreefissurroundedbymobilesandwhichcanshiftnaturallyinresponsetowave action during storms causing burial of large sections of Kirra Reef This effect has reduced the availability of rocky substrate for colonisation and the availability of refuge
Fromanexaminationof theextentofKirraReef fromarealmapsandwaveheightdata thereappears tobea relationshipbetween theareaof rockexposedandstormevents Notably in a series of storm events in May 2009 corresponds with large areas of rock becoming exposed (with the reef approximately 100m2 in 2006 and approximately in 1009m2 2009) Further a stormy conditions between December 2011 and July 2012 correspondstotheareaofexposedrockmorethandoublinginsizeWhiletherewasno changetothetotalareaofexposedrockfollowingstormyconditionsinearly2013there wasaclearchangeinthedistibutionofexposedrockduringthistimeSince2013storm conditions have been calm to moderate and there has been little change in the areal extentanddistrubtionofexposedrockatKirraReef
WaveheighttypicallyincreasesduringstormeventsandgiventheshallowdepthofKirra Reef waves are more likely to shoal and break across the reef during storms This increases thephysicaldisturbanceabrasionandsedimentationofbenthicassemblages onKirraReefStormdisturbancecancauselocalreductionsinthespeciesrichnessand abundanceofcoral(Woodleyetal1981HMasselampDone1993HHughes1994HConnellet al 1997) and can alter fish assemblages indirectly through habitat modifications (Kaufman1983HJonesampSyms1998)ordirectlybyincreasingfishmortality(Lassig1983) The hydrodynamic forces produced by wave action are an important source of disturbance in subtidal habitats inflicting damage through direct physical impact and abrasion(UnderwoodampKennelly1990)DirectimpactsfromphysicaldisturbanceatKirra Reefareevidentduringsurveyeventswhenlargefragmentsofmacroalgaearepresentin thewatercolumnoverthereef
Storm and wave action (and associated sedimentation and abrasion) continue to be importantforcesshapingthedistributionandabundanceofbenthicspeciesatKirraReef Increased magnitude and frequency of physical disturbance resulting from increased exposureorsusceptibility tostormsandassociatedwaveaction (asonKirraReef)can lead to a decrease in the diversity of sessile invertebrate assemblages DisturbanceR drivenreductionsinbiodiversityhavethepotentialtoimpactnegativelyonthehealthand productivity of reef ecosystems (Walker et al 2008) Biodiversity is important to reef health given that many of these species (eg sponges bryozoans and ascidians) contribute a range of vital ecosystem services to reefs including nutrient cycling (Scheffers et al 2004) trophic interactions and food webs (Lesser 2006H Pawlik et al 2007) bioRerosion (Rutzler 2002H LopezRVictoria et al 2006) and stabilizing substrata (DiazampRutzler2001HWulff2001)
Theimpactsof increasedwaveactionandsedimentationonthebenthicassemblagesat Kirra Reef are likely to be greatest during and immediately following storm conditions
TRESBPKirraReefMarineBiotaMonitoring2015 51
frc environmental
Partitioningtheinfluenceofstormandwavedrivendisturbancefromthatoftheoperation oftheTRESBPwouldrequireamuchmorestatisticallypowerfulandtemporilyreplicated experimental design Given there is a large collection of wave and storm data by TRESBP this would involve greater temporal sampling of Kirra Reef including event samplingfollowingseverewaveandstormactivity
The data generated by this Kirra Reef biota monitoring program doesnrsquot support statistically rigorous consideration of seasonality (monitoring has been at its most frequentannual)
InApril2014andMarch2015KirraReefcoveredlessthan50ofthereefrsquosextentprior to theoperationof theTRESBP The lossof reefhabitathasreducedtheavailabilityof hard substratum available for colonisation and consequently the abundance of benthic sessileassemblages
The reduced depth of water resulting from the accumulation of sand exacerbates the effects of storms and wave action It is likley that as a consequnece the biological communities of Kirra Reef will reflect earlyRstage succession more frequently and for longerperiods
While there is sufficient structure available frcenvironmentalexpect that Kirra Reef will continuetoprovideimportanthabitatforadiverseassemblageoffishes
TRESBPKirraReefMarineBiotaMonitoring2015 52
frc environmental
5$ Conclusions$
Although there is still a substantial portion of the reef covered compared to before the extension of the Tweed River entrance breakwaters the current extent of Kirra Reef is broadly inaccordancewithpredictionsmadein theEIS Initial lsquocatchRuprsquobypassingand dredgeplacementofsand(between2001and2008)resulted in theburialofKirraReef Subsequentsanddelivery(since2008onwards)morecloselyreflectsnaturalpatternsof longRshoresandtransportandisthereefhasslowlyreRemerged
Theextentofthereefhasbeenrelativelystablesince2013Thishasallowedforsome succession in the benthic assemblages including a relatively high cover of sponges ascidiansandcrinoidsWiththedeliveryofsandmorecloselymatchingthenaturalrateit isexpected the reef willundergoshortRtermchanges in extentdue toseasonal shifts in sand deliveryH however the diversity of benthic assemblages on Kirra Reef is likely to increaseovertimeThiswouldcreatemorespaceforspeciestorecruitandreducesthe influence of sand abrasion and wave damage It was predicted that the areas of Kirra Reef newly exposed in 2012 would undergo a shift from turfRdominated communities to more diverse communities that could include macroalgae sponges ascidians and potentiallyhardandsoftcoralWiththeexceptionofhardandsoftcoralsthisprediction wasconfirmedbytheresultsoftheApril2014andMarch2015surveys
ThediversityoffishesassociatedwithKirraReefisbroadlysimilartothatrecordedprior tothecommencementofsandbypassingin1995Giventhatfisharemobilethegreatest impacts on fish assemblages are likely to be shortRterm changes due to both the prevailingconditionsandchangestheextentofavailablehabitatthatprovidesshelterand foodforavarietyofdifferentspeciesIfKirraReefincreasesinsizethereislikelytobea greater proportion of cryptic benthic species as these species are more typical of assemblagesinalaterstageofsuccession(eg(WillisampAnderson2003))
Assuming a broadly stable delivery rate of sand and consequent stable extent of Kirra ReeflsquorecoveryrsquoislikleytobesubstantivelycompleteFloralandfaunalcommunitieswill undergo succession between severe storm events but are likley to remain relatively dynamic
Albert S Udy J amp Tibbetts I 2008 Responses of algal communities to gradients in herbivorebiomassandwaterqualityinMarovoLagoonSolomonIslandsCoral0 Reefs2773R82
Anderson MJ 2001 A new method for nonRparametric multivariate analysis of varianceAustral0Ecology2632R46
Anderson MJ 2004 PERMDISP0 a0 FORTRAN0 computer0 program0 for0 permutatinoal0 analysis0 of0 multivariate0 dispersions0 (for0 any0 twoSfactor0 ANOVA0 design)0 using0 permutational0 tests Department of Statistics University of Auckland New Zealand
Cannon LR Goeden GB amp Campbell P 1987 Community patterns revealed by trawling in the interRreef regions of the Great Barrier Reef Memoirs0 of0 the0 Queensland0Museum2545R70
Chapman MG Underwood AJ amp Skilleter GA 1995 Variability at different spatial scalesbetweenasubtidalassemblageexposedtothedischargeofsewageand two control assemblages Journal0 of0 Experimental0 Biology0 and0 Ecology 189 103R122
Cheshire AC Miller DJ amp Stewart R (1999) Effect0 of0 dispersed0 sediment0 plumes0 from0beach0sand0replenishment0dredging0on0recruitment0of0phaeophycean0algae0 to0rocky0reefs0in0Gulf0St0Vincent0South0Australia0The0Impact0of0Sand0Dredging0 on0 Benthic0 Community0 Structure0 at0 the0 Port0 Stanvac0 Dredge0 Site0 20 1S39 UniversityofAdelaideAdelaide
ConnellJHHughesTPampWallaceCC1997A30Ryearstudyofcoralabundance recruitment and disturbance at several scales in space and time Ecological0 Monographs67461R488
Diaz MC amp Rutzler K 2001 Sponges an essential component of Caribbean coral reefsBulletin0of0Marine0Science69535R546
DodgeREampVaisnysJR1977Coralpopulationsandgrowthpatternsresponsesto sedimentation and turbidity associated with dredging Journal0 of0 Marine0 Research35715R730
Done TJ 1982 Patterns in the distribution of coral communities across the central GreatBarrierReefCoral0Reefs195R107
Edwards RA amp Smith DA 2005 Subtidal assemblages associated with a geotextile reef insouthReastQueenslandAustraliaMarine0and0Freshwater0Research56 133R142
FisheriesResearchConsultants1991Survey0of0the0Intertidal0and0Subtidal0Rocky0Reefs0 of0 the0 Sunshine0 Coast report prepared for Queensland National Parks and WildlifeService
HarrisonPHarriotVBanksSampHolmesN1998ThecoralcommunitiesofFlinders Reef andMyora Reef in theMoretonBay MarineParkQueensland Australia In Moreton0 Bay0 and0 Catchment Tibbits I Hall N amp Dennison W (Eds) SchoolofMarineScienceUniversityofQueenslandStLuciapp525R536
Hatcher B Johannes R amp Robertson A 1989 Review of research relevant to the conservationofshallowtropicalmarineecosystemsOceanography0and0Marine0 Biology0an0Annual0Review27337R414
Hoey A amp Bellwood D 2008 CrossRshelf variation in the role of parrotfishes on the GreatBarrierReefCoral0Reefs37R47
TRESBPKirraReefMarineBiotaMonitoring2015 56
frc environmental
Hollingsworth P 1975 Environmental Investigation Report Crown Reserve R R68 Currumbin Creek City of the Gold Coast Land Administration Commission unpublishedreport
Hughes TP 1994 Catastrophes phase shifts and large scale degradation of a CaribbeancoralreefScience2651547R1551
Hughes TP Rodrigues MJ Bellwood DR Ceccarelli D HoeghRGuldberg O McCook L Moltschaniwskvi N Pratchett MS Steneck RS amp Willis B 2007Phaseshiftsherbivoryandtheresilienceofcoralreefstoclimatechange Current0Biology17360R365
Hutchinson A Rempel C Taveras V Loder J amp Salmond J 2013 Reef0 Check0 Australia0 South0 East0 Queensland0 Summary0 Report0 2013 report prepared for ReefCheckFoundationLimited
Hyder Consulting 1997 Tweed0 River0 Entrance0 Sand0 Bypassing0 Project0 Permanent0 Bypassing0 System0 0 Environmental0 Impact0 Statement0 0 Impact0 Assessment0 Study report prepared for New South Wales Department of Land and Water Conservation
Jompa J amp McCook LJ 2002 Effects of competition and herbivory on interactions betweenahardcoralandabrownalgaJournal0of0Experimental0Marine0Biology0 and0Ecology27125R39
KayAMampKeoughMJ1981Occupationofpatchesintheepifaunalcommunitieson pier pilings and the bivalve Pinna bicolor at Edithburgh South Australia Oecologia48123R130
KennellyS1987aInhibitionofkelprecruitmentbyturfingalgaeandconsequencesfor an Australian kelp community Journal0 of0 Experimental0 Marine0 Biology0 and0 Ecology11249R60
Kennelly S 1987b Physical disturbances in an Australian kelp community I temporal effectsMarine0Ecology0Progress0Series40145R153
TRESBPKirraReefMarineBiotaMonitoring2015 57
frc environmental
Kennelly S 1989 Effects of kelp canopies on understory species due to shade and scourMarine0Ecology0Progress0Series50215R224
Lassig BR 1983 The effects of a cyclonic storm on coral reef fish assemblages Environmental0Biology0of0Fishes955R63
Lawson S McMahon J amp Boswood P 2001 Environmental management of the construction and operation of a sand bypassing system at the Tweed River EntranceInThe15thAustralasianCoastalandOceanEngineeringConference the 8th Australasian Port and Harbour Conference 25 R 28 September 2001 QueenslandAustralia
Lesser MP 2006 BenthicRpelagic coupling on coral reefs feeding and growth of Caribbean sponges Journal0 of0 Experimental0 Marine0 Biology0 amp0 Ecology 328 277R288
LopezRVictoriaM ZeaSampWei E2006 Competition for spacebetweenencrusting excavatingCaribbeanspongesandothercoral reeforganismsMarine0Ecology0 Progress0Series312113R121
MalcolmHASmithSDAampJordanA2009Usingpatternsofreeffishassemblages to refine a Habitat Classification System for marine parks in NSW Australia Aquatic0Conservation0Marine0and0Freshwater0Ecosystems2083R92
Massel SR amp Done TJ 1993 Effects of cyclone waves on massive coral assemblages on the Great Barrier Reef meteorology hydrodynamics and demographyCoral0Reefs12153R166
Mumby PJ amp Steneck RS 2008 Coral reef management and conservation in light of rapidly evolving ecological paradigms Trends in Ecology amp Evoution 23 555 -563
Murphy HM amp Jenkins GP 2010 Observational methods used in marine spatial monitoring of fishes and associated habitats a review Marine and Freshwater Research 61 236-252
Noriega R 2007 An Overview of Available Information on Sandy Beach Ecology Coastal Sand Dunes Rocky Reefs and Associated Biota on the Gold Coast Griffith Centre for Coastal Management Research Report No 85 report prepared for Griffith University
Parker P (1995) Structure to Reef Fish Assemblages at Julian Rocks Northern New South Wales Masters Thesis Griffith University
Parker PG 1999 Fish assemblages at Julian Rocks and the adjacent waters of northern New South Wales Australia Australian Zoologist 31 134 - 160
Pawlik JR Steindler L Henkel TP Beer S amp Ilan M 2007 Chemical warfare on coral reefs sponge metabolites differentially affect coral symbiosis in situ Limnology and Oceanography 52 907-911
Reef Check 2010 httpwwwreefcheckaustraliaorgdatahtml accessed December 2015
Robinson KI amp Pollard DA 1982 Marine and estuarine reserves in Australia with particular reference to New South Wales Wetlands 2 17 - 26
Rogers CS 1990 Responses of coral reefs and reef organisms to sedimentation Marine Ecology Progress Series 62 185-202
Russ GR 2003 Grazer biomass correlates more strongly with production than with biomass of algal turfs on a coral reef Coral Reefs 22 63-67
Rutzler K 2002 Impact of crustose clionid sponges on Caribbean reef corals Acta Geologica Hispanica 37 61-72
Scheffers SR Nieuwland G Bak RPM amp van Duyl FC 2004 Removal of bacteria and nutrient dynamics within the coral reef framework of Curacao (Netherlands Antilles) Coral Reefs 23 413-422
TRESBP Kirra Reef Marine Biota Monitoring 2015 59
frc environmental
Schlacher-Hoenlinger M Walker S Johnson J Schlacher T amp Hooper J 2009 Biological Monitoring of the Ex-HMAS Brisbane Artificial Reef Phase II - Habitat Values report prepared for Environmental Protection Agency (EPA)
Smith KA 2003 A simple multivariate technique to improve the design of a sampling strategy for age-based fishery monitoring Fisheries Research 64 79-85
Smith S Edwards R Dalton S amp Harrison M 2005 Biological assessment of fish and benthic communities at Palm Beach Bait Reef Gold Coast Queensland report prepared for University of New England
TRESBP 2014 Autum 2009 storms httpwwwtweedsandbypassnswgovauarticles-and-studiesinteresting-itemsautumn-2009-storm updated 4 May 2014 accessed December 2015
TRESBP 2015a Tweed Sand Bypassing Restoring Coastal Sand Drift Improving Boating Access ndash Techinical information httpwwwtweedsandbypassnswgovau__dataassetspdf_file0004552055kir ra-feb-2015pdf acessed December 2015
TRESBP 2015b Waves httpwwwtweedsandbypassnswgovauenvironmental-monitoringcoastal-conditionswaves updated 30 September 2015 accessed December 2015
Umar MJMLJ amp Price IR 1998 Effects of sediment deposition on the seaweed Sargassum on a fringing coral reef Coral Reefs 17 169-177
Underwood AJ amp Kennelly SJ 1990 Ecology of marine algae on rocky shores and subtidal reefs in temperate Australia Hydrobiologia 192 3-20
Walker S Schlacher T amp Schlacher-Hoenlinger M 2007 Spatial heterogeneity of epibenthos on artificial reefs fouling communities in the early stages of colonization on an East Australian shipwreck Marine Ecology 28 435-445
Walker SJ Degnan BM Hooper JNA amp Skilleter GA 2008 Will increased storm intensity from climate change affect biodiversity in non-scleractinian sessile fauna on coral reefs Global Change Biology 14 2755-2770
Warwick RM amp Clarke KR 1993 Increased variability as a symptom of stress in marine communtities Journal of Experimental Marine Biology and Ecology 172 215-216
Thenumberofsitessurveyedhasvariedover timeasaresultof the fluctuating levelof sandcoveringKirraReef
Prior to May 2003 three sites were assessed along the eastern and northern edge of KirraReef(KirraReefOutersites1to3)andthreesiteswereexaminedalongtheinshore marginof the reef (KirraReef Inner sites1 to 3)(MapA1) ReefRedge (ieKirraOuter) siteswerechosentoprovideearlywarningofimpactsfromoffshoreplacementofdredged sandwhilst inshoresites(ieKirraInner)werechosentoindicatewhetherimpactsfrom inshore beach profile development were affecting the reef platform In May 2003 the threeeasternsitesatKirraReef (ieKRO1KRO2andKRI1)werecompletelycovered with bare mobile sand Consequently only the three western sites at Kirra Reef (ie KRO3KRI2andKRI3)supportedbenthicfloraandfaunaInMarch2004theextentof the remainingwesternoutcropof KirraReef had been further reduced so that all inner reefsiteswerecompletelycoveredwithmobilesandConsequentlyonlyasingleoriginal reefsite(ieKRO3)couldbesurveyed(Figure23)Thereforetoprovideanindicationof the condition of the remaining reef two new sites were established (ie KRN1 and KRN2)(Figure23)andsurveyedinMarch2004Theextentofthewesternreefhadbeen further reduced by February 2005 and a third new site (ie KRN3) was established (Figure23)Consequentlyfoursites(KRO3KRN1KRN2andKRN3)weresurveyedin February2005
InFebruary2010fourKirraReefsites(ieKRO3KRO1KRN1andKRN2)wereclearof thesurroundingsandandsupportedbenthic floraand fauna Inaddition several rocks protruded from the sand in the vicinity of site KRI2H these were assessed to provide a quantitativeindicationofbroadRscaletemporalchangestotheinshorereefcommunities
SOURCEScopy Copyright Commonwealth of Australia (Geoscience Australia) 2001 2004 2006copy The State of Queensland (Department of Natural Resources and Mines) 2015copy Nearmap 2014 2015
DATE2015-09-09
DRAWN BYCF
VERSION02
PROJECTIONCoordinate System GDA 1994 MGA Zone 56Projection Transverse MercatorDatum GDA 1994
plusmn SCALE
0 50 100
Metres
Scale 12500 A3
frc environmental
Appendix$B$ Introduction$to$Data$Analysis$Used$
Multivariate$Analyses$
Multivariate statistical techniques are widely used in ecology to assess the similarities relationshipsbetweenassemblagesWhereasunivariateanalysescanonlycompareone variable at a time (eg an index of community structure such as a diversity index or a singleindicatorspecies)multivariateanalysescancomparesamplesbasedontheextent thatassemblagesshareparticulartaxaandabundances(ClarkeampWarwick2001)
Thefirststepofmultivariateanalysisusuallyinvolvesthecreationofamatrixofsimilarity coefficients computed between every pair of samples The coefficient is usually a measureofhowclose theabundance is foreachspecies (definedso that100= total similarity and 0=complete dissimilarity) The Bray Curtis similarity measure is commonlythemostappropriateforbiologicaldata(ClarkeampWarwick2001)
MultidimensionalScaling
NonRmetricmultiRdimensionalscalingordinations(nMDS)attempttoplacesamplesintwo dimensionalspacesothattherankorderofthedistancesbetweensamplesmatchesthe rankorderofthematchingsimilaritiesfromthesimilaritymatrix(ClarkeampWarwick2001) Thisprovidesavisualrepresentationofthesimilaritiesbetweenassemblageswithineach sampleEachoftheaxesisnotrelatedtoanyparticularvalueHinfactaxescanberotated toprovide thebestvisual representationof thedata Ordinationsareparticularlyuseful tools for analysing and visually presenting differences between assemblages Ordinationsareessentiallymapsofsamples inwhich theplacementofsampleson the mapreflectsthesimilarlyofthecommunitytothecommunitiesinothersamples(Clarkeamp Warwick 2001) Distances between samples on an ordination attempt to match the similarities inassemblagestructurenearbypoints representassemblageswithvery few attributes(speciesorabundanceofspecies)Hpoints faraparthavevery fewattributes in common(ClarkeampWarwick2001)
A stress coefficient is calculated to reflect the extent to which the multiRdimensional scalingordinationandthesimilaritymatrixagree(ClarkeampWarwick2001)(iehowwell the multiRdimensional scaling ordination accurately reflects the relationship between samples)Stressvaluesoflt015aregenerallyacceptable
In Figure A1 each freshwater macroinvertebrate sample is represented on the multiRdimensionalscalingordination By lookingat thedistancesbetweeneachsample
ANOSIMisanalogoustoANOVAinunivariatestatistics(Smith2003)AglobalRstatistic iscalculatedtodeterminewhetherthereisasignificantdifferencebetweenallsamplesIf there are differences then pairwise comparisons are conducted to test for differences betweenpairsofsamples(analogoustopostRhoctestsinANOVA)
The R value lies between R1 and +1 (all similarities within groups are less than any similarity between groups) with a value of zero representing the null hypothesis (no differenceamongasetofsamples)(ClarkeampWarwick2001)ComparisonofpairwiseR values can give an indication of how different assemblages are R values close to 0 indicatelittledifferencevaluesaround05indicatesomeoverlapandvaluescloseto1to indicate many or substantial differences In many instances however researches are primarily interestedinwhethertheRvalueisstatisticallydifferentfromzero(usuallyata confidence level of 005) (Clarke amp Warwick 2001) (ie whether they can reject the null hypothesis)
ANOSIM can provide information on whether the (visual) differences between assemblages in the multiRdimensional scaling ordination are significantH it is an independenttestfromthemultiRdimensionalscalingordinationItisbasedontestingthe
TRESBPKirraReefMarineBiotaMonitoring2015 B2
frc environmental
differences between the rank similarities in the similarity matrix not on the distances betweensamplesinthemultiRdimensionalscalingordination(ClarkeampWarwick2001)
PermutationalMultivariateAnalysisofVariance
PERMANOVAisusedtotestsimultaneousresponsesofoneormorevariablestooneor more factors in an a0 priori0 structured design using random permutation of the data to assess significance (Anderson 2004) PERMANOVA generates a pseudo FRstatistic similar to traditional ANOVA but pRvalues are calculated with permutations which does notassumenormaldatadistribution PERMANOVAcanprovide informationonwhether the (visual) differences between assemblages in a multiRdimensional scaling ordination are significantH however it is an independent test from the multiRdimensional scaling ordination
Thelevelofmultivariatedispersionamongsampleswithineachofthetestgroupscanbe examined using the permutational analysis of multivariate dispersions (PERMDISP) routine(Anderson2004)Intraditionalimpactassessmentachangeinthedispersionof datacanalsoindicateanimpact
SimilarityPercentagendashSpeciesContributions
SIMPER analysis provides information on how dissimilar assemblages from various groups are (eg how similar all of the macroinvertebrate samples taken for a particular habitatwithinastreamreachare)andhowsimilareachgroup(egreach)istoanyother group SIMPER analysis also identifies the species taxa that are contributing to the dissimilarity between two assemblages in rank order (ie it identifies which species is contributingthemosttothedifferences)SIMPERanalysismayhelptoidentifypotential lsquoindicatorrsquospeciesForexampleifaparticularspeciesconsistentlycontributesgreatlyto the differences between impacted and unimpacted assemblages it may be a useful indicator Theabundanceofthis indicatorspeciescanthenbecomparedbetweensites usingunivariatetechniquessuchasANOVA
Data is available on request from tresbpprojectofficecrownlandnswgov
TRESBPKirraReefMarineBiotaMonitoring2015 C1
frc environmental
Appendix(D( Pairwise( PERMANOVA( Results
Data is available on request from tresbpprojectofficecrownlandnswgov
TRESBPKirraReefMarineBiotaMonitoring2015 D1
frc environmental
Appendix(E( Relative(Abundance(of(Fish(found(at(Kirra(( ( and(Palm(Beach(Reefs(in(Each(Survey((Data is available on request from tresbpprojectofficecrownlandnswgovau
TRESBPKirraReefMarineBiotaMonitoring2015 E1
Structure Bookmarks
0 50 100 Metres Scale 12500 A3
0 50 100 200 Metres Scale 15000 A3
Kirra Reef
Kirra Reef
Kirra Reef
Kirra Reef
Kirra Reef
Kirra Reef
Map A1Location of Kirra Reef monitoring sites
Table D8 Pairwise comparison of macroalgae cover between sites in each year
Table D15 Pairwise comparison of turf algae cover between sites in each year
Table D29 Pairwise comparison of ascidian cover between sites in each year
Table D43 Pairwise comparison of soft coral cover between sites in each year
frc environmental
AppendixA HistoryofSitesSurveyedatKirraReef
AppendixB IntroductiontoDataAnalysisUsed
AppendixC Cover and Abundance of Benthic Fauna and Flora on Kirra and Palm BeachReefs
The New South Wales Government Department of Primary Industries LandsR and the QueenslandGovernmentDepartmentofScienceInformationTechnologyandInnovation commissionedfrcenvironmentalonbehalfoftheTweedRiverEntranceSandBypassing Project (TRESBP) to monitor the condition and biodiversity of benthic and fish assemblages at Kirra Reef and to assess potential impacts of the project on those assemblages The purpose of the TRESBP is to maintain a navigable entrance to the Tweed River and to provide a continuing supply of sand to the southern Gold Coast beaches consistent with the natural rate of longshore drift This report discusses the results of ecological monitoring of the benthic fauna flora and fish of Kirra Reef completedinMarch2015
Ongoing monitoring of Kirra Reef is required under the Environmental Management System(EMS)SubgtPlanB14KirraReefManagementPlanpreparedbytheTRESBPin February 2001 The methods used in the March 2015 survey (ie surveys of benthic cover and fish abundance) were those developed for the Stage I survey completed in 1995andhavebeenused in thesubsequentsurveys in19962001200320042005 20102012and2014
ImpactsoftheSandBypassingSystemonKirraReef
The extent of the three major outcrops of Kirra Reef (northern southern and eastern sections)varynaturallydependingonwaterandsandmovementsDuringtheearlyyears of theTRESBP operation largeamounts of sandwere deposited on thesouthern Gold Coast beaches This was done to provide a lsquocatch uprsquo quantity of sand to the badly erodedbeachesreducetheTweedRiverentrancebarandclearasandtrapinthevicinity ofthesandcollectionjettytoincreasetheefficiencyofthebypassingsystemDuringthe initialperiodofincreaseddepositionthevolumeofsanddeliveredexceededtheamount that was transported north through natural mechanisms A large volume of sand was deposited on the southern Gold Coast beaches and wave action and tidal currents redistributed some of this sand over Kirra Reef This resulted in a decline in the areal extentofKirraReefwiththereefalmostcompletelycovered(lt100m2exposed)in2006 The projectrsquos Environmental Impact Statement (EIS) predicted that impacts associated withthegradualaccumulationofsandaroundthebaseofKirraReefwereunavoidable
Sincethedeliveryoflargequantitiesofsandwascompletedin2008thevolumeofsand delivered by the project has declined and now closely matches the natural rate of northwardsandtransportHowevertherewasasubstantiallagbetweenthereductionin sanddeliveryandtransportofthesandfurthernorthduetoaperiodofcalmerthanusual
TRESBPKirraReefMarineBiotaMonitoring2015 i
frc environmental
conditionswith reduced storm activity from the north`east Assuchdispersion of sand from Kirra Beach and reduction in the sand levels around the reef was slower than predictedbetween2005and2009
BetweenFebruary2010andJuly2012 therewasa large(50) increase in theareaof exposedrockinthenorthernsectionofKirraReefThiswaslikelytoberelatedtosevere storms in late 2009 moving sand further north andor to the manual removal of 140000m3ofsandfromKirraBeachin2009
InDecember2013KirraPointgroynewasextendedby30mby theCityofGoldCoast with the expectation that the beach bar would move seaward as a consequence At present theKirraPointgroyneestension in2013isunlikelytohavehadamajor impact onthearealextentofKirraReef
Thereefhasbeenrelativelystablesince2013withminor(lt5)changesintheamount of reefexposed Nonetheless thearealextentofKirraReef remains less than50of the extent recorded in 1962 and in 1995 before the TRESBP began In 2015 the reef comprisesthenorthernsectionandapartof theeasternsectionof thereefasrecorded pre`TRESBP(allthesouthernsectionofthereefremainsburied)
ChangestotheEcologicalConditionofKirraReef
The Projectrsquos EIS did not consider the ecological consequences of the reduced areal extentofreefalhabitatandincreasedwaveenergy(aconsequenceofdecreaseddepth) thatwouldoccurasaresultoftheaccretionofsandaroundKirraReefHoweverasthe TRESBPbettermimicednaturalpatternsofsandtransportsince2009theEISpredicted that the reefrsquos benthic floral and faunal assemblages would return to the conditions exhibitedpriortotheextensionoftheTweedRivertrainingwallsinthemid1960s
Sincemonitoringcommenced thegreatestchangeto the floralandfaunalassemblages of Kirra Reef has been due to the loss of reefal habitat In addition to a reduction in overall abundance of taxa the redistribution of sand mediated through complex interactions between physical disturbance (associated with wave action suspended sedimentssedimentdepositionandburial)foodavailabilityandcompetitionhasresulted inavarietyofsmall`scalechangestothedistributionandabundanceofthereefrsquosbenthic assemblages
InApril2014andMarch2015thediversityofassemblageshadincreasedrelativetoJuly 2012as had thecoverof macroalgae (though it remained well below the peakof 60 coverrecordedinJanuary2001)Thisismostlikelyduetonaturalsuccessionwithmore mature communities being established between 2012 and 2015 when the extent of exposedrockwasrelativelystableNeverthelessthebenthicassemblageonKirraReef
TRESBPKirraReefMarineBiotaMonitoring2015 ii
frc environmental
exhibited signs of ongoing stress from physical disturbance such as storm and wave disturbancephysicalabrasionandburialbysandRincludinglowpercentagecoverofhard coralandsoftcoralThisisconsideredessentiallynaturalandcharacteristicofshallow inshorereefsChronicphysicaldisturbancekeepsthebenthicassemblagesofKirraReef inastateofearlysuccession Thediversity(and insomecasesabundnace)ofareefrsquos benthic assemblage is predicted to increase where the extent of reef remains stable or increases and where the frequency and severity of storm conditions are less than the long`term average This was evident in 2014 and 2015 with a relative high cover of spongesandascidians
InMarch2015amorediverseassemblageoffishwasfoundonKirraReefthanonPalm Beach Reef As fish are mobile they can move more easily to areas that are less disturbed or that exhibit more suitable conditions While the composition of the assemblagedifferedfromprevioussurveyeventsthedifferencesweremorelikelydueto the effects of seasonal changes in water temperature and the effects of prevailing conditions at the time of the survey rather than any substantial effect of the bypassing project
Despite some impacts from the TRESBP (with sand covering much of the reef area) overall the composition of the flora and fauna assemblages on Kirra Reef were more similar to that found at nearby Palm Beach Reef than in previous years Kirra Reef therefore continues to provide habitat to a range of flora and fauna and provides important marine ecological functions and services in the region It is possible that as sandlevelshavestabilisedoverthepastthreeyearsassemblagesareslowlybeginning tobecomemoresimilartothoserecordedpriortoimplementationoftheTRESBPandto thoseatnearbyPalmBeachReef
ImpactsofStormsampSeasonalityonKirraReef
The large quantities of sand that were initially delivered by the project caused a substantialshallowingofthenear`shoreareaaroundthereefThisincreaseinbedlevels wasresponsibleforcoveringasubstatialamountofthereefandsubsequentlyincreasing the incidenceof wavedisturbance and sand scouringaround the reef which negatively impactedthebenthicfaunaandflora
As the delivery of sand through the bypassing system now more closely matches the naturalrateofnorthernlongshoresandtransportshort`termandseasonalchangesinthe areal extent of the reef are more likely the result of natural processes than a discrete impactof thesandbypassingactivity Short`term fluctuations that result fromstormsor changesinthecoastalsandsupplywouldhavebeenacomponentofthenaturalrangeof ecologicalconditionsobservedpriortotheextensionofthetrainingwalls
TRESBPKirraReefMarineBiotaMonitoring2015 iii
frc environmental
Thereappearstobearelationshipbetweentheareaandordistributionofrockexposed andstormeventsatKirraReefNotablyaseriesofstormsin2009andstormyconditions between late 2011 and 2012 correspond to large areas of rock becoming exposed Furtherstormsinearly2013correspondstoaclearchangeinthedistributionofrockat Kirra Reef Since 2013 storm conditions have been calm to moderate and there has beenlittlechangeinthearealextentanddistrubtionofexposedrockatKirraReef
Thecloseproximityofthereeftothecoastcontinuestosubjectthebenthicassemblages tosandabrasionwavedisturbanceandsandsmotheringGreaterbalancebetween the deliveryofsandthroughtheprojectandthenaturalmovementofsandonandoffshoreis likely to result inbetterecologicaloutcomes for thebenthicassemblages foundonKirra Reefandgreaterconsistencyintheextentofreefhabitatthatisuncovered
frcenvironmental expect that the area of reef uncovered will continue to change due to seasonal shifts in sand delivery and stormsR however the diversity of flora and fauna assemblagesonKirraReefshouldincreasegraduallyovertimeespeciallyiftheextentof the rocky reef that remains uncovered is consistent andor increases over time to become moresimilarwith that foundprior to the extension of the trainingwalls In this scenario itwasexpectedthat thatnewlyexposedareasofKirraReef in2012thatwere dominated by turf algae would be colonised by other organisms including macroalgae spongesascidiansandpotentiallyhardandsoftcoralovertimeTheresultsfrom2014 and2015indicatethatthisprocessisslowlyoccurringonKirraReef
The change in areal extent between 2014 and 2015 was approximately 85 in the northern section of Kirra Reef A small area of the eastern section of Kirra Reef also became exposed between 2014 and 2015 Ongoing monitoring will provide insight into therateoflsquorecoveryrsquoofcommunitiesHowevergiventhesmallchangeinarealextentof KirraReefandrealtivelysimilarfloraandfaunacommunitiessurveyedin2014and2015 monitoringcouldbereducedtobiannuallyIfmonitoringisreducedasubstantialchange (eg 15) in the extent of the exposed reef should be used to triggered annual monitoring
TRESBPKirraReefMarineBiotaMonitoring2015 iv
frc environmental
1 Introduction
frcenvironmentalwascommissionedbytheNewSouthWalesGovernmentDepartment ofPrimary IndustriesLandsR and theQueenslandGovernmentDepartmentofScience Information Technology and Innovation on behalf of the Tweed River Entrance Sand BypassingProject(TRESBP)tomonitortheconditionabundanceandbiodiversityoffloral and faunal communities at Kirra Reef This report presents results of the survey of benthicfloramacro`invertebratefaunaandfishatsitesonKirraReefandatcomparative sitesonPalmBeachReefinMarch2015
The current condition of Kirra Reef was compared with the current condition of nearby Palm Beach Reef and with changes to the Kirra Reef community over time ie with previousassessmentsofKirraReefundertaken in199519962001200320042005 20102012and2014(frcenvironmental2014)
The TRESBP was established in 1995 as a joint initiative of the NSW and Queensland GovernmentstoimproveandmaintainnavigationconditionsattheTweedRiverentrance andtoprovideacontinuingsupplyofsandtothesouthernGoldCoastbeachesconsistent withthenaturalrateoflongshoredriftTheprojectwascarriedoutintwostages
sdot Stage2Implementation of a sand bypassing system to maintain the improvementsachievedduringStage1(fromMay2001onwards)
DuringStage1approximatelythreemillioncubicmetres(m3)ofcleanmarinesand(with lessthan3fines)weredredgedfromtheTweedRiverentranceMostofthedredging materialwasdeliveredout to`10mmeanwaterdepthfromPointDangertoNorthKirra withapproximately600000m3ofcleanmarinesandbeingplacedontheupperbeaches fromRainbowBaytoNorthKirraFromApril2000toFebruary2001additionaldredging activities were undertaken to maintain a clear navigation channel at the Tweed River entrance Prior to the establishment of the permanent sand bypassing system a further 480000m3of clean marine sandwas placed innear`shore areas from PointDanger to CoolangattaBeach
Stage2commissioning trialscommenced in March 2001 and full scale operationof the sand bypassing system commenced in May 2001 Since this time approximately 70millionm3ofpumpedsandand14millionm3ofdredgedsand(derivedfromdredging
TRESBPKirraReefMarineBiotaMonitoring2015 1
frc environmental
oftheTweedRivermouth)havebeendepositedalongthesouthernGoldCoastbeaches Mostofthesanddeliveredthroughpumpinganddredginghasbeenplacedintheprimary placementareasoutheastofSnapperRocks Sand isalsodischarged fromoutletsat Duranbah Beach and occasionally at Snapper Rocks West There is an outlet at Kirra BeachRhowever thishasnotbeenusedsinceDecember2003 Aplacementexclusion zone has been established around Kirra Reef extending a minimum of 100m from the reefedge(1995extent)topreventdirectplacementofsandincloseproximitytothereef (Lawsonetal2001)
sdot provide much needed sand nourishment to the severely eroded southern Gold Coastbeaches
sdot reducetheTweedEntranceBarand
sdot clear a sand trap in the vicinity of the jetty to improve the efficiently of the sand bypasssystem
These project objectives were achieved and the quantity of sand delivered since 2008 has been more consistent with the natural quantity of sand movement along the coast (average natural net longshore sand drfit is estimated to be 500000m3 per year in a northward direction) In 2014 a total of 450232m3 was pumped through the sand bypassing system to the primary placement area at Danger Point From January to February2015anadditional105119m3ofsandwaspumpedthroughthesystem
In 2009 the Queensland government removed approximately 140000m3 of sand from KirraBeachintertidalzonetothelowprofilebackdunesIn2013theCityofGoldCoast extendedKirragroyneby30m
12 HistoricalContextforKirraReefMonitoring
Kirra Reef is the collective name given to the complex of rocky outcrops located a few hundredmetresoffshoreofKirraBeachatbetween`3and`10mandwithintheinfluence
TRESBPKirraReefMarineBiotaMonitoring2015 2
frc environmental
of wave action It is subject to naturally shifting sands that intermittently cover and uncover the reefrsquos rocky outcrops (TRESBP 2015a) The exposed extent of Kirra Reef hasvariedoverthepast50yearsduetonaturalstormeventsandchangestothecoastal environmentsuchastheextensionoftheTweedRivertrainingwallsinthemid`1960sand commencementoftheTRESBP(TRESBP2015a)Therearethreemajoroutcropsofthe reefthenorthernsouthernandeasternsectionswhichhavebeenvariouslyexposedin thepast(refertoTable11andFigure11)
MonitoringofKirraReef is requiredunderaproject`specificEnvironmentalManagement System (EMS) prepared by the TRESBP in February 20011 Under EMS SubgtPlan B14 KirraReefManagementPlaniftheareaofexposedreefonaerialphotographsissmaller thantherangeofareasshownonaerialphotographsfrom1962to1965thenmonitoring ofthemarinebiotaofKirraReefisrequired
frcenvironmentalcompletedabaselineassessmentofKirraReefinAprilandJune1995 (FisheriesResearchConsultants1995a)(FisheriesResearchConsultants1995b)andhas undertaken nine subsequent ecological monitoring surveys of the reef on behalf of TRESBP in February 1996 January 2001 May 2003 March 2004 February 2005 February 2010 July 2012 April 2014 (Fisheries Research Consultants 1996R frc environmental2001R2003R2004R2005R2010)andthecurrentsurveyinMarch2015
13 TemporalChangesintheAreaofExposedReef
AreductionintheexposedextentofKirraReefwaspredictedintheprojectrsquosEIS(Hyder Consulting 1997) It was also expected that Kirra Reef would return to pre`1960rsquos conditions before the extension of the Tweed River breakwaters that interrupted the northerlymovementofsandwereconstructed(Lawsonetal2001)
Prior to 1960 Kirra Reef was partially covered by sand which varied naturally with the naturalsupplyofsandandwaveenergyDuringthe1960rsquosfollowingtheextensionofthe Tweed River training walls between 1962 and 1965 Kirra Reef became increasingly exposed due to the depleted sand supply (note the increase in area of Kirra Reef from 1962 to1972 inTable11) Following theKirraPointgroynecontruction in1972 there was further depletion of sand supply and Kirra Reef was perennially exposed (note the increaseinareaofKirraReeffrom1972to1995inTable11RrefertoFigure11forthe extentofreefin1995)Kirrareefgroynewasshortened(from175mto145m)in1996
1 The ongoing reef monitoring also incorporates additional monitoring activities implemented by the
TRESBPinAugust2004
TRESBPKirraReefMarineBiotaMonitoring2015 3
frc environmental
AccumulationofsandonKirraReefwasobservedasaresultofindirectsandnourishment bytheTRESBP(notethedecreaseinareaofKirraReefafter1995inTable11)Aerial photographs taken in 2003 and 2004 showed the reef to be of significantly less extent than the range of extent observed in 1962 and 1965 (Table 11) Loss of reef area continuedforsomeyearsandbyearly2006theareaofexposedreefhadbeenreduced to lt100m2 There was a substantial lag between the reduction in sand delivery and transportof thesand furthernorthdue toaperiodofcalmer thanusualconditionswith reducedstormactivityfromthenorth`eastAssuchdispersionofsandfromKirraBeach andreductioninthesandlevelsaroundthereefbetween2005and2009wasslowerthan predicted (refer to Figure 11 for the extent of reef in 2009) As a consequence of the extensiveburialofthereefsimplevisualinspectionsofthereefwereundertakeninplace offullecologicalsurveysbetween2006and20102
In2009eightyearsaftertheinitiationofsandpumpingbytheTRESBPbeganaseriesof storms shifted approximately 200000 m3 of sand from Kirra Beach to the north This storm was the worst protracted storm for east facing beahes in at least 14 years with significant wave heights remaining for four days (TRESBP 2014) This along with the removalofapproximately140000m3ofsandfromtheKirraBeachintertidalzoneagain uncoveredpartsofKirraReef (TRESBP2015a) Since2008sanddeliveryvolumesof the TRESBP have been more consistent with the natural quantity of sand movement alongthecoastEcologicalsurveysrecommencedin2010astheexposedareasofKirra Reefincreasedinextent
Between November 2011 and August 2012 there was a large increase in the northern section of Kirra Reef when the area of exposed rock more than doubled (Table 11R Figure11) This corresponds to a lsquostormy yearrsquowith one severe storm and twomajor storms recorded (TRESBP 2015b) Further stormy conditions were recorded in early 2013withoneextremestorm(approximately110yearevent)inJanuaryandonemajor storminFebruary(TRESBP2015)Therewaslittlechangeinthetotalareaofexposed reefduring this time (note thesimilarareaofAugust2012andMay2013 inTable11) Howevertherewascleardistributionchangesintheareasofexposedrock(Figure11) Thereefareahasremainedrelativelystablesince2013withminorchangesintheareaof rock exposed (Table 11R Figure 11) Wave height data since 2013 indicates calm to moderate conditions with only minor storms recorded except in May 2015 when there wasaseverestorm(TRESBP2015)Inlate2013KirraPointgroynewasreinstatedby 30mtoitsorginalconstructedlengthGiventheminorchangesintheexposedrocksince
2 Underwater visual inspections were completed by Gilbert Diving and Gold Coast City Council from
In2014KirraReefcoveredanareaof2920m2Rpredominantlyinthenorthernsectionof thereefInMarch2015thisnorthernsectioncoveredanareaofapproximately2672m2 (Figure11andFigure12)an85decreaseintheexposedextentbetween2014and 2015 In March 2015 the rocky outcrops were typically between 1 and 2m above the cleanmobilesandwithseveraloutcropsextendingtomorethan2mabovethesandA small section (116m2) of the eastern reef wasalsoexposed inMarch 2015 (Figure 11 andFigure12)Howeverthereefarearemainslessthan50oftheextentrecordedin 1962and1995beforetheTRESBPbegan(Table11Rreefareabetween1962and1965 was between 7000 and 13300 Department of Land and Water Conservation photogrammetricanalysis)
TRESBPKirraReefMarineBiotaMonitoring2015 5
frc environmental
Table11 ApproximateexposedextentofKirraReef
Area(m2) Date SourceofImage
NorthernSection SouthernSection EasternSection Total
The southeast Queensland (SEQ) region comprises five subregions the Gold Coast Inner Moreton Bay Outer Moreton Bay Sunshine Coast and Fraser Coast Coral communities within SEQ are diverse with an extensive range of coral growth forms (Harrison et al 1998) The greatest diversity of coral species are typically found at offshoresites likeFlindersReefswhere119differentcoralspecieshavebeen recorded (Harrisonetal1998)
Subtidal rocky reefs of the Gold Coast region comprise remnants of highly eroded volcanic substratum isolated by wide variable expanses of soft sediment (Edwards amp Smith 2005) They support community assemblages that are indicative of a transition between the tropical waters of the Great Barrier Reef and the temperate waters characteristicofthemidNewSouthWalescoast(Done1982XCannonetal1987)
GoldCoastreefcommunitiesarebroadlysimilartoareasofcomparabletopographytothe north(InnerGneeringsoffshorefromMooloolabaandoffshoreofMoretonBay)andtothe south (Julian Rocks offshore of Byron Bay) that are dominated by macroalgae and sessile invertbrates(FisheriesResearchConsultants1991XHarriottetal1999XEdwards amp Smith 2005X Baronio amp Butcher 2008X Fellegara 2008X SchlacherHoenlinger et al 2009)ManyoftheGoldCoastsreefslocatedclosetoshoreareoftenaffectedbyhuman activities (Noriega 2007)and typicallyhave lesscoralcover Ina2013surveyofSEQ reefsGoldCoastreefshadthelowesthardcoralcoverat9(Hutchinsonetal2013)
Fish of the Gold Coast region are similar in community composition to that recorded offshore of Moreton Bay at Julian Rocks and the Solitary Islands offshore of Coffs Harbourandtoa lesserextentat theexHMASBrisbanenearMooloolaba(Robinsonamp Pollard 1982X Parker 1995X Parker 1999X Edwards amp Smith 2005X Malcolm et al 2009X SchlacherHoenlingeretal2009) The smaller inshore reefsof theGoldCoast region suchasKirraReeftypicallysupportalowerabundanceanddiversityoffishes(Edwards ampSmith2005Xfrcenvironmental2005)
Kirra$Reef$
ThebenthicassemblagesofKirraReefarecharacterisedbyahighcoverofmacroalgae andturfalgaeandamoderatecoverofsessilebenthicinvertebratesincludingafewhard corals(EdwardsampSmith2005Xfrcenvironmental2005)Turfalagecoversthemajorityof the reef substrate Crinoids (feather stars) ascidians (sea squirts) and sponges are typically themostabundantbenthic faunawhilstanemonessoftcoralsandurchinsare present in low numbers (frc environmental 2014) The composition of benthic assemblagesatKirraReef isbroadlysimilar to thatdescribed fromadjacent rockyreefs
Exposuretowaveactionsandscouringandsmotheringareimportantfactorsinfluencing the distribution and abundance of sessile species on rocky reefs (Kay amp Keough 1981X McGuinness1987)ChangeintheheightofsandaroundthebaseofKirraReefappears to be a major factor influencing the abundance (cover) of benthic flora and fauna periodically resulting in a bare stratum on rocks within 08 to 1m of the seafloor Outcropsontheeasternsectionof thereefcomplexwherewaveactionand likelysand abrasion are greatest have historically supported a lower abundance of benthic fauna than outcrops on the northern section (Fisheries Research Consultants 1995a)X (Fisheries Research Consultants 1995b)X (Fisheries Research Consultants 1996)X (frc environmental 2003)X (frc environmental 2004)X (frc environmental 2005)X (frc environmental2010)
Strong wave action results in sustained abrasion of the dominant brown macroalgae (Sargassum(flavicans(andEcklonia( radiata)causing the fronds tobreak Thecontinual resuspensionofalgal fragments(commonlyreferredtoas lsquocornflakesrsquo)candramatically reducewaterclarityandvisibility Algal fragmentswere largelyabsent inJuly2012and April2014surveyslikelyduetolongperiodsofrelativelybenignseaconditionsInMarch 2015amoderateamountofalgalfragmentswasobservedlikelyduetostormactivityin theweeksproceedingthesurvey(egmoderateseas11to14Februaryandminorstorm over1922February)
RecentsurveysatPalmBeachReefcompletedbyReefCheckrecordedadeclineinhard coralcover from2008to2013(Hutchinsonetal2013) Sessile invertebrates including spongescoralsandascidianstypicallydominatethebenthicassemblageofPalmBeach Reef(EdwardsampSmith2005X frcenvironmental2005XReefCheck2010) Thecoverof sessileinvertebrateshashistoricallybeensimilartothatrecordedfromtheoutersections of Kirra Reef However the cover of macroalgae has consistently been loweron Palm BeachReefthanonKirraReefTheproximityofPalmBeachReeftotwocreekmouths andtheabsenceofstrongcurrentsintheareatypicallyresultsinahighlevelofturbidity Elevated turbidity together with greater water depth and a high abundance of grazing
TRESBPKirraReefMarineBiotaMonitoring2015 10
frc environmental
speciessuchasurchinsislikelytocontributetoarelativelylowcoverofmacroalgaeand abundant suspension feeding organisms such as ascidians sponges hydrozoans and crinoidsatPalmBeachReef(Smithetal2005)
PalmBeachhasa lowerabundanceanddiversityof benthicdemersaland pelagic fish comparedtoKirraReef(Smithetal2005)ThegreaterdensityoffishatKirraReefmay beaconsequenceof the lossof reef forcingmore fish intoasmallerarea (Smithetal 2005)PalmbeachrecordedaslightlylowerdiversityoffishthanKirraReefin2012and 2014surveys(frcenvironmental2012Xfrcenvironmental2014)
TRESBPKirraReefMarineBiotaMonitoring2015 11
frc environmental
2$ Methods$
The methods used in the March 2015 survey were developed for the Stage I survey completed in April and June 1995 and used for subsequent surveys February 1996 January 2001 May 2003 March 2004 February 2005 February 2010 July 2012 and April2014 Datawere collected from KirraReef (2816251535309) andPalmBeach Reef(2810751534774)locatedapproximately9kmnorth(Figure21)
Themainobjectiveof the monitoring was to investigateanychange in the marinebiota and habitat of Kirra Reef compared to Palm Beach Reef (comparative reef) in order to assesstheeffectofthesandbypassproject(andsubsequentincreasesinsandload)on theecologyofKirraReef
0 2 41
Kilometres
Service Layer Credits Sources Esri HERE DeLorme Intermap increment P Corp GEBCO USGS FAO NPS NRCAN GeoBase IGN Kadaster NL Ordnance
0 2 41
Kilometres
Service Layer Credits Sources Esri HERE DeLorme Intermap increment P Corp GEBCO USGS FAO NPS NRCAN GeoBase IGN Kadaster NL Ordnance
Threesites(KRN1KRN2KRO3)atKirraReef(waterdepth5to8m)weresurveyedin March 2015 (Map 1) The remainder of the sites previously surveyed were covered by sand(refertoappendixAforahistoryofsitespreviouslysurveyed)Threecomparative sites (PB1 PB2 and PB3) were also surveyed at Palm Beach Reef (water depth 12 to 17m)(Map2)
TRESBPKirraReefMarineBiotaMonitoring2015 12
orth NetreStkicrraG
Marine Parade
t eertS ickr
M rarin ae Pa Grade
Musgrave St
t
re ee e Powel t r lt CrescenS t t es eel ri tM S
t ee ge drt u tleS d Rro MuL sgrave Street
LEGEND 0 1 Km Tweed River E ntrance Sand Bypassing Project Survey Site Road Network
copy Copyright Commonwealth of Australia (Geoscience Australia) 2001 2004 2006copy The State of Queensland (Department of Natural Resources and Mines) 2015copy Nearmap 2014
DATE2015-03-24
DRAWN BYCF
VERSION01
PROJECTIONCoordinate System GDA 1994 MGA Zone 56Projection Transverse MercatorDatum GDA 1994
plusmn SCALE
0 50 100 200
Metres
Scale 15000 A3
Gold Coast Highway
i
PalmBeach
Tugun
Coolangatta
0 1 Km
frc environmental
22$ Benthic$Flora$and$Macroinvertebrates$
At each site benthic assemblages were surveyed in fifteen 025m2 quadrats with the percentcoverofbenthicmacroalgaeturfalgaespongesascidianshardcoralsandsoft coralsassessedvisually(Figure22)Quadratswereplacedhaphazardlywhichincluded horizontal and sloping surfaces The minimum distance between quadrats was approximately2m Thenumberof largeascidians (Pyurastolonifera)crinoids (feather stars)barnaclesurchinstubewormspolychaeteshydroidszoanthidsandcowriesand the dominant species of macroalgae were also recorded and quantitative notes were madeontheapparenthealthofeachtaxonomicgroup
ThespeciesrichnessandrelativeabundanceoffishatKirraReefandPalmBeachReef were assessed using a combination of underwater visual census (UVC) and video surveys The combination of these techniques represents the most costeffective and efficientmeansofobtainingdataonthestructureoffishassemblagesindifferenthabitats (Murphy amp Jenkins 2010) A baited remote underwater video (BRUVX baited with pilchards) and footage captured by a diver swimming hapazard trasects over the reef wererecorded
Video footage from each BRUV (approximately 20minutes) and video transects (approximately 35 minutes) was reviewed by an ecologist experienced in marine fish identification
24$ Data$Analysis$
Permutational multivariate analysis of variance (PERMANOVA) was used to determine differences in the composition (cover of benthic fauna and taxonomic group) of benthic assemblagesbetweenKirraReefandPalmBeachReefover time PERMANOVAuses permutational methods (PsuedoAF) to derive statistical significance which require fewer assumptionstobemetthananalogousmethodssuchasmultivariateanalysisofvariance (MANOVA) (Anderson 2001X Anderson et al 2008) This analysis enables an examinationofchangesinthecommunityasawhole
A three factor PERMANOVA was used to examine differences in the composition of benthic assemblages with survey (fixed factor) locations (Palm Beach Reef and Kirra Reeffixedfactor)andsites(nestedinlocationsasarandomfactor)asthefactorsData weresquareroot transformedtodownweightdominatingspeciesabundanceXconverted toaBrayCurtisdistancematrixXandtestedforsignificanceusingasmanypermutations as allowed (9800 to 9937 unique permuations achieved for all factors and factor combinationsXexceptlocationwhere10uniquepermutationswereachieved))Posthoc pairwisetestwasusedtodeterminethemagnitudeofdifference
Nonmetricmultidimensionalscaling (nMDS)ordinationswereused tovisually represent the variation in the composition of assemblages between reefs separately for each survey nMDS ordinations were also used to visually represent the variation in the compositionofassemblagessurveysatKirraReefforallsurveysXbaselinesurveyinApril 1995andMarch2015XandApril2014andMarch2015
Separate univariate PERMANOVAs were used to compare differences in the cover of macroalgae turf algae and the abundance of crinoids and ascidians Data were
TRESBPKirraReefMarineBiotaMonitoring2015 16
frc environmental
converted to a eucildean distances matrixX and tested for significance using as many permutations as allowed (998 to 999 unique permuations achieved for all factors and factor combinationsX except location where 10 unique permutations were achieved) Factors were survey (fixed factor) locations (Palm Beach Reef and Kirra Reef fixed factor)andsites (nested in locationsanda random factor) Posthoc pairwise testwas used to determine the magnitude of difference Monte Carlo procedures were used to calculateempiricalPvaluesforthesurveyxlocationtest
Further information on the use and interpretation of PERMANOVA and other analyses usedinthisreportisprovidedinAppendixB
TRESBPKirraReefMarineBiotaMonitoring2015 17
frc environmental
3$ Results$
31$ Cover$of$Benthic$Assemblages$
The composition of benthic fauna and flora ( cover and type combined Appendix C) variedbetweenmostsitesatbothKirraReefandPalmBeachReefandbetweennearly allsurveysateachsite(notethesignificantinteractionofsite(location)xsurveyinTable 31X Appendix D) Nevertheless there appeared to be substantial differences in the compositionofthebenthicassemblagesbetweenthetworeefsineachsurveyfrom1995 to2015(Figure31toFigure33)
In2015 therewassomeoverlap in thecompositionofassemblagesonKirraandPalm Beach Reefs (Figure 33) However there was also some clear patterns of difference including
Benthic assemblages at Kirra Reef appeared to show some overlap between surveys (Figure34H) HowevernearlyallsurveysweredifferentateachsiteatbothKirraReef andPalmBeachReef(AppendixD)BenthicassemblagesinMarch2015andApril2014 wereverysimilarcomparedtobenthicassemblages inthebaselinesurvey inApril1995 andMarch2015(notethegreateroverlapinFigure35comparedtoFigure36)
In March 2015 as in previous surveys the macroalgae Sargassum sp dominated the benthic assemblages at all sites at Kirra Reef (Figure 37) Other species present included
sdot Dictyopteris0arostichoides0
sdot Dilophus0intermedius00
sdot Zonariasp
sdot Laurencia0brongniartic0
sdot Amphiroa0anceps0
sdot Caulerpa0lentilliferaand
sdot Halimeda0discoideaand
sdot Macrocystissp
Juvenile kelp (from the genus Macrocystis) was also emerging on some areas of Kirra Reef
ThecoverofmacroalagevariedbetweensitesandsurveysatbothKirraReefandPalm Beach Reef with the magnitude of difference varying over time (note the significant interaction between site (location) x survey in Table 32) Macroalgae cover varied between surveys with 2001 being the most different to the other years (Appendix D) ThereweredifferencesbetweensitesatKirraReefinJune1995February1996January 2001 May 2003 February 2005 and February 2010 and between sites at Palm Beach ReefinJanuary2001andFebruary2010Inrecentsurveys(2012to2015)thecoverof macroalgaeatsitesatbothKirraReefandPalmBeachReefwassimilar (AppendixD) indicatingarelativelyconsistentdistributionacrossbothreefs
ThemeancoverofmacroalgaeatKirraReefhasdeclinedsinceitspeakin2001withthe greatest magnitude of decline recorded between January 2001 and May 2003 (Figure 38)InsurveysbetweenJune1995andMay2003Sargassumspformeddensecarpets overtherockysubstratecoveringupto58oftheavailablesurfaceareaofthereefIn February 2010 macroalgal cover was 12 Macroalgal cover has increased to 26 in March2015ThisissimilartothecoverrecordedinApril1995(23cover)(Figure38)
In2015nomacroalgaewasrecordedwithinthequadratsatPalmBeachReefThecover of macroalgae on Palm Beach Reef has been consistently lower than Kirra Reef since
TRESBPKirraReefMarineBiotaMonitoring2015 26
frc environmental
ecologicalmonitoringbegan typically lessthan5of theavailablesurfacearea(Figure 38)
The mean cover of turf algae varied between sites and surveys at both Kirra Reef and PalmBeachReef(notethesignificantinteractionbetweensite(location)xsurveyinTable 33)SpecificallythereweresignificantdifferencesbetweensitesatbothKirraReefand PalmBeachReefinJune1995January2001February2010July2012andApril2014 (aswellasbetweensitesinFebruary1996atKirraReef)Thecoverofturfalgaevaried betweenmostsurveysatallsitesateachreef(AppendixD)BothKirraandPalmBeach reefs showed major increases in the percent cover of turf algae from 2010 to 2012 followedbyadecreaseincoverbetween2012and2014(Figure310)Thecoverofturf algae is typically lower at Kirra Reef than at Palm Beach Reef (July 2012 being an exception) and was again slightly lower at Kirra Reef in March 2015 (Table 310) In March2015turfalgaewasmoreprevalentatKirraReefthanduringthebaselinesurvey ofApril1995
ThemeancoverofspongesatsomesitesatbothKirraReefandPalmBeachReefhas varied significantly during some surveys (note the significant interaction between site (location)xsurvey inTable34HFigure311) However thecoverofspongestendedto bemore temporallyvariable atKirraReef than at Palm Beach Reef (Figure312) The cover of sponges at Kirra Reef varied between sites in February 1996 January 2001 March2004July2012andApril2014 However thecoverofspongesatPalmBeach Reefonlyvariedbetweensites inJanuary2001andFebruary2010 (AppendixD) The cover of sponges varied between survey at each site with 1995 1996 and 2001 most differenttootheryears(AppendixD)
ThemeancoverofspongesatKirraReefdeclinedbetweenMarch2004(20cover)and February 2010 (less than 1 cover) Since 2010 the cover of sponges has increased slightly with sponges covering 8 of the reef in March 2015 (Figure 312) In March 2015thecoverofspongeswashigherthanrecordedduringthebaselinesurveyinApril 1995(3cover)(Figure312)
Figure312 Mean cover of sponges (plusmnSE) at Kirra Reef and Palm Beach Reef on all
surveys
Table34 Univariate PERMANOVA results for differences in the cover of sponges betweensurveysandlocations
Factor$ df$ MS$effect$ PseudoF$ p$(perm)$
survey 10 18576 276 0018
location 1 39671 589 0210
site(location) 4 67354 477 0001
locationxsurvey 10 1490 221 0032
site(location)xsurvey 40 67331 477 0001
error 924 14108
Shadingdenotessignificanceatplt005
TRESBPKirraReefMarineBiotaMonitoring2015 32
frc environmental
Ascidians$
ThemeanabundanceofallascidiansotherthanPyura0stoloniferahasvariedsignifcantly between sites at Kirra Reef and Palm Beach Reef and between surveys at each site (Figure314andnotethesignificantinteractionbetweensite(location)xsurveyinTable 35) The abundance of ascidians was different between sites at Kirra Reef in January 2001May2003March2004February2005andApril2014HanddifferentatPalmBeach ReefinJanuary2001February2005February2010andMarch2015Theabundance ofascidiansvariedbetweensurveysateachsitewith1995beingmostdifferentwhenthe abundanceofascidianswaslow(AppendixD)InMarch2015theabundanceofallother ascidiansonKirraReefandPalmBeachReefwashigherthanpreviouslyreportedinthe baselinesurveyinApril1995(whennoascidianswererecorded)Themeanabundance washigheratKirraReefthanatPalmBeachReef(Figure314)
ThemeanabundanceofPyura0stoloniferahasvariedconsiderablybetweensitesatKirra Reef and Palm Beach Reef over time (note the significant interaction between site (location) x survey in Table 36) In March 2015 the mean abundance (individual per 025m2plusmnSE)of theascidianPstolonifera (Figure313)wassimilaratKirraReefand PalmBeachReef(Figure315)ThemeanabundanceofP0stoloniferahasrangedfrom 02to17individualsper025m2atbothreefssinceMay2003
Figure315 Mean abundance of ascidians (Pyura0 stolonifera) (individuals025m2)
(plusmnSE)atKirraReefandPalmBeachReefinallsurveys
TRESBPKirraReefMarineBiotaMonitoring2015 34
frc environmental
Table35 Univariate PERMANOVA results for the differences in cover of all ascidians otherthanPyura0stolonifera0betweensurveysandlocations
Factor$ df$ MS$effect$ PseudoF$ p$(perm)$
survey 10 26658 474 0001
location 1 13603 710 0104
site(location) 4 19154 149 0212
locationxsurvey 10 2629 468 0001
site(location)xsurvey 40 5621 438 0001
error 924 12828
Shadingdenotessignificanceatplt005
Table36 Univariate PERMANOVA results for the differences in Pyura0 stolonifera densitybetweensurveysandlocations
Factor$ df$ MS$effect$ PseudoF$ p$(perm)$
survey 10 16254 11842 0001
location 1 12445 60881 0206
site(location) 4 20442 56799 0001
locationxsurvey 10 79724 58082 0001
site (location) x 40 13726 38138 0001 survey
error 924 35991
Shadingdenotessignificanceatplt005
$
TRESBPKirraReefMarineBiotaMonitoring2015 35
frc environmental
Hard$Coral$
There was a significant difference between the cover of hard corals at Kirra Reef and PalmBeachReefduringsomesurveys(notethesignificantinteractionbetweenlocationx surveyinTable37)SpecificallytherewassignificantlymorehardcoralatPalmBeach Reef thanKirraReef inFebraury1996March2004April2014andMarch2015(Table 38)
ThecoverofhardcoralistypicallylowonKirraReefaccountingforlessthan2ofthe availablesubstrateInMarch2015hardcoralcoveredlessthan1oftheareaofKirra Reef which was less than the cover recorded during the baseline survey in April 1995 (Figure 316) In contrast hard coral covered 11 of the surface area at Palm Beach ReefwhichwasgreaterthanthecoverrecordedinApril1995(Figure316)
The cover of hard corals at Palm Beach Reef has been more variable over time comparedtothecoverofhardcoralatKirraReef(Figure316)Withtheexceptionofthe surveys inApril1995andJanuary2001when thecoverofhardcoralwas lowonboth reefshardcoralsaretypicallymoreprevalentatPalmBeachReef(Figure316)
Table38 PERMANOVA post hoc pairwise results for the differences in the cover of hardcoralbetweenlocationsineachsurveyevent
Hard$Corals$ Survey$
t$ p$(MC)$a$
Apr1995 054 0606
Jun1995 182 0140
Feb1996 541 0006
Jan2001 R R
May2003 166 0168
Mar2004 765 0001
Feb2005 049 0646
Feb2010 156 0197
Jul2012 283 0053
Apr2014 525 0011
Mar2015 695 0003 Shadingdenotessignificanceatplt005 a pvaluesbasedonMonteCarlotests
TRESBPKirraReefMarineBiotaMonitoring2015 37
60
50
40
30
20
10
0
Soft
Cor
al C
over
()
Kirra Reef Palm Beach Reef
frc environmental
Soft$Coral$
The cover of soft coral was significantly different between sites at both Kirra Reef and PalmBeachReefandduringsomesurveys(notethesignificant interactionbetweensite (location)xsurvey)TherewasnosoftcoralrecordedatKirraReefinMarch2015The coverofsoftcoralhasdeclinedatKirraReefsince2003andhascoveredlessthan2of theavailablesubstratesince2005whichissimilartothecoverofsoftcoraldescribedfor the baseline surveys in 1995 (Figure 317) The cover of soft coral was consistent betweensitesineachsurveyexceptbetweensitesin
sdot April1995atKirraReef
sdot 1996atKirraReef
sdot 2003atPalmBeachReefand
sdot 2014atPalmBeachReef(AppendixD)
Soft corals have historically covered more of the available space on Palm Beach Reef than on Kirra Reef However there was more temporal variability within sites at Palm BeachReefthanatKirraReef(AppendixD)ThecoverofsoftcoralatPalmBeachReef has varied over time and was highest in April 1995 (48 cover) Despite increasing sinceFebruary2005itisstilllowerthanthecoverrecordedduringthebaselinesurveyin April1995(Figure317)
Table39 UnivariatePERMANOVAresults for thedifferences in thecoverofsoft coral betweensurveysandlocations
Factor$ df$ MS$effect$ PseudoF$ p$(perm)$
survey 10 44657 1323 0001
location 1 32922 6620 0117
site(location) 4 49732 266 0036
locationxsurvey 10 40982 1214 0001
site (location) x 40 3376 181 0002 survey
error 924 18688
Shadingdenotessignificanceatplt005
$
TRESBPKirraReefMarineBiotaMonitoring2015 39
frc environmental
Crinoids$
ThereisasignificantdifferencebetweensomesitesatbothKirraReefandParmBeach Reef that varies through time (note the significant interaction between site (location) x survey inTable310) Theabundanceofcrinoidshasbeensimilarbetweensites inall years at Palm Beach ReefH and was different beween sites at Kirra Reef in June 1995 February1996May2003andFebruary2005(AppendixD)Withineachsitetherehas been some natural temporal variability particualrly at Palm Beach Reef sites in 2001 (Appendix D) The mean abundance (individuals 025m2) of crinoids (Figure 318) at KirraReefandPalmBeachReefhasgenerallybeenlessthan2individualsper025m2 andhasdeclinedatboth locationssincethebaselinesurvey inApril1995(Figure319) However the mean abundance of crinoids on Kirra Reef has shown a slight increase sinceFebruary2010(Figure319)
In March 2015 fewer crinoids were recorded at Palm Beach Reef than at Kirra ReefH crinoidshavebeenrareatPalmBeachReefsince2003
The species richness of fish recorded from Kirra Reef across all monitoring events has rangedfrom14to57 InMarch201557specieswereidentifiedat thereefwhichwas similar to April 2014 (53) and higher than previous surveys (Figure 320) Species richnessatPalmBeachReefwas lower(34species)andgenerallyvaried lessbetween surveyscomparedtoKirraReef
InMarch2015 the assemblage of fish at KirraReef comprised species fromall trophic levelsincludingdetritivoresplanktivoresherbivoresandcarnivores(AppendixE)Asin previous surveys the assemblage was dominated by herbivores and planktivores Yellowtail (Trachurus0 novaezelandiae) and striped sea pike (Sphyraena0 obtusata) were the dominant species present in large schools (Figure 321) Australian mado (Atypichthys0 strigatus) ringRtailed surgeon (Acanthurus0 blochii) silver trevally (Pseudocaranx0 georgianus) eastern pomfred (Schuettea0 scalaripinnis) sweep (Scorpis0 lineolatus) and various wrasses were also very abundant releative to other species (AppendixE)
Two new species were observed at Kirra Reef the orangeRband surgeon (Acanthurus0 olivaceus) and the unicornfish (Naso0 sp) Five new species were recorded at Palm BeachReef
No threatened or protected fish species listed under the Queenslandrsquos Nature0 Conservation0Act01992ornationallyundertheEnvironmental0Protection0and0Biodiversity0 Conservation0 Act0 1999 were observed The complete list of species recorded and the relativeabundanceispresentedinAppendixE
TRESBPKirraReefMarineBiotaMonitoring2015 42
60
0
10
20
30
40
50
Num
ber
of F
ish
Spe
cies
Apr-95
Jun-95
Feb-96
Jan-01
May-03
Mar-04
Feb-05
Feb-10
Jul-12
Apr-14
Mar-15
Kirra Reef Palm Beach Reef Location
frc environmental
Figure320 Number of fish species recorded at Kirra Reef and Palm Beach Reef on
ThegreatestchangetotheecologicalconditionofKirraReefsincethebaselinesurveyin 1995 has been the loss of large areas of hard substrate that support benthic flora and faunaThedeliveryoflargesandvolumesduringthestage1dredgingoperations(1995 to1998)andtheinitialoperationofthesandbypasssystem(2001to2008)resultedinan increaseinwaveactionandtidalcurrentsredistributingthissandoverKirraReef
The three major outcrops of Kirra Reef (northern southern and eastern sections) are naturally exposed and covered depending on water and sand movements In March 2015 the rocky outcrops in the northern section of Kirra Reef were exposed and supportedamoderatelydiversebenthicassemblagedominatedbyturfalgaeTherewas arelativelyhighfishdiversityatKirraReefTheecologicalassemblageexhibitedsignsof ongoingstressfromphysicaldisturbanceincludingtheabsenceofsoftcoralsandrarityof hardcoral(MumbyampSteneck2008)HoweverKirraReefhasarelativelyhighcoverof sponges and ascidians Sponges ascidians and crinoids were more abundant at Kirra ReefthanatPalmBeachReefinMarch2015
KirraReefcontinues toprovidehabitatandsupport importantecological functions in the region providing hard substrate for the colonisation of algae and benthic invertebrates and food and refuge for fish As sand levels have stabilised since 2008 assemblages have becomemoresimilar to those recordedprior to implementationof the TRESBP in April1995 Forexamplemacroalgalcover inApril1995andMarch2015wasrelatively similarHoweverassemblagecompositionisstillsignificantlydifferenttothatrecordedin thebaselinesurveysmostnoticeablyduetoa lowercoverofbaresubstrateandhigher coverofturfalgaeandascidianssincesurveyshavebeenperformed
Benthic$Macroalgae$
The cover of macroalgae at Kirra Reef was relatively similar during the 2014 and 2015 surveys and remained well below the peak of nearly 60 cover recorded in January 2001TherewasasteepdeclineinthecoverofmacroalgaebetweenJanuary2001and May2003whichappearedtobestronglyassociatedwith thedecline inreefareaduring that time as well as a decline in the cover of Sargassum sp (an important indicator speciesonKirraReef) SimilardeclineswereevidentatPalmBeachReefbetween the January2001andMay2003surveys
TRESBPKirraReefMarineBiotaMonitoring2015 45
frc environmental
The cover ofmacroalgae at Palm Beach Reef was much lower thanat Kirra Reef over time There are several possible reasons for the lower cover of macroalgae at Palm Beach
sdot PalmBeachReefisdeeperthanKirraReefandgenerallyhashigherturbidityand therefore greater light attenuation The quantity and quality of available light affectsthedistributionandgrowthofmacroalgae(MillerampEtter2008)
sdot Differences in the pattern of recruitment of algal species to the reefs due to differentwatercurrentsandtimingofthesurveys(Kennelly1987b)
sdot Increased competition with turf algae and sessile benthic invertebrates which competeforspacewithmacroalgae(Kennelly1987aHMillerampEtter2008)
sdot PresenceofdifferentspeciesandhigherdensityofherbivoresatPalmBeachReef (particularly sea urchins and herbivorous fish) which graze on macroalgae (McCook1997HJompaampMcCook2002)
Biological assemblages exposed to physical stress typically exhibit greater levels of temporalandspatialvariability(WarwickampClarke1993HChapmanetal1995)Temporal variationinthecoverofmacroalgaeatKirraReefislikelytobeprincipallyduetotheeffect ofphysicaldisturbance fromwaveactionaswellas theassociatedassociatedabrasion andsmotheringbysandTheeffectsofthesephysicaldisturbanceswouldincreasewith thereductionofKirraReefasedgeeffectsarepronouncedandwaterdepth isreduced Increasedsmotheringbysandcanalsoreducediversity(Hatcheretal1989)abundance recruitment growth survival and seasonal regeneration of macroalgae (Umar amp Price 1998HCheshireetal1999)
Changes in the cover of macroalgae on Kirra Reef over time are also likely due to the extentofthereefchangingHthefishandmobileinvertbratesassociatedwiththereefmay have concentrated which would in turn increase grazing pressure Increased grazing pressure from fish and mobile invertebrates can reduce the coverage and diversity of macroalgaeonreefs(McCook1997HJompaampMcCook2002)
Thecoverof turfalgaeatbothKirraReefandPalmBeachReefhasvariedsignificantly betweensurveysPriorto2005turfalgaetypicallycoveredlessoftheavailablesurface areaonKirraReefthanPalmBeachReefInMarch2015themeancoverofturfalgae hasincreasedsincebaselinesurveysin1995andwasrelativelysimilarbetweenreefs(40 plusmn4atKirraReefcomparedto48plusmn4atPalmBeachReef)Thecoverofturfalgaeat Kirra Reef was similar in 2014 and 2015 which was generally higher than previous surveysexceptduringJuly2012whencoverofturfalgaepeakedat67plusmn4
TRESBPKirraReefMarineBiotaMonitoring2015 46
frc environmental
Turfalgaearebecomingadominantcomponentofcommunitiesaroundtheworld likely the result of rapid colonisation of openspace after a disturbance (eg storms) nutrient enrichment andor changes in grazing pressures Turf algae can also reflect a more physically robust growth form suited to high wave energy environments (than foliose macroRalgae)TurfalgaepeakedintheJuly2012surveylikelyrelatedtotheincreasein bare reef exposure following a stormy conditions in early 2009 and between December 2011 and June 2012 Turf algae have been the dominant form of algae on Kirra Reef sincethistimealbeitthecoverlowerthanthe2012survey
Increased cover of turf algae is typically related to good light conditions high concentrationsofnutrientsandlownumbersofgrazerssuchasfish(orconstantgrazing pressure preventing macroalgae colonisation) However the relationship between algal dynamics physical disturbance water quality and herbivore grazing activity is complex andthecoverof turfalgaecanexhibitextremetemporalvariabilityasaconsequenceof the interactionbetween topRdownandbottomRupprocesses (Russ2003HBellwoodetal 2006H Hughes et al 2007H Albert et al 2008H Hoey amp Bellwood 2008H Mumby 2009) Furtherinvestigationwouldberequiredtoreliablydeterminethemechanismsofchangein bothmacroalgaeandturfalgaeassemblagesonthesereefs
Benthic$Macroinvertebrates$
AtKirraReeftheburialandreRemergenceofrockyoutcrops(influencedbytheTRESBP) islikelytohaveincreasedtemporalvariabilityinthedistributionandabundanceofbenthic macroinvertebrates Additional perturbations such as wave action and sand abrasion (each influenced through changes in bathymetry seabed topography and water depth) are likely to have resulted in the decline in cover and diversity of the benthic macroinvertebratesatKirraReefbetweensurveysparticularlybetweenMarch2004and February2005andduringtheseverestormsof2009Benthicmacroinvertebratessuch asascidiansspongeshardcoralandsoftcoralarehighlysusceptible to theeffectsof stormandwavedisturbancephysicalabrasionandburialbysand(KayampKeough1981H Walker et al 2008) which can affect settlement growth rate and survival (Dodge amp Vaisnys1977HRogers1990)
Physical disturbance from sand burial sand abrasion and the action of storm waves appeartokeepthebenthicassemblagesofKirraReefinastateofearlysuccessionItis commonforearlypioneerspeciessuchassomemacroalgaetorecruitrapidlytoahard surface in large numbers allowing these species to dominate assemblages early in the successionaltrajectory(Walkeretal2007)
Afurther indicatorof theearlystateofsuccessionatKirraReef isthatthecoverofhard and soft coral has remained very low (generally lt 5) In March 2015 less than 1
Benthic macroinvertebrate cover may also be affected indirectly through increased competitionwithmacroalgaeforspaceThepresenceoflargemacroalgaecanaffectthe recruitment and survival of sessile benthic invertebrates as fronds moving with wave action sweep and abrade the surface of rocks killing new recruits especially corals (Kennelly1989HMcCooketal2001)Itcantakeseveralyearsforhardandsoftcoralto become dominant on reefs in the SEQ region (SchlacherRHoenlinger et al 2009) Therefore hard coral is not expected to become abundant until several years after the reefhasbeenuncoveredandonlyifthephysicaldisturbanceregimeandsupplyofnew recruitsissufficienttosupportsurvivalandgenerationalsuccessionofthesespeciesThe coverofhardandsoftcoralsatKirraReefwerebothverylowandpatchypriortothestart oftheTRESBP
Sponges and ascidians are highly susceptible to smothering and sand abrasion unless theyhaveathicktunic(outercoveringmadeofkeratin)liketheascidianP0stolonifera0or strong internal keratin silicon or calcareous structures in the case of some species of sponges0(KayampKeough1981HMcGuinness1987HWalkeretal2008)Duetoincreased wave action and sedimentation (which can be influenced by the TRESBP) the mean coverofascidiansandspongeswasexpectedtobemuchloweronKirraReefthanPalm Beach Reef However in March 2015 the cover of sponges was similar between the reefsandthecoverofascidians(otherthanP0stolonifera)wasgreateratKirraReefthan at Palm Beach Reef This suggests that Kirra Reef is slowly recovering from the increasedstressofphysicaldisturbancesuchas increasedwaveactionandsandscour andorthatwaveandstormconditionshavebeenlesssevereinthepastfewyears
Fish$
KirraReefcontinuestosupportahighdiversityofreefRassociatedandpelagic(ienonR reefassociated) fishspecies Despite itsdiminishedsizecompared to1995KirraReef continuestoprovidevaluablehabitatforanumberoffishspeciesfromdifferentfunctional groups
ThereisahighdegreeofinterRannualvariabilityinthespeciesandabundanceofthefish present at Kirra Reef compared with the assemblage at Palm Beach Reef This likely reflectsthetemporalvariabilityintheavailablehabitatasaconsequenceofreefburialand reRemergenceThediversityqualityandarealextentofreefhabitatareimportantfactors influencing the distribution abundance biomass and diversity of reef fish (Bellwood amp Hughes2001HFriedlanderetal2003)Diversityandabundanceoffishcanincreasewith
TRESBPKirraReefMarineBiotaMonitoring2015 48
frc environmental
greaterstructuralcomplexityandincreasedheterogeneityofavailablehabitats(Bellwood ampHughes2001)Thissuggeststhatperiodsofreefburialreducetheoveralldiversityof reefRassociated fish species at Kirra Reef Despite the reduction in overall reef space therewasalargervarietyofhabitats(suchasmarcoalgaeandturfalgae)in2015which was likely to be related to the high diversity of fish assemblages This is particularly importantforseveralspeciesthatdependonthepresenceoflsquostructurersquosuchasprovided by reef habitat (ie oldwife moray eels damselfish and Australian mado that were recordedinMarch2015butwerenotrecordedinJuly2012)
Theabundanceanddiversityof fishare likelytobenegativelyaffectedfollowingperiods of severe weather which create unfavourable conditions for many species and may further exacerbate the affects of abrasion and sedimentation The biomass of fish is knowntodecreasewithincreasingexposuretophysicaldisturbancefromwaveactionand strong currents (Friedlander et al 2003) As our surveys have been undertaken at different times of the year variation in the prevailing conditions at the time of sampling could also influence the types of fish observed (and the amount of reef habitat that is availableatanytime)Manyofthespeciesmayalsobeaffectedbyseasonalchangesin the water temperature such as damselfish which are less abundant in cool waters However theoveralldiversityof the fishassemblageatKirraReef is likely toreflect the sizeoftheoutcropsexposedwithagreaterphysicaldisturbance(fromseaconditionsand sandmovement)andcompetitionHandlesserfoodavailablewhenthereefiscovered
ThepredictedimpactstoKirraReefasaresultoftheTRESBPincludedaccretionofsand around the base of the rock outcrops causing a reduction in extent of reef It was predictedthatsanddeliveryaspartoftheprojectwouldeventuallymimiclsquonaturalrsquopatterns ofsanddispersalandthatthereefwouldreturntoitsnaturalextent(ietheextentpriorto extension of the Tweed River training walls in 1962) The benthic flora and fauna assemblages of the reef the historical reef extent and natural sand transport patterns wereexpectedtoreturntoconditionsobservedbeforetheextensionofthetrainingwalls between 1962 and 1965 However the Environmental Impact Study did not predict the ecologicalconsequencesofboththereducedarealextentandincreasedwaveenergy(a consequenceofdecreaseddepth)thathavebeenrecorded
ThecurrentextentofKirraReef remains less than50of that recorded in1962and in 1995beforethesanddeliverybytheTRESBPcommencedHowevertheextentofreef in1995 wasstrongly influenced by adepletion in sand following the construction of the Tweed River training walls and the Kirra Point groyne Accumulation of sand on Kirra ReefwasobservedtoincreaseasaresultofindirectsandnourishmentbytheTRESBP and the reef has been extensively covered (particuarly between 2005 and 2010) as a result
Whiletheextentofthereefcontinuestochangeovertimethedeliveryofsandaspartof the project now more closely matches the natural rate of longshore sand transport ShortRtermandseasonalchangesintheextentofthereefarenowlikelytobetheresultof waveandcurrentaction(particularlyduringservereweatherevents)thanadirectimpact of the TRESBP Therefore the extent of Kirra Reef in March 2015 is broadly in accordancewithpredictionsmadeintheEISwhichpredictedthatthereefwouldreturnto a condition similar to that exhibited in the preR1960rsquos ie before the extension of the TweedRiverbreakwatersthatinterruptedlittoralsandsupplytothesebeaches
InDecember2013KirraPointgroynewasextendedby30mwiththeexpectationthatthe beach bar would move seaward as a consequence At present Kirra Point groyne is unlikelytohavehadamajorimpactonthearealextentofKirraReefHoweverongoing monitoringbasedonaerialphotographsmayprovidefurtherinsight
Sessile benthic assemblages on Kirra Reef are highly susceptible to the influence of storms and associated wave action (Kay amp Keough 1981H Walker et al 2008) The shallowreefissurroundedbymobilesandwhichcanshiftnaturallyinresponsetowave action during storms causing burial of large sections of Kirra Reef This effect has reduced the availability of rocky substrate for colonisation and the availability of refuge
Fromanexaminationof theextentofKirraReef fromarealmapsandwaveheightdata thereappears tobea relationshipbetween theareaof rockexposedandstormevents Notably in a series of storm events in May 2009 corresponds with large areas of rock becoming exposed (with the reef approximately 100m2 in 2006 and approximately in 1009m2 2009) Further a stormy conditions between December 2011 and July 2012 correspondstotheareaofexposedrockmorethandoublinginsizeWhiletherewasno changetothetotalareaofexposedrockfollowingstormyconditionsinearly2013there wasaclearchangeinthedistibutionofexposedrockduringthistimeSince2013storm conditions have been calm to moderate and there has been little change in the areal extentanddistrubtionofexposedrockatKirraReef
WaveheighttypicallyincreasesduringstormeventsandgiventheshallowdepthofKirra Reef waves are more likely to shoal and break across the reef during storms This increases thephysicaldisturbanceabrasionandsedimentationofbenthicassemblages onKirraReefStormdisturbancecancauselocalreductionsinthespeciesrichnessand abundanceofcoral(Woodleyetal1981HMasselampDone1993HHughes1994HConnellet al 1997) and can alter fish assemblages indirectly through habitat modifications (Kaufman1983HJonesampSyms1998)ordirectlybyincreasingfishmortality(Lassig1983) The hydrodynamic forces produced by wave action are an important source of disturbance in subtidal habitats inflicting damage through direct physical impact and abrasion(UnderwoodampKennelly1990)DirectimpactsfromphysicaldisturbanceatKirra Reefareevidentduringsurveyeventswhenlargefragmentsofmacroalgaearepresentin thewatercolumnoverthereef
Storm and wave action (and associated sedimentation and abrasion) continue to be importantforcesshapingthedistributionandabundanceofbenthicspeciesatKirraReef Increased magnitude and frequency of physical disturbance resulting from increased exposureorsusceptibility tostormsandassociatedwaveaction (asonKirraReef)can lead to a decrease in the diversity of sessile invertebrate assemblages DisturbanceR drivenreductionsinbiodiversityhavethepotentialtoimpactnegativelyonthehealthand productivity of reef ecosystems (Walker et al 2008) Biodiversity is important to reef health given that many of these species (eg sponges bryozoans and ascidians) contribute a range of vital ecosystem services to reefs including nutrient cycling (Scheffers et al 2004) trophic interactions and food webs (Lesser 2006H Pawlik et al 2007) bioRerosion (Rutzler 2002H LopezRVictoria et al 2006) and stabilizing substrata (DiazampRutzler2001HWulff2001)
Theimpactsof increasedwaveactionandsedimentationonthebenthicassemblagesat Kirra Reef are likely to be greatest during and immediately following storm conditions
TRESBPKirraReefMarineBiotaMonitoring2015 51
frc environmental
Partitioningtheinfluenceofstormandwavedrivendisturbancefromthatoftheoperation oftheTRESBPwouldrequireamuchmorestatisticallypowerfulandtemporilyreplicated experimental design Given there is a large collection of wave and storm data by TRESBP this would involve greater temporal sampling of Kirra Reef including event samplingfollowingseverewaveandstormactivity
The data generated by this Kirra Reef biota monitoring program doesnrsquot support statistically rigorous consideration of seasonality (monitoring has been at its most frequentannual)
InApril2014andMarch2015KirraReefcoveredlessthan50ofthereefrsquosextentprior to theoperationof theTRESBP The lossof reefhabitathasreducedtheavailabilityof hard substratum available for colonisation and consequently the abundance of benthic sessileassemblages
The reduced depth of water resulting from the accumulation of sand exacerbates the effects of storms and wave action It is likley that as a consequnece the biological communities of Kirra Reef will reflect earlyRstage succession more frequently and for longerperiods
While there is sufficient structure available frcenvironmentalexpect that Kirra Reef will continuetoprovideimportanthabitatforadiverseassemblageoffishes
TRESBPKirraReefMarineBiotaMonitoring2015 52
frc environmental
5$ Conclusions$
Although there is still a substantial portion of the reef covered compared to before the extension of the Tweed River entrance breakwaters the current extent of Kirra Reef is broadly inaccordancewithpredictionsmadein theEIS Initial lsquocatchRuprsquobypassingand dredgeplacementofsand(between2001and2008)resulted in theburialofKirraReef Subsequentsanddelivery(since2008onwards)morecloselyreflectsnaturalpatternsof longRshoresandtransportandisthereefhasslowlyreRemerged
Theextentofthereefhasbeenrelativelystablesince2013Thishasallowedforsome succession in the benthic assemblages including a relatively high cover of sponges ascidiansandcrinoidsWiththedeliveryofsandmorecloselymatchingthenaturalrateit isexpected the reef willundergoshortRtermchanges in extentdue toseasonal shifts in sand deliveryH however the diversity of benthic assemblages on Kirra Reef is likely to increaseovertimeThiswouldcreatemorespaceforspeciestorecruitandreducesthe influence of sand abrasion and wave damage It was predicted that the areas of Kirra Reef newly exposed in 2012 would undergo a shift from turfRdominated communities to more diverse communities that could include macroalgae sponges ascidians and potentiallyhardandsoftcoralWiththeexceptionofhardandsoftcoralsthisprediction wasconfirmedbytheresultsoftheApril2014andMarch2015surveys
ThediversityoffishesassociatedwithKirraReefisbroadlysimilartothatrecordedprior tothecommencementofsandbypassingin1995Giventhatfisharemobilethegreatest impacts on fish assemblages are likely to be shortRterm changes due to both the prevailingconditionsandchangestheextentofavailablehabitatthatprovidesshelterand foodforavarietyofdifferentspeciesIfKirraReefincreasesinsizethereislikelytobea greater proportion of cryptic benthic species as these species are more typical of assemblagesinalaterstageofsuccession(eg(WillisampAnderson2003))
Assuming a broadly stable delivery rate of sand and consequent stable extent of Kirra ReeflsquorecoveryrsquoislikleytobesubstantivelycompleteFloralandfaunalcommunitieswill undergo succession between severe storm events but are likley to remain relatively dynamic
Albert S Udy J amp Tibbetts I 2008 Responses of algal communities to gradients in herbivorebiomassandwaterqualityinMarovoLagoonSolomonIslandsCoral0 Reefs2773R82
Anderson MJ 2001 A new method for nonRparametric multivariate analysis of varianceAustral0Ecology2632R46
Anderson MJ 2004 PERMDISP0 a0 FORTRAN0 computer0 program0 for0 permutatinoal0 analysis0 of0 multivariate0 dispersions0 (for0 any0 twoSfactor0 ANOVA0 design)0 using0 permutational0 tests Department of Statistics University of Auckland New Zealand
Cannon LR Goeden GB amp Campbell P 1987 Community patterns revealed by trawling in the interRreef regions of the Great Barrier Reef Memoirs0 of0 the0 Queensland0Museum2545R70
Chapman MG Underwood AJ amp Skilleter GA 1995 Variability at different spatial scalesbetweenasubtidalassemblageexposedtothedischargeofsewageand two control assemblages Journal0 of0 Experimental0 Biology0 and0 Ecology 189 103R122
Cheshire AC Miller DJ amp Stewart R (1999) Effect0 of0 dispersed0 sediment0 plumes0 from0beach0sand0replenishment0dredging0on0recruitment0of0phaeophycean0algae0 to0rocky0reefs0in0Gulf0St0Vincent0South0Australia0The0Impact0of0Sand0Dredging0 on0 Benthic0 Community0 Structure0 at0 the0 Port0 Stanvac0 Dredge0 Site0 20 1S39 UniversityofAdelaideAdelaide
ConnellJHHughesTPampWallaceCC1997A30Ryearstudyofcoralabundance recruitment and disturbance at several scales in space and time Ecological0 Monographs67461R488
Diaz MC amp Rutzler K 2001 Sponges an essential component of Caribbean coral reefsBulletin0of0Marine0Science69535R546
DodgeREampVaisnysJR1977Coralpopulationsandgrowthpatternsresponsesto sedimentation and turbidity associated with dredging Journal0 of0 Marine0 Research35715R730
Done TJ 1982 Patterns in the distribution of coral communities across the central GreatBarrierReefCoral0Reefs195R107
Edwards RA amp Smith DA 2005 Subtidal assemblages associated with a geotextile reef insouthReastQueenslandAustraliaMarine0and0Freshwater0Research56 133R142
FisheriesResearchConsultants1991Survey0of0the0Intertidal0and0Subtidal0Rocky0Reefs0 of0 the0 Sunshine0 Coast report prepared for Queensland National Parks and WildlifeService
HarrisonPHarriotVBanksSampHolmesN1998ThecoralcommunitiesofFlinders Reef andMyora Reef in theMoretonBay MarineParkQueensland Australia In Moreton0 Bay0 and0 Catchment Tibbits I Hall N amp Dennison W (Eds) SchoolofMarineScienceUniversityofQueenslandStLuciapp525R536
Hatcher B Johannes R amp Robertson A 1989 Review of research relevant to the conservationofshallowtropicalmarineecosystemsOceanography0and0Marine0 Biology0an0Annual0Review27337R414
Hoey A amp Bellwood D 2008 CrossRshelf variation in the role of parrotfishes on the GreatBarrierReefCoral0Reefs37R47
TRESBPKirraReefMarineBiotaMonitoring2015 56
frc environmental
Hollingsworth P 1975 Environmental Investigation Report Crown Reserve R R68 Currumbin Creek City of the Gold Coast Land Administration Commission unpublishedreport
Hughes TP 1994 Catastrophes phase shifts and large scale degradation of a CaribbeancoralreefScience2651547R1551
Hughes TP Rodrigues MJ Bellwood DR Ceccarelli D HoeghRGuldberg O McCook L Moltschaniwskvi N Pratchett MS Steneck RS amp Willis B 2007Phaseshiftsherbivoryandtheresilienceofcoralreefstoclimatechange Current0Biology17360R365
Hutchinson A Rempel C Taveras V Loder J amp Salmond J 2013 Reef0 Check0 Australia0 South0 East0 Queensland0 Summary0 Report0 2013 report prepared for ReefCheckFoundationLimited
Hyder Consulting 1997 Tweed0 River0 Entrance0 Sand0 Bypassing0 Project0 Permanent0 Bypassing0 System0 0 Environmental0 Impact0 Statement0 0 Impact0 Assessment0 Study report prepared for New South Wales Department of Land and Water Conservation
Jompa J amp McCook LJ 2002 Effects of competition and herbivory on interactions betweenahardcoralandabrownalgaJournal0of0Experimental0Marine0Biology0 and0Ecology27125R39
KayAMampKeoughMJ1981Occupationofpatchesintheepifaunalcommunitieson pier pilings and the bivalve Pinna bicolor at Edithburgh South Australia Oecologia48123R130
KennellyS1987aInhibitionofkelprecruitmentbyturfingalgaeandconsequencesfor an Australian kelp community Journal0 of0 Experimental0 Marine0 Biology0 and0 Ecology11249R60
Kennelly S 1987b Physical disturbances in an Australian kelp community I temporal effectsMarine0Ecology0Progress0Series40145R153
TRESBPKirraReefMarineBiotaMonitoring2015 57
frc environmental
Kennelly S 1989 Effects of kelp canopies on understory species due to shade and scourMarine0Ecology0Progress0Series50215R224
Lassig BR 1983 The effects of a cyclonic storm on coral reef fish assemblages Environmental0Biology0of0Fishes955R63
Lawson S McMahon J amp Boswood P 2001 Environmental management of the construction and operation of a sand bypassing system at the Tweed River EntranceInThe15thAustralasianCoastalandOceanEngineeringConference the 8th Australasian Port and Harbour Conference 25 R 28 September 2001 QueenslandAustralia
Lesser MP 2006 BenthicRpelagic coupling on coral reefs feeding and growth of Caribbean sponges Journal0 of0 Experimental0 Marine0 Biology0 amp0 Ecology 328 277R288
LopezRVictoriaM ZeaSampWei E2006 Competition for spacebetweenencrusting excavatingCaribbeanspongesandothercoral reeforganismsMarine0Ecology0 Progress0Series312113R121
MalcolmHASmithSDAampJordanA2009Usingpatternsofreeffishassemblages to refine a Habitat Classification System for marine parks in NSW Australia Aquatic0Conservation0Marine0and0Freshwater0Ecosystems2083R92
Massel SR amp Done TJ 1993 Effects of cyclone waves on massive coral assemblages on the Great Barrier Reef meteorology hydrodynamics and demographyCoral0Reefs12153R166
Mumby PJ amp Steneck RS 2008 Coral reef management and conservation in light of rapidly evolving ecological paradigms Trends in Ecology amp Evoution 23 555 -563
Murphy HM amp Jenkins GP 2010 Observational methods used in marine spatial monitoring of fishes and associated habitats a review Marine and Freshwater Research 61 236-252
Noriega R 2007 An Overview of Available Information on Sandy Beach Ecology Coastal Sand Dunes Rocky Reefs and Associated Biota on the Gold Coast Griffith Centre for Coastal Management Research Report No 85 report prepared for Griffith University
Parker P (1995) Structure to Reef Fish Assemblages at Julian Rocks Northern New South Wales Masters Thesis Griffith University
Parker PG 1999 Fish assemblages at Julian Rocks and the adjacent waters of northern New South Wales Australia Australian Zoologist 31 134 - 160
Pawlik JR Steindler L Henkel TP Beer S amp Ilan M 2007 Chemical warfare on coral reefs sponge metabolites differentially affect coral symbiosis in situ Limnology and Oceanography 52 907-911
Reef Check 2010 httpwwwreefcheckaustraliaorgdatahtml accessed December 2015
Robinson KI amp Pollard DA 1982 Marine and estuarine reserves in Australia with particular reference to New South Wales Wetlands 2 17 - 26
Rogers CS 1990 Responses of coral reefs and reef organisms to sedimentation Marine Ecology Progress Series 62 185-202
Russ GR 2003 Grazer biomass correlates more strongly with production than with biomass of algal turfs on a coral reef Coral Reefs 22 63-67
Rutzler K 2002 Impact of crustose clionid sponges on Caribbean reef corals Acta Geologica Hispanica 37 61-72
Scheffers SR Nieuwland G Bak RPM amp van Duyl FC 2004 Removal of bacteria and nutrient dynamics within the coral reef framework of Curacao (Netherlands Antilles) Coral Reefs 23 413-422
TRESBP Kirra Reef Marine Biota Monitoring 2015 59
frc environmental
Schlacher-Hoenlinger M Walker S Johnson J Schlacher T amp Hooper J 2009 Biological Monitoring of the Ex-HMAS Brisbane Artificial Reef Phase II - Habitat Values report prepared for Environmental Protection Agency (EPA)
Smith KA 2003 A simple multivariate technique to improve the design of a sampling strategy for age-based fishery monitoring Fisheries Research 64 79-85
Smith S Edwards R Dalton S amp Harrison M 2005 Biological assessment of fish and benthic communities at Palm Beach Bait Reef Gold Coast Queensland report prepared for University of New England
TRESBP 2014 Autum 2009 storms httpwwwtweedsandbypassnswgovauarticles-and-studiesinteresting-itemsautumn-2009-storm updated 4 May 2014 accessed December 2015
TRESBP 2015a Tweed Sand Bypassing Restoring Coastal Sand Drift Improving Boating Access ndash Techinical information httpwwwtweedsandbypassnswgovau__dataassetspdf_file0004552055kir ra-feb-2015pdf acessed December 2015
TRESBP 2015b Waves httpwwwtweedsandbypassnswgovauenvironmental-monitoringcoastal-conditionswaves updated 30 September 2015 accessed December 2015
Umar MJMLJ amp Price IR 1998 Effects of sediment deposition on the seaweed Sargassum on a fringing coral reef Coral Reefs 17 169-177
Underwood AJ amp Kennelly SJ 1990 Ecology of marine algae on rocky shores and subtidal reefs in temperate Australia Hydrobiologia 192 3-20
Walker S Schlacher T amp Schlacher-Hoenlinger M 2007 Spatial heterogeneity of epibenthos on artificial reefs fouling communities in the early stages of colonization on an East Australian shipwreck Marine Ecology 28 435-445
Walker SJ Degnan BM Hooper JNA amp Skilleter GA 2008 Will increased storm intensity from climate change affect biodiversity in non-scleractinian sessile fauna on coral reefs Global Change Biology 14 2755-2770
Warwick RM amp Clarke KR 1993 Increased variability as a symptom of stress in marine communtities Journal of Experimental Marine Biology and Ecology 172 215-216
Thenumberofsitessurveyedhasvariedover timeasaresultof the fluctuating levelof sandcoveringKirraReef
Prior to May 2003 three sites were assessed along the eastern and northern edge of KirraReef(KirraReefOutersites1to3)andthreesiteswereexaminedalongtheinshore marginof the reef (KirraReef Inner sites1 to 3)(MapA1) ReefRedge (ieKirraOuter) siteswerechosentoprovideearlywarningofimpactsfromoffshoreplacementofdredged sandwhilst inshoresites(ieKirraInner)werechosentoindicatewhetherimpactsfrom inshore beach profile development were affecting the reef platform In May 2003 the threeeasternsitesatKirraReef (ieKRO1KRO2andKRI1)werecompletelycovered with bare mobile sand Consequently only the three western sites at Kirra Reef (ie KRO3KRI2andKRI3)supportedbenthicfloraandfaunaInMarch2004theextentof the remainingwesternoutcropof KirraReef had been further reduced so that all inner reefsiteswerecompletelycoveredwithmobilesandConsequentlyonlyasingleoriginal reefsite(ieKRO3)couldbesurveyed(Figure23)Thereforetoprovideanindicationof the condition of the remaining reef two new sites were established (ie KRN1 and KRN2)(Figure23)andsurveyedinMarch2004Theextentofthewesternreefhadbeen further reduced by February 2005 and a third new site (ie KRN3) was established (Figure23)Consequentlyfoursites(KRO3KRN1KRN2andKRN3)weresurveyedin February2005
InFebruary2010fourKirraReefsites(ieKRO3KRO1KRN1andKRN2)wereclearof thesurroundingsandandsupportedbenthic floraand fauna Inaddition several rocks protruded from the sand in the vicinity of site KRI2H these were assessed to provide a quantitativeindicationofbroadRscaletemporalchangestotheinshorereefcommunities
SOURCEScopy Copyright Commonwealth of Australia (Geoscience Australia) 2001 2004 2006copy The State of Queensland (Department of Natural Resources and Mines) 2015copy Nearmap 2014 2015
DATE2015-09-09
DRAWN BYCF
VERSION02
PROJECTIONCoordinate System GDA 1994 MGA Zone 56Projection Transverse MercatorDatum GDA 1994
plusmn SCALE
0 50 100
Metres
Scale 12500 A3
frc environmental
Appendix$B$ Introduction$to$Data$Analysis$Used$
Multivariate$Analyses$
Multivariate statistical techniques are widely used in ecology to assess the similarities relationshipsbetweenassemblagesWhereasunivariateanalysescanonlycompareone variable at a time (eg an index of community structure such as a diversity index or a singleindicatorspecies)multivariateanalysescancomparesamplesbasedontheextent thatassemblagesshareparticulartaxaandabundances(ClarkeampWarwick2001)
Thefirststepofmultivariateanalysisusuallyinvolvesthecreationofamatrixofsimilarity coefficients computed between every pair of samples The coefficient is usually a measureofhowclose theabundance is foreachspecies (definedso that100= total similarity and 0=complete dissimilarity) The Bray Curtis similarity measure is commonlythemostappropriateforbiologicaldata(ClarkeampWarwick2001)
MultidimensionalScaling
NonRmetricmultiRdimensionalscalingordinations(nMDS)attempttoplacesamplesintwo dimensionalspacesothattherankorderofthedistancesbetweensamplesmatchesthe rankorderofthematchingsimilaritiesfromthesimilaritymatrix(ClarkeampWarwick2001) Thisprovidesavisualrepresentationofthesimilaritiesbetweenassemblageswithineach sampleEachoftheaxesisnotrelatedtoanyparticularvalueHinfactaxescanberotated toprovide thebestvisual representationof thedata Ordinationsareparticularlyuseful tools for analysing and visually presenting differences between assemblages Ordinationsareessentiallymapsofsamples inwhich theplacementofsampleson the mapreflectsthesimilarlyofthecommunitytothecommunitiesinothersamples(Clarkeamp Warwick 2001) Distances between samples on an ordination attempt to match the similarities inassemblagestructurenearbypoints representassemblageswithvery few attributes(speciesorabundanceofspecies)Hpoints faraparthavevery fewattributes in common(ClarkeampWarwick2001)
A stress coefficient is calculated to reflect the extent to which the multiRdimensional scalingordinationandthesimilaritymatrixagree(ClarkeampWarwick2001)(iehowwell the multiRdimensional scaling ordination accurately reflects the relationship between samples)Stressvaluesoflt015aregenerallyacceptable
In Figure A1 each freshwater macroinvertebrate sample is represented on the multiRdimensionalscalingordination By lookingat thedistancesbetweeneachsample
ANOSIMisanalogoustoANOVAinunivariatestatistics(Smith2003)AglobalRstatistic iscalculatedtodeterminewhetherthereisasignificantdifferencebetweenallsamplesIf there are differences then pairwise comparisons are conducted to test for differences betweenpairsofsamples(analogoustopostRhoctestsinANOVA)
The R value lies between R1 and +1 (all similarities within groups are less than any similarity between groups) with a value of zero representing the null hypothesis (no differenceamongasetofsamples)(ClarkeampWarwick2001)ComparisonofpairwiseR values can give an indication of how different assemblages are R values close to 0 indicatelittledifferencevaluesaround05indicatesomeoverlapandvaluescloseto1to indicate many or substantial differences In many instances however researches are primarily interestedinwhethertheRvalueisstatisticallydifferentfromzero(usuallyata confidence level of 005) (Clarke amp Warwick 2001) (ie whether they can reject the null hypothesis)
ANOSIM can provide information on whether the (visual) differences between assemblages in the multiRdimensional scaling ordination are significantH it is an independenttestfromthemultiRdimensionalscalingordinationItisbasedontestingthe
TRESBPKirraReefMarineBiotaMonitoring2015 B2
frc environmental
differences between the rank similarities in the similarity matrix not on the distances betweensamplesinthemultiRdimensionalscalingordination(ClarkeampWarwick2001)
PermutationalMultivariateAnalysisofVariance
PERMANOVAisusedtotestsimultaneousresponsesofoneormorevariablestooneor more factors in an a0 priori0 structured design using random permutation of the data to assess significance (Anderson 2004) PERMANOVA generates a pseudo FRstatistic similar to traditional ANOVA but pRvalues are calculated with permutations which does notassumenormaldatadistribution PERMANOVAcanprovide informationonwhether the (visual) differences between assemblages in a multiRdimensional scaling ordination are significantH however it is an independent test from the multiRdimensional scaling ordination
Thelevelofmultivariatedispersionamongsampleswithineachofthetestgroupscanbe examined using the permutational analysis of multivariate dispersions (PERMDISP) routine(Anderson2004)Intraditionalimpactassessmentachangeinthedispersionof datacanalsoindicateanimpact
SimilarityPercentagendashSpeciesContributions
SIMPER analysis provides information on how dissimilar assemblages from various groups are (eg how similar all of the macroinvertebrate samples taken for a particular habitatwithinastreamreachare)andhowsimilareachgroup(egreach)istoanyother group SIMPER analysis also identifies the species taxa that are contributing to the dissimilarity between two assemblages in rank order (ie it identifies which species is contributingthemosttothedifferences)SIMPERanalysismayhelptoidentifypotential lsquoindicatorrsquospeciesForexampleifaparticularspeciesconsistentlycontributesgreatlyto the differences between impacted and unimpacted assemblages it may be a useful indicator Theabundanceofthis indicatorspeciescanthenbecomparedbetweensites usingunivariatetechniquessuchasANOVA
Data is available on request from tresbpprojectofficecrownlandnswgov
TRESBPKirraReefMarineBiotaMonitoring2015 C1
frc environmental
Appendix(D( Pairwise( PERMANOVA( Results
Data is available on request from tresbpprojectofficecrownlandnswgov
TRESBPKirraReefMarineBiotaMonitoring2015 D1
frc environmental
Appendix(E( Relative(Abundance(of(Fish(found(at(Kirra(( ( and(Palm(Beach(Reefs(in(Each(Survey((Data is available on request from tresbpprojectofficecrownlandnswgovau
TRESBPKirraReefMarineBiotaMonitoring2015 E1
Structure Bookmarks
0 50 100 Metres Scale 12500 A3
0 50 100 200 Metres Scale 15000 A3
Kirra Reef
Kirra Reef
Kirra Reef
Kirra Reef
Kirra Reef
Kirra Reef
Map A1Location of Kirra Reef monitoring sites
Table D8 Pairwise comparison of macroalgae cover between sites in each year
Table D15 Pairwise comparison of turf algae cover between sites in each year
Table D29 Pairwise comparison of ascidian cover between sites in each year
Table D43 Pairwise comparison of soft coral cover between sites in each year
frc environmental
Table310 Univariate PERMANOVA results for the differences in crinoiddensitybetweensurveysandlocations 42
Figures
Figure11 Extent of Kirra Reef in 1995 2001 2002 2009 2010 2011201220132014and2015 7
The New South Wales Government Department of Primary Industries LandsR and the QueenslandGovernmentDepartmentofScienceInformationTechnologyandInnovation commissionedfrcenvironmentalonbehalfoftheTweedRiverEntranceSandBypassing Project (TRESBP) to monitor the condition and biodiversity of benthic and fish assemblages at Kirra Reef and to assess potential impacts of the project on those assemblages The purpose of the TRESBP is to maintain a navigable entrance to the Tweed River and to provide a continuing supply of sand to the southern Gold Coast beaches consistent with the natural rate of longshore drift This report discusses the results of ecological monitoring of the benthic fauna flora and fish of Kirra Reef completedinMarch2015
Ongoing monitoring of Kirra Reef is required under the Environmental Management System(EMS)SubgtPlanB14KirraReefManagementPlanpreparedbytheTRESBPin February 2001 The methods used in the March 2015 survey (ie surveys of benthic cover and fish abundance) were those developed for the Stage I survey completed in 1995andhavebeenused in thesubsequentsurveys in19962001200320042005 20102012and2014
ImpactsoftheSandBypassingSystemonKirraReef
The extent of the three major outcrops of Kirra Reef (northern southern and eastern sections)varynaturallydependingonwaterandsandmovementsDuringtheearlyyears of theTRESBP operation largeamounts of sandwere deposited on thesouthern Gold Coast beaches This was done to provide a lsquocatch uprsquo quantity of sand to the badly erodedbeachesreducetheTweedRiverentrancebarandclearasandtrapinthevicinity ofthesandcollectionjettytoincreasetheefficiencyofthebypassingsystemDuringthe initialperiodofincreaseddepositionthevolumeofsanddeliveredexceededtheamount that was transported north through natural mechanisms A large volume of sand was deposited on the southern Gold Coast beaches and wave action and tidal currents redistributed some of this sand over Kirra Reef This resulted in a decline in the areal extentofKirraReefwiththereefalmostcompletelycovered(lt100m2exposed)in2006 The projectrsquos Environmental Impact Statement (EIS) predicted that impacts associated withthegradualaccumulationofsandaroundthebaseofKirraReefwereunavoidable
Sincethedeliveryoflargequantitiesofsandwascompletedin2008thevolumeofsand delivered by the project has declined and now closely matches the natural rate of northwardsandtransportHowevertherewasasubstantiallagbetweenthereductionin sanddeliveryandtransportofthesandfurthernorthduetoaperiodofcalmerthanusual
TRESBPKirraReefMarineBiotaMonitoring2015 i
frc environmental
conditionswith reduced storm activity from the north`east Assuchdispersion of sand from Kirra Beach and reduction in the sand levels around the reef was slower than predictedbetween2005and2009
BetweenFebruary2010andJuly2012 therewasa large(50) increase in theareaof exposedrockinthenorthernsectionofKirraReefThiswaslikelytoberelatedtosevere storms in late 2009 moving sand further north andor to the manual removal of 140000m3ofsandfromKirraBeachin2009
InDecember2013KirraPointgroynewasextendedby30mby theCityofGoldCoast with the expectation that the beach bar would move seaward as a consequence At present theKirraPointgroyneestension in2013isunlikelytohavehadamajor impact onthearealextentofKirraReef
Thereefhasbeenrelativelystablesince2013withminor(lt5)changesintheamount of reefexposed Nonetheless thearealextentofKirraReef remains less than50of the extent recorded in 1962 and in 1995 before the TRESBP began In 2015 the reef comprisesthenorthernsectionandapartof theeasternsectionof thereefasrecorded pre`TRESBP(allthesouthernsectionofthereefremainsburied)
ChangestotheEcologicalConditionofKirraReef
The Projectrsquos EIS did not consider the ecological consequences of the reduced areal extentofreefalhabitatandincreasedwaveenergy(aconsequenceofdecreaseddepth) thatwouldoccurasaresultoftheaccretionofsandaroundKirraReefHoweverasthe TRESBPbettermimicednaturalpatternsofsandtransportsince2009theEISpredicted that the reefrsquos benthic floral and faunal assemblages would return to the conditions exhibitedpriortotheextensionoftheTweedRivertrainingwallsinthemid1960s
Sincemonitoringcommenced thegreatestchangeto the floralandfaunalassemblages of Kirra Reef has been due to the loss of reefal habitat In addition to a reduction in overall abundance of taxa the redistribution of sand mediated through complex interactions between physical disturbance (associated with wave action suspended sedimentssedimentdepositionandburial)foodavailabilityandcompetitionhasresulted inavarietyofsmall`scalechangestothedistributionandabundanceofthereefrsquosbenthic assemblages
InApril2014andMarch2015thediversityofassemblageshadincreasedrelativetoJuly 2012as had thecoverof macroalgae (though it remained well below the peakof 60 coverrecordedinJanuary2001)Thisismostlikelyduetonaturalsuccessionwithmore mature communities being established between 2012 and 2015 when the extent of exposedrockwasrelativelystableNeverthelessthebenthicassemblageonKirraReef
TRESBPKirraReefMarineBiotaMonitoring2015 ii
frc environmental
exhibited signs of ongoing stress from physical disturbance such as storm and wave disturbancephysicalabrasionandburialbysandRincludinglowpercentagecoverofhard coralandsoftcoralThisisconsideredessentiallynaturalandcharacteristicofshallow inshorereefsChronicphysicaldisturbancekeepsthebenthicassemblagesofKirraReef inastateofearlysuccession Thediversity(and insomecasesabundnace)ofareefrsquos benthic assemblage is predicted to increase where the extent of reef remains stable or increases and where the frequency and severity of storm conditions are less than the long`term average This was evident in 2014 and 2015 with a relative high cover of spongesandascidians
InMarch2015amorediverseassemblageoffishwasfoundonKirraReefthanonPalm Beach Reef As fish are mobile they can move more easily to areas that are less disturbed or that exhibit more suitable conditions While the composition of the assemblagedifferedfromprevioussurveyeventsthedifferencesweremorelikelydueto the effects of seasonal changes in water temperature and the effects of prevailing conditions at the time of the survey rather than any substantial effect of the bypassing project
Despite some impacts from the TRESBP (with sand covering much of the reef area) overall the composition of the flora and fauna assemblages on Kirra Reef were more similar to that found at nearby Palm Beach Reef than in previous years Kirra Reef therefore continues to provide habitat to a range of flora and fauna and provides important marine ecological functions and services in the region It is possible that as sandlevelshavestabilisedoverthepastthreeyearsassemblagesareslowlybeginning tobecomemoresimilartothoserecordedpriortoimplementationoftheTRESBPandto thoseatnearbyPalmBeachReef
ImpactsofStormsampSeasonalityonKirraReef
The large quantities of sand that were initially delivered by the project caused a substantialshallowingofthenear`shoreareaaroundthereefThisincreaseinbedlevels wasresponsibleforcoveringasubstatialamountofthereefandsubsequentlyincreasing the incidenceof wavedisturbance and sand scouringaround the reef which negatively impactedthebenthicfaunaandflora
As the delivery of sand through the bypassing system now more closely matches the naturalrateofnorthernlongshoresandtransportshort`termandseasonalchangesinthe areal extent of the reef are more likely the result of natural processes than a discrete impactof thesandbypassingactivity Short`term fluctuations that result fromstormsor changesinthecoastalsandsupplywouldhavebeenacomponentofthenaturalrangeof ecologicalconditionsobservedpriortotheextensionofthetrainingwalls
TRESBPKirraReefMarineBiotaMonitoring2015 iii
frc environmental
Thereappearstobearelationshipbetweentheareaandordistributionofrockexposed andstormeventsatKirraReefNotablyaseriesofstormsin2009andstormyconditions between late 2011 and 2012 correspond to large areas of rock becoming exposed Furtherstormsinearly2013correspondstoaclearchangeinthedistributionofrockat Kirra Reef Since 2013 storm conditions have been calm to moderate and there has beenlittlechangeinthearealextentanddistrubtionofexposedrockatKirraReef
Thecloseproximityofthereeftothecoastcontinuestosubjectthebenthicassemblages tosandabrasionwavedisturbanceandsandsmotheringGreaterbalancebetween the deliveryofsandthroughtheprojectandthenaturalmovementofsandonandoffshoreis likely to result inbetterecologicaloutcomes for thebenthicassemblages foundonKirra Reefandgreaterconsistencyintheextentofreefhabitatthatisuncovered
frcenvironmental expect that the area of reef uncovered will continue to change due to seasonal shifts in sand delivery and stormsR however the diversity of flora and fauna assemblagesonKirraReefshouldincreasegraduallyovertimeespeciallyiftheextentof the rocky reef that remains uncovered is consistent andor increases over time to become moresimilarwith that foundprior to the extension of the trainingwalls In this scenario itwasexpectedthat thatnewlyexposedareasofKirraReef in2012thatwere dominated by turf algae would be colonised by other organisms including macroalgae spongesascidiansandpotentiallyhardandsoftcoralovertimeTheresultsfrom2014 and2015indicatethatthisprocessisslowlyoccurringonKirraReef
The change in areal extent between 2014 and 2015 was approximately 85 in the northern section of Kirra Reef A small area of the eastern section of Kirra Reef also became exposed between 2014 and 2015 Ongoing monitoring will provide insight into therateoflsquorecoveryrsquoofcommunitiesHowevergiventhesmallchangeinarealextentof KirraReefandrealtivelysimilarfloraandfaunacommunitiessurveyedin2014and2015 monitoringcouldbereducedtobiannuallyIfmonitoringisreducedasubstantialchange (eg 15) in the extent of the exposed reef should be used to triggered annual monitoring
TRESBPKirraReefMarineBiotaMonitoring2015 iv
frc environmental
1 Introduction
frcenvironmentalwascommissionedbytheNewSouthWalesGovernmentDepartment ofPrimary IndustriesLandsR and theQueenslandGovernmentDepartmentofScience Information Technology and Innovation on behalf of the Tweed River Entrance Sand BypassingProject(TRESBP)tomonitortheconditionabundanceandbiodiversityoffloral and faunal communities at Kirra Reef This report presents results of the survey of benthicfloramacro`invertebratefaunaandfishatsitesonKirraReefandatcomparative sitesonPalmBeachReefinMarch2015
The current condition of Kirra Reef was compared with the current condition of nearby Palm Beach Reef and with changes to the Kirra Reef community over time ie with previousassessmentsofKirraReefundertaken in199519962001200320042005 20102012and2014(frcenvironmental2014)
The TRESBP was established in 1995 as a joint initiative of the NSW and Queensland GovernmentstoimproveandmaintainnavigationconditionsattheTweedRiverentrance andtoprovideacontinuingsupplyofsandtothesouthernGoldCoastbeachesconsistent withthenaturalrateoflongshoredriftTheprojectwascarriedoutintwostages
sdot Stage2Implementation of a sand bypassing system to maintain the improvementsachievedduringStage1(fromMay2001onwards)
DuringStage1approximatelythreemillioncubicmetres(m3)ofcleanmarinesand(with lessthan3fines)weredredgedfromtheTweedRiverentranceMostofthedredging materialwasdeliveredout to`10mmeanwaterdepthfromPointDangertoNorthKirra withapproximately600000m3ofcleanmarinesandbeingplacedontheupperbeaches fromRainbowBaytoNorthKirraFromApril2000toFebruary2001additionaldredging activities were undertaken to maintain a clear navigation channel at the Tweed River entrance Prior to the establishment of the permanent sand bypassing system a further 480000m3of clean marine sandwas placed innear`shore areas from PointDanger to CoolangattaBeach
Stage2commissioning trialscommenced in March 2001 and full scale operationof the sand bypassing system commenced in May 2001 Since this time approximately 70millionm3ofpumpedsandand14millionm3ofdredgedsand(derivedfromdredging
TRESBPKirraReefMarineBiotaMonitoring2015 1
frc environmental
oftheTweedRivermouth)havebeendepositedalongthesouthernGoldCoastbeaches Mostofthesanddeliveredthroughpumpinganddredginghasbeenplacedintheprimary placementareasoutheastofSnapperRocks Sand isalsodischarged fromoutletsat Duranbah Beach and occasionally at Snapper Rocks West There is an outlet at Kirra BeachRhowever thishasnotbeenusedsinceDecember2003 Aplacementexclusion zone has been established around Kirra Reef extending a minimum of 100m from the reefedge(1995extent)topreventdirectplacementofsandincloseproximitytothereef (Lawsonetal2001)
sdot provide much needed sand nourishment to the severely eroded southern Gold Coastbeaches
sdot reducetheTweedEntranceBarand
sdot clear a sand trap in the vicinity of the jetty to improve the efficiently of the sand bypasssystem
These project objectives were achieved and the quantity of sand delivered since 2008 has been more consistent with the natural quantity of sand movement along the coast (average natural net longshore sand drfit is estimated to be 500000m3 per year in a northward direction) In 2014 a total of 450232m3 was pumped through the sand bypassing system to the primary placement area at Danger Point From January to February2015anadditional105119m3ofsandwaspumpedthroughthesystem
In 2009 the Queensland government removed approximately 140000m3 of sand from KirraBeachintertidalzonetothelowprofilebackdunesIn2013theCityofGoldCoast extendedKirragroyneby30m
12 HistoricalContextforKirraReefMonitoring
Kirra Reef is the collective name given to the complex of rocky outcrops located a few hundredmetresoffshoreofKirraBeachatbetween`3and`10mandwithintheinfluence
TRESBPKirraReefMarineBiotaMonitoring2015 2
frc environmental
of wave action It is subject to naturally shifting sands that intermittently cover and uncover the reefrsquos rocky outcrops (TRESBP 2015a) The exposed extent of Kirra Reef hasvariedoverthepast50yearsduetonaturalstormeventsandchangestothecoastal environmentsuchastheextensionoftheTweedRivertrainingwallsinthemid`1960sand commencementoftheTRESBP(TRESBP2015a)Therearethreemajoroutcropsofthe reefthenorthernsouthernandeasternsectionswhichhavebeenvariouslyexposedin thepast(refertoTable11andFigure11)
MonitoringofKirraReef is requiredunderaproject`specificEnvironmentalManagement System (EMS) prepared by the TRESBP in February 20011 Under EMS SubgtPlan B14 KirraReefManagementPlaniftheareaofexposedreefonaerialphotographsissmaller thantherangeofareasshownonaerialphotographsfrom1962to1965thenmonitoring ofthemarinebiotaofKirraReefisrequired
frcenvironmentalcompletedabaselineassessmentofKirraReefinAprilandJune1995 (FisheriesResearchConsultants1995a)(FisheriesResearchConsultants1995b)andhas undertaken nine subsequent ecological monitoring surveys of the reef on behalf of TRESBP in February 1996 January 2001 May 2003 March 2004 February 2005 February 2010 July 2012 April 2014 (Fisheries Research Consultants 1996R frc environmental2001R2003R2004R2005R2010)andthecurrentsurveyinMarch2015
13 TemporalChangesintheAreaofExposedReef
AreductionintheexposedextentofKirraReefwaspredictedintheprojectrsquosEIS(Hyder Consulting 1997) It was also expected that Kirra Reef would return to pre`1960rsquos conditions before the extension of the Tweed River breakwaters that interrupted the northerlymovementofsandwereconstructed(Lawsonetal2001)
Prior to 1960 Kirra Reef was partially covered by sand which varied naturally with the naturalsupplyofsandandwaveenergyDuringthe1960rsquosfollowingtheextensionofthe Tweed River training walls between 1962 and 1965 Kirra Reef became increasingly exposed due to the depleted sand supply (note the increase in area of Kirra Reef from 1962 to1972 inTable11) Following theKirraPointgroynecontruction in1972 there was further depletion of sand supply and Kirra Reef was perennially exposed (note the increaseinareaofKirraReeffrom1972to1995inTable11RrefertoFigure11forthe extentofreefin1995)Kirrareefgroynewasshortened(from175mto145m)in1996
1 The ongoing reef monitoring also incorporates additional monitoring activities implemented by the
TRESBPinAugust2004
TRESBPKirraReefMarineBiotaMonitoring2015 3
frc environmental
AccumulationofsandonKirraReefwasobservedasaresultofindirectsandnourishment bytheTRESBP(notethedecreaseinareaofKirraReefafter1995inTable11)Aerial photographs taken in 2003 and 2004 showed the reef to be of significantly less extent than the range of extent observed in 1962 and 1965 (Table 11) Loss of reef area continuedforsomeyearsandbyearly2006theareaofexposedreefhadbeenreduced to lt100m2 There was a substantial lag between the reduction in sand delivery and transportof thesand furthernorthdue toaperiodofcalmer thanusualconditionswith reducedstormactivityfromthenorth`eastAssuchdispersionofsandfromKirraBeach andreductioninthesandlevelsaroundthereefbetween2005and2009wasslowerthan predicted (refer to Figure 11 for the extent of reef in 2009) As a consequence of the extensiveburialofthereefsimplevisualinspectionsofthereefwereundertakeninplace offullecologicalsurveysbetween2006and20102
In2009eightyearsaftertheinitiationofsandpumpingbytheTRESBPbeganaseriesof storms shifted approximately 200000 m3 of sand from Kirra Beach to the north This storm was the worst protracted storm for east facing beahes in at least 14 years with significant wave heights remaining for four days (TRESBP 2014) This along with the removalofapproximately140000m3ofsandfromtheKirraBeachintertidalzoneagain uncoveredpartsofKirraReef (TRESBP2015a) Since2008sanddeliveryvolumesof the TRESBP have been more consistent with the natural quantity of sand movement alongthecoastEcologicalsurveysrecommencedin2010astheexposedareasofKirra Reefincreasedinextent
Between November 2011 and August 2012 there was a large increase in the northern section of Kirra Reef when the area of exposed rock more than doubled (Table 11R Figure11) This corresponds to a lsquostormy yearrsquowith one severe storm and twomajor storms recorded (TRESBP 2015b) Further stormy conditions were recorded in early 2013withoneextremestorm(approximately110yearevent)inJanuaryandonemajor storminFebruary(TRESBP2015)Therewaslittlechangeinthetotalareaofexposed reefduring this time (note thesimilarareaofAugust2012andMay2013 inTable11) Howevertherewascleardistributionchangesintheareasofexposedrock(Figure11) Thereefareahasremainedrelativelystablesince2013withminorchangesintheareaof rock exposed (Table 11R Figure 11) Wave height data since 2013 indicates calm to moderate conditions with only minor storms recorded except in May 2015 when there wasaseverestorm(TRESBP2015)Inlate2013KirraPointgroynewasreinstatedby 30mtoitsorginalconstructedlengthGiventheminorchangesintheexposedrocksince
2 Underwater visual inspections were completed by Gilbert Diving and Gold Coast City Council from
In2014KirraReefcoveredanareaof2920m2Rpredominantlyinthenorthernsectionof thereefInMarch2015thisnorthernsectioncoveredanareaofapproximately2672m2 (Figure11andFigure12)an85decreaseintheexposedextentbetween2014and 2015 In March 2015 the rocky outcrops were typically between 1 and 2m above the cleanmobilesandwithseveraloutcropsextendingtomorethan2mabovethesandA small section (116m2) of the eastern reef wasalsoexposed inMarch 2015 (Figure 11 andFigure12)Howeverthereefarearemainslessthan50oftheextentrecordedin 1962and1995beforetheTRESBPbegan(Table11Rreefareabetween1962and1965 was between 7000 and 13300 Department of Land and Water Conservation photogrammetricanalysis)
TRESBPKirraReefMarineBiotaMonitoring2015 5
frc environmental
Table11 ApproximateexposedextentofKirraReef
Area(m2) Date SourceofImage
NorthernSection SouthernSection EasternSection Total
The southeast Queensland (SEQ) region comprises five subregions the Gold Coast Inner Moreton Bay Outer Moreton Bay Sunshine Coast and Fraser Coast Coral communities within SEQ are diverse with an extensive range of coral growth forms (Harrison et al 1998) The greatest diversity of coral species are typically found at offshoresites likeFlindersReefswhere119differentcoralspecieshavebeen recorded (Harrisonetal1998)
Subtidal rocky reefs of the Gold Coast region comprise remnants of highly eroded volcanic substratum isolated by wide variable expanses of soft sediment (Edwards amp Smith 2005) They support community assemblages that are indicative of a transition between the tropical waters of the Great Barrier Reef and the temperate waters characteristicofthemidNewSouthWalescoast(Done1982XCannonetal1987)
GoldCoastreefcommunitiesarebroadlysimilartoareasofcomparabletopographytothe north(InnerGneeringsoffshorefromMooloolabaandoffshoreofMoretonBay)andtothe south (Julian Rocks offshore of Byron Bay) that are dominated by macroalgae and sessile invertbrates(FisheriesResearchConsultants1991XHarriottetal1999XEdwards amp Smith 2005X Baronio amp Butcher 2008X Fellegara 2008X SchlacherHoenlinger et al 2009)ManyoftheGoldCoastsreefslocatedclosetoshoreareoftenaffectedbyhuman activities (Noriega 2007)and typicallyhave lesscoralcover Ina2013surveyofSEQ reefsGoldCoastreefshadthelowesthardcoralcoverat9(Hutchinsonetal2013)
Fish of the Gold Coast region are similar in community composition to that recorded offshore of Moreton Bay at Julian Rocks and the Solitary Islands offshore of Coffs Harbourandtoa lesserextentat theexHMASBrisbanenearMooloolaba(Robinsonamp Pollard 1982X Parker 1995X Parker 1999X Edwards amp Smith 2005X Malcolm et al 2009X SchlacherHoenlingeretal2009) The smaller inshore reefsof theGoldCoast region suchasKirraReeftypicallysupportalowerabundanceanddiversityoffishes(Edwards ampSmith2005Xfrcenvironmental2005)
Kirra$Reef$
ThebenthicassemblagesofKirraReefarecharacterisedbyahighcoverofmacroalgae andturfalgaeandamoderatecoverofsessilebenthicinvertebratesincludingafewhard corals(EdwardsampSmith2005Xfrcenvironmental2005)Turfalagecoversthemajorityof the reef substrate Crinoids (feather stars) ascidians (sea squirts) and sponges are typically themostabundantbenthic faunawhilstanemonessoftcoralsandurchinsare present in low numbers (frc environmental 2014) The composition of benthic assemblagesatKirraReef isbroadlysimilar to thatdescribed fromadjacent rockyreefs
Exposuretowaveactionsandscouringandsmotheringareimportantfactorsinfluencing the distribution and abundance of sessile species on rocky reefs (Kay amp Keough 1981X McGuinness1987)ChangeintheheightofsandaroundthebaseofKirraReefappears to be a major factor influencing the abundance (cover) of benthic flora and fauna periodically resulting in a bare stratum on rocks within 08 to 1m of the seafloor Outcropsontheeasternsectionof thereefcomplexwherewaveactionand likelysand abrasion are greatest have historically supported a lower abundance of benthic fauna than outcrops on the northern section (Fisheries Research Consultants 1995a)X (Fisheries Research Consultants 1995b)X (Fisheries Research Consultants 1996)X (frc environmental 2003)X (frc environmental 2004)X (frc environmental 2005)X (frc environmental2010)
Strong wave action results in sustained abrasion of the dominant brown macroalgae (Sargassum(flavicans(andEcklonia( radiata)causing the fronds tobreak Thecontinual resuspensionofalgal fragments(commonlyreferredtoas lsquocornflakesrsquo)candramatically reducewaterclarityandvisibility Algal fragmentswere largelyabsent inJuly2012and April2014surveyslikelyduetolongperiodsofrelativelybenignseaconditionsInMarch 2015amoderateamountofalgalfragmentswasobservedlikelyduetostormactivityin theweeksproceedingthesurvey(egmoderateseas11to14Februaryandminorstorm over1922February)
RecentsurveysatPalmBeachReefcompletedbyReefCheckrecordedadeclineinhard coralcover from2008to2013(Hutchinsonetal2013) Sessile invertebrates including spongescoralsandascidianstypicallydominatethebenthicassemblageofPalmBeach Reef(EdwardsampSmith2005X frcenvironmental2005XReefCheck2010) Thecoverof sessileinvertebrateshashistoricallybeensimilartothatrecordedfromtheoutersections of Kirra Reef However the cover of macroalgae has consistently been loweron Palm BeachReefthanonKirraReefTheproximityofPalmBeachReeftotwocreekmouths andtheabsenceofstrongcurrentsintheareatypicallyresultsinahighlevelofturbidity Elevated turbidity together with greater water depth and a high abundance of grazing
TRESBPKirraReefMarineBiotaMonitoring2015 10
frc environmental
speciessuchasurchinsislikelytocontributetoarelativelylowcoverofmacroalgaeand abundant suspension feeding organisms such as ascidians sponges hydrozoans and crinoidsatPalmBeachReef(Smithetal2005)
PalmBeachhasa lowerabundanceanddiversityof benthicdemersaland pelagic fish comparedtoKirraReef(Smithetal2005)ThegreaterdensityoffishatKirraReefmay beaconsequenceof the lossof reef forcingmore fish intoasmallerarea (Smithetal 2005)PalmbeachrecordedaslightlylowerdiversityoffishthanKirraReefin2012and 2014surveys(frcenvironmental2012Xfrcenvironmental2014)
TRESBPKirraReefMarineBiotaMonitoring2015 11
frc environmental
2$ Methods$
The methods used in the March 2015 survey were developed for the Stage I survey completed in April and June 1995 and used for subsequent surveys February 1996 January 2001 May 2003 March 2004 February 2005 February 2010 July 2012 and April2014 Datawere collected from KirraReef (2816251535309) andPalmBeach Reef(2810751534774)locatedapproximately9kmnorth(Figure21)
Themainobjectiveof the monitoring was to investigateanychange in the marinebiota and habitat of Kirra Reef compared to Palm Beach Reef (comparative reef) in order to assesstheeffectofthesandbypassproject(andsubsequentincreasesinsandload)on theecologyofKirraReef
0 2 41
Kilometres
Service Layer Credits Sources Esri HERE DeLorme Intermap increment P Corp GEBCO USGS FAO NPS NRCAN GeoBase IGN Kadaster NL Ordnance
0 2 41
Kilometres
Service Layer Credits Sources Esri HERE DeLorme Intermap increment P Corp GEBCO USGS FAO NPS NRCAN GeoBase IGN Kadaster NL Ordnance
Threesites(KRN1KRN2KRO3)atKirraReef(waterdepth5to8m)weresurveyedin March 2015 (Map 1) The remainder of the sites previously surveyed were covered by sand(refertoappendixAforahistoryofsitespreviouslysurveyed)Threecomparative sites (PB1 PB2 and PB3) were also surveyed at Palm Beach Reef (water depth 12 to 17m)(Map2)
TRESBPKirraReefMarineBiotaMonitoring2015 12
orth NetreStkicrraG
Marine Parade
t eertS ickr
M rarin ae Pa Grade
Musgrave St
t
re ee e Powel t r lt CrescenS t t es eel ri tM S
t ee ge drt u tleS d Rro MuL sgrave Street
LEGEND 0 1 Km Tweed River E ntrance Sand Bypassing Project Survey Site Road Network
copy Copyright Commonwealth of Australia (Geoscience Australia) 2001 2004 2006copy The State of Queensland (Department of Natural Resources and Mines) 2015copy Nearmap 2014
DATE2015-03-24
DRAWN BYCF
VERSION01
PROJECTIONCoordinate System GDA 1994 MGA Zone 56Projection Transverse MercatorDatum GDA 1994
plusmn SCALE
0 50 100 200
Metres
Scale 15000 A3
Gold Coast Highway
i
PalmBeach
Tugun
Coolangatta
0 1 Km
frc environmental
22$ Benthic$Flora$and$Macroinvertebrates$
At each site benthic assemblages were surveyed in fifteen 025m2 quadrats with the percentcoverofbenthicmacroalgaeturfalgaespongesascidianshardcoralsandsoft coralsassessedvisually(Figure22)Quadratswereplacedhaphazardlywhichincluded horizontal and sloping surfaces The minimum distance between quadrats was approximately2m Thenumberof largeascidians (Pyurastolonifera)crinoids (feather stars)barnaclesurchinstubewormspolychaeteshydroidszoanthidsandcowriesand the dominant species of macroalgae were also recorded and quantitative notes were madeontheapparenthealthofeachtaxonomicgroup
ThespeciesrichnessandrelativeabundanceoffishatKirraReefandPalmBeachReef were assessed using a combination of underwater visual census (UVC) and video surveys The combination of these techniques represents the most costeffective and efficientmeansofobtainingdataonthestructureoffishassemblagesindifferenthabitats (Murphy amp Jenkins 2010) A baited remote underwater video (BRUVX baited with pilchards) and footage captured by a diver swimming hapazard trasects over the reef wererecorded
Video footage from each BRUV (approximately 20minutes) and video transects (approximately 35 minutes) was reviewed by an ecologist experienced in marine fish identification
24$ Data$Analysis$
Permutational multivariate analysis of variance (PERMANOVA) was used to determine differences in the composition (cover of benthic fauna and taxonomic group) of benthic assemblagesbetweenKirraReefandPalmBeachReefover time PERMANOVAuses permutational methods (PsuedoAF) to derive statistical significance which require fewer assumptionstobemetthananalogousmethodssuchasmultivariateanalysisofvariance (MANOVA) (Anderson 2001X Anderson et al 2008) This analysis enables an examinationofchangesinthecommunityasawhole
A three factor PERMANOVA was used to examine differences in the composition of benthic assemblages with survey (fixed factor) locations (Palm Beach Reef and Kirra Reeffixedfactor)andsites(nestedinlocationsasarandomfactor)asthefactorsData weresquareroot transformedtodownweightdominatingspeciesabundanceXconverted toaBrayCurtisdistancematrixXandtestedforsignificanceusingasmanypermutations as allowed (9800 to 9937 unique permuations achieved for all factors and factor combinationsXexceptlocationwhere10uniquepermutationswereachieved))Posthoc pairwisetestwasusedtodeterminethemagnitudeofdifference
Nonmetricmultidimensionalscaling (nMDS)ordinationswereused tovisually represent the variation in the composition of assemblages between reefs separately for each survey nMDS ordinations were also used to visually represent the variation in the compositionofassemblagessurveysatKirraReefforallsurveysXbaselinesurveyinApril 1995andMarch2015XandApril2014andMarch2015
Separate univariate PERMANOVAs were used to compare differences in the cover of macroalgae turf algae and the abundance of crinoids and ascidians Data were
TRESBPKirraReefMarineBiotaMonitoring2015 16
frc environmental
converted to a eucildean distances matrixX and tested for significance using as many permutations as allowed (998 to 999 unique permuations achieved for all factors and factor combinationsX except location where 10 unique permutations were achieved) Factors were survey (fixed factor) locations (Palm Beach Reef and Kirra Reef fixed factor)andsites (nested in locationsanda random factor) Posthoc pairwise testwas used to determine the magnitude of difference Monte Carlo procedures were used to calculateempiricalPvaluesforthesurveyxlocationtest
Further information on the use and interpretation of PERMANOVA and other analyses usedinthisreportisprovidedinAppendixB
TRESBPKirraReefMarineBiotaMonitoring2015 17
frc environmental
3$ Results$
31$ Cover$of$Benthic$Assemblages$
The composition of benthic fauna and flora ( cover and type combined Appendix C) variedbetweenmostsitesatbothKirraReefandPalmBeachReefandbetweennearly allsurveysateachsite(notethesignificantinteractionofsite(location)xsurveyinTable 31X Appendix D) Nevertheless there appeared to be substantial differences in the compositionofthebenthicassemblagesbetweenthetworeefsineachsurveyfrom1995 to2015(Figure31toFigure33)
In2015 therewassomeoverlap in thecompositionofassemblagesonKirraandPalm Beach Reefs (Figure 33) However there was also some clear patterns of difference including
Benthic assemblages at Kirra Reef appeared to show some overlap between surveys (Figure34H) HowevernearlyallsurveysweredifferentateachsiteatbothKirraReef andPalmBeachReef(AppendixD)BenthicassemblagesinMarch2015andApril2014 wereverysimilarcomparedtobenthicassemblages inthebaselinesurvey inApril1995 andMarch2015(notethegreateroverlapinFigure35comparedtoFigure36)
In March 2015 as in previous surveys the macroalgae Sargassum sp dominated the benthic assemblages at all sites at Kirra Reef (Figure 37) Other species present included
sdot Dictyopteris0arostichoides0
sdot Dilophus0intermedius00
sdot Zonariasp
sdot Laurencia0brongniartic0
sdot Amphiroa0anceps0
sdot Caulerpa0lentilliferaand
sdot Halimeda0discoideaand
sdot Macrocystissp
Juvenile kelp (from the genus Macrocystis) was also emerging on some areas of Kirra Reef
ThecoverofmacroalagevariedbetweensitesandsurveysatbothKirraReefandPalm Beach Reef with the magnitude of difference varying over time (note the significant interaction between site (location) x survey in Table 32) Macroalgae cover varied between surveys with 2001 being the most different to the other years (Appendix D) ThereweredifferencesbetweensitesatKirraReefinJune1995February1996January 2001 May 2003 February 2005 and February 2010 and between sites at Palm Beach ReefinJanuary2001andFebruary2010Inrecentsurveys(2012to2015)thecoverof macroalgaeatsitesatbothKirraReefandPalmBeachReefwassimilar (AppendixD) indicatingarelativelyconsistentdistributionacrossbothreefs
ThemeancoverofmacroalgaeatKirraReefhasdeclinedsinceitspeakin2001withthe greatest magnitude of decline recorded between January 2001 and May 2003 (Figure 38)InsurveysbetweenJune1995andMay2003Sargassumspformeddensecarpets overtherockysubstratecoveringupto58oftheavailablesurfaceareaofthereefIn February 2010 macroalgal cover was 12 Macroalgal cover has increased to 26 in March2015ThisissimilartothecoverrecordedinApril1995(23cover)(Figure38)
In2015nomacroalgaewasrecordedwithinthequadratsatPalmBeachReefThecover of macroalgae on Palm Beach Reef has been consistently lower than Kirra Reef since
TRESBPKirraReefMarineBiotaMonitoring2015 26
frc environmental
ecologicalmonitoringbegan typically lessthan5of theavailablesurfacearea(Figure 38)
The mean cover of turf algae varied between sites and surveys at both Kirra Reef and PalmBeachReef(notethesignificantinteractionbetweensite(location)xsurveyinTable 33)SpecificallythereweresignificantdifferencesbetweensitesatbothKirraReefand PalmBeachReefinJune1995January2001February2010July2012andApril2014 (aswellasbetweensitesinFebruary1996atKirraReef)Thecoverofturfalgaevaried betweenmostsurveysatallsitesateachreef(AppendixD)BothKirraandPalmBeach reefs showed major increases in the percent cover of turf algae from 2010 to 2012 followedbyadecreaseincoverbetween2012and2014(Figure310)Thecoverofturf algae is typically lower at Kirra Reef than at Palm Beach Reef (July 2012 being an exception) and was again slightly lower at Kirra Reef in March 2015 (Table 310) In March2015turfalgaewasmoreprevalentatKirraReefthanduringthebaselinesurvey ofApril1995
ThemeancoverofspongesatsomesitesatbothKirraReefandPalmBeachReefhas varied significantly during some surveys (note the significant interaction between site (location)xsurvey inTable34HFigure311) However thecoverofspongestendedto bemore temporallyvariable atKirraReef than at Palm Beach Reef (Figure312) The cover of sponges at Kirra Reef varied between sites in February 1996 January 2001 March2004July2012andApril2014 However thecoverofspongesatPalmBeach Reefonlyvariedbetweensites inJanuary2001andFebruary2010 (AppendixD) The cover of sponges varied between survey at each site with 1995 1996 and 2001 most differenttootheryears(AppendixD)
ThemeancoverofspongesatKirraReefdeclinedbetweenMarch2004(20cover)and February 2010 (less than 1 cover) Since 2010 the cover of sponges has increased slightly with sponges covering 8 of the reef in March 2015 (Figure 312) In March 2015thecoverofspongeswashigherthanrecordedduringthebaselinesurveyinApril 1995(3cover)(Figure312)
Figure312 Mean cover of sponges (plusmnSE) at Kirra Reef and Palm Beach Reef on all
surveys
Table34 Univariate PERMANOVA results for differences in the cover of sponges betweensurveysandlocations
Factor$ df$ MS$effect$ PseudoF$ p$(perm)$
survey 10 18576 276 0018
location 1 39671 589 0210
site(location) 4 67354 477 0001
locationxsurvey 10 1490 221 0032
site(location)xsurvey 40 67331 477 0001
error 924 14108
Shadingdenotessignificanceatplt005
TRESBPKirraReefMarineBiotaMonitoring2015 32
frc environmental
Ascidians$
ThemeanabundanceofallascidiansotherthanPyura0stoloniferahasvariedsignifcantly between sites at Kirra Reef and Palm Beach Reef and between surveys at each site (Figure314andnotethesignificantinteractionbetweensite(location)xsurveyinTable 35) The abundance of ascidians was different between sites at Kirra Reef in January 2001May2003March2004February2005andApril2014HanddifferentatPalmBeach ReefinJanuary2001February2005February2010andMarch2015Theabundance ofascidiansvariedbetweensurveysateachsitewith1995beingmostdifferentwhenthe abundanceofascidianswaslow(AppendixD)InMarch2015theabundanceofallother ascidiansonKirraReefandPalmBeachReefwashigherthanpreviouslyreportedinthe baselinesurveyinApril1995(whennoascidianswererecorded)Themeanabundance washigheratKirraReefthanatPalmBeachReef(Figure314)
ThemeanabundanceofPyura0stoloniferahasvariedconsiderablybetweensitesatKirra Reef and Palm Beach Reef over time (note the significant interaction between site (location) x survey in Table 36) In March 2015 the mean abundance (individual per 025m2plusmnSE)of theascidianPstolonifera (Figure313)wassimilaratKirraReefand PalmBeachReef(Figure315)ThemeanabundanceofP0stoloniferahasrangedfrom 02to17individualsper025m2atbothreefssinceMay2003
Figure315 Mean abundance of ascidians (Pyura0 stolonifera) (individuals025m2)
(plusmnSE)atKirraReefandPalmBeachReefinallsurveys
TRESBPKirraReefMarineBiotaMonitoring2015 34
frc environmental
Table35 Univariate PERMANOVA results for the differences in cover of all ascidians otherthanPyura0stolonifera0betweensurveysandlocations
Factor$ df$ MS$effect$ PseudoF$ p$(perm)$
survey 10 26658 474 0001
location 1 13603 710 0104
site(location) 4 19154 149 0212
locationxsurvey 10 2629 468 0001
site(location)xsurvey 40 5621 438 0001
error 924 12828
Shadingdenotessignificanceatplt005
Table36 Univariate PERMANOVA results for the differences in Pyura0 stolonifera densitybetweensurveysandlocations
Factor$ df$ MS$effect$ PseudoF$ p$(perm)$
survey 10 16254 11842 0001
location 1 12445 60881 0206
site(location) 4 20442 56799 0001
locationxsurvey 10 79724 58082 0001
site (location) x 40 13726 38138 0001 survey
error 924 35991
Shadingdenotessignificanceatplt005
$
TRESBPKirraReefMarineBiotaMonitoring2015 35
frc environmental
Hard$Coral$
There was a significant difference between the cover of hard corals at Kirra Reef and PalmBeachReefduringsomesurveys(notethesignificantinteractionbetweenlocationx surveyinTable37)SpecificallytherewassignificantlymorehardcoralatPalmBeach Reef thanKirraReef inFebraury1996March2004April2014andMarch2015(Table 38)
ThecoverofhardcoralistypicallylowonKirraReefaccountingforlessthan2ofthe availablesubstrateInMarch2015hardcoralcoveredlessthan1oftheareaofKirra Reef which was less than the cover recorded during the baseline survey in April 1995 (Figure 316) In contrast hard coral covered 11 of the surface area at Palm Beach ReefwhichwasgreaterthanthecoverrecordedinApril1995(Figure316)
The cover of hard corals at Palm Beach Reef has been more variable over time comparedtothecoverofhardcoralatKirraReef(Figure316)Withtheexceptionofthe surveys inApril1995andJanuary2001when thecoverofhardcoralwas lowonboth reefshardcoralsaretypicallymoreprevalentatPalmBeachReef(Figure316)
Table38 PERMANOVA post hoc pairwise results for the differences in the cover of hardcoralbetweenlocationsineachsurveyevent
Hard$Corals$ Survey$
t$ p$(MC)$a$
Apr1995 054 0606
Jun1995 182 0140
Feb1996 541 0006
Jan2001 R R
May2003 166 0168
Mar2004 765 0001
Feb2005 049 0646
Feb2010 156 0197
Jul2012 283 0053
Apr2014 525 0011
Mar2015 695 0003 Shadingdenotessignificanceatplt005 a pvaluesbasedonMonteCarlotests
TRESBPKirraReefMarineBiotaMonitoring2015 37
60
50
40
30
20
10
0
Soft
Cor
al C
over
()
Kirra Reef Palm Beach Reef
frc environmental
Soft$Coral$
The cover of soft coral was significantly different between sites at both Kirra Reef and PalmBeachReefandduringsomesurveys(notethesignificant interactionbetweensite (location)xsurvey)TherewasnosoftcoralrecordedatKirraReefinMarch2015The coverofsoftcoralhasdeclinedatKirraReefsince2003andhascoveredlessthan2of theavailablesubstratesince2005whichissimilartothecoverofsoftcoraldescribedfor the baseline surveys in 1995 (Figure 317) The cover of soft coral was consistent betweensitesineachsurveyexceptbetweensitesin
sdot April1995atKirraReef
sdot 1996atKirraReef
sdot 2003atPalmBeachReefand
sdot 2014atPalmBeachReef(AppendixD)
Soft corals have historically covered more of the available space on Palm Beach Reef than on Kirra Reef However there was more temporal variability within sites at Palm BeachReefthanatKirraReef(AppendixD)ThecoverofsoftcoralatPalmBeachReef has varied over time and was highest in April 1995 (48 cover) Despite increasing sinceFebruary2005itisstilllowerthanthecoverrecordedduringthebaselinesurveyin April1995(Figure317)
Table39 UnivariatePERMANOVAresults for thedifferences in thecoverofsoft coral betweensurveysandlocations
Factor$ df$ MS$effect$ PseudoF$ p$(perm)$
survey 10 44657 1323 0001
location 1 32922 6620 0117
site(location) 4 49732 266 0036
locationxsurvey 10 40982 1214 0001
site (location) x 40 3376 181 0002 survey
error 924 18688
Shadingdenotessignificanceatplt005
$
TRESBPKirraReefMarineBiotaMonitoring2015 39
frc environmental
Crinoids$
ThereisasignificantdifferencebetweensomesitesatbothKirraReefandParmBeach Reef that varies through time (note the significant interaction between site (location) x survey inTable310) Theabundanceofcrinoidshasbeensimilarbetweensites inall years at Palm Beach ReefH and was different beween sites at Kirra Reef in June 1995 February1996May2003andFebruary2005(AppendixD)Withineachsitetherehas been some natural temporal variability particualrly at Palm Beach Reef sites in 2001 (Appendix D) The mean abundance (individuals 025m2) of crinoids (Figure 318) at KirraReefandPalmBeachReefhasgenerallybeenlessthan2individualsper025m2 andhasdeclinedatboth locationssincethebaselinesurvey inApril1995(Figure319) However the mean abundance of crinoids on Kirra Reef has shown a slight increase sinceFebruary2010(Figure319)
In March 2015 fewer crinoids were recorded at Palm Beach Reef than at Kirra ReefH crinoidshavebeenrareatPalmBeachReefsince2003
The species richness of fish recorded from Kirra Reef across all monitoring events has rangedfrom14to57 InMarch201557specieswereidentifiedat thereefwhichwas similar to April 2014 (53) and higher than previous surveys (Figure 320) Species richnessatPalmBeachReefwas lower(34species)andgenerallyvaried lessbetween surveyscomparedtoKirraReef
InMarch2015 the assemblage of fish at KirraReef comprised species fromall trophic levelsincludingdetritivoresplanktivoresherbivoresandcarnivores(AppendixE)Asin previous surveys the assemblage was dominated by herbivores and planktivores Yellowtail (Trachurus0 novaezelandiae) and striped sea pike (Sphyraena0 obtusata) were the dominant species present in large schools (Figure 321) Australian mado (Atypichthys0 strigatus) ringRtailed surgeon (Acanthurus0 blochii) silver trevally (Pseudocaranx0 georgianus) eastern pomfred (Schuettea0 scalaripinnis) sweep (Scorpis0 lineolatus) and various wrasses were also very abundant releative to other species (AppendixE)
Two new species were observed at Kirra Reef the orangeRband surgeon (Acanthurus0 olivaceus) and the unicornfish (Naso0 sp) Five new species were recorded at Palm BeachReef
No threatened or protected fish species listed under the Queenslandrsquos Nature0 Conservation0Act01992ornationallyundertheEnvironmental0Protection0and0Biodiversity0 Conservation0 Act0 1999 were observed The complete list of species recorded and the relativeabundanceispresentedinAppendixE
TRESBPKirraReefMarineBiotaMonitoring2015 42
60
0
10
20
30
40
50
Num
ber
of F
ish
Spe
cies
Apr-95
Jun-95
Feb-96
Jan-01
May-03
Mar-04
Feb-05
Feb-10
Jul-12
Apr-14
Mar-15
Kirra Reef Palm Beach Reef Location
frc environmental
Figure320 Number of fish species recorded at Kirra Reef and Palm Beach Reef on
ThegreatestchangetotheecologicalconditionofKirraReefsincethebaselinesurveyin 1995 has been the loss of large areas of hard substrate that support benthic flora and faunaThedeliveryoflargesandvolumesduringthestage1dredgingoperations(1995 to1998)andtheinitialoperationofthesandbypasssystem(2001to2008)resultedinan increaseinwaveactionandtidalcurrentsredistributingthissandoverKirraReef
The three major outcrops of Kirra Reef (northern southern and eastern sections) are naturally exposed and covered depending on water and sand movements In March 2015 the rocky outcrops in the northern section of Kirra Reef were exposed and supportedamoderatelydiversebenthicassemblagedominatedbyturfalgaeTherewas arelativelyhighfishdiversityatKirraReefTheecologicalassemblageexhibitedsignsof ongoingstressfromphysicaldisturbanceincludingtheabsenceofsoftcoralsandrarityof hardcoral(MumbyampSteneck2008)HoweverKirraReefhasarelativelyhighcoverof sponges and ascidians Sponges ascidians and crinoids were more abundant at Kirra ReefthanatPalmBeachReefinMarch2015
KirraReefcontinues toprovidehabitatandsupport importantecological functions in the region providing hard substrate for the colonisation of algae and benthic invertebrates and food and refuge for fish As sand levels have stabilised since 2008 assemblages have becomemoresimilar to those recordedprior to implementationof the TRESBP in April1995 Forexamplemacroalgalcover inApril1995andMarch2015wasrelatively similarHoweverassemblagecompositionisstillsignificantlydifferenttothatrecordedin thebaselinesurveysmostnoticeablyduetoa lowercoverofbaresubstrateandhigher coverofturfalgaeandascidianssincesurveyshavebeenperformed
Benthic$Macroalgae$
The cover of macroalgae at Kirra Reef was relatively similar during the 2014 and 2015 surveys and remained well below the peak of nearly 60 cover recorded in January 2001TherewasasteepdeclineinthecoverofmacroalgaebetweenJanuary2001and May2003whichappearedtobestronglyassociatedwith thedecline inreefareaduring that time as well as a decline in the cover of Sargassum sp (an important indicator speciesonKirraReef) SimilardeclineswereevidentatPalmBeachReefbetween the January2001andMay2003surveys
TRESBPKirraReefMarineBiotaMonitoring2015 45
frc environmental
The cover ofmacroalgae at Palm Beach Reef was much lower thanat Kirra Reef over time There are several possible reasons for the lower cover of macroalgae at Palm Beach
sdot PalmBeachReefisdeeperthanKirraReefandgenerallyhashigherturbidityand therefore greater light attenuation The quantity and quality of available light affectsthedistributionandgrowthofmacroalgae(MillerampEtter2008)
sdot Differences in the pattern of recruitment of algal species to the reefs due to differentwatercurrentsandtimingofthesurveys(Kennelly1987b)
sdot Increased competition with turf algae and sessile benthic invertebrates which competeforspacewithmacroalgae(Kennelly1987aHMillerampEtter2008)
sdot PresenceofdifferentspeciesandhigherdensityofherbivoresatPalmBeachReef (particularly sea urchins and herbivorous fish) which graze on macroalgae (McCook1997HJompaampMcCook2002)
Biological assemblages exposed to physical stress typically exhibit greater levels of temporalandspatialvariability(WarwickampClarke1993HChapmanetal1995)Temporal variationinthecoverofmacroalgaeatKirraReefislikelytobeprincipallyduetotheeffect ofphysicaldisturbance fromwaveactionaswellas theassociatedassociatedabrasion andsmotheringbysandTheeffectsofthesephysicaldisturbanceswouldincreasewith thereductionofKirraReefasedgeeffectsarepronouncedandwaterdepth isreduced Increasedsmotheringbysandcanalsoreducediversity(Hatcheretal1989)abundance recruitment growth survival and seasonal regeneration of macroalgae (Umar amp Price 1998HCheshireetal1999)
Changes in the cover of macroalgae on Kirra Reef over time are also likely due to the extentofthereefchangingHthefishandmobileinvertbratesassociatedwiththereefmay have concentrated which would in turn increase grazing pressure Increased grazing pressure from fish and mobile invertebrates can reduce the coverage and diversity of macroalgaeonreefs(McCook1997HJompaampMcCook2002)
Thecoverof turfalgaeatbothKirraReefandPalmBeachReefhasvariedsignificantly betweensurveysPriorto2005turfalgaetypicallycoveredlessoftheavailablesurface areaonKirraReefthanPalmBeachReefInMarch2015themeancoverofturfalgae hasincreasedsincebaselinesurveysin1995andwasrelativelysimilarbetweenreefs(40 plusmn4atKirraReefcomparedto48plusmn4atPalmBeachReef)Thecoverofturfalgaeat Kirra Reef was similar in 2014 and 2015 which was generally higher than previous surveysexceptduringJuly2012whencoverofturfalgaepeakedat67plusmn4
TRESBPKirraReefMarineBiotaMonitoring2015 46
frc environmental
Turfalgaearebecomingadominantcomponentofcommunitiesaroundtheworld likely the result of rapid colonisation of openspace after a disturbance (eg storms) nutrient enrichment andor changes in grazing pressures Turf algae can also reflect a more physically robust growth form suited to high wave energy environments (than foliose macroRalgae)TurfalgaepeakedintheJuly2012surveylikelyrelatedtotheincreasein bare reef exposure following a stormy conditions in early 2009 and between December 2011 and June 2012 Turf algae have been the dominant form of algae on Kirra Reef sincethistimealbeitthecoverlowerthanthe2012survey
Increased cover of turf algae is typically related to good light conditions high concentrationsofnutrientsandlownumbersofgrazerssuchasfish(orconstantgrazing pressure preventing macroalgae colonisation) However the relationship between algal dynamics physical disturbance water quality and herbivore grazing activity is complex andthecoverof turfalgaecanexhibitextremetemporalvariabilityasaconsequenceof the interactionbetween topRdownandbottomRupprocesses (Russ2003HBellwoodetal 2006H Hughes et al 2007H Albert et al 2008H Hoey amp Bellwood 2008H Mumby 2009) Furtherinvestigationwouldberequiredtoreliablydeterminethemechanismsofchangein bothmacroalgaeandturfalgaeassemblagesonthesereefs
Benthic$Macroinvertebrates$
AtKirraReeftheburialandreRemergenceofrockyoutcrops(influencedbytheTRESBP) islikelytohaveincreasedtemporalvariabilityinthedistributionandabundanceofbenthic macroinvertebrates Additional perturbations such as wave action and sand abrasion (each influenced through changes in bathymetry seabed topography and water depth) are likely to have resulted in the decline in cover and diversity of the benthic macroinvertebratesatKirraReefbetweensurveysparticularlybetweenMarch2004and February2005andduringtheseverestormsof2009Benthicmacroinvertebratessuch asascidiansspongeshardcoralandsoftcoralarehighlysusceptible to theeffectsof stormandwavedisturbancephysicalabrasionandburialbysand(KayampKeough1981H Walker et al 2008) which can affect settlement growth rate and survival (Dodge amp Vaisnys1977HRogers1990)
Physical disturbance from sand burial sand abrasion and the action of storm waves appeartokeepthebenthicassemblagesofKirraReefinastateofearlysuccessionItis commonforearlypioneerspeciessuchassomemacroalgaetorecruitrapidlytoahard surface in large numbers allowing these species to dominate assemblages early in the successionaltrajectory(Walkeretal2007)
Afurther indicatorof theearlystateofsuccessionatKirraReef isthatthecoverofhard and soft coral has remained very low (generally lt 5) In March 2015 less than 1
Benthic macroinvertebrate cover may also be affected indirectly through increased competitionwithmacroalgaeforspaceThepresenceoflargemacroalgaecanaffectthe recruitment and survival of sessile benthic invertebrates as fronds moving with wave action sweep and abrade the surface of rocks killing new recruits especially corals (Kennelly1989HMcCooketal2001)Itcantakeseveralyearsforhardandsoftcoralto become dominant on reefs in the SEQ region (SchlacherRHoenlinger et al 2009) Therefore hard coral is not expected to become abundant until several years after the reefhasbeenuncoveredandonlyifthephysicaldisturbanceregimeandsupplyofnew recruitsissufficienttosupportsurvivalandgenerationalsuccessionofthesespeciesThe coverofhardandsoftcoralsatKirraReefwerebothverylowandpatchypriortothestart oftheTRESBP
Sponges and ascidians are highly susceptible to smothering and sand abrasion unless theyhaveathicktunic(outercoveringmadeofkeratin)liketheascidianP0stolonifera0or strong internal keratin silicon or calcareous structures in the case of some species of sponges0(KayampKeough1981HMcGuinness1987HWalkeretal2008)Duetoincreased wave action and sedimentation (which can be influenced by the TRESBP) the mean coverofascidiansandspongeswasexpectedtobemuchloweronKirraReefthanPalm Beach Reef However in March 2015 the cover of sponges was similar between the reefsandthecoverofascidians(otherthanP0stolonifera)wasgreateratKirraReefthan at Palm Beach Reef This suggests that Kirra Reef is slowly recovering from the increasedstressofphysicaldisturbancesuchas increasedwaveactionandsandscour andorthatwaveandstormconditionshavebeenlesssevereinthepastfewyears
Fish$
KirraReefcontinuestosupportahighdiversityofreefRassociatedandpelagic(ienonR reefassociated) fishspecies Despite itsdiminishedsizecompared to1995KirraReef continuestoprovidevaluablehabitatforanumberoffishspeciesfromdifferentfunctional groups
ThereisahighdegreeofinterRannualvariabilityinthespeciesandabundanceofthefish present at Kirra Reef compared with the assemblage at Palm Beach Reef This likely reflectsthetemporalvariabilityintheavailablehabitatasaconsequenceofreefburialand reRemergenceThediversityqualityandarealextentofreefhabitatareimportantfactors influencing the distribution abundance biomass and diversity of reef fish (Bellwood amp Hughes2001HFriedlanderetal2003)Diversityandabundanceoffishcanincreasewith
TRESBPKirraReefMarineBiotaMonitoring2015 48
frc environmental
greaterstructuralcomplexityandincreasedheterogeneityofavailablehabitats(Bellwood ampHughes2001)Thissuggeststhatperiodsofreefburialreducetheoveralldiversityof reefRassociated fish species at Kirra Reef Despite the reduction in overall reef space therewasalargervarietyofhabitats(suchasmarcoalgaeandturfalgae)in2015which was likely to be related to the high diversity of fish assemblages This is particularly importantforseveralspeciesthatdependonthepresenceoflsquostructurersquosuchasprovided by reef habitat (ie oldwife moray eels damselfish and Australian mado that were recordedinMarch2015butwerenotrecordedinJuly2012)
Theabundanceanddiversityof fishare likelytobenegativelyaffectedfollowingperiods of severe weather which create unfavourable conditions for many species and may further exacerbate the affects of abrasion and sedimentation The biomass of fish is knowntodecreasewithincreasingexposuretophysicaldisturbancefromwaveactionand strong currents (Friedlander et al 2003) As our surveys have been undertaken at different times of the year variation in the prevailing conditions at the time of sampling could also influence the types of fish observed (and the amount of reef habitat that is availableatanytime)Manyofthespeciesmayalsobeaffectedbyseasonalchangesin the water temperature such as damselfish which are less abundant in cool waters However theoveralldiversityof the fishassemblageatKirraReef is likely toreflect the sizeoftheoutcropsexposedwithagreaterphysicaldisturbance(fromseaconditionsand sandmovement)andcompetitionHandlesserfoodavailablewhenthereefiscovered
ThepredictedimpactstoKirraReefasaresultoftheTRESBPincludedaccretionofsand around the base of the rock outcrops causing a reduction in extent of reef It was predictedthatsanddeliveryaspartoftheprojectwouldeventuallymimiclsquonaturalrsquopatterns ofsanddispersalandthatthereefwouldreturntoitsnaturalextent(ietheextentpriorto extension of the Tweed River training walls in 1962) The benthic flora and fauna assemblages of the reef the historical reef extent and natural sand transport patterns wereexpectedtoreturntoconditionsobservedbeforetheextensionofthetrainingwalls between 1962 and 1965 However the Environmental Impact Study did not predict the ecologicalconsequencesofboththereducedarealextentandincreasedwaveenergy(a consequenceofdecreaseddepth)thathavebeenrecorded
ThecurrentextentofKirraReef remains less than50of that recorded in1962and in 1995beforethesanddeliverybytheTRESBPcommencedHowevertheextentofreef in1995 wasstrongly influenced by adepletion in sand following the construction of the Tweed River training walls and the Kirra Point groyne Accumulation of sand on Kirra ReefwasobservedtoincreaseasaresultofindirectsandnourishmentbytheTRESBP and the reef has been extensively covered (particuarly between 2005 and 2010) as a result
Whiletheextentofthereefcontinuestochangeovertimethedeliveryofsandaspartof the project now more closely matches the natural rate of longshore sand transport ShortRtermandseasonalchangesintheextentofthereefarenowlikelytobetheresultof waveandcurrentaction(particularlyduringservereweatherevents)thanadirectimpact of the TRESBP Therefore the extent of Kirra Reef in March 2015 is broadly in accordancewithpredictionsmadeintheEISwhichpredictedthatthereefwouldreturnto a condition similar to that exhibited in the preR1960rsquos ie before the extension of the TweedRiverbreakwatersthatinterruptedlittoralsandsupplytothesebeaches
InDecember2013KirraPointgroynewasextendedby30mwiththeexpectationthatthe beach bar would move seaward as a consequence At present Kirra Point groyne is unlikelytohavehadamajorimpactonthearealextentofKirraReefHoweverongoing monitoringbasedonaerialphotographsmayprovidefurtherinsight
Sessile benthic assemblages on Kirra Reef are highly susceptible to the influence of storms and associated wave action (Kay amp Keough 1981H Walker et al 2008) The shallowreefissurroundedbymobilesandwhichcanshiftnaturallyinresponsetowave action during storms causing burial of large sections of Kirra Reef This effect has reduced the availability of rocky substrate for colonisation and the availability of refuge
Fromanexaminationof theextentofKirraReef fromarealmapsandwaveheightdata thereappears tobea relationshipbetween theareaof rockexposedandstormevents Notably in a series of storm events in May 2009 corresponds with large areas of rock becoming exposed (with the reef approximately 100m2 in 2006 and approximately in 1009m2 2009) Further a stormy conditions between December 2011 and July 2012 correspondstotheareaofexposedrockmorethandoublinginsizeWhiletherewasno changetothetotalareaofexposedrockfollowingstormyconditionsinearly2013there wasaclearchangeinthedistibutionofexposedrockduringthistimeSince2013storm conditions have been calm to moderate and there has been little change in the areal extentanddistrubtionofexposedrockatKirraReef
WaveheighttypicallyincreasesduringstormeventsandgiventheshallowdepthofKirra Reef waves are more likely to shoal and break across the reef during storms This increases thephysicaldisturbanceabrasionandsedimentationofbenthicassemblages onKirraReefStormdisturbancecancauselocalreductionsinthespeciesrichnessand abundanceofcoral(Woodleyetal1981HMasselampDone1993HHughes1994HConnellet al 1997) and can alter fish assemblages indirectly through habitat modifications (Kaufman1983HJonesampSyms1998)ordirectlybyincreasingfishmortality(Lassig1983) The hydrodynamic forces produced by wave action are an important source of disturbance in subtidal habitats inflicting damage through direct physical impact and abrasion(UnderwoodampKennelly1990)DirectimpactsfromphysicaldisturbanceatKirra Reefareevidentduringsurveyeventswhenlargefragmentsofmacroalgaearepresentin thewatercolumnoverthereef
Storm and wave action (and associated sedimentation and abrasion) continue to be importantforcesshapingthedistributionandabundanceofbenthicspeciesatKirraReef Increased magnitude and frequency of physical disturbance resulting from increased exposureorsusceptibility tostormsandassociatedwaveaction (asonKirraReef)can lead to a decrease in the diversity of sessile invertebrate assemblages DisturbanceR drivenreductionsinbiodiversityhavethepotentialtoimpactnegativelyonthehealthand productivity of reef ecosystems (Walker et al 2008) Biodiversity is important to reef health given that many of these species (eg sponges bryozoans and ascidians) contribute a range of vital ecosystem services to reefs including nutrient cycling (Scheffers et al 2004) trophic interactions and food webs (Lesser 2006H Pawlik et al 2007) bioRerosion (Rutzler 2002H LopezRVictoria et al 2006) and stabilizing substrata (DiazampRutzler2001HWulff2001)
Theimpactsof increasedwaveactionandsedimentationonthebenthicassemblagesat Kirra Reef are likely to be greatest during and immediately following storm conditions
TRESBPKirraReefMarineBiotaMonitoring2015 51
frc environmental
Partitioningtheinfluenceofstormandwavedrivendisturbancefromthatoftheoperation oftheTRESBPwouldrequireamuchmorestatisticallypowerfulandtemporilyreplicated experimental design Given there is a large collection of wave and storm data by TRESBP this would involve greater temporal sampling of Kirra Reef including event samplingfollowingseverewaveandstormactivity
The data generated by this Kirra Reef biota monitoring program doesnrsquot support statistically rigorous consideration of seasonality (monitoring has been at its most frequentannual)
InApril2014andMarch2015KirraReefcoveredlessthan50ofthereefrsquosextentprior to theoperationof theTRESBP The lossof reefhabitathasreducedtheavailabilityof hard substratum available for colonisation and consequently the abundance of benthic sessileassemblages
The reduced depth of water resulting from the accumulation of sand exacerbates the effects of storms and wave action It is likley that as a consequnece the biological communities of Kirra Reef will reflect earlyRstage succession more frequently and for longerperiods
While there is sufficient structure available frcenvironmentalexpect that Kirra Reef will continuetoprovideimportanthabitatforadiverseassemblageoffishes
TRESBPKirraReefMarineBiotaMonitoring2015 52
frc environmental
5$ Conclusions$
Although there is still a substantial portion of the reef covered compared to before the extension of the Tweed River entrance breakwaters the current extent of Kirra Reef is broadly inaccordancewithpredictionsmadein theEIS Initial lsquocatchRuprsquobypassingand dredgeplacementofsand(between2001and2008)resulted in theburialofKirraReef Subsequentsanddelivery(since2008onwards)morecloselyreflectsnaturalpatternsof longRshoresandtransportandisthereefhasslowlyreRemerged
Theextentofthereefhasbeenrelativelystablesince2013Thishasallowedforsome succession in the benthic assemblages including a relatively high cover of sponges ascidiansandcrinoidsWiththedeliveryofsandmorecloselymatchingthenaturalrateit isexpected the reef willundergoshortRtermchanges in extentdue toseasonal shifts in sand deliveryH however the diversity of benthic assemblages on Kirra Reef is likely to increaseovertimeThiswouldcreatemorespaceforspeciestorecruitandreducesthe influence of sand abrasion and wave damage It was predicted that the areas of Kirra Reef newly exposed in 2012 would undergo a shift from turfRdominated communities to more diverse communities that could include macroalgae sponges ascidians and potentiallyhardandsoftcoralWiththeexceptionofhardandsoftcoralsthisprediction wasconfirmedbytheresultsoftheApril2014andMarch2015surveys
ThediversityoffishesassociatedwithKirraReefisbroadlysimilartothatrecordedprior tothecommencementofsandbypassingin1995Giventhatfisharemobilethegreatest impacts on fish assemblages are likely to be shortRterm changes due to both the prevailingconditionsandchangestheextentofavailablehabitatthatprovidesshelterand foodforavarietyofdifferentspeciesIfKirraReefincreasesinsizethereislikelytobea greater proportion of cryptic benthic species as these species are more typical of assemblagesinalaterstageofsuccession(eg(WillisampAnderson2003))
Assuming a broadly stable delivery rate of sand and consequent stable extent of Kirra ReeflsquorecoveryrsquoislikleytobesubstantivelycompleteFloralandfaunalcommunitieswill undergo succession between severe storm events but are likley to remain relatively dynamic
Albert S Udy J amp Tibbetts I 2008 Responses of algal communities to gradients in herbivorebiomassandwaterqualityinMarovoLagoonSolomonIslandsCoral0 Reefs2773R82
Anderson MJ 2001 A new method for nonRparametric multivariate analysis of varianceAustral0Ecology2632R46
Anderson MJ 2004 PERMDISP0 a0 FORTRAN0 computer0 program0 for0 permutatinoal0 analysis0 of0 multivariate0 dispersions0 (for0 any0 twoSfactor0 ANOVA0 design)0 using0 permutational0 tests Department of Statistics University of Auckland New Zealand
Cannon LR Goeden GB amp Campbell P 1987 Community patterns revealed by trawling in the interRreef regions of the Great Barrier Reef Memoirs0 of0 the0 Queensland0Museum2545R70
Chapman MG Underwood AJ amp Skilleter GA 1995 Variability at different spatial scalesbetweenasubtidalassemblageexposedtothedischargeofsewageand two control assemblages Journal0 of0 Experimental0 Biology0 and0 Ecology 189 103R122
Cheshire AC Miller DJ amp Stewart R (1999) Effect0 of0 dispersed0 sediment0 plumes0 from0beach0sand0replenishment0dredging0on0recruitment0of0phaeophycean0algae0 to0rocky0reefs0in0Gulf0St0Vincent0South0Australia0The0Impact0of0Sand0Dredging0 on0 Benthic0 Community0 Structure0 at0 the0 Port0 Stanvac0 Dredge0 Site0 20 1S39 UniversityofAdelaideAdelaide
ConnellJHHughesTPampWallaceCC1997A30Ryearstudyofcoralabundance recruitment and disturbance at several scales in space and time Ecological0 Monographs67461R488
Diaz MC amp Rutzler K 2001 Sponges an essential component of Caribbean coral reefsBulletin0of0Marine0Science69535R546
DodgeREampVaisnysJR1977Coralpopulationsandgrowthpatternsresponsesto sedimentation and turbidity associated with dredging Journal0 of0 Marine0 Research35715R730
Done TJ 1982 Patterns in the distribution of coral communities across the central GreatBarrierReefCoral0Reefs195R107
Edwards RA amp Smith DA 2005 Subtidal assemblages associated with a geotextile reef insouthReastQueenslandAustraliaMarine0and0Freshwater0Research56 133R142
FisheriesResearchConsultants1991Survey0of0the0Intertidal0and0Subtidal0Rocky0Reefs0 of0 the0 Sunshine0 Coast report prepared for Queensland National Parks and WildlifeService
HarrisonPHarriotVBanksSampHolmesN1998ThecoralcommunitiesofFlinders Reef andMyora Reef in theMoretonBay MarineParkQueensland Australia In Moreton0 Bay0 and0 Catchment Tibbits I Hall N amp Dennison W (Eds) SchoolofMarineScienceUniversityofQueenslandStLuciapp525R536
Hatcher B Johannes R amp Robertson A 1989 Review of research relevant to the conservationofshallowtropicalmarineecosystemsOceanography0and0Marine0 Biology0an0Annual0Review27337R414
Hoey A amp Bellwood D 2008 CrossRshelf variation in the role of parrotfishes on the GreatBarrierReefCoral0Reefs37R47
TRESBPKirraReefMarineBiotaMonitoring2015 56
frc environmental
Hollingsworth P 1975 Environmental Investigation Report Crown Reserve R R68 Currumbin Creek City of the Gold Coast Land Administration Commission unpublishedreport
Hughes TP 1994 Catastrophes phase shifts and large scale degradation of a CaribbeancoralreefScience2651547R1551
Hughes TP Rodrigues MJ Bellwood DR Ceccarelli D HoeghRGuldberg O McCook L Moltschaniwskvi N Pratchett MS Steneck RS amp Willis B 2007Phaseshiftsherbivoryandtheresilienceofcoralreefstoclimatechange Current0Biology17360R365
Hutchinson A Rempel C Taveras V Loder J amp Salmond J 2013 Reef0 Check0 Australia0 South0 East0 Queensland0 Summary0 Report0 2013 report prepared for ReefCheckFoundationLimited
Hyder Consulting 1997 Tweed0 River0 Entrance0 Sand0 Bypassing0 Project0 Permanent0 Bypassing0 System0 0 Environmental0 Impact0 Statement0 0 Impact0 Assessment0 Study report prepared for New South Wales Department of Land and Water Conservation
Jompa J amp McCook LJ 2002 Effects of competition and herbivory on interactions betweenahardcoralandabrownalgaJournal0of0Experimental0Marine0Biology0 and0Ecology27125R39
KayAMampKeoughMJ1981Occupationofpatchesintheepifaunalcommunitieson pier pilings and the bivalve Pinna bicolor at Edithburgh South Australia Oecologia48123R130
KennellyS1987aInhibitionofkelprecruitmentbyturfingalgaeandconsequencesfor an Australian kelp community Journal0 of0 Experimental0 Marine0 Biology0 and0 Ecology11249R60
Kennelly S 1987b Physical disturbances in an Australian kelp community I temporal effectsMarine0Ecology0Progress0Series40145R153
TRESBPKirraReefMarineBiotaMonitoring2015 57
frc environmental
Kennelly S 1989 Effects of kelp canopies on understory species due to shade and scourMarine0Ecology0Progress0Series50215R224
Lassig BR 1983 The effects of a cyclonic storm on coral reef fish assemblages Environmental0Biology0of0Fishes955R63
Lawson S McMahon J amp Boswood P 2001 Environmental management of the construction and operation of a sand bypassing system at the Tweed River EntranceInThe15thAustralasianCoastalandOceanEngineeringConference the 8th Australasian Port and Harbour Conference 25 R 28 September 2001 QueenslandAustralia
Lesser MP 2006 BenthicRpelagic coupling on coral reefs feeding and growth of Caribbean sponges Journal0 of0 Experimental0 Marine0 Biology0 amp0 Ecology 328 277R288
LopezRVictoriaM ZeaSampWei E2006 Competition for spacebetweenencrusting excavatingCaribbeanspongesandothercoral reeforganismsMarine0Ecology0 Progress0Series312113R121
MalcolmHASmithSDAampJordanA2009Usingpatternsofreeffishassemblages to refine a Habitat Classification System for marine parks in NSW Australia Aquatic0Conservation0Marine0and0Freshwater0Ecosystems2083R92
Massel SR amp Done TJ 1993 Effects of cyclone waves on massive coral assemblages on the Great Barrier Reef meteorology hydrodynamics and demographyCoral0Reefs12153R166
Mumby PJ amp Steneck RS 2008 Coral reef management and conservation in light of rapidly evolving ecological paradigms Trends in Ecology amp Evoution 23 555 -563
Murphy HM amp Jenkins GP 2010 Observational methods used in marine spatial monitoring of fishes and associated habitats a review Marine and Freshwater Research 61 236-252
Noriega R 2007 An Overview of Available Information on Sandy Beach Ecology Coastal Sand Dunes Rocky Reefs and Associated Biota on the Gold Coast Griffith Centre for Coastal Management Research Report No 85 report prepared for Griffith University
Parker P (1995) Structure to Reef Fish Assemblages at Julian Rocks Northern New South Wales Masters Thesis Griffith University
Parker PG 1999 Fish assemblages at Julian Rocks and the adjacent waters of northern New South Wales Australia Australian Zoologist 31 134 - 160
Pawlik JR Steindler L Henkel TP Beer S amp Ilan M 2007 Chemical warfare on coral reefs sponge metabolites differentially affect coral symbiosis in situ Limnology and Oceanography 52 907-911
Reef Check 2010 httpwwwreefcheckaustraliaorgdatahtml accessed December 2015
Robinson KI amp Pollard DA 1982 Marine and estuarine reserves in Australia with particular reference to New South Wales Wetlands 2 17 - 26
Rogers CS 1990 Responses of coral reefs and reef organisms to sedimentation Marine Ecology Progress Series 62 185-202
Russ GR 2003 Grazer biomass correlates more strongly with production than with biomass of algal turfs on a coral reef Coral Reefs 22 63-67
Rutzler K 2002 Impact of crustose clionid sponges on Caribbean reef corals Acta Geologica Hispanica 37 61-72
Scheffers SR Nieuwland G Bak RPM amp van Duyl FC 2004 Removal of bacteria and nutrient dynamics within the coral reef framework of Curacao (Netherlands Antilles) Coral Reefs 23 413-422
TRESBP Kirra Reef Marine Biota Monitoring 2015 59
frc environmental
Schlacher-Hoenlinger M Walker S Johnson J Schlacher T amp Hooper J 2009 Biological Monitoring of the Ex-HMAS Brisbane Artificial Reef Phase II - Habitat Values report prepared for Environmental Protection Agency (EPA)
Smith KA 2003 A simple multivariate technique to improve the design of a sampling strategy for age-based fishery monitoring Fisheries Research 64 79-85
Smith S Edwards R Dalton S amp Harrison M 2005 Biological assessment of fish and benthic communities at Palm Beach Bait Reef Gold Coast Queensland report prepared for University of New England
TRESBP 2014 Autum 2009 storms httpwwwtweedsandbypassnswgovauarticles-and-studiesinteresting-itemsautumn-2009-storm updated 4 May 2014 accessed December 2015
TRESBP 2015a Tweed Sand Bypassing Restoring Coastal Sand Drift Improving Boating Access ndash Techinical information httpwwwtweedsandbypassnswgovau__dataassetspdf_file0004552055kir ra-feb-2015pdf acessed December 2015
TRESBP 2015b Waves httpwwwtweedsandbypassnswgovauenvironmental-monitoringcoastal-conditionswaves updated 30 September 2015 accessed December 2015
Umar MJMLJ amp Price IR 1998 Effects of sediment deposition on the seaweed Sargassum on a fringing coral reef Coral Reefs 17 169-177
Underwood AJ amp Kennelly SJ 1990 Ecology of marine algae on rocky shores and subtidal reefs in temperate Australia Hydrobiologia 192 3-20
Walker S Schlacher T amp Schlacher-Hoenlinger M 2007 Spatial heterogeneity of epibenthos on artificial reefs fouling communities in the early stages of colonization on an East Australian shipwreck Marine Ecology 28 435-445
Walker SJ Degnan BM Hooper JNA amp Skilleter GA 2008 Will increased storm intensity from climate change affect biodiversity in non-scleractinian sessile fauna on coral reefs Global Change Biology 14 2755-2770
Warwick RM amp Clarke KR 1993 Increased variability as a symptom of stress in marine communtities Journal of Experimental Marine Biology and Ecology 172 215-216
Thenumberofsitessurveyedhasvariedover timeasaresultof the fluctuating levelof sandcoveringKirraReef
Prior to May 2003 three sites were assessed along the eastern and northern edge of KirraReef(KirraReefOutersites1to3)andthreesiteswereexaminedalongtheinshore marginof the reef (KirraReef Inner sites1 to 3)(MapA1) ReefRedge (ieKirraOuter) siteswerechosentoprovideearlywarningofimpactsfromoffshoreplacementofdredged sandwhilst inshoresites(ieKirraInner)werechosentoindicatewhetherimpactsfrom inshore beach profile development were affecting the reef platform In May 2003 the threeeasternsitesatKirraReef (ieKRO1KRO2andKRI1)werecompletelycovered with bare mobile sand Consequently only the three western sites at Kirra Reef (ie KRO3KRI2andKRI3)supportedbenthicfloraandfaunaInMarch2004theextentof the remainingwesternoutcropof KirraReef had been further reduced so that all inner reefsiteswerecompletelycoveredwithmobilesandConsequentlyonlyasingleoriginal reefsite(ieKRO3)couldbesurveyed(Figure23)Thereforetoprovideanindicationof the condition of the remaining reef two new sites were established (ie KRN1 and KRN2)(Figure23)andsurveyedinMarch2004Theextentofthewesternreefhadbeen further reduced by February 2005 and a third new site (ie KRN3) was established (Figure23)Consequentlyfoursites(KRO3KRN1KRN2andKRN3)weresurveyedin February2005
InFebruary2010fourKirraReefsites(ieKRO3KRO1KRN1andKRN2)wereclearof thesurroundingsandandsupportedbenthic floraand fauna Inaddition several rocks protruded from the sand in the vicinity of site KRI2H these were assessed to provide a quantitativeindicationofbroadRscaletemporalchangestotheinshorereefcommunities
SOURCEScopy Copyright Commonwealth of Australia (Geoscience Australia) 2001 2004 2006copy The State of Queensland (Department of Natural Resources and Mines) 2015copy Nearmap 2014 2015
DATE2015-09-09
DRAWN BYCF
VERSION02
PROJECTIONCoordinate System GDA 1994 MGA Zone 56Projection Transverse MercatorDatum GDA 1994
plusmn SCALE
0 50 100
Metres
Scale 12500 A3
frc environmental
Appendix$B$ Introduction$to$Data$Analysis$Used$
Multivariate$Analyses$
Multivariate statistical techniques are widely used in ecology to assess the similarities relationshipsbetweenassemblagesWhereasunivariateanalysescanonlycompareone variable at a time (eg an index of community structure such as a diversity index or a singleindicatorspecies)multivariateanalysescancomparesamplesbasedontheextent thatassemblagesshareparticulartaxaandabundances(ClarkeampWarwick2001)
Thefirststepofmultivariateanalysisusuallyinvolvesthecreationofamatrixofsimilarity coefficients computed between every pair of samples The coefficient is usually a measureofhowclose theabundance is foreachspecies (definedso that100= total similarity and 0=complete dissimilarity) The Bray Curtis similarity measure is commonlythemostappropriateforbiologicaldata(ClarkeampWarwick2001)
MultidimensionalScaling
NonRmetricmultiRdimensionalscalingordinations(nMDS)attempttoplacesamplesintwo dimensionalspacesothattherankorderofthedistancesbetweensamplesmatchesthe rankorderofthematchingsimilaritiesfromthesimilaritymatrix(ClarkeampWarwick2001) Thisprovidesavisualrepresentationofthesimilaritiesbetweenassemblageswithineach sampleEachoftheaxesisnotrelatedtoanyparticularvalueHinfactaxescanberotated toprovide thebestvisual representationof thedata Ordinationsareparticularlyuseful tools for analysing and visually presenting differences between assemblages Ordinationsareessentiallymapsofsamples inwhich theplacementofsampleson the mapreflectsthesimilarlyofthecommunitytothecommunitiesinothersamples(Clarkeamp Warwick 2001) Distances between samples on an ordination attempt to match the similarities inassemblagestructurenearbypoints representassemblageswithvery few attributes(speciesorabundanceofspecies)Hpoints faraparthavevery fewattributes in common(ClarkeampWarwick2001)
A stress coefficient is calculated to reflect the extent to which the multiRdimensional scalingordinationandthesimilaritymatrixagree(ClarkeampWarwick2001)(iehowwell the multiRdimensional scaling ordination accurately reflects the relationship between samples)Stressvaluesoflt015aregenerallyacceptable
In Figure A1 each freshwater macroinvertebrate sample is represented on the multiRdimensionalscalingordination By lookingat thedistancesbetweeneachsample
ANOSIMisanalogoustoANOVAinunivariatestatistics(Smith2003)AglobalRstatistic iscalculatedtodeterminewhetherthereisasignificantdifferencebetweenallsamplesIf there are differences then pairwise comparisons are conducted to test for differences betweenpairsofsamples(analogoustopostRhoctestsinANOVA)
The R value lies between R1 and +1 (all similarities within groups are less than any similarity between groups) with a value of zero representing the null hypothesis (no differenceamongasetofsamples)(ClarkeampWarwick2001)ComparisonofpairwiseR values can give an indication of how different assemblages are R values close to 0 indicatelittledifferencevaluesaround05indicatesomeoverlapandvaluescloseto1to indicate many or substantial differences In many instances however researches are primarily interestedinwhethertheRvalueisstatisticallydifferentfromzero(usuallyata confidence level of 005) (Clarke amp Warwick 2001) (ie whether they can reject the null hypothesis)
ANOSIM can provide information on whether the (visual) differences between assemblages in the multiRdimensional scaling ordination are significantH it is an independenttestfromthemultiRdimensionalscalingordinationItisbasedontestingthe
TRESBPKirraReefMarineBiotaMonitoring2015 B2
frc environmental
differences between the rank similarities in the similarity matrix not on the distances betweensamplesinthemultiRdimensionalscalingordination(ClarkeampWarwick2001)
PermutationalMultivariateAnalysisofVariance
PERMANOVAisusedtotestsimultaneousresponsesofoneormorevariablestooneor more factors in an a0 priori0 structured design using random permutation of the data to assess significance (Anderson 2004) PERMANOVA generates a pseudo FRstatistic similar to traditional ANOVA but pRvalues are calculated with permutations which does notassumenormaldatadistribution PERMANOVAcanprovide informationonwhether the (visual) differences between assemblages in a multiRdimensional scaling ordination are significantH however it is an independent test from the multiRdimensional scaling ordination
Thelevelofmultivariatedispersionamongsampleswithineachofthetestgroupscanbe examined using the permutational analysis of multivariate dispersions (PERMDISP) routine(Anderson2004)Intraditionalimpactassessmentachangeinthedispersionof datacanalsoindicateanimpact
SimilarityPercentagendashSpeciesContributions
SIMPER analysis provides information on how dissimilar assemblages from various groups are (eg how similar all of the macroinvertebrate samples taken for a particular habitatwithinastreamreachare)andhowsimilareachgroup(egreach)istoanyother group SIMPER analysis also identifies the species taxa that are contributing to the dissimilarity between two assemblages in rank order (ie it identifies which species is contributingthemosttothedifferences)SIMPERanalysismayhelptoidentifypotential lsquoindicatorrsquospeciesForexampleifaparticularspeciesconsistentlycontributesgreatlyto the differences between impacted and unimpacted assemblages it may be a useful indicator Theabundanceofthis indicatorspeciescanthenbecomparedbetweensites usingunivariatetechniquessuchasANOVA
Data is available on request from tresbpprojectofficecrownlandnswgov
TRESBPKirraReefMarineBiotaMonitoring2015 C1
frc environmental
Appendix(D( Pairwise( PERMANOVA( Results
Data is available on request from tresbpprojectofficecrownlandnswgov
TRESBPKirraReefMarineBiotaMonitoring2015 D1
frc environmental
Appendix(E( Relative(Abundance(of(Fish(found(at(Kirra(( ( and(Palm(Beach(Reefs(in(Each(Survey((Data is available on request from tresbpprojectofficecrownlandnswgovau
TRESBPKirraReefMarineBiotaMonitoring2015 E1
Structure Bookmarks
0 50 100 Metres Scale 12500 A3
0 50 100 200 Metres Scale 15000 A3
Kirra Reef
Kirra Reef
Kirra Reef
Kirra Reef
Kirra Reef
Kirra Reef
Map A1Location of Kirra Reef monitoring sites
Table D8 Pairwise comparison of macroalgae cover between sites in each year
Table D15 Pairwise comparison of turf algae cover between sites in each year
Table D29 Pairwise comparison of ascidian cover between sites in each year
Table D43 Pairwise comparison of soft coral cover between sites in each year
frc environmental
Figure311 SpongesatKirraReefin2015 31 Figure312 Mean cover of sponges (plusmnSE) at Kirra Reef and Palm Beach
Reefonallsurveys 32 Figure313 Ascidians (Cnemidocarpa stolonifera) at Kirra Reef in March
The New South Wales Government Department of Primary Industries LandsR and the QueenslandGovernmentDepartmentofScienceInformationTechnologyandInnovation commissionedfrcenvironmentalonbehalfoftheTweedRiverEntranceSandBypassing Project (TRESBP) to monitor the condition and biodiversity of benthic and fish assemblages at Kirra Reef and to assess potential impacts of the project on those assemblages The purpose of the TRESBP is to maintain a navigable entrance to the Tweed River and to provide a continuing supply of sand to the southern Gold Coast beaches consistent with the natural rate of longshore drift This report discusses the results of ecological monitoring of the benthic fauna flora and fish of Kirra Reef completedinMarch2015
Ongoing monitoring of Kirra Reef is required under the Environmental Management System(EMS)SubgtPlanB14KirraReefManagementPlanpreparedbytheTRESBPin February 2001 The methods used in the March 2015 survey (ie surveys of benthic cover and fish abundance) were those developed for the Stage I survey completed in 1995andhavebeenused in thesubsequentsurveys in19962001200320042005 20102012and2014
ImpactsoftheSandBypassingSystemonKirraReef
The extent of the three major outcrops of Kirra Reef (northern southern and eastern sections)varynaturallydependingonwaterandsandmovementsDuringtheearlyyears of theTRESBP operation largeamounts of sandwere deposited on thesouthern Gold Coast beaches This was done to provide a lsquocatch uprsquo quantity of sand to the badly erodedbeachesreducetheTweedRiverentrancebarandclearasandtrapinthevicinity ofthesandcollectionjettytoincreasetheefficiencyofthebypassingsystemDuringthe initialperiodofincreaseddepositionthevolumeofsanddeliveredexceededtheamount that was transported north through natural mechanisms A large volume of sand was deposited on the southern Gold Coast beaches and wave action and tidal currents redistributed some of this sand over Kirra Reef This resulted in a decline in the areal extentofKirraReefwiththereefalmostcompletelycovered(lt100m2exposed)in2006 The projectrsquos Environmental Impact Statement (EIS) predicted that impacts associated withthegradualaccumulationofsandaroundthebaseofKirraReefwereunavoidable
Sincethedeliveryoflargequantitiesofsandwascompletedin2008thevolumeofsand delivered by the project has declined and now closely matches the natural rate of northwardsandtransportHowevertherewasasubstantiallagbetweenthereductionin sanddeliveryandtransportofthesandfurthernorthduetoaperiodofcalmerthanusual
TRESBPKirraReefMarineBiotaMonitoring2015 i
frc environmental
conditionswith reduced storm activity from the north`east Assuchdispersion of sand from Kirra Beach and reduction in the sand levels around the reef was slower than predictedbetween2005and2009
BetweenFebruary2010andJuly2012 therewasa large(50) increase in theareaof exposedrockinthenorthernsectionofKirraReefThiswaslikelytoberelatedtosevere storms in late 2009 moving sand further north andor to the manual removal of 140000m3ofsandfromKirraBeachin2009
InDecember2013KirraPointgroynewasextendedby30mby theCityofGoldCoast with the expectation that the beach bar would move seaward as a consequence At present theKirraPointgroyneestension in2013isunlikelytohavehadamajor impact onthearealextentofKirraReef
Thereefhasbeenrelativelystablesince2013withminor(lt5)changesintheamount of reefexposed Nonetheless thearealextentofKirraReef remains less than50of the extent recorded in 1962 and in 1995 before the TRESBP began In 2015 the reef comprisesthenorthernsectionandapartof theeasternsectionof thereefasrecorded pre`TRESBP(allthesouthernsectionofthereefremainsburied)
ChangestotheEcologicalConditionofKirraReef
The Projectrsquos EIS did not consider the ecological consequences of the reduced areal extentofreefalhabitatandincreasedwaveenergy(aconsequenceofdecreaseddepth) thatwouldoccurasaresultoftheaccretionofsandaroundKirraReefHoweverasthe TRESBPbettermimicednaturalpatternsofsandtransportsince2009theEISpredicted that the reefrsquos benthic floral and faunal assemblages would return to the conditions exhibitedpriortotheextensionoftheTweedRivertrainingwallsinthemid1960s
Sincemonitoringcommenced thegreatestchangeto the floralandfaunalassemblages of Kirra Reef has been due to the loss of reefal habitat In addition to a reduction in overall abundance of taxa the redistribution of sand mediated through complex interactions between physical disturbance (associated with wave action suspended sedimentssedimentdepositionandburial)foodavailabilityandcompetitionhasresulted inavarietyofsmall`scalechangestothedistributionandabundanceofthereefrsquosbenthic assemblages
InApril2014andMarch2015thediversityofassemblageshadincreasedrelativetoJuly 2012as had thecoverof macroalgae (though it remained well below the peakof 60 coverrecordedinJanuary2001)Thisismostlikelyduetonaturalsuccessionwithmore mature communities being established between 2012 and 2015 when the extent of exposedrockwasrelativelystableNeverthelessthebenthicassemblageonKirraReef
TRESBPKirraReefMarineBiotaMonitoring2015 ii
frc environmental
exhibited signs of ongoing stress from physical disturbance such as storm and wave disturbancephysicalabrasionandburialbysandRincludinglowpercentagecoverofhard coralandsoftcoralThisisconsideredessentiallynaturalandcharacteristicofshallow inshorereefsChronicphysicaldisturbancekeepsthebenthicassemblagesofKirraReef inastateofearlysuccession Thediversity(and insomecasesabundnace)ofareefrsquos benthic assemblage is predicted to increase where the extent of reef remains stable or increases and where the frequency and severity of storm conditions are less than the long`term average This was evident in 2014 and 2015 with a relative high cover of spongesandascidians
InMarch2015amorediverseassemblageoffishwasfoundonKirraReefthanonPalm Beach Reef As fish are mobile they can move more easily to areas that are less disturbed or that exhibit more suitable conditions While the composition of the assemblagedifferedfromprevioussurveyeventsthedifferencesweremorelikelydueto the effects of seasonal changes in water temperature and the effects of prevailing conditions at the time of the survey rather than any substantial effect of the bypassing project
Despite some impacts from the TRESBP (with sand covering much of the reef area) overall the composition of the flora and fauna assemblages on Kirra Reef were more similar to that found at nearby Palm Beach Reef than in previous years Kirra Reef therefore continues to provide habitat to a range of flora and fauna and provides important marine ecological functions and services in the region It is possible that as sandlevelshavestabilisedoverthepastthreeyearsassemblagesareslowlybeginning tobecomemoresimilartothoserecordedpriortoimplementationoftheTRESBPandto thoseatnearbyPalmBeachReef
ImpactsofStormsampSeasonalityonKirraReef
The large quantities of sand that were initially delivered by the project caused a substantialshallowingofthenear`shoreareaaroundthereefThisincreaseinbedlevels wasresponsibleforcoveringasubstatialamountofthereefandsubsequentlyincreasing the incidenceof wavedisturbance and sand scouringaround the reef which negatively impactedthebenthicfaunaandflora
As the delivery of sand through the bypassing system now more closely matches the naturalrateofnorthernlongshoresandtransportshort`termandseasonalchangesinthe areal extent of the reef are more likely the result of natural processes than a discrete impactof thesandbypassingactivity Short`term fluctuations that result fromstormsor changesinthecoastalsandsupplywouldhavebeenacomponentofthenaturalrangeof ecologicalconditionsobservedpriortotheextensionofthetrainingwalls
TRESBPKirraReefMarineBiotaMonitoring2015 iii
frc environmental
Thereappearstobearelationshipbetweentheareaandordistributionofrockexposed andstormeventsatKirraReefNotablyaseriesofstormsin2009andstormyconditions between late 2011 and 2012 correspond to large areas of rock becoming exposed Furtherstormsinearly2013correspondstoaclearchangeinthedistributionofrockat Kirra Reef Since 2013 storm conditions have been calm to moderate and there has beenlittlechangeinthearealextentanddistrubtionofexposedrockatKirraReef
Thecloseproximityofthereeftothecoastcontinuestosubjectthebenthicassemblages tosandabrasionwavedisturbanceandsandsmotheringGreaterbalancebetween the deliveryofsandthroughtheprojectandthenaturalmovementofsandonandoffshoreis likely to result inbetterecologicaloutcomes for thebenthicassemblages foundonKirra Reefandgreaterconsistencyintheextentofreefhabitatthatisuncovered
frcenvironmental expect that the area of reef uncovered will continue to change due to seasonal shifts in sand delivery and stormsR however the diversity of flora and fauna assemblagesonKirraReefshouldincreasegraduallyovertimeespeciallyiftheextentof the rocky reef that remains uncovered is consistent andor increases over time to become moresimilarwith that foundprior to the extension of the trainingwalls In this scenario itwasexpectedthat thatnewlyexposedareasofKirraReef in2012thatwere dominated by turf algae would be colonised by other organisms including macroalgae spongesascidiansandpotentiallyhardandsoftcoralovertimeTheresultsfrom2014 and2015indicatethatthisprocessisslowlyoccurringonKirraReef
The change in areal extent between 2014 and 2015 was approximately 85 in the northern section of Kirra Reef A small area of the eastern section of Kirra Reef also became exposed between 2014 and 2015 Ongoing monitoring will provide insight into therateoflsquorecoveryrsquoofcommunitiesHowevergiventhesmallchangeinarealextentof KirraReefandrealtivelysimilarfloraandfaunacommunitiessurveyedin2014and2015 monitoringcouldbereducedtobiannuallyIfmonitoringisreducedasubstantialchange (eg 15) in the extent of the exposed reef should be used to triggered annual monitoring
TRESBPKirraReefMarineBiotaMonitoring2015 iv
frc environmental
1 Introduction
frcenvironmentalwascommissionedbytheNewSouthWalesGovernmentDepartment ofPrimary IndustriesLandsR and theQueenslandGovernmentDepartmentofScience Information Technology and Innovation on behalf of the Tweed River Entrance Sand BypassingProject(TRESBP)tomonitortheconditionabundanceandbiodiversityoffloral and faunal communities at Kirra Reef This report presents results of the survey of benthicfloramacro`invertebratefaunaandfishatsitesonKirraReefandatcomparative sitesonPalmBeachReefinMarch2015
The current condition of Kirra Reef was compared with the current condition of nearby Palm Beach Reef and with changes to the Kirra Reef community over time ie with previousassessmentsofKirraReefundertaken in199519962001200320042005 20102012and2014(frcenvironmental2014)
The TRESBP was established in 1995 as a joint initiative of the NSW and Queensland GovernmentstoimproveandmaintainnavigationconditionsattheTweedRiverentrance andtoprovideacontinuingsupplyofsandtothesouthernGoldCoastbeachesconsistent withthenaturalrateoflongshoredriftTheprojectwascarriedoutintwostages
sdot Stage2Implementation of a sand bypassing system to maintain the improvementsachievedduringStage1(fromMay2001onwards)
DuringStage1approximatelythreemillioncubicmetres(m3)ofcleanmarinesand(with lessthan3fines)weredredgedfromtheTweedRiverentranceMostofthedredging materialwasdeliveredout to`10mmeanwaterdepthfromPointDangertoNorthKirra withapproximately600000m3ofcleanmarinesandbeingplacedontheupperbeaches fromRainbowBaytoNorthKirraFromApril2000toFebruary2001additionaldredging activities were undertaken to maintain a clear navigation channel at the Tweed River entrance Prior to the establishment of the permanent sand bypassing system a further 480000m3of clean marine sandwas placed innear`shore areas from PointDanger to CoolangattaBeach
Stage2commissioning trialscommenced in March 2001 and full scale operationof the sand bypassing system commenced in May 2001 Since this time approximately 70millionm3ofpumpedsandand14millionm3ofdredgedsand(derivedfromdredging
TRESBPKirraReefMarineBiotaMonitoring2015 1
frc environmental
oftheTweedRivermouth)havebeendepositedalongthesouthernGoldCoastbeaches Mostofthesanddeliveredthroughpumpinganddredginghasbeenplacedintheprimary placementareasoutheastofSnapperRocks Sand isalsodischarged fromoutletsat Duranbah Beach and occasionally at Snapper Rocks West There is an outlet at Kirra BeachRhowever thishasnotbeenusedsinceDecember2003 Aplacementexclusion zone has been established around Kirra Reef extending a minimum of 100m from the reefedge(1995extent)topreventdirectplacementofsandincloseproximitytothereef (Lawsonetal2001)
sdot provide much needed sand nourishment to the severely eroded southern Gold Coastbeaches
sdot reducetheTweedEntranceBarand
sdot clear a sand trap in the vicinity of the jetty to improve the efficiently of the sand bypasssystem
These project objectives were achieved and the quantity of sand delivered since 2008 has been more consistent with the natural quantity of sand movement along the coast (average natural net longshore sand drfit is estimated to be 500000m3 per year in a northward direction) In 2014 a total of 450232m3 was pumped through the sand bypassing system to the primary placement area at Danger Point From January to February2015anadditional105119m3ofsandwaspumpedthroughthesystem
In 2009 the Queensland government removed approximately 140000m3 of sand from KirraBeachintertidalzonetothelowprofilebackdunesIn2013theCityofGoldCoast extendedKirragroyneby30m
12 HistoricalContextforKirraReefMonitoring
Kirra Reef is the collective name given to the complex of rocky outcrops located a few hundredmetresoffshoreofKirraBeachatbetween`3and`10mandwithintheinfluence
TRESBPKirraReefMarineBiotaMonitoring2015 2
frc environmental
of wave action It is subject to naturally shifting sands that intermittently cover and uncover the reefrsquos rocky outcrops (TRESBP 2015a) The exposed extent of Kirra Reef hasvariedoverthepast50yearsduetonaturalstormeventsandchangestothecoastal environmentsuchastheextensionoftheTweedRivertrainingwallsinthemid`1960sand commencementoftheTRESBP(TRESBP2015a)Therearethreemajoroutcropsofthe reefthenorthernsouthernandeasternsectionswhichhavebeenvariouslyexposedin thepast(refertoTable11andFigure11)
MonitoringofKirraReef is requiredunderaproject`specificEnvironmentalManagement System (EMS) prepared by the TRESBP in February 20011 Under EMS SubgtPlan B14 KirraReefManagementPlaniftheareaofexposedreefonaerialphotographsissmaller thantherangeofareasshownonaerialphotographsfrom1962to1965thenmonitoring ofthemarinebiotaofKirraReefisrequired
frcenvironmentalcompletedabaselineassessmentofKirraReefinAprilandJune1995 (FisheriesResearchConsultants1995a)(FisheriesResearchConsultants1995b)andhas undertaken nine subsequent ecological monitoring surveys of the reef on behalf of TRESBP in February 1996 January 2001 May 2003 March 2004 February 2005 February 2010 July 2012 April 2014 (Fisheries Research Consultants 1996R frc environmental2001R2003R2004R2005R2010)andthecurrentsurveyinMarch2015
13 TemporalChangesintheAreaofExposedReef
AreductionintheexposedextentofKirraReefwaspredictedintheprojectrsquosEIS(Hyder Consulting 1997) It was also expected that Kirra Reef would return to pre`1960rsquos conditions before the extension of the Tweed River breakwaters that interrupted the northerlymovementofsandwereconstructed(Lawsonetal2001)
Prior to 1960 Kirra Reef was partially covered by sand which varied naturally with the naturalsupplyofsandandwaveenergyDuringthe1960rsquosfollowingtheextensionofthe Tweed River training walls between 1962 and 1965 Kirra Reef became increasingly exposed due to the depleted sand supply (note the increase in area of Kirra Reef from 1962 to1972 inTable11) Following theKirraPointgroynecontruction in1972 there was further depletion of sand supply and Kirra Reef was perennially exposed (note the increaseinareaofKirraReeffrom1972to1995inTable11RrefertoFigure11forthe extentofreefin1995)Kirrareefgroynewasshortened(from175mto145m)in1996
1 The ongoing reef monitoring also incorporates additional monitoring activities implemented by the
TRESBPinAugust2004
TRESBPKirraReefMarineBiotaMonitoring2015 3
frc environmental
AccumulationofsandonKirraReefwasobservedasaresultofindirectsandnourishment bytheTRESBP(notethedecreaseinareaofKirraReefafter1995inTable11)Aerial photographs taken in 2003 and 2004 showed the reef to be of significantly less extent than the range of extent observed in 1962 and 1965 (Table 11) Loss of reef area continuedforsomeyearsandbyearly2006theareaofexposedreefhadbeenreduced to lt100m2 There was a substantial lag between the reduction in sand delivery and transportof thesand furthernorthdue toaperiodofcalmer thanusualconditionswith reducedstormactivityfromthenorth`eastAssuchdispersionofsandfromKirraBeach andreductioninthesandlevelsaroundthereefbetween2005and2009wasslowerthan predicted (refer to Figure 11 for the extent of reef in 2009) As a consequence of the extensiveburialofthereefsimplevisualinspectionsofthereefwereundertakeninplace offullecologicalsurveysbetween2006and20102
In2009eightyearsaftertheinitiationofsandpumpingbytheTRESBPbeganaseriesof storms shifted approximately 200000 m3 of sand from Kirra Beach to the north This storm was the worst protracted storm for east facing beahes in at least 14 years with significant wave heights remaining for four days (TRESBP 2014) This along with the removalofapproximately140000m3ofsandfromtheKirraBeachintertidalzoneagain uncoveredpartsofKirraReef (TRESBP2015a) Since2008sanddeliveryvolumesof the TRESBP have been more consistent with the natural quantity of sand movement alongthecoastEcologicalsurveysrecommencedin2010astheexposedareasofKirra Reefincreasedinextent
Between November 2011 and August 2012 there was a large increase in the northern section of Kirra Reef when the area of exposed rock more than doubled (Table 11R Figure11) This corresponds to a lsquostormy yearrsquowith one severe storm and twomajor storms recorded (TRESBP 2015b) Further stormy conditions were recorded in early 2013withoneextremestorm(approximately110yearevent)inJanuaryandonemajor storminFebruary(TRESBP2015)Therewaslittlechangeinthetotalareaofexposed reefduring this time (note thesimilarareaofAugust2012andMay2013 inTable11) Howevertherewascleardistributionchangesintheareasofexposedrock(Figure11) Thereefareahasremainedrelativelystablesince2013withminorchangesintheareaof rock exposed (Table 11R Figure 11) Wave height data since 2013 indicates calm to moderate conditions with only minor storms recorded except in May 2015 when there wasaseverestorm(TRESBP2015)Inlate2013KirraPointgroynewasreinstatedby 30mtoitsorginalconstructedlengthGiventheminorchangesintheexposedrocksince
2 Underwater visual inspections were completed by Gilbert Diving and Gold Coast City Council from
In2014KirraReefcoveredanareaof2920m2Rpredominantlyinthenorthernsectionof thereefInMarch2015thisnorthernsectioncoveredanareaofapproximately2672m2 (Figure11andFigure12)an85decreaseintheexposedextentbetween2014and 2015 In March 2015 the rocky outcrops were typically between 1 and 2m above the cleanmobilesandwithseveraloutcropsextendingtomorethan2mabovethesandA small section (116m2) of the eastern reef wasalsoexposed inMarch 2015 (Figure 11 andFigure12)Howeverthereefarearemainslessthan50oftheextentrecordedin 1962and1995beforetheTRESBPbegan(Table11Rreefareabetween1962and1965 was between 7000 and 13300 Department of Land and Water Conservation photogrammetricanalysis)
TRESBPKirraReefMarineBiotaMonitoring2015 5
frc environmental
Table11 ApproximateexposedextentofKirraReef
Area(m2) Date SourceofImage
NorthernSection SouthernSection EasternSection Total
The southeast Queensland (SEQ) region comprises five subregions the Gold Coast Inner Moreton Bay Outer Moreton Bay Sunshine Coast and Fraser Coast Coral communities within SEQ are diverse with an extensive range of coral growth forms (Harrison et al 1998) The greatest diversity of coral species are typically found at offshoresites likeFlindersReefswhere119differentcoralspecieshavebeen recorded (Harrisonetal1998)
Subtidal rocky reefs of the Gold Coast region comprise remnants of highly eroded volcanic substratum isolated by wide variable expanses of soft sediment (Edwards amp Smith 2005) They support community assemblages that are indicative of a transition between the tropical waters of the Great Barrier Reef and the temperate waters characteristicofthemidNewSouthWalescoast(Done1982XCannonetal1987)
GoldCoastreefcommunitiesarebroadlysimilartoareasofcomparabletopographytothe north(InnerGneeringsoffshorefromMooloolabaandoffshoreofMoretonBay)andtothe south (Julian Rocks offshore of Byron Bay) that are dominated by macroalgae and sessile invertbrates(FisheriesResearchConsultants1991XHarriottetal1999XEdwards amp Smith 2005X Baronio amp Butcher 2008X Fellegara 2008X SchlacherHoenlinger et al 2009)ManyoftheGoldCoastsreefslocatedclosetoshoreareoftenaffectedbyhuman activities (Noriega 2007)and typicallyhave lesscoralcover Ina2013surveyofSEQ reefsGoldCoastreefshadthelowesthardcoralcoverat9(Hutchinsonetal2013)
Fish of the Gold Coast region are similar in community composition to that recorded offshore of Moreton Bay at Julian Rocks and the Solitary Islands offshore of Coffs Harbourandtoa lesserextentat theexHMASBrisbanenearMooloolaba(Robinsonamp Pollard 1982X Parker 1995X Parker 1999X Edwards amp Smith 2005X Malcolm et al 2009X SchlacherHoenlingeretal2009) The smaller inshore reefsof theGoldCoast region suchasKirraReeftypicallysupportalowerabundanceanddiversityoffishes(Edwards ampSmith2005Xfrcenvironmental2005)
Kirra$Reef$
ThebenthicassemblagesofKirraReefarecharacterisedbyahighcoverofmacroalgae andturfalgaeandamoderatecoverofsessilebenthicinvertebratesincludingafewhard corals(EdwardsampSmith2005Xfrcenvironmental2005)Turfalagecoversthemajorityof the reef substrate Crinoids (feather stars) ascidians (sea squirts) and sponges are typically themostabundantbenthic faunawhilstanemonessoftcoralsandurchinsare present in low numbers (frc environmental 2014) The composition of benthic assemblagesatKirraReef isbroadlysimilar to thatdescribed fromadjacent rockyreefs
Exposuretowaveactionsandscouringandsmotheringareimportantfactorsinfluencing the distribution and abundance of sessile species on rocky reefs (Kay amp Keough 1981X McGuinness1987)ChangeintheheightofsandaroundthebaseofKirraReefappears to be a major factor influencing the abundance (cover) of benthic flora and fauna periodically resulting in a bare stratum on rocks within 08 to 1m of the seafloor Outcropsontheeasternsectionof thereefcomplexwherewaveactionand likelysand abrasion are greatest have historically supported a lower abundance of benthic fauna than outcrops on the northern section (Fisheries Research Consultants 1995a)X (Fisheries Research Consultants 1995b)X (Fisheries Research Consultants 1996)X (frc environmental 2003)X (frc environmental 2004)X (frc environmental 2005)X (frc environmental2010)
Strong wave action results in sustained abrasion of the dominant brown macroalgae (Sargassum(flavicans(andEcklonia( radiata)causing the fronds tobreak Thecontinual resuspensionofalgal fragments(commonlyreferredtoas lsquocornflakesrsquo)candramatically reducewaterclarityandvisibility Algal fragmentswere largelyabsent inJuly2012and April2014surveyslikelyduetolongperiodsofrelativelybenignseaconditionsInMarch 2015amoderateamountofalgalfragmentswasobservedlikelyduetostormactivityin theweeksproceedingthesurvey(egmoderateseas11to14Februaryandminorstorm over1922February)
RecentsurveysatPalmBeachReefcompletedbyReefCheckrecordedadeclineinhard coralcover from2008to2013(Hutchinsonetal2013) Sessile invertebrates including spongescoralsandascidianstypicallydominatethebenthicassemblageofPalmBeach Reef(EdwardsampSmith2005X frcenvironmental2005XReefCheck2010) Thecoverof sessileinvertebrateshashistoricallybeensimilartothatrecordedfromtheoutersections of Kirra Reef However the cover of macroalgae has consistently been loweron Palm BeachReefthanonKirraReefTheproximityofPalmBeachReeftotwocreekmouths andtheabsenceofstrongcurrentsintheareatypicallyresultsinahighlevelofturbidity Elevated turbidity together with greater water depth and a high abundance of grazing
TRESBPKirraReefMarineBiotaMonitoring2015 10
frc environmental
speciessuchasurchinsislikelytocontributetoarelativelylowcoverofmacroalgaeand abundant suspension feeding organisms such as ascidians sponges hydrozoans and crinoidsatPalmBeachReef(Smithetal2005)
PalmBeachhasa lowerabundanceanddiversityof benthicdemersaland pelagic fish comparedtoKirraReef(Smithetal2005)ThegreaterdensityoffishatKirraReefmay beaconsequenceof the lossof reef forcingmore fish intoasmallerarea (Smithetal 2005)PalmbeachrecordedaslightlylowerdiversityoffishthanKirraReefin2012and 2014surveys(frcenvironmental2012Xfrcenvironmental2014)
TRESBPKirraReefMarineBiotaMonitoring2015 11
frc environmental
2$ Methods$
The methods used in the March 2015 survey were developed for the Stage I survey completed in April and June 1995 and used for subsequent surveys February 1996 January 2001 May 2003 March 2004 February 2005 February 2010 July 2012 and April2014 Datawere collected from KirraReef (2816251535309) andPalmBeach Reef(2810751534774)locatedapproximately9kmnorth(Figure21)
Themainobjectiveof the monitoring was to investigateanychange in the marinebiota and habitat of Kirra Reef compared to Palm Beach Reef (comparative reef) in order to assesstheeffectofthesandbypassproject(andsubsequentincreasesinsandload)on theecologyofKirraReef
0 2 41
Kilometres
Service Layer Credits Sources Esri HERE DeLorme Intermap increment P Corp GEBCO USGS FAO NPS NRCAN GeoBase IGN Kadaster NL Ordnance
0 2 41
Kilometres
Service Layer Credits Sources Esri HERE DeLorme Intermap increment P Corp GEBCO USGS FAO NPS NRCAN GeoBase IGN Kadaster NL Ordnance
Threesites(KRN1KRN2KRO3)atKirraReef(waterdepth5to8m)weresurveyedin March 2015 (Map 1) The remainder of the sites previously surveyed were covered by sand(refertoappendixAforahistoryofsitespreviouslysurveyed)Threecomparative sites (PB1 PB2 and PB3) were also surveyed at Palm Beach Reef (water depth 12 to 17m)(Map2)
TRESBPKirraReefMarineBiotaMonitoring2015 12
orth NetreStkicrraG
Marine Parade
t eertS ickr
M rarin ae Pa Grade
Musgrave St
t
re ee e Powel t r lt CrescenS t t es eel ri tM S
t ee ge drt u tleS d Rro MuL sgrave Street
LEGEND 0 1 Km Tweed River E ntrance Sand Bypassing Project Survey Site Road Network
copy Copyright Commonwealth of Australia (Geoscience Australia) 2001 2004 2006copy The State of Queensland (Department of Natural Resources and Mines) 2015copy Nearmap 2014
DATE2015-03-24
DRAWN BYCF
VERSION01
PROJECTIONCoordinate System GDA 1994 MGA Zone 56Projection Transverse MercatorDatum GDA 1994
plusmn SCALE
0 50 100 200
Metres
Scale 15000 A3
Gold Coast Highway
i
PalmBeach
Tugun
Coolangatta
0 1 Km
frc environmental
22$ Benthic$Flora$and$Macroinvertebrates$
At each site benthic assemblages were surveyed in fifteen 025m2 quadrats with the percentcoverofbenthicmacroalgaeturfalgaespongesascidianshardcoralsandsoft coralsassessedvisually(Figure22)Quadratswereplacedhaphazardlywhichincluded horizontal and sloping surfaces The minimum distance between quadrats was approximately2m Thenumberof largeascidians (Pyurastolonifera)crinoids (feather stars)barnaclesurchinstubewormspolychaeteshydroidszoanthidsandcowriesand the dominant species of macroalgae were also recorded and quantitative notes were madeontheapparenthealthofeachtaxonomicgroup
ThespeciesrichnessandrelativeabundanceoffishatKirraReefandPalmBeachReef were assessed using a combination of underwater visual census (UVC) and video surveys The combination of these techniques represents the most costeffective and efficientmeansofobtainingdataonthestructureoffishassemblagesindifferenthabitats (Murphy amp Jenkins 2010) A baited remote underwater video (BRUVX baited with pilchards) and footage captured by a diver swimming hapazard trasects over the reef wererecorded
Video footage from each BRUV (approximately 20minutes) and video transects (approximately 35 minutes) was reviewed by an ecologist experienced in marine fish identification
24$ Data$Analysis$
Permutational multivariate analysis of variance (PERMANOVA) was used to determine differences in the composition (cover of benthic fauna and taxonomic group) of benthic assemblagesbetweenKirraReefandPalmBeachReefover time PERMANOVAuses permutational methods (PsuedoAF) to derive statistical significance which require fewer assumptionstobemetthananalogousmethodssuchasmultivariateanalysisofvariance (MANOVA) (Anderson 2001X Anderson et al 2008) This analysis enables an examinationofchangesinthecommunityasawhole
A three factor PERMANOVA was used to examine differences in the composition of benthic assemblages with survey (fixed factor) locations (Palm Beach Reef and Kirra Reeffixedfactor)andsites(nestedinlocationsasarandomfactor)asthefactorsData weresquareroot transformedtodownweightdominatingspeciesabundanceXconverted toaBrayCurtisdistancematrixXandtestedforsignificanceusingasmanypermutations as allowed (9800 to 9937 unique permuations achieved for all factors and factor combinationsXexceptlocationwhere10uniquepermutationswereachieved))Posthoc pairwisetestwasusedtodeterminethemagnitudeofdifference
Nonmetricmultidimensionalscaling (nMDS)ordinationswereused tovisually represent the variation in the composition of assemblages between reefs separately for each survey nMDS ordinations were also used to visually represent the variation in the compositionofassemblagessurveysatKirraReefforallsurveysXbaselinesurveyinApril 1995andMarch2015XandApril2014andMarch2015
Separate univariate PERMANOVAs were used to compare differences in the cover of macroalgae turf algae and the abundance of crinoids and ascidians Data were
TRESBPKirraReefMarineBiotaMonitoring2015 16
frc environmental
converted to a eucildean distances matrixX and tested for significance using as many permutations as allowed (998 to 999 unique permuations achieved for all factors and factor combinationsX except location where 10 unique permutations were achieved) Factors were survey (fixed factor) locations (Palm Beach Reef and Kirra Reef fixed factor)andsites (nested in locationsanda random factor) Posthoc pairwise testwas used to determine the magnitude of difference Monte Carlo procedures were used to calculateempiricalPvaluesforthesurveyxlocationtest
Further information on the use and interpretation of PERMANOVA and other analyses usedinthisreportisprovidedinAppendixB
TRESBPKirraReefMarineBiotaMonitoring2015 17
frc environmental
3$ Results$
31$ Cover$of$Benthic$Assemblages$
The composition of benthic fauna and flora ( cover and type combined Appendix C) variedbetweenmostsitesatbothKirraReefandPalmBeachReefandbetweennearly allsurveysateachsite(notethesignificantinteractionofsite(location)xsurveyinTable 31X Appendix D) Nevertheless there appeared to be substantial differences in the compositionofthebenthicassemblagesbetweenthetworeefsineachsurveyfrom1995 to2015(Figure31toFigure33)
In2015 therewassomeoverlap in thecompositionofassemblagesonKirraandPalm Beach Reefs (Figure 33) However there was also some clear patterns of difference including
Benthic assemblages at Kirra Reef appeared to show some overlap between surveys (Figure34H) HowevernearlyallsurveysweredifferentateachsiteatbothKirraReef andPalmBeachReef(AppendixD)BenthicassemblagesinMarch2015andApril2014 wereverysimilarcomparedtobenthicassemblages inthebaselinesurvey inApril1995 andMarch2015(notethegreateroverlapinFigure35comparedtoFigure36)
In March 2015 as in previous surveys the macroalgae Sargassum sp dominated the benthic assemblages at all sites at Kirra Reef (Figure 37) Other species present included
sdot Dictyopteris0arostichoides0
sdot Dilophus0intermedius00
sdot Zonariasp
sdot Laurencia0brongniartic0
sdot Amphiroa0anceps0
sdot Caulerpa0lentilliferaand
sdot Halimeda0discoideaand
sdot Macrocystissp
Juvenile kelp (from the genus Macrocystis) was also emerging on some areas of Kirra Reef
ThecoverofmacroalagevariedbetweensitesandsurveysatbothKirraReefandPalm Beach Reef with the magnitude of difference varying over time (note the significant interaction between site (location) x survey in Table 32) Macroalgae cover varied between surveys with 2001 being the most different to the other years (Appendix D) ThereweredifferencesbetweensitesatKirraReefinJune1995February1996January 2001 May 2003 February 2005 and February 2010 and between sites at Palm Beach ReefinJanuary2001andFebruary2010Inrecentsurveys(2012to2015)thecoverof macroalgaeatsitesatbothKirraReefandPalmBeachReefwassimilar (AppendixD) indicatingarelativelyconsistentdistributionacrossbothreefs
ThemeancoverofmacroalgaeatKirraReefhasdeclinedsinceitspeakin2001withthe greatest magnitude of decline recorded between January 2001 and May 2003 (Figure 38)InsurveysbetweenJune1995andMay2003Sargassumspformeddensecarpets overtherockysubstratecoveringupto58oftheavailablesurfaceareaofthereefIn February 2010 macroalgal cover was 12 Macroalgal cover has increased to 26 in March2015ThisissimilartothecoverrecordedinApril1995(23cover)(Figure38)
In2015nomacroalgaewasrecordedwithinthequadratsatPalmBeachReefThecover of macroalgae on Palm Beach Reef has been consistently lower than Kirra Reef since
TRESBPKirraReefMarineBiotaMonitoring2015 26
frc environmental
ecologicalmonitoringbegan typically lessthan5of theavailablesurfacearea(Figure 38)
The mean cover of turf algae varied between sites and surveys at both Kirra Reef and PalmBeachReef(notethesignificantinteractionbetweensite(location)xsurveyinTable 33)SpecificallythereweresignificantdifferencesbetweensitesatbothKirraReefand PalmBeachReefinJune1995January2001February2010July2012andApril2014 (aswellasbetweensitesinFebruary1996atKirraReef)Thecoverofturfalgaevaried betweenmostsurveysatallsitesateachreef(AppendixD)BothKirraandPalmBeach reefs showed major increases in the percent cover of turf algae from 2010 to 2012 followedbyadecreaseincoverbetween2012and2014(Figure310)Thecoverofturf algae is typically lower at Kirra Reef than at Palm Beach Reef (July 2012 being an exception) and was again slightly lower at Kirra Reef in March 2015 (Table 310) In March2015turfalgaewasmoreprevalentatKirraReefthanduringthebaselinesurvey ofApril1995
ThemeancoverofspongesatsomesitesatbothKirraReefandPalmBeachReefhas varied significantly during some surveys (note the significant interaction between site (location)xsurvey inTable34HFigure311) However thecoverofspongestendedto bemore temporallyvariable atKirraReef than at Palm Beach Reef (Figure312) The cover of sponges at Kirra Reef varied between sites in February 1996 January 2001 March2004July2012andApril2014 However thecoverofspongesatPalmBeach Reefonlyvariedbetweensites inJanuary2001andFebruary2010 (AppendixD) The cover of sponges varied between survey at each site with 1995 1996 and 2001 most differenttootheryears(AppendixD)
ThemeancoverofspongesatKirraReefdeclinedbetweenMarch2004(20cover)and February 2010 (less than 1 cover) Since 2010 the cover of sponges has increased slightly with sponges covering 8 of the reef in March 2015 (Figure 312) In March 2015thecoverofspongeswashigherthanrecordedduringthebaselinesurveyinApril 1995(3cover)(Figure312)
Figure312 Mean cover of sponges (plusmnSE) at Kirra Reef and Palm Beach Reef on all
surveys
Table34 Univariate PERMANOVA results for differences in the cover of sponges betweensurveysandlocations
Factor$ df$ MS$effect$ PseudoF$ p$(perm)$
survey 10 18576 276 0018
location 1 39671 589 0210
site(location) 4 67354 477 0001
locationxsurvey 10 1490 221 0032
site(location)xsurvey 40 67331 477 0001
error 924 14108
Shadingdenotessignificanceatplt005
TRESBPKirraReefMarineBiotaMonitoring2015 32
frc environmental
Ascidians$
ThemeanabundanceofallascidiansotherthanPyura0stoloniferahasvariedsignifcantly between sites at Kirra Reef and Palm Beach Reef and between surveys at each site (Figure314andnotethesignificantinteractionbetweensite(location)xsurveyinTable 35) The abundance of ascidians was different between sites at Kirra Reef in January 2001May2003March2004February2005andApril2014HanddifferentatPalmBeach ReefinJanuary2001February2005February2010andMarch2015Theabundance ofascidiansvariedbetweensurveysateachsitewith1995beingmostdifferentwhenthe abundanceofascidianswaslow(AppendixD)InMarch2015theabundanceofallother ascidiansonKirraReefandPalmBeachReefwashigherthanpreviouslyreportedinthe baselinesurveyinApril1995(whennoascidianswererecorded)Themeanabundance washigheratKirraReefthanatPalmBeachReef(Figure314)
ThemeanabundanceofPyura0stoloniferahasvariedconsiderablybetweensitesatKirra Reef and Palm Beach Reef over time (note the significant interaction between site (location) x survey in Table 36) In March 2015 the mean abundance (individual per 025m2plusmnSE)of theascidianPstolonifera (Figure313)wassimilaratKirraReefand PalmBeachReef(Figure315)ThemeanabundanceofP0stoloniferahasrangedfrom 02to17individualsper025m2atbothreefssinceMay2003
Figure315 Mean abundance of ascidians (Pyura0 stolonifera) (individuals025m2)
(plusmnSE)atKirraReefandPalmBeachReefinallsurveys
TRESBPKirraReefMarineBiotaMonitoring2015 34
frc environmental
Table35 Univariate PERMANOVA results for the differences in cover of all ascidians otherthanPyura0stolonifera0betweensurveysandlocations
Factor$ df$ MS$effect$ PseudoF$ p$(perm)$
survey 10 26658 474 0001
location 1 13603 710 0104
site(location) 4 19154 149 0212
locationxsurvey 10 2629 468 0001
site(location)xsurvey 40 5621 438 0001
error 924 12828
Shadingdenotessignificanceatplt005
Table36 Univariate PERMANOVA results for the differences in Pyura0 stolonifera densitybetweensurveysandlocations
Factor$ df$ MS$effect$ PseudoF$ p$(perm)$
survey 10 16254 11842 0001
location 1 12445 60881 0206
site(location) 4 20442 56799 0001
locationxsurvey 10 79724 58082 0001
site (location) x 40 13726 38138 0001 survey
error 924 35991
Shadingdenotessignificanceatplt005
$
TRESBPKirraReefMarineBiotaMonitoring2015 35
frc environmental
Hard$Coral$
There was a significant difference between the cover of hard corals at Kirra Reef and PalmBeachReefduringsomesurveys(notethesignificantinteractionbetweenlocationx surveyinTable37)SpecificallytherewassignificantlymorehardcoralatPalmBeach Reef thanKirraReef inFebraury1996March2004April2014andMarch2015(Table 38)
ThecoverofhardcoralistypicallylowonKirraReefaccountingforlessthan2ofthe availablesubstrateInMarch2015hardcoralcoveredlessthan1oftheareaofKirra Reef which was less than the cover recorded during the baseline survey in April 1995 (Figure 316) In contrast hard coral covered 11 of the surface area at Palm Beach ReefwhichwasgreaterthanthecoverrecordedinApril1995(Figure316)
The cover of hard corals at Palm Beach Reef has been more variable over time comparedtothecoverofhardcoralatKirraReef(Figure316)Withtheexceptionofthe surveys inApril1995andJanuary2001when thecoverofhardcoralwas lowonboth reefshardcoralsaretypicallymoreprevalentatPalmBeachReef(Figure316)
Table38 PERMANOVA post hoc pairwise results for the differences in the cover of hardcoralbetweenlocationsineachsurveyevent
Hard$Corals$ Survey$
t$ p$(MC)$a$
Apr1995 054 0606
Jun1995 182 0140
Feb1996 541 0006
Jan2001 R R
May2003 166 0168
Mar2004 765 0001
Feb2005 049 0646
Feb2010 156 0197
Jul2012 283 0053
Apr2014 525 0011
Mar2015 695 0003 Shadingdenotessignificanceatplt005 a pvaluesbasedonMonteCarlotests
TRESBPKirraReefMarineBiotaMonitoring2015 37
60
50
40
30
20
10
0
Soft
Cor
al C
over
()
Kirra Reef Palm Beach Reef
frc environmental
Soft$Coral$
The cover of soft coral was significantly different between sites at both Kirra Reef and PalmBeachReefandduringsomesurveys(notethesignificant interactionbetweensite (location)xsurvey)TherewasnosoftcoralrecordedatKirraReefinMarch2015The coverofsoftcoralhasdeclinedatKirraReefsince2003andhascoveredlessthan2of theavailablesubstratesince2005whichissimilartothecoverofsoftcoraldescribedfor the baseline surveys in 1995 (Figure 317) The cover of soft coral was consistent betweensitesineachsurveyexceptbetweensitesin
sdot April1995atKirraReef
sdot 1996atKirraReef
sdot 2003atPalmBeachReefand
sdot 2014atPalmBeachReef(AppendixD)
Soft corals have historically covered more of the available space on Palm Beach Reef than on Kirra Reef However there was more temporal variability within sites at Palm BeachReefthanatKirraReef(AppendixD)ThecoverofsoftcoralatPalmBeachReef has varied over time and was highest in April 1995 (48 cover) Despite increasing sinceFebruary2005itisstilllowerthanthecoverrecordedduringthebaselinesurveyin April1995(Figure317)
Table39 UnivariatePERMANOVAresults for thedifferences in thecoverofsoft coral betweensurveysandlocations
Factor$ df$ MS$effect$ PseudoF$ p$(perm)$
survey 10 44657 1323 0001
location 1 32922 6620 0117
site(location) 4 49732 266 0036
locationxsurvey 10 40982 1214 0001
site (location) x 40 3376 181 0002 survey
error 924 18688
Shadingdenotessignificanceatplt005
$
TRESBPKirraReefMarineBiotaMonitoring2015 39
frc environmental
Crinoids$
ThereisasignificantdifferencebetweensomesitesatbothKirraReefandParmBeach Reef that varies through time (note the significant interaction between site (location) x survey inTable310) Theabundanceofcrinoidshasbeensimilarbetweensites inall years at Palm Beach ReefH and was different beween sites at Kirra Reef in June 1995 February1996May2003andFebruary2005(AppendixD)Withineachsitetherehas been some natural temporal variability particualrly at Palm Beach Reef sites in 2001 (Appendix D) The mean abundance (individuals 025m2) of crinoids (Figure 318) at KirraReefandPalmBeachReefhasgenerallybeenlessthan2individualsper025m2 andhasdeclinedatboth locationssincethebaselinesurvey inApril1995(Figure319) However the mean abundance of crinoids on Kirra Reef has shown a slight increase sinceFebruary2010(Figure319)
In March 2015 fewer crinoids were recorded at Palm Beach Reef than at Kirra ReefH crinoidshavebeenrareatPalmBeachReefsince2003
The species richness of fish recorded from Kirra Reef across all monitoring events has rangedfrom14to57 InMarch201557specieswereidentifiedat thereefwhichwas similar to April 2014 (53) and higher than previous surveys (Figure 320) Species richnessatPalmBeachReefwas lower(34species)andgenerallyvaried lessbetween surveyscomparedtoKirraReef
InMarch2015 the assemblage of fish at KirraReef comprised species fromall trophic levelsincludingdetritivoresplanktivoresherbivoresandcarnivores(AppendixE)Asin previous surveys the assemblage was dominated by herbivores and planktivores Yellowtail (Trachurus0 novaezelandiae) and striped sea pike (Sphyraena0 obtusata) were the dominant species present in large schools (Figure 321) Australian mado (Atypichthys0 strigatus) ringRtailed surgeon (Acanthurus0 blochii) silver trevally (Pseudocaranx0 georgianus) eastern pomfred (Schuettea0 scalaripinnis) sweep (Scorpis0 lineolatus) and various wrasses were also very abundant releative to other species (AppendixE)
Two new species were observed at Kirra Reef the orangeRband surgeon (Acanthurus0 olivaceus) and the unicornfish (Naso0 sp) Five new species were recorded at Palm BeachReef
No threatened or protected fish species listed under the Queenslandrsquos Nature0 Conservation0Act01992ornationallyundertheEnvironmental0Protection0and0Biodiversity0 Conservation0 Act0 1999 were observed The complete list of species recorded and the relativeabundanceispresentedinAppendixE
TRESBPKirraReefMarineBiotaMonitoring2015 42
60
0
10
20
30
40
50
Num
ber
of F
ish
Spe
cies
Apr-95
Jun-95
Feb-96
Jan-01
May-03
Mar-04
Feb-05
Feb-10
Jul-12
Apr-14
Mar-15
Kirra Reef Palm Beach Reef Location
frc environmental
Figure320 Number of fish species recorded at Kirra Reef and Palm Beach Reef on
ThegreatestchangetotheecologicalconditionofKirraReefsincethebaselinesurveyin 1995 has been the loss of large areas of hard substrate that support benthic flora and faunaThedeliveryoflargesandvolumesduringthestage1dredgingoperations(1995 to1998)andtheinitialoperationofthesandbypasssystem(2001to2008)resultedinan increaseinwaveactionandtidalcurrentsredistributingthissandoverKirraReef
The three major outcrops of Kirra Reef (northern southern and eastern sections) are naturally exposed and covered depending on water and sand movements In March 2015 the rocky outcrops in the northern section of Kirra Reef were exposed and supportedamoderatelydiversebenthicassemblagedominatedbyturfalgaeTherewas arelativelyhighfishdiversityatKirraReefTheecologicalassemblageexhibitedsignsof ongoingstressfromphysicaldisturbanceincludingtheabsenceofsoftcoralsandrarityof hardcoral(MumbyampSteneck2008)HoweverKirraReefhasarelativelyhighcoverof sponges and ascidians Sponges ascidians and crinoids were more abundant at Kirra ReefthanatPalmBeachReefinMarch2015
KirraReefcontinues toprovidehabitatandsupport importantecological functions in the region providing hard substrate for the colonisation of algae and benthic invertebrates and food and refuge for fish As sand levels have stabilised since 2008 assemblages have becomemoresimilar to those recordedprior to implementationof the TRESBP in April1995 Forexamplemacroalgalcover inApril1995andMarch2015wasrelatively similarHoweverassemblagecompositionisstillsignificantlydifferenttothatrecordedin thebaselinesurveysmostnoticeablyduetoa lowercoverofbaresubstrateandhigher coverofturfalgaeandascidianssincesurveyshavebeenperformed
Benthic$Macroalgae$
The cover of macroalgae at Kirra Reef was relatively similar during the 2014 and 2015 surveys and remained well below the peak of nearly 60 cover recorded in January 2001TherewasasteepdeclineinthecoverofmacroalgaebetweenJanuary2001and May2003whichappearedtobestronglyassociatedwith thedecline inreefareaduring that time as well as a decline in the cover of Sargassum sp (an important indicator speciesonKirraReef) SimilardeclineswereevidentatPalmBeachReefbetween the January2001andMay2003surveys
TRESBPKirraReefMarineBiotaMonitoring2015 45
frc environmental
The cover ofmacroalgae at Palm Beach Reef was much lower thanat Kirra Reef over time There are several possible reasons for the lower cover of macroalgae at Palm Beach
sdot PalmBeachReefisdeeperthanKirraReefandgenerallyhashigherturbidityand therefore greater light attenuation The quantity and quality of available light affectsthedistributionandgrowthofmacroalgae(MillerampEtter2008)
sdot Differences in the pattern of recruitment of algal species to the reefs due to differentwatercurrentsandtimingofthesurveys(Kennelly1987b)
sdot Increased competition with turf algae and sessile benthic invertebrates which competeforspacewithmacroalgae(Kennelly1987aHMillerampEtter2008)
sdot PresenceofdifferentspeciesandhigherdensityofherbivoresatPalmBeachReef (particularly sea urchins and herbivorous fish) which graze on macroalgae (McCook1997HJompaampMcCook2002)
Biological assemblages exposed to physical stress typically exhibit greater levels of temporalandspatialvariability(WarwickampClarke1993HChapmanetal1995)Temporal variationinthecoverofmacroalgaeatKirraReefislikelytobeprincipallyduetotheeffect ofphysicaldisturbance fromwaveactionaswellas theassociatedassociatedabrasion andsmotheringbysandTheeffectsofthesephysicaldisturbanceswouldincreasewith thereductionofKirraReefasedgeeffectsarepronouncedandwaterdepth isreduced Increasedsmotheringbysandcanalsoreducediversity(Hatcheretal1989)abundance recruitment growth survival and seasonal regeneration of macroalgae (Umar amp Price 1998HCheshireetal1999)
Changes in the cover of macroalgae on Kirra Reef over time are also likely due to the extentofthereefchangingHthefishandmobileinvertbratesassociatedwiththereefmay have concentrated which would in turn increase grazing pressure Increased grazing pressure from fish and mobile invertebrates can reduce the coverage and diversity of macroalgaeonreefs(McCook1997HJompaampMcCook2002)
Thecoverof turfalgaeatbothKirraReefandPalmBeachReefhasvariedsignificantly betweensurveysPriorto2005turfalgaetypicallycoveredlessoftheavailablesurface areaonKirraReefthanPalmBeachReefInMarch2015themeancoverofturfalgae hasincreasedsincebaselinesurveysin1995andwasrelativelysimilarbetweenreefs(40 plusmn4atKirraReefcomparedto48plusmn4atPalmBeachReef)Thecoverofturfalgaeat Kirra Reef was similar in 2014 and 2015 which was generally higher than previous surveysexceptduringJuly2012whencoverofturfalgaepeakedat67plusmn4
TRESBPKirraReefMarineBiotaMonitoring2015 46
frc environmental
Turfalgaearebecomingadominantcomponentofcommunitiesaroundtheworld likely the result of rapid colonisation of openspace after a disturbance (eg storms) nutrient enrichment andor changes in grazing pressures Turf algae can also reflect a more physically robust growth form suited to high wave energy environments (than foliose macroRalgae)TurfalgaepeakedintheJuly2012surveylikelyrelatedtotheincreasein bare reef exposure following a stormy conditions in early 2009 and between December 2011 and June 2012 Turf algae have been the dominant form of algae on Kirra Reef sincethistimealbeitthecoverlowerthanthe2012survey
Increased cover of turf algae is typically related to good light conditions high concentrationsofnutrientsandlownumbersofgrazerssuchasfish(orconstantgrazing pressure preventing macroalgae colonisation) However the relationship between algal dynamics physical disturbance water quality and herbivore grazing activity is complex andthecoverof turfalgaecanexhibitextremetemporalvariabilityasaconsequenceof the interactionbetween topRdownandbottomRupprocesses (Russ2003HBellwoodetal 2006H Hughes et al 2007H Albert et al 2008H Hoey amp Bellwood 2008H Mumby 2009) Furtherinvestigationwouldberequiredtoreliablydeterminethemechanismsofchangein bothmacroalgaeandturfalgaeassemblagesonthesereefs
Benthic$Macroinvertebrates$
AtKirraReeftheburialandreRemergenceofrockyoutcrops(influencedbytheTRESBP) islikelytohaveincreasedtemporalvariabilityinthedistributionandabundanceofbenthic macroinvertebrates Additional perturbations such as wave action and sand abrasion (each influenced through changes in bathymetry seabed topography and water depth) are likely to have resulted in the decline in cover and diversity of the benthic macroinvertebratesatKirraReefbetweensurveysparticularlybetweenMarch2004and February2005andduringtheseverestormsof2009Benthicmacroinvertebratessuch asascidiansspongeshardcoralandsoftcoralarehighlysusceptible to theeffectsof stormandwavedisturbancephysicalabrasionandburialbysand(KayampKeough1981H Walker et al 2008) which can affect settlement growth rate and survival (Dodge amp Vaisnys1977HRogers1990)
Physical disturbance from sand burial sand abrasion and the action of storm waves appeartokeepthebenthicassemblagesofKirraReefinastateofearlysuccessionItis commonforearlypioneerspeciessuchassomemacroalgaetorecruitrapidlytoahard surface in large numbers allowing these species to dominate assemblages early in the successionaltrajectory(Walkeretal2007)
Afurther indicatorof theearlystateofsuccessionatKirraReef isthatthecoverofhard and soft coral has remained very low (generally lt 5) In March 2015 less than 1
Benthic macroinvertebrate cover may also be affected indirectly through increased competitionwithmacroalgaeforspaceThepresenceoflargemacroalgaecanaffectthe recruitment and survival of sessile benthic invertebrates as fronds moving with wave action sweep and abrade the surface of rocks killing new recruits especially corals (Kennelly1989HMcCooketal2001)Itcantakeseveralyearsforhardandsoftcoralto become dominant on reefs in the SEQ region (SchlacherRHoenlinger et al 2009) Therefore hard coral is not expected to become abundant until several years after the reefhasbeenuncoveredandonlyifthephysicaldisturbanceregimeandsupplyofnew recruitsissufficienttosupportsurvivalandgenerationalsuccessionofthesespeciesThe coverofhardandsoftcoralsatKirraReefwerebothverylowandpatchypriortothestart oftheTRESBP
Sponges and ascidians are highly susceptible to smothering and sand abrasion unless theyhaveathicktunic(outercoveringmadeofkeratin)liketheascidianP0stolonifera0or strong internal keratin silicon or calcareous structures in the case of some species of sponges0(KayampKeough1981HMcGuinness1987HWalkeretal2008)Duetoincreased wave action and sedimentation (which can be influenced by the TRESBP) the mean coverofascidiansandspongeswasexpectedtobemuchloweronKirraReefthanPalm Beach Reef However in March 2015 the cover of sponges was similar between the reefsandthecoverofascidians(otherthanP0stolonifera)wasgreateratKirraReefthan at Palm Beach Reef This suggests that Kirra Reef is slowly recovering from the increasedstressofphysicaldisturbancesuchas increasedwaveactionandsandscour andorthatwaveandstormconditionshavebeenlesssevereinthepastfewyears
Fish$
KirraReefcontinuestosupportahighdiversityofreefRassociatedandpelagic(ienonR reefassociated) fishspecies Despite itsdiminishedsizecompared to1995KirraReef continuestoprovidevaluablehabitatforanumberoffishspeciesfromdifferentfunctional groups
ThereisahighdegreeofinterRannualvariabilityinthespeciesandabundanceofthefish present at Kirra Reef compared with the assemblage at Palm Beach Reef This likely reflectsthetemporalvariabilityintheavailablehabitatasaconsequenceofreefburialand reRemergenceThediversityqualityandarealextentofreefhabitatareimportantfactors influencing the distribution abundance biomass and diversity of reef fish (Bellwood amp Hughes2001HFriedlanderetal2003)Diversityandabundanceoffishcanincreasewith
TRESBPKirraReefMarineBiotaMonitoring2015 48
frc environmental
greaterstructuralcomplexityandincreasedheterogeneityofavailablehabitats(Bellwood ampHughes2001)Thissuggeststhatperiodsofreefburialreducetheoveralldiversityof reefRassociated fish species at Kirra Reef Despite the reduction in overall reef space therewasalargervarietyofhabitats(suchasmarcoalgaeandturfalgae)in2015which was likely to be related to the high diversity of fish assemblages This is particularly importantforseveralspeciesthatdependonthepresenceoflsquostructurersquosuchasprovided by reef habitat (ie oldwife moray eels damselfish and Australian mado that were recordedinMarch2015butwerenotrecordedinJuly2012)
Theabundanceanddiversityof fishare likelytobenegativelyaffectedfollowingperiods of severe weather which create unfavourable conditions for many species and may further exacerbate the affects of abrasion and sedimentation The biomass of fish is knowntodecreasewithincreasingexposuretophysicaldisturbancefromwaveactionand strong currents (Friedlander et al 2003) As our surveys have been undertaken at different times of the year variation in the prevailing conditions at the time of sampling could also influence the types of fish observed (and the amount of reef habitat that is availableatanytime)Manyofthespeciesmayalsobeaffectedbyseasonalchangesin the water temperature such as damselfish which are less abundant in cool waters However theoveralldiversityof the fishassemblageatKirraReef is likely toreflect the sizeoftheoutcropsexposedwithagreaterphysicaldisturbance(fromseaconditionsand sandmovement)andcompetitionHandlesserfoodavailablewhenthereefiscovered
ThepredictedimpactstoKirraReefasaresultoftheTRESBPincludedaccretionofsand around the base of the rock outcrops causing a reduction in extent of reef It was predictedthatsanddeliveryaspartoftheprojectwouldeventuallymimiclsquonaturalrsquopatterns ofsanddispersalandthatthereefwouldreturntoitsnaturalextent(ietheextentpriorto extension of the Tweed River training walls in 1962) The benthic flora and fauna assemblages of the reef the historical reef extent and natural sand transport patterns wereexpectedtoreturntoconditionsobservedbeforetheextensionofthetrainingwalls between 1962 and 1965 However the Environmental Impact Study did not predict the ecologicalconsequencesofboththereducedarealextentandincreasedwaveenergy(a consequenceofdecreaseddepth)thathavebeenrecorded
ThecurrentextentofKirraReef remains less than50of that recorded in1962and in 1995beforethesanddeliverybytheTRESBPcommencedHowevertheextentofreef in1995 wasstrongly influenced by adepletion in sand following the construction of the Tweed River training walls and the Kirra Point groyne Accumulation of sand on Kirra ReefwasobservedtoincreaseasaresultofindirectsandnourishmentbytheTRESBP and the reef has been extensively covered (particuarly between 2005 and 2010) as a result
Whiletheextentofthereefcontinuestochangeovertimethedeliveryofsandaspartof the project now more closely matches the natural rate of longshore sand transport ShortRtermandseasonalchangesintheextentofthereefarenowlikelytobetheresultof waveandcurrentaction(particularlyduringservereweatherevents)thanadirectimpact of the TRESBP Therefore the extent of Kirra Reef in March 2015 is broadly in accordancewithpredictionsmadeintheEISwhichpredictedthatthereefwouldreturnto a condition similar to that exhibited in the preR1960rsquos ie before the extension of the TweedRiverbreakwatersthatinterruptedlittoralsandsupplytothesebeaches
InDecember2013KirraPointgroynewasextendedby30mwiththeexpectationthatthe beach bar would move seaward as a consequence At present Kirra Point groyne is unlikelytohavehadamajorimpactonthearealextentofKirraReefHoweverongoing monitoringbasedonaerialphotographsmayprovidefurtherinsight
Sessile benthic assemblages on Kirra Reef are highly susceptible to the influence of storms and associated wave action (Kay amp Keough 1981H Walker et al 2008) The shallowreefissurroundedbymobilesandwhichcanshiftnaturallyinresponsetowave action during storms causing burial of large sections of Kirra Reef This effect has reduced the availability of rocky substrate for colonisation and the availability of refuge
Fromanexaminationof theextentofKirraReef fromarealmapsandwaveheightdata thereappears tobea relationshipbetween theareaof rockexposedandstormevents Notably in a series of storm events in May 2009 corresponds with large areas of rock becoming exposed (with the reef approximately 100m2 in 2006 and approximately in 1009m2 2009) Further a stormy conditions between December 2011 and July 2012 correspondstotheareaofexposedrockmorethandoublinginsizeWhiletherewasno changetothetotalareaofexposedrockfollowingstormyconditionsinearly2013there wasaclearchangeinthedistibutionofexposedrockduringthistimeSince2013storm conditions have been calm to moderate and there has been little change in the areal extentanddistrubtionofexposedrockatKirraReef
WaveheighttypicallyincreasesduringstormeventsandgiventheshallowdepthofKirra Reef waves are more likely to shoal and break across the reef during storms This increases thephysicaldisturbanceabrasionandsedimentationofbenthicassemblages onKirraReefStormdisturbancecancauselocalreductionsinthespeciesrichnessand abundanceofcoral(Woodleyetal1981HMasselampDone1993HHughes1994HConnellet al 1997) and can alter fish assemblages indirectly through habitat modifications (Kaufman1983HJonesampSyms1998)ordirectlybyincreasingfishmortality(Lassig1983) The hydrodynamic forces produced by wave action are an important source of disturbance in subtidal habitats inflicting damage through direct physical impact and abrasion(UnderwoodampKennelly1990)DirectimpactsfromphysicaldisturbanceatKirra Reefareevidentduringsurveyeventswhenlargefragmentsofmacroalgaearepresentin thewatercolumnoverthereef
Storm and wave action (and associated sedimentation and abrasion) continue to be importantforcesshapingthedistributionandabundanceofbenthicspeciesatKirraReef Increased magnitude and frequency of physical disturbance resulting from increased exposureorsusceptibility tostormsandassociatedwaveaction (asonKirraReef)can lead to a decrease in the diversity of sessile invertebrate assemblages DisturbanceR drivenreductionsinbiodiversityhavethepotentialtoimpactnegativelyonthehealthand productivity of reef ecosystems (Walker et al 2008) Biodiversity is important to reef health given that many of these species (eg sponges bryozoans and ascidians) contribute a range of vital ecosystem services to reefs including nutrient cycling (Scheffers et al 2004) trophic interactions and food webs (Lesser 2006H Pawlik et al 2007) bioRerosion (Rutzler 2002H LopezRVictoria et al 2006) and stabilizing substrata (DiazampRutzler2001HWulff2001)
Theimpactsof increasedwaveactionandsedimentationonthebenthicassemblagesat Kirra Reef are likely to be greatest during and immediately following storm conditions
TRESBPKirraReefMarineBiotaMonitoring2015 51
frc environmental
Partitioningtheinfluenceofstormandwavedrivendisturbancefromthatoftheoperation oftheTRESBPwouldrequireamuchmorestatisticallypowerfulandtemporilyreplicated experimental design Given there is a large collection of wave and storm data by TRESBP this would involve greater temporal sampling of Kirra Reef including event samplingfollowingseverewaveandstormactivity
The data generated by this Kirra Reef biota monitoring program doesnrsquot support statistically rigorous consideration of seasonality (monitoring has been at its most frequentannual)
InApril2014andMarch2015KirraReefcoveredlessthan50ofthereefrsquosextentprior to theoperationof theTRESBP The lossof reefhabitathasreducedtheavailabilityof hard substratum available for colonisation and consequently the abundance of benthic sessileassemblages
The reduced depth of water resulting from the accumulation of sand exacerbates the effects of storms and wave action It is likley that as a consequnece the biological communities of Kirra Reef will reflect earlyRstage succession more frequently and for longerperiods
While there is sufficient structure available frcenvironmentalexpect that Kirra Reef will continuetoprovideimportanthabitatforadiverseassemblageoffishes
TRESBPKirraReefMarineBiotaMonitoring2015 52
frc environmental
5$ Conclusions$
Although there is still a substantial portion of the reef covered compared to before the extension of the Tweed River entrance breakwaters the current extent of Kirra Reef is broadly inaccordancewithpredictionsmadein theEIS Initial lsquocatchRuprsquobypassingand dredgeplacementofsand(between2001and2008)resulted in theburialofKirraReef Subsequentsanddelivery(since2008onwards)morecloselyreflectsnaturalpatternsof longRshoresandtransportandisthereefhasslowlyreRemerged
Theextentofthereefhasbeenrelativelystablesince2013Thishasallowedforsome succession in the benthic assemblages including a relatively high cover of sponges ascidiansandcrinoidsWiththedeliveryofsandmorecloselymatchingthenaturalrateit isexpected the reef willundergoshortRtermchanges in extentdue toseasonal shifts in sand deliveryH however the diversity of benthic assemblages on Kirra Reef is likely to increaseovertimeThiswouldcreatemorespaceforspeciestorecruitandreducesthe influence of sand abrasion and wave damage It was predicted that the areas of Kirra Reef newly exposed in 2012 would undergo a shift from turfRdominated communities to more diverse communities that could include macroalgae sponges ascidians and potentiallyhardandsoftcoralWiththeexceptionofhardandsoftcoralsthisprediction wasconfirmedbytheresultsoftheApril2014andMarch2015surveys
ThediversityoffishesassociatedwithKirraReefisbroadlysimilartothatrecordedprior tothecommencementofsandbypassingin1995Giventhatfisharemobilethegreatest impacts on fish assemblages are likely to be shortRterm changes due to both the prevailingconditionsandchangestheextentofavailablehabitatthatprovidesshelterand foodforavarietyofdifferentspeciesIfKirraReefincreasesinsizethereislikelytobea greater proportion of cryptic benthic species as these species are more typical of assemblagesinalaterstageofsuccession(eg(WillisampAnderson2003))
Assuming a broadly stable delivery rate of sand and consequent stable extent of Kirra ReeflsquorecoveryrsquoislikleytobesubstantivelycompleteFloralandfaunalcommunitieswill undergo succession between severe storm events but are likley to remain relatively dynamic
Albert S Udy J amp Tibbetts I 2008 Responses of algal communities to gradients in herbivorebiomassandwaterqualityinMarovoLagoonSolomonIslandsCoral0 Reefs2773R82
Anderson MJ 2001 A new method for nonRparametric multivariate analysis of varianceAustral0Ecology2632R46
Anderson MJ 2004 PERMDISP0 a0 FORTRAN0 computer0 program0 for0 permutatinoal0 analysis0 of0 multivariate0 dispersions0 (for0 any0 twoSfactor0 ANOVA0 design)0 using0 permutational0 tests Department of Statistics University of Auckland New Zealand
Cannon LR Goeden GB amp Campbell P 1987 Community patterns revealed by trawling in the interRreef regions of the Great Barrier Reef Memoirs0 of0 the0 Queensland0Museum2545R70
Chapman MG Underwood AJ amp Skilleter GA 1995 Variability at different spatial scalesbetweenasubtidalassemblageexposedtothedischargeofsewageand two control assemblages Journal0 of0 Experimental0 Biology0 and0 Ecology 189 103R122
Cheshire AC Miller DJ amp Stewart R (1999) Effect0 of0 dispersed0 sediment0 plumes0 from0beach0sand0replenishment0dredging0on0recruitment0of0phaeophycean0algae0 to0rocky0reefs0in0Gulf0St0Vincent0South0Australia0The0Impact0of0Sand0Dredging0 on0 Benthic0 Community0 Structure0 at0 the0 Port0 Stanvac0 Dredge0 Site0 20 1S39 UniversityofAdelaideAdelaide
ConnellJHHughesTPampWallaceCC1997A30Ryearstudyofcoralabundance recruitment and disturbance at several scales in space and time Ecological0 Monographs67461R488
Diaz MC amp Rutzler K 2001 Sponges an essential component of Caribbean coral reefsBulletin0of0Marine0Science69535R546
DodgeREampVaisnysJR1977Coralpopulationsandgrowthpatternsresponsesto sedimentation and turbidity associated with dredging Journal0 of0 Marine0 Research35715R730
Done TJ 1982 Patterns in the distribution of coral communities across the central GreatBarrierReefCoral0Reefs195R107
Edwards RA amp Smith DA 2005 Subtidal assemblages associated with a geotextile reef insouthReastQueenslandAustraliaMarine0and0Freshwater0Research56 133R142
FisheriesResearchConsultants1991Survey0of0the0Intertidal0and0Subtidal0Rocky0Reefs0 of0 the0 Sunshine0 Coast report prepared for Queensland National Parks and WildlifeService
HarrisonPHarriotVBanksSampHolmesN1998ThecoralcommunitiesofFlinders Reef andMyora Reef in theMoretonBay MarineParkQueensland Australia In Moreton0 Bay0 and0 Catchment Tibbits I Hall N amp Dennison W (Eds) SchoolofMarineScienceUniversityofQueenslandStLuciapp525R536
Hatcher B Johannes R amp Robertson A 1989 Review of research relevant to the conservationofshallowtropicalmarineecosystemsOceanography0and0Marine0 Biology0an0Annual0Review27337R414
Hoey A amp Bellwood D 2008 CrossRshelf variation in the role of parrotfishes on the GreatBarrierReefCoral0Reefs37R47
TRESBPKirraReefMarineBiotaMonitoring2015 56
frc environmental
Hollingsworth P 1975 Environmental Investigation Report Crown Reserve R R68 Currumbin Creek City of the Gold Coast Land Administration Commission unpublishedreport
Hughes TP 1994 Catastrophes phase shifts and large scale degradation of a CaribbeancoralreefScience2651547R1551
Hughes TP Rodrigues MJ Bellwood DR Ceccarelli D HoeghRGuldberg O McCook L Moltschaniwskvi N Pratchett MS Steneck RS amp Willis B 2007Phaseshiftsherbivoryandtheresilienceofcoralreefstoclimatechange Current0Biology17360R365
Hutchinson A Rempel C Taveras V Loder J amp Salmond J 2013 Reef0 Check0 Australia0 South0 East0 Queensland0 Summary0 Report0 2013 report prepared for ReefCheckFoundationLimited
Hyder Consulting 1997 Tweed0 River0 Entrance0 Sand0 Bypassing0 Project0 Permanent0 Bypassing0 System0 0 Environmental0 Impact0 Statement0 0 Impact0 Assessment0 Study report prepared for New South Wales Department of Land and Water Conservation
Jompa J amp McCook LJ 2002 Effects of competition and herbivory on interactions betweenahardcoralandabrownalgaJournal0of0Experimental0Marine0Biology0 and0Ecology27125R39
KayAMampKeoughMJ1981Occupationofpatchesintheepifaunalcommunitieson pier pilings and the bivalve Pinna bicolor at Edithburgh South Australia Oecologia48123R130
KennellyS1987aInhibitionofkelprecruitmentbyturfingalgaeandconsequencesfor an Australian kelp community Journal0 of0 Experimental0 Marine0 Biology0 and0 Ecology11249R60
Kennelly S 1987b Physical disturbances in an Australian kelp community I temporal effectsMarine0Ecology0Progress0Series40145R153
TRESBPKirraReefMarineBiotaMonitoring2015 57
frc environmental
Kennelly S 1989 Effects of kelp canopies on understory species due to shade and scourMarine0Ecology0Progress0Series50215R224
Lassig BR 1983 The effects of a cyclonic storm on coral reef fish assemblages Environmental0Biology0of0Fishes955R63
Lawson S McMahon J amp Boswood P 2001 Environmental management of the construction and operation of a sand bypassing system at the Tweed River EntranceInThe15thAustralasianCoastalandOceanEngineeringConference the 8th Australasian Port and Harbour Conference 25 R 28 September 2001 QueenslandAustralia
Lesser MP 2006 BenthicRpelagic coupling on coral reefs feeding and growth of Caribbean sponges Journal0 of0 Experimental0 Marine0 Biology0 amp0 Ecology 328 277R288
LopezRVictoriaM ZeaSampWei E2006 Competition for spacebetweenencrusting excavatingCaribbeanspongesandothercoral reeforganismsMarine0Ecology0 Progress0Series312113R121
MalcolmHASmithSDAampJordanA2009Usingpatternsofreeffishassemblages to refine a Habitat Classification System for marine parks in NSW Australia Aquatic0Conservation0Marine0and0Freshwater0Ecosystems2083R92
Massel SR amp Done TJ 1993 Effects of cyclone waves on massive coral assemblages on the Great Barrier Reef meteorology hydrodynamics and demographyCoral0Reefs12153R166
Mumby PJ amp Steneck RS 2008 Coral reef management and conservation in light of rapidly evolving ecological paradigms Trends in Ecology amp Evoution 23 555 -563
Murphy HM amp Jenkins GP 2010 Observational methods used in marine spatial monitoring of fishes and associated habitats a review Marine and Freshwater Research 61 236-252
Noriega R 2007 An Overview of Available Information on Sandy Beach Ecology Coastal Sand Dunes Rocky Reefs and Associated Biota on the Gold Coast Griffith Centre for Coastal Management Research Report No 85 report prepared for Griffith University
Parker P (1995) Structure to Reef Fish Assemblages at Julian Rocks Northern New South Wales Masters Thesis Griffith University
Parker PG 1999 Fish assemblages at Julian Rocks and the adjacent waters of northern New South Wales Australia Australian Zoologist 31 134 - 160
Pawlik JR Steindler L Henkel TP Beer S amp Ilan M 2007 Chemical warfare on coral reefs sponge metabolites differentially affect coral symbiosis in situ Limnology and Oceanography 52 907-911
Reef Check 2010 httpwwwreefcheckaustraliaorgdatahtml accessed December 2015
Robinson KI amp Pollard DA 1982 Marine and estuarine reserves in Australia with particular reference to New South Wales Wetlands 2 17 - 26
Rogers CS 1990 Responses of coral reefs and reef organisms to sedimentation Marine Ecology Progress Series 62 185-202
Russ GR 2003 Grazer biomass correlates more strongly with production than with biomass of algal turfs on a coral reef Coral Reefs 22 63-67
Rutzler K 2002 Impact of crustose clionid sponges on Caribbean reef corals Acta Geologica Hispanica 37 61-72
Scheffers SR Nieuwland G Bak RPM amp van Duyl FC 2004 Removal of bacteria and nutrient dynamics within the coral reef framework of Curacao (Netherlands Antilles) Coral Reefs 23 413-422
TRESBP Kirra Reef Marine Biota Monitoring 2015 59
frc environmental
Schlacher-Hoenlinger M Walker S Johnson J Schlacher T amp Hooper J 2009 Biological Monitoring of the Ex-HMAS Brisbane Artificial Reef Phase II - Habitat Values report prepared for Environmental Protection Agency (EPA)
Smith KA 2003 A simple multivariate technique to improve the design of a sampling strategy for age-based fishery monitoring Fisheries Research 64 79-85
Smith S Edwards R Dalton S amp Harrison M 2005 Biological assessment of fish and benthic communities at Palm Beach Bait Reef Gold Coast Queensland report prepared for University of New England
TRESBP 2014 Autum 2009 storms httpwwwtweedsandbypassnswgovauarticles-and-studiesinteresting-itemsautumn-2009-storm updated 4 May 2014 accessed December 2015
TRESBP 2015a Tweed Sand Bypassing Restoring Coastal Sand Drift Improving Boating Access ndash Techinical information httpwwwtweedsandbypassnswgovau__dataassetspdf_file0004552055kir ra-feb-2015pdf acessed December 2015
TRESBP 2015b Waves httpwwwtweedsandbypassnswgovauenvironmental-monitoringcoastal-conditionswaves updated 30 September 2015 accessed December 2015
Umar MJMLJ amp Price IR 1998 Effects of sediment deposition on the seaweed Sargassum on a fringing coral reef Coral Reefs 17 169-177
Underwood AJ amp Kennelly SJ 1990 Ecology of marine algae on rocky shores and subtidal reefs in temperate Australia Hydrobiologia 192 3-20
Walker S Schlacher T amp Schlacher-Hoenlinger M 2007 Spatial heterogeneity of epibenthos on artificial reefs fouling communities in the early stages of colonization on an East Australian shipwreck Marine Ecology 28 435-445
Walker SJ Degnan BM Hooper JNA amp Skilleter GA 2008 Will increased storm intensity from climate change affect biodiversity in non-scleractinian sessile fauna on coral reefs Global Change Biology 14 2755-2770
Warwick RM amp Clarke KR 1993 Increased variability as a symptom of stress in marine communtities Journal of Experimental Marine Biology and Ecology 172 215-216
Thenumberofsitessurveyedhasvariedover timeasaresultof the fluctuating levelof sandcoveringKirraReef
Prior to May 2003 three sites were assessed along the eastern and northern edge of KirraReef(KirraReefOutersites1to3)andthreesiteswereexaminedalongtheinshore marginof the reef (KirraReef Inner sites1 to 3)(MapA1) ReefRedge (ieKirraOuter) siteswerechosentoprovideearlywarningofimpactsfromoffshoreplacementofdredged sandwhilst inshoresites(ieKirraInner)werechosentoindicatewhetherimpactsfrom inshore beach profile development were affecting the reef platform In May 2003 the threeeasternsitesatKirraReef (ieKRO1KRO2andKRI1)werecompletelycovered with bare mobile sand Consequently only the three western sites at Kirra Reef (ie KRO3KRI2andKRI3)supportedbenthicfloraandfaunaInMarch2004theextentof the remainingwesternoutcropof KirraReef had been further reduced so that all inner reefsiteswerecompletelycoveredwithmobilesandConsequentlyonlyasingleoriginal reefsite(ieKRO3)couldbesurveyed(Figure23)Thereforetoprovideanindicationof the condition of the remaining reef two new sites were established (ie KRN1 and KRN2)(Figure23)andsurveyedinMarch2004Theextentofthewesternreefhadbeen further reduced by February 2005 and a third new site (ie KRN3) was established (Figure23)Consequentlyfoursites(KRO3KRN1KRN2andKRN3)weresurveyedin February2005
InFebruary2010fourKirraReefsites(ieKRO3KRO1KRN1andKRN2)wereclearof thesurroundingsandandsupportedbenthic floraand fauna Inaddition several rocks protruded from the sand in the vicinity of site KRI2H these were assessed to provide a quantitativeindicationofbroadRscaletemporalchangestotheinshorereefcommunities
SOURCEScopy Copyright Commonwealth of Australia (Geoscience Australia) 2001 2004 2006copy The State of Queensland (Department of Natural Resources and Mines) 2015copy Nearmap 2014 2015
DATE2015-09-09
DRAWN BYCF
VERSION02
PROJECTIONCoordinate System GDA 1994 MGA Zone 56Projection Transverse MercatorDatum GDA 1994
plusmn SCALE
0 50 100
Metres
Scale 12500 A3
frc environmental
Appendix$B$ Introduction$to$Data$Analysis$Used$
Multivariate$Analyses$
Multivariate statistical techniques are widely used in ecology to assess the similarities relationshipsbetweenassemblagesWhereasunivariateanalysescanonlycompareone variable at a time (eg an index of community structure such as a diversity index or a singleindicatorspecies)multivariateanalysescancomparesamplesbasedontheextent thatassemblagesshareparticulartaxaandabundances(ClarkeampWarwick2001)
Thefirststepofmultivariateanalysisusuallyinvolvesthecreationofamatrixofsimilarity coefficients computed between every pair of samples The coefficient is usually a measureofhowclose theabundance is foreachspecies (definedso that100= total similarity and 0=complete dissimilarity) The Bray Curtis similarity measure is commonlythemostappropriateforbiologicaldata(ClarkeampWarwick2001)
MultidimensionalScaling
NonRmetricmultiRdimensionalscalingordinations(nMDS)attempttoplacesamplesintwo dimensionalspacesothattherankorderofthedistancesbetweensamplesmatchesthe rankorderofthematchingsimilaritiesfromthesimilaritymatrix(ClarkeampWarwick2001) Thisprovidesavisualrepresentationofthesimilaritiesbetweenassemblageswithineach sampleEachoftheaxesisnotrelatedtoanyparticularvalueHinfactaxescanberotated toprovide thebestvisual representationof thedata Ordinationsareparticularlyuseful tools for analysing and visually presenting differences between assemblages Ordinationsareessentiallymapsofsamples inwhich theplacementofsampleson the mapreflectsthesimilarlyofthecommunitytothecommunitiesinothersamples(Clarkeamp Warwick 2001) Distances between samples on an ordination attempt to match the similarities inassemblagestructurenearbypoints representassemblageswithvery few attributes(speciesorabundanceofspecies)Hpoints faraparthavevery fewattributes in common(ClarkeampWarwick2001)
A stress coefficient is calculated to reflect the extent to which the multiRdimensional scalingordinationandthesimilaritymatrixagree(ClarkeampWarwick2001)(iehowwell the multiRdimensional scaling ordination accurately reflects the relationship between samples)Stressvaluesoflt015aregenerallyacceptable
In Figure A1 each freshwater macroinvertebrate sample is represented on the multiRdimensionalscalingordination By lookingat thedistancesbetweeneachsample
ANOSIMisanalogoustoANOVAinunivariatestatistics(Smith2003)AglobalRstatistic iscalculatedtodeterminewhetherthereisasignificantdifferencebetweenallsamplesIf there are differences then pairwise comparisons are conducted to test for differences betweenpairsofsamples(analogoustopostRhoctestsinANOVA)
The R value lies between R1 and +1 (all similarities within groups are less than any similarity between groups) with a value of zero representing the null hypothesis (no differenceamongasetofsamples)(ClarkeampWarwick2001)ComparisonofpairwiseR values can give an indication of how different assemblages are R values close to 0 indicatelittledifferencevaluesaround05indicatesomeoverlapandvaluescloseto1to indicate many or substantial differences In many instances however researches are primarily interestedinwhethertheRvalueisstatisticallydifferentfromzero(usuallyata confidence level of 005) (Clarke amp Warwick 2001) (ie whether they can reject the null hypothesis)
ANOSIM can provide information on whether the (visual) differences between assemblages in the multiRdimensional scaling ordination are significantH it is an independenttestfromthemultiRdimensionalscalingordinationItisbasedontestingthe
TRESBPKirraReefMarineBiotaMonitoring2015 B2
frc environmental
differences between the rank similarities in the similarity matrix not on the distances betweensamplesinthemultiRdimensionalscalingordination(ClarkeampWarwick2001)
PermutationalMultivariateAnalysisofVariance
PERMANOVAisusedtotestsimultaneousresponsesofoneormorevariablestooneor more factors in an a0 priori0 structured design using random permutation of the data to assess significance (Anderson 2004) PERMANOVA generates a pseudo FRstatistic similar to traditional ANOVA but pRvalues are calculated with permutations which does notassumenormaldatadistribution PERMANOVAcanprovide informationonwhether the (visual) differences between assemblages in a multiRdimensional scaling ordination are significantH however it is an independent test from the multiRdimensional scaling ordination
Thelevelofmultivariatedispersionamongsampleswithineachofthetestgroupscanbe examined using the permutational analysis of multivariate dispersions (PERMDISP) routine(Anderson2004)Intraditionalimpactassessmentachangeinthedispersionof datacanalsoindicateanimpact
SimilarityPercentagendashSpeciesContributions
SIMPER analysis provides information on how dissimilar assemblages from various groups are (eg how similar all of the macroinvertebrate samples taken for a particular habitatwithinastreamreachare)andhowsimilareachgroup(egreach)istoanyother group SIMPER analysis also identifies the species taxa that are contributing to the dissimilarity between two assemblages in rank order (ie it identifies which species is contributingthemosttothedifferences)SIMPERanalysismayhelptoidentifypotential lsquoindicatorrsquospeciesForexampleifaparticularspeciesconsistentlycontributesgreatlyto the differences between impacted and unimpacted assemblages it may be a useful indicator Theabundanceofthis indicatorspeciescanthenbecomparedbetweensites usingunivariatetechniquessuchasANOVA
Data is available on request from tresbpprojectofficecrownlandnswgov
TRESBPKirraReefMarineBiotaMonitoring2015 C1
frc environmental
Appendix(D( Pairwise( PERMANOVA( Results
Data is available on request from tresbpprojectofficecrownlandnswgov
TRESBPKirraReefMarineBiotaMonitoring2015 D1
frc environmental
Appendix(E( Relative(Abundance(of(Fish(found(at(Kirra(( ( and(Palm(Beach(Reefs(in(Each(Survey((Data is available on request from tresbpprojectofficecrownlandnswgovau
TRESBPKirraReefMarineBiotaMonitoring2015 E1
Structure Bookmarks
0 50 100 Metres Scale 12500 A3
0 50 100 200 Metres Scale 15000 A3
Kirra Reef
Kirra Reef
Kirra Reef
Kirra Reef
Kirra Reef
Kirra Reef
Map A1Location of Kirra Reef monitoring sites
Table D8 Pairwise comparison of macroalgae cover between sites in each year
Table D15 Pairwise comparison of turf algae cover between sites in each year
Table D29 Pairwise comparison of ascidian cover between sites in each year
Table D43 Pairwise comparison of soft coral cover between sites in each year
frc environmental
Summary
The New South Wales Government Department of Primary Industries LandsR and the QueenslandGovernmentDepartmentofScienceInformationTechnologyandInnovation commissionedfrcenvironmentalonbehalfoftheTweedRiverEntranceSandBypassing Project (TRESBP) to monitor the condition and biodiversity of benthic and fish assemblages at Kirra Reef and to assess potential impacts of the project on those assemblages The purpose of the TRESBP is to maintain a navigable entrance to the Tweed River and to provide a continuing supply of sand to the southern Gold Coast beaches consistent with the natural rate of longshore drift This report discusses the results of ecological monitoring of the benthic fauna flora and fish of Kirra Reef completedinMarch2015
Ongoing monitoring of Kirra Reef is required under the Environmental Management System(EMS)SubgtPlanB14KirraReefManagementPlanpreparedbytheTRESBPin February 2001 The methods used in the March 2015 survey (ie surveys of benthic cover and fish abundance) were those developed for the Stage I survey completed in 1995andhavebeenused in thesubsequentsurveys in19962001200320042005 20102012and2014
ImpactsoftheSandBypassingSystemonKirraReef
The extent of the three major outcrops of Kirra Reef (northern southern and eastern sections)varynaturallydependingonwaterandsandmovementsDuringtheearlyyears of theTRESBP operation largeamounts of sandwere deposited on thesouthern Gold Coast beaches This was done to provide a lsquocatch uprsquo quantity of sand to the badly erodedbeachesreducetheTweedRiverentrancebarandclearasandtrapinthevicinity ofthesandcollectionjettytoincreasetheefficiencyofthebypassingsystemDuringthe initialperiodofincreaseddepositionthevolumeofsanddeliveredexceededtheamount that was transported north through natural mechanisms A large volume of sand was deposited on the southern Gold Coast beaches and wave action and tidal currents redistributed some of this sand over Kirra Reef This resulted in a decline in the areal extentofKirraReefwiththereefalmostcompletelycovered(lt100m2exposed)in2006 The projectrsquos Environmental Impact Statement (EIS) predicted that impacts associated withthegradualaccumulationofsandaroundthebaseofKirraReefwereunavoidable
Sincethedeliveryoflargequantitiesofsandwascompletedin2008thevolumeofsand delivered by the project has declined and now closely matches the natural rate of northwardsandtransportHowevertherewasasubstantiallagbetweenthereductionin sanddeliveryandtransportofthesandfurthernorthduetoaperiodofcalmerthanusual
TRESBPKirraReefMarineBiotaMonitoring2015 i
frc environmental
conditionswith reduced storm activity from the north`east Assuchdispersion of sand from Kirra Beach and reduction in the sand levels around the reef was slower than predictedbetween2005and2009
BetweenFebruary2010andJuly2012 therewasa large(50) increase in theareaof exposedrockinthenorthernsectionofKirraReefThiswaslikelytoberelatedtosevere storms in late 2009 moving sand further north andor to the manual removal of 140000m3ofsandfromKirraBeachin2009
InDecember2013KirraPointgroynewasextendedby30mby theCityofGoldCoast with the expectation that the beach bar would move seaward as a consequence At present theKirraPointgroyneestension in2013isunlikelytohavehadamajor impact onthearealextentofKirraReef
Thereefhasbeenrelativelystablesince2013withminor(lt5)changesintheamount of reefexposed Nonetheless thearealextentofKirraReef remains less than50of the extent recorded in 1962 and in 1995 before the TRESBP began In 2015 the reef comprisesthenorthernsectionandapartof theeasternsectionof thereefasrecorded pre`TRESBP(allthesouthernsectionofthereefremainsburied)
ChangestotheEcologicalConditionofKirraReef
The Projectrsquos EIS did not consider the ecological consequences of the reduced areal extentofreefalhabitatandincreasedwaveenergy(aconsequenceofdecreaseddepth) thatwouldoccurasaresultoftheaccretionofsandaroundKirraReefHoweverasthe TRESBPbettermimicednaturalpatternsofsandtransportsince2009theEISpredicted that the reefrsquos benthic floral and faunal assemblages would return to the conditions exhibitedpriortotheextensionoftheTweedRivertrainingwallsinthemid1960s
Sincemonitoringcommenced thegreatestchangeto the floralandfaunalassemblages of Kirra Reef has been due to the loss of reefal habitat In addition to a reduction in overall abundance of taxa the redistribution of sand mediated through complex interactions between physical disturbance (associated with wave action suspended sedimentssedimentdepositionandburial)foodavailabilityandcompetitionhasresulted inavarietyofsmall`scalechangestothedistributionandabundanceofthereefrsquosbenthic assemblages
InApril2014andMarch2015thediversityofassemblageshadincreasedrelativetoJuly 2012as had thecoverof macroalgae (though it remained well below the peakof 60 coverrecordedinJanuary2001)Thisismostlikelyduetonaturalsuccessionwithmore mature communities being established between 2012 and 2015 when the extent of exposedrockwasrelativelystableNeverthelessthebenthicassemblageonKirraReef
TRESBPKirraReefMarineBiotaMonitoring2015 ii
frc environmental
exhibited signs of ongoing stress from physical disturbance such as storm and wave disturbancephysicalabrasionandburialbysandRincludinglowpercentagecoverofhard coralandsoftcoralThisisconsideredessentiallynaturalandcharacteristicofshallow inshorereefsChronicphysicaldisturbancekeepsthebenthicassemblagesofKirraReef inastateofearlysuccession Thediversity(and insomecasesabundnace)ofareefrsquos benthic assemblage is predicted to increase where the extent of reef remains stable or increases and where the frequency and severity of storm conditions are less than the long`term average This was evident in 2014 and 2015 with a relative high cover of spongesandascidians
InMarch2015amorediverseassemblageoffishwasfoundonKirraReefthanonPalm Beach Reef As fish are mobile they can move more easily to areas that are less disturbed or that exhibit more suitable conditions While the composition of the assemblagedifferedfromprevioussurveyeventsthedifferencesweremorelikelydueto the effects of seasonal changes in water temperature and the effects of prevailing conditions at the time of the survey rather than any substantial effect of the bypassing project
Despite some impacts from the TRESBP (with sand covering much of the reef area) overall the composition of the flora and fauna assemblages on Kirra Reef were more similar to that found at nearby Palm Beach Reef than in previous years Kirra Reef therefore continues to provide habitat to a range of flora and fauna and provides important marine ecological functions and services in the region It is possible that as sandlevelshavestabilisedoverthepastthreeyearsassemblagesareslowlybeginning tobecomemoresimilartothoserecordedpriortoimplementationoftheTRESBPandto thoseatnearbyPalmBeachReef
ImpactsofStormsampSeasonalityonKirraReef
The large quantities of sand that were initially delivered by the project caused a substantialshallowingofthenear`shoreareaaroundthereefThisincreaseinbedlevels wasresponsibleforcoveringasubstatialamountofthereefandsubsequentlyincreasing the incidenceof wavedisturbance and sand scouringaround the reef which negatively impactedthebenthicfaunaandflora
As the delivery of sand through the bypassing system now more closely matches the naturalrateofnorthernlongshoresandtransportshort`termandseasonalchangesinthe areal extent of the reef are more likely the result of natural processes than a discrete impactof thesandbypassingactivity Short`term fluctuations that result fromstormsor changesinthecoastalsandsupplywouldhavebeenacomponentofthenaturalrangeof ecologicalconditionsobservedpriortotheextensionofthetrainingwalls
TRESBPKirraReefMarineBiotaMonitoring2015 iii
frc environmental
Thereappearstobearelationshipbetweentheareaandordistributionofrockexposed andstormeventsatKirraReefNotablyaseriesofstormsin2009andstormyconditions between late 2011 and 2012 correspond to large areas of rock becoming exposed Furtherstormsinearly2013correspondstoaclearchangeinthedistributionofrockat Kirra Reef Since 2013 storm conditions have been calm to moderate and there has beenlittlechangeinthearealextentanddistrubtionofexposedrockatKirraReef
Thecloseproximityofthereeftothecoastcontinuestosubjectthebenthicassemblages tosandabrasionwavedisturbanceandsandsmotheringGreaterbalancebetween the deliveryofsandthroughtheprojectandthenaturalmovementofsandonandoffshoreis likely to result inbetterecologicaloutcomes for thebenthicassemblages foundonKirra Reefandgreaterconsistencyintheextentofreefhabitatthatisuncovered
frcenvironmental expect that the area of reef uncovered will continue to change due to seasonal shifts in sand delivery and stormsR however the diversity of flora and fauna assemblagesonKirraReefshouldincreasegraduallyovertimeespeciallyiftheextentof the rocky reef that remains uncovered is consistent andor increases over time to become moresimilarwith that foundprior to the extension of the trainingwalls In this scenario itwasexpectedthat thatnewlyexposedareasofKirraReef in2012thatwere dominated by turf algae would be colonised by other organisms including macroalgae spongesascidiansandpotentiallyhardandsoftcoralovertimeTheresultsfrom2014 and2015indicatethatthisprocessisslowlyoccurringonKirraReef
The change in areal extent between 2014 and 2015 was approximately 85 in the northern section of Kirra Reef A small area of the eastern section of Kirra Reef also became exposed between 2014 and 2015 Ongoing monitoring will provide insight into therateoflsquorecoveryrsquoofcommunitiesHowevergiventhesmallchangeinarealextentof KirraReefandrealtivelysimilarfloraandfaunacommunitiessurveyedin2014and2015 monitoringcouldbereducedtobiannuallyIfmonitoringisreducedasubstantialchange (eg 15) in the extent of the exposed reef should be used to triggered annual monitoring
TRESBPKirraReefMarineBiotaMonitoring2015 iv
frc environmental
1 Introduction
frcenvironmentalwascommissionedbytheNewSouthWalesGovernmentDepartment ofPrimary IndustriesLandsR and theQueenslandGovernmentDepartmentofScience Information Technology and Innovation on behalf of the Tweed River Entrance Sand BypassingProject(TRESBP)tomonitortheconditionabundanceandbiodiversityoffloral and faunal communities at Kirra Reef This report presents results of the survey of benthicfloramacro`invertebratefaunaandfishatsitesonKirraReefandatcomparative sitesonPalmBeachReefinMarch2015
The current condition of Kirra Reef was compared with the current condition of nearby Palm Beach Reef and with changes to the Kirra Reef community over time ie with previousassessmentsofKirraReefundertaken in199519962001200320042005 20102012and2014(frcenvironmental2014)
The TRESBP was established in 1995 as a joint initiative of the NSW and Queensland GovernmentstoimproveandmaintainnavigationconditionsattheTweedRiverentrance andtoprovideacontinuingsupplyofsandtothesouthernGoldCoastbeachesconsistent withthenaturalrateoflongshoredriftTheprojectwascarriedoutintwostages
sdot Stage2Implementation of a sand bypassing system to maintain the improvementsachievedduringStage1(fromMay2001onwards)
DuringStage1approximatelythreemillioncubicmetres(m3)ofcleanmarinesand(with lessthan3fines)weredredgedfromtheTweedRiverentranceMostofthedredging materialwasdeliveredout to`10mmeanwaterdepthfromPointDangertoNorthKirra withapproximately600000m3ofcleanmarinesandbeingplacedontheupperbeaches fromRainbowBaytoNorthKirraFromApril2000toFebruary2001additionaldredging activities were undertaken to maintain a clear navigation channel at the Tweed River entrance Prior to the establishment of the permanent sand bypassing system a further 480000m3of clean marine sandwas placed innear`shore areas from PointDanger to CoolangattaBeach
Stage2commissioning trialscommenced in March 2001 and full scale operationof the sand bypassing system commenced in May 2001 Since this time approximately 70millionm3ofpumpedsandand14millionm3ofdredgedsand(derivedfromdredging
TRESBPKirraReefMarineBiotaMonitoring2015 1
frc environmental
oftheTweedRivermouth)havebeendepositedalongthesouthernGoldCoastbeaches Mostofthesanddeliveredthroughpumpinganddredginghasbeenplacedintheprimary placementareasoutheastofSnapperRocks Sand isalsodischarged fromoutletsat Duranbah Beach and occasionally at Snapper Rocks West There is an outlet at Kirra BeachRhowever thishasnotbeenusedsinceDecember2003 Aplacementexclusion zone has been established around Kirra Reef extending a minimum of 100m from the reefedge(1995extent)topreventdirectplacementofsandincloseproximitytothereef (Lawsonetal2001)
sdot provide much needed sand nourishment to the severely eroded southern Gold Coastbeaches
sdot reducetheTweedEntranceBarand
sdot clear a sand trap in the vicinity of the jetty to improve the efficiently of the sand bypasssystem
These project objectives were achieved and the quantity of sand delivered since 2008 has been more consistent with the natural quantity of sand movement along the coast (average natural net longshore sand drfit is estimated to be 500000m3 per year in a northward direction) In 2014 a total of 450232m3 was pumped through the sand bypassing system to the primary placement area at Danger Point From January to February2015anadditional105119m3ofsandwaspumpedthroughthesystem
In 2009 the Queensland government removed approximately 140000m3 of sand from KirraBeachintertidalzonetothelowprofilebackdunesIn2013theCityofGoldCoast extendedKirragroyneby30m
12 HistoricalContextforKirraReefMonitoring
Kirra Reef is the collective name given to the complex of rocky outcrops located a few hundredmetresoffshoreofKirraBeachatbetween`3and`10mandwithintheinfluence
TRESBPKirraReefMarineBiotaMonitoring2015 2
frc environmental
of wave action It is subject to naturally shifting sands that intermittently cover and uncover the reefrsquos rocky outcrops (TRESBP 2015a) The exposed extent of Kirra Reef hasvariedoverthepast50yearsduetonaturalstormeventsandchangestothecoastal environmentsuchastheextensionoftheTweedRivertrainingwallsinthemid`1960sand commencementoftheTRESBP(TRESBP2015a)Therearethreemajoroutcropsofthe reefthenorthernsouthernandeasternsectionswhichhavebeenvariouslyexposedin thepast(refertoTable11andFigure11)
MonitoringofKirraReef is requiredunderaproject`specificEnvironmentalManagement System (EMS) prepared by the TRESBP in February 20011 Under EMS SubgtPlan B14 KirraReefManagementPlaniftheareaofexposedreefonaerialphotographsissmaller thantherangeofareasshownonaerialphotographsfrom1962to1965thenmonitoring ofthemarinebiotaofKirraReefisrequired
frcenvironmentalcompletedabaselineassessmentofKirraReefinAprilandJune1995 (FisheriesResearchConsultants1995a)(FisheriesResearchConsultants1995b)andhas undertaken nine subsequent ecological monitoring surveys of the reef on behalf of TRESBP in February 1996 January 2001 May 2003 March 2004 February 2005 February 2010 July 2012 April 2014 (Fisheries Research Consultants 1996R frc environmental2001R2003R2004R2005R2010)andthecurrentsurveyinMarch2015
13 TemporalChangesintheAreaofExposedReef
AreductionintheexposedextentofKirraReefwaspredictedintheprojectrsquosEIS(Hyder Consulting 1997) It was also expected that Kirra Reef would return to pre`1960rsquos conditions before the extension of the Tweed River breakwaters that interrupted the northerlymovementofsandwereconstructed(Lawsonetal2001)
Prior to 1960 Kirra Reef was partially covered by sand which varied naturally with the naturalsupplyofsandandwaveenergyDuringthe1960rsquosfollowingtheextensionofthe Tweed River training walls between 1962 and 1965 Kirra Reef became increasingly exposed due to the depleted sand supply (note the increase in area of Kirra Reef from 1962 to1972 inTable11) Following theKirraPointgroynecontruction in1972 there was further depletion of sand supply and Kirra Reef was perennially exposed (note the increaseinareaofKirraReeffrom1972to1995inTable11RrefertoFigure11forthe extentofreefin1995)Kirrareefgroynewasshortened(from175mto145m)in1996
1 The ongoing reef monitoring also incorporates additional monitoring activities implemented by the
TRESBPinAugust2004
TRESBPKirraReefMarineBiotaMonitoring2015 3
frc environmental
AccumulationofsandonKirraReefwasobservedasaresultofindirectsandnourishment bytheTRESBP(notethedecreaseinareaofKirraReefafter1995inTable11)Aerial photographs taken in 2003 and 2004 showed the reef to be of significantly less extent than the range of extent observed in 1962 and 1965 (Table 11) Loss of reef area continuedforsomeyearsandbyearly2006theareaofexposedreefhadbeenreduced to lt100m2 There was a substantial lag between the reduction in sand delivery and transportof thesand furthernorthdue toaperiodofcalmer thanusualconditionswith reducedstormactivityfromthenorth`eastAssuchdispersionofsandfromKirraBeach andreductioninthesandlevelsaroundthereefbetween2005and2009wasslowerthan predicted (refer to Figure 11 for the extent of reef in 2009) As a consequence of the extensiveburialofthereefsimplevisualinspectionsofthereefwereundertakeninplace offullecologicalsurveysbetween2006and20102
In2009eightyearsaftertheinitiationofsandpumpingbytheTRESBPbeganaseriesof storms shifted approximately 200000 m3 of sand from Kirra Beach to the north This storm was the worst protracted storm for east facing beahes in at least 14 years with significant wave heights remaining for four days (TRESBP 2014) This along with the removalofapproximately140000m3ofsandfromtheKirraBeachintertidalzoneagain uncoveredpartsofKirraReef (TRESBP2015a) Since2008sanddeliveryvolumesof the TRESBP have been more consistent with the natural quantity of sand movement alongthecoastEcologicalsurveysrecommencedin2010astheexposedareasofKirra Reefincreasedinextent
Between November 2011 and August 2012 there was a large increase in the northern section of Kirra Reef when the area of exposed rock more than doubled (Table 11R Figure11) This corresponds to a lsquostormy yearrsquowith one severe storm and twomajor storms recorded (TRESBP 2015b) Further stormy conditions were recorded in early 2013withoneextremestorm(approximately110yearevent)inJanuaryandonemajor storminFebruary(TRESBP2015)Therewaslittlechangeinthetotalareaofexposed reefduring this time (note thesimilarareaofAugust2012andMay2013 inTable11) Howevertherewascleardistributionchangesintheareasofexposedrock(Figure11) Thereefareahasremainedrelativelystablesince2013withminorchangesintheareaof rock exposed (Table 11R Figure 11) Wave height data since 2013 indicates calm to moderate conditions with only minor storms recorded except in May 2015 when there wasaseverestorm(TRESBP2015)Inlate2013KirraPointgroynewasreinstatedby 30mtoitsorginalconstructedlengthGiventheminorchangesintheexposedrocksince
2 Underwater visual inspections were completed by Gilbert Diving and Gold Coast City Council from
In2014KirraReefcoveredanareaof2920m2Rpredominantlyinthenorthernsectionof thereefInMarch2015thisnorthernsectioncoveredanareaofapproximately2672m2 (Figure11andFigure12)an85decreaseintheexposedextentbetween2014and 2015 In March 2015 the rocky outcrops were typically between 1 and 2m above the cleanmobilesandwithseveraloutcropsextendingtomorethan2mabovethesandA small section (116m2) of the eastern reef wasalsoexposed inMarch 2015 (Figure 11 andFigure12)Howeverthereefarearemainslessthan50oftheextentrecordedin 1962and1995beforetheTRESBPbegan(Table11Rreefareabetween1962and1965 was between 7000 and 13300 Department of Land and Water Conservation photogrammetricanalysis)
TRESBPKirraReefMarineBiotaMonitoring2015 5
frc environmental
Table11 ApproximateexposedextentofKirraReef
Area(m2) Date SourceofImage
NorthernSection SouthernSection EasternSection Total
The southeast Queensland (SEQ) region comprises five subregions the Gold Coast Inner Moreton Bay Outer Moreton Bay Sunshine Coast and Fraser Coast Coral communities within SEQ are diverse with an extensive range of coral growth forms (Harrison et al 1998) The greatest diversity of coral species are typically found at offshoresites likeFlindersReefswhere119differentcoralspecieshavebeen recorded (Harrisonetal1998)
Subtidal rocky reefs of the Gold Coast region comprise remnants of highly eroded volcanic substratum isolated by wide variable expanses of soft sediment (Edwards amp Smith 2005) They support community assemblages that are indicative of a transition between the tropical waters of the Great Barrier Reef and the temperate waters characteristicofthemidNewSouthWalescoast(Done1982XCannonetal1987)
GoldCoastreefcommunitiesarebroadlysimilartoareasofcomparabletopographytothe north(InnerGneeringsoffshorefromMooloolabaandoffshoreofMoretonBay)andtothe south (Julian Rocks offshore of Byron Bay) that are dominated by macroalgae and sessile invertbrates(FisheriesResearchConsultants1991XHarriottetal1999XEdwards amp Smith 2005X Baronio amp Butcher 2008X Fellegara 2008X SchlacherHoenlinger et al 2009)ManyoftheGoldCoastsreefslocatedclosetoshoreareoftenaffectedbyhuman activities (Noriega 2007)and typicallyhave lesscoralcover Ina2013surveyofSEQ reefsGoldCoastreefshadthelowesthardcoralcoverat9(Hutchinsonetal2013)
Fish of the Gold Coast region are similar in community composition to that recorded offshore of Moreton Bay at Julian Rocks and the Solitary Islands offshore of Coffs Harbourandtoa lesserextentat theexHMASBrisbanenearMooloolaba(Robinsonamp Pollard 1982X Parker 1995X Parker 1999X Edwards amp Smith 2005X Malcolm et al 2009X SchlacherHoenlingeretal2009) The smaller inshore reefsof theGoldCoast region suchasKirraReeftypicallysupportalowerabundanceanddiversityoffishes(Edwards ampSmith2005Xfrcenvironmental2005)
Kirra$Reef$
ThebenthicassemblagesofKirraReefarecharacterisedbyahighcoverofmacroalgae andturfalgaeandamoderatecoverofsessilebenthicinvertebratesincludingafewhard corals(EdwardsampSmith2005Xfrcenvironmental2005)Turfalagecoversthemajorityof the reef substrate Crinoids (feather stars) ascidians (sea squirts) and sponges are typically themostabundantbenthic faunawhilstanemonessoftcoralsandurchinsare present in low numbers (frc environmental 2014) The composition of benthic assemblagesatKirraReef isbroadlysimilar to thatdescribed fromadjacent rockyreefs
Exposuretowaveactionsandscouringandsmotheringareimportantfactorsinfluencing the distribution and abundance of sessile species on rocky reefs (Kay amp Keough 1981X McGuinness1987)ChangeintheheightofsandaroundthebaseofKirraReefappears to be a major factor influencing the abundance (cover) of benthic flora and fauna periodically resulting in a bare stratum on rocks within 08 to 1m of the seafloor Outcropsontheeasternsectionof thereefcomplexwherewaveactionand likelysand abrasion are greatest have historically supported a lower abundance of benthic fauna than outcrops on the northern section (Fisheries Research Consultants 1995a)X (Fisheries Research Consultants 1995b)X (Fisheries Research Consultants 1996)X (frc environmental 2003)X (frc environmental 2004)X (frc environmental 2005)X (frc environmental2010)
Strong wave action results in sustained abrasion of the dominant brown macroalgae (Sargassum(flavicans(andEcklonia( radiata)causing the fronds tobreak Thecontinual resuspensionofalgal fragments(commonlyreferredtoas lsquocornflakesrsquo)candramatically reducewaterclarityandvisibility Algal fragmentswere largelyabsent inJuly2012and April2014surveyslikelyduetolongperiodsofrelativelybenignseaconditionsInMarch 2015amoderateamountofalgalfragmentswasobservedlikelyduetostormactivityin theweeksproceedingthesurvey(egmoderateseas11to14Februaryandminorstorm over1922February)
RecentsurveysatPalmBeachReefcompletedbyReefCheckrecordedadeclineinhard coralcover from2008to2013(Hutchinsonetal2013) Sessile invertebrates including spongescoralsandascidianstypicallydominatethebenthicassemblageofPalmBeach Reef(EdwardsampSmith2005X frcenvironmental2005XReefCheck2010) Thecoverof sessileinvertebrateshashistoricallybeensimilartothatrecordedfromtheoutersections of Kirra Reef However the cover of macroalgae has consistently been loweron Palm BeachReefthanonKirraReefTheproximityofPalmBeachReeftotwocreekmouths andtheabsenceofstrongcurrentsintheareatypicallyresultsinahighlevelofturbidity Elevated turbidity together with greater water depth and a high abundance of grazing
TRESBPKirraReefMarineBiotaMonitoring2015 10
frc environmental
speciessuchasurchinsislikelytocontributetoarelativelylowcoverofmacroalgaeand abundant suspension feeding organisms such as ascidians sponges hydrozoans and crinoidsatPalmBeachReef(Smithetal2005)
PalmBeachhasa lowerabundanceanddiversityof benthicdemersaland pelagic fish comparedtoKirraReef(Smithetal2005)ThegreaterdensityoffishatKirraReefmay beaconsequenceof the lossof reef forcingmore fish intoasmallerarea (Smithetal 2005)PalmbeachrecordedaslightlylowerdiversityoffishthanKirraReefin2012and 2014surveys(frcenvironmental2012Xfrcenvironmental2014)
TRESBPKirraReefMarineBiotaMonitoring2015 11
frc environmental
2$ Methods$
The methods used in the March 2015 survey were developed for the Stage I survey completed in April and June 1995 and used for subsequent surveys February 1996 January 2001 May 2003 March 2004 February 2005 February 2010 July 2012 and April2014 Datawere collected from KirraReef (2816251535309) andPalmBeach Reef(2810751534774)locatedapproximately9kmnorth(Figure21)
Themainobjectiveof the monitoring was to investigateanychange in the marinebiota and habitat of Kirra Reef compared to Palm Beach Reef (comparative reef) in order to assesstheeffectofthesandbypassproject(andsubsequentincreasesinsandload)on theecologyofKirraReef
0 2 41
Kilometres
Service Layer Credits Sources Esri HERE DeLorme Intermap increment P Corp GEBCO USGS FAO NPS NRCAN GeoBase IGN Kadaster NL Ordnance
0 2 41
Kilometres
Service Layer Credits Sources Esri HERE DeLorme Intermap increment P Corp GEBCO USGS FAO NPS NRCAN GeoBase IGN Kadaster NL Ordnance
Threesites(KRN1KRN2KRO3)atKirraReef(waterdepth5to8m)weresurveyedin March 2015 (Map 1) The remainder of the sites previously surveyed were covered by sand(refertoappendixAforahistoryofsitespreviouslysurveyed)Threecomparative sites (PB1 PB2 and PB3) were also surveyed at Palm Beach Reef (water depth 12 to 17m)(Map2)
TRESBPKirraReefMarineBiotaMonitoring2015 12
orth NetreStkicrraG
Marine Parade
t eertS ickr
M rarin ae Pa Grade
Musgrave St
t
re ee e Powel t r lt CrescenS t t es eel ri tM S
t ee ge drt u tleS d Rro MuL sgrave Street
LEGEND 0 1 Km Tweed River E ntrance Sand Bypassing Project Survey Site Road Network
copy Copyright Commonwealth of Australia (Geoscience Australia) 2001 2004 2006copy The State of Queensland (Department of Natural Resources and Mines) 2015copy Nearmap 2014
DATE2015-03-24
DRAWN BYCF
VERSION01
PROJECTIONCoordinate System GDA 1994 MGA Zone 56Projection Transverse MercatorDatum GDA 1994
plusmn SCALE
0 50 100 200
Metres
Scale 15000 A3
Gold Coast Highway
i
PalmBeach
Tugun
Coolangatta
0 1 Km
frc environmental
22$ Benthic$Flora$and$Macroinvertebrates$
At each site benthic assemblages were surveyed in fifteen 025m2 quadrats with the percentcoverofbenthicmacroalgaeturfalgaespongesascidianshardcoralsandsoft coralsassessedvisually(Figure22)Quadratswereplacedhaphazardlywhichincluded horizontal and sloping surfaces The minimum distance between quadrats was approximately2m Thenumberof largeascidians (Pyurastolonifera)crinoids (feather stars)barnaclesurchinstubewormspolychaeteshydroidszoanthidsandcowriesand the dominant species of macroalgae were also recorded and quantitative notes were madeontheapparenthealthofeachtaxonomicgroup
ThespeciesrichnessandrelativeabundanceoffishatKirraReefandPalmBeachReef were assessed using a combination of underwater visual census (UVC) and video surveys The combination of these techniques represents the most costeffective and efficientmeansofobtainingdataonthestructureoffishassemblagesindifferenthabitats (Murphy amp Jenkins 2010) A baited remote underwater video (BRUVX baited with pilchards) and footage captured by a diver swimming hapazard trasects over the reef wererecorded
Video footage from each BRUV (approximately 20minutes) and video transects (approximately 35 minutes) was reviewed by an ecologist experienced in marine fish identification
24$ Data$Analysis$
Permutational multivariate analysis of variance (PERMANOVA) was used to determine differences in the composition (cover of benthic fauna and taxonomic group) of benthic assemblagesbetweenKirraReefandPalmBeachReefover time PERMANOVAuses permutational methods (PsuedoAF) to derive statistical significance which require fewer assumptionstobemetthananalogousmethodssuchasmultivariateanalysisofvariance (MANOVA) (Anderson 2001X Anderson et al 2008) This analysis enables an examinationofchangesinthecommunityasawhole
A three factor PERMANOVA was used to examine differences in the composition of benthic assemblages with survey (fixed factor) locations (Palm Beach Reef and Kirra Reeffixedfactor)andsites(nestedinlocationsasarandomfactor)asthefactorsData weresquareroot transformedtodownweightdominatingspeciesabundanceXconverted toaBrayCurtisdistancematrixXandtestedforsignificanceusingasmanypermutations as allowed (9800 to 9937 unique permuations achieved for all factors and factor combinationsXexceptlocationwhere10uniquepermutationswereachieved))Posthoc pairwisetestwasusedtodeterminethemagnitudeofdifference
Nonmetricmultidimensionalscaling (nMDS)ordinationswereused tovisually represent the variation in the composition of assemblages between reefs separately for each survey nMDS ordinations were also used to visually represent the variation in the compositionofassemblagessurveysatKirraReefforallsurveysXbaselinesurveyinApril 1995andMarch2015XandApril2014andMarch2015
Separate univariate PERMANOVAs were used to compare differences in the cover of macroalgae turf algae and the abundance of crinoids and ascidians Data were
TRESBPKirraReefMarineBiotaMonitoring2015 16
frc environmental
converted to a eucildean distances matrixX and tested for significance using as many permutations as allowed (998 to 999 unique permuations achieved for all factors and factor combinationsX except location where 10 unique permutations were achieved) Factors were survey (fixed factor) locations (Palm Beach Reef and Kirra Reef fixed factor)andsites (nested in locationsanda random factor) Posthoc pairwise testwas used to determine the magnitude of difference Monte Carlo procedures were used to calculateempiricalPvaluesforthesurveyxlocationtest
Further information on the use and interpretation of PERMANOVA and other analyses usedinthisreportisprovidedinAppendixB
TRESBPKirraReefMarineBiotaMonitoring2015 17
frc environmental
3$ Results$
31$ Cover$of$Benthic$Assemblages$
The composition of benthic fauna and flora ( cover and type combined Appendix C) variedbetweenmostsitesatbothKirraReefandPalmBeachReefandbetweennearly allsurveysateachsite(notethesignificantinteractionofsite(location)xsurveyinTable 31X Appendix D) Nevertheless there appeared to be substantial differences in the compositionofthebenthicassemblagesbetweenthetworeefsineachsurveyfrom1995 to2015(Figure31toFigure33)
In2015 therewassomeoverlap in thecompositionofassemblagesonKirraandPalm Beach Reefs (Figure 33) However there was also some clear patterns of difference including
Benthic assemblages at Kirra Reef appeared to show some overlap between surveys (Figure34H) HowevernearlyallsurveysweredifferentateachsiteatbothKirraReef andPalmBeachReef(AppendixD)BenthicassemblagesinMarch2015andApril2014 wereverysimilarcomparedtobenthicassemblages inthebaselinesurvey inApril1995 andMarch2015(notethegreateroverlapinFigure35comparedtoFigure36)
In March 2015 as in previous surveys the macroalgae Sargassum sp dominated the benthic assemblages at all sites at Kirra Reef (Figure 37) Other species present included
sdot Dictyopteris0arostichoides0
sdot Dilophus0intermedius00
sdot Zonariasp
sdot Laurencia0brongniartic0
sdot Amphiroa0anceps0
sdot Caulerpa0lentilliferaand
sdot Halimeda0discoideaand
sdot Macrocystissp
Juvenile kelp (from the genus Macrocystis) was also emerging on some areas of Kirra Reef
ThecoverofmacroalagevariedbetweensitesandsurveysatbothKirraReefandPalm Beach Reef with the magnitude of difference varying over time (note the significant interaction between site (location) x survey in Table 32) Macroalgae cover varied between surveys with 2001 being the most different to the other years (Appendix D) ThereweredifferencesbetweensitesatKirraReefinJune1995February1996January 2001 May 2003 February 2005 and February 2010 and between sites at Palm Beach ReefinJanuary2001andFebruary2010Inrecentsurveys(2012to2015)thecoverof macroalgaeatsitesatbothKirraReefandPalmBeachReefwassimilar (AppendixD) indicatingarelativelyconsistentdistributionacrossbothreefs
ThemeancoverofmacroalgaeatKirraReefhasdeclinedsinceitspeakin2001withthe greatest magnitude of decline recorded between January 2001 and May 2003 (Figure 38)InsurveysbetweenJune1995andMay2003Sargassumspformeddensecarpets overtherockysubstratecoveringupto58oftheavailablesurfaceareaofthereefIn February 2010 macroalgal cover was 12 Macroalgal cover has increased to 26 in March2015ThisissimilartothecoverrecordedinApril1995(23cover)(Figure38)
In2015nomacroalgaewasrecordedwithinthequadratsatPalmBeachReefThecover of macroalgae on Palm Beach Reef has been consistently lower than Kirra Reef since
TRESBPKirraReefMarineBiotaMonitoring2015 26
frc environmental
ecologicalmonitoringbegan typically lessthan5of theavailablesurfacearea(Figure 38)
The mean cover of turf algae varied between sites and surveys at both Kirra Reef and PalmBeachReef(notethesignificantinteractionbetweensite(location)xsurveyinTable 33)SpecificallythereweresignificantdifferencesbetweensitesatbothKirraReefand PalmBeachReefinJune1995January2001February2010July2012andApril2014 (aswellasbetweensitesinFebruary1996atKirraReef)Thecoverofturfalgaevaried betweenmostsurveysatallsitesateachreef(AppendixD)BothKirraandPalmBeach reefs showed major increases in the percent cover of turf algae from 2010 to 2012 followedbyadecreaseincoverbetween2012and2014(Figure310)Thecoverofturf algae is typically lower at Kirra Reef than at Palm Beach Reef (July 2012 being an exception) and was again slightly lower at Kirra Reef in March 2015 (Table 310) In March2015turfalgaewasmoreprevalentatKirraReefthanduringthebaselinesurvey ofApril1995
ThemeancoverofspongesatsomesitesatbothKirraReefandPalmBeachReefhas varied significantly during some surveys (note the significant interaction between site (location)xsurvey inTable34HFigure311) However thecoverofspongestendedto bemore temporallyvariable atKirraReef than at Palm Beach Reef (Figure312) The cover of sponges at Kirra Reef varied between sites in February 1996 January 2001 March2004July2012andApril2014 However thecoverofspongesatPalmBeach Reefonlyvariedbetweensites inJanuary2001andFebruary2010 (AppendixD) The cover of sponges varied between survey at each site with 1995 1996 and 2001 most differenttootheryears(AppendixD)
ThemeancoverofspongesatKirraReefdeclinedbetweenMarch2004(20cover)and February 2010 (less than 1 cover) Since 2010 the cover of sponges has increased slightly with sponges covering 8 of the reef in March 2015 (Figure 312) In March 2015thecoverofspongeswashigherthanrecordedduringthebaselinesurveyinApril 1995(3cover)(Figure312)
Figure312 Mean cover of sponges (plusmnSE) at Kirra Reef and Palm Beach Reef on all
surveys
Table34 Univariate PERMANOVA results for differences in the cover of sponges betweensurveysandlocations
Factor$ df$ MS$effect$ PseudoF$ p$(perm)$
survey 10 18576 276 0018
location 1 39671 589 0210
site(location) 4 67354 477 0001
locationxsurvey 10 1490 221 0032
site(location)xsurvey 40 67331 477 0001
error 924 14108
Shadingdenotessignificanceatplt005
TRESBPKirraReefMarineBiotaMonitoring2015 32
frc environmental
Ascidians$
ThemeanabundanceofallascidiansotherthanPyura0stoloniferahasvariedsignifcantly between sites at Kirra Reef and Palm Beach Reef and between surveys at each site (Figure314andnotethesignificantinteractionbetweensite(location)xsurveyinTable 35) The abundance of ascidians was different between sites at Kirra Reef in January 2001May2003March2004February2005andApril2014HanddifferentatPalmBeach ReefinJanuary2001February2005February2010andMarch2015Theabundance ofascidiansvariedbetweensurveysateachsitewith1995beingmostdifferentwhenthe abundanceofascidianswaslow(AppendixD)InMarch2015theabundanceofallother ascidiansonKirraReefandPalmBeachReefwashigherthanpreviouslyreportedinthe baselinesurveyinApril1995(whennoascidianswererecorded)Themeanabundance washigheratKirraReefthanatPalmBeachReef(Figure314)
ThemeanabundanceofPyura0stoloniferahasvariedconsiderablybetweensitesatKirra Reef and Palm Beach Reef over time (note the significant interaction between site (location) x survey in Table 36) In March 2015 the mean abundance (individual per 025m2plusmnSE)of theascidianPstolonifera (Figure313)wassimilaratKirraReefand PalmBeachReef(Figure315)ThemeanabundanceofP0stoloniferahasrangedfrom 02to17individualsper025m2atbothreefssinceMay2003
Figure315 Mean abundance of ascidians (Pyura0 stolonifera) (individuals025m2)
(plusmnSE)atKirraReefandPalmBeachReefinallsurveys
TRESBPKirraReefMarineBiotaMonitoring2015 34
frc environmental
Table35 Univariate PERMANOVA results for the differences in cover of all ascidians otherthanPyura0stolonifera0betweensurveysandlocations
Factor$ df$ MS$effect$ PseudoF$ p$(perm)$
survey 10 26658 474 0001
location 1 13603 710 0104
site(location) 4 19154 149 0212
locationxsurvey 10 2629 468 0001
site(location)xsurvey 40 5621 438 0001
error 924 12828
Shadingdenotessignificanceatplt005
Table36 Univariate PERMANOVA results for the differences in Pyura0 stolonifera densitybetweensurveysandlocations
Factor$ df$ MS$effect$ PseudoF$ p$(perm)$
survey 10 16254 11842 0001
location 1 12445 60881 0206
site(location) 4 20442 56799 0001
locationxsurvey 10 79724 58082 0001
site (location) x 40 13726 38138 0001 survey
error 924 35991
Shadingdenotessignificanceatplt005
$
TRESBPKirraReefMarineBiotaMonitoring2015 35
frc environmental
Hard$Coral$
There was a significant difference between the cover of hard corals at Kirra Reef and PalmBeachReefduringsomesurveys(notethesignificantinteractionbetweenlocationx surveyinTable37)SpecificallytherewassignificantlymorehardcoralatPalmBeach Reef thanKirraReef inFebraury1996March2004April2014andMarch2015(Table 38)
ThecoverofhardcoralistypicallylowonKirraReefaccountingforlessthan2ofthe availablesubstrateInMarch2015hardcoralcoveredlessthan1oftheareaofKirra Reef which was less than the cover recorded during the baseline survey in April 1995 (Figure 316) In contrast hard coral covered 11 of the surface area at Palm Beach ReefwhichwasgreaterthanthecoverrecordedinApril1995(Figure316)
The cover of hard corals at Palm Beach Reef has been more variable over time comparedtothecoverofhardcoralatKirraReef(Figure316)Withtheexceptionofthe surveys inApril1995andJanuary2001when thecoverofhardcoralwas lowonboth reefshardcoralsaretypicallymoreprevalentatPalmBeachReef(Figure316)
Table38 PERMANOVA post hoc pairwise results for the differences in the cover of hardcoralbetweenlocationsineachsurveyevent
Hard$Corals$ Survey$
t$ p$(MC)$a$
Apr1995 054 0606
Jun1995 182 0140
Feb1996 541 0006
Jan2001 R R
May2003 166 0168
Mar2004 765 0001
Feb2005 049 0646
Feb2010 156 0197
Jul2012 283 0053
Apr2014 525 0011
Mar2015 695 0003 Shadingdenotessignificanceatplt005 a pvaluesbasedonMonteCarlotests
TRESBPKirraReefMarineBiotaMonitoring2015 37
60
50
40
30
20
10
0
Soft
Cor
al C
over
()
Kirra Reef Palm Beach Reef
frc environmental
Soft$Coral$
The cover of soft coral was significantly different between sites at both Kirra Reef and PalmBeachReefandduringsomesurveys(notethesignificant interactionbetweensite (location)xsurvey)TherewasnosoftcoralrecordedatKirraReefinMarch2015The coverofsoftcoralhasdeclinedatKirraReefsince2003andhascoveredlessthan2of theavailablesubstratesince2005whichissimilartothecoverofsoftcoraldescribedfor the baseline surveys in 1995 (Figure 317) The cover of soft coral was consistent betweensitesineachsurveyexceptbetweensitesin
sdot April1995atKirraReef
sdot 1996atKirraReef
sdot 2003atPalmBeachReefand
sdot 2014atPalmBeachReef(AppendixD)
Soft corals have historically covered more of the available space on Palm Beach Reef than on Kirra Reef However there was more temporal variability within sites at Palm BeachReefthanatKirraReef(AppendixD)ThecoverofsoftcoralatPalmBeachReef has varied over time and was highest in April 1995 (48 cover) Despite increasing sinceFebruary2005itisstilllowerthanthecoverrecordedduringthebaselinesurveyin April1995(Figure317)
Table39 UnivariatePERMANOVAresults for thedifferences in thecoverofsoft coral betweensurveysandlocations
Factor$ df$ MS$effect$ PseudoF$ p$(perm)$
survey 10 44657 1323 0001
location 1 32922 6620 0117
site(location) 4 49732 266 0036
locationxsurvey 10 40982 1214 0001
site (location) x 40 3376 181 0002 survey
error 924 18688
Shadingdenotessignificanceatplt005
$
TRESBPKirraReefMarineBiotaMonitoring2015 39
frc environmental
Crinoids$
ThereisasignificantdifferencebetweensomesitesatbothKirraReefandParmBeach Reef that varies through time (note the significant interaction between site (location) x survey inTable310) Theabundanceofcrinoidshasbeensimilarbetweensites inall years at Palm Beach ReefH and was different beween sites at Kirra Reef in June 1995 February1996May2003andFebruary2005(AppendixD)Withineachsitetherehas been some natural temporal variability particualrly at Palm Beach Reef sites in 2001 (Appendix D) The mean abundance (individuals 025m2) of crinoids (Figure 318) at KirraReefandPalmBeachReefhasgenerallybeenlessthan2individualsper025m2 andhasdeclinedatboth locationssincethebaselinesurvey inApril1995(Figure319) However the mean abundance of crinoids on Kirra Reef has shown a slight increase sinceFebruary2010(Figure319)
In March 2015 fewer crinoids were recorded at Palm Beach Reef than at Kirra ReefH crinoidshavebeenrareatPalmBeachReefsince2003
The species richness of fish recorded from Kirra Reef across all monitoring events has rangedfrom14to57 InMarch201557specieswereidentifiedat thereefwhichwas similar to April 2014 (53) and higher than previous surveys (Figure 320) Species richnessatPalmBeachReefwas lower(34species)andgenerallyvaried lessbetween surveyscomparedtoKirraReef
InMarch2015 the assemblage of fish at KirraReef comprised species fromall trophic levelsincludingdetritivoresplanktivoresherbivoresandcarnivores(AppendixE)Asin previous surveys the assemblage was dominated by herbivores and planktivores Yellowtail (Trachurus0 novaezelandiae) and striped sea pike (Sphyraena0 obtusata) were the dominant species present in large schools (Figure 321) Australian mado (Atypichthys0 strigatus) ringRtailed surgeon (Acanthurus0 blochii) silver trevally (Pseudocaranx0 georgianus) eastern pomfred (Schuettea0 scalaripinnis) sweep (Scorpis0 lineolatus) and various wrasses were also very abundant releative to other species (AppendixE)
Two new species were observed at Kirra Reef the orangeRband surgeon (Acanthurus0 olivaceus) and the unicornfish (Naso0 sp) Five new species were recorded at Palm BeachReef
No threatened or protected fish species listed under the Queenslandrsquos Nature0 Conservation0Act01992ornationallyundertheEnvironmental0Protection0and0Biodiversity0 Conservation0 Act0 1999 were observed The complete list of species recorded and the relativeabundanceispresentedinAppendixE
TRESBPKirraReefMarineBiotaMonitoring2015 42
60
0
10
20
30
40
50
Num
ber
of F
ish
Spe
cies
Apr-95
Jun-95
Feb-96
Jan-01
May-03
Mar-04
Feb-05
Feb-10
Jul-12
Apr-14
Mar-15
Kirra Reef Palm Beach Reef Location
frc environmental
Figure320 Number of fish species recorded at Kirra Reef and Palm Beach Reef on
ThegreatestchangetotheecologicalconditionofKirraReefsincethebaselinesurveyin 1995 has been the loss of large areas of hard substrate that support benthic flora and faunaThedeliveryoflargesandvolumesduringthestage1dredgingoperations(1995 to1998)andtheinitialoperationofthesandbypasssystem(2001to2008)resultedinan increaseinwaveactionandtidalcurrentsredistributingthissandoverKirraReef
The three major outcrops of Kirra Reef (northern southern and eastern sections) are naturally exposed and covered depending on water and sand movements In March 2015 the rocky outcrops in the northern section of Kirra Reef were exposed and supportedamoderatelydiversebenthicassemblagedominatedbyturfalgaeTherewas arelativelyhighfishdiversityatKirraReefTheecologicalassemblageexhibitedsignsof ongoingstressfromphysicaldisturbanceincludingtheabsenceofsoftcoralsandrarityof hardcoral(MumbyampSteneck2008)HoweverKirraReefhasarelativelyhighcoverof sponges and ascidians Sponges ascidians and crinoids were more abundant at Kirra ReefthanatPalmBeachReefinMarch2015
KirraReefcontinues toprovidehabitatandsupport importantecological functions in the region providing hard substrate for the colonisation of algae and benthic invertebrates and food and refuge for fish As sand levels have stabilised since 2008 assemblages have becomemoresimilar to those recordedprior to implementationof the TRESBP in April1995 Forexamplemacroalgalcover inApril1995andMarch2015wasrelatively similarHoweverassemblagecompositionisstillsignificantlydifferenttothatrecordedin thebaselinesurveysmostnoticeablyduetoa lowercoverofbaresubstrateandhigher coverofturfalgaeandascidianssincesurveyshavebeenperformed
Benthic$Macroalgae$
The cover of macroalgae at Kirra Reef was relatively similar during the 2014 and 2015 surveys and remained well below the peak of nearly 60 cover recorded in January 2001TherewasasteepdeclineinthecoverofmacroalgaebetweenJanuary2001and May2003whichappearedtobestronglyassociatedwith thedecline inreefareaduring that time as well as a decline in the cover of Sargassum sp (an important indicator speciesonKirraReef) SimilardeclineswereevidentatPalmBeachReefbetween the January2001andMay2003surveys
TRESBPKirraReefMarineBiotaMonitoring2015 45
frc environmental
The cover ofmacroalgae at Palm Beach Reef was much lower thanat Kirra Reef over time There are several possible reasons for the lower cover of macroalgae at Palm Beach
sdot PalmBeachReefisdeeperthanKirraReefandgenerallyhashigherturbidityand therefore greater light attenuation The quantity and quality of available light affectsthedistributionandgrowthofmacroalgae(MillerampEtter2008)
sdot Differences in the pattern of recruitment of algal species to the reefs due to differentwatercurrentsandtimingofthesurveys(Kennelly1987b)
sdot Increased competition with turf algae and sessile benthic invertebrates which competeforspacewithmacroalgae(Kennelly1987aHMillerampEtter2008)
sdot PresenceofdifferentspeciesandhigherdensityofherbivoresatPalmBeachReef (particularly sea urchins and herbivorous fish) which graze on macroalgae (McCook1997HJompaampMcCook2002)
Biological assemblages exposed to physical stress typically exhibit greater levels of temporalandspatialvariability(WarwickampClarke1993HChapmanetal1995)Temporal variationinthecoverofmacroalgaeatKirraReefislikelytobeprincipallyduetotheeffect ofphysicaldisturbance fromwaveactionaswellas theassociatedassociatedabrasion andsmotheringbysandTheeffectsofthesephysicaldisturbanceswouldincreasewith thereductionofKirraReefasedgeeffectsarepronouncedandwaterdepth isreduced Increasedsmotheringbysandcanalsoreducediversity(Hatcheretal1989)abundance recruitment growth survival and seasonal regeneration of macroalgae (Umar amp Price 1998HCheshireetal1999)
Changes in the cover of macroalgae on Kirra Reef over time are also likely due to the extentofthereefchangingHthefishandmobileinvertbratesassociatedwiththereefmay have concentrated which would in turn increase grazing pressure Increased grazing pressure from fish and mobile invertebrates can reduce the coverage and diversity of macroalgaeonreefs(McCook1997HJompaampMcCook2002)
Thecoverof turfalgaeatbothKirraReefandPalmBeachReefhasvariedsignificantly betweensurveysPriorto2005turfalgaetypicallycoveredlessoftheavailablesurface areaonKirraReefthanPalmBeachReefInMarch2015themeancoverofturfalgae hasincreasedsincebaselinesurveysin1995andwasrelativelysimilarbetweenreefs(40 plusmn4atKirraReefcomparedto48plusmn4atPalmBeachReef)Thecoverofturfalgaeat Kirra Reef was similar in 2014 and 2015 which was generally higher than previous surveysexceptduringJuly2012whencoverofturfalgaepeakedat67plusmn4
TRESBPKirraReefMarineBiotaMonitoring2015 46
frc environmental
Turfalgaearebecomingadominantcomponentofcommunitiesaroundtheworld likely the result of rapid colonisation of openspace after a disturbance (eg storms) nutrient enrichment andor changes in grazing pressures Turf algae can also reflect a more physically robust growth form suited to high wave energy environments (than foliose macroRalgae)TurfalgaepeakedintheJuly2012surveylikelyrelatedtotheincreasein bare reef exposure following a stormy conditions in early 2009 and between December 2011 and June 2012 Turf algae have been the dominant form of algae on Kirra Reef sincethistimealbeitthecoverlowerthanthe2012survey
Increased cover of turf algae is typically related to good light conditions high concentrationsofnutrientsandlownumbersofgrazerssuchasfish(orconstantgrazing pressure preventing macroalgae colonisation) However the relationship between algal dynamics physical disturbance water quality and herbivore grazing activity is complex andthecoverof turfalgaecanexhibitextremetemporalvariabilityasaconsequenceof the interactionbetween topRdownandbottomRupprocesses (Russ2003HBellwoodetal 2006H Hughes et al 2007H Albert et al 2008H Hoey amp Bellwood 2008H Mumby 2009) Furtherinvestigationwouldberequiredtoreliablydeterminethemechanismsofchangein bothmacroalgaeandturfalgaeassemblagesonthesereefs
Benthic$Macroinvertebrates$
AtKirraReeftheburialandreRemergenceofrockyoutcrops(influencedbytheTRESBP) islikelytohaveincreasedtemporalvariabilityinthedistributionandabundanceofbenthic macroinvertebrates Additional perturbations such as wave action and sand abrasion (each influenced through changes in bathymetry seabed topography and water depth) are likely to have resulted in the decline in cover and diversity of the benthic macroinvertebratesatKirraReefbetweensurveysparticularlybetweenMarch2004and February2005andduringtheseverestormsof2009Benthicmacroinvertebratessuch asascidiansspongeshardcoralandsoftcoralarehighlysusceptible to theeffectsof stormandwavedisturbancephysicalabrasionandburialbysand(KayampKeough1981H Walker et al 2008) which can affect settlement growth rate and survival (Dodge amp Vaisnys1977HRogers1990)
Physical disturbance from sand burial sand abrasion and the action of storm waves appeartokeepthebenthicassemblagesofKirraReefinastateofearlysuccessionItis commonforearlypioneerspeciessuchassomemacroalgaetorecruitrapidlytoahard surface in large numbers allowing these species to dominate assemblages early in the successionaltrajectory(Walkeretal2007)
Afurther indicatorof theearlystateofsuccessionatKirraReef isthatthecoverofhard and soft coral has remained very low (generally lt 5) In March 2015 less than 1
Benthic macroinvertebrate cover may also be affected indirectly through increased competitionwithmacroalgaeforspaceThepresenceoflargemacroalgaecanaffectthe recruitment and survival of sessile benthic invertebrates as fronds moving with wave action sweep and abrade the surface of rocks killing new recruits especially corals (Kennelly1989HMcCooketal2001)Itcantakeseveralyearsforhardandsoftcoralto become dominant on reefs in the SEQ region (SchlacherRHoenlinger et al 2009) Therefore hard coral is not expected to become abundant until several years after the reefhasbeenuncoveredandonlyifthephysicaldisturbanceregimeandsupplyofnew recruitsissufficienttosupportsurvivalandgenerationalsuccessionofthesespeciesThe coverofhardandsoftcoralsatKirraReefwerebothverylowandpatchypriortothestart oftheTRESBP
Sponges and ascidians are highly susceptible to smothering and sand abrasion unless theyhaveathicktunic(outercoveringmadeofkeratin)liketheascidianP0stolonifera0or strong internal keratin silicon or calcareous structures in the case of some species of sponges0(KayampKeough1981HMcGuinness1987HWalkeretal2008)Duetoincreased wave action and sedimentation (which can be influenced by the TRESBP) the mean coverofascidiansandspongeswasexpectedtobemuchloweronKirraReefthanPalm Beach Reef However in March 2015 the cover of sponges was similar between the reefsandthecoverofascidians(otherthanP0stolonifera)wasgreateratKirraReefthan at Palm Beach Reef This suggests that Kirra Reef is slowly recovering from the increasedstressofphysicaldisturbancesuchas increasedwaveactionandsandscour andorthatwaveandstormconditionshavebeenlesssevereinthepastfewyears
Fish$
KirraReefcontinuestosupportahighdiversityofreefRassociatedandpelagic(ienonR reefassociated) fishspecies Despite itsdiminishedsizecompared to1995KirraReef continuestoprovidevaluablehabitatforanumberoffishspeciesfromdifferentfunctional groups
ThereisahighdegreeofinterRannualvariabilityinthespeciesandabundanceofthefish present at Kirra Reef compared with the assemblage at Palm Beach Reef This likely reflectsthetemporalvariabilityintheavailablehabitatasaconsequenceofreefburialand reRemergenceThediversityqualityandarealextentofreefhabitatareimportantfactors influencing the distribution abundance biomass and diversity of reef fish (Bellwood amp Hughes2001HFriedlanderetal2003)Diversityandabundanceoffishcanincreasewith
TRESBPKirraReefMarineBiotaMonitoring2015 48
frc environmental
greaterstructuralcomplexityandincreasedheterogeneityofavailablehabitats(Bellwood ampHughes2001)Thissuggeststhatperiodsofreefburialreducetheoveralldiversityof reefRassociated fish species at Kirra Reef Despite the reduction in overall reef space therewasalargervarietyofhabitats(suchasmarcoalgaeandturfalgae)in2015which was likely to be related to the high diversity of fish assemblages This is particularly importantforseveralspeciesthatdependonthepresenceoflsquostructurersquosuchasprovided by reef habitat (ie oldwife moray eels damselfish and Australian mado that were recordedinMarch2015butwerenotrecordedinJuly2012)
Theabundanceanddiversityof fishare likelytobenegativelyaffectedfollowingperiods of severe weather which create unfavourable conditions for many species and may further exacerbate the affects of abrasion and sedimentation The biomass of fish is knowntodecreasewithincreasingexposuretophysicaldisturbancefromwaveactionand strong currents (Friedlander et al 2003) As our surveys have been undertaken at different times of the year variation in the prevailing conditions at the time of sampling could also influence the types of fish observed (and the amount of reef habitat that is availableatanytime)Manyofthespeciesmayalsobeaffectedbyseasonalchangesin the water temperature such as damselfish which are less abundant in cool waters However theoveralldiversityof the fishassemblageatKirraReef is likely toreflect the sizeoftheoutcropsexposedwithagreaterphysicaldisturbance(fromseaconditionsand sandmovement)andcompetitionHandlesserfoodavailablewhenthereefiscovered
ThepredictedimpactstoKirraReefasaresultoftheTRESBPincludedaccretionofsand around the base of the rock outcrops causing a reduction in extent of reef It was predictedthatsanddeliveryaspartoftheprojectwouldeventuallymimiclsquonaturalrsquopatterns ofsanddispersalandthatthereefwouldreturntoitsnaturalextent(ietheextentpriorto extension of the Tweed River training walls in 1962) The benthic flora and fauna assemblages of the reef the historical reef extent and natural sand transport patterns wereexpectedtoreturntoconditionsobservedbeforetheextensionofthetrainingwalls between 1962 and 1965 However the Environmental Impact Study did not predict the ecologicalconsequencesofboththereducedarealextentandincreasedwaveenergy(a consequenceofdecreaseddepth)thathavebeenrecorded
ThecurrentextentofKirraReef remains less than50of that recorded in1962and in 1995beforethesanddeliverybytheTRESBPcommencedHowevertheextentofreef in1995 wasstrongly influenced by adepletion in sand following the construction of the Tweed River training walls and the Kirra Point groyne Accumulation of sand on Kirra ReefwasobservedtoincreaseasaresultofindirectsandnourishmentbytheTRESBP and the reef has been extensively covered (particuarly between 2005 and 2010) as a result
Whiletheextentofthereefcontinuestochangeovertimethedeliveryofsandaspartof the project now more closely matches the natural rate of longshore sand transport ShortRtermandseasonalchangesintheextentofthereefarenowlikelytobetheresultof waveandcurrentaction(particularlyduringservereweatherevents)thanadirectimpact of the TRESBP Therefore the extent of Kirra Reef in March 2015 is broadly in accordancewithpredictionsmadeintheEISwhichpredictedthatthereefwouldreturnto a condition similar to that exhibited in the preR1960rsquos ie before the extension of the TweedRiverbreakwatersthatinterruptedlittoralsandsupplytothesebeaches
InDecember2013KirraPointgroynewasextendedby30mwiththeexpectationthatthe beach bar would move seaward as a consequence At present Kirra Point groyne is unlikelytohavehadamajorimpactonthearealextentofKirraReefHoweverongoing monitoringbasedonaerialphotographsmayprovidefurtherinsight
Sessile benthic assemblages on Kirra Reef are highly susceptible to the influence of storms and associated wave action (Kay amp Keough 1981H Walker et al 2008) The shallowreefissurroundedbymobilesandwhichcanshiftnaturallyinresponsetowave action during storms causing burial of large sections of Kirra Reef This effect has reduced the availability of rocky substrate for colonisation and the availability of refuge
Fromanexaminationof theextentofKirraReef fromarealmapsandwaveheightdata thereappears tobea relationshipbetween theareaof rockexposedandstormevents Notably in a series of storm events in May 2009 corresponds with large areas of rock becoming exposed (with the reef approximately 100m2 in 2006 and approximately in 1009m2 2009) Further a stormy conditions between December 2011 and July 2012 correspondstotheareaofexposedrockmorethandoublinginsizeWhiletherewasno changetothetotalareaofexposedrockfollowingstormyconditionsinearly2013there wasaclearchangeinthedistibutionofexposedrockduringthistimeSince2013storm conditions have been calm to moderate and there has been little change in the areal extentanddistrubtionofexposedrockatKirraReef
WaveheighttypicallyincreasesduringstormeventsandgiventheshallowdepthofKirra Reef waves are more likely to shoal and break across the reef during storms This increases thephysicaldisturbanceabrasionandsedimentationofbenthicassemblages onKirraReefStormdisturbancecancauselocalreductionsinthespeciesrichnessand abundanceofcoral(Woodleyetal1981HMasselampDone1993HHughes1994HConnellet al 1997) and can alter fish assemblages indirectly through habitat modifications (Kaufman1983HJonesampSyms1998)ordirectlybyincreasingfishmortality(Lassig1983) The hydrodynamic forces produced by wave action are an important source of disturbance in subtidal habitats inflicting damage through direct physical impact and abrasion(UnderwoodampKennelly1990)DirectimpactsfromphysicaldisturbanceatKirra Reefareevidentduringsurveyeventswhenlargefragmentsofmacroalgaearepresentin thewatercolumnoverthereef
Storm and wave action (and associated sedimentation and abrasion) continue to be importantforcesshapingthedistributionandabundanceofbenthicspeciesatKirraReef Increased magnitude and frequency of physical disturbance resulting from increased exposureorsusceptibility tostormsandassociatedwaveaction (asonKirraReef)can lead to a decrease in the diversity of sessile invertebrate assemblages DisturbanceR drivenreductionsinbiodiversityhavethepotentialtoimpactnegativelyonthehealthand productivity of reef ecosystems (Walker et al 2008) Biodiversity is important to reef health given that many of these species (eg sponges bryozoans and ascidians) contribute a range of vital ecosystem services to reefs including nutrient cycling (Scheffers et al 2004) trophic interactions and food webs (Lesser 2006H Pawlik et al 2007) bioRerosion (Rutzler 2002H LopezRVictoria et al 2006) and stabilizing substrata (DiazampRutzler2001HWulff2001)
Theimpactsof increasedwaveactionandsedimentationonthebenthicassemblagesat Kirra Reef are likely to be greatest during and immediately following storm conditions
TRESBPKirraReefMarineBiotaMonitoring2015 51
frc environmental
Partitioningtheinfluenceofstormandwavedrivendisturbancefromthatoftheoperation oftheTRESBPwouldrequireamuchmorestatisticallypowerfulandtemporilyreplicated experimental design Given there is a large collection of wave and storm data by TRESBP this would involve greater temporal sampling of Kirra Reef including event samplingfollowingseverewaveandstormactivity
The data generated by this Kirra Reef biota monitoring program doesnrsquot support statistically rigorous consideration of seasonality (monitoring has been at its most frequentannual)
InApril2014andMarch2015KirraReefcoveredlessthan50ofthereefrsquosextentprior to theoperationof theTRESBP The lossof reefhabitathasreducedtheavailabilityof hard substratum available for colonisation and consequently the abundance of benthic sessileassemblages
The reduced depth of water resulting from the accumulation of sand exacerbates the effects of storms and wave action It is likley that as a consequnece the biological communities of Kirra Reef will reflect earlyRstage succession more frequently and for longerperiods
While there is sufficient structure available frcenvironmentalexpect that Kirra Reef will continuetoprovideimportanthabitatforadiverseassemblageoffishes
TRESBPKirraReefMarineBiotaMonitoring2015 52
frc environmental
5$ Conclusions$
Although there is still a substantial portion of the reef covered compared to before the extension of the Tweed River entrance breakwaters the current extent of Kirra Reef is broadly inaccordancewithpredictionsmadein theEIS Initial lsquocatchRuprsquobypassingand dredgeplacementofsand(between2001and2008)resulted in theburialofKirraReef Subsequentsanddelivery(since2008onwards)morecloselyreflectsnaturalpatternsof longRshoresandtransportandisthereefhasslowlyreRemerged
Theextentofthereefhasbeenrelativelystablesince2013Thishasallowedforsome succession in the benthic assemblages including a relatively high cover of sponges ascidiansandcrinoidsWiththedeliveryofsandmorecloselymatchingthenaturalrateit isexpected the reef willundergoshortRtermchanges in extentdue toseasonal shifts in sand deliveryH however the diversity of benthic assemblages on Kirra Reef is likely to increaseovertimeThiswouldcreatemorespaceforspeciestorecruitandreducesthe influence of sand abrasion and wave damage It was predicted that the areas of Kirra Reef newly exposed in 2012 would undergo a shift from turfRdominated communities to more diverse communities that could include macroalgae sponges ascidians and potentiallyhardandsoftcoralWiththeexceptionofhardandsoftcoralsthisprediction wasconfirmedbytheresultsoftheApril2014andMarch2015surveys
ThediversityoffishesassociatedwithKirraReefisbroadlysimilartothatrecordedprior tothecommencementofsandbypassingin1995Giventhatfisharemobilethegreatest impacts on fish assemblages are likely to be shortRterm changes due to both the prevailingconditionsandchangestheextentofavailablehabitatthatprovidesshelterand foodforavarietyofdifferentspeciesIfKirraReefincreasesinsizethereislikelytobea greater proportion of cryptic benthic species as these species are more typical of assemblagesinalaterstageofsuccession(eg(WillisampAnderson2003))
Assuming a broadly stable delivery rate of sand and consequent stable extent of Kirra ReeflsquorecoveryrsquoislikleytobesubstantivelycompleteFloralandfaunalcommunitieswill undergo succession between severe storm events but are likley to remain relatively dynamic
Albert S Udy J amp Tibbetts I 2008 Responses of algal communities to gradients in herbivorebiomassandwaterqualityinMarovoLagoonSolomonIslandsCoral0 Reefs2773R82
Anderson MJ 2001 A new method for nonRparametric multivariate analysis of varianceAustral0Ecology2632R46
Anderson MJ 2004 PERMDISP0 a0 FORTRAN0 computer0 program0 for0 permutatinoal0 analysis0 of0 multivariate0 dispersions0 (for0 any0 twoSfactor0 ANOVA0 design)0 using0 permutational0 tests Department of Statistics University of Auckland New Zealand
Cannon LR Goeden GB amp Campbell P 1987 Community patterns revealed by trawling in the interRreef regions of the Great Barrier Reef Memoirs0 of0 the0 Queensland0Museum2545R70
Chapman MG Underwood AJ amp Skilleter GA 1995 Variability at different spatial scalesbetweenasubtidalassemblageexposedtothedischargeofsewageand two control assemblages Journal0 of0 Experimental0 Biology0 and0 Ecology 189 103R122
Cheshire AC Miller DJ amp Stewart R (1999) Effect0 of0 dispersed0 sediment0 plumes0 from0beach0sand0replenishment0dredging0on0recruitment0of0phaeophycean0algae0 to0rocky0reefs0in0Gulf0St0Vincent0South0Australia0The0Impact0of0Sand0Dredging0 on0 Benthic0 Community0 Structure0 at0 the0 Port0 Stanvac0 Dredge0 Site0 20 1S39 UniversityofAdelaideAdelaide
ConnellJHHughesTPampWallaceCC1997A30Ryearstudyofcoralabundance recruitment and disturbance at several scales in space and time Ecological0 Monographs67461R488
Diaz MC amp Rutzler K 2001 Sponges an essential component of Caribbean coral reefsBulletin0of0Marine0Science69535R546
DodgeREampVaisnysJR1977Coralpopulationsandgrowthpatternsresponsesto sedimentation and turbidity associated with dredging Journal0 of0 Marine0 Research35715R730
Done TJ 1982 Patterns in the distribution of coral communities across the central GreatBarrierReefCoral0Reefs195R107
Edwards RA amp Smith DA 2005 Subtidal assemblages associated with a geotextile reef insouthReastQueenslandAustraliaMarine0and0Freshwater0Research56 133R142
FisheriesResearchConsultants1991Survey0of0the0Intertidal0and0Subtidal0Rocky0Reefs0 of0 the0 Sunshine0 Coast report prepared for Queensland National Parks and WildlifeService
HarrisonPHarriotVBanksSampHolmesN1998ThecoralcommunitiesofFlinders Reef andMyora Reef in theMoretonBay MarineParkQueensland Australia In Moreton0 Bay0 and0 Catchment Tibbits I Hall N amp Dennison W (Eds) SchoolofMarineScienceUniversityofQueenslandStLuciapp525R536
Hatcher B Johannes R amp Robertson A 1989 Review of research relevant to the conservationofshallowtropicalmarineecosystemsOceanography0and0Marine0 Biology0an0Annual0Review27337R414
Hoey A amp Bellwood D 2008 CrossRshelf variation in the role of parrotfishes on the GreatBarrierReefCoral0Reefs37R47
TRESBPKirraReefMarineBiotaMonitoring2015 56
frc environmental
Hollingsworth P 1975 Environmental Investigation Report Crown Reserve R R68 Currumbin Creek City of the Gold Coast Land Administration Commission unpublishedreport
Hughes TP 1994 Catastrophes phase shifts and large scale degradation of a CaribbeancoralreefScience2651547R1551
Hughes TP Rodrigues MJ Bellwood DR Ceccarelli D HoeghRGuldberg O McCook L Moltschaniwskvi N Pratchett MS Steneck RS amp Willis B 2007Phaseshiftsherbivoryandtheresilienceofcoralreefstoclimatechange Current0Biology17360R365
Hutchinson A Rempel C Taveras V Loder J amp Salmond J 2013 Reef0 Check0 Australia0 South0 East0 Queensland0 Summary0 Report0 2013 report prepared for ReefCheckFoundationLimited
Hyder Consulting 1997 Tweed0 River0 Entrance0 Sand0 Bypassing0 Project0 Permanent0 Bypassing0 System0 0 Environmental0 Impact0 Statement0 0 Impact0 Assessment0 Study report prepared for New South Wales Department of Land and Water Conservation
Jompa J amp McCook LJ 2002 Effects of competition and herbivory on interactions betweenahardcoralandabrownalgaJournal0of0Experimental0Marine0Biology0 and0Ecology27125R39
KayAMampKeoughMJ1981Occupationofpatchesintheepifaunalcommunitieson pier pilings and the bivalve Pinna bicolor at Edithburgh South Australia Oecologia48123R130
KennellyS1987aInhibitionofkelprecruitmentbyturfingalgaeandconsequencesfor an Australian kelp community Journal0 of0 Experimental0 Marine0 Biology0 and0 Ecology11249R60
Kennelly S 1987b Physical disturbances in an Australian kelp community I temporal effectsMarine0Ecology0Progress0Series40145R153
TRESBPKirraReefMarineBiotaMonitoring2015 57
frc environmental
Kennelly S 1989 Effects of kelp canopies on understory species due to shade and scourMarine0Ecology0Progress0Series50215R224
Lassig BR 1983 The effects of a cyclonic storm on coral reef fish assemblages Environmental0Biology0of0Fishes955R63
Lawson S McMahon J amp Boswood P 2001 Environmental management of the construction and operation of a sand bypassing system at the Tweed River EntranceInThe15thAustralasianCoastalandOceanEngineeringConference the 8th Australasian Port and Harbour Conference 25 R 28 September 2001 QueenslandAustralia
Lesser MP 2006 BenthicRpelagic coupling on coral reefs feeding and growth of Caribbean sponges Journal0 of0 Experimental0 Marine0 Biology0 amp0 Ecology 328 277R288
LopezRVictoriaM ZeaSampWei E2006 Competition for spacebetweenencrusting excavatingCaribbeanspongesandothercoral reeforganismsMarine0Ecology0 Progress0Series312113R121
MalcolmHASmithSDAampJordanA2009Usingpatternsofreeffishassemblages to refine a Habitat Classification System for marine parks in NSW Australia Aquatic0Conservation0Marine0and0Freshwater0Ecosystems2083R92
Massel SR amp Done TJ 1993 Effects of cyclone waves on massive coral assemblages on the Great Barrier Reef meteorology hydrodynamics and demographyCoral0Reefs12153R166
Mumby PJ amp Steneck RS 2008 Coral reef management and conservation in light of rapidly evolving ecological paradigms Trends in Ecology amp Evoution 23 555 -563
Murphy HM amp Jenkins GP 2010 Observational methods used in marine spatial monitoring of fishes and associated habitats a review Marine and Freshwater Research 61 236-252
Noriega R 2007 An Overview of Available Information on Sandy Beach Ecology Coastal Sand Dunes Rocky Reefs and Associated Biota on the Gold Coast Griffith Centre for Coastal Management Research Report No 85 report prepared for Griffith University
Parker P (1995) Structure to Reef Fish Assemblages at Julian Rocks Northern New South Wales Masters Thesis Griffith University
Parker PG 1999 Fish assemblages at Julian Rocks and the adjacent waters of northern New South Wales Australia Australian Zoologist 31 134 - 160
Pawlik JR Steindler L Henkel TP Beer S amp Ilan M 2007 Chemical warfare on coral reefs sponge metabolites differentially affect coral symbiosis in situ Limnology and Oceanography 52 907-911
Reef Check 2010 httpwwwreefcheckaustraliaorgdatahtml accessed December 2015
Robinson KI amp Pollard DA 1982 Marine and estuarine reserves in Australia with particular reference to New South Wales Wetlands 2 17 - 26
Rogers CS 1990 Responses of coral reefs and reef organisms to sedimentation Marine Ecology Progress Series 62 185-202
Russ GR 2003 Grazer biomass correlates more strongly with production than with biomass of algal turfs on a coral reef Coral Reefs 22 63-67
Rutzler K 2002 Impact of crustose clionid sponges on Caribbean reef corals Acta Geologica Hispanica 37 61-72
Scheffers SR Nieuwland G Bak RPM amp van Duyl FC 2004 Removal of bacteria and nutrient dynamics within the coral reef framework of Curacao (Netherlands Antilles) Coral Reefs 23 413-422
TRESBP Kirra Reef Marine Biota Monitoring 2015 59
frc environmental
Schlacher-Hoenlinger M Walker S Johnson J Schlacher T amp Hooper J 2009 Biological Monitoring of the Ex-HMAS Brisbane Artificial Reef Phase II - Habitat Values report prepared for Environmental Protection Agency (EPA)
Smith KA 2003 A simple multivariate technique to improve the design of a sampling strategy for age-based fishery monitoring Fisheries Research 64 79-85
Smith S Edwards R Dalton S amp Harrison M 2005 Biological assessment of fish and benthic communities at Palm Beach Bait Reef Gold Coast Queensland report prepared for University of New England
TRESBP 2014 Autum 2009 storms httpwwwtweedsandbypassnswgovauarticles-and-studiesinteresting-itemsautumn-2009-storm updated 4 May 2014 accessed December 2015
TRESBP 2015a Tweed Sand Bypassing Restoring Coastal Sand Drift Improving Boating Access ndash Techinical information httpwwwtweedsandbypassnswgovau__dataassetspdf_file0004552055kir ra-feb-2015pdf acessed December 2015
TRESBP 2015b Waves httpwwwtweedsandbypassnswgovauenvironmental-monitoringcoastal-conditionswaves updated 30 September 2015 accessed December 2015
Umar MJMLJ amp Price IR 1998 Effects of sediment deposition on the seaweed Sargassum on a fringing coral reef Coral Reefs 17 169-177
Underwood AJ amp Kennelly SJ 1990 Ecology of marine algae on rocky shores and subtidal reefs in temperate Australia Hydrobiologia 192 3-20
Walker S Schlacher T amp Schlacher-Hoenlinger M 2007 Spatial heterogeneity of epibenthos on artificial reefs fouling communities in the early stages of colonization on an East Australian shipwreck Marine Ecology 28 435-445
Walker SJ Degnan BM Hooper JNA amp Skilleter GA 2008 Will increased storm intensity from climate change affect biodiversity in non-scleractinian sessile fauna on coral reefs Global Change Biology 14 2755-2770
Warwick RM amp Clarke KR 1993 Increased variability as a symptom of stress in marine communtities Journal of Experimental Marine Biology and Ecology 172 215-216
Thenumberofsitessurveyedhasvariedover timeasaresultof the fluctuating levelof sandcoveringKirraReef
Prior to May 2003 three sites were assessed along the eastern and northern edge of KirraReef(KirraReefOutersites1to3)andthreesiteswereexaminedalongtheinshore marginof the reef (KirraReef Inner sites1 to 3)(MapA1) ReefRedge (ieKirraOuter) siteswerechosentoprovideearlywarningofimpactsfromoffshoreplacementofdredged sandwhilst inshoresites(ieKirraInner)werechosentoindicatewhetherimpactsfrom inshore beach profile development were affecting the reef platform In May 2003 the threeeasternsitesatKirraReef (ieKRO1KRO2andKRI1)werecompletelycovered with bare mobile sand Consequently only the three western sites at Kirra Reef (ie KRO3KRI2andKRI3)supportedbenthicfloraandfaunaInMarch2004theextentof the remainingwesternoutcropof KirraReef had been further reduced so that all inner reefsiteswerecompletelycoveredwithmobilesandConsequentlyonlyasingleoriginal reefsite(ieKRO3)couldbesurveyed(Figure23)Thereforetoprovideanindicationof the condition of the remaining reef two new sites were established (ie KRN1 and KRN2)(Figure23)andsurveyedinMarch2004Theextentofthewesternreefhadbeen further reduced by February 2005 and a third new site (ie KRN3) was established (Figure23)Consequentlyfoursites(KRO3KRN1KRN2andKRN3)weresurveyedin February2005
InFebruary2010fourKirraReefsites(ieKRO3KRO1KRN1andKRN2)wereclearof thesurroundingsandandsupportedbenthic floraand fauna Inaddition several rocks protruded from the sand in the vicinity of site KRI2H these were assessed to provide a quantitativeindicationofbroadRscaletemporalchangestotheinshorereefcommunities
SOURCEScopy Copyright Commonwealth of Australia (Geoscience Australia) 2001 2004 2006copy The State of Queensland (Department of Natural Resources and Mines) 2015copy Nearmap 2014 2015
DATE2015-09-09
DRAWN BYCF
VERSION02
PROJECTIONCoordinate System GDA 1994 MGA Zone 56Projection Transverse MercatorDatum GDA 1994
plusmn SCALE
0 50 100
Metres
Scale 12500 A3
frc environmental
Appendix$B$ Introduction$to$Data$Analysis$Used$
Multivariate$Analyses$
Multivariate statistical techniques are widely used in ecology to assess the similarities relationshipsbetweenassemblagesWhereasunivariateanalysescanonlycompareone variable at a time (eg an index of community structure such as a diversity index or a singleindicatorspecies)multivariateanalysescancomparesamplesbasedontheextent thatassemblagesshareparticulartaxaandabundances(ClarkeampWarwick2001)
Thefirststepofmultivariateanalysisusuallyinvolvesthecreationofamatrixofsimilarity coefficients computed between every pair of samples The coefficient is usually a measureofhowclose theabundance is foreachspecies (definedso that100= total similarity and 0=complete dissimilarity) The Bray Curtis similarity measure is commonlythemostappropriateforbiologicaldata(ClarkeampWarwick2001)
MultidimensionalScaling
NonRmetricmultiRdimensionalscalingordinations(nMDS)attempttoplacesamplesintwo dimensionalspacesothattherankorderofthedistancesbetweensamplesmatchesthe rankorderofthematchingsimilaritiesfromthesimilaritymatrix(ClarkeampWarwick2001) Thisprovidesavisualrepresentationofthesimilaritiesbetweenassemblageswithineach sampleEachoftheaxesisnotrelatedtoanyparticularvalueHinfactaxescanberotated toprovide thebestvisual representationof thedata Ordinationsareparticularlyuseful tools for analysing and visually presenting differences between assemblages Ordinationsareessentiallymapsofsamples inwhich theplacementofsampleson the mapreflectsthesimilarlyofthecommunitytothecommunitiesinothersamples(Clarkeamp Warwick 2001) Distances between samples on an ordination attempt to match the similarities inassemblagestructurenearbypoints representassemblageswithvery few attributes(speciesorabundanceofspecies)Hpoints faraparthavevery fewattributes in common(ClarkeampWarwick2001)
A stress coefficient is calculated to reflect the extent to which the multiRdimensional scalingordinationandthesimilaritymatrixagree(ClarkeampWarwick2001)(iehowwell the multiRdimensional scaling ordination accurately reflects the relationship between samples)Stressvaluesoflt015aregenerallyacceptable
In Figure A1 each freshwater macroinvertebrate sample is represented on the multiRdimensionalscalingordination By lookingat thedistancesbetweeneachsample
ANOSIMisanalogoustoANOVAinunivariatestatistics(Smith2003)AglobalRstatistic iscalculatedtodeterminewhetherthereisasignificantdifferencebetweenallsamplesIf there are differences then pairwise comparisons are conducted to test for differences betweenpairsofsamples(analogoustopostRhoctestsinANOVA)
The R value lies between R1 and +1 (all similarities within groups are less than any similarity between groups) with a value of zero representing the null hypothesis (no differenceamongasetofsamples)(ClarkeampWarwick2001)ComparisonofpairwiseR values can give an indication of how different assemblages are R values close to 0 indicatelittledifferencevaluesaround05indicatesomeoverlapandvaluescloseto1to indicate many or substantial differences In many instances however researches are primarily interestedinwhethertheRvalueisstatisticallydifferentfromzero(usuallyata confidence level of 005) (Clarke amp Warwick 2001) (ie whether they can reject the null hypothesis)
ANOSIM can provide information on whether the (visual) differences between assemblages in the multiRdimensional scaling ordination are significantH it is an independenttestfromthemultiRdimensionalscalingordinationItisbasedontestingthe
TRESBPKirraReefMarineBiotaMonitoring2015 B2
frc environmental
differences between the rank similarities in the similarity matrix not on the distances betweensamplesinthemultiRdimensionalscalingordination(ClarkeampWarwick2001)
PermutationalMultivariateAnalysisofVariance
PERMANOVAisusedtotestsimultaneousresponsesofoneormorevariablestooneor more factors in an a0 priori0 structured design using random permutation of the data to assess significance (Anderson 2004) PERMANOVA generates a pseudo FRstatistic similar to traditional ANOVA but pRvalues are calculated with permutations which does notassumenormaldatadistribution PERMANOVAcanprovide informationonwhether the (visual) differences between assemblages in a multiRdimensional scaling ordination are significantH however it is an independent test from the multiRdimensional scaling ordination
Thelevelofmultivariatedispersionamongsampleswithineachofthetestgroupscanbe examined using the permutational analysis of multivariate dispersions (PERMDISP) routine(Anderson2004)Intraditionalimpactassessmentachangeinthedispersionof datacanalsoindicateanimpact
SimilarityPercentagendashSpeciesContributions
SIMPER analysis provides information on how dissimilar assemblages from various groups are (eg how similar all of the macroinvertebrate samples taken for a particular habitatwithinastreamreachare)andhowsimilareachgroup(egreach)istoanyother group SIMPER analysis also identifies the species taxa that are contributing to the dissimilarity between two assemblages in rank order (ie it identifies which species is contributingthemosttothedifferences)SIMPERanalysismayhelptoidentifypotential lsquoindicatorrsquospeciesForexampleifaparticularspeciesconsistentlycontributesgreatlyto the differences between impacted and unimpacted assemblages it may be a useful indicator Theabundanceofthis indicatorspeciescanthenbecomparedbetweensites usingunivariatetechniquessuchasANOVA
Data is available on request from tresbpprojectofficecrownlandnswgov
TRESBPKirraReefMarineBiotaMonitoring2015 C1
frc environmental
Appendix(D( Pairwise( PERMANOVA( Results
Data is available on request from tresbpprojectofficecrownlandnswgov
TRESBPKirraReefMarineBiotaMonitoring2015 D1
frc environmental
Appendix(E( Relative(Abundance(of(Fish(found(at(Kirra(( ( and(Palm(Beach(Reefs(in(Each(Survey((Data is available on request from tresbpprojectofficecrownlandnswgovau
TRESBPKirraReefMarineBiotaMonitoring2015 E1
Structure Bookmarks
0 50 100 Metres Scale 12500 A3
0 50 100 200 Metres Scale 15000 A3
Kirra Reef
Kirra Reef
Kirra Reef
Kirra Reef
Kirra Reef
Kirra Reef
Map A1Location of Kirra Reef monitoring sites
Table D8 Pairwise comparison of macroalgae cover between sites in each year
Table D15 Pairwise comparison of turf algae cover between sites in each year
Table D29 Pairwise comparison of ascidian cover between sites in each year
Table D43 Pairwise comparison of soft coral cover between sites in each year
frc environmental
AccumulationofsandonKirraReefwasobservedasaresultofindirectsandnourishment bytheTRESBP(notethedecreaseinareaofKirraReefafter1995inTable11)Aerial photographs taken in 2003 and 2004 showed the reef to be of significantly less extent than the range of extent observed in 1962 and 1965 (Table 11) Loss of reef area continuedforsomeyearsandbyearly2006theareaofexposedreefhadbeenreduced to lt100m2 There was a substantial lag between the reduction in sand delivery and transportof thesand furthernorthdue toaperiodofcalmer thanusualconditionswith reducedstormactivityfromthenorth`eastAssuchdispersionofsandfromKirraBeach andreductioninthesandlevelsaroundthereefbetween2005and2009wasslowerthan predicted (refer to Figure 11 for the extent of reef in 2009) As a consequence of the extensiveburialofthereefsimplevisualinspectionsofthereefwereundertakeninplace offullecologicalsurveysbetween2006and20102
In2009eightyearsaftertheinitiationofsandpumpingbytheTRESBPbeganaseriesof storms shifted approximately 200000 m3 of sand from Kirra Beach to the north This storm was the worst protracted storm for east facing beahes in at least 14 years with significant wave heights remaining for four days (TRESBP 2014) This along with the removalofapproximately140000m3ofsandfromtheKirraBeachintertidalzoneagain uncoveredpartsofKirraReef (TRESBP2015a) Since2008sanddeliveryvolumesof the TRESBP have been more consistent with the natural quantity of sand movement alongthecoastEcologicalsurveysrecommencedin2010astheexposedareasofKirra Reefincreasedinextent
Between November 2011 and August 2012 there was a large increase in the northern section of Kirra Reef when the area of exposed rock more than doubled (Table 11R Figure11) This corresponds to a lsquostormy yearrsquowith one severe storm and twomajor storms recorded (TRESBP 2015b) Further stormy conditions were recorded in early 2013withoneextremestorm(approximately110yearevent)inJanuaryandonemajor storminFebruary(TRESBP2015)Therewaslittlechangeinthetotalareaofexposed reefduring this time (note thesimilarareaofAugust2012andMay2013 inTable11) Howevertherewascleardistributionchangesintheareasofexposedrock(Figure11) Thereefareahasremainedrelativelystablesince2013withminorchangesintheareaof rock exposed (Table 11R Figure 11) Wave height data since 2013 indicates calm to moderate conditions with only minor storms recorded except in May 2015 when there wasaseverestorm(TRESBP2015)Inlate2013KirraPointgroynewasreinstatedby 30mtoitsorginalconstructedlengthGiventheminorchangesintheexposedrocksince
2 Underwater visual inspections were completed by Gilbert Diving and Gold Coast City Council from
In2014KirraReefcoveredanareaof2920m2Rpredominantlyinthenorthernsectionof thereefInMarch2015thisnorthernsectioncoveredanareaofapproximately2672m2 (Figure11andFigure12)an85decreaseintheexposedextentbetween2014and 2015 In March 2015 the rocky outcrops were typically between 1 and 2m above the cleanmobilesandwithseveraloutcropsextendingtomorethan2mabovethesandA small section (116m2) of the eastern reef wasalsoexposed inMarch 2015 (Figure 11 andFigure12)Howeverthereefarearemainslessthan50oftheextentrecordedin 1962and1995beforetheTRESBPbegan(Table11Rreefareabetween1962and1965 was between 7000 and 13300 Department of Land and Water Conservation photogrammetricanalysis)
TRESBPKirraReefMarineBiotaMonitoring2015 5
frc environmental
Table11 ApproximateexposedextentofKirraReef
Area(m2) Date SourceofImage
NorthernSection SouthernSection EasternSection Total
The southeast Queensland (SEQ) region comprises five subregions the Gold Coast Inner Moreton Bay Outer Moreton Bay Sunshine Coast and Fraser Coast Coral communities within SEQ are diverse with an extensive range of coral growth forms (Harrison et al 1998) The greatest diversity of coral species are typically found at offshoresites likeFlindersReefswhere119differentcoralspecieshavebeen recorded (Harrisonetal1998)
Subtidal rocky reefs of the Gold Coast region comprise remnants of highly eroded volcanic substratum isolated by wide variable expanses of soft sediment (Edwards amp Smith 2005) They support community assemblages that are indicative of a transition between the tropical waters of the Great Barrier Reef and the temperate waters characteristicofthemidNewSouthWalescoast(Done1982XCannonetal1987)
GoldCoastreefcommunitiesarebroadlysimilartoareasofcomparabletopographytothe north(InnerGneeringsoffshorefromMooloolabaandoffshoreofMoretonBay)andtothe south (Julian Rocks offshore of Byron Bay) that are dominated by macroalgae and sessile invertbrates(FisheriesResearchConsultants1991XHarriottetal1999XEdwards amp Smith 2005X Baronio amp Butcher 2008X Fellegara 2008X SchlacherHoenlinger et al 2009)ManyoftheGoldCoastsreefslocatedclosetoshoreareoftenaffectedbyhuman activities (Noriega 2007)and typicallyhave lesscoralcover Ina2013surveyofSEQ reefsGoldCoastreefshadthelowesthardcoralcoverat9(Hutchinsonetal2013)
Fish of the Gold Coast region are similar in community composition to that recorded offshore of Moreton Bay at Julian Rocks and the Solitary Islands offshore of Coffs Harbourandtoa lesserextentat theexHMASBrisbanenearMooloolaba(Robinsonamp Pollard 1982X Parker 1995X Parker 1999X Edwards amp Smith 2005X Malcolm et al 2009X SchlacherHoenlingeretal2009) The smaller inshore reefsof theGoldCoast region suchasKirraReeftypicallysupportalowerabundanceanddiversityoffishes(Edwards ampSmith2005Xfrcenvironmental2005)
Kirra$Reef$
ThebenthicassemblagesofKirraReefarecharacterisedbyahighcoverofmacroalgae andturfalgaeandamoderatecoverofsessilebenthicinvertebratesincludingafewhard corals(EdwardsampSmith2005Xfrcenvironmental2005)Turfalagecoversthemajorityof the reef substrate Crinoids (feather stars) ascidians (sea squirts) and sponges are typically themostabundantbenthic faunawhilstanemonessoftcoralsandurchinsare present in low numbers (frc environmental 2014) The composition of benthic assemblagesatKirraReef isbroadlysimilar to thatdescribed fromadjacent rockyreefs
Exposuretowaveactionsandscouringandsmotheringareimportantfactorsinfluencing the distribution and abundance of sessile species on rocky reefs (Kay amp Keough 1981X McGuinness1987)ChangeintheheightofsandaroundthebaseofKirraReefappears to be a major factor influencing the abundance (cover) of benthic flora and fauna periodically resulting in a bare stratum on rocks within 08 to 1m of the seafloor Outcropsontheeasternsectionof thereefcomplexwherewaveactionand likelysand abrasion are greatest have historically supported a lower abundance of benthic fauna than outcrops on the northern section (Fisheries Research Consultants 1995a)X (Fisheries Research Consultants 1995b)X (Fisheries Research Consultants 1996)X (frc environmental 2003)X (frc environmental 2004)X (frc environmental 2005)X (frc environmental2010)
Strong wave action results in sustained abrasion of the dominant brown macroalgae (Sargassum(flavicans(andEcklonia( radiata)causing the fronds tobreak Thecontinual resuspensionofalgal fragments(commonlyreferredtoas lsquocornflakesrsquo)candramatically reducewaterclarityandvisibility Algal fragmentswere largelyabsent inJuly2012and April2014surveyslikelyduetolongperiodsofrelativelybenignseaconditionsInMarch 2015amoderateamountofalgalfragmentswasobservedlikelyduetostormactivityin theweeksproceedingthesurvey(egmoderateseas11to14Februaryandminorstorm over1922February)
RecentsurveysatPalmBeachReefcompletedbyReefCheckrecordedadeclineinhard coralcover from2008to2013(Hutchinsonetal2013) Sessile invertebrates including spongescoralsandascidianstypicallydominatethebenthicassemblageofPalmBeach Reef(EdwardsampSmith2005X frcenvironmental2005XReefCheck2010) Thecoverof sessileinvertebrateshashistoricallybeensimilartothatrecordedfromtheoutersections of Kirra Reef However the cover of macroalgae has consistently been loweron Palm BeachReefthanonKirraReefTheproximityofPalmBeachReeftotwocreekmouths andtheabsenceofstrongcurrentsintheareatypicallyresultsinahighlevelofturbidity Elevated turbidity together with greater water depth and a high abundance of grazing
TRESBPKirraReefMarineBiotaMonitoring2015 10
frc environmental
speciessuchasurchinsislikelytocontributetoarelativelylowcoverofmacroalgaeand abundant suspension feeding organisms such as ascidians sponges hydrozoans and crinoidsatPalmBeachReef(Smithetal2005)
PalmBeachhasa lowerabundanceanddiversityof benthicdemersaland pelagic fish comparedtoKirraReef(Smithetal2005)ThegreaterdensityoffishatKirraReefmay beaconsequenceof the lossof reef forcingmore fish intoasmallerarea (Smithetal 2005)PalmbeachrecordedaslightlylowerdiversityoffishthanKirraReefin2012and 2014surveys(frcenvironmental2012Xfrcenvironmental2014)
TRESBPKirraReefMarineBiotaMonitoring2015 11
frc environmental
2$ Methods$
The methods used in the March 2015 survey were developed for the Stage I survey completed in April and June 1995 and used for subsequent surveys February 1996 January 2001 May 2003 March 2004 February 2005 February 2010 July 2012 and April2014 Datawere collected from KirraReef (2816251535309) andPalmBeach Reef(2810751534774)locatedapproximately9kmnorth(Figure21)
Themainobjectiveof the monitoring was to investigateanychange in the marinebiota and habitat of Kirra Reef compared to Palm Beach Reef (comparative reef) in order to assesstheeffectofthesandbypassproject(andsubsequentincreasesinsandload)on theecologyofKirraReef
0 2 41
Kilometres
Service Layer Credits Sources Esri HERE DeLorme Intermap increment P Corp GEBCO USGS FAO NPS NRCAN GeoBase IGN Kadaster NL Ordnance
0 2 41
Kilometres
Service Layer Credits Sources Esri HERE DeLorme Intermap increment P Corp GEBCO USGS FAO NPS NRCAN GeoBase IGN Kadaster NL Ordnance
Threesites(KRN1KRN2KRO3)atKirraReef(waterdepth5to8m)weresurveyedin March 2015 (Map 1) The remainder of the sites previously surveyed were covered by sand(refertoappendixAforahistoryofsitespreviouslysurveyed)Threecomparative sites (PB1 PB2 and PB3) were also surveyed at Palm Beach Reef (water depth 12 to 17m)(Map2)
TRESBPKirraReefMarineBiotaMonitoring2015 12
orth NetreStkicrraG
Marine Parade
t eertS ickr
M rarin ae Pa Grade
Musgrave St
t
re ee e Powel t r lt CrescenS t t es eel ri tM S
t ee ge drt u tleS d Rro MuL sgrave Street
LEGEND 0 1 Km Tweed River E ntrance Sand Bypassing Project Survey Site Road Network
copy Copyright Commonwealth of Australia (Geoscience Australia) 2001 2004 2006copy The State of Queensland (Department of Natural Resources and Mines) 2015copy Nearmap 2014
DATE2015-03-24
DRAWN BYCF
VERSION01
PROJECTIONCoordinate System GDA 1994 MGA Zone 56Projection Transverse MercatorDatum GDA 1994
plusmn SCALE
0 50 100 200
Metres
Scale 15000 A3
Gold Coast Highway
i
PalmBeach
Tugun
Coolangatta
0 1 Km
frc environmental
22$ Benthic$Flora$and$Macroinvertebrates$
At each site benthic assemblages were surveyed in fifteen 025m2 quadrats with the percentcoverofbenthicmacroalgaeturfalgaespongesascidianshardcoralsandsoft coralsassessedvisually(Figure22)Quadratswereplacedhaphazardlywhichincluded horizontal and sloping surfaces The minimum distance between quadrats was approximately2m Thenumberof largeascidians (Pyurastolonifera)crinoids (feather stars)barnaclesurchinstubewormspolychaeteshydroidszoanthidsandcowriesand the dominant species of macroalgae were also recorded and quantitative notes were madeontheapparenthealthofeachtaxonomicgroup
ThespeciesrichnessandrelativeabundanceoffishatKirraReefandPalmBeachReef were assessed using a combination of underwater visual census (UVC) and video surveys The combination of these techniques represents the most costeffective and efficientmeansofobtainingdataonthestructureoffishassemblagesindifferenthabitats (Murphy amp Jenkins 2010) A baited remote underwater video (BRUVX baited with pilchards) and footage captured by a diver swimming hapazard trasects over the reef wererecorded
Video footage from each BRUV (approximately 20minutes) and video transects (approximately 35 minutes) was reviewed by an ecologist experienced in marine fish identification
24$ Data$Analysis$
Permutational multivariate analysis of variance (PERMANOVA) was used to determine differences in the composition (cover of benthic fauna and taxonomic group) of benthic assemblagesbetweenKirraReefandPalmBeachReefover time PERMANOVAuses permutational methods (PsuedoAF) to derive statistical significance which require fewer assumptionstobemetthananalogousmethodssuchasmultivariateanalysisofvariance (MANOVA) (Anderson 2001X Anderson et al 2008) This analysis enables an examinationofchangesinthecommunityasawhole
A three factor PERMANOVA was used to examine differences in the composition of benthic assemblages with survey (fixed factor) locations (Palm Beach Reef and Kirra Reeffixedfactor)andsites(nestedinlocationsasarandomfactor)asthefactorsData weresquareroot transformedtodownweightdominatingspeciesabundanceXconverted toaBrayCurtisdistancematrixXandtestedforsignificanceusingasmanypermutations as allowed (9800 to 9937 unique permuations achieved for all factors and factor combinationsXexceptlocationwhere10uniquepermutationswereachieved))Posthoc pairwisetestwasusedtodeterminethemagnitudeofdifference
Nonmetricmultidimensionalscaling (nMDS)ordinationswereused tovisually represent the variation in the composition of assemblages between reefs separately for each survey nMDS ordinations were also used to visually represent the variation in the compositionofassemblagessurveysatKirraReefforallsurveysXbaselinesurveyinApril 1995andMarch2015XandApril2014andMarch2015
Separate univariate PERMANOVAs were used to compare differences in the cover of macroalgae turf algae and the abundance of crinoids and ascidians Data were
TRESBPKirraReefMarineBiotaMonitoring2015 16
frc environmental
converted to a eucildean distances matrixX and tested for significance using as many permutations as allowed (998 to 999 unique permuations achieved for all factors and factor combinationsX except location where 10 unique permutations were achieved) Factors were survey (fixed factor) locations (Palm Beach Reef and Kirra Reef fixed factor)andsites (nested in locationsanda random factor) Posthoc pairwise testwas used to determine the magnitude of difference Monte Carlo procedures were used to calculateempiricalPvaluesforthesurveyxlocationtest
Further information on the use and interpretation of PERMANOVA and other analyses usedinthisreportisprovidedinAppendixB
TRESBPKirraReefMarineBiotaMonitoring2015 17
frc environmental
3$ Results$
31$ Cover$of$Benthic$Assemblages$
The composition of benthic fauna and flora ( cover and type combined Appendix C) variedbetweenmostsitesatbothKirraReefandPalmBeachReefandbetweennearly allsurveysateachsite(notethesignificantinteractionofsite(location)xsurveyinTable 31X Appendix D) Nevertheless there appeared to be substantial differences in the compositionofthebenthicassemblagesbetweenthetworeefsineachsurveyfrom1995 to2015(Figure31toFigure33)
In2015 therewassomeoverlap in thecompositionofassemblagesonKirraandPalm Beach Reefs (Figure 33) However there was also some clear patterns of difference including
Benthic assemblages at Kirra Reef appeared to show some overlap between surveys (Figure34H) HowevernearlyallsurveysweredifferentateachsiteatbothKirraReef andPalmBeachReef(AppendixD)BenthicassemblagesinMarch2015andApril2014 wereverysimilarcomparedtobenthicassemblages inthebaselinesurvey inApril1995 andMarch2015(notethegreateroverlapinFigure35comparedtoFigure36)
In March 2015 as in previous surveys the macroalgae Sargassum sp dominated the benthic assemblages at all sites at Kirra Reef (Figure 37) Other species present included
sdot Dictyopteris0arostichoides0
sdot Dilophus0intermedius00
sdot Zonariasp
sdot Laurencia0brongniartic0
sdot Amphiroa0anceps0
sdot Caulerpa0lentilliferaand
sdot Halimeda0discoideaand
sdot Macrocystissp
Juvenile kelp (from the genus Macrocystis) was also emerging on some areas of Kirra Reef
ThecoverofmacroalagevariedbetweensitesandsurveysatbothKirraReefandPalm Beach Reef with the magnitude of difference varying over time (note the significant interaction between site (location) x survey in Table 32) Macroalgae cover varied between surveys with 2001 being the most different to the other years (Appendix D) ThereweredifferencesbetweensitesatKirraReefinJune1995February1996January 2001 May 2003 February 2005 and February 2010 and between sites at Palm Beach ReefinJanuary2001andFebruary2010Inrecentsurveys(2012to2015)thecoverof macroalgaeatsitesatbothKirraReefandPalmBeachReefwassimilar (AppendixD) indicatingarelativelyconsistentdistributionacrossbothreefs
ThemeancoverofmacroalgaeatKirraReefhasdeclinedsinceitspeakin2001withthe greatest magnitude of decline recorded between January 2001 and May 2003 (Figure 38)InsurveysbetweenJune1995andMay2003Sargassumspformeddensecarpets overtherockysubstratecoveringupto58oftheavailablesurfaceareaofthereefIn February 2010 macroalgal cover was 12 Macroalgal cover has increased to 26 in March2015ThisissimilartothecoverrecordedinApril1995(23cover)(Figure38)
In2015nomacroalgaewasrecordedwithinthequadratsatPalmBeachReefThecover of macroalgae on Palm Beach Reef has been consistently lower than Kirra Reef since
TRESBPKirraReefMarineBiotaMonitoring2015 26
frc environmental
ecologicalmonitoringbegan typically lessthan5of theavailablesurfacearea(Figure 38)
The mean cover of turf algae varied between sites and surveys at both Kirra Reef and PalmBeachReef(notethesignificantinteractionbetweensite(location)xsurveyinTable 33)SpecificallythereweresignificantdifferencesbetweensitesatbothKirraReefand PalmBeachReefinJune1995January2001February2010July2012andApril2014 (aswellasbetweensitesinFebruary1996atKirraReef)Thecoverofturfalgaevaried betweenmostsurveysatallsitesateachreef(AppendixD)BothKirraandPalmBeach reefs showed major increases in the percent cover of turf algae from 2010 to 2012 followedbyadecreaseincoverbetween2012and2014(Figure310)Thecoverofturf algae is typically lower at Kirra Reef than at Palm Beach Reef (July 2012 being an exception) and was again slightly lower at Kirra Reef in March 2015 (Table 310) In March2015turfalgaewasmoreprevalentatKirraReefthanduringthebaselinesurvey ofApril1995
ThemeancoverofspongesatsomesitesatbothKirraReefandPalmBeachReefhas varied significantly during some surveys (note the significant interaction between site (location)xsurvey inTable34HFigure311) However thecoverofspongestendedto bemore temporallyvariable atKirraReef than at Palm Beach Reef (Figure312) The cover of sponges at Kirra Reef varied between sites in February 1996 January 2001 March2004July2012andApril2014 However thecoverofspongesatPalmBeach Reefonlyvariedbetweensites inJanuary2001andFebruary2010 (AppendixD) The cover of sponges varied between survey at each site with 1995 1996 and 2001 most differenttootheryears(AppendixD)
ThemeancoverofspongesatKirraReefdeclinedbetweenMarch2004(20cover)and February 2010 (less than 1 cover) Since 2010 the cover of sponges has increased slightly with sponges covering 8 of the reef in March 2015 (Figure 312) In March 2015thecoverofspongeswashigherthanrecordedduringthebaselinesurveyinApril 1995(3cover)(Figure312)
Figure312 Mean cover of sponges (plusmnSE) at Kirra Reef and Palm Beach Reef on all
surveys
Table34 Univariate PERMANOVA results for differences in the cover of sponges betweensurveysandlocations
Factor$ df$ MS$effect$ PseudoF$ p$(perm)$
survey 10 18576 276 0018
location 1 39671 589 0210
site(location) 4 67354 477 0001
locationxsurvey 10 1490 221 0032
site(location)xsurvey 40 67331 477 0001
error 924 14108
Shadingdenotessignificanceatplt005
TRESBPKirraReefMarineBiotaMonitoring2015 32
frc environmental
Ascidians$
ThemeanabundanceofallascidiansotherthanPyura0stoloniferahasvariedsignifcantly between sites at Kirra Reef and Palm Beach Reef and between surveys at each site (Figure314andnotethesignificantinteractionbetweensite(location)xsurveyinTable 35) The abundance of ascidians was different between sites at Kirra Reef in January 2001May2003March2004February2005andApril2014HanddifferentatPalmBeach ReefinJanuary2001February2005February2010andMarch2015Theabundance ofascidiansvariedbetweensurveysateachsitewith1995beingmostdifferentwhenthe abundanceofascidianswaslow(AppendixD)InMarch2015theabundanceofallother ascidiansonKirraReefandPalmBeachReefwashigherthanpreviouslyreportedinthe baselinesurveyinApril1995(whennoascidianswererecorded)Themeanabundance washigheratKirraReefthanatPalmBeachReef(Figure314)
ThemeanabundanceofPyura0stoloniferahasvariedconsiderablybetweensitesatKirra Reef and Palm Beach Reef over time (note the significant interaction between site (location) x survey in Table 36) In March 2015 the mean abundance (individual per 025m2plusmnSE)of theascidianPstolonifera (Figure313)wassimilaratKirraReefand PalmBeachReef(Figure315)ThemeanabundanceofP0stoloniferahasrangedfrom 02to17individualsper025m2atbothreefssinceMay2003
Figure315 Mean abundance of ascidians (Pyura0 stolonifera) (individuals025m2)
(plusmnSE)atKirraReefandPalmBeachReefinallsurveys
TRESBPKirraReefMarineBiotaMonitoring2015 34
frc environmental
Table35 Univariate PERMANOVA results for the differences in cover of all ascidians otherthanPyura0stolonifera0betweensurveysandlocations
Factor$ df$ MS$effect$ PseudoF$ p$(perm)$
survey 10 26658 474 0001
location 1 13603 710 0104
site(location) 4 19154 149 0212
locationxsurvey 10 2629 468 0001
site(location)xsurvey 40 5621 438 0001
error 924 12828
Shadingdenotessignificanceatplt005
Table36 Univariate PERMANOVA results for the differences in Pyura0 stolonifera densitybetweensurveysandlocations
Factor$ df$ MS$effect$ PseudoF$ p$(perm)$
survey 10 16254 11842 0001
location 1 12445 60881 0206
site(location) 4 20442 56799 0001
locationxsurvey 10 79724 58082 0001
site (location) x 40 13726 38138 0001 survey
error 924 35991
Shadingdenotessignificanceatplt005
$
TRESBPKirraReefMarineBiotaMonitoring2015 35
frc environmental
Hard$Coral$
There was a significant difference between the cover of hard corals at Kirra Reef and PalmBeachReefduringsomesurveys(notethesignificantinteractionbetweenlocationx surveyinTable37)SpecificallytherewassignificantlymorehardcoralatPalmBeach Reef thanKirraReef inFebraury1996March2004April2014andMarch2015(Table 38)
ThecoverofhardcoralistypicallylowonKirraReefaccountingforlessthan2ofthe availablesubstrateInMarch2015hardcoralcoveredlessthan1oftheareaofKirra Reef which was less than the cover recorded during the baseline survey in April 1995 (Figure 316) In contrast hard coral covered 11 of the surface area at Palm Beach ReefwhichwasgreaterthanthecoverrecordedinApril1995(Figure316)
The cover of hard corals at Palm Beach Reef has been more variable over time comparedtothecoverofhardcoralatKirraReef(Figure316)Withtheexceptionofthe surveys inApril1995andJanuary2001when thecoverofhardcoralwas lowonboth reefshardcoralsaretypicallymoreprevalentatPalmBeachReef(Figure316)
Table38 PERMANOVA post hoc pairwise results for the differences in the cover of hardcoralbetweenlocationsineachsurveyevent
Hard$Corals$ Survey$
t$ p$(MC)$a$
Apr1995 054 0606
Jun1995 182 0140
Feb1996 541 0006
Jan2001 R R
May2003 166 0168
Mar2004 765 0001
Feb2005 049 0646
Feb2010 156 0197
Jul2012 283 0053
Apr2014 525 0011
Mar2015 695 0003 Shadingdenotessignificanceatplt005 a pvaluesbasedonMonteCarlotests
TRESBPKirraReefMarineBiotaMonitoring2015 37
60
50
40
30
20
10
0
Soft
Cor
al C
over
()
Kirra Reef Palm Beach Reef
frc environmental
Soft$Coral$
The cover of soft coral was significantly different between sites at both Kirra Reef and PalmBeachReefandduringsomesurveys(notethesignificant interactionbetweensite (location)xsurvey)TherewasnosoftcoralrecordedatKirraReefinMarch2015The coverofsoftcoralhasdeclinedatKirraReefsince2003andhascoveredlessthan2of theavailablesubstratesince2005whichissimilartothecoverofsoftcoraldescribedfor the baseline surveys in 1995 (Figure 317) The cover of soft coral was consistent betweensitesineachsurveyexceptbetweensitesin
sdot April1995atKirraReef
sdot 1996atKirraReef
sdot 2003atPalmBeachReefand
sdot 2014atPalmBeachReef(AppendixD)
Soft corals have historically covered more of the available space on Palm Beach Reef than on Kirra Reef However there was more temporal variability within sites at Palm BeachReefthanatKirraReef(AppendixD)ThecoverofsoftcoralatPalmBeachReef has varied over time and was highest in April 1995 (48 cover) Despite increasing sinceFebruary2005itisstilllowerthanthecoverrecordedduringthebaselinesurveyin April1995(Figure317)
Table39 UnivariatePERMANOVAresults for thedifferences in thecoverofsoft coral betweensurveysandlocations
Factor$ df$ MS$effect$ PseudoF$ p$(perm)$
survey 10 44657 1323 0001
location 1 32922 6620 0117
site(location) 4 49732 266 0036
locationxsurvey 10 40982 1214 0001
site (location) x 40 3376 181 0002 survey
error 924 18688
Shadingdenotessignificanceatplt005
$
TRESBPKirraReefMarineBiotaMonitoring2015 39
frc environmental
Crinoids$
ThereisasignificantdifferencebetweensomesitesatbothKirraReefandParmBeach Reef that varies through time (note the significant interaction between site (location) x survey inTable310) Theabundanceofcrinoidshasbeensimilarbetweensites inall years at Palm Beach ReefH and was different beween sites at Kirra Reef in June 1995 February1996May2003andFebruary2005(AppendixD)Withineachsitetherehas been some natural temporal variability particualrly at Palm Beach Reef sites in 2001 (Appendix D) The mean abundance (individuals 025m2) of crinoids (Figure 318) at KirraReefandPalmBeachReefhasgenerallybeenlessthan2individualsper025m2 andhasdeclinedatboth locationssincethebaselinesurvey inApril1995(Figure319) However the mean abundance of crinoids on Kirra Reef has shown a slight increase sinceFebruary2010(Figure319)
In March 2015 fewer crinoids were recorded at Palm Beach Reef than at Kirra ReefH crinoidshavebeenrareatPalmBeachReefsince2003
The species richness of fish recorded from Kirra Reef across all monitoring events has rangedfrom14to57 InMarch201557specieswereidentifiedat thereefwhichwas similar to April 2014 (53) and higher than previous surveys (Figure 320) Species richnessatPalmBeachReefwas lower(34species)andgenerallyvaried lessbetween surveyscomparedtoKirraReef
InMarch2015 the assemblage of fish at KirraReef comprised species fromall trophic levelsincludingdetritivoresplanktivoresherbivoresandcarnivores(AppendixE)Asin previous surveys the assemblage was dominated by herbivores and planktivores Yellowtail (Trachurus0 novaezelandiae) and striped sea pike (Sphyraena0 obtusata) were the dominant species present in large schools (Figure 321) Australian mado (Atypichthys0 strigatus) ringRtailed surgeon (Acanthurus0 blochii) silver trevally (Pseudocaranx0 georgianus) eastern pomfred (Schuettea0 scalaripinnis) sweep (Scorpis0 lineolatus) and various wrasses were also very abundant releative to other species (AppendixE)
Two new species were observed at Kirra Reef the orangeRband surgeon (Acanthurus0 olivaceus) and the unicornfish (Naso0 sp) Five new species were recorded at Palm BeachReef
No threatened or protected fish species listed under the Queenslandrsquos Nature0 Conservation0Act01992ornationallyundertheEnvironmental0Protection0and0Biodiversity0 Conservation0 Act0 1999 were observed The complete list of species recorded and the relativeabundanceispresentedinAppendixE
TRESBPKirraReefMarineBiotaMonitoring2015 42
60
0
10
20
30
40
50
Num
ber
of F
ish
Spe
cies
Apr-95
Jun-95
Feb-96
Jan-01
May-03
Mar-04
Feb-05
Feb-10
Jul-12
Apr-14
Mar-15
Kirra Reef Palm Beach Reef Location
frc environmental
Figure320 Number of fish species recorded at Kirra Reef and Palm Beach Reef on
ThegreatestchangetotheecologicalconditionofKirraReefsincethebaselinesurveyin 1995 has been the loss of large areas of hard substrate that support benthic flora and faunaThedeliveryoflargesandvolumesduringthestage1dredgingoperations(1995 to1998)andtheinitialoperationofthesandbypasssystem(2001to2008)resultedinan increaseinwaveactionandtidalcurrentsredistributingthissandoverKirraReef
The three major outcrops of Kirra Reef (northern southern and eastern sections) are naturally exposed and covered depending on water and sand movements In March 2015 the rocky outcrops in the northern section of Kirra Reef were exposed and supportedamoderatelydiversebenthicassemblagedominatedbyturfalgaeTherewas arelativelyhighfishdiversityatKirraReefTheecologicalassemblageexhibitedsignsof ongoingstressfromphysicaldisturbanceincludingtheabsenceofsoftcoralsandrarityof hardcoral(MumbyampSteneck2008)HoweverKirraReefhasarelativelyhighcoverof sponges and ascidians Sponges ascidians and crinoids were more abundant at Kirra ReefthanatPalmBeachReefinMarch2015
KirraReefcontinues toprovidehabitatandsupport importantecological functions in the region providing hard substrate for the colonisation of algae and benthic invertebrates and food and refuge for fish As sand levels have stabilised since 2008 assemblages have becomemoresimilar to those recordedprior to implementationof the TRESBP in April1995 Forexamplemacroalgalcover inApril1995andMarch2015wasrelatively similarHoweverassemblagecompositionisstillsignificantlydifferenttothatrecordedin thebaselinesurveysmostnoticeablyduetoa lowercoverofbaresubstrateandhigher coverofturfalgaeandascidianssincesurveyshavebeenperformed
Benthic$Macroalgae$
The cover of macroalgae at Kirra Reef was relatively similar during the 2014 and 2015 surveys and remained well below the peak of nearly 60 cover recorded in January 2001TherewasasteepdeclineinthecoverofmacroalgaebetweenJanuary2001and May2003whichappearedtobestronglyassociatedwith thedecline inreefareaduring that time as well as a decline in the cover of Sargassum sp (an important indicator speciesonKirraReef) SimilardeclineswereevidentatPalmBeachReefbetween the January2001andMay2003surveys
TRESBPKirraReefMarineBiotaMonitoring2015 45
frc environmental
The cover ofmacroalgae at Palm Beach Reef was much lower thanat Kirra Reef over time There are several possible reasons for the lower cover of macroalgae at Palm Beach
sdot PalmBeachReefisdeeperthanKirraReefandgenerallyhashigherturbidityand therefore greater light attenuation The quantity and quality of available light affectsthedistributionandgrowthofmacroalgae(MillerampEtter2008)
sdot Differences in the pattern of recruitment of algal species to the reefs due to differentwatercurrentsandtimingofthesurveys(Kennelly1987b)
sdot Increased competition with turf algae and sessile benthic invertebrates which competeforspacewithmacroalgae(Kennelly1987aHMillerampEtter2008)
sdot PresenceofdifferentspeciesandhigherdensityofherbivoresatPalmBeachReef (particularly sea urchins and herbivorous fish) which graze on macroalgae (McCook1997HJompaampMcCook2002)
Biological assemblages exposed to physical stress typically exhibit greater levels of temporalandspatialvariability(WarwickampClarke1993HChapmanetal1995)Temporal variationinthecoverofmacroalgaeatKirraReefislikelytobeprincipallyduetotheeffect ofphysicaldisturbance fromwaveactionaswellas theassociatedassociatedabrasion andsmotheringbysandTheeffectsofthesephysicaldisturbanceswouldincreasewith thereductionofKirraReefasedgeeffectsarepronouncedandwaterdepth isreduced Increasedsmotheringbysandcanalsoreducediversity(Hatcheretal1989)abundance recruitment growth survival and seasonal regeneration of macroalgae (Umar amp Price 1998HCheshireetal1999)
Changes in the cover of macroalgae on Kirra Reef over time are also likely due to the extentofthereefchangingHthefishandmobileinvertbratesassociatedwiththereefmay have concentrated which would in turn increase grazing pressure Increased grazing pressure from fish and mobile invertebrates can reduce the coverage and diversity of macroalgaeonreefs(McCook1997HJompaampMcCook2002)
Thecoverof turfalgaeatbothKirraReefandPalmBeachReefhasvariedsignificantly betweensurveysPriorto2005turfalgaetypicallycoveredlessoftheavailablesurface areaonKirraReefthanPalmBeachReefInMarch2015themeancoverofturfalgae hasincreasedsincebaselinesurveysin1995andwasrelativelysimilarbetweenreefs(40 plusmn4atKirraReefcomparedto48plusmn4atPalmBeachReef)Thecoverofturfalgaeat Kirra Reef was similar in 2014 and 2015 which was generally higher than previous surveysexceptduringJuly2012whencoverofturfalgaepeakedat67plusmn4
TRESBPKirraReefMarineBiotaMonitoring2015 46
frc environmental
Turfalgaearebecomingadominantcomponentofcommunitiesaroundtheworld likely the result of rapid colonisation of openspace after a disturbance (eg storms) nutrient enrichment andor changes in grazing pressures Turf algae can also reflect a more physically robust growth form suited to high wave energy environments (than foliose macroRalgae)TurfalgaepeakedintheJuly2012surveylikelyrelatedtotheincreasein bare reef exposure following a stormy conditions in early 2009 and between December 2011 and June 2012 Turf algae have been the dominant form of algae on Kirra Reef sincethistimealbeitthecoverlowerthanthe2012survey
Increased cover of turf algae is typically related to good light conditions high concentrationsofnutrientsandlownumbersofgrazerssuchasfish(orconstantgrazing pressure preventing macroalgae colonisation) However the relationship between algal dynamics physical disturbance water quality and herbivore grazing activity is complex andthecoverof turfalgaecanexhibitextremetemporalvariabilityasaconsequenceof the interactionbetween topRdownandbottomRupprocesses (Russ2003HBellwoodetal 2006H Hughes et al 2007H Albert et al 2008H Hoey amp Bellwood 2008H Mumby 2009) Furtherinvestigationwouldberequiredtoreliablydeterminethemechanismsofchangein bothmacroalgaeandturfalgaeassemblagesonthesereefs
Benthic$Macroinvertebrates$
AtKirraReeftheburialandreRemergenceofrockyoutcrops(influencedbytheTRESBP) islikelytohaveincreasedtemporalvariabilityinthedistributionandabundanceofbenthic macroinvertebrates Additional perturbations such as wave action and sand abrasion (each influenced through changes in bathymetry seabed topography and water depth) are likely to have resulted in the decline in cover and diversity of the benthic macroinvertebratesatKirraReefbetweensurveysparticularlybetweenMarch2004and February2005andduringtheseverestormsof2009Benthicmacroinvertebratessuch asascidiansspongeshardcoralandsoftcoralarehighlysusceptible to theeffectsof stormandwavedisturbancephysicalabrasionandburialbysand(KayampKeough1981H Walker et al 2008) which can affect settlement growth rate and survival (Dodge amp Vaisnys1977HRogers1990)
Physical disturbance from sand burial sand abrasion and the action of storm waves appeartokeepthebenthicassemblagesofKirraReefinastateofearlysuccessionItis commonforearlypioneerspeciessuchassomemacroalgaetorecruitrapidlytoahard surface in large numbers allowing these species to dominate assemblages early in the successionaltrajectory(Walkeretal2007)
Afurther indicatorof theearlystateofsuccessionatKirraReef isthatthecoverofhard and soft coral has remained very low (generally lt 5) In March 2015 less than 1
Benthic macroinvertebrate cover may also be affected indirectly through increased competitionwithmacroalgaeforspaceThepresenceoflargemacroalgaecanaffectthe recruitment and survival of sessile benthic invertebrates as fronds moving with wave action sweep and abrade the surface of rocks killing new recruits especially corals (Kennelly1989HMcCooketal2001)Itcantakeseveralyearsforhardandsoftcoralto become dominant on reefs in the SEQ region (SchlacherRHoenlinger et al 2009) Therefore hard coral is not expected to become abundant until several years after the reefhasbeenuncoveredandonlyifthephysicaldisturbanceregimeandsupplyofnew recruitsissufficienttosupportsurvivalandgenerationalsuccessionofthesespeciesThe coverofhardandsoftcoralsatKirraReefwerebothverylowandpatchypriortothestart oftheTRESBP
Sponges and ascidians are highly susceptible to smothering and sand abrasion unless theyhaveathicktunic(outercoveringmadeofkeratin)liketheascidianP0stolonifera0or strong internal keratin silicon or calcareous structures in the case of some species of sponges0(KayampKeough1981HMcGuinness1987HWalkeretal2008)Duetoincreased wave action and sedimentation (which can be influenced by the TRESBP) the mean coverofascidiansandspongeswasexpectedtobemuchloweronKirraReefthanPalm Beach Reef However in March 2015 the cover of sponges was similar between the reefsandthecoverofascidians(otherthanP0stolonifera)wasgreateratKirraReefthan at Palm Beach Reef This suggests that Kirra Reef is slowly recovering from the increasedstressofphysicaldisturbancesuchas increasedwaveactionandsandscour andorthatwaveandstormconditionshavebeenlesssevereinthepastfewyears
Fish$
KirraReefcontinuestosupportahighdiversityofreefRassociatedandpelagic(ienonR reefassociated) fishspecies Despite itsdiminishedsizecompared to1995KirraReef continuestoprovidevaluablehabitatforanumberoffishspeciesfromdifferentfunctional groups
ThereisahighdegreeofinterRannualvariabilityinthespeciesandabundanceofthefish present at Kirra Reef compared with the assemblage at Palm Beach Reef This likely reflectsthetemporalvariabilityintheavailablehabitatasaconsequenceofreefburialand reRemergenceThediversityqualityandarealextentofreefhabitatareimportantfactors influencing the distribution abundance biomass and diversity of reef fish (Bellwood amp Hughes2001HFriedlanderetal2003)Diversityandabundanceoffishcanincreasewith
TRESBPKirraReefMarineBiotaMonitoring2015 48
frc environmental
greaterstructuralcomplexityandincreasedheterogeneityofavailablehabitats(Bellwood ampHughes2001)Thissuggeststhatperiodsofreefburialreducetheoveralldiversityof reefRassociated fish species at Kirra Reef Despite the reduction in overall reef space therewasalargervarietyofhabitats(suchasmarcoalgaeandturfalgae)in2015which was likely to be related to the high diversity of fish assemblages This is particularly importantforseveralspeciesthatdependonthepresenceoflsquostructurersquosuchasprovided by reef habitat (ie oldwife moray eels damselfish and Australian mado that were recordedinMarch2015butwerenotrecordedinJuly2012)
Theabundanceanddiversityof fishare likelytobenegativelyaffectedfollowingperiods of severe weather which create unfavourable conditions for many species and may further exacerbate the affects of abrasion and sedimentation The biomass of fish is knowntodecreasewithincreasingexposuretophysicaldisturbancefromwaveactionand strong currents (Friedlander et al 2003) As our surveys have been undertaken at different times of the year variation in the prevailing conditions at the time of sampling could also influence the types of fish observed (and the amount of reef habitat that is availableatanytime)Manyofthespeciesmayalsobeaffectedbyseasonalchangesin the water temperature such as damselfish which are less abundant in cool waters However theoveralldiversityof the fishassemblageatKirraReef is likely toreflect the sizeoftheoutcropsexposedwithagreaterphysicaldisturbance(fromseaconditionsand sandmovement)andcompetitionHandlesserfoodavailablewhenthereefiscovered
ThepredictedimpactstoKirraReefasaresultoftheTRESBPincludedaccretionofsand around the base of the rock outcrops causing a reduction in extent of reef It was predictedthatsanddeliveryaspartoftheprojectwouldeventuallymimiclsquonaturalrsquopatterns ofsanddispersalandthatthereefwouldreturntoitsnaturalextent(ietheextentpriorto extension of the Tweed River training walls in 1962) The benthic flora and fauna assemblages of the reef the historical reef extent and natural sand transport patterns wereexpectedtoreturntoconditionsobservedbeforetheextensionofthetrainingwalls between 1962 and 1965 However the Environmental Impact Study did not predict the ecologicalconsequencesofboththereducedarealextentandincreasedwaveenergy(a consequenceofdecreaseddepth)thathavebeenrecorded
ThecurrentextentofKirraReef remains less than50of that recorded in1962and in 1995beforethesanddeliverybytheTRESBPcommencedHowevertheextentofreef in1995 wasstrongly influenced by adepletion in sand following the construction of the Tweed River training walls and the Kirra Point groyne Accumulation of sand on Kirra ReefwasobservedtoincreaseasaresultofindirectsandnourishmentbytheTRESBP and the reef has been extensively covered (particuarly between 2005 and 2010) as a result
Whiletheextentofthereefcontinuestochangeovertimethedeliveryofsandaspartof the project now more closely matches the natural rate of longshore sand transport ShortRtermandseasonalchangesintheextentofthereefarenowlikelytobetheresultof waveandcurrentaction(particularlyduringservereweatherevents)thanadirectimpact of the TRESBP Therefore the extent of Kirra Reef in March 2015 is broadly in accordancewithpredictionsmadeintheEISwhichpredictedthatthereefwouldreturnto a condition similar to that exhibited in the preR1960rsquos ie before the extension of the TweedRiverbreakwatersthatinterruptedlittoralsandsupplytothesebeaches
InDecember2013KirraPointgroynewasextendedby30mwiththeexpectationthatthe beach bar would move seaward as a consequence At present Kirra Point groyne is unlikelytohavehadamajorimpactonthearealextentofKirraReefHoweverongoing monitoringbasedonaerialphotographsmayprovidefurtherinsight
Sessile benthic assemblages on Kirra Reef are highly susceptible to the influence of storms and associated wave action (Kay amp Keough 1981H Walker et al 2008) The shallowreefissurroundedbymobilesandwhichcanshiftnaturallyinresponsetowave action during storms causing burial of large sections of Kirra Reef This effect has reduced the availability of rocky substrate for colonisation and the availability of refuge
Fromanexaminationof theextentofKirraReef fromarealmapsandwaveheightdata thereappears tobea relationshipbetween theareaof rockexposedandstormevents Notably in a series of storm events in May 2009 corresponds with large areas of rock becoming exposed (with the reef approximately 100m2 in 2006 and approximately in 1009m2 2009) Further a stormy conditions between December 2011 and July 2012 correspondstotheareaofexposedrockmorethandoublinginsizeWhiletherewasno changetothetotalareaofexposedrockfollowingstormyconditionsinearly2013there wasaclearchangeinthedistibutionofexposedrockduringthistimeSince2013storm conditions have been calm to moderate and there has been little change in the areal extentanddistrubtionofexposedrockatKirraReef
WaveheighttypicallyincreasesduringstormeventsandgiventheshallowdepthofKirra Reef waves are more likely to shoal and break across the reef during storms This increases thephysicaldisturbanceabrasionandsedimentationofbenthicassemblages onKirraReefStormdisturbancecancauselocalreductionsinthespeciesrichnessand abundanceofcoral(Woodleyetal1981HMasselampDone1993HHughes1994HConnellet al 1997) and can alter fish assemblages indirectly through habitat modifications (Kaufman1983HJonesampSyms1998)ordirectlybyincreasingfishmortality(Lassig1983) The hydrodynamic forces produced by wave action are an important source of disturbance in subtidal habitats inflicting damage through direct physical impact and abrasion(UnderwoodampKennelly1990)DirectimpactsfromphysicaldisturbanceatKirra Reefareevidentduringsurveyeventswhenlargefragmentsofmacroalgaearepresentin thewatercolumnoverthereef
Storm and wave action (and associated sedimentation and abrasion) continue to be importantforcesshapingthedistributionandabundanceofbenthicspeciesatKirraReef Increased magnitude and frequency of physical disturbance resulting from increased exposureorsusceptibility tostormsandassociatedwaveaction (asonKirraReef)can lead to a decrease in the diversity of sessile invertebrate assemblages DisturbanceR drivenreductionsinbiodiversityhavethepotentialtoimpactnegativelyonthehealthand productivity of reef ecosystems (Walker et al 2008) Biodiversity is important to reef health given that many of these species (eg sponges bryozoans and ascidians) contribute a range of vital ecosystem services to reefs including nutrient cycling (Scheffers et al 2004) trophic interactions and food webs (Lesser 2006H Pawlik et al 2007) bioRerosion (Rutzler 2002H LopezRVictoria et al 2006) and stabilizing substrata (DiazampRutzler2001HWulff2001)
Theimpactsof increasedwaveactionandsedimentationonthebenthicassemblagesat Kirra Reef are likely to be greatest during and immediately following storm conditions
TRESBPKirraReefMarineBiotaMonitoring2015 51
frc environmental
Partitioningtheinfluenceofstormandwavedrivendisturbancefromthatoftheoperation oftheTRESBPwouldrequireamuchmorestatisticallypowerfulandtemporilyreplicated experimental design Given there is a large collection of wave and storm data by TRESBP this would involve greater temporal sampling of Kirra Reef including event samplingfollowingseverewaveandstormactivity
The data generated by this Kirra Reef biota monitoring program doesnrsquot support statistically rigorous consideration of seasonality (monitoring has been at its most frequentannual)
InApril2014andMarch2015KirraReefcoveredlessthan50ofthereefrsquosextentprior to theoperationof theTRESBP The lossof reefhabitathasreducedtheavailabilityof hard substratum available for colonisation and consequently the abundance of benthic sessileassemblages
The reduced depth of water resulting from the accumulation of sand exacerbates the effects of storms and wave action It is likley that as a consequnece the biological communities of Kirra Reef will reflect earlyRstage succession more frequently and for longerperiods
While there is sufficient structure available frcenvironmentalexpect that Kirra Reef will continuetoprovideimportanthabitatforadiverseassemblageoffishes
TRESBPKirraReefMarineBiotaMonitoring2015 52
frc environmental
5$ Conclusions$
Although there is still a substantial portion of the reef covered compared to before the extension of the Tweed River entrance breakwaters the current extent of Kirra Reef is broadly inaccordancewithpredictionsmadein theEIS Initial lsquocatchRuprsquobypassingand dredgeplacementofsand(between2001and2008)resulted in theburialofKirraReef Subsequentsanddelivery(since2008onwards)morecloselyreflectsnaturalpatternsof longRshoresandtransportandisthereefhasslowlyreRemerged
Theextentofthereefhasbeenrelativelystablesince2013Thishasallowedforsome succession in the benthic assemblages including a relatively high cover of sponges ascidiansandcrinoidsWiththedeliveryofsandmorecloselymatchingthenaturalrateit isexpected the reef willundergoshortRtermchanges in extentdue toseasonal shifts in sand deliveryH however the diversity of benthic assemblages on Kirra Reef is likely to increaseovertimeThiswouldcreatemorespaceforspeciestorecruitandreducesthe influence of sand abrasion and wave damage It was predicted that the areas of Kirra Reef newly exposed in 2012 would undergo a shift from turfRdominated communities to more diverse communities that could include macroalgae sponges ascidians and potentiallyhardandsoftcoralWiththeexceptionofhardandsoftcoralsthisprediction wasconfirmedbytheresultsoftheApril2014andMarch2015surveys
ThediversityoffishesassociatedwithKirraReefisbroadlysimilartothatrecordedprior tothecommencementofsandbypassingin1995Giventhatfisharemobilethegreatest impacts on fish assemblages are likely to be shortRterm changes due to both the prevailingconditionsandchangestheextentofavailablehabitatthatprovidesshelterand foodforavarietyofdifferentspeciesIfKirraReefincreasesinsizethereislikelytobea greater proportion of cryptic benthic species as these species are more typical of assemblagesinalaterstageofsuccession(eg(WillisampAnderson2003))
Assuming a broadly stable delivery rate of sand and consequent stable extent of Kirra ReeflsquorecoveryrsquoislikleytobesubstantivelycompleteFloralandfaunalcommunitieswill undergo succession between severe storm events but are likley to remain relatively dynamic
Albert S Udy J amp Tibbetts I 2008 Responses of algal communities to gradients in herbivorebiomassandwaterqualityinMarovoLagoonSolomonIslandsCoral0 Reefs2773R82
Anderson MJ 2001 A new method for nonRparametric multivariate analysis of varianceAustral0Ecology2632R46
Anderson MJ 2004 PERMDISP0 a0 FORTRAN0 computer0 program0 for0 permutatinoal0 analysis0 of0 multivariate0 dispersions0 (for0 any0 twoSfactor0 ANOVA0 design)0 using0 permutational0 tests Department of Statistics University of Auckland New Zealand
Cannon LR Goeden GB amp Campbell P 1987 Community patterns revealed by trawling in the interRreef regions of the Great Barrier Reef Memoirs0 of0 the0 Queensland0Museum2545R70
Chapman MG Underwood AJ amp Skilleter GA 1995 Variability at different spatial scalesbetweenasubtidalassemblageexposedtothedischargeofsewageand two control assemblages Journal0 of0 Experimental0 Biology0 and0 Ecology 189 103R122
Cheshire AC Miller DJ amp Stewart R (1999) Effect0 of0 dispersed0 sediment0 plumes0 from0beach0sand0replenishment0dredging0on0recruitment0of0phaeophycean0algae0 to0rocky0reefs0in0Gulf0St0Vincent0South0Australia0The0Impact0of0Sand0Dredging0 on0 Benthic0 Community0 Structure0 at0 the0 Port0 Stanvac0 Dredge0 Site0 20 1S39 UniversityofAdelaideAdelaide
ConnellJHHughesTPampWallaceCC1997A30Ryearstudyofcoralabundance recruitment and disturbance at several scales in space and time Ecological0 Monographs67461R488
Diaz MC amp Rutzler K 2001 Sponges an essential component of Caribbean coral reefsBulletin0of0Marine0Science69535R546
DodgeREampVaisnysJR1977Coralpopulationsandgrowthpatternsresponsesto sedimentation and turbidity associated with dredging Journal0 of0 Marine0 Research35715R730
Done TJ 1982 Patterns in the distribution of coral communities across the central GreatBarrierReefCoral0Reefs195R107
Edwards RA amp Smith DA 2005 Subtidal assemblages associated with a geotextile reef insouthReastQueenslandAustraliaMarine0and0Freshwater0Research56 133R142
FisheriesResearchConsultants1991Survey0of0the0Intertidal0and0Subtidal0Rocky0Reefs0 of0 the0 Sunshine0 Coast report prepared for Queensland National Parks and WildlifeService
HarrisonPHarriotVBanksSampHolmesN1998ThecoralcommunitiesofFlinders Reef andMyora Reef in theMoretonBay MarineParkQueensland Australia In Moreton0 Bay0 and0 Catchment Tibbits I Hall N amp Dennison W (Eds) SchoolofMarineScienceUniversityofQueenslandStLuciapp525R536
Hatcher B Johannes R amp Robertson A 1989 Review of research relevant to the conservationofshallowtropicalmarineecosystemsOceanography0and0Marine0 Biology0an0Annual0Review27337R414
Hoey A amp Bellwood D 2008 CrossRshelf variation in the role of parrotfishes on the GreatBarrierReefCoral0Reefs37R47
TRESBPKirraReefMarineBiotaMonitoring2015 56
frc environmental
Hollingsworth P 1975 Environmental Investigation Report Crown Reserve R R68 Currumbin Creek City of the Gold Coast Land Administration Commission unpublishedreport
Hughes TP 1994 Catastrophes phase shifts and large scale degradation of a CaribbeancoralreefScience2651547R1551
Hughes TP Rodrigues MJ Bellwood DR Ceccarelli D HoeghRGuldberg O McCook L Moltschaniwskvi N Pratchett MS Steneck RS amp Willis B 2007Phaseshiftsherbivoryandtheresilienceofcoralreefstoclimatechange Current0Biology17360R365
Hutchinson A Rempel C Taveras V Loder J amp Salmond J 2013 Reef0 Check0 Australia0 South0 East0 Queensland0 Summary0 Report0 2013 report prepared for ReefCheckFoundationLimited
Hyder Consulting 1997 Tweed0 River0 Entrance0 Sand0 Bypassing0 Project0 Permanent0 Bypassing0 System0 0 Environmental0 Impact0 Statement0 0 Impact0 Assessment0 Study report prepared for New South Wales Department of Land and Water Conservation
Jompa J amp McCook LJ 2002 Effects of competition and herbivory on interactions betweenahardcoralandabrownalgaJournal0of0Experimental0Marine0Biology0 and0Ecology27125R39
KayAMampKeoughMJ1981Occupationofpatchesintheepifaunalcommunitieson pier pilings and the bivalve Pinna bicolor at Edithburgh South Australia Oecologia48123R130
KennellyS1987aInhibitionofkelprecruitmentbyturfingalgaeandconsequencesfor an Australian kelp community Journal0 of0 Experimental0 Marine0 Biology0 and0 Ecology11249R60
Kennelly S 1987b Physical disturbances in an Australian kelp community I temporal effectsMarine0Ecology0Progress0Series40145R153
TRESBPKirraReefMarineBiotaMonitoring2015 57
frc environmental
Kennelly S 1989 Effects of kelp canopies on understory species due to shade and scourMarine0Ecology0Progress0Series50215R224
Lassig BR 1983 The effects of a cyclonic storm on coral reef fish assemblages Environmental0Biology0of0Fishes955R63
Lawson S McMahon J amp Boswood P 2001 Environmental management of the construction and operation of a sand bypassing system at the Tweed River EntranceInThe15thAustralasianCoastalandOceanEngineeringConference the 8th Australasian Port and Harbour Conference 25 R 28 September 2001 QueenslandAustralia
Lesser MP 2006 BenthicRpelagic coupling on coral reefs feeding and growth of Caribbean sponges Journal0 of0 Experimental0 Marine0 Biology0 amp0 Ecology 328 277R288
LopezRVictoriaM ZeaSampWei E2006 Competition for spacebetweenencrusting excavatingCaribbeanspongesandothercoral reeforganismsMarine0Ecology0 Progress0Series312113R121
MalcolmHASmithSDAampJordanA2009Usingpatternsofreeffishassemblages to refine a Habitat Classification System for marine parks in NSW Australia Aquatic0Conservation0Marine0and0Freshwater0Ecosystems2083R92
Massel SR amp Done TJ 1993 Effects of cyclone waves on massive coral assemblages on the Great Barrier Reef meteorology hydrodynamics and demographyCoral0Reefs12153R166
Mumby PJ amp Steneck RS 2008 Coral reef management and conservation in light of rapidly evolving ecological paradigms Trends in Ecology amp Evoution 23 555 -563
Murphy HM amp Jenkins GP 2010 Observational methods used in marine spatial monitoring of fishes and associated habitats a review Marine and Freshwater Research 61 236-252
Noriega R 2007 An Overview of Available Information on Sandy Beach Ecology Coastal Sand Dunes Rocky Reefs and Associated Biota on the Gold Coast Griffith Centre for Coastal Management Research Report No 85 report prepared for Griffith University
Parker P (1995) Structure to Reef Fish Assemblages at Julian Rocks Northern New South Wales Masters Thesis Griffith University
Parker PG 1999 Fish assemblages at Julian Rocks and the adjacent waters of northern New South Wales Australia Australian Zoologist 31 134 - 160
Pawlik JR Steindler L Henkel TP Beer S amp Ilan M 2007 Chemical warfare on coral reefs sponge metabolites differentially affect coral symbiosis in situ Limnology and Oceanography 52 907-911
Reef Check 2010 httpwwwreefcheckaustraliaorgdatahtml accessed December 2015
Robinson KI amp Pollard DA 1982 Marine and estuarine reserves in Australia with particular reference to New South Wales Wetlands 2 17 - 26
Rogers CS 1990 Responses of coral reefs and reef organisms to sedimentation Marine Ecology Progress Series 62 185-202
Russ GR 2003 Grazer biomass correlates more strongly with production than with biomass of algal turfs on a coral reef Coral Reefs 22 63-67
Rutzler K 2002 Impact of crustose clionid sponges on Caribbean reef corals Acta Geologica Hispanica 37 61-72
Scheffers SR Nieuwland G Bak RPM amp van Duyl FC 2004 Removal of bacteria and nutrient dynamics within the coral reef framework of Curacao (Netherlands Antilles) Coral Reefs 23 413-422
TRESBP Kirra Reef Marine Biota Monitoring 2015 59
frc environmental
Schlacher-Hoenlinger M Walker S Johnson J Schlacher T amp Hooper J 2009 Biological Monitoring of the Ex-HMAS Brisbane Artificial Reef Phase II - Habitat Values report prepared for Environmental Protection Agency (EPA)
Smith KA 2003 A simple multivariate technique to improve the design of a sampling strategy for age-based fishery monitoring Fisheries Research 64 79-85
Smith S Edwards R Dalton S amp Harrison M 2005 Biological assessment of fish and benthic communities at Palm Beach Bait Reef Gold Coast Queensland report prepared for University of New England
TRESBP 2014 Autum 2009 storms httpwwwtweedsandbypassnswgovauarticles-and-studiesinteresting-itemsautumn-2009-storm updated 4 May 2014 accessed December 2015
TRESBP 2015a Tweed Sand Bypassing Restoring Coastal Sand Drift Improving Boating Access ndash Techinical information httpwwwtweedsandbypassnswgovau__dataassetspdf_file0004552055kir ra-feb-2015pdf acessed December 2015
TRESBP 2015b Waves httpwwwtweedsandbypassnswgovauenvironmental-monitoringcoastal-conditionswaves updated 30 September 2015 accessed December 2015
Umar MJMLJ amp Price IR 1998 Effects of sediment deposition on the seaweed Sargassum on a fringing coral reef Coral Reefs 17 169-177
Underwood AJ amp Kennelly SJ 1990 Ecology of marine algae on rocky shores and subtidal reefs in temperate Australia Hydrobiologia 192 3-20
Walker S Schlacher T amp Schlacher-Hoenlinger M 2007 Spatial heterogeneity of epibenthos on artificial reefs fouling communities in the early stages of colonization on an East Australian shipwreck Marine Ecology 28 435-445
Walker SJ Degnan BM Hooper JNA amp Skilleter GA 2008 Will increased storm intensity from climate change affect biodiversity in non-scleractinian sessile fauna on coral reefs Global Change Biology 14 2755-2770
Warwick RM amp Clarke KR 1993 Increased variability as a symptom of stress in marine communtities Journal of Experimental Marine Biology and Ecology 172 215-216
Thenumberofsitessurveyedhasvariedover timeasaresultof the fluctuating levelof sandcoveringKirraReef
Prior to May 2003 three sites were assessed along the eastern and northern edge of KirraReef(KirraReefOutersites1to3)andthreesiteswereexaminedalongtheinshore marginof the reef (KirraReef Inner sites1 to 3)(MapA1) ReefRedge (ieKirraOuter) siteswerechosentoprovideearlywarningofimpactsfromoffshoreplacementofdredged sandwhilst inshoresites(ieKirraInner)werechosentoindicatewhetherimpactsfrom inshore beach profile development were affecting the reef platform In May 2003 the threeeasternsitesatKirraReef (ieKRO1KRO2andKRI1)werecompletelycovered with bare mobile sand Consequently only the three western sites at Kirra Reef (ie KRO3KRI2andKRI3)supportedbenthicfloraandfaunaInMarch2004theextentof the remainingwesternoutcropof KirraReef had been further reduced so that all inner reefsiteswerecompletelycoveredwithmobilesandConsequentlyonlyasingleoriginal reefsite(ieKRO3)couldbesurveyed(Figure23)Thereforetoprovideanindicationof the condition of the remaining reef two new sites were established (ie KRN1 and KRN2)(Figure23)andsurveyedinMarch2004Theextentofthewesternreefhadbeen further reduced by February 2005 and a third new site (ie KRN3) was established (Figure23)Consequentlyfoursites(KRO3KRN1KRN2andKRN3)weresurveyedin February2005
InFebruary2010fourKirraReefsites(ieKRO3KRO1KRN1andKRN2)wereclearof thesurroundingsandandsupportedbenthic floraand fauna Inaddition several rocks protruded from the sand in the vicinity of site KRI2H these were assessed to provide a quantitativeindicationofbroadRscaletemporalchangestotheinshorereefcommunities
SOURCEScopy Copyright Commonwealth of Australia (Geoscience Australia) 2001 2004 2006copy The State of Queensland (Department of Natural Resources and Mines) 2015copy Nearmap 2014 2015
DATE2015-09-09
DRAWN BYCF
VERSION02
PROJECTIONCoordinate System GDA 1994 MGA Zone 56Projection Transverse MercatorDatum GDA 1994
plusmn SCALE
0 50 100
Metres
Scale 12500 A3
frc environmental
Appendix$B$ Introduction$to$Data$Analysis$Used$
Multivariate$Analyses$
Multivariate statistical techniques are widely used in ecology to assess the similarities relationshipsbetweenassemblagesWhereasunivariateanalysescanonlycompareone variable at a time (eg an index of community structure such as a diversity index or a singleindicatorspecies)multivariateanalysescancomparesamplesbasedontheextent thatassemblagesshareparticulartaxaandabundances(ClarkeampWarwick2001)
Thefirststepofmultivariateanalysisusuallyinvolvesthecreationofamatrixofsimilarity coefficients computed between every pair of samples The coefficient is usually a measureofhowclose theabundance is foreachspecies (definedso that100= total similarity and 0=complete dissimilarity) The Bray Curtis similarity measure is commonlythemostappropriateforbiologicaldata(ClarkeampWarwick2001)
MultidimensionalScaling
NonRmetricmultiRdimensionalscalingordinations(nMDS)attempttoplacesamplesintwo dimensionalspacesothattherankorderofthedistancesbetweensamplesmatchesthe rankorderofthematchingsimilaritiesfromthesimilaritymatrix(ClarkeampWarwick2001) Thisprovidesavisualrepresentationofthesimilaritiesbetweenassemblageswithineach sampleEachoftheaxesisnotrelatedtoanyparticularvalueHinfactaxescanberotated toprovide thebestvisual representationof thedata Ordinationsareparticularlyuseful tools for analysing and visually presenting differences between assemblages Ordinationsareessentiallymapsofsamples inwhich theplacementofsampleson the mapreflectsthesimilarlyofthecommunitytothecommunitiesinothersamples(Clarkeamp Warwick 2001) Distances between samples on an ordination attempt to match the similarities inassemblagestructurenearbypoints representassemblageswithvery few attributes(speciesorabundanceofspecies)Hpoints faraparthavevery fewattributes in common(ClarkeampWarwick2001)
A stress coefficient is calculated to reflect the extent to which the multiRdimensional scalingordinationandthesimilaritymatrixagree(ClarkeampWarwick2001)(iehowwell the multiRdimensional scaling ordination accurately reflects the relationship between samples)Stressvaluesoflt015aregenerallyacceptable
In Figure A1 each freshwater macroinvertebrate sample is represented on the multiRdimensionalscalingordination By lookingat thedistancesbetweeneachsample
ANOSIMisanalogoustoANOVAinunivariatestatistics(Smith2003)AglobalRstatistic iscalculatedtodeterminewhetherthereisasignificantdifferencebetweenallsamplesIf there are differences then pairwise comparisons are conducted to test for differences betweenpairsofsamples(analogoustopostRhoctestsinANOVA)
The R value lies between R1 and +1 (all similarities within groups are less than any similarity between groups) with a value of zero representing the null hypothesis (no differenceamongasetofsamples)(ClarkeampWarwick2001)ComparisonofpairwiseR values can give an indication of how different assemblages are R values close to 0 indicatelittledifferencevaluesaround05indicatesomeoverlapandvaluescloseto1to indicate many or substantial differences In many instances however researches are primarily interestedinwhethertheRvalueisstatisticallydifferentfromzero(usuallyata confidence level of 005) (Clarke amp Warwick 2001) (ie whether they can reject the null hypothesis)
ANOSIM can provide information on whether the (visual) differences between assemblages in the multiRdimensional scaling ordination are significantH it is an independenttestfromthemultiRdimensionalscalingordinationItisbasedontestingthe
TRESBPKirraReefMarineBiotaMonitoring2015 B2
frc environmental
differences between the rank similarities in the similarity matrix not on the distances betweensamplesinthemultiRdimensionalscalingordination(ClarkeampWarwick2001)
PermutationalMultivariateAnalysisofVariance
PERMANOVAisusedtotestsimultaneousresponsesofoneormorevariablestooneor more factors in an a0 priori0 structured design using random permutation of the data to assess significance (Anderson 2004) PERMANOVA generates a pseudo FRstatistic similar to traditional ANOVA but pRvalues are calculated with permutations which does notassumenormaldatadistribution PERMANOVAcanprovide informationonwhether the (visual) differences between assemblages in a multiRdimensional scaling ordination are significantH however it is an independent test from the multiRdimensional scaling ordination
Thelevelofmultivariatedispersionamongsampleswithineachofthetestgroupscanbe examined using the permutational analysis of multivariate dispersions (PERMDISP) routine(Anderson2004)Intraditionalimpactassessmentachangeinthedispersionof datacanalsoindicateanimpact
SimilarityPercentagendashSpeciesContributions
SIMPER analysis provides information on how dissimilar assemblages from various groups are (eg how similar all of the macroinvertebrate samples taken for a particular habitatwithinastreamreachare)andhowsimilareachgroup(egreach)istoanyother group SIMPER analysis also identifies the species taxa that are contributing to the dissimilarity between two assemblages in rank order (ie it identifies which species is contributingthemosttothedifferences)SIMPERanalysismayhelptoidentifypotential lsquoindicatorrsquospeciesForexampleifaparticularspeciesconsistentlycontributesgreatlyto the differences between impacted and unimpacted assemblages it may be a useful indicator Theabundanceofthis indicatorspeciescanthenbecomparedbetweensites usingunivariatetechniquessuchasANOVA
Data is available on request from tresbpprojectofficecrownlandnswgov
TRESBPKirraReefMarineBiotaMonitoring2015 C1
frc environmental
Appendix(D( Pairwise( PERMANOVA( Results
Data is available on request from tresbpprojectofficecrownlandnswgov
TRESBPKirraReefMarineBiotaMonitoring2015 D1
frc environmental
Appendix(E( Relative(Abundance(of(Fish(found(at(Kirra(( ( and(Palm(Beach(Reefs(in(Each(Survey((Data is available on request from tresbpprojectofficecrownlandnswgovau
TRESBPKirraReefMarineBiotaMonitoring2015 E1
Structure Bookmarks
0 50 100 Metres Scale 12500 A3
0 50 100 200 Metres Scale 15000 A3
Kirra Reef
Kirra Reef
Kirra Reef
Kirra Reef
Kirra Reef
Kirra Reef
Map A1Location of Kirra Reef monitoring sites
Table D8 Pairwise comparison of macroalgae cover between sites in each year
Table D15 Pairwise comparison of turf algae cover between sites in each year
Table D29 Pairwise comparison of ascidian cover between sites in each year
Table D43 Pairwise comparison of soft coral cover between sites in each year
frc environmental
Table11 ApproximateexposedextentofKirraReef
Area(m2) Date SourceofImage
NorthernSection SouthernSection EasternSection Total
The southeast Queensland (SEQ) region comprises five subregions the Gold Coast Inner Moreton Bay Outer Moreton Bay Sunshine Coast and Fraser Coast Coral communities within SEQ are diverse with an extensive range of coral growth forms (Harrison et al 1998) The greatest diversity of coral species are typically found at offshoresites likeFlindersReefswhere119differentcoralspecieshavebeen recorded (Harrisonetal1998)
Subtidal rocky reefs of the Gold Coast region comprise remnants of highly eroded volcanic substratum isolated by wide variable expanses of soft sediment (Edwards amp Smith 2005) They support community assemblages that are indicative of a transition between the tropical waters of the Great Barrier Reef and the temperate waters characteristicofthemidNewSouthWalescoast(Done1982XCannonetal1987)
GoldCoastreefcommunitiesarebroadlysimilartoareasofcomparabletopographytothe north(InnerGneeringsoffshorefromMooloolabaandoffshoreofMoretonBay)andtothe south (Julian Rocks offshore of Byron Bay) that are dominated by macroalgae and sessile invertbrates(FisheriesResearchConsultants1991XHarriottetal1999XEdwards amp Smith 2005X Baronio amp Butcher 2008X Fellegara 2008X SchlacherHoenlinger et al 2009)ManyoftheGoldCoastsreefslocatedclosetoshoreareoftenaffectedbyhuman activities (Noriega 2007)and typicallyhave lesscoralcover Ina2013surveyofSEQ reefsGoldCoastreefshadthelowesthardcoralcoverat9(Hutchinsonetal2013)
Fish of the Gold Coast region are similar in community composition to that recorded offshore of Moreton Bay at Julian Rocks and the Solitary Islands offshore of Coffs Harbourandtoa lesserextentat theexHMASBrisbanenearMooloolaba(Robinsonamp Pollard 1982X Parker 1995X Parker 1999X Edwards amp Smith 2005X Malcolm et al 2009X SchlacherHoenlingeretal2009) The smaller inshore reefsof theGoldCoast region suchasKirraReeftypicallysupportalowerabundanceanddiversityoffishes(Edwards ampSmith2005Xfrcenvironmental2005)
Kirra$Reef$
ThebenthicassemblagesofKirraReefarecharacterisedbyahighcoverofmacroalgae andturfalgaeandamoderatecoverofsessilebenthicinvertebratesincludingafewhard corals(EdwardsampSmith2005Xfrcenvironmental2005)Turfalagecoversthemajorityof the reef substrate Crinoids (feather stars) ascidians (sea squirts) and sponges are typically themostabundantbenthic faunawhilstanemonessoftcoralsandurchinsare present in low numbers (frc environmental 2014) The composition of benthic assemblagesatKirraReef isbroadlysimilar to thatdescribed fromadjacent rockyreefs
Exposuretowaveactionsandscouringandsmotheringareimportantfactorsinfluencing the distribution and abundance of sessile species on rocky reefs (Kay amp Keough 1981X McGuinness1987)ChangeintheheightofsandaroundthebaseofKirraReefappears to be a major factor influencing the abundance (cover) of benthic flora and fauna periodically resulting in a bare stratum on rocks within 08 to 1m of the seafloor Outcropsontheeasternsectionof thereefcomplexwherewaveactionand likelysand abrasion are greatest have historically supported a lower abundance of benthic fauna than outcrops on the northern section (Fisheries Research Consultants 1995a)X (Fisheries Research Consultants 1995b)X (Fisheries Research Consultants 1996)X (frc environmental 2003)X (frc environmental 2004)X (frc environmental 2005)X (frc environmental2010)
Strong wave action results in sustained abrasion of the dominant brown macroalgae (Sargassum(flavicans(andEcklonia( radiata)causing the fronds tobreak Thecontinual resuspensionofalgal fragments(commonlyreferredtoas lsquocornflakesrsquo)candramatically reducewaterclarityandvisibility Algal fragmentswere largelyabsent inJuly2012and April2014surveyslikelyduetolongperiodsofrelativelybenignseaconditionsInMarch 2015amoderateamountofalgalfragmentswasobservedlikelyduetostormactivityin theweeksproceedingthesurvey(egmoderateseas11to14Februaryandminorstorm over1922February)
RecentsurveysatPalmBeachReefcompletedbyReefCheckrecordedadeclineinhard coralcover from2008to2013(Hutchinsonetal2013) Sessile invertebrates including spongescoralsandascidianstypicallydominatethebenthicassemblageofPalmBeach Reef(EdwardsampSmith2005X frcenvironmental2005XReefCheck2010) Thecoverof sessileinvertebrateshashistoricallybeensimilartothatrecordedfromtheoutersections of Kirra Reef However the cover of macroalgae has consistently been loweron Palm BeachReefthanonKirraReefTheproximityofPalmBeachReeftotwocreekmouths andtheabsenceofstrongcurrentsintheareatypicallyresultsinahighlevelofturbidity Elevated turbidity together with greater water depth and a high abundance of grazing
TRESBPKirraReefMarineBiotaMonitoring2015 10
frc environmental
speciessuchasurchinsislikelytocontributetoarelativelylowcoverofmacroalgaeand abundant suspension feeding organisms such as ascidians sponges hydrozoans and crinoidsatPalmBeachReef(Smithetal2005)
PalmBeachhasa lowerabundanceanddiversityof benthicdemersaland pelagic fish comparedtoKirraReef(Smithetal2005)ThegreaterdensityoffishatKirraReefmay beaconsequenceof the lossof reef forcingmore fish intoasmallerarea (Smithetal 2005)PalmbeachrecordedaslightlylowerdiversityoffishthanKirraReefin2012and 2014surveys(frcenvironmental2012Xfrcenvironmental2014)
TRESBPKirraReefMarineBiotaMonitoring2015 11
frc environmental
2$ Methods$
The methods used in the March 2015 survey were developed for the Stage I survey completed in April and June 1995 and used for subsequent surveys February 1996 January 2001 May 2003 March 2004 February 2005 February 2010 July 2012 and April2014 Datawere collected from KirraReef (2816251535309) andPalmBeach Reef(2810751534774)locatedapproximately9kmnorth(Figure21)
Themainobjectiveof the monitoring was to investigateanychange in the marinebiota and habitat of Kirra Reef compared to Palm Beach Reef (comparative reef) in order to assesstheeffectofthesandbypassproject(andsubsequentincreasesinsandload)on theecologyofKirraReef
0 2 41
Kilometres
Service Layer Credits Sources Esri HERE DeLorme Intermap increment P Corp GEBCO USGS FAO NPS NRCAN GeoBase IGN Kadaster NL Ordnance
0 2 41
Kilometres
Service Layer Credits Sources Esri HERE DeLorme Intermap increment P Corp GEBCO USGS FAO NPS NRCAN GeoBase IGN Kadaster NL Ordnance
Threesites(KRN1KRN2KRO3)atKirraReef(waterdepth5to8m)weresurveyedin March 2015 (Map 1) The remainder of the sites previously surveyed were covered by sand(refertoappendixAforahistoryofsitespreviouslysurveyed)Threecomparative sites (PB1 PB2 and PB3) were also surveyed at Palm Beach Reef (water depth 12 to 17m)(Map2)
TRESBPKirraReefMarineBiotaMonitoring2015 12
orth NetreStkicrraG
Marine Parade
t eertS ickr
M rarin ae Pa Grade
Musgrave St
t
re ee e Powel t r lt CrescenS t t es eel ri tM S
t ee ge drt u tleS d Rro MuL sgrave Street
LEGEND 0 1 Km Tweed River E ntrance Sand Bypassing Project Survey Site Road Network
copy Copyright Commonwealth of Australia (Geoscience Australia) 2001 2004 2006copy The State of Queensland (Department of Natural Resources and Mines) 2015copy Nearmap 2014
DATE2015-03-24
DRAWN BYCF
VERSION01
PROJECTIONCoordinate System GDA 1994 MGA Zone 56Projection Transverse MercatorDatum GDA 1994
plusmn SCALE
0 50 100 200
Metres
Scale 15000 A3
Gold Coast Highway
i
PalmBeach
Tugun
Coolangatta
0 1 Km
frc environmental
22$ Benthic$Flora$and$Macroinvertebrates$
At each site benthic assemblages were surveyed in fifteen 025m2 quadrats with the percentcoverofbenthicmacroalgaeturfalgaespongesascidianshardcoralsandsoft coralsassessedvisually(Figure22)Quadratswereplacedhaphazardlywhichincluded horizontal and sloping surfaces The minimum distance between quadrats was approximately2m Thenumberof largeascidians (Pyurastolonifera)crinoids (feather stars)barnaclesurchinstubewormspolychaeteshydroidszoanthidsandcowriesand the dominant species of macroalgae were also recorded and quantitative notes were madeontheapparenthealthofeachtaxonomicgroup
ThespeciesrichnessandrelativeabundanceoffishatKirraReefandPalmBeachReef were assessed using a combination of underwater visual census (UVC) and video surveys The combination of these techniques represents the most costeffective and efficientmeansofobtainingdataonthestructureoffishassemblagesindifferenthabitats (Murphy amp Jenkins 2010) A baited remote underwater video (BRUVX baited with pilchards) and footage captured by a diver swimming hapazard trasects over the reef wererecorded
Video footage from each BRUV (approximately 20minutes) and video transects (approximately 35 minutes) was reviewed by an ecologist experienced in marine fish identification
24$ Data$Analysis$
Permutational multivariate analysis of variance (PERMANOVA) was used to determine differences in the composition (cover of benthic fauna and taxonomic group) of benthic assemblagesbetweenKirraReefandPalmBeachReefover time PERMANOVAuses permutational methods (PsuedoAF) to derive statistical significance which require fewer assumptionstobemetthananalogousmethodssuchasmultivariateanalysisofvariance (MANOVA) (Anderson 2001X Anderson et al 2008) This analysis enables an examinationofchangesinthecommunityasawhole
A three factor PERMANOVA was used to examine differences in the composition of benthic assemblages with survey (fixed factor) locations (Palm Beach Reef and Kirra Reeffixedfactor)andsites(nestedinlocationsasarandomfactor)asthefactorsData weresquareroot transformedtodownweightdominatingspeciesabundanceXconverted toaBrayCurtisdistancematrixXandtestedforsignificanceusingasmanypermutations as allowed (9800 to 9937 unique permuations achieved for all factors and factor combinationsXexceptlocationwhere10uniquepermutationswereachieved))Posthoc pairwisetestwasusedtodeterminethemagnitudeofdifference
Nonmetricmultidimensionalscaling (nMDS)ordinationswereused tovisually represent the variation in the composition of assemblages between reefs separately for each survey nMDS ordinations were also used to visually represent the variation in the compositionofassemblagessurveysatKirraReefforallsurveysXbaselinesurveyinApril 1995andMarch2015XandApril2014andMarch2015
Separate univariate PERMANOVAs were used to compare differences in the cover of macroalgae turf algae and the abundance of crinoids and ascidians Data were
TRESBPKirraReefMarineBiotaMonitoring2015 16
frc environmental
converted to a eucildean distances matrixX and tested for significance using as many permutations as allowed (998 to 999 unique permuations achieved for all factors and factor combinationsX except location where 10 unique permutations were achieved) Factors were survey (fixed factor) locations (Palm Beach Reef and Kirra Reef fixed factor)andsites (nested in locationsanda random factor) Posthoc pairwise testwas used to determine the magnitude of difference Monte Carlo procedures were used to calculateempiricalPvaluesforthesurveyxlocationtest
Further information on the use and interpretation of PERMANOVA and other analyses usedinthisreportisprovidedinAppendixB
TRESBPKirraReefMarineBiotaMonitoring2015 17
frc environmental
3$ Results$
31$ Cover$of$Benthic$Assemblages$
The composition of benthic fauna and flora ( cover and type combined Appendix C) variedbetweenmostsitesatbothKirraReefandPalmBeachReefandbetweennearly allsurveysateachsite(notethesignificantinteractionofsite(location)xsurveyinTable 31X Appendix D) Nevertheless there appeared to be substantial differences in the compositionofthebenthicassemblagesbetweenthetworeefsineachsurveyfrom1995 to2015(Figure31toFigure33)
In2015 therewassomeoverlap in thecompositionofassemblagesonKirraandPalm Beach Reefs (Figure 33) However there was also some clear patterns of difference including
Benthic assemblages at Kirra Reef appeared to show some overlap between surveys (Figure34H) HowevernearlyallsurveysweredifferentateachsiteatbothKirraReef andPalmBeachReef(AppendixD)BenthicassemblagesinMarch2015andApril2014 wereverysimilarcomparedtobenthicassemblages inthebaselinesurvey inApril1995 andMarch2015(notethegreateroverlapinFigure35comparedtoFigure36)
In March 2015 as in previous surveys the macroalgae Sargassum sp dominated the benthic assemblages at all sites at Kirra Reef (Figure 37) Other species present included
sdot Dictyopteris0arostichoides0
sdot Dilophus0intermedius00
sdot Zonariasp
sdot Laurencia0brongniartic0
sdot Amphiroa0anceps0
sdot Caulerpa0lentilliferaand
sdot Halimeda0discoideaand
sdot Macrocystissp
Juvenile kelp (from the genus Macrocystis) was also emerging on some areas of Kirra Reef
ThecoverofmacroalagevariedbetweensitesandsurveysatbothKirraReefandPalm Beach Reef with the magnitude of difference varying over time (note the significant interaction between site (location) x survey in Table 32) Macroalgae cover varied between surveys with 2001 being the most different to the other years (Appendix D) ThereweredifferencesbetweensitesatKirraReefinJune1995February1996January 2001 May 2003 February 2005 and February 2010 and between sites at Palm Beach ReefinJanuary2001andFebruary2010Inrecentsurveys(2012to2015)thecoverof macroalgaeatsitesatbothKirraReefandPalmBeachReefwassimilar (AppendixD) indicatingarelativelyconsistentdistributionacrossbothreefs
ThemeancoverofmacroalgaeatKirraReefhasdeclinedsinceitspeakin2001withthe greatest magnitude of decline recorded between January 2001 and May 2003 (Figure 38)InsurveysbetweenJune1995andMay2003Sargassumspformeddensecarpets overtherockysubstratecoveringupto58oftheavailablesurfaceareaofthereefIn February 2010 macroalgal cover was 12 Macroalgal cover has increased to 26 in March2015ThisissimilartothecoverrecordedinApril1995(23cover)(Figure38)
In2015nomacroalgaewasrecordedwithinthequadratsatPalmBeachReefThecover of macroalgae on Palm Beach Reef has been consistently lower than Kirra Reef since
TRESBPKirraReefMarineBiotaMonitoring2015 26
frc environmental
ecologicalmonitoringbegan typically lessthan5of theavailablesurfacearea(Figure 38)
The mean cover of turf algae varied between sites and surveys at both Kirra Reef and PalmBeachReef(notethesignificantinteractionbetweensite(location)xsurveyinTable 33)SpecificallythereweresignificantdifferencesbetweensitesatbothKirraReefand PalmBeachReefinJune1995January2001February2010July2012andApril2014 (aswellasbetweensitesinFebruary1996atKirraReef)Thecoverofturfalgaevaried betweenmostsurveysatallsitesateachreef(AppendixD)BothKirraandPalmBeach reefs showed major increases in the percent cover of turf algae from 2010 to 2012 followedbyadecreaseincoverbetween2012and2014(Figure310)Thecoverofturf algae is typically lower at Kirra Reef than at Palm Beach Reef (July 2012 being an exception) and was again slightly lower at Kirra Reef in March 2015 (Table 310) In March2015turfalgaewasmoreprevalentatKirraReefthanduringthebaselinesurvey ofApril1995
ThemeancoverofspongesatsomesitesatbothKirraReefandPalmBeachReefhas varied significantly during some surveys (note the significant interaction between site (location)xsurvey inTable34HFigure311) However thecoverofspongestendedto bemore temporallyvariable atKirraReef than at Palm Beach Reef (Figure312) The cover of sponges at Kirra Reef varied between sites in February 1996 January 2001 March2004July2012andApril2014 However thecoverofspongesatPalmBeach Reefonlyvariedbetweensites inJanuary2001andFebruary2010 (AppendixD) The cover of sponges varied between survey at each site with 1995 1996 and 2001 most differenttootheryears(AppendixD)
ThemeancoverofspongesatKirraReefdeclinedbetweenMarch2004(20cover)and February 2010 (less than 1 cover) Since 2010 the cover of sponges has increased slightly with sponges covering 8 of the reef in March 2015 (Figure 312) In March 2015thecoverofspongeswashigherthanrecordedduringthebaselinesurveyinApril 1995(3cover)(Figure312)
Figure312 Mean cover of sponges (plusmnSE) at Kirra Reef and Palm Beach Reef on all
surveys
Table34 Univariate PERMANOVA results for differences in the cover of sponges betweensurveysandlocations
Factor$ df$ MS$effect$ PseudoF$ p$(perm)$
survey 10 18576 276 0018
location 1 39671 589 0210
site(location) 4 67354 477 0001
locationxsurvey 10 1490 221 0032
site(location)xsurvey 40 67331 477 0001
error 924 14108
Shadingdenotessignificanceatplt005
TRESBPKirraReefMarineBiotaMonitoring2015 32
frc environmental
Ascidians$
ThemeanabundanceofallascidiansotherthanPyura0stoloniferahasvariedsignifcantly between sites at Kirra Reef and Palm Beach Reef and between surveys at each site (Figure314andnotethesignificantinteractionbetweensite(location)xsurveyinTable 35) The abundance of ascidians was different between sites at Kirra Reef in January 2001May2003March2004February2005andApril2014HanddifferentatPalmBeach ReefinJanuary2001February2005February2010andMarch2015Theabundance ofascidiansvariedbetweensurveysateachsitewith1995beingmostdifferentwhenthe abundanceofascidianswaslow(AppendixD)InMarch2015theabundanceofallother ascidiansonKirraReefandPalmBeachReefwashigherthanpreviouslyreportedinthe baselinesurveyinApril1995(whennoascidianswererecorded)Themeanabundance washigheratKirraReefthanatPalmBeachReef(Figure314)
ThemeanabundanceofPyura0stoloniferahasvariedconsiderablybetweensitesatKirra Reef and Palm Beach Reef over time (note the significant interaction between site (location) x survey in Table 36) In March 2015 the mean abundance (individual per 025m2plusmnSE)of theascidianPstolonifera (Figure313)wassimilaratKirraReefand PalmBeachReef(Figure315)ThemeanabundanceofP0stoloniferahasrangedfrom 02to17individualsper025m2atbothreefssinceMay2003
Figure315 Mean abundance of ascidians (Pyura0 stolonifera) (individuals025m2)
(plusmnSE)atKirraReefandPalmBeachReefinallsurveys
TRESBPKirraReefMarineBiotaMonitoring2015 34
frc environmental
Table35 Univariate PERMANOVA results for the differences in cover of all ascidians otherthanPyura0stolonifera0betweensurveysandlocations
Factor$ df$ MS$effect$ PseudoF$ p$(perm)$
survey 10 26658 474 0001
location 1 13603 710 0104
site(location) 4 19154 149 0212
locationxsurvey 10 2629 468 0001
site(location)xsurvey 40 5621 438 0001
error 924 12828
Shadingdenotessignificanceatplt005
Table36 Univariate PERMANOVA results for the differences in Pyura0 stolonifera densitybetweensurveysandlocations
Factor$ df$ MS$effect$ PseudoF$ p$(perm)$
survey 10 16254 11842 0001
location 1 12445 60881 0206
site(location) 4 20442 56799 0001
locationxsurvey 10 79724 58082 0001
site (location) x 40 13726 38138 0001 survey
error 924 35991
Shadingdenotessignificanceatplt005
$
TRESBPKirraReefMarineBiotaMonitoring2015 35
frc environmental
Hard$Coral$
There was a significant difference between the cover of hard corals at Kirra Reef and PalmBeachReefduringsomesurveys(notethesignificantinteractionbetweenlocationx surveyinTable37)SpecificallytherewassignificantlymorehardcoralatPalmBeach Reef thanKirraReef inFebraury1996March2004April2014andMarch2015(Table 38)
ThecoverofhardcoralistypicallylowonKirraReefaccountingforlessthan2ofthe availablesubstrateInMarch2015hardcoralcoveredlessthan1oftheareaofKirra Reef which was less than the cover recorded during the baseline survey in April 1995 (Figure 316) In contrast hard coral covered 11 of the surface area at Palm Beach ReefwhichwasgreaterthanthecoverrecordedinApril1995(Figure316)
The cover of hard corals at Palm Beach Reef has been more variable over time comparedtothecoverofhardcoralatKirraReef(Figure316)Withtheexceptionofthe surveys inApril1995andJanuary2001when thecoverofhardcoralwas lowonboth reefshardcoralsaretypicallymoreprevalentatPalmBeachReef(Figure316)
Table38 PERMANOVA post hoc pairwise results for the differences in the cover of hardcoralbetweenlocationsineachsurveyevent
Hard$Corals$ Survey$
t$ p$(MC)$a$
Apr1995 054 0606
Jun1995 182 0140
Feb1996 541 0006
Jan2001 R R
May2003 166 0168
Mar2004 765 0001
Feb2005 049 0646
Feb2010 156 0197
Jul2012 283 0053
Apr2014 525 0011
Mar2015 695 0003 Shadingdenotessignificanceatplt005 a pvaluesbasedonMonteCarlotests
TRESBPKirraReefMarineBiotaMonitoring2015 37
60
50
40
30
20
10
0
Soft
Cor
al C
over
()
Kirra Reef Palm Beach Reef
frc environmental
Soft$Coral$
The cover of soft coral was significantly different between sites at both Kirra Reef and PalmBeachReefandduringsomesurveys(notethesignificant interactionbetweensite (location)xsurvey)TherewasnosoftcoralrecordedatKirraReefinMarch2015The coverofsoftcoralhasdeclinedatKirraReefsince2003andhascoveredlessthan2of theavailablesubstratesince2005whichissimilartothecoverofsoftcoraldescribedfor the baseline surveys in 1995 (Figure 317) The cover of soft coral was consistent betweensitesineachsurveyexceptbetweensitesin
sdot April1995atKirraReef
sdot 1996atKirraReef
sdot 2003atPalmBeachReefand
sdot 2014atPalmBeachReef(AppendixD)
Soft corals have historically covered more of the available space on Palm Beach Reef than on Kirra Reef However there was more temporal variability within sites at Palm BeachReefthanatKirraReef(AppendixD)ThecoverofsoftcoralatPalmBeachReef has varied over time and was highest in April 1995 (48 cover) Despite increasing sinceFebruary2005itisstilllowerthanthecoverrecordedduringthebaselinesurveyin April1995(Figure317)
Table39 UnivariatePERMANOVAresults for thedifferences in thecoverofsoft coral betweensurveysandlocations
Factor$ df$ MS$effect$ PseudoF$ p$(perm)$
survey 10 44657 1323 0001
location 1 32922 6620 0117
site(location) 4 49732 266 0036
locationxsurvey 10 40982 1214 0001
site (location) x 40 3376 181 0002 survey
error 924 18688
Shadingdenotessignificanceatplt005
$
TRESBPKirraReefMarineBiotaMonitoring2015 39
frc environmental
Crinoids$
ThereisasignificantdifferencebetweensomesitesatbothKirraReefandParmBeach Reef that varies through time (note the significant interaction between site (location) x survey inTable310) Theabundanceofcrinoidshasbeensimilarbetweensites inall years at Palm Beach ReefH and was different beween sites at Kirra Reef in June 1995 February1996May2003andFebruary2005(AppendixD)Withineachsitetherehas been some natural temporal variability particualrly at Palm Beach Reef sites in 2001 (Appendix D) The mean abundance (individuals 025m2) of crinoids (Figure 318) at KirraReefandPalmBeachReefhasgenerallybeenlessthan2individualsper025m2 andhasdeclinedatboth locationssincethebaselinesurvey inApril1995(Figure319) However the mean abundance of crinoids on Kirra Reef has shown a slight increase sinceFebruary2010(Figure319)
In March 2015 fewer crinoids were recorded at Palm Beach Reef than at Kirra ReefH crinoidshavebeenrareatPalmBeachReefsince2003
The species richness of fish recorded from Kirra Reef across all monitoring events has rangedfrom14to57 InMarch201557specieswereidentifiedat thereefwhichwas similar to April 2014 (53) and higher than previous surveys (Figure 320) Species richnessatPalmBeachReefwas lower(34species)andgenerallyvaried lessbetween surveyscomparedtoKirraReef
InMarch2015 the assemblage of fish at KirraReef comprised species fromall trophic levelsincludingdetritivoresplanktivoresherbivoresandcarnivores(AppendixE)Asin previous surveys the assemblage was dominated by herbivores and planktivores Yellowtail (Trachurus0 novaezelandiae) and striped sea pike (Sphyraena0 obtusata) were the dominant species present in large schools (Figure 321) Australian mado (Atypichthys0 strigatus) ringRtailed surgeon (Acanthurus0 blochii) silver trevally (Pseudocaranx0 georgianus) eastern pomfred (Schuettea0 scalaripinnis) sweep (Scorpis0 lineolatus) and various wrasses were also very abundant releative to other species (AppendixE)
Two new species were observed at Kirra Reef the orangeRband surgeon (Acanthurus0 olivaceus) and the unicornfish (Naso0 sp) Five new species were recorded at Palm BeachReef
No threatened or protected fish species listed under the Queenslandrsquos Nature0 Conservation0Act01992ornationallyundertheEnvironmental0Protection0and0Biodiversity0 Conservation0 Act0 1999 were observed The complete list of species recorded and the relativeabundanceispresentedinAppendixE
TRESBPKirraReefMarineBiotaMonitoring2015 42
60
0
10
20
30
40
50
Num
ber
of F
ish
Spe
cies
Apr-95
Jun-95
Feb-96
Jan-01
May-03
Mar-04
Feb-05
Feb-10
Jul-12
Apr-14
Mar-15
Kirra Reef Palm Beach Reef Location
frc environmental
Figure320 Number of fish species recorded at Kirra Reef and Palm Beach Reef on
ThegreatestchangetotheecologicalconditionofKirraReefsincethebaselinesurveyin 1995 has been the loss of large areas of hard substrate that support benthic flora and faunaThedeliveryoflargesandvolumesduringthestage1dredgingoperations(1995 to1998)andtheinitialoperationofthesandbypasssystem(2001to2008)resultedinan increaseinwaveactionandtidalcurrentsredistributingthissandoverKirraReef
The three major outcrops of Kirra Reef (northern southern and eastern sections) are naturally exposed and covered depending on water and sand movements In March 2015 the rocky outcrops in the northern section of Kirra Reef were exposed and supportedamoderatelydiversebenthicassemblagedominatedbyturfalgaeTherewas arelativelyhighfishdiversityatKirraReefTheecologicalassemblageexhibitedsignsof ongoingstressfromphysicaldisturbanceincludingtheabsenceofsoftcoralsandrarityof hardcoral(MumbyampSteneck2008)HoweverKirraReefhasarelativelyhighcoverof sponges and ascidians Sponges ascidians and crinoids were more abundant at Kirra ReefthanatPalmBeachReefinMarch2015
KirraReefcontinues toprovidehabitatandsupport importantecological functions in the region providing hard substrate for the colonisation of algae and benthic invertebrates and food and refuge for fish As sand levels have stabilised since 2008 assemblages have becomemoresimilar to those recordedprior to implementationof the TRESBP in April1995 Forexamplemacroalgalcover inApril1995andMarch2015wasrelatively similarHoweverassemblagecompositionisstillsignificantlydifferenttothatrecordedin thebaselinesurveysmostnoticeablyduetoa lowercoverofbaresubstrateandhigher coverofturfalgaeandascidianssincesurveyshavebeenperformed
Benthic$Macroalgae$
The cover of macroalgae at Kirra Reef was relatively similar during the 2014 and 2015 surveys and remained well below the peak of nearly 60 cover recorded in January 2001TherewasasteepdeclineinthecoverofmacroalgaebetweenJanuary2001and May2003whichappearedtobestronglyassociatedwith thedecline inreefareaduring that time as well as a decline in the cover of Sargassum sp (an important indicator speciesonKirraReef) SimilardeclineswereevidentatPalmBeachReefbetween the January2001andMay2003surveys
TRESBPKirraReefMarineBiotaMonitoring2015 45
frc environmental
The cover ofmacroalgae at Palm Beach Reef was much lower thanat Kirra Reef over time There are several possible reasons for the lower cover of macroalgae at Palm Beach
sdot PalmBeachReefisdeeperthanKirraReefandgenerallyhashigherturbidityand therefore greater light attenuation The quantity and quality of available light affectsthedistributionandgrowthofmacroalgae(MillerampEtter2008)
sdot Differences in the pattern of recruitment of algal species to the reefs due to differentwatercurrentsandtimingofthesurveys(Kennelly1987b)
sdot Increased competition with turf algae and sessile benthic invertebrates which competeforspacewithmacroalgae(Kennelly1987aHMillerampEtter2008)
sdot PresenceofdifferentspeciesandhigherdensityofherbivoresatPalmBeachReef (particularly sea urchins and herbivorous fish) which graze on macroalgae (McCook1997HJompaampMcCook2002)
Biological assemblages exposed to physical stress typically exhibit greater levels of temporalandspatialvariability(WarwickampClarke1993HChapmanetal1995)Temporal variationinthecoverofmacroalgaeatKirraReefislikelytobeprincipallyduetotheeffect ofphysicaldisturbance fromwaveactionaswellas theassociatedassociatedabrasion andsmotheringbysandTheeffectsofthesephysicaldisturbanceswouldincreasewith thereductionofKirraReefasedgeeffectsarepronouncedandwaterdepth isreduced Increasedsmotheringbysandcanalsoreducediversity(Hatcheretal1989)abundance recruitment growth survival and seasonal regeneration of macroalgae (Umar amp Price 1998HCheshireetal1999)
Changes in the cover of macroalgae on Kirra Reef over time are also likely due to the extentofthereefchangingHthefishandmobileinvertbratesassociatedwiththereefmay have concentrated which would in turn increase grazing pressure Increased grazing pressure from fish and mobile invertebrates can reduce the coverage and diversity of macroalgaeonreefs(McCook1997HJompaampMcCook2002)
Thecoverof turfalgaeatbothKirraReefandPalmBeachReefhasvariedsignificantly betweensurveysPriorto2005turfalgaetypicallycoveredlessoftheavailablesurface areaonKirraReefthanPalmBeachReefInMarch2015themeancoverofturfalgae hasincreasedsincebaselinesurveysin1995andwasrelativelysimilarbetweenreefs(40 plusmn4atKirraReefcomparedto48plusmn4atPalmBeachReef)Thecoverofturfalgaeat Kirra Reef was similar in 2014 and 2015 which was generally higher than previous surveysexceptduringJuly2012whencoverofturfalgaepeakedat67plusmn4
TRESBPKirraReefMarineBiotaMonitoring2015 46
frc environmental
Turfalgaearebecomingadominantcomponentofcommunitiesaroundtheworld likely the result of rapid colonisation of openspace after a disturbance (eg storms) nutrient enrichment andor changes in grazing pressures Turf algae can also reflect a more physically robust growth form suited to high wave energy environments (than foliose macroRalgae)TurfalgaepeakedintheJuly2012surveylikelyrelatedtotheincreasein bare reef exposure following a stormy conditions in early 2009 and between December 2011 and June 2012 Turf algae have been the dominant form of algae on Kirra Reef sincethistimealbeitthecoverlowerthanthe2012survey
Increased cover of turf algae is typically related to good light conditions high concentrationsofnutrientsandlownumbersofgrazerssuchasfish(orconstantgrazing pressure preventing macroalgae colonisation) However the relationship between algal dynamics physical disturbance water quality and herbivore grazing activity is complex andthecoverof turfalgaecanexhibitextremetemporalvariabilityasaconsequenceof the interactionbetween topRdownandbottomRupprocesses (Russ2003HBellwoodetal 2006H Hughes et al 2007H Albert et al 2008H Hoey amp Bellwood 2008H Mumby 2009) Furtherinvestigationwouldberequiredtoreliablydeterminethemechanismsofchangein bothmacroalgaeandturfalgaeassemblagesonthesereefs
Benthic$Macroinvertebrates$
AtKirraReeftheburialandreRemergenceofrockyoutcrops(influencedbytheTRESBP) islikelytohaveincreasedtemporalvariabilityinthedistributionandabundanceofbenthic macroinvertebrates Additional perturbations such as wave action and sand abrasion (each influenced through changes in bathymetry seabed topography and water depth) are likely to have resulted in the decline in cover and diversity of the benthic macroinvertebratesatKirraReefbetweensurveysparticularlybetweenMarch2004and February2005andduringtheseverestormsof2009Benthicmacroinvertebratessuch asascidiansspongeshardcoralandsoftcoralarehighlysusceptible to theeffectsof stormandwavedisturbancephysicalabrasionandburialbysand(KayampKeough1981H Walker et al 2008) which can affect settlement growth rate and survival (Dodge amp Vaisnys1977HRogers1990)
Physical disturbance from sand burial sand abrasion and the action of storm waves appeartokeepthebenthicassemblagesofKirraReefinastateofearlysuccessionItis commonforearlypioneerspeciessuchassomemacroalgaetorecruitrapidlytoahard surface in large numbers allowing these species to dominate assemblages early in the successionaltrajectory(Walkeretal2007)
Afurther indicatorof theearlystateofsuccessionatKirraReef isthatthecoverofhard and soft coral has remained very low (generally lt 5) In March 2015 less than 1
Benthic macroinvertebrate cover may also be affected indirectly through increased competitionwithmacroalgaeforspaceThepresenceoflargemacroalgaecanaffectthe recruitment and survival of sessile benthic invertebrates as fronds moving with wave action sweep and abrade the surface of rocks killing new recruits especially corals (Kennelly1989HMcCooketal2001)Itcantakeseveralyearsforhardandsoftcoralto become dominant on reefs in the SEQ region (SchlacherRHoenlinger et al 2009) Therefore hard coral is not expected to become abundant until several years after the reefhasbeenuncoveredandonlyifthephysicaldisturbanceregimeandsupplyofnew recruitsissufficienttosupportsurvivalandgenerationalsuccessionofthesespeciesThe coverofhardandsoftcoralsatKirraReefwerebothverylowandpatchypriortothestart oftheTRESBP
Sponges and ascidians are highly susceptible to smothering and sand abrasion unless theyhaveathicktunic(outercoveringmadeofkeratin)liketheascidianP0stolonifera0or strong internal keratin silicon or calcareous structures in the case of some species of sponges0(KayampKeough1981HMcGuinness1987HWalkeretal2008)Duetoincreased wave action and sedimentation (which can be influenced by the TRESBP) the mean coverofascidiansandspongeswasexpectedtobemuchloweronKirraReefthanPalm Beach Reef However in March 2015 the cover of sponges was similar between the reefsandthecoverofascidians(otherthanP0stolonifera)wasgreateratKirraReefthan at Palm Beach Reef This suggests that Kirra Reef is slowly recovering from the increasedstressofphysicaldisturbancesuchas increasedwaveactionandsandscour andorthatwaveandstormconditionshavebeenlesssevereinthepastfewyears
Fish$
KirraReefcontinuestosupportahighdiversityofreefRassociatedandpelagic(ienonR reefassociated) fishspecies Despite itsdiminishedsizecompared to1995KirraReef continuestoprovidevaluablehabitatforanumberoffishspeciesfromdifferentfunctional groups
ThereisahighdegreeofinterRannualvariabilityinthespeciesandabundanceofthefish present at Kirra Reef compared with the assemblage at Palm Beach Reef This likely reflectsthetemporalvariabilityintheavailablehabitatasaconsequenceofreefburialand reRemergenceThediversityqualityandarealextentofreefhabitatareimportantfactors influencing the distribution abundance biomass and diversity of reef fish (Bellwood amp Hughes2001HFriedlanderetal2003)Diversityandabundanceoffishcanincreasewith
TRESBPKirraReefMarineBiotaMonitoring2015 48
frc environmental
greaterstructuralcomplexityandincreasedheterogeneityofavailablehabitats(Bellwood ampHughes2001)Thissuggeststhatperiodsofreefburialreducetheoveralldiversityof reefRassociated fish species at Kirra Reef Despite the reduction in overall reef space therewasalargervarietyofhabitats(suchasmarcoalgaeandturfalgae)in2015which was likely to be related to the high diversity of fish assemblages This is particularly importantforseveralspeciesthatdependonthepresenceoflsquostructurersquosuchasprovided by reef habitat (ie oldwife moray eels damselfish and Australian mado that were recordedinMarch2015butwerenotrecordedinJuly2012)
Theabundanceanddiversityof fishare likelytobenegativelyaffectedfollowingperiods of severe weather which create unfavourable conditions for many species and may further exacerbate the affects of abrasion and sedimentation The biomass of fish is knowntodecreasewithincreasingexposuretophysicaldisturbancefromwaveactionand strong currents (Friedlander et al 2003) As our surveys have been undertaken at different times of the year variation in the prevailing conditions at the time of sampling could also influence the types of fish observed (and the amount of reef habitat that is availableatanytime)Manyofthespeciesmayalsobeaffectedbyseasonalchangesin the water temperature such as damselfish which are less abundant in cool waters However theoveralldiversityof the fishassemblageatKirraReef is likely toreflect the sizeoftheoutcropsexposedwithagreaterphysicaldisturbance(fromseaconditionsand sandmovement)andcompetitionHandlesserfoodavailablewhenthereefiscovered
ThepredictedimpactstoKirraReefasaresultoftheTRESBPincludedaccretionofsand around the base of the rock outcrops causing a reduction in extent of reef It was predictedthatsanddeliveryaspartoftheprojectwouldeventuallymimiclsquonaturalrsquopatterns ofsanddispersalandthatthereefwouldreturntoitsnaturalextent(ietheextentpriorto extension of the Tweed River training walls in 1962) The benthic flora and fauna assemblages of the reef the historical reef extent and natural sand transport patterns wereexpectedtoreturntoconditionsobservedbeforetheextensionofthetrainingwalls between 1962 and 1965 However the Environmental Impact Study did not predict the ecologicalconsequencesofboththereducedarealextentandincreasedwaveenergy(a consequenceofdecreaseddepth)thathavebeenrecorded
ThecurrentextentofKirraReef remains less than50of that recorded in1962and in 1995beforethesanddeliverybytheTRESBPcommencedHowevertheextentofreef in1995 wasstrongly influenced by adepletion in sand following the construction of the Tweed River training walls and the Kirra Point groyne Accumulation of sand on Kirra ReefwasobservedtoincreaseasaresultofindirectsandnourishmentbytheTRESBP and the reef has been extensively covered (particuarly between 2005 and 2010) as a result
Whiletheextentofthereefcontinuestochangeovertimethedeliveryofsandaspartof the project now more closely matches the natural rate of longshore sand transport ShortRtermandseasonalchangesintheextentofthereefarenowlikelytobetheresultof waveandcurrentaction(particularlyduringservereweatherevents)thanadirectimpact of the TRESBP Therefore the extent of Kirra Reef in March 2015 is broadly in accordancewithpredictionsmadeintheEISwhichpredictedthatthereefwouldreturnto a condition similar to that exhibited in the preR1960rsquos ie before the extension of the TweedRiverbreakwatersthatinterruptedlittoralsandsupplytothesebeaches
InDecember2013KirraPointgroynewasextendedby30mwiththeexpectationthatthe beach bar would move seaward as a consequence At present Kirra Point groyne is unlikelytohavehadamajorimpactonthearealextentofKirraReefHoweverongoing monitoringbasedonaerialphotographsmayprovidefurtherinsight
Sessile benthic assemblages on Kirra Reef are highly susceptible to the influence of storms and associated wave action (Kay amp Keough 1981H Walker et al 2008) The shallowreefissurroundedbymobilesandwhichcanshiftnaturallyinresponsetowave action during storms causing burial of large sections of Kirra Reef This effect has reduced the availability of rocky substrate for colonisation and the availability of refuge
Fromanexaminationof theextentofKirraReef fromarealmapsandwaveheightdata thereappears tobea relationshipbetween theareaof rockexposedandstormevents Notably in a series of storm events in May 2009 corresponds with large areas of rock becoming exposed (with the reef approximately 100m2 in 2006 and approximately in 1009m2 2009) Further a stormy conditions between December 2011 and July 2012 correspondstotheareaofexposedrockmorethandoublinginsizeWhiletherewasno changetothetotalareaofexposedrockfollowingstormyconditionsinearly2013there wasaclearchangeinthedistibutionofexposedrockduringthistimeSince2013storm conditions have been calm to moderate and there has been little change in the areal extentanddistrubtionofexposedrockatKirraReef
WaveheighttypicallyincreasesduringstormeventsandgiventheshallowdepthofKirra Reef waves are more likely to shoal and break across the reef during storms This increases thephysicaldisturbanceabrasionandsedimentationofbenthicassemblages onKirraReefStormdisturbancecancauselocalreductionsinthespeciesrichnessand abundanceofcoral(Woodleyetal1981HMasselampDone1993HHughes1994HConnellet al 1997) and can alter fish assemblages indirectly through habitat modifications (Kaufman1983HJonesampSyms1998)ordirectlybyincreasingfishmortality(Lassig1983) The hydrodynamic forces produced by wave action are an important source of disturbance in subtidal habitats inflicting damage through direct physical impact and abrasion(UnderwoodampKennelly1990)DirectimpactsfromphysicaldisturbanceatKirra Reefareevidentduringsurveyeventswhenlargefragmentsofmacroalgaearepresentin thewatercolumnoverthereef
Storm and wave action (and associated sedimentation and abrasion) continue to be importantforcesshapingthedistributionandabundanceofbenthicspeciesatKirraReef Increased magnitude and frequency of physical disturbance resulting from increased exposureorsusceptibility tostormsandassociatedwaveaction (asonKirraReef)can lead to a decrease in the diversity of sessile invertebrate assemblages DisturbanceR drivenreductionsinbiodiversityhavethepotentialtoimpactnegativelyonthehealthand productivity of reef ecosystems (Walker et al 2008) Biodiversity is important to reef health given that many of these species (eg sponges bryozoans and ascidians) contribute a range of vital ecosystem services to reefs including nutrient cycling (Scheffers et al 2004) trophic interactions and food webs (Lesser 2006H Pawlik et al 2007) bioRerosion (Rutzler 2002H LopezRVictoria et al 2006) and stabilizing substrata (DiazampRutzler2001HWulff2001)
Theimpactsof increasedwaveactionandsedimentationonthebenthicassemblagesat Kirra Reef are likely to be greatest during and immediately following storm conditions
TRESBPKirraReefMarineBiotaMonitoring2015 51
frc environmental
Partitioningtheinfluenceofstormandwavedrivendisturbancefromthatoftheoperation oftheTRESBPwouldrequireamuchmorestatisticallypowerfulandtemporilyreplicated experimental design Given there is a large collection of wave and storm data by TRESBP this would involve greater temporal sampling of Kirra Reef including event samplingfollowingseverewaveandstormactivity
The data generated by this Kirra Reef biota monitoring program doesnrsquot support statistically rigorous consideration of seasonality (monitoring has been at its most frequentannual)
InApril2014andMarch2015KirraReefcoveredlessthan50ofthereefrsquosextentprior to theoperationof theTRESBP The lossof reefhabitathasreducedtheavailabilityof hard substratum available for colonisation and consequently the abundance of benthic sessileassemblages
The reduced depth of water resulting from the accumulation of sand exacerbates the effects of storms and wave action It is likley that as a consequnece the biological communities of Kirra Reef will reflect earlyRstage succession more frequently and for longerperiods
While there is sufficient structure available frcenvironmentalexpect that Kirra Reef will continuetoprovideimportanthabitatforadiverseassemblageoffishes
TRESBPKirraReefMarineBiotaMonitoring2015 52
frc environmental
5$ Conclusions$
Although there is still a substantial portion of the reef covered compared to before the extension of the Tweed River entrance breakwaters the current extent of Kirra Reef is broadly inaccordancewithpredictionsmadein theEIS Initial lsquocatchRuprsquobypassingand dredgeplacementofsand(between2001and2008)resulted in theburialofKirraReef Subsequentsanddelivery(since2008onwards)morecloselyreflectsnaturalpatternsof longRshoresandtransportandisthereefhasslowlyreRemerged
Theextentofthereefhasbeenrelativelystablesince2013Thishasallowedforsome succession in the benthic assemblages including a relatively high cover of sponges ascidiansandcrinoidsWiththedeliveryofsandmorecloselymatchingthenaturalrateit isexpected the reef willundergoshortRtermchanges in extentdue toseasonal shifts in sand deliveryH however the diversity of benthic assemblages on Kirra Reef is likely to increaseovertimeThiswouldcreatemorespaceforspeciestorecruitandreducesthe influence of sand abrasion and wave damage It was predicted that the areas of Kirra Reef newly exposed in 2012 would undergo a shift from turfRdominated communities to more diverse communities that could include macroalgae sponges ascidians and potentiallyhardandsoftcoralWiththeexceptionofhardandsoftcoralsthisprediction wasconfirmedbytheresultsoftheApril2014andMarch2015surveys
ThediversityoffishesassociatedwithKirraReefisbroadlysimilartothatrecordedprior tothecommencementofsandbypassingin1995Giventhatfisharemobilethegreatest impacts on fish assemblages are likely to be shortRterm changes due to both the prevailingconditionsandchangestheextentofavailablehabitatthatprovidesshelterand foodforavarietyofdifferentspeciesIfKirraReefincreasesinsizethereislikelytobea greater proportion of cryptic benthic species as these species are more typical of assemblagesinalaterstageofsuccession(eg(WillisampAnderson2003))
Assuming a broadly stable delivery rate of sand and consequent stable extent of Kirra ReeflsquorecoveryrsquoislikleytobesubstantivelycompleteFloralandfaunalcommunitieswill undergo succession between severe storm events but are likley to remain relatively dynamic
Albert S Udy J amp Tibbetts I 2008 Responses of algal communities to gradients in herbivorebiomassandwaterqualityinMarovoLagoonSolomonIslandsCoral0 Reefs2773R82
Anderson MJ 2001 A new method for nonRparametric multivariate analysis of varianceAustral0Ecology2632R46
Anderson MJ 2004 PERMDISP0 a0 FORTRAN0 computer0 program0 for0 permutatinoal0 analysis0 of0 multivariate0 dispersions0 (for0 any0 twoSfactor0 ANOVA0 design)0 using0 permutational0 tests Department of Statistics University of Auckland New Zealand
Cannon LR Goeden GB amp Campbell P 1987 Community patterns revealed by trawling in the interRreef regions of the Great Barrier Reef Memoirs0 of0 the0 Queensland0Museum2545R70
Chapman MG Underwood AJ amp Skilleter GA 1995 Variability at different spatial scalesbetweenasubtidalassemblageexposedtothedischargeofsewageand two control assemblages Journal0 of0 Experimental0 Biology0 and0 Ecology 189 103R122
Cheshire AC Miller DJ amp Stewart R (1999) Effect0 of0 dispersed0 sediment0 plumes0 from0beach0sand0replenishment0dredging0on0recruitment0of0phaeophycean0algae0 to0rocky0reefs0in0Gulf0St0Vincent0South0Australia0The0Impact0of0Sand0Dredging0 on0 Benthic0 Community0 Structure0 at0 the0 Port0 Stanvac0 Dredge0 Site0 20 1S39 UniversityofAdelaideAdelaide
ConnellJHHughesTPampWallaceCC1997A30Ryearstudyofcoralabundance recruitment and disturbance at several scales in space and time Ecological0 Monographs67461R488
Diaz MC amp Rutzler K 2001 Sponges an essential component of Caribbean coral reefsBulletin0of0Marine0Science69535R546
DodgeREampVaisnysJR1977Coralpopulationsandgrowthpatternsresponsesto sedimentation and turbidity associated with dredging Journal0 of0 Marine0 Research35715R730
Done TJ 1982 Patterns in the distribution of coral communities across the central GreatBarrierReefCoral0Reefs195R107
Edwards RA amp Smith DA 2005 Subtidal assemblages associated with a geotextile reef insouthReastQueenslandAustraliaMarine0and0Freshwater0Research56 133R142
FisheriesResearchConsultants1991Survey0of0the0Intertidal0and0Subtidal0Rocky0Reefs0 of0 the0 Sunshine0 Coast report prepared for Queensland National Parks and WildlifeService
HarrisonPHarriotVBanksSampHolmesN1998ThecoralcommunitiesofFlinders Reef andMyora Reef in theMoretonBay MarineParkQueensland Australia In Moreton0 Bay0 and0 Catchment Tibbits I Hall N amp Dennison W (Eds) SchoolofMarineScienceUniversityofQueenslandStLuciapp525R536
Hatcher B Johannes R amp Robertson A 1989 Review of research relevant to the conservationofshallowtropicalmarineecosystemsOceanography0and0Marine0 Biology0an0Annual0Review27337R414
Hoey A amp Bellwood D 2008 CrossRshelf variation in the role of parrotfishes on the GreatBarrierReefCoral0Reefs37R47
TRESBPKirraReefMarineBiotaMonitoring2015 56
frc environmental
Hollingsworth P 1975 Environmental Investigation Report Crown Reserve R R68 Currumbin Creek City of the Gold Coast Land Administration Commission unpublishedreport
Hughes TP 1994 Catastrophes phase shifts and large scale degradation of a CaribbeancoralreefScience2651547R1551
Hughes TP Rodrigues MJ Bellwood DR Ceccarelli D HoeghRGuldberg O McCook L Moltschaniwskvi N Pratchett MS Steneck RS amp Willis B 2007Phaseshiftsherbivoryandtheresilienceofcoralreefstoclimatechange Current0Biology17360R365
Hutchinson A Rempel C Taveras V Loder J amp Salmond J 2013 Reef0 Check0 Australia0 South0 East0 Queensland0 Summary0 Report0 2013 report prepared for ReefCheckFoundationLimited
Hyder Consulting 1997 Tweed0 River0 Entrance0 Sand0 Bypassing0 Project0 Permanent0 Bypassing0 System0 0 Environmental0 Impact0 Statement0 0 Impact0 Assessment0 Study report prepared for New South Wales Department of Land and Water Conservation
Jompa J amp McCook LJ 2002 Effects of competition and herbivory on interactions betweenahardcoralandabrownalgaJournal0of0Experimental0Marine0Biology0 and0Ecology27125R39
KayAMampKeoughMJ1981Occupationofpatchesintheepifaunalcommunitieson pier pilings and the bivalve Pinna bicolor at Edithburgh South Australia Oecologia48123R130
KennellyS1987aInhibitionofkelprecruitmentbyturfingalgaeandconsequencesfor an Australian kelp community Journal0 of0 Experimental0 Marine0 Biology0 and0 Ecology11249R60
Kennelly S 1987b Physical disturbances in an Australian kelp community I temporal effectsMarine0Ecology0Progress0Series40145R153
TRESBPKirraReefMarineBiotaMonitoring2015 57
frc environmental
Kennelly S 1989 Effects of kelp canopies on understory species due to shade and scourMarine0Ecology0Progress0Series50215R224
Lassig BR 1983 The effects of a cyclonic storm on coral reef fish assemblages Environmental0Biology0of0Fishes955R63
Lawson S McMahon J amp Boswood P 2001 Environmental management of the construction and operation of a sand bypassing system at the Tweed River EntranceInThe15thAustralasianCoastalandOceanEngineeringConference the 8th Australasian Port and Harbour Conference 25 R 28 September 2001 QueenslandAustralia
Lesser MP 2006 BenthicRpelagic coupling on coral reefs feeding and growth of Caribbean sponges Journal0 of0 Experimental0 Marine0 Biology0 amp0 Ecology 328 277R288
LopezRVictoriaM ZeaSampWei E2006 Competition for spacebetweenencrusting excavatingCaribbeanspongesandothercoral reeforganismsMarine0Ecology0 Progress0Series312113R121
MalcolmHASmithSDAampJordanA2009Usingpatternsofreeffishassemblages to refine a Habitat Classification System for marine parks in NSW Australia Aquatic0Conservation0Marine0and0Freshwater0Ecosystems2083R92
Massel SR amp Done TJ 1993 Effects of cyclone waves on massive coral assemblages on the Great Barrier Reef meteorology hydrodynamics and demographyCoral0Reefs12153R166
Mumby PJ amp Steneck RS 2008 Coral reef management and conservation in light of rapidly evolving ecological paradigms Trends in Ecology amp Evoution 23 555 -563
Murphy HM amp Jenkins GP 2010 Observational methods used in marine spatial monitoring of fishes and associated habitats a review Marine and Freshwater Research 61 236-252
Noriega R 2007 An Overview of Available Information on Sandy Beach Ecology Coastal Sand Dunes Rocky Reefs and Associated Biota on the Gold Coast Griffith Centre for Coastal Management Research Report No 85 report prepared for Griffith University
Parker P (1995) Structure to Reef Fish Assemblages at Julian Rocks Northern New South Wales Masters Thesis Griffith University
Parker PG 1999 Fish assemblages at Julian Rocks and the adjacent waters of northern New South Wales Australia Australian Zoologist 31 134 - 160
Pawlik JR Steindler L Henkel TP Beer S amp Ilan M 2007 Chemical warfare on coral reefs sponge metabolites differentially affect coral symbiosis in situ Limnology and Oceanography 52 907-911
Reef Check 2010 httpwwwreefcheckaustraliaorgdatahtml accessed December 2015
Robinson KI amp Pollard DA 1982 Marine and estuarine reserves in Australia with particular reference to New South Wales Wetlands 2 17 - 26
Rogers CS 1990 Responses of coral reefs and reef organisms to sedimentation Marine Ecology Progress Series 62 185-202
Russ GR 2003 Grazer biomass correlates more strongly with production than with biomass of algal turfs on a coral reef Coral Reefs 22 63-67
Rutzler K 2002 Impact of crustose clionid sponges on Caribbean reef corals Acta Geologica Hispanica 37 61-72
Scheffers SR Nieuwland G Bak RPM amp van Duyl FC 2004 Removal of bacteria and nutrient dynamics within the coral reef framework of Curacao (Netherlands Antilles) Coral Reefs 23 413-422
TRESBP Kirra Reef Marine Biota Monitoring 2015 59
frc environmental
Schlacher-Hoenlinger M Walker S Johnson J Schlacher T amp Hooper J 2009 Biological Monitoring of the Ex-HMAS Brisbane Artificial Reef Phase II - Habitat Values report prepared for Environmental Protection Agency (EPA)
Smith KA 2003 A simple multivariate technique to improve the design of a sampling strategy for age-based fishery monitoring Fisheries Research 64 79-85
Smith S Edwards R Dalton S amp Harrison M 2005 Biological assessment of fish and benthic communities at Palm Beach Bait Reef Gold Coast Queensland report prepared for University of New England
TRESBP 2014 Autum 2009 storms httpwwwtweedsandbypassnswgovauarticles-and-studiesinteresting-itemsautumn-2009-storm updated 4 May 2014 accessed December 2015
TRESBP 2015a Tweed Sand Bypassing Restoring Coastal Sand Drift Improving Boating Access ndash Techinical information httpwwwtweedsandbypassnswgovau__dataassetspdf_file0004552055kir ra-feb-2015pdf acessed December 2015
TRESBP 2015b Waves httpwwwtweedsandbypassnswgovauenvironmental-monitoringcoastal-conditionswaves updated 30 September 2015 accessed December 2015
Umar MJMLJ amp Price IR 1998 Effects of sediment deposition on the seaweed Sargassum on a fringing coral reef Coral Reefs 17 169-177
Underwood AJ amp Kennelly SJ 1990 Ecology of marine algae on rocky shores and subtidal reefs in temperate Australia Hydrobiologia 192 3-20
Walker S Schlacher T amp Schlacher-Hoenlinger M 2007 Spatial heterogeneity of epibenthos on artificial reefs fouling communities in the early stages of colonization on an East Australian shipwreck Marine Ecology 28 435-445
Walker SJ Degnan BM Hooper JNA amp Skilleter GA 2008 Will increased storm intensity from climate change affect biodiversity in non-scleractinian sessile fauna on coral reefs Global Change Biology 14 2755-2770
Warwick RM amp Clarke KR 1993 Increased variability as a symptom of stress in marine communtities Journal of Experimental Marine Biology and Ecology 172 215-216
Thenumberofsitessurveyedhasvariedover timeasaresultof the fluctuating levelof sandcoveringKirraReef
Prior to May 2003 three sites were assessed along the eastern and northern edge of KirraReef(KirraReefOutersites1to3)andthreesiteswereexaminedalongtheinshore marginof the reef (KirraReef Inner sites1 to 3)(MapA1) ReefRedge (ieKirraOuter) siteswerechosentoprovideearlywarningofimpactsfromoffshoreplacementofdredged sandwhilst inshoresites(ieKirraInner)werechosentoindicatewhetherimpactsfrom inshore beach profile development were affecting the reef platform In May 2003 the threeeasternsitesatKirraReef (ieKRO1KRO2andKRI1)werecompletelycovered with bare mobile sand Consequently only the three western sites at Kirra Reef (ie KRO3KRI2andKRI3)supportedbenthicfloraandfaunaInMarch2004theextentof the remainingwesternoutcropof KirraReef had been further reduced so that all inner reefsiteswerecompletelycoveredwithmobilesandConsequentlyonlyasingleoriginal reefsite(ieKRO3)couldbesurveyed(Figure23)Thereforetoprovideanindicationof the condition of the remaining reef two new sites were established (ie KRN1 and KRN2)(Figure23)andsurveyedinMarch2004Theextentofthewesternreefhadbeen further reduced by February 2005 and a third new site (ie KRN3) was established (Figure23)Consequentlyfoursites(KRO3KRN1KRN2andKRN3)weresurveyedin February2005
InFebruary2010fourKirraReefsites(ieKRO3KRO1KRN1andKRN2)wereclearof thesurroundingsandandsupportedbenthic floraand fauna Inaddition several rocks protruded from the sand in the vicinity of site KRI2H these were assessed to provide a quantitativeindicationofbroadRscaletemporalchangestotheinshorereefcommunities
SOURCEScopy Copyright Commonwealth of Australia (Geoscience Australia) 2001 2004 2006copy The State of Queensland (Department of Natural Resources and Mines) 2015copy Nearmap 2014 2015
DATE2015-09-09
DRAWN BYCF
VERSION02
PROJECTIONCoordinate System GDA 1994 MGA Zone 56Projection Transverse MercatorDatum GDA 1994
plusmn SCALE
0 50 100
Metres
Scale 12500 A3
frc environmental
Appendix$B$ Introduction$to$Data$Analysis$Used$
Multivariate$Analyses$
Multivariate statistical techniques are widely used in ecology to assess the similarities relationshipsbetweenassemblagesWhereasunivariateanalysescanonlycompareone variable at a time (eg an index of community structure such as a diversity index or a singleindicatorspecies)multivariateanalysescancomparesamplesbasedontheextent thatassemblagesshareparticulartaxaandabundances(ClarkeampWarwick2001)
Thefirststepofmultivariateanalysisusuallyinvolvesthecreationofamatrixofsimilarity coefficients computed between every pair of samples The coefficient is usually a measureofhowclose theabundance is foreachspecies (definedso that100= total similarity and 0=complete dissimilarity) The Bray Curtis similarity measure is commonlythemostappropriateforbiologicaldata(ClarkeampWarwick2001)
MultidimensionalScaling
NonRmetricmultiRdimensionalscalingordinations(nMDS)attempttoplacesamplesintwo dimensionalspacesothattherankorderofthedistancesbetweensamplesmatchesthe rankorderofthematchingsimilaritiesfromthesimilaritymatrix(ClarkeampWarwick2001) Thisprovidesavisualrepresentationofthesimilaritiesbetweenassemblageswithineach sampleEachoftheaxesisnotrelatedtoanyparticularvalueHinfactaxescanberotated toprovide thebestvisual representationof thedata Ordinationsareparticularlyuseful tools for analysing and visually presenting differences between assemblages Ordinationsareessentiallymapsofsamples inwhich theplacementofsampleson the mapreflectsthesimilarlyofthecommunitytothecommunitiesinothersamples(Clarkeamp Warwick 2001) Distances between samples on an ordination attempt to match the similarities inassemblagestructurenearbypoints representassemblageswithvery few attributes(speciesorabundanceofspecies)Hpoints faraparthavevery fewattributes in common(ClarkeampWarwick2001)
A stress coefficient is calculated to reflect the extent to which the multiRdimensional scalingordinationandthesimilaritymatrixagree(ClarkeampWarwick2001)(iehowwell the multiRdimensional scaling ordination accurately reflects the relationship between samples)Stressvaluesoflt015aregenerallyacceptable
In Figure A1 each freshwater macroinvertebrate sample is represented on the multiRdimensionalscalingordination By lookingat thedistancesbetweeneachsample
ANOSIMisanalogoustoANOVAinunivariatestatistics(Smith2003)AglobalRstatistic iscalculatedtodeterminewhetherthereisasignificantdifferencebetweenallsamplesIf there are differences then pairwise comparisons are conducted to test for differences betweenpairsofsamples(analogoustopostRhoctestsinANOVA)
The R value lies between R1 and +1 (all similarities within groups are less than any similarity between groups) with a value of zero representing the null hypothesis (no differenceamongasetofsamples)(ClarkeampWarwick2001)ComparisonofpairwiseR values can give an indication of how different assemblages are R values close to 0 indicatelittledifferencevaluesaround05indicatesomeoverlapandvaluescloseto1to indicate many or substantial differences In many instances however researches are primarily interestedinwhethertheRvalueisstatisticallydifferentfromzero(usuallyata confidence level of 005) (Clarke amp Warwick 2001) (ie whether they can reject the null hypothesis)
ANOSIM can provide information on whether the (visual) differences between assemblages in the multiRdimensional scaling ordination are significantH it is an independenttestfromthemultiRdimensionalscalingordinationItisbasedontestingthe
TRESBPKirraReefMarineBiotaMonitoring2015 B2
frc environmental
differences between the rank similarities in the similarity matrix not on the distances betweensamplesinthemultiRdimensionalscalingordination(ClarkeampWarwick2001)
PermutationalMultivariateAnalysisofVariance
PERMANOVAisusedtotestsimultaneousresponsesofoneormorevariablestooneor more factors in an a0 priori0 structured design using random permutation of the data to assess significance (Anderson 2004) PERMANOVA generates a pseudo FRstatistic similar to traditional ANOVA but pRvalues are calculated with permutations which does notassumenormaldatadistribution PERMANOVAcanprovide informationonwhether the (visual) differences between assemblages in a multiRdimensional scaling ordination are significantH however it is an independent test from the multiRdimensional scaling ordination
Thelevelofmultivariatedispersionamongsampleswithineachofthetestgroupscanbe examined using the permutational analysis of multivariate dispersions (PERMDISP) routine(Anderson2004)Intraditionalimpactassessmentachangeinthedispersionof datacanalsoindicateanimpact
SimilarityPercentagendashSpeciesContributions
SIMPER analysis provides information on how dissimilar assemblages from various groups are (eg how similar all of the macroinvertebrate samples taken for a particular habitatwithinastreamreachare)andhowsimilareachgroup(egreach)istoanyother group SIMPER analysis also identifies the species taxa that are contributing to the dissimilarity between two assemblages in rank order (ie it identifies which species is contributingthemosttothedifferences)SIMPERanalysismayhelptoidentifypotential lsquoindicatorrsquospeciesForexampleifaparticularspeciesconsistentlycontributesgreatlyto the differences between impacted and unimpacted assemblages it may be a useful indicator Theabundanceofthis indicatorspeciescanthenbecomparedbetweensites usingunivariatetechniquessuchasANOVA
Data is available on request from tresbpprojectofficecrownlandnswgov
TRESBPKirraReefMarineBiotaMonitoring2015 C1
frc environmental
Appendix(D( Pairwise( PERMANOVA( Results
Data is available on request from tresbpprojectofficecrownlandnswgov
TRESBPKirraReefMarineBiotaMonitoring2015 D1
frc environmental
Appendix(E( Relative(Abundance(of(Fish(found(at(Kirra(( ( and(Palm(Beach(Reefs(in(Each(Survey((Data is available on request from tresbpprojectofficecrownlandnswgovau
TRESBPKirraReefMarineBiotaMonitoring2015 E1
Structure Bookmarks
0 50 100 Metres Scale 12500 A3
0 50 100 200 Metres Scale 15000 A3
Kirra Reef
Kirra Reef
Kirra Reef
Kirra Reef
Kirra Reef
Kirra Reef
Map A1Location of Kirra Reef monitoring sites
Table D8 Pairwise comparison of macroalgae cover between sites in each year
Table D15 Pairwise comparison of turf algae cover between sites in each year
Table D29 Pairwise comparison of ascidian cover between sites in each year
Table D43 Pairwise comparison of soft coral cover between sites in each year
frc environmental
Figure 12 Extent of Kirra Reef in March 2015 (image source NSW Trade amp Investment)
The southeast Queensland (SEQ) region comprises five subregions the Gold Coast Inner Moreton Bay Outer Moreton Bay Sunshine Coast and Fraser Coast Coral communities within SEQ are diverse with an extensive range of coral growth forms (Harrison et al 1998) The greatest diversity of coral species are typically found at offshoresites likeFlindersReefswhere119differentcoralspecieshavebeen recorded (Harrisonetal1998)
Subtidal rocky reefs of the Gold Coast region comprise remnants of highly eroded volcanic substratum isolated by wide variable expanses of soft sediment (Edwards amp Smith 2005) They support community assemblages that are indicative of a transition between the tropical waters of the Great Barrier Reef and the temperate waters characteristicofthemidNewSouthWalescoast(Done1982XCannonetal1987)
GoldCoastreefcommunitiesarebroadlysimilartoareasofcomparabletopographytothe north(InnerGneeringsoffshorefromMooloolabaandoffshoreofMoretonBay)andtothe south (Julian Rocks offshore of Byron Bay) that are dominated by macroalgae and sessile invertbrates(FisheriesResearchConsultants1991XHarriottetal1999XEdwards amp Smith 2005X Baronio amp Butcher 2008X Fellegara 2008X SchlacherHoenlinger et al 2009)ManyoftheGoldCoastsreefslocatedclosetoshoreareoftenaffectedbyhuman activities (Noriega 2007)and typicallyhave lesscoralcover Ina2013surveyofSEQ reefsGoldCoastreefshadthelowesthardcoralcoverat9(Hutchinsonetal2013)
Fish of the Gold Coast region are similar in community composition to that recorded offshore of Moreton Bay at Julian Rocks and the Solitary Islands offshore of Coffs Harbourandtoa lesserextentat theexHMASBrisbanenearMooloolaba(Robinsonamp Pollard 1982X Parker 1995X Parker 1999X Edwards amp Smith 2005X Malcolm et al 2009X SchlacherHoenlingeretal2009) The smaller inshore reefsof theGoldCoast region suchasKirraReeftypicallysupportalowerabundanceanddiversityoffishes(Edwards ampSmith2005Xfrcenvironmental2005)
Kirra$Reef$
ThebenthicassemblagesofKirraReefarecharacterisedbyahighcoverofmacroalgae andturfalgaeandamoderatecoverofsessilebenthicinvertebratesincludingafewhard corals(EdwardsampSmith2005Xfrcenvironmental2005)Turfalagecoversthemajorityof the reef substrate Crinoids (feather stars) ascidians (sea squirts) and sponges are typically themostabundantbenthic faunawhilstanemonessoftcoralsandurchinsare present in low numbers (frc environmental 2014) The composition of benthic assemblagesatKirraReef isbroadlysimilar to thatdescribed fromadjacent rockyreefs
Exposuretowaveactionsandscouringandsmotheringareimportantfactorsinfluencing the distribution and abundance of sessile species on rocky reefs (Kay amp Keough 1981X McGuinness1987)ChangeintheheightofsandaroundthebaseofKirraReefappears to be a major factor influencing the abundance (cover) of benthic flora and fauna periodically resulting in a bare stratum on rocks within 08 to 1m of the seafloor Outcropsontheeasternsectionof thereefcomplexwherewaveactionand likelysand abrasion are greatest have historically supported a lower abundance of benthic fauna than outcrops on the northern section (Fisheries Research Consultants 1995a)X (Fisheries Research Consultants 1995b)X (Fisheries Research Consultants 1996)X (frc environmental 2003)X (frc environmental 2004)X (frc environmental 2005)X (frc environmental2010)
Strong wave action results in sustained abrasion of the dominant brown macroalgae (Sargassum(flavicans(andEcklonia( radiata)causing the fronds tobreak Thecontinual resuspensionofalgal fragments(commonlyreferredtoas lsquocornflakesrsquo)candramatically reducewaterclarityandvisibility Algal fragmentswere largelyabsent inJuly2012and April2014surveyslikelyduetolongperiodsofrelativelybenignseaconditionsInMarch 2015amoderateamountofalgalfragmentswasobservedlikelyduetostormactivityin theweeksproceedingthesurvey(egmoderateseas11to14Februaryandminorstorm over1922February)
RecentsurveysatPalmBeachReefcompletedbyReefCheckrecordedadeclineinhard coralcover from2008to2013(Hutchinsonetal2013) Sessile invertebrates including spongescoralsandascidianstypicallydominatethebenthicassemblageofPalmBeach Reef(EdwardsampSmith2005X frcenvironmental2005XReefCheck2010) Thecoverof sessileinvertebrateshashistoricallybeensimilartothatrecordedfromtheoutersections of Kirra Reef However the cover of macroalgae has consistently been loweron Palm BeachReefthanonKirraReefTheproximityofPalmBeachReeftotwocreekmouths andtheabsenceofstrongcurrentsintheareatypicallyresultsinahighlevelofturbidity Elevated turbidity together with greater water depth and a high abundance of grazing
TRESBPKirraReefMarineBiotaMonitoring2015 10
frc environmental
speciessuchasurchinsislikelytocontributetoarelativelylowcoverofmacroalgaeand abundant suspension feeding organisms such as ascidians sponges hydrozoans and crinoidsatPalmBeachReef(Smithetal2005)
PalmBeachhasa lowerabundanceanddiversityof benthicdemersaland pelagic fish comparedtoKirraReef(Smithetal2005)ThegreaterdensityoffishatKirraReefmay beaconsequenceof the lossof reef forcingmore fish intoasmallerarea (Smithetal 2005)PalmbeachrecordedaslightlylowerdiversityoffishthanKirraReefin2012and 2014surveys(frcenvironmental2012Xfrcenvironmental2014)
TRESBPKirraReefMarineBiotaMonitoring2015 11
frc environmental
2$ Methods$
The methods used in the March 2015 survey were developed for the Stage I survey completed in April and June 1995 and used for subsequent surveys February 1996 January 2001 May 2003 March 2004 February 2005 February 2010 July 2012 and April2014 Datawere collected from KirraReef (2816251535309) andPalmBeach Reef(2810751534774)locatedapproximately9kmnorth(Figure21)
Themainobjectiveof the monitoring was to investigateanychange in the marinebiota and habitat of Kirra Reef compared to Palm Beach Reef (comparative reef) in order to assesstheeffectofthesandbypassproject(andsubsequentincreasesinsandload)on theecologyofKirraReef
0 2 41
Kilometres
Service Layer Credits Sources Esri HERE DeLorme Intermap increment P Corp GEBCO USGS FAO NPS NRCAN GeoBase IGN Kadaster NL Ordnance
0 2 41
Kilometres
Service Layer Credits Sources Esri HERE DeLorme Intermap increment P Corp GEBCO USGS FAO NPS NRCAN GeoBase IGN Kadaster NL Ordnance
Threesites(KRN1KRN2KRO3)atKirraReef(waterdepth5to8m)weresurveyedin March 2015 (Map 1) The remainder of the sites previously surveyed were covered by sand(refertoappendixAforahistoryofsitespreviouslysurveyed)Threecomparative sites (PB1 PB2 and PB3) were also surveyed at Palm Beach Reef (water depth 12 to 17m)(Map2)
TRESBPKirraReefMarineBiotaMonitoring2015 12
orth NetreStkicrraG
Marine Parade
t eertS ickr
M rarin ae Pa Grade
Musgrave St
t
re ee e Powel t r lt CrescenS t t es eel ri tM S
t ee ge drt u tleS d Rro MuL sgrave Street
LEGEND 0 1 Km Tweed River E ntrance Sand Bypassing Project Survey Site Road Network
copy Copyright Commonwealth of Australia (Geoscience Australia) 2001 2004 2006copy The State of Queensland (Department of Natural Resources and Mines) 2015copy Nearmap 2014
DATE2015-03-24
DRAWN BYCF
VERSION01
PROJECTIONCoordinate System GDA 1994 MGA Zone 56Projection Transverse MercatorDatum GDA 1994
plusmn SCALE
0 50 100 200
Metres
Scale 15000 A3
Gold Coast Highway
i
PalmBeach
Tugun
Coolangatta
0 1 Km
frc environmental
22$ Benthic$Flora$and$Macroinvertebrates$
At each site benthic assemblages were surveyed in fifteen 025m2 quadrats with the percentcoverofbenthicmacroalgaeturfalgaespongesascidianshardcoralsandsoft coralsassessedvisually(Figure22)Quadratswereplacedhaphazardlywhichincluded horizontal and sloping surfaces The minimum distance between quadrats was approximately2m Thenumberof largeascidians (Pyurastolonifera)crinoids (feather stars)barnaclesurchinstubewormspolychaeteshydroidszoanthidsandcowriesand the dominant species of macroalgae were also recorded and quantitative notes were madeontheapparenthealthofeachtaxonomicgroup
ThespeciesrichnessandrelativeabundanceoffishatKirraReefandPalmBeachReef were assessed using a combination of underwater visual census (UVC) and video surveys The combination of these techniques represents the most costeffective and efficientmeansofobtainingdataonthestructureoffishassemblagesindifferenthabitats (Murphy amp Jenkins 2010) A baited remote underwater video (BRUVX baited with pilchards) and footage captured by a diver swimming hapazard trasects over the reef wererecorded
Video footage from each BRUV (approximately 20minutes) and video transects (approximately 35 minutes) was reviewed by an ecologist experienced in marine fish identification
24$ Data$Analysis$
Permutational multivariate analysis of variance (PERMANOVA) was used to determine differences in the composition (cover of benthic fauna and taxonomic group) of benthic assemblagesbetweenKirraReefandPalmBeachReefover time PERMANOVAuses permutational methods (PsuedoAF) to derive statistical significance which require fewer assumptionstobemetthananalogousmethodssuchasmultivariateanalysisofvariance (MANOVA) (Anderson 2001X Anderson et al 2008) This analysis enables an examinationofchangesinthecommunityasawhole
A three factor PERMANOVA was used to examine differences in the composition of benthic assemblages with survey (fixed factor) locations (Palm Beach Reef and Kirra Reeffixedfactor)andsites(nestedinlocationsasarandomfactor)asthefactorsData weresquareroot transformedtodownweightdominatingspeciesabundanceXconverted toaBrayCurtisdistancematrixXandtestedforsignificanceusingasmanypermutations as allowed (9800 to 9937 unique permuations achieved for all factors and factor combinationsXexceptlocationwhere10uniquepermutationswereachieved))Posthoc pairwisetestwasusedtodeterminethemagnitudeofdifference
Nonmetricmultidimensionalscaling (nMDS)ordinationswereused tovisually represent the variation in the composition of assemblages between reefs separately for each survey nMDS ordinations were also used to visually represent the variation in the compositionofassemblagessurveysatKirraReefforallsurveysXbaselinesurveyinApril 1995andMarch2015XandApril2014andMarch2015
Separate univariate PERMANOVAs were used to compare differences in the cover of macroalgae turf algae and the abundance of crinoids and ascidians Data were
TRESBPKirraReefMarineBiotaMonitoring2015 16
frc environmental
converted to a eucildean distances matrixX and tested for significance using as many permutations as allowed (998 to 999 unique permuations achieved for all factors and factor combinationsX except location where 10 unique permutations were achieved) Factors were survey (fixed factor) locations (Palm Beach Reef and Kirra Reef fixed factor)andsites (nested in locationsanda random factor) Posthoc pairwise testwas used to determine the magnitude of difference Monte Carlo procedures were used to calculateempiricalPvaluesforthesurveyxlocationtest
Further information on the use and interpretation of PERMANOVA and other analyses usedinthisreportisprovidedinAppendixB
TRESBPKirraReefMarineBiotaMonitoring2015 17
frc environmental
3$ Results$
31$ Cover$of$Benthic$Assemblages$
The composition of benthic fauna and flora ( cover and type combined Appendix C) variedbetweenmostsitesatbothKirraReefandPalmBeachReefandbetweennearly allsurveysateachsite(notethesignificantinteractionofsite(location)xsurveyinTable 31X Appendix D) Nevertheless there appeared to be substantial differences in the compositionofthebenthicassemblagesbetweenthetworeefsineachsurveyfrom1995 to2015(Figure31toFigure33)
In2015 therewassomeoverlap in thecompositionofassemblagesonKirraandPalm Beach Reefs (Figure 33) However there was also some clear patterns of difference including
Benthic assemblages at Kirra Reef appeared to show some overlap between surveys (Figure34H) HowevernearlyallsurveysweredifferentateachsiteatbothKirraReef andPalmBeachReef(AppendixD)BenthicassemblagesinMarch2015andApril2014 wereverysimilarcomparedtobenthicassemblages inthebaselinesurvey inApril1995 andMarch2015(notethegreateroverlapinFigure35comparedtoFigure36)
In March 2015 as in previous surveys the macroalgae Sargassum sp dominated the benthic assemblages at all sites at Kirra Reef (Figure 37) Other species present included
sdot Dictyopteris0arostichoides0
sdot Dilophus0intermedius00
sdot Zonariasp
sdot Laurencia0brongniartic0
sdot Amphiroa0anceps0
sdot Caulerpa0lentilliferaand
sdot Halimeda0discoideaand
sdot Macrocystissp
Juvenile kelp (from the genus Macrocystis) was also emerging on some areas of Kirra Reef
ThecoverofmacroalagevariedbetweensitesandsurveysatbothKirraReefandPalm Beach Reef with the magnitude of difference varying over time (note the significant interaction between site (location) x survey in Table 32) Macroalgae cover varied between surveys with 2001 being the most different to the other years (Appendix D) ThereweredifferencesbetweensitesatKirraReefinJune1995February1996January 2001 May 2003 February 2005 and February 2010 and between sites at Palm Beach ReefinJanuary2001andFebruary2010Inrecentsurveys(2012to2015)thecoverof macroalgaeatsitesatbothKirraReefandPalmBeachReefwassimilar (AppendixD) indicatingarelativelyconsistentdistributionacrossbothreefs
ThemeancoverofmacroalgaeatKirraReefhasdeclinedsinceitspeakin2001withthe greatest magnitude of decline recorded between January 2001 and May 2003 (Figure 38)InsurveysbetweenJune1995andMay2003Sargassumspformeddensecarpets overtherockysubstratecoveringupto58oftheavailablesurfaceareaofthereefIn February 2010 macroalgal cover was 12 Macroalgal cover has increased to 26 in March2015ThisissimilartothecoverrecordedinApril1995(23cover)(Figure38)
In2015nomacroalgaewasrecordedwithinthequadratsatPalmBeachReefThecover of macroalgae on Palm Beach Reef has been consistently lower than Kirra Reef since
TRESBPKirraReefMarineBiotaMonitoring2015 26
frc environmental
ecologicalmonitoringbegan typically lessthan5of theavailablesurfacearea(Figure 38)
The mean cover of turf algae varied between sites and surveys at both Kirra Reef and PalmBeachReef(notethesignificantinteractionbetweensite(location)xsurveyinTable 33)SpecificallythereweresignificantdifferencesbetweensitesatbothKirraReefand PalmBeachReefinJune1995January2001February2010July2012andApril2014 (aswellasbetweensitesinFebruary1996atKirraReef)Thecoverofturfalgaevaried betweenmostsurveysatallsitesateachreef(AppendixD)BothKirraandPalmBeach reefs showed major increases in the percent cover of turf algae from 2010 to 2012 followedbyadecreaseincoverbetween2012and2014(Figure310)Thecoverofturf algae is typically lower at Kirra Reef than at Palm Beach Reef (July 2012 being an exception) and was again slightly lower at Kirra Reef in March 2015 (Table 310) In March2015turfalgaewasmoreprevalentatKirraReefthanduringthebaselinesurvey ofApril1995
ThemeancoverofspongesatsomesitesatbothKirraReefandPalmBeachReefhas varied significantly during some surveys (note the significant interaction between site (location)xsurvey inTable34HFigure311) However thecoverofspongestendedto bemore temporallyvariable atKirraReef than at Palm Beach Reef (Figure312) The cover of sponges at Kirra Reef varied between sites in February 1996 January 2001 March2004July2012andApril2014 However thecoverofspongesatPalmBeach Reefonlyvariedbetweensites inJanuary2001andFebruary2010 (AppendixD) The cover of sponges varied between survey at each site with 1995 1996 and 2001 most differenttootheryears(AppendixD)
ThemeancoverofspongesatKirraReefdeclinedbetweenMarch2004(20cover)and February 2010 (less than 1 cover) Since 2010 the cover of sponges has increased slightly with sponges covering 8 of the reef in March 2015 (Figure 312) In March 2015thecoverofspongeswashigherthanrecordedduringthebaselinesurveyinApril 1995(3cover)(Figure312)
Figure312 Mean cover of sponges (plusmnSE) at Kirra Reef and Palm Beach Reef on all
surveys
Table34 Univariate PERMANOVA results for differences in the cover of sponges betweensurveysandlocations
Factor$ df$ MS$effect$ PseudoF$ p$(perm)$
survey 10 18576 276 0018
location 1 39671 589 0210
site(location) 4 67354 477 0001
locationxsurvey 10 1490 221 0032
site(location)xsurvey 40 67331 477 0001
error 924 14108
Shadingdenotessignificanceatplt005
TRESBPKirraReefMarineBiotaMonitoring2015 32
frc environmental
Ascidians$
ThemeanabundanceofallascidiansotherthanPyura0stoloniferahasvariedsignifcantly between sites at Kirra Reef and Palm Beach Reef and between surveys at each site (Figure314andnotethesignificantinteractionbetweensite(location)xsurveyinTable 35) The abundance of ascidians was different between sites at Kirra Reef in January 2001May2003March2004February2005andApril2014HanddifferentatPalmBeach ReefinJanuary2001February2005February2010andMarch2015Theabundance ofascidiansvariedbetweensurveysateachsitewith1995beingmostdifferentwhenthe abundanceofascidianswaslow(AppendixD)InMarch2015theabundanceofallother ascidiansonKirraReefandPalmBeachReefwashigherthanpreviouslyreportedinthe baselinesurveyinApril1995(whennoascidianswererecorded)Themeanabundance washigheratKirraReefthanatPalmBeachReef(Figure314)
ThemeanabundanceofPyura0stoloniferahasvariedconsiderablybetweensitesatKirra Reef and Palm Beach Reef over time (note the significant interaction between site (location) x survey in Table 36) In March 2015 the mean abundance (individual per 025m2plusmnSE)of theascidianPstolonifera (Figure313)wassimilaratKirraReefand PalmBeachReef(Figure315)ThemeanabundanceofP0stoloniferahasrangedfrom 02to17individualsper025m2atbothreefssinceMay2003
Figure315 Mean abundance of ascidians (Pyura0 stolonifera) (individuals025m2)
(plusmnSE)atKirraReefandPalmBeachReefinallsurveys
TRESBPKirraReefMarineBiotaMonitoring2015 34
frc environmental
Table35 Univariate PERMANOVA results for the differences in cover of all ascidians otherthanPyura0stolonifera0betweensurveysandlocations
Factor$ df$ MS$effect$ PseudoF$ p$(perm)$
survey 10 26658 474 0001
location 1 13603 710 0104
site(location) 4 19154 149 0212
locationxsurvey 10 2629 468 0001
site(location)xsurvey 40 5621 438 0001
error 924 12828
Shadingdenotessignificanceatplt005
Table36 Univariate PERMANOVA results for the differences in Pyura0 stolonifera densitybetweensurveysandlocations
Factor$ df$ MS$effect$ PseudoF$ p$(perm)$
survey 10 16254 11842 0001
location 1 12445 60881 0206
site(location) 4 20442 56799 0001
locationxsurvey 10 79724 58082 0001
site (location) x 40 13726 38138 0001 survey
error 924 35991
Shadingdenotessignificanceatplt005
$
TRESBPKirraReefMarineBiotaMonitoring2015 35
frc environmental
Hard$Coral$
There was a significant difference between the cover of hard corals at Kirra Reef and PalmBeachReefduringsomesurveys(notethesignificantinteractionbetweenlocationx surveyinTable37)SpecificallytherewassignificantlymorehardcoralatPalmBeach Reef thanKirraReef inFebraury1996March2004April2014andMarch2015(Table 38)
ThecoverofhardcoralistypicallylowonKirraReefaccountingforlessthan2ofthe availablesubstrateInMarch2015hardcoralcoveredlessthan1oftheareaofKirra Reef which was less than the cover recorded during the baseline survey in April 1995 (Figure 316) In contrast hard coral covered 11 of the surface area at Palm Beach ReefwhichwasgreaterthanthecoverrecordedinApril1995(Figure316)
The cover of hard corals at Palm Beach Reef has been more variable over time comparedtothecoverofhardcoralatKirraReef(Figure316)Withtheexceptionofthe surveys inApril1995andJanuary2001when thecoverofhardcoralwas lowonboth reefshardcoralsaretypicallymoreprevalentatPalmBeachReef(Figure316)
Table38 PERMANOVA post hoc pairwise results for the differences in the cover of hardcoralbetweenlocationsineachsurveyevent
Hard$Corals$ Survey$
t$ p$(MC)$a$
Apr1995 054 0606
Jun1995 182 0140
Feb1996 541 0006
Jan2001 R R
May2003 166 0168
Mar2004 765 0001
Feb2005 049 0646
Feb2010 156 0197
Jul2012 283 0053
Apr2014 525 0011
Mar2015 695 0003 Shadingdenotessignificanceatplt005 a pvaluesbasedonMonteCarlotests
TRESBPKirraReefMarineBiotaMonitoring2015 37
60
50
40
30
20
10
0
Soft
Cor
al C
over
()
Kirra Reef Palm Beach Reef
frc environmental
Soft$Coral$
The cover of soft coral was significantly different between sites at both Kirra Reef and PalmBeachReefandduringsomesurveys(notethesignificant interactionbetweensite (location)xsurvey)TherewasnosoftcoralrecordedatKirraReefinMarch2015The coverofsoftcoralhasdeclinedatKirraReefsince2003andhascoveredlessthan2of theavailablesubstratesince2005whichissimilartothecoverofsoftcoraldescribedfor the baseline surveys in 1995 (Figure 317) The cover of soft coral was consistent betweensitesineachsurveyexceptbetweensitesin
sdot April1995atKirraReef
sdot 1996atKirraReef
sdot 2003atPalmBeachReefand
sdot 2014atPalmBeachReef(AppendixD)
Soft corals have historically covered more of the available space on Palm Beach Reef than on Kirra Reef However there was more temporal variability within sites at Palm BeachReefthanatKirraReef(AppendixD)ThecoverofsoftcoralatPalmBeachReef has varied over time and was highest in April 1995 (48 cover) Despite increasing sinceFebruary2005itisstilllowerthanthecoverrecordedduringthebaselinesurveyin April1995(Figure317)
Table39 UnivariatePERMANOVAresults for thedifferences in thecoverofsoft coral betweensurveysandlocations
Factor$ df$ MS$effect$ PseudoF$ p$(perm)$
survey 10 44657 1323 0001
location 1 32922 6620 0117
site(location) 4 49732 266 0036
locationxsurvey 10 40982 1214 0001
site (location) x 40 3376 181 0002 survey
error 924 18688
Shadingdenotessignificanceatplt005
$
TRESBPKirraReefMarineBiotaMonitoring2015 39
frc environmental
Crinoids$
ThereisasignificantdifferencebetweensomesitesatbothKirraReefandParmBeach Reef that varies through time (note the significant interaction between site (location) x survey inTable310) Theabundanceofcrinoidshasbeensimilarbetweensites inall years at Palm Beach ReefH and was different beween sites at Kirra Reef in June 1995 February1996May2003andFebruary2005(AppendixD)Withineachsitetherehas been some natural temporal variability particualrly at Palm Beach Reef sites in 2001 (Appendix D) The mean abundance (individuals 025m2) of crinoids (Figure 318) at KirraReefandPalmBeachReefhasgenerallybeenlessthan2individualsper025m2 andhasdeclinedatboth locationssincethebaselinesurvey inApril1995(Figure319) However the mean abundance of crinoids on Kirra Reef has shown a slight increase sinceFebruary2010(Figure319)
In March 2015 fewer crinoids were recorded at Palm Beach Reef than at Kirra ReefH crinoidshavebeenrareatPalmBeachReefsince2003
The species richness of fish recorded from Kirra Reef across all monitoring events has rangedfrom14to57 InMarch201557specieswereidentifiedat thereefwhichwas similar to April 2014 (53) and higher than previous surveys (Figure 320) Species richnessatPalmBeachReefwas lower(34species)andgenerallyvaried lessbetween surveyscomparedtoKirraReef
InMarch2015 the assemblage of fish at KirraReef comprised species fromall trophic levelsincludingdetritivoresplanktivoresherbivoresandcarnivores(AppendixE)Asin previous surveys the assemblage was dominated by herbivores and planktivores Yellowtail (Trachurus0 novaezelandiae) and striped sea pike (Sphyraena0 obtusata) were the dominant species present in large schools (Figure 321) Australian mado (Atypichthys0 strigatus) ringRtailed surgeon (Acanthurus0 blochii) silver trevally (Pseudocaranx0 georgianus) eastern pomfred (Schuettea0 scalaripinnis) sweep (Scorpis0 lineolatus) and various wrasses were also very abundant releative to other species (AppendixE)
Two new species were observed at Kirra Reef the orangeRband surgeon (Acanthurus0 olivaceus) and the unicornfish (Naso0 sp) Five new species were recorded at Palm BeachReef
No threatened or protected fish species listed under the Queenslandrsquos Nature0 Conservation0Act01992ornationallyundertheEnvironmental0Protection0and0Biodiversity0 Conservation0 Act0 1999 were observed The complete list of species recorded and the relativeabundanceispresentedinAppendixE
TRESBPKirraReefMarineBiotaMonitoring2015 42
60
0
10
20
30
40
50
Num
ber
of F
ish
Spe
cies
Apr-95
Jun-95
Feb-96
Jan-01
May-03
Mar-04
Feb-05
Feb-10
Jul-12
Apr-14
Mar-15
Kirra Reef Palm Beach Reef Location
frc environmental
Figure320 Number of fish species recorded at Kirra Reef and Palm Beach Reef on
ThegreatestchangetotheecologicalconditionofKirraReefsincethebaselinesurveyin 1995 has been the loss of large areas of hard substrate that support benthic flora and faunaThedeliveryoflargesandvolumesduringthestage1dredgingoperations(1995 to1998)andtheinitialoperationofthesandbypasssystem(2001to2008)resultedinan increaseinwaveactionandtidalcurrentsredistributingthissandoverKirraReef
The three major outcrops of Kirra Reef (northern southern and eastern sections) are naturally exposed and covered depending on water and sand movements In March 2015 the rocky outcrops in the northern section of Kirra Reef were exposed and supportedamoderatelydiversebenthicassemblagedominatedbyturfalgaeTherewas arelativelyhighfishdiversityatKirraReefTheecologicalassemblageexhibitedsignsof ongoingstressfromphysicaldisturbanceincludingtheabsenceofsoftcoralsandrarityof hardcoral(MumbyampSteneck2008)HoweverKirraReefhasarelativelyhighcoverof sponges and ascidians Sponges ascidians and crinoids were more abundant at Kirra ReefthanatPalmBeachReefinMarch2015
KirraReefcontinues toprovidehabitatandsupport importantecological functions in the region providing hard substrate for the colonisation of algae and benthic invertebrates and food and refuge for fish As sand levels have stabilised since 2008 assemblages have becomemoresimilar to those recordedprior to implementationof the TRESBP in April1995 Forexamplemacroalgalcover inApril1995andMarch2015wasrelatively similarHoweverassemblagecompositionisstillsignificantlydifferenttothatrecordedin thebaselinesurveysmostnoticeablyduetoa lowercoverofbaresubstrateandhigher coverofturfalgaeandascidianssincesurveyshavebeenperformed
Benthic$Macroalgae$
The cover of macroalgae at Kirra Reef was relatively similar during the 2014 and 2015 surveys and remained well below the peak of nearly 60 cover recorded in January 2001TherewasasteepdeclineinthecoverofmacroalgaebetweenJanuary2001and May2003whichappearedtobestronglyassociatedwith thedecline inreefareaduring that time as well as a decline in the cover of Sargassum sp (an important indicator speciesonKirraReef) SimilardeclineswereevidentatPalmBeachReefbetween the January2001andMay2003surveys
TRESBPKirraReefMarineBiotaMonitoring2015 45
frc environmental
The cover ofmacroalgae at Palm Beach Reef was much lower thanat Kirra Reef over time There are several possible reasons for the lower cover of macroalgae at Palm Beach
sdot PalmBeachReefisdeeperthanKirraReefandgenerallyhashigherturbidityand therefore greater light attenuation The quantity and quality of available light affectsthedistributionandgrowthofmacroalgae(MillerampEtter2008)
sdot Differences in the pattern of recruitment of algal species to the reefs due to differentwatercurrentsandtimingofthesurveys(Kennelly1987b)
sdot Increased competition with turf algae and sessile benthic invertebrates which competeforspacewithmacroalgae(Kennelly1987aHMillerampEtter2008)
sdot PresenceofdifferentspeciesandhigherdensityofherbivoresatPalmBeachReef (particularly sea urchins and herbivorous fish) which graze on macroalgae (McCook1997HJompaampMcCook2002)
Biological assemblages exposed to physical stress typically exhibit greater levels of temporalandspatialvariability(WarwickampClarke1993HChapmanetal1995)Temporal variationinthecoverofmacroalgaeatKirraReefislikelytobeprincipallyduetotheeffect ofphysicaldisturbance fromwaveactionaswellas theassociatedassociatedabrasion andsmotheringbysandTheeffectsofthesephysicaldisturbanceswouldincreasewith thereductionofKirraReefasedgeeffectsarepronouncedandwaterdepth isreduced Increasedsmotheringbysandcanalsoreducediversity(Hatcheretal1989)abundance recruitment growth survival and seasonal regeneration of macroalgae (Umar amp Price 1998HCheshireetal1999)
Changes in the cover of macroalgae on Kirra Reef over time are also likely due to the extentofthereefchangingHthefishandmobileinvertbratesassociatedwiththereefmay have concentrated which would in turn increase grazing pressure Increased grazing pressure from fish and mobile invertebrates can reduce the coverage and diversity of macroalgaeonreefs(McCook1997HJompaampMcCook2002)
Thecoverof turfalgaeatbothKirraReefandPalmBeachReefhasvariedsignificantly betweensurveysPriorto2005turfalgaetypicallycoveredlessoftheavailablesurface areaonKirraReefthanPalmBeachReefInMarch2015themeancoverofturfalgae hasincreasedsincebaselinesurveysin1995andwasrelativelysimilarbetweenreefs(40 plusmn4atKirraReefcomparedto48plusmn4atPalmBeachReef)Thecoverofturfalgaeat Kirra Reef was similar in 2014 and 2015 which was generally higher than previous surveysexceptduringJuly2012whencoverofturfalgaepeakedat67plusmn4
TRESBPKirraReefMarineBiotaMonitoring2015 46
frc environmental
Turfalgaearebecomingadominantcomponentofcommunitiesaroundtheworld likely the result of rapid colonisation of openspace after a disturbance (eg storms) nutrient enrichment andor changes in grazing pressures Turf algae can also reflect a more physically robust growth form suited to high wave energy environments (than foliose macroRalgae)TurfalgaepeakedintheJuly2012surveylikelyrelatedtotheincreasein bare reef exposure following a stormy conditions in early 2009 and between December 2011 and June 2012 Turf algae have been the dominant form of algae on Kirra Reef sincethistimealbeitthecoverlowerthanthe2012survey
Increased cover of turf algae is typically related to good light conditions high concentrationsofnutrientsandlownumbersofgrazerssuchasfish(orconstantgrazing pressure preventing macroalgae colonisation) However the relationship between algal dynamics physical disturbance water quality and herbivore grazing activity is complex andthecoverof turfalgaecanexhibitextremetemporalvariabilityasaconsequenceof the interactionbetween topRdownandbottomRupprocesses (Russ2003HBellwoodetal 2006H Hughes et al 2007H Albert et al 2008H Hoey amp Bellwood 2008H Mumby 2009) Furtherinvestigationwouldberequiredtoreliablydeterminethemechanismsofchangein bothmacroalgaeandturfalgaeassemblagesonthesereefs
Benthic$Macroinvertebrates$
AtKirraReeftheburialandreRemergenceofrockyoutcrops(influencedbytheTRESBP) islikelytohaveincreasedtemporalvariabilityinthedistributionandabundanceofbenthic macroinvertebrates Additional perturbations such as wave action and sand abrasion (each influenced through changes in bathymetry seabed topography and water depth) are likely to have resulted in the decline in cover and diversity of the benthic macroinvertebratesatKirraReefbetweensurveysparticularlybetweenMarch2004and February2005andduringtheseverestormsof2009Benthicmacroinvertebratessuch asascidiansspongeshardcoralandsoftcoralarehighlysusceptible to theeffectsof stormandwavedisturbancephysicalabrasionandburialbysand(KayampKeough1981H Walker et al 2008) which can affect settlement growth rate and survival (Dodge amp Vaisnys1977HRogers1990)
Physical disturbance from sand burial sand abrasion and the action of storm waves appeartokeepthebenthicassemblagesofKirraReefinastateofearlysuccessionItis commonforearlypioneerspeciessuchassomemacroalgaetorecruitrapidlytoahard surface in large numbers allowing these species to dominate assemblages early in the successionaltrajectory(Walkeretal2007)
Afurther indicatorof theearlystateofsuccessionatKirraReef isthatthecoverofhard and soft coral has remained very low (generally lt 5) In March 2015 less than 1
Benthic macroinvertebrate cover may also be affected indirectly through increased competitionwithmacroalgaeforspaceThepresenceoflargemacroalgaecanaffectthe recruitment and survival of sessile benthic invertebrates as fronds moving with wave action sweep and abrade the surface of rocks killing new recruits especially corals (Kennelly1989HMcCooketal2001)Itcantakeseveralyearsforhardandsoftcoralto become dominant on reefs in the SEQ region (SchlacherRHoenlinger et al 2009) Therefore hard coral is not expected to become abundant until several years after the reefhasbeenuncoveredandonlyifthephysicaldisturbanceregimeandsupplyofnew recruitsissufficienttosupportsurvivalandgenerationalsuccessionofthesespeciesThe coverofhardandsoftcoralsatKirraReefwerebothverylowandpatchypriortothestart oftheTRESBP
Sponges and ascidians are highly susceptible to smothering and sand abrasion unless theyhaveathicktunic(outercoveringmadeofkeratin)liketheascidianP0stolonifera0or strong internal keratin silicon or calcareous structures in the case of some species of sponges0(KayampKeough1981HMcGuinness1987HWalkeretal2008)Duetoincreased wave action and sedimentation (which can be influenced by the TRESBP) the mean coverofascidiansandspongeswasexpectedtobemuchloweronKirraReefthanPalm Beach Reef However in March 2015 the cover of sponges was similar between the reefsandthecoverofascidians(otherthanP0stolonifera)wasgreateratKirraReefthan at Palm Beach Reef This suggests that Kirra Reef is slowly recovering from the increasedstressofphysicaldisturbancesuchas increasedwaveactionandsandscour andorthatwaveandstormconditionshavebeenlesssevereinthepastfewyears
Fish$
KirraReefcontinuestosupportahighdiversityofreefRassociatedandpelagic(ienonR reefassociated) fishspecies Despite itsdiminishedsizecompared to1995KirraReef continuestoprovidevaluablehabitatforanumberoffishspeciesfromdifferentfunctional groups
ThereisahighdegreeofinterRannualvariabilityinthespeciesandabundanceofthefish present at Kirra Reef compared with the assemblage at Palm Beach Reef This likely reflectsthetemporalvariabilityintheavailablehabitatasaconsequenceofreefburialand reRemergenceThediversityqualityandarealextentofreefhabitatareimportantfactors influencing the distribution abundance biomass and diversity of reef fish (Bellwood amp Hughes2001HFriedlanderetal2003)Diversityandabundanceoffishcanincreasewith
TRESBPKirraReefMarineBiotaMonitoring2015 48
frc environmental
greaterstructuralcomplexityandincreasedheterogeneityofavailablehabitats(Bellwood ampHughes2001)Thissuggeststhatperiodsofreefburialreducetheoveralldiversityof reefRassociated fish species at Kirra Reef Despite the reduction in overall reef space therewasalargervarietyofhabitats(suchasmarcoalgaeandturfalgae)in2015which was likely to be related to the high diversity of fish assemblages This is particularly importantforseveralspeciesthatdependonthepresenceoflsquostructurersquosuchasprovided by reef habitat (ie oldwife moray eels damselfish and Australian mado that were recordedinMarch2015butwerenotrecordedinJuly2012)
Theabundanceanddiversityof fishare likelytobenegativelyaffectedfollowingperiods of severe weather which create unfavourable conditions for many species and may further exacerbate the affects of abrasion and sedimentation The biomass of fish is knowntodecreasewithincreasingexposuretophysicaldisturbancefromwaveactionand strong currents (Friedlander et al 2003) As our surveys have been undertaken at different times of the year variation in the prevailing conditions at the time of sampling could also influence the types of fish observed (and the amount of reef habitat that is availableatanytime)Manyofthespeciesmayalsobeaffectedbyseasonalchangesin the water temperature such as damselfish which are less abundant in cool waters However theoveralldiversityof the fishassemblageatKirraReef is likely toreflect the sizeoftheoutcropsexposedwithagreaterphysicaldisturbance(fromseaconditionsand sandmovement)andcompetitionHandlesserfoodavailablewhenthereefiscovered
ThepredictedimpactstoKirraReefasaresultoftheTRESBPincludedaccretionofsand around the base of the rock outcrops causing a reduction in extent of reef It was predictedthatsanddeliveryaspartoftheprojectwouldeventuallymimiclsquonaturalrsquopatterns ofsanddispersalandthatthereefwouldreturntoitsnaturalextent(ietheextentpriorto extension of the Tweed River training walls in 1962) The benthic flora and fauna assemblages of the reef the historical reef extent and natural sand transport patterns wereexpectedtoreturntoconditionsobservedbeforetheextensionofthetrainingwalls between 1962 and 1965 However the Environmental Impact Study did not predict the ecologicalconsequencesofboththereducedarealextentandincreasedwaveenergy(a consequenceofdecreaseddepth)thathavebeenrecorded
ThecurrentextentofKirraReef remains less than50of that recorded in1962and in 1995beforethesanddeliverybytheTRESBPcommencedHowevertheextentofreef in1995 wasstrongly influenced by adepletion in sand following the construction of the Tweed River training walls and the Kirra Point groyne Accumulation of sand on Kirra ReefwasobservedtoincreaseasaresultofindirectsandnourishmentbytheTRESBP and the reef has been extensively covered (particuarly between 2005 and 2010) as a result
Whiletheextentofthereefcontinuestochangeovertimethedeliveryofsandaspartof the project now more closely matches the natural rate of longshore sand transport ShortRtermandseasonalchangesintheextentofthereefarenowlikelytobetheresultof waveandcurrentaction(particularlyduringservereweatherevents)thanadirectimpact of the TRESBP Therefore the extent of Kirra Reef in March 2015 is broadly in accordancewithpredictionsmadeintheEISwhichpredictedthatthereefwouldreturnto a condition similar to that exhibited in the preR1960rsquos ie before the extension of the TweedRiverbreakwatersthatinterruptedlittoralsandsupplytothesebeaches
InDecember2013KirraPointgroynewasextendedby30mwiththeexpectationthatthe beach bar would move seaward as a consequence At present Kirra Point groyne is unlikelytohavehadamajorimpactonthearealextentofKirraReefHoweverongoing monitoringbasedonaerialphotographsmayprovidefurtherinsight
Sessile benthic assemblages on Kirra Reef are highly susceptible to the influence of storms and associated wave action (Kay amp Keough 1981H Walker et al 2008) The shallowreefissurroundedbymobilesandwhichcanshiftnaturallyinresponsetowave action during storms causing burial of large sections of Kirra Reef This effect has reduced the availability of rocky substrate for colonisation and the availability of refuge
Fromanexaminationof theextentofKirraReef fromarealmapsandwaveheightdata thereappears tobea relationshipbetween theareaof rockexposedandstormevents Notably in a series of storm events in May 2009 corresponds with large areas of rock becoming exposed (with the reef approximately 100m2 in 2006 and approximately in 1009m2 2009) Further a stormy conditions between December 2011 and July 2012 correspondstotheareaofexposedrockmorethandoublinginsizeWhiletherewasno changetothetotalareaofexposedrockfollowingstormyconditionsinearly2013there wasaclearchangeinthedistibutionofexposedrockduringthistimeSince2013storm conditions have been calm to moderate and there has been little change in the areal extentanddistrubtionofexposedrockatKirraReef
WaveheighttypicallyincreasesduringstormeventsandgiventheshallowdepthofKirra Reef waves are more likely to shoal and break across the reef during storms This increases thephysicaldisturbanceabrasionandsedimentationofbenthicassemblages onKirraReefStormdisturbancecancauselocalreductionsinthespeciesrichnessand abundanceofcoral(Woodleyetal1981HMasselampDone1993HHughes1994HConnellet al 1997) and can alter fish assemblages indirectly through habitat modifications (Kaufman1983HJonesampSyms1998)ordirectlybyincreasingfishmortality(Lassig1983) The hydrodynamic forces produced by wave action are an important source of disturbance in subtidal habitats inflicting damage through direct physical impact and abrasion(UnderwoodampKennelly1990)DirectimpactsfromphysicaldisturbanceatKirra Reefareevidentduringsurveyeventswhenlargefragmentsofmacroalgaearepresentin thewatercolumnoverthereef
Storm and wave action (and associated sedimentation and abrasion) continue to be importantforcesshapingthedistributionandabundanceofbenthicspeciesatKirraReef Increased magnitude and frequency of physical disturbance resulting from increased exposureorsusceptibility tostormsandassociatedwaveaction (asonKirraReef)can lead to a decrease in the diversity of sessile invertebrate assemblages DisturbanceR drivenreductionsinbiodiversityhavethepotentialtoimpactnegativelyonthehealthand productivity of reef ecosystems (Walker et al 2008) Biodiversity is important to reef health given that many of these species (eg sponges bryozoans and ascidians) contribute a range of vital ecosystem services to reefs including nutrient cycling (Scheffers et al 2004) trophic interactions and food webs (Lesser 2006H Pawlik et al 2007) bioRerosion (Rutzler 2002H LopezRVictoria et al 2006) and stabilizing substrata (DiazampRutzler2001HWulff2001)
Theimpactsof increasedwaveactionandsedimentationonthebenthicassemblagesat Kirra Reef are likely to be greatest during and immediately following storm conditions
TRESBPKirraReefMarineBiotaMonitoring2015 51
frc environmental
Partitioningtheinfluenceofstormandwavedrivendisturbancefromthatoftheoperation oftheTRESBPwouldrequireamuchmorestatisticallypowerfulandtemporilyreplicated experimental design Given there is a large collection of wave and storm data by TRESBP this would involve greater temporal sampling of Kirra Reef including event samplingfollowingseverewaveandstormactivity
The data generated by this Kirra Reef biota monitoring program doesnrsquot support statistically rigorous consideration of seasonality (monitoring has been at its most frequentannual)
InApril2014andMarch2015KirraReefcoveredlessthan50ofthereefrsquosextentprior to theoperationof theTRESBP The lossof reefhabitathasreducedtheavailabilityof hard substratum available for colonisation and consequently the abundance of benthic sessileassemblages
The reduced depth of water resulting from the accumulation of sand exacerbates the effects of storms and wave action It is likley that as a consequnece the biological communities of Kirra Reef will reflect earlyRstage succession more frequently and for longerperiods
While there is sufficient structure available frcenvironmentalexpect that Kirra Reef will continuetoprovideimportanthabitatforadiverseassemblageoffishes
TRESBPKirraReefMarineBiotaMonitoring2015 52
frc environmental
5$ Conclusions$
Although there is still a substantial portion of the reef covered compared to before the extension of the Tweed River entrance breakwaters the current extent of Kirra Reef is broadly inaccordancewithpredictionsmadein theEIS Initial lsquocatchRuprsquobypassingand dredgeplacementofsand(between2001and2008)resulted in theburialofKirraReef Subsequentsanddelivery(since2008onwards)morecloselyreflectsnaturalpatternsof longRshoresandtransportandisthereefhasslowlyreRemerged
Theextentofthereefhasbeenrelativelystablesince2013Thishasallowedforsome succession in the benthic assemblages including a relatively high cover of sponges ascidiansandcrinoidsWiththedeliveryofsandmorecloselymatchingthenaturalrateit isexpected the reef willundergoshortRtermchanges in extentdue toseasonal shifts in sand deliveryH however the diversity of benthic assemblages on Kirra Reef is likely to increaseovertimeThiswouldcreatemorespaceforspeciestorecruitandreducesthe influence of sand abrasion and wave damage It was predicted that the areas of Kirra Reef newly exposed in 2012 would undergo a shift from turfRdominated communities to more diverse communities that could include macroalgae sponges ascidians and potentiallyhardandsoftcoralWiththeexceptionofhardandsoftcoralsthisprediction wasconfirmedbytheresultsoftheApril2014andMarch2015surveys
ThediversityoffishesassociatedwithKirraReefisbroadlysimilartothatrecordedprior tothecommencementofsandbypassingin1995Giventhatfisharemobilethegreatest impacts on fish assemblages are likely to be shortRterm changes due to both the prevailingconditionsandchangestheextentofavailablehabitatthatprovidesshelterand foodforavarietyofdifferentspeciesIfKirraReefincreasesinsizethereislikelytobea greater proportion of cryptic benthic species as these species are more typical of assemblagesinalaterstageofsuccession(eg(WillisampAnderson2003))
Assuming a broadly stable delivery rate of sand and consequent stable extent of Kirra ReeflsquorecoveryrsquoislikleytobesubstantivelycompleteFloralandfaunalcommunitieswill undergo succession between severe storm events but are likley to remain relatively dynamic
Albert S Udy J amp Tibbetts I 2008 Responses of algal communities to gradients in herbivorebiomassandwaterqualityinMarovoLagoonSolomonIslandsCoral0 Reefs2773R82
Anderson MJ 2001 A new method for nonRparametric multivariate analysis of varianceAustral0Ecology2632R46
Anderson MJ 2004 PERMDISP0 a0 FORTRAN0 computer0 program0 for0 permutatinoal0 analysis0 of0 multivariate0 dispersions0 (for0 any0 twoSfactor0 ANOVA0 design)0 using0 permutational0 tests Department of Statistics University of Auckland New Zealand
Cannon LR Goeden GB amp Campbell P 1987 Community patterns revealed by trawling in the interRreef regions of the Great Barrier Reef Memoirs0 of0 the0 Queensland0Museum2545R70
Chapman MG Underwood AJ amp Skilleter GA 1995 Variability at different spatial scalesbetweenasubtidalassemblageexposedtothedischargeofsewageand two control assemblages Journal0 of0 Experimental0 Biology0 and0 Ecology 189 103R122
Cheshire AC Miller DJ amp Stewart R (1999) Effect0 of0 dispersed0 sediment0 plumes0 from0beach0sand0replenishment0dredging0on0recruitment0of0phaeophycean0algae0 to0rocky0reefs0in0Gulf0St0Vincent0South0Australia0The0Impact0of0Sand0Dredging0 on0 Benthic0 Community0 Structure0 at0 the0 Port0 Stanvac0 Dredge0 Site0 20 1S39 UniversityofAdelaideAdelaide
ConnellJHHughesTPampWallaceCC1997A30Ryearstudyofcoralabundance recruitment and disturbance at several scales in space and time Ecological0 Monographs67461R488
Diaz MC amp Rutzler K 2001 Sponges an essential component of Caribbean coral reefsBulletin0of0Marine0Science69535R546
DodgeREampVaisnysJR1977Coralpopulationsandgrowthpatternsresponsesto sedimentation and turbidity associated with dredging Journal0 of0 Marine0 Research35715R730
Done TJ 1982 Patterns in the distribution of coral communities across the central GreatBarrierReefCoral0Reefs195R107
Edwards RA amp Smith DA 2005 Subtidal assemblages associated with a geotextile reef insouthReastQueenslandAustraliaMarine0and0Freshwater0Research56 133R142
FisheriesResearchConsultants1991Survey0of0the0Intertidal0and0Subtidal0Rocky0Reefs0 of0 the0 Sunshine0 Coast report prepared for Queensland National Parks and WildlifeService
HarrisonPHarriotVBanksSampHolmesN1998ThecoralcommunitiesofFlinders Reef andMyora Reef in theMoretonBay MarineParkQueensland Australia In Moreton0 Bay0 and0 Catchment Tibbits I Hall N amp Dennison W (Eds) SchoolofMarineScienceUniversityofQueenslandStLuciapp525R536
Hatcher B Johannes R amp Robertson A 1989 Review of research relevant to the conservationofshallowtropicalmarineecosystemsOceanography0and0Marine0 Biology0an0Annual0Review27337R414
Hoey A amp Bellwood D 2008 CrossRshelf variation in the role of parrotfishes on the GreatBarrierReefCoral0Reefs37R47
TRESBPKirraReefMarineBiotaMonitoring2015 56
frc environmental
Hollingsworth P 1975 Environmental Investigation Report Crown Reserve R R68 Currumbin Creek City of the Gold Coast Land Administration Commission unpublishedreport
Hughes TP 1994 Catastrophes phase shifts and large scale degradation of a CaribbeancoralreefScience2651547R1551
Hughes TP Rodrigues MJ Bellwood DR Ceccarelli D HoeghRGuldberg O McCook L Moltschaniwskvi N Pratchett MS Steneck RS amp Willis B 2007Phaseshiftsherbivoryandtheresilienceofcoralreefstoclimatechange Current0Biology17360R365
Hutchinson A Rempel C Taveras V Loder J amp Salmond J 2013 Reef0 Check0 Australia0 South0 East0 Queensland0 Summary0 Report0 2013 report prepared for ReefCheckFoundationLimited
Hyder Consulting 1997 Tweed0 River0 Entrance0 Sand0 Bypassing0 Project0 Permanent0 Bypassing0 System0 0 Environmental0 Impact0 Statement0 0 Impact0 Assessment0 Study report prepared for New South Wales Department of Land and Water Conservation
Jompa J amp McCook LJ 2002 Effects of competition and herbivory on interactions betweenahardcoralandabrownalgaJournal0of0Experimental0Marine0Biology0 and0Ecology27125R39
KayAMampKeoughMJ1981Occupationofpatchesintheepifaunalcommunitieson pier pilings and the bivalve Pinna bicolor at Edithburgh South Australia Oecologia48123R130
KennellyS1987aInhibitionofkelprecruitmentbyturfingalgaeandconsequencesfor an Australian kelp community Journal0 of0 Experimental0 Marine0 Biology0 and0 Ecology11249R60
Kennelly S 1987b Physical disturbances in an Australian kelp community I temporal effectsMarine0Ecology0Progress0Series40145R153
TRESBPKirraReefMarineBiotaMonitoring2015 57
frc environmental
Kennelly S 1989 Effects of kelp canopies on understory species due to shade and scourMarine0Ecology0Progress0Series50215R224
Lassig BR 1983 The effects of a cyclonic storm on coral reef fish assemblages Environmental0Biology0of0Fishes955R63
Lawson S McMahon J amp Boswood P 2001 Environmental management of the construction and operation of a sand bypassing system at the Tweed River EntranceInThe15thAustralasianCoastalandOceanEngineeringConference the 8th Australasian Port and Harbour Conference 25 R 28 September 2001 QueenslandAustralia
Lesser MP 2006 BenthicRpelagic coupling on coral reefs feeding and growth of Caribbean sponges Journal0 of0 Experimental0 Marine0 Biology0 amp0 Ecology 328 277R288
LopezRVictoriaM ZeaSampWei E2006 Competition for spacebetweenencrusting excavatingCaribbeanspongesandothercoral reeforganismsMarine0Ecology0 Progress0Series312113R121
MalcolmHASmithSDAampJordanA2009Usingpatternsofreeffishassemblages to refine a Habitat Classification System for marine parks in NSW Australia Aquatic0Conservation0Marine0and0Freshwater0Ecosystems2083R92
Massel SR amp Done TJ 1993 Effects of cyclone waves on massive coral assemblages on the Great Barrier Reef meteorology hydrodynamics and demographyCoral0Reefs12153R166
Mumby PJ amp Steneck RS 2008 Coral reef management and conservation in light of rapidly evolving ecological paradigms Trends in Ecology amp Evoution 23 555 -563
Murphy HM amp Jenkins GP 2010 Observational methods used in marine spatial monitoring of fishes and associated habitats a review Marine and Freshwater Research 61 236-252
Noriega R 2007 An Overview of Available Information on Sandy Beach Ecology Coastal Sand Dunes Rocky Reefs and Associated Biota on the Gold Coast Griffith Centre for Coastal Management Research Report No 85 report prepared for Griffith University
Parker P (1995) Structure to Reef Fish Assemblages at Julian Rocks Northern New South Wales Masters Thesis Griffith University
Parker PG 1999 Fish assemblages at Julian Rocks and the adjacent waters of northern New South Wales Australia Australian Zoologist 31 134 - 160
Pawlik JR Steindler L Henkel TP Beer S amp Ilan M 2007 Chemical warfare on coral reefs sponge metabolites differentially affect coral symbiosis in situ Limnology and Oceanography 52 907-911
Reef Check 2010 httpwwwreefcheckaustraliaorgdatahtml accessed December 2015
Robinson KI amp Pollard DA 1982 Marine and estuarine reserves in Australia with particular reference to New South Wales Wetlands 2 17 - 26
Rogers CS 1990 Responses of coral reefs and reef organisms to sedimentation Marine Ecology Progress Series 62 185-202
Russ GR 2003 Grazer biomass correlates more strongly with production than with biomass of algal turfs on a coral reef Coral Reefs 22 63-67
Rutzler K 2002 Impact of crustose clionid sponges on Caribbean reef corals Acta Geologica Hispanica 37 61-72
Scheffers SR Nieuwland G Bak RPM amp van Duyl FC 2004 Removal of bacteria and nutrient dynamics within the coral reef framework of Curacao (Netherlands Antilles) Coral Reefs 23 413-422
TRESBP Kirra Reef Marine Biota Monitoring 2015 59
frc environmental
Schlacher-Hoenlinger M Walker S Johnson J Schlacher T amp Hooper J 2009 Biological Monitoring of the Ex-HMAS Brisbane Artificial Reef Phase II - Habitat Values report prepared for Environmental Protection Agency (EPA)
Smith KA 2003 A simple multivariate technique to improve the design of a sampling strategy for age-based fishery monitoring Fisheries Research 64 79-85
Smith S Edwards R Dalton S amp Harrison M 2005 Biological assessment of fish and benthic communities at Palm Beach Bait Reef Gold Coast Queensland report prepared for University of New England
TRESBP 2014 Autum 2009 storms httpwwwtweedsandbypassnswgovauarticles-and-studiesinteresting-itemsautumn-2009-storm updated 4 May 2014 accessed December 2015
TRESBP 2015a Tweed Sand Bypassing Restoring Coastal Sand Drift Improving Boating Access ndash Techinical information httpwwwtweedsandbypassnswgovau__dataassetspdf_file0004552055kir ra-feb-2015pdf acessed December 2015
TRESBP 2015b Waves httpwwwtweedsandbypassnswgovauenvironmental-monitoringcoastal-conditionswaves updated 30 September 2015 accessed December 2015
Umar MJMLJ amp Price IR 1998 Effects of sediment deposition on the seaweed Sargassum on a fringing coral reef Coral Reefs 17 169-177
Underwood AJ amp Kennelly SJ 1990 Ecology of marine algae on rocky shores and subtidal reefs in temperate Australia Hydrobiologia 192 3-20
Walker S Schlacher T amp Schlacher-Hoenlinger M 2007 Spatial heterogeneity of epibenthos on artificial reefs fouling communities in the early stages of colonization on an East Australian shipwreck Marine Ecology 28 435-445
Walker SJ Degnan BM Hooper JNA amp Skilleter GA 2008 Will increased storm intensity from climate change affect biodiversity in non-scleractinian sessile fauna on coral reefs Global Change Biology 14 2755-2770
Warwick RM amp Clarke KR 1993 Increased variability as a symptom of stress in marine communtities Journal of Experimental Marine Biology and Ecology 172 215-216
Thenumberofsitessurveyedhasvariedover timeasaresultof the fluctuating levelof sandcoveringKirraReef
Prior to May 2003 three sites were assessed along the eastern and northern edge of KirraReef(KirraReefOutersites1to3)andthreesiteswereexaminedalongtheinshore marginof the reef (KirraReef Inner sites1 to 3)(MapA1) ReefRedge (ieKirraOuter) siteswerechosentoprovideearlywarningofimpactsfromoffshoreplacementofdredged sandwhilst inshoresites(ieKirraInner)werechosentoindicatewhetherimpactsfrom inshore beach profile development were affecting the reef platform In May 2003 the threeeasternsitesatKirraReef (ieKRO1KRO2andKRI1)werecompletelycovered with bare mobile sand Consequently only the three western sites at Kirra Reef (ie KRO3KRI2andKRI3)supportedbenthicfloraandfaunaInMarch2004theextentof the remainingwesternoutcropof KirraReef had been further reduced so that all inner reefsiteswerecompletelycoveredwithmobilesandConsequentlyonlyasingleoriginal reefsite(ieKRO3)couldbesurveyed(Figure23)Thereforetoprovideanindicationof the condition of the remaining reef two new sites were established (ie KRN1 and KRN2)(Figure23)andsurveyedinMarch2004Theextentofthewesternreefhadbeen further reduced by February 2005 and a third new site (ie KRN3) was established (Figure23)Consequentlyfoursites(KRO3KRN1KRN2andKRN3)weresurveyedin February2005
InFebruary2010fourKirraReefsites(ieKRO3KRO1KRN1andKRN2)wereclearof thesurroundingsandandsupportedbenthic floraand fauna Inaddition several rocks protruded from the sand in the vicinity of site KRI2H these were assessed to provide a quantitativeindicationofbroadRscaletemporalchangestotheinshorereefcommunities
SOURCEScopy Copyright Commonwealth of Australia (Geoscience Australia) 2001 2004 2006copy The State of Queensland (Department of Natural Resources and Mines) 2015copy Nearmap 2014 2015
DATE2015-09-09
DRAWN BYCF
VERSION02
PROJECTIONCoordinate System GDA 1994 MGA Zone 56Projection Transverse MercatorDatum GDA 1994
plusmn SCALE
0 50 100
Metres
Scale 12500 A3
frc environmental
Appendix$B$ Introduction$to$Data$Analysis$Used$
Multivariate$Analyses$
Multivariate statistical techniques are widely used in ecology to assess the similarities relationshipsbetweenassemblagesWhereasunivariateanalysescanonlycompareone variable at a time (eg an index of community structure such as a diversity index or a singleindicatorspecies)multivariateanalysescancomparesamplesbasedontheextent thatassemblagesshareparticulartaxaandabundances(ClarkeampWarwick2001)
Thefirststepofmultivariateanalysisusuallyinvolvesthecreationofamatrixofsimilarity coefficients computed between every pair of samples The coefficient is usually a measureofhowclose theabundance is foreachspecies (definedso that100= total similarity and 0=complete dissimilarity) The Bray Curtis similarity measure is commonlythemostappropriateforbiologicaldata(ClarkeampWarwick2001)
MultidimensionalScaling
NonRmetricmultiRdimensionalscalingordinations(nMDS)attempttoplacesamplesintwo dimensionalspacesothattherankorderofthedistancesbetweensamplesmatchesthe rankorderofthematchingsimilaritiesfromthesimilaritymatrix(ClarkeampWarwick2001) Thisprovidesavisualrepresentationofthesimilaritiesbetweenassemblageswithineach sampleEachoftheaxesisnotrelatedtoanyparticularvalueHinfactaxescanberotated toprovide thebestvisual representationof thedata Ordinationsareparticularlyuseful tools for analysing and visually presenting differences between assemblages Ordinationsareessentiallymapsofsamples inwhich theplacementofsampleson the mapreflectsthesimilarlyofthecommunitytothecommunitiesinothersamples(Clarkeamp Warwick 2001) Distances between samples on an ordination attempt to match the similarities inassemblagestructurenearbypoints representassemblageswithvery few attributes(speciesorabundanceofspecies)Hpoints faraparthavevery fewattributes in common(ClarkeampWarwick2001)
A stress coefficient is calculated to reflect the extent to which the multiRdimensional scalingordinationandthesimilaritymatrixagree(ClarkeampWarwick2001)(iehowwell the multiRdimensional scaling ordination accurately reflects the relationship between samples)Stressvaluesoflt015aregenerallyacceptable
In Figure A1 each freshwater macroinvertebrate sample is represented on the multiRdimensionalscalingordination By lookingat thedistancesbetweeneachsample
ANOSIMisanalogoustoANOVAinunivariatestatistics(Smith2003)AglobalRstatistic iscalculatedtodeterminewhetherthereisasignificantdifferencebetweenallsamplesIf there are differences then pairwise comparisons are conducted to test for differences betweenpairsofsamples(analogoustopostRhoctestsinANOVA)
The R value lies between R1 and +1 (all similarities within groups are less than any similarity between groups) with a value of zero representing the null hypothesis (no differenceamongasetofsamples)(ClarkeampWarwick2001)ComparisonofpairwiseR values can give an indication of how different assemblages are R values close to 0 indicatelittledifferencevaluesaround05indicatesomeoverlapandvaluescloseto1to indicate many or substantial differences In many instances however researches are primarily interestedinwhethertheRvalueisstatisticallydifferentfromzero(usuallyata confidence level of 005) (Clarke amp Warwick 2001) (ie whether they can reject the null hypothesis)
ANOSIM can provide information on whether the (visual) differences between assemblages in the multiRdimensional scaling ordination are significantH it is an independenttestfromthemultiRdimensionalscalingordinationItisbasedontestingthe
TRESBPKirraReefMarineBiotaMonitoring2015 B2
frc environmental
differences between the rank similarities in the similarity matrix not on the distances betweensamplesinthemultiRdimensionalscalingordination(ClarkeampWarwick2001)
PermutationalMultivariateAnalysisofVariance
PERMANOVAisusedtotestsimultaneousresponsesofoneormorevariablestooneor more factors in an a0 priori0 structured design using random permutation of the data to assess significance (Anderson 2004) PERMANOVA generates a pseudo FRstatistic similar to traditional ANOVA but pRvalues are calculated with permutations which does notassumenormaldatadistribution PERMANOVAcanprovide informationonwhether the (visual) differences between assemblages in a multiRdimensional scaling ordination are significantH however it is an independent test from the multiRdimensional scaling ordination
Thelevelofmultivariatedispersionamongsampleswithineachofthetestgroupscanbe examined using the permutational analysis of multivariate dispersions (PERMDISP) routine(Anderson2004)Intraditionalimpactassessmentachangeinthedispersionof datacanalsoindicateanimpact
SimilarityPercentagendashSpeciesContributions
SIMPER analysis provides information on how dissimilar assemblages from various groups are (eg how similar all of the macroinvertebrate samples taken for a particular habitatwithinastreamreachare)andhowsimilareachgroup(egreach)istoanyother group SIMPER analysis also identifies the species taxa that are contributing to the dissimilarity between two assemblages in rank order (ie it identifies which species is contributingthemosttothedifferences)SIMPERanalysismayhelptoidentifypotential lsquoindicatorrsquospeciesForexampleifaparticularspeciesconsistentlycontributesgreatlyto the differences between impacted and unimpacted assemblages it may be a useful indicator Theabundanceofthis indicatorspeciescanthenbecomparedbetweensites usingunivariatetechniquessuchasANOVA
Data is available on request from tresbpprojectofficecrownlandnswgov
TRESBPKirraReefMarineBiotaMonitoring2015 C1
frc environmental
Appendix(D( Pairwise( PERMANOVA( Results
Data is available on request from tresbpprojectofficecrownlandnswgov
TRESBPKirraReefMarineBiotaMonitoring2015 D1
frc environmental
Appendix(E( Relative(Abundance(of(Fish(found(at(Kirra(( ( and(Palm(Beach(Reefs(in(Each(Survey((Data is available on request from tresbpprojectofficecrownlandnswgovau
TRESBPKirraReefMarineBiotaMonitoring2015 E1
Structure Bookmarks
0 50 100 Metres Scale 12500 A3
0 50 100 200 Metres Scale 15000 A3
Kirra Reef
Kirra Reef
Kirra Reef
Kirra Reef
Kirra Reef
Kirra Reef
Map A1Location of Kirra Reef monitoring sites
Table D8 Pairwise comparison of macroalgae cover between sites in each year
Table D15 Pairwise comparison of turf algae cover between sites in each year
Table D29 Pairwise comparison of ascidian cover between sites in each year
Table D43 Pairwise comparison of soft coral cover between sites in each year
frc environmental
2$ Methods$
The methods used in the March 2015 survey were developed for the Stage I survey completed in April and June 1995 and used for subsequent surveys February 1996 January 2001 May 2003 March 2004 February 2005 February 2010 July 2012 and April2014 Datawere collected from KirraReef (2816251535309) andPalmBeach Reef(2810751534774)locatedapproximately9kmnorth(Figure21)
Themainobjectiveof the monitoring was to investigateanychange in the marinebiota and habitat of Kirra Reef compared to Palm Beach Reef (comparative reef) in order to assesstheeffectofthesandbypassproject(andsubsequentincreasesinsandload)on theecologyofKirraReef
0 2 41
Kilometres
Service Layer Credits Sources Esri HERE DeLorme Intermap increment P Corp GEBCO USGS FAO NPS NRCAN GeoBase IGN Kadaster NL Ordnance
0 2 41
Kilometres
Service Layer Credits Sources Esri HERE DeLorme Intermap increment P Corp GEBCO USGS FAO NPS NRCAN GeoBase IGN Kadaster NL Ordnance
Threesites(KRN1KRN2KRO3)atKirraReef(waterdepth5to8m)weresurveyedin March 2015 (Map 1) The remainder of the sites previously surveyed were covered by sand(refertoappendixAforahistoryofsitespreviouslysurveyed)Threecomparative sites (PB1 PB2 and PB3) were also surveyed at Palm Beach Reef (water depth 12 to 17m)(Map2)
TRESBPKirraReefMarineBiotaMonitoring2015 12
orth NetreStkicrraG
Marine Parade
t eertS ickr
M rarin ae Pa Grade
Musgrave St
t
re ee e Powel t r lt CrescenS t t es eel ri tM S
t ee ge drt u tleS d Rro MuL sgrave Street
LEGEND 0 1 Km Tweed River E ntrance Sand Bypassing Project Survey Site Road Network
copy Copyright Commonwealth of Australia (Geoscience Australia) 2001 2004 2006copy The State of Queensland (Department of Natural Resources and Mines) 2015copy Nearmap 2014
DATE2015-03-24
DRAWN BYCF
VERSION01
PROJECTIONCoordinate System GDA 1994 MGA Zone 56Projection Transverse MercatorDatum GDA 1994
plusmn SCALE
0 50 100 200
Metres
Scale 15000 A3
Gold Coast Highway
i
PalmBeach
Tugun
Coolangatta
0 1 Km
frc environmental
22$ Benthic$Flora$and$Macroinvertebrates$
At each site benthic assemblages were surveyed in fifteen 025m2 quadrats with the percentcoverofbenthicmacroalgaeturfalgaespongesascidianshardcoralsandsoft coralsassessedvisually(Figure22)Quadratswereplacedhaphazardlywhichincluded horizontal and sloping surfaces The minimum distance between quadrats was approximately2m Thenumberof largeascidians (Pyurastolonifera)crinoids (feather stars)barnaclesurchinstubewormspolychaeteshydroidszoanthidsandcowriesand the dominant species of macroalgae were also recorded and quantitative notes were madeontheapparenthealthofeachtaxonomicgroup
ThespeciesrichnessandrelativeabundanceoffishatKirraReefandPalmBeachReef were assessed using a combination of underwater visual census (UVC) and video surveys The combination of these techniques represents the most costeffective and efficientmeansofobtainingdataonthestructureoffishassemblagesindifferenthabitats (Murphy amp Jenkins 2010) A baited remote underwater video (BRUVX baited with pilchards) and footage captured by a diver swimming hapazard trasects over the reef wererecorded
Video footage from each BRUV (approximately 20minutes) and video transects (approximately 35 minutes) was reviewed by an ecologist experienced in marine fish identification
24$ Data$Analysis$
Permutational multivariate analysis of variance (PERMANOVA) was used to determine differences in the composition (cover of benthic fauna and taxonomic group) of benthic assemblagesbetweenKirraReefandPalmBeachReefover time PERMANOVAuses permutational methods (PsuedoAF) to derive statistical significance which require fewer assumptionstobemetthananalogousmethodssuchasmultivariateanalysisofvariance (MANOVA) (Anderson 2001X Anderson et al 2008) This analysis enables an examinationofchangesinthecommunityasawhole
A three factor PERMANOVA was used to examine differences in the composition of benthic assemblages with survey (fixed factor) locations (Palm Beach Reef and Kirra Reeffixedfactor)andsites(nestedinlocationsasarandomfactor)asthefactorsData weresquareroot transformedtodownweightdominatingspeciesabundanceXconverted toaBrayCurtisdistancematrixXandtestedforsignificanceusingasmanypermutations as allowed (9800 to 9937 unique permuations achieved for all factors and factor combinationsXexceptlocationwhere10uniquepermutationswereachieved))Posthoc pairwisetestwasusedtodeterminethemagnitudeofdifference
Nonmetricmultidimensionalscaling (nMDS)ordinationswereused tovisually represent the variation in the composition of assemblages between reefs separately for each survey nMDS ordinations were also used to visually represent the variation in the compositionofassemblagessurveysatKirraReefforallsurveysXbaselinesurveyinApril 1995andMarch2015XandApril2014andMarch2015
Separate univariate PERMANOVAs were used to compare differences in the cover of macroalgae turf algae and the abundance of crinoids and ascidians Data were
TRESBPKirraReefMarineBiotaMonitoring2015 16
frc environmental
converted to a eucildean distances matrixX and tested for significance using as many permutations as allowed (998 to 999 unique permuations achieved for all factors and factor combinationsX except location where 10 unique permutations were achieved) Factors were survey (fixed factor) locations (Palm Beach Reef and Kirra Reef fixed factor)andsites (nested in locationsanda random factor) Posthoc pairwise testwas used to determine the magnitude of difference Monte Carlo procedures were used to calculateempiricalPvaluesforthesurveyxlocationtest
Further information on the use and interpretation of PERMANOVA and other analyses usedinthisreportisprovidedinAppendixB
TRESBPKirraReefMarineBiotaMonitoring2015 17
frc environmental
3$ Results$
31$ Cover$of$Benthic$Assemblages$
The composition of benthic fauna and flora ( cover and type combined Appendix C) variedbetweenmostsitesatbothKirraReefandPalmBeachReefandbetweennearly allsurveysateachsite(notethesignificantinteractionofsite(location)xsurveyinTable 31X Appendix D) Nevertheless there appeared to be substantial differences in the compositionofthebenthicassemblagesbetweenthetworeefsineachsurveyfrom1995 to2015(Figure31toFigure33)
In2015 therewassomeoverlap in thecompositionofassemblagesonKirraandPalm Beach Reefs (Figure 33) However there was also some clear patterns of difference including
Benthic assemblages at Kirra Reef appeared to show some overlap between surveys (Figure34H) HowevernearlyallsurveysweredifferentateachsiteatbothKirraReef andPalmBeachReef(AppendixD)BenthicassemblagesinMarch2015andApril2014 wereverysimilarcomparedtobenthicassemblages inthebaselinesurvey inApril1995 andMarch2015(notethegreateroverlapinFigure35comparedtoFigure36)
In March 2015 as in previous surveys the macroalgae Sargassum sp dominated the benthic assemblages at all sites at Kirra Reef (Figure 37) Other species present included
sdot Dictyopteris0arostichoides0
sdot Dilophus0intermedius00
sdot Zonariasp
sdot Laurencia0brongniartic0
sdot Amphiroa0anceps0
sdot Caulerpa0lentilliferaand
sdot Halimeda0discoideaand
sdot Macrocystissp
Juvenile kelp (from the genus Macrocystis) was also emerging on some areas of Kirra Reef
ThecoverofmacroalagevariedbetweensitesandsurveysatbothKirraReefandPalm Beach Reef with the magnitude of difference varying over time (note the significant interaction between site (location) x survey in Table 32) Macroalgae cover varied between surveys with 2001 being the most different to the other years (Appendix D) ThereweredifferencesbetweensitesatKirraReefinJune1995February1996January 2001 May 2003 February 2005 and February 2010 and between sites at Palm Beach ReefinJanuary2001andFebruary2010Inrecentsurveys(2012to2015)thecoverof macroalgaeatsitesatbothKirraReefandPalmBeachReefwassimilar (AppendixD) indicatingarelativelyconsistentdistributionacrossbothreefs
ThemeancoverofmacroalgaeatKirraReefhasdeclinedsinceitspeakin2001withthe greatest magnitude of decline recorded between January 2001 and May 2003 (Figure 38)InsurveysbetweenJune1995andMay2003Sargassumspformeddensecarpets overtherockysubstratecoveringupto58oftheavailablesurfaceareaofthereefIn February 2010 macroalgal cover was 12 Macroalgal cover has increased to 26 in March2015ThisissimilartothecoverrecordedinApril1995(23cover)(Figure38)
In2015nomacroalgaewasrecordedwithinthequadratsatPalmBeachReefThecover of macroalgae on Palm Beach Reef has been consistently lower than Kirra Reef since
TRESBPKirraReefMarineBiotaMonitoring2015 26
frc environmental
ecologicalmonitoringbegan typically lessthan5of theavailablesurfacearea(Figure 38)
The mean cover of turf algae varied between sites and surveys at both Kirra Reef and PalmBeachReef(notethesignificantinteractionbetweensite(location)xsurveyinTable 33)SpecificallythereweresignificantdifferencesbetweensitesatbothKirraReefand PalmBeachReefinJune1995January2001February2010July2012andApril2014 (aswellasbetweensitesinFebruary1996atKirraReef)Thecoverofturfalgaevaried betweenmostsurveysatallsitesateachreef(AppendixD)BothKirraandPalmBeach reefs showed major increases in the percent cover of turf algae from 2010 to 2012 followedbyadecreaseincoverbetween2012and2014(Figure310)Thecoverofturf algae is typically lower at Kirra Reef than at Palm Beach Reef (July 2012 being an exception) and was again slightly lower at Kirra Reef in March 2015 (Table 310) In March2015turfalgaewasmoreprevalentatKirraReefthanduringthebaselinesurvey ofApril1995
ThemeancoverofspongesatsomesitesatbothKirraReefandPalmBeachReefhas varied significantly during some surveys (note the significant interaction between site (location)xsurvey inTable34HFigure311) However thecoverofspongestendedto bemore temporallyvariable atKirraReef than at Palm Beach Reef (Figure312) The cover of sponges at Kirra Reef varied between sites in February 1996 January 2001 March2004July2012andApril2014 However thecoverofspongesatPalmBeach Reefonlyvariedbetweensites inJanuary2001andFebruary2010 (AppendixD) The cover of sponges varied between survey at each site with 1995 1996 and 2001 most differenttootheryears(AppendixD)
ThemeancoverofspongesatKirraReefdeclinedbetweenMarch2004(20cover)and February 2010 (less than 1 cover) Since 2010 the cover of sponges has increased slightly with sponges covering 8 of the reef in March 2015 (Figure 312) In March 2015thecoverofspongeswashigherthanrecordedduringthebaselinesurveyinApril 1995(3cover)(Figure312)
Figure312 Mean cover of sponges (plusmnSE) at Kirra Reef and Palm Beach Reef on all
surveys
Table34 Univariate PERMANOVA results for differences in the cover of sponges betweensurveysandlocations
Factor$ df$ MS$effect$ PseudoF$ p$(perm)$
survey 10 18576 276 0018
location 1 39671 589 0210
site(location) 4 67354 477 0001
locationxsurvey 10 1490 221 0032
site(location)xsurvey 40 67331 477 0001
error 924 14108
Shadingdenotessignificanceatplt005
TRESBPKirraReefMarineBiotaMonitoring2015 32
frc environmental
Ascidians$
ThemeanabundanceofallascidiansotherthanPyura0stoloniferahasvariedsignifcantly between sites at Kirra Reef and Palm Beach Reef and between surveys at each site (Figure314andnotethesignificantinteractionbetweensite(location)xsurveyinTable 35) The abundance of ascidians was different between sites at Kirra Reef in January 2001May2003March2004February2005andApril2014HanddifferentatPalmBeach ReefinJanuary2001February2005February2010andMarch2015Theabundance ofascidiansvariedbetweensurveysateachsitewith1995beingmostdifferentwhenthe abundanceofascidianswaslow(AppendixD)InMarch2015theabundanceofallother ascidiansonKirraReefandPalmBeachReefwashigherthanpreviouslyreportedinthe baselinesurveyinApril1995(whennoascidianswererecorded)Themeanabundance washigheratKirraReefthanatPalmBeachReef(Figure314)
ThemeanabundanceofPyura0stoloniferahasvariedconsiderablybetweensitesatKirra Reef and Palm Beach Reef over time (note the significant interaction between site (location) x survey in Table 36) In March 2015 the mean abundance (individual per 025m2plusmnSE)of theascidianPstolonifera (Figure313)wassimilaratKirraReefand PalmBeachReef(Figure315)ThemeanabundanceofP0stoloniferahasrangedfrom 02to17individualsper025m2atbothreefssinceMay2003
Figure315 Mean abundance of ascidians (Pyura0 stolonifera) (individuals025m2)
(plusmnSE)atKirraReefandPalmBeachReefinallsurveys
TRESBPKirraReefMarineBiotaMonitoring2015 34
frc environmental
Table35 Univariate PERMANOVA results for the differences in cover of all ascidians otherthanPyura0stolonifera0betweensurveysandlocations
Factor$ df$ MS$effect$ PseudoF$ p$(perm)$
survey 10 26658 474 0001
location 1 13603 710 0104
site(location) 4 19154 149 0212
locationxsurvey 10 2629 468 0001
site(location)xsurvey 40 5621 438 0001
error 924 12828
Shadingdenotessignificanceatplt005
Table36 Univariate PERMANOVA results for the differences in Pyura0 stolonifera densitybetweensurveysandlocations
Factor$ df$ MS$effect$ PseudoF$ p$(perm)$
survey 10 16254 11842 0001
location 1 12445 60881 0206
site(location) 4 20442 56799 0001
locationxsurvey 10 79724 58082 0001
site (location) x 40 13726 38138 0001 survey
error 924 35991
Shadingdenotessignificanceatplt005
$
TRESBPKirraReefMarineBiotaMonitoring2015 35
frc environmental
Hard$Coral$
There was a significant difference between the cover of hard corals at Kirra Reef and PalmBeachReefduringsomesurveys(notethesignificantinteractionbetweenlocationx surveyinTable37)SpecificallytherewassignificantlymorehardcoralatPalmBeach Reef thanKirraReef inFebraury1996March2004April2014andMarch2015(Table 38)
ThecoverofhardcoralistypicallylowonKirraReefaccountingforlessthan2ofthe availablesubstrateInMarch2015hardcoralcoveredlessthan1oftheareaofKirra Reef which was less than the cover recorded during the baseline survey in April 1995 (Figure 316) In contrast hard coral covered 11 of the surface area at Palm Beach ReefwhichwasgreaterthanthecoverrecordedinApril1995(Figure316)
The cover of hard corals at Palm Beach Reef has been more variable over time comparedtothecoverofhardcoralatKirraReef(Figure316)Withtheexceptionofthe surveys inApril1995andJanuary2001when thecoverofhardcoralwas lowonboth reefshardcoralsaretypicallymoreprevalentatPalmBeachReef(Figure316)
Table38 PERMANOVA post hoc pairwise results for the differences in the cover of hardcoralbetweenlocationsineachsurveyevent
Hard$Corals$ Survey$
t$ p$(MC)$a$
Apr1995 054 0606
Jun1995 182 0140
Feb1996 541 0006
Jan2001 R R
May2003 166 0168
Mar2004 765 0001
Feb2005 049 0646
Feb2010 156 0197
Jul2012 283 0053
Apr2014 525 0011
Mar2015 695 0003 Shadingdenotessignificanceatplt005 a pvaluesbasedonMonteCarlotests
TRESBPKirraReefMarineBiotaMonitoring2015 37
60
50
40
30
20
10
0
Soft
Cor
al C
over
()
Kirra Reef Palm Beach Reef
frc environmental
Soft$Coral$
The cover of soft coral was significantly different between sites at both Kirra Reef and PalmBeachReefandduringsomesurveys(notethesignificant interactionbetweensite (location)xsurvey)TherewasnosoftcoralrecordedatKirraReefinMarch2015The coverofsoftcoralhasdeclinedatKirraReefsince2003andhascoveredlessthan2of theavailablesubstratesince2005whichissimilartothecoverofsoftcoraldescribedfor the baseline surveys in 1995 (Figure 317) The cover of soft coral was consistent betweensitesineachsurveyexceptbetweensitesin
sdot April1995atKirraReef
sdot 1996atKirraReef
sdot 2003atPalmBeachReefand
sdot 2014atPalmBeachReef(AppendixD)
Soft corals have historically covered more of the available space on Palm Beach Reef than on Kirra Reef However there was more temporal variability within sites at Palm BeachReefthanatKirraReef(AppendixD)ThecoverofsoftcoralatPalmBeachReef has varied over time and was highest in April 1995 (48 cover) Despite increasing sinceFebruary2005itisstilllowerthanthecoverrecordedduringthebaselinesurveyin April1995(Figure317)
Table39 UnivariatePERMANOVAresults for thedifferences in thecoverofsoft coral betweensurveysandlocations
Factor$ df$ MS$effect$ PseudoF$ p$(perm)$
survey 10 44657 1323 0001
location 1 32922 6620 0117
site(location) 4 49732 266 0036
locationxsurvey 10 40982 1214 0001
site (location) x 40 3376 181 0002 survey
error 924 18688
Shadingdenotessignificanceatplt005
$
TRESBPKirraReefMarineBiotaMonitoring2015 39
frc environmental
Crinoids$
ThereisasignificantdifferencebetweensomesitesatbothKirraReefandParmBeach Reef that varies through time (note the significant interaction between site (location) x survey inTable310) Theabundanceofcrinoidshasbeensimilarbetweensites inall years at Palm Beach ReefH and was different beween sites at Kirra Reef in June 1995 February1996May2003andFebruary2005(AppendixD)Withineachsitetherehas been some natural temporal variability particualrly at Palm Beach Reef sites in 2001 (Appendix D) The mean abundance (individuals 025m2) of crinoids (Figure 318) at KirraReefandPalmBeachReefhasgenerallybeenlessthan2individualsper025m2 andhasdeclinedatboth locationssincethebaselinesurvey inApril1995(Figure319) However the mean abundance of crinoids on Kirra Reef has shown a slight increase sinceFebruary2010(Figure319)
In March 2015 fewer crinoids were recorded at Palm Beach Reef than at Kirra ReefH crinoidshavebeenrareatPalmBeachReefsince2003
The species richness of fish recorded from Kirra Reef across all monitoring events has rangedfrom14to57 InMarch201557specieswereidentifiedat thereefwhichwas similar to April 2014 (53) and higher than previous surveys (Figure 320) Species richnessatPalmBeachReefwas lower(34species)andgenerallyvaried lessbetween surveyscomparedtoKirraReef
InMarch2015 the assemblage of fish at KirraReef comprised species fromall trophic levelsincludingdetritivoresplanktivoresherbivoresandcarnivores(AppendixE)Asin previous surveys the assemblage was dominated by herbivores and planktivores Yellowtail (Trachurus0 novaezelandiae) and striped sea pike (Sphyraena0 obtusata) were the dominant species present in large schools (Figure 321) Australian mado (Atypichthys0 strigatus) ringRtailed surgeon (Acanthurus0 blochii) silver trevally (Pseudocaranx0 georgianus) eastern pomfred (Schuettea0 scalaripinnis) sweep (Scorpis0 lineolatus) and various wrasses were also very abundant releative to other species (AppendixE)
Two new species were observed at Kirra Reef the orangeRband surgeon (Acanthurus0 olivaceus) and the unicornfish (Naso0 sp) Five new species were recorded at Palm BeachReef
No threatened or protected fish species listed under the Queenslandrsquos Nature0 Conservation0Act01992ornationallyundertheEnvironmental0Protection0and0Biodiversity0 Conservation0 Act0 1999 were observed The complete list of species recorded and the relativeabundanceispresentedinAppendixE
TRESBPKirraReefMarineBiotaMonitoring2015 42
60
0
10
20
30
40
50
Num
ber
of F
ish
Spe
cies
Apr-95
Jun-95
Feb-96
Jan-01
May-03
Mar-04
Feb-05
Feb-10
Jul-12
Apr-14
Mar-15
Kirra Reef Palm Beach Reef Location
frc environmental
Figure320 Number of fish species recorded at Kirra Reef and Palm Beach Reef on
ThegreatestchangetotheecologicalconditionofKirraReefsincethebaselinesurveyin 1995 has been the loss of large areas of hard substrate that support benthic flora and faunaThedeliveryoflargesandvolumesduringthestage1dredgingoperations(1995 to1998)andtheinitialoperationofthesandbypasssystem(2001to2008)resultedinan increaseinwaveactionandtidalcurrentsredistributingthissandoverKirraReef
The three major outcrops of Kirra Reef (northern southern and eastern sections) are naturally exposed and covered depending on water and sand movements In March 2015 the rocky outcrops in the northern section of Kirra Reef were exposed and supportedamoderatelydiversebenthicassemblagedominatedbyturfalgaeTherewas arelativelyhighfishdiversityatKirraReefTheecologicalassemblageexhibitedsignsof ongoingstressfromphysicaldisturbanceincludingtheabsenceofsoftcoralsandrarityof hardcoral(MumbyampSteneck2008)HoweverKirraReefhasarelativelyhighcoverof sponges and ascidians Sponges ascidians and crinoids were more abundant at Kirra ReefthanatPalmBeachReefinMarch2015
KirraReefcontinues toprovidehabitatandsupport importantecological functions in the region providing hard substrate for the colonisation of algae and benthic invertebrates and food and refuge for fish As sand levels have stabilised since 2008 assemblages have becomemoresimilar to those recordedprior to implementationof the TRESBP in April1995 Forexamplemacroalgalcover inApril1995andMarch2015wasrelatively similarHoweverassemblagecompositionisstillsignificantlydifferenttothatrecordedin thebaselinesurveysmostnoticeablyduetoa lowercoverofbaresubstrateandhigher coverofturfalgaeandascidianssincesurveyshavebeenperformed
Benthic$Macroalgae$
The cover of macroalgae at Kirra Reef was relatively similar during the 2014 and 2015 surveys and remained well below the peak of nearly 60 cover recorded in January 2001TherewasasteepdeclineinthecoverofmacroalgaebetweenJanuary2001and May2003whichappearedtobestronglyassociatedwith thedecline inreefareaduring that time as well as a decline in the cover of Sargassum sp (an important indicator speciesonKirraReef) SimilardeclineswereevidentatPalmBeachReefbetween the January2001andMay2003surveys
TRESBPKirraReefMarineBiotaMonitoring2015 45
frc environmental
The cover ofmacroalgae at Palm Beach Reef was much lower thanat Kirra Reef over time There are several possible reasons for the lower cover of macroalgae at Palm Beach
sdot PalmBeachReefisdeeperthanKirraReefandgenerallyhashigherturbidityand therefore greater light attenuation The quantity and quality of available light affectsthedistributionandgrowthofmacroalgae(MillerampEtter2008)
sdot Differences in the pattern of recruitment of algal species to the reefs due to differentwatercurrentsandtimingofthesurveys(Kennelly1987b)
sdot Increased competition with turf algae and sessile benthic invertebrates which competeforspacewithmacroalgae(Kennelly1987aHMillerampEtter2008)
sdot PresenceofdifferentspeciesandhigherdensityofherbivoresatPalmBeachReef (particularly sea urchins and herbivorous fish) which graze on macroalgae (McCook1997HJompaampMcCook2002)
Biological assemblages exposed to physical stress typically exhibit greater levels of temporalandspatialvariability(WarwickampClarke1993HChapmanetal1995)Temporal variationinthecoverofmacroalgaeatKirraReefislikelytobeprincipallyduetotheeffect ofphysicaldisturbance fromwaveactionaswellas theassociatedassociatedabrasion andsmotheringbysandTheeffectsofthesephysicaldisturbanceswouldincreasewith thereductionofKirraReefasedgeeffectsarepronouncedandwaterdepth isreduced Increasedsmotheringbysandcanalsoreducediversity(Hatcheretal1989)abundance recruitment growth survival and seasonal regeneration of macroalgae (Umar amp Price 1998HCheshireetal1999)
Changes in the cover of macroalgae on Kirra Reef over time are also likely due to the extentofthereefchangingHthefishandmobileinvertbratesassociatedwiththereefmay have concentrated which would in turn increase grazing pressure Increased grazing pressure from fish and mobile invertebrates can reduce the coverage and diversity of macroalgaeonreefs(McCook1997HJompaampMcCook2002)
Thecoverof turfalgaeatbothKirraReefandPalmBeachReefhasvariedsignificantly betweensurveysPriorto2005turfalgaetypicallycoveredlessoftheavailablesurface areaonKirraReefthanPalmBeachReefInMarch2015themeancoverofturfalgae hasincreasedsincebaselinesurveysin1995andwasrelativelysimilarbetweenreefs(40 plusmn4atKirraReefcomparedto48plusmn4atPalmBeachReef)Thecoverofturfalgaeat Kirra Reef was similar in 2014 and 2015 which was generally higher than previous surveysexceptduringJuly2012whencoverofturfalgaepeakedat67plusmn4
TRESBPKirraReefMarineBiotaMonitoring2015 46
frc environmental
Turfalgaearebecomingadominantcomponentofcommunitiesaroundtheworld likely the result of rapid colonisation of openspace after a disturbance (eg storms) nutrient enrichment andor changes in grazing pressures Turf algae can also reflect a more physically robust growth form suited to high wave energy environments (than foliose macroRalgae)TurfalgaepeakedintheJuly2012surveylikelyrelatedtotheincreasein bare reef exposure following a stormy conditions in early 2009 and between December 2011 and June 2012 Turf algae have been the dominant form of algae on Kirra Reef sincethistimealbeitthecoverlowerthanthe2012survey
Increased cover of turf algae is typically related to good light conditions high concentrationsofnutrientsandlownumbersofgrazerssuchasfish(orconstantgrazing pressure preventing macroalgae colonisation) However the relationship between algal dynamics physical disturbance water quality and herbivore grazing activity is complex andthecoverof turfalgaecanexhibitextremetemporalvariabilityasaconsequenceof the interactionbetween topRdownandbottomRupprocesses (Russ2003HBellwoodetal 2006H Hughes et al 2007H Albert et al 2008H Hoey amp Bellwood 2008H Mumby 2009) Furtherinvestigationwouldberequiredtoreliablydeterminethemechanismsofchangein bothmacroalgaeandturfalgaeassemblagesonthesereefs
Benthic$Macroinvertebrates$
AtKirraReeftheburialandreRemergenceofrockyoutcrops(influencedbytheTRESBP) islikelytohaveincreasedtemporalvariabilityinthedistributionandabundanceofbenthic macroinvertebrates Additional perturbations such as wave action and sand abrasion (each influenced through changes in bathymetry seabed topography and water depth) are likely to have resulted in the decline in cover and diversity of the benthic macroinvertebratesatKirraReefbetweensurveysparticularlybetweenMarch2004and February2005andduringtheseverestormsof2009Benthicmacroinvertebratessuch asascidiansspongeshardcoralandsoftcoralarehighlysusceptible to theeffectsof stormandwavedisturbancephysicalabrasionandburialbysand(KayampKeough1981H Walker et al 2008) which can affect settlement growth rate and survival (Dodge amp Vaisnys1977HRogers1990)
Physical disturbance from sand burial sand abrasion and the action of storm waves appeartokeepthebenthicassemblagesofKirraReefinastateofearlysuccessionItis commonforearlypioneerspeciessuchassomemacroalgaetorecruitrapidlytoahard surface in large numbers allowing these species to dominate assemblages early in the successionaltrajectory(Walkeretal2007)
Afurther indicatorof theearlystateofsuccessionatKirraReef isthatthecoverofhard and soft coral has remained very low (generally lt 5) In March 2015 less than 1
Benthic macroinvertebrate cover may also be affected indirectly through increased competitionwithmacroalgaeforspaceThepresenceoflargemacroalgaecanaffectthe recruitment and survival of sessile benthic invertebrates as fronds moving with wave action sweep and abrade the surface of rocks killing new recruits especially corals (Kennelly1989HMcCooketal2001)Itcantakeseveralyearsforhardandsoftcoralto become dominant on reefs in the SEQ region (SchlacherRHoenlinger et al 2009) Therefore hard coral is not expected to become abundant until several years after the reefhasbeenuncoveredandonlyifthephysicaldisturbanceregimeandsupplyofnew recruitsissufficienttosupportsurvivalandgenerationalsuccessionofthesespeciesThe coverofhardandsoftcoralsatKirraReefwerebothverylowandpatchypriortothestart oftheTRESBP
Sponges and ascidians are highly susceptible to smothering and sand abrasion unless theyhaveathicktunic(outercoveringmadeofkeratin)liketheascidianP0stolonifera0or strong internal keratin silicon or calcareous structures in the case of some species of sponges0(KayampKeough1981HMcGuinness1987HWalkeretal2008)Duetoincreased wave action and sedimentation (which can be influenced by the TRESBP) the mean coverofascidiansandspongeswasexpectedtobemuchloweronKirraReefthanPalm Beach Reef However in March 2015 the cover of sponges was similar between the reefsandthecoverofascidians(otherthanP0stolonifera)wasgreateratKirraReefthan at Palm Beach Reef This suggests that Kirra Reef is slowly recovering from the increasedstressofphysicaldisturbancesuchas increasedwaveactionandsandscour andorthatwaveandstormconditionshavebeenlesssevereinthepastfewyears
Fish$
KirraReefcontinuestosupportahighdiversityofreefRassociatedandpelagic(ienonR reefassociated) fishspecies Despite itsdiminishedsizecompared to1995KirraReef continuestoprovidevaluablehabitatforanumberoffishspeciesfromdifferentfunctional groups
ThereisahighdegreeofinterRannualvariabilityinthespeciesandabundanceofthefish present at Kirra Reef compared with the assemblage at Palm Beach Reef This likely reflectsthetemporalvariabilityintheavailablehabitatasaconsequenceofreefburialand reRemergenceThediversityqualityandarealextentofreefhabitatareimportantfactors influencing the distribution abundance biomass and diversity of reef fish (Bellwood amp Hughes2001HFriedlanderetal2003)Diversityandabundanceoffishcanincreasewith
TRESBPKirraReefMarineBiotaMonitoring2015 48
frc environmental
greaterstructuralcomplexityandincreasedheterogeneityofavailablehabitats(Bellwood ampHughes2001)Thissuggeststhatperiodsofreefburialreducetheoveralldiversityof reefRassociated fish species at Kirra Reef Despite the reduction in overall reef space therewasalargervarietyofhabitats(suchasmarcoalgaeandturfalgae)in2015which was likely to be related to the high diversity of fish assemblages This is particularly importantforseveralspeciesthatdependonthepresenceoflsquostructurersquosuchasprovided by reef habitat (ie oldwife moray eels damselfish and Australian mado that were recordedinMarch2015butwerenotrecordedinJuly2012)
Theabundanceanddiversityof fishare likelytobenegativelyaffectedfollowingperiods of severe weather which create unfavourable conditions for many species and may further exacerbate the affects of abrasion and sedimentation The biomass of fish is knowntodecreasewithincreasingexposuretophysicaldisturbancefromwaveactionand strong currents (Friedlander et al 2003) As our surveys have been undertaken at different times of the year variation in the prevailing conditions at the time of sampling could also influence the types of fish observed (and the amount of reef habitat that is availableatanytime)Manyofthespeciesmayalsobeaffectedbyseasonalchangesin the water temperature such as damselfish which are less abundant in cool waters However theoveralldiversityof the fishassemblageatKirraReef is likely toreflect the sizeoftheoutcropsexposedwithagreaterphysicaldisturbance(fromseaconditionsand sandmovement)andcompetitionHandlesserfoodavailablewhenthereefiscovered
ThepredictedimpactstoKirraReefasaresultoftheTRESBPincludedaccretionofsand around the base of the rock outcrops causing a reduction in extent of reef It was predictedthatsanddeliveryaspartoftheprojectwouldeventuallymimiclsquonaturalrsquopatterns ofsanddispersalandthatthereefwouldreturntoitsnaturalextent(ietheextentpriorto extension of the Tweed River training walls in 1962) The benthic flora and fauna assemblages of the reef the historical reef extent and natural sand transport patterns wereexpectedtoreturntoconditionsobservedbeforetheextensionofthetrainingwalls between 1962 and 1965 However the Environmental Impact Study did not predict the ecologicalconsequencesofboththereducedarealextentandincreasedwaveenergy(a consequenceofdecreaseddepth)thathavebeenrecorded
ThecurrentextentofKirraReef remains less than50of that recorded in1962and in 1995beforethesanddeliverybytheTRESBPcommencedHowevertheextentofreef in1995 wasstrongly influenced by adepletion in sand following the construction of the Tweed River training walls and the Kirra Point groyne Accumulation of sand on Kirra ReefwasobservedtoincreaseasaresultofindirectsandnourishmentbytheTRESBP and the reef has been extensively covered (particuarly between 2005 and 2010) as a result
Whiletheextentofthereefcontinuestochangeovertimethedeliveryofsandaspartof the project now more closely matches the natural rate of longshore sand transport ShortRtermandseasonalchangesintheextentofthereefarenowlikelytobetheresultof waveandcurrentaction(particularlyduringservereweatherevents)thanadirectimpact of the TRESBP Therefore the extent of Kirra Reef in March 2015 is broadly in accordancewithpredictionsmadeintheEISwhichpredictedthatthereefwouldreturnto a condition similar to that exhibited in the preR1960rsquos ie before the extension of the TweedRiverbreakwatersthatinterruptedlittoralsandsupplytothesebeaches
InDecember2013KirraPointgroynewasextendedby30mwiththeexpectationthatthe beach bar would move seaward as a consequence At present Kirra Point groyne is unlikelytohavehadamajorimpactonthearealextentofKirraReefHoweverongoing monitoringbasedonaerialphotographsmayprovidefurtherinsight
Sessile benthic assemblages on Kirra Reef are highly susceptible to the influence of storms and associated wave action (Kay amp Keough 1981H Walker et al 2008) The shallowreefissurroundedbymobilesandwhichcanshiftnaturallyinresponsetowave action during storms causing burial of large sections of Kirra Reef This effect has reduced the availability of rocky substrate for colonisation and the availability of refuge
Fromanexaminationof theextentofKirraReef fromarealmapsandwaveheightdata thereappears tobea relationshipbetween theareaof rockexposedandstormevents Notably in a series of storm events in May 2009 corresponds with large areas of rock becoming exposed (with the reef approximately 100m2 in 2006 and approximately in 1009m2 2009) Further a stormy conditions between December 2011 and July 2012 correspondstotheareaofexposedrockmorethandoublinginsizeWhiletherewasno changetothetotalareaofexposedrockfollowingstormyconditionsinearly2013there wasaclearchangeinthedistibutionofexposedrockduringthistimeSince2013storm conditions have been calm to moderate and there has been little change in the areal extentanddistrubtionofexposedrockatKirraReef
WaveheighttypicallyincreasesduringstormeventsandgiventheshallowdepthofKirra Reef waves are more likely to shoal and break across the reef during storms This increases thephysicaldisturbanceabrasionandsedimentationofbenthicassemblages onKirraReefStormdisturbancecancauselocalreductionsinthespeciesrichnessand abundanceofcoral(Woodleyetal1981HMasselampDone1993HHughes1994HConnellet al 1997) and can alter fish assemblages indirectly through habitat modifications (Kaufman1983HJonesampSyms1998)ordirectlybyincreasingfishmortality(Lassig1983) The hydrodynamic forces produced by wave action are an important source of disturbance in subtidal habitats inflicting damage through direct physical impact and abrasion(UnderwoodampKennelly1990)DirectimpactsfromphysicaldisturbanceatKirra Reefareevidentduringsurveyeventswhenlargefragmentsofmacroalgaearepresentin thewatercolumnoverthereef
Storm and wave action (and associated sedimentation and abrasion) continue to be importantforcesshapingthedistributionandabundanceofbenthicspeciesatKirraReef Increased magnitude and frequency of physical disturbance resulting from increased exposureorsusceptibility tostormsandassociatedwaveaction (asonKirraReef)can lead to a decrease in the diversity of sessile invertebrate assemblages DisturbanceR drivenreductionsinbiodiversityhavethepotentialtoimpactnegativelyonthehealthand productivity of reef ecosystems (Walker et al 2008) Biodiversity is important to reef health given that many of these species (eg sponges bryozoans and ascidians) contribute a range of vital ecosystem services to reefs including nutrient cycling (Scheffers et al 2004) trophic interactions and food webs (Lesser 2006H Pawlik et al 2007) bioRerosion (Rutzler 2002H LopezRVictoria et al 2006) and stabilizing substrata (DiazampRutzler2001HWulff2001)
Theimpactsof increasedwaveactionandsedimentationonthebenthicassemblagesat Kirra Reef are likely to be greatest during and immediately following storm conditions
TRESBPKirraReefMarineBiotaMonitoring2015 51
frc environmental
Partitioningtheinfluenceofstormandwavedrivendisturbancefromthatoftheoperation oftheTRESBPwouldrequireamuchmorestatisticallypowerfulandtemporilyreplicated experimental design Given there is a large collection of wave and storm data by TRESBP this would involve greater temporal sampling of Kirra Reef including event samplingfollowingseverewaveandstormactivity
The data generated by this Kirra Reef biota monitoring program doesnrsquot support statistically rigorous consideration of seasonality (monitoring has been at its most frequentannual)
InApril2014andMarch2015KirraReefcoveredlessthan50ofthereefrsquosextentprior to theoperationof theTRESBP The lossof reefhabitathasreducedtheavailabilityof hard substratum available for colonisation and consequently the abundance of benthic sessileassemblages
The reduced depth of water resulting from the accumulation of sand exacerbates the effects of storms and wave action It is likley that as a consequnece the biological communities of Kirra Reef will reflect earlyRstage succession more frequently and for longerperiods
While there is sufficient structure available frcenvironmentalexpect that Kirra Reef will continuetoprovideimportanthabitatforadiverseassemblageoffishes
TRESBPKirraReefMarineBiotaMonitoring2015 52
frc environmental
5$ Conclusions$
Although there is still a substantial portion of the reef covered compared to before the extension of the Tweed River entrance breakwaters the current extent of Kirra Reef is broadly inaccordancewithpredictionsmadein theEIS Initial lsquocatchRuprsquobypassingand dredgeplacementofsand(between2001and2008)resulted in theburialofKirraReef Subsequentsanddelivery(since2008onwards)morecloselyreflectsnaturalpatternsof longRshoresandtransportandisthereefhasslowlyreRemerged
Theextentofthereefhasbeenrelativelystablesince2013Thishasallowedforsome succession in the benthic assemblages including a relatively high cover of sponges ascidiansandcrinoidsWiththedeliveryofsandmorecloselymatchingthenaturalrateit isexpected the reef willundergoshortRtermchanges in extentdue toseasonal shifts in sand deliveryH however the diversity of benthic assemblages on Kirra Reef is likely to increaseovertimeThiswouldcreatemorespaceforspeciestorecruitandreducesthe influence of sand abrasion and wave damage It was predicted that the areas of Kirra Reef newly exposed in 2012 would undergo a shift from turfRdominated communities to more diverse communities that could include macroalgae sponges ascidians and potentiallyhardandsoftcoralWiththeexceptionofhardandsoftcoralsthisprediction wasconfirmedbytheresultsoftheApril2014andMarch2015surveys
ThediversityoffishesassociatedwithKirraReefisbroadlysimilartothatrecordedprior tothecommencementofsandbypassingin1995Giventhatfisharemobilethegreatest impacts on fish assemblages are likely to be shortRterm changes due to both the prevailingconditionsandchangestheextentofavailablehabitatthatprovidesshelterand foodforavarietyofdifferentspeciesIfKirraReefincreasesinsizethereislikelytobea greater proportion of cryptic benthic species as these species are more typical of assemblagesinalaterstageofsuccession(eg(WillisampAnderson2003))
Assuming a broadly stable delivery rate of sand and consequent stable extent of Kirra ReeflsquorecoveryrsquoislikleytobesubstantivelycompleteFloralandfaunalcommunitieswill undergo succession between severe storm events but are likley to remain relatively dynamic
Albert S Udy J amp Tibbetts I 2008 Responses of algal communities to gradients in herbivorebiomassandwaterqualityinMarovoLagoonSolomonIslandsCoral0 Reefs2773R82
Anderson MJ 2001 A new method for nonRparametric multivariate analysis of varianceAustral0Ecology2632R46
Anderson MJ 2004 PERMDISP0 a0 FORTRAN0 computer0 program0 for0 permutatinoal0 analysis0 of0 multivariate0 dispersions0 (for0 any0 twoSfactor0 ANOVA0 design)0 using0 permutational0 tests Department of Statistics University of Auckland New Zealand
Cannon LR Goeden GB amp Campbell P 1987 Community patterns revealed by trawling in the interRreef regions of the Great Barrier Reef Memoirs0 of0 the0 Queensland0Museum2545R70
Chapman MG Underwood AJ amp Skilleter GA 1995 Variability at different spatial scalesbetweenasubtidalassemblageexposedtothedischargeofsewageand two control assemblages Journal0 of0 Experimental0 Biology0 and0 Ecology 189 103R122
Cheshire AC Miller DJ amp Stewart R (1999) Effect0 of0 dispersed0 sediment0 plumes0 from0beach0sand0replenishment0dredging0on0recruitment0of0phaeophycean0algae0 to0rocky0reefs0in0Gulf0St0Vincent0South0Australia0The0Impact0of0Sand0Dredging0 on0 Benthic0 Community0 Structure0 at0 the0 Port0 Stanvac0 Dredge0 Site0 20 1S39 UniversityofAdelaideAdelaide
ConnellJHHughesTPampWallaceCC1997A30Ryearstudyofcoralabundance recruitment and disturbance at several scales in space and time Ecological0 Monographs67461R488
Diaz MC amp Rutzler K 2001 Sponges an essential component of Caribbean coral reefsBulletin0of0Marine0Science69535R546
DodgeREampVaisnysJR1977Coralpopulationsandgrowthpatternsresponsesto sedimentation and turbidity associated with dredging Journal0 of0 Marine0 Research35715R730
Done TJ 1982 Patterns in the distribution of coral communities across the central GreatBarrierReefCoral0Reefs195R107
Edwards RA amp Smith DA 2005 Subtidal assemblages associated with a geotextile reef insouthReastQueenslandAustraliaMarine0and0Freshwater0Research56 133R142
FisheriesResearchConsultants1991Survey0of0the0Intertidal0and0Subtidal0Rocky0Reefs0 of0 the0 Sunshine0 Coast report prepared for Queensland National Parks and WildlifeService
HarrisonPHarriotVBanksSampHolmesN1998ThecoralcommunitiesofFlinders Reef andMyora Reef in theMoretonBay MarineParkQueensland Australia In Moreton0 Bay0 and0 Catchment Tibbits I Hall N amp Dennison W (Eds) SchoolofMarineScienceUniversityofQueenslandStLuciapp525R536
Hatcher B Johannes R amp Robertson A 1989 Review of research relevant to the conservationofshallowtropicalmarineecosystemsOceanography0and0Marine0 Biology0an0Annual0Review27337R414
Hoey A amp Bellwood D 2008 CrossRshelf variation in the role of parrotfishes on the GreatBarrierReefCoral0Reefs37R47
TRESBPKirraReefMarineBiotaMonitoring2015 56
frc environmental
Hollingsworth P 1975 Environmental Investigation Report Crown Reserve R R68 Currumbin Creek City of the Gold Coast Land Administration Commission unpublishedreport
Hughes TP 1994 Catastrophes phase shifts and large scale degradation of a CaribbeancoralreefScience2651547R1551
Hughes TP Rodrigues MJ Bellwood DR Ceccarelli D HoeghRGuldberg O McCook L Moltschaniwskvi N Pratchett MS Steneck RS amp Willis B 2007Phaseshiftsherbivoryandtheresilienceofcoralreefstoclimatechange Current0Biology17360R365
Hutchinson A Rempel C Taveras V Loder J amp Salmond J 2013 Reef0 Check0 Australia0 South0 East0 Queensland0 Summary0 Report0 2013 report prepared for ReefCheckFoundationLimited
Hyder Consulting 1997 Tweed0 River0 Entrance0 Sand0 Bypassing0 Project0 Permanent0 Bypassing0 System0 0 Environmental0 Impact0 Statement0 0 Impact0 Assessment0 Study report prepared for New South Wales Department of Land and Water Conservation
Jompa J amp McCook LJ 2002 Effects of competition and herbivory on interactions betweenahardcoralandabrownalgaJournal0of0Experimental0Marine0Biology0 and0Ecology27125R39
KayAMampKeoughMJ1981Occupationofpatchesintheepifaunalcommunitieson pier pilings and the bivalve Pinna bicolor at Edithburgh South Australia Oecologia48123R130
KennellyS1987aInhibitionofkelprecruitmentbyturfingalgaeandconsequencesfor an Australian kelp community Journal0 of0 Experimental0 Marine0 Biology0 and0 Ecology11249R60
Kennelly S 1987b Physical disturbances in an Australian kelp community I temporal effectsMarine0Ecology0Progress0Series40145R153
TRESBPKirraReefMarineBiotaMonitoring2015 57
frc environmental
Kennelly S 1989 Effects of kelp canopies on understory species due to shade and scourMarine0Ecology0Progress0Series50215R224
Lassig BR 1983 The effects of a cyclonic storm on coral reef fish assemblages Environmental0Biology0of0Fishes955R63
Lawson S McMahon J amp Boswood P 2001 Environmental management of the construction and operation of a sand bypassing system at the Tweed River EntranceInThe15thAustralasianCoastalandOceanEngineeringConference the 8th Australasian Port and Harbour Conference 25 R 28 September 2001 QueenslandAustralia
Lesser MP 2006 BenthicRpelagic coupling on coral reefs feeding and growth of Caribbean sponges Journal0 of0 Experimental0 Marine0 Biology0 amp0 Ecology 328 277R288
LopezRVictoriaM ZeaSampWei E2006 Competition for spacebetweenencrusting excavatingCaribbeanspongesandothercoral reeforganismsMarine0Ecology0 Progress0Series312113R121
MalcolmHASmithSDAampJordanA2009Usingpatternsofreeffishassemblages to refine a Habitat Classification System for marine parks in NSW Australia Aquatic0Conservation0Marine0and0Freshwater0Ecosystems2083R92
Massel SR amp Done TJ 1993 Effects of cyclone waves on massive coral assemblages on the Great Barrier Reef meteorology hydrodynamics and demographyCoral0Reefs12153R166
Mumby PJ amp Steneck RS 2008 Coral reef management and conservation in light of rapidly evolving ecological paradigms Trends in Ecology amp Evoution 23 555 -563
Murphy HM amp Jenkins GP 2010 Observational methods used in marine spatial monitoring of fishes and associated habitats a review Marine and Freshwater Research 61 236-252
Noriega R 2007 An Overview of Available Information on Sandy Beach Ecology Coastal Sand Dunes Rocky Reefs and Associated Biota on the Gold Coast Griffith Centre for Coastal Management Research Report No 85 report prepared for Griffith University
Parker P (1995) Structure to Reef Fish Assemblages at Julian Rocks Northern New South Wales Masters Thesis Griffith University
Parker PG 1999 Fish assemblages at Julian Rocks and the adjacent waters of northern New South Wales Australia Australian Zoologist 31 134 - 160
Pawlik JR Steindler L Henkel TP Beer S amp Ilan M 2007 Chemical warfare on coral reefs sponge metabolites differentially affect coral symbiosis in situ Limnology and Oceanography 52 907-911
Reef Check 2010 httpwwwreefcheckaustraliaorgdatahtml accessed December 2015
Robinson KI amp Pollard DA 1982 Marine and estuarine reserves in Australia with particular reference to New South Wales Wetlands 2 17 - 26
Rogers CS 1990 Responses of coral reefs and reef organisms to sedimentation Marine Ecology Progress Series 62 185-202
Russ GR 2003 Grazer biomass correlates more strongly with production than with biomass of algal turfs on a coral reef Coral Reefs 22 63-67
Rutzler K 2002 Impact of crustose clionid sponges on Caribbean reef corals Acta Geologica Hispanica 37 61-72
Scheffers SR Nieuwland G Bak RPM amp van Duyl FC 2004 Removal of bacteria and nutrient dynamics within the coral reef framework of Curacao (Netherlands Antilles) Coral Reefs 23 413-422
TRESBP Kirra Reef Marine Biota Monitoring 2015 59
frc environmental
Schlacher-Hoenlinger M Walker S Johnson J Schlacher T amp Hooper J 2009 Biological Monitoring of the Ex-HMAS Brisbane Artificial Reef Phase II - Habitat Values report prepared for Environmental Protection Agency (EPA)
Smith KA 2003 A simple multivariate technique to improve the design of a sampling strategy for age-based fishery monitoring Fisheries Research 64 79-85
Smith S Edwards R Dalton S amp Harrison M 2005 Biological assessment of fish and benthic communities at Palm Beach Bait Reef Gold Coast Queensland report prepared for University of New England
TRESBP 2014 Autum 2009 storms httpwwwtweedsandbypassnswgovauarticles-and-studiesinteresting-itemsautumn-2009-storm updated 4 May 2014 accessed December 2015
TRESBP 2015a Tweed Sand Bypassing Restoring Coastal Sand Drift Improving Boating Access ndash Techinical information httpwwwtweedsandbypassnswgovau__dataassetspdf_file0004552055kir ra-feb-2015pdf acessed December 2015
TRESBP 2015b Waves httpwwwtweedsandbypassnswgovauenvironmental-monitoringcoastal-conditionswaves updated 30 September 2015 accessed December 2015
Umar MJMLJ amp Price IR 1998 Effects of sediment deposition on the seaweed Sargassum on a fringing coral reef Coral Reefs 17 169-177
Underwood AJ amp Kennelly SJ 1990 Ecology of marine algae on rocky shores and subtidal reefs in temperate Australia Hydrobiologia 192 3-20
Walker S Schlacher T amp Schlacher-Hoenlinger M 2007 Spatial heterogeneity of epibenthos on artificial reefs fouling communities in the early stages of colonization on an East Australian shipwreck Marine Ecology 28 435-445
Walker SJ Degnan BM Hooper JNA amp Skilleter GA 2008 Will increased storm intensity from climate change affect biodiversity in non-scleractinian sessile fauna on coral reefs Global Change Biology 14 2755-2770
Warwick RM amp Clarke KR 1993 Increased variability as a symptom of stress in marine communtities Journal of Experimental Marine Biology and Ecology 172 215-216
Thenumberofsitessurveyedhasvariedover timeasaresultof the fluctuating levelof sandcoveringKirraReef
Prior to May 2003 three sites were assessed along the eastern and northern edge of KirraReef(KirraReefOutersites1to3)andthreesiteswereexaminedalongtheinshore marginof the reef (KirraReef Inner sites1 to 3)(MapA1) ReefRedge (ieKirraOuter) siteswerechosentoprovideearlywarningofimpactsfromoffshoreplacementofdredged sandwhilst inshoresites(ieKirraInner)werechosentoindicatewhetherimpactsfrom inshore beach profile development were affecting the reef platform In May 2003 the threeeasternsitesatKirraReef (ieKRO1KRO2andKRI1)werecompletelycovered with bare mobile sand Consequently only the three western sites at Kirra Reef (ie KRO3KRI2andKRI3)supportedbenthicfloraandfaunaInMarch2004theextentof the remainingwesternoutcropof KirraReef had been further reduced so that all inner reefsiteswerecompletelycoveredwithmobilesandConsequentlyonlyasingleoriginal reefsite(ieKRO3)couldbesurveyed(Figure23)Thereforetoprovideanindicationof the condition of the remaining reef two new sites were established (ie KRN1 and KRN2)(Figure23)andsurveyedinMarch2004Theextentofthewesternreefhadbeen further reduced by February 2005 and a third new site (ie KRN3) was established (Figure23)Consequentlyfoursites(KRO3KRN1KRN2andKRN3)weresurveyedin February2005
InFebruary2010fourKirraReefsites(ieKRO3KRO1KRN1andKRN2)wereclearof thesurroundingsandandsupportedbenthic floraand fauna Inaddition several rocks protruded from the sand in the vicinity of site KRI2H these were assessed to provide a quantitativeindicationofbroadRscaletemporalchangestotheinshorereefcommunities
SOURCEScopy Copyright Commonwealth of Australia (Geoscience Australia) 2001 2004 2006copy The State of Queensland (Department of Natural Resources and Mines) 2015copy Nearmap 2014 2015
DATE2015-09-09
DRAWN BYCF
VERSION02
PROJECTIONCoordinate System GDA 1994 MGA Zone 56Projection Transverse MercatorDatum GDA 1994
plusmn SCALE
0 50 100
Metres
Scale 12500 A3
frc environmental
Appendix$B$ Introduction$to$Data$Analysis$Used$
Multivariate$Analyses$
Multivariate statistical techniques are widely used in ecology to assess the similarities relationshipsbetweenassemblagesWhereasunivariateanalysescanonlycompareone variable at a time (eg an index of community structure such as a diversity index or a singleindicatorspecies)multivariateanalysescancomparesamplesbasedontheextent thatassemblagesshareparticulartaxaandabundances(ClarkeampWarwick2001)
Thefirststepofmultivariateanalysisusuallyinvolvesthecreationofamatrixofsimilarity coefficients computed between every pair of samples The coefficient is usually a measureofhowclose theabundance is foreachspecies (definedso that100= total similarity and 0=complete dissimilarity) The Bray Curtis similarity measure is commonlythemostappropriateforbiologicaldata(ClarkeampWarwick2001)
MultidimensionalScaling
NonRmetricmultiRdimensionalscalingordinations(nMDS)attempttoplacesamplesintwo dimensionalspacesothattherankorderofthedistancesbetweensamplesmatchesthe rankorderofthematchingsimilaritiesfromthesimilaritymatrix(ClarkeampWarwick2001) Thisprovidesavisualrepresentationofthesimilaritiesbetweenassemblageswithineach sampleEachoftheaxesisnotrelatedtoanyparticularvalueHinfactaxescanberotated toprovide thebestvisual representationof thedata Ordinationsareparticularlyuseful tools for analysing and visually presenting differences between assemblages Ordinationsareessentiallymapsofsamples inwhich theplacementofsampleson the mapreflectsthesimilarlyofthecommunitytothecommunitiesinothersamples(Clarkeamp Warwick 2001) Distances between samples on an ordination attempt to match the similarities inassemblagestructurenearbypoints representassemblageswithvery few attributes(speciesorabundanceofspecies)Hpoints faraparthavevery fewattributes in common(ClarkeampWarwick2001)
A stress coefficient is calculated to reflect the extent to which the multiRdimensional scalingordinationandthesimilaritymatrixagree(ClarkeampWarwick2001)(iehowwell the multiRdimensional scaling ordination accurately reflects the relationship between samples)Stressvaluesoflt015aregenerallyacceptable
In Figure A1 each freshwater macroinvertebrate sample is represented on the multiRdimensionalscalingordination By lookingat thedistancesbetweeneachsample
ANOSIMisanalogoustoANOVAinunivariatestatistics(Smith2003)AglobalRstatistic iscalculatedtodeterminewhetherthereisasignificantdifferencebetweenallsamplesIf there are differences then pairwise comparisons are conducted to test for differences betweenpairsofsamples(analogoustopostRhoctestsinANOVA)
The R value lies between R1 and +1 (all similarities within groups are less than any similarity between groups) with a value of zero representing the null hypothesis (no differenceamongasetofsamples)(ClarkeampWarwick2001)ComparisonofpairwiseR values can give an indication of how different assemblages are R values close to 0 indicatelittledifferencevaluesaround05indicatesomeoverlapandvaluescloseto1to indicate many or substantial differences In many instances however researches are primarily interestedinwhethertheRvalueisstatisticallydifferentfromzero(usuallyata confidence level of 005) (Clarke amp Warwick 2001) (ie whether they can reject the null hypothesis)
ANOSIM can provide information on whether the (visual) differences between assemblages in the multiRdimensional scaling ordination are significantH it is an independenttestfromthemultiRdimensionalscalingordinationItisbasedontestingthe
TRESBPKirraReefMarineBiotaMonitoring2015 B2
frc environmental
differences between the rank similarities in the similarity matrix not on the distances betweensamplesinthemultiRdimensionalscalingordination(ClarkeampWarwick2001)
PermutationalMultivariateAnalysisofVariance
PERMANOVAisusedtotestsimultaneousresponsesofoneormorevariablestooneor more factors in an a0 priori0 structured design using random permutation of the data to assess significance (Anderson 2004) PERMANOVA generates a pseudo FRstatistic similar to traditional ANOVA but pRvalues are calculated with permutations which does notassumenormaldatadistribution PERMANOVAcanprovide informationonwhether the (visual) differences between assemblages in a multiRdimensional scaling ordination are significantH however it is an independent test from the multiRdimensional scaling ordination
Thelevelofmultivariatedispersionamongsampleswithineachofthetestgroupscanbe examined using the permutational analysis of multivariate dispersions (PERMDISP) routine(Anderson2004)Intraditionalimpactassessmentachangeinthedispersionof datacanalsoindicateanimpact
SimilarityPercentagendashSpeciesContributions
SIMPER analysis provides information on how dissimilar assemblages from various groups are (eg how similar all of the macroinvertebrate samples taken for a particular habitatwithinastreamreachare)andhowsimilareachgroup(egreach)istoanyother group SIMPER analysis also identifies the species taxa that are contributing to the dissimilarity between two assemblages in rank order (ie it identifies which species is contributingthemosttothedifferences)SIMPERanalysismayhelptoidentifypotential lsquoindicatorrsquospeciesForexampleifaparticularspeciesconsistentlycontributesgreatlyto the differences between impacted and unimpacted assemblages it may be a useful indicator Theabundanceofthis indicatorspeciescanthenbecomparedbetweensites usingunivariatetechniquessuchasANOVA
Data is available on request from tresbpprojectofficecrownlandnswgov
TRESBPKirraReefMarineBiotaMonitoring2015 C1
frc environmental
Appendix(D( Pairwise( PERMANOVA( Results
Data is available on request from tresbpprojectofficecrownlandnswgov
TRESBPKirraReefMarineBiotaMonitoring2015 D1
frc environmental
Appendix(E( Relative(Abundance(of(Fish(found(at(Kirra(( ( and(Palm(Beach(Reefs(in(Each(Survey((Data is available on request from tresbpprojectofficecrownlandnswgovau
TRESBPKirraReefMarineBiotaMonitoring2015 E1
Structure Bookmarks
0 50 100 Metres Scale 12500 A3
0 50 100 200 Metres Scale 15000 A3
Kirra Reef
Kirra Reef
Kirra Reef
Kirra Reef
Kirra Reef
Kirra Reef
Map A1Location of Kirra Reef monitoring sites
Table D8 Pairwise comparison of macroalgae cover between sites in each year
Table D15 Pairwise comparison of turf algae cover between sites in each year
Table D29 Pairwise comparison of ascidian cover between sites in each year
Table D43 Pairwise comparison of soft coral cover between sites in each year
frc environmental
23$ Fish$
ThespeciesrichnessandrelativeabundanceoffishatKirraReefandPalmBeachReef were assessed using a combination of underwater visual census (UVC) and video surveys The combination of these techniques represents the most costeffective and efficientmeansofobtainingdataonthestructureoffishassemblagesindifferenthabitats (Murphy amp Jenkins 2010) A baited remote underwater video (BRUVX baited with pilchards) and footage captured by a diver swimming hapazard trasects over the reef wererecorded
Video footage from each BRUV (approximately 20minutes) and video transects (approximately 35 minutes) was reviewed by an ecologist experienced in marine fish identification
24$ Data$Analysis$
Permutational multivariate analysis of variance (PERMANOVA) was used to determine differences in the composition (cover of benthic fauna and taxonomic group) of benthic assemblagesbetweenKirraReefandPalmBeachReefover time PERMANOVAuses permutational methods (PsuedoAF) to derive statistical significance which require fewer assumptionstobemetthananalogousmethodssuchasmultivariateanalysisofvariance (MANOVA) (Anderson 2001X Anderson et al 2008) This analysis enables an examinationofchangesinthecommunityasawhole
A three factor PERMANOVA was used to examine differences in the composition of benthic assemblages with survey (fixed factor) locations (Palm Beach Reef and Kirra Reeffixedfactor)andsites(nestedinlocationsasarandomfactor)asthefactorsData weresquareroot transformedtodownweightdominatingspeciesabundanceXconverted toaBrayCurtisdistancematrixXandtestedforsignificanceusingasmanypermutations as allowed (9800 to 9937 unique permuations achieved for all factors and factor combinationsXexceptlocationwhere10uniquepermutationswereachieved))Posthoc pairwisetestwasusedtodeterminethemagnitudeofdifference
Nonmetricmultidimensionalscaling (nMDS)ordinationswereused tovisually represent the variation in the composition of assemblages between reefs separately for each survey nMDS ordinations were also used to visually represent the variation in the compositionofassemblagessurveysatKirraReefforallsurveysXbaselinesurveyinApril 1995andMarch2015XandApril2014andMarch2015
Separate univariate PERMANOVAs were used to compare differences in the cover of macroalgae turf algae and the abundance of crinoids and ascidians Data were
TRESBPKirraReefMarineBiotaMonitoring2015 16
frc environmental
converted to a eucildean distances matrixX and tested for significance using as many permutations as allowed (998 to 999 unique permuations achieved for all factors and factor combinationsX except location where 10 unique permutations were achieved) Factors were survey (fixed factor) locations (Palm Beach Reef and Kirra Reef fixed factor)andsites (nested in locationsanda random factor) Posthoc pairwise testwas used to determine the magnitude of difference Monte Carlo procedures were used to calculateempiricalPvaluesforthesurveyxlocationtest
Further information on the use and interpretation of PERMANOVA and other analyses usedinthisreportisprovidedinAppendixB
TRESBPKirraReefMarineBiotaMonitoring2015 17
frc environmental
3$ Results$
31$ Cover$of$Benthic$Assemblages$
The composition of benthic fauna and flora ( cover and type combined Appendix C) variedbetweenmostsitesatbothKirraReefandPalmBeachReefandbetweennearly allsurveysateachsite(notethesignificantinteractionofsite(location)xsurveyinTable 31X Appendix D) Nevertheless there appeared to be substantial differences in the compositionofthebenthicassemblagesbetweenthetworeefsineachsurveyfrom1995 to2015(Figure31toFigure33)
In2015 therewassomeoverlap in thecompositionofassemblagesonKirraandPalm Beach Reefs (Figure 33) However there was also some clear patterns of difference including
Benthic assemblages at Kirra Reef appeared to show some overlap between surveys (Figure34H) HowevernearlyallsurveysweredifferentateachsiteatbothKirraReef andPalmBeachReef(AppendixD)BenthicassemblagesinMarch2015andApril2014 wereverysimilarcomparedtobenthicassemblages inthebaselinesurvey inApril1995 andMarch2015(notethegreateroverlapinFigure35comparedtoFigure36)
In March 2015 as in previous surveys the macroalgae Sargassum sp dominated the benthic assemblages at all sites at Kirra Reef (Figure 37) Other species present included
sdot Dictyopteris0arostichoides0
sdot Dilophus0intermedius00
sdot Zonariasp
sdot Laurencia0brongniartic0
sdot Amphiroa0anceps0
sdot Caulerpa0lentilliferaand
sdot Halimeda0discoideaand
sdot Macrocystissp
Juvenile kelp (from the genus Macrocystis) was also emerging on some areas of Kirra Reef
ThecoverofmacroalagevariedbetweensitesandsurveysatbothKirraReefandPalm Beach Reef with the magnitude of difference varying over time (note the significant interaction between site (location) x survey in Table 32) Macroalgae cover varied between surveys with 2001 being the most different to the other years (Appendix D) ThereweredifferencesbetweensitesatKirraReefinJune1995February1996January 2001 May 2003 February 2005 and February 2010 and between sites at Palm Beach ReefinJanuary2001andFebruary2010Inrecentsurveys(2012to2015)thecoverof macroalgaeatsitesatbothKirraReefandPalmBeachReefwassimilar (AppendixD) indicatingarelativelyconsistentdistributionacrossbothreefs
ThemeancoverofmacroalgaeatKirraReefhasdeclinedsinceitspeakin2001withthe greatest magnitude of decline recorded between January 2001 and May 2003 (Figure 38)InsurveysbetweenJune1995andMay2003Sargassumspformeddensecarpets overtherockysubstratecoveringupto58oftheavailablesurfaceareaofthereefIn February 2010 macroalgal cover was 12 Macroalgal cover has increased to 26 in March2015ThisissimilartothecoverrecordedinApril1995(23cover)(Figure38)
In2015nomacroalgaewasrecordedwithinthequadratsatPalmBeachReefThecover of macroalgae on Palm Beach Reef has been consistently lower than Kirra Reef since
TRESBPKirraReefMarineBiotaMonitoring2015 26
frc environmental
ecologicalmonitoringbegan typically lessthan5of theavailablesurfacearea(Figure 38)
The mean cover of turf algae varied between sites and surveys at both Kirra Reef and PalmBeachReef(notethesignificantinteractionbetweensite(location)xsurveyinTable 33)SpecificallythereweresignificantdifferencesbetweensitesatbothKirraReefand PalmBeachReefinJune1995January2001February2010July2012andApril2014 (aswellasbetweensitesinFebruary1996atKirraReef)Thecoverofturfalgaevaried betweenmostsurveysatallsitesateachreef(AppendixD)BothKirraandPalmBeach reefs showed major increases in the percent cover of turf algae from 2010 to 2012 followedbyadecreaseincoverbetween2012and2014(Figure310)Thecoverofturf algae is typically lower at Kirra Reef than at Palm Beach Reef (July 2012 being an exception) and was again slightly lower at Kirra Reef in March 2015 (Table 310) In March2015turfalgaewasmoreprevalentatKirraReefthanduringthebaselinesurvey ofApril1995
ThemeancoverofspongesatsomesitesatbothKirraReefandPalmBeachReefhas varied significantly during some surveys (note the significant interaction between site (location)xsurvey inTable34HFigure311) However thecoverofspongestendedto bemore temporallyvariable atKirraReef than at Palm Beach Reef (Figure312) The cover of sponges at Kirra Reef varied between sites in February 1996 January 2001 March2004July2012andApril2014 However thecoverofspongesatPalmBeach Reefonlyvariedbetweensites inJanuary2001andFebruary2010 (AppendixD) The cover of sponges varied between survey at each site with 1995 1996 and 2001 most differenttootheryears(AppendixD)
ThemeancoverofspongesatKirraReefdeclinedbetweenMarch2004(20cover)and February 2010 (less than 1 cover) Since 2010 the cover of sponges has increased slightly with sponges covering 8 of the reef in March 2015 (Figure 312) In March 2015thecoverofspongeswashigherthanrecordedduringthebaselinesurveyinApril 1995(3cover)(Figure312)
Figure312 Mean cover of sponges (plusmnSE) at Kirra Reef and Palm Beach Reef on all
surveys
Table34 Univariate PERMANOVA results for differences in the cover of sponges betweensurveysandlocations
Factor$ df$ MS$effect$ PseudoF$ p$(perm)$
survey 10 18576 276 0018
location 1 39671 589 0210
site(location) 4 67354 477 0001
locationxsurvey 10 1490 221 0032
site(location)xsurvey 40 67331 477 0001
error 924 14108
Shadingdenotessignificanceatplt005
TRESBPKirraReefMarineBiotaMonitoring2015 32
frc environmental
Ascidians$
ThemeanabundanceofallascidiansotherthanPyura0stoloniferahasvariedsignifcantly between sites at Kirra Reef and Palm Beach Reef and between surveys at each site (Figure314andnotethesignificantinteractionbetweensite(location)xsurveyinTable 35) The abundance of ascidians was different between sites at Kirra Reef in January 2001May2003March2004February2005andApril2014HanddifferentatPalmBeach ReefinJanuary2001February2005February2010andMarch2015Theabundance ofascidiansvariedbetweensurveysateachsitewith1995beingmostdifferentwhenthe abundanceofascidianswaslow(AppendixD)InMarch2015theabundanceofallother ascidiansonKirraReefandPalmBeachReefwashigherthanpreviouslyreportedinthe baselinesurveyinApril1995(whennoascidianswererecorded)Themeanabundance washigheratKirraReefthanatPalmBeachReef(Figure314)
ThemeanabundanceofPyura0stoloniferahasvariedconsiderablybetweensitesatKirra Reef and Palm Beach Reef over time (note the significant interaction between site (location) x survey in Table 36) In March 2015 the mean abundance (individual per 025m2plusmnSE)of theascidianPstolonifera (Figure313)wassimilaratKirraReefand PalmBeachReef(Figure315)ThemeanabundanceofP0stoloniferahasrangedfrom 02to17individualsper025m2atbothreefssinceMay2003
Figure315 Mean abundance of ascidians (Pyura0 stolonifera) (individuals025m2)
(plusmnSE)atKirraReefandPalmBeachReefinallsurveys
TRESBPKirraReefMarineBiotaMonitoring2015 34
frc environmental
Table35 Univariate PERMANOVA results for the differences in cover of all ascidians otherthanPyura0stolonifera0betweensurveysandlocations
Factor$ df$ MS$effect$ PseudoF$ p$(perm)$
survey 10 26658 474 0001
location 1 13603 710 0104
site(location) 4 19154 149 0212
locationxsurvey 10 2629 468 0001
site(location)xsurvey 40 5621 438 0001
error 924 12828
Shadingdenotessignificanceatplt005
Table36 Univariate PERMANOVA results for the differences in Pyura0 stolonifera densitybetweensurveysandlocations
Factor$ df$ MS$effect$ PseudoF$ p$(perm)$
survey 10 16254 11842 0001
location 1 12445 60881 0206
site(location) 4 20442 56799 0001
locationxsurvey 10 79724 58082 0001
site (location) x 40 13726 38138 0001 survey
error 924 35991
Shadingdenotessignificanceatplt005
$
TRESBPKirraReefMarineBiotaMonitoring2015 35
frc environmental
Hard$Coral$
There was a significant difference between the cover of hard corals at Kirra Reef and PalmBeachReefduringsomesurveys(notethesignificantinteractionbetweenlocationx surveyinTable37)SpecificallytherewassignificantlymorehardcoralatPalmBeach Reef thanKirraReef inFebraury1996March2004April2014andMarch2015(Table 38)
ThecoverofhardcoralistypicallylowonKirraReefaccountingforlessthan2ofthe availablesubstrateInMarch2015hardcoralcoveredlessthan1oftheareaofKirra Reef which was less than the cover recorded during the baseline survey in April 1995 (Figure 316) In contrast hard coral covered 11 of the surface area at Palm Beach ReefwhichwasgreaterthanthecoverrecordedinApril1995(Figure316)
The cover of hard corals at Palm Beach Reef has been more variable over time comparedtothecoverofhardcoralatKirraReef(Figure316)Withtheexceptionofthe surveys inApril1995andJanuary2001when thecoverofhardcoralwas lowonboth reefshardcoralsaretypicallymoreprevalentatPalmBeachReef(Figure316)
Table38 PERMANOVA post hoc pairwise results for the differences in the cover of hardcoralbetweenlocationsineachsurveyevent
Hard$Corals$ Survey$
t$ p$(MC)$a$
Apr1995 054 0606
Jun1995 182 0140
Feb1996 541 0006
Jan2001 R R
May2003 166 0168
Mar2004 765 0001
Feb2005 049 0646
Feb2010 156 0197
Jul2012 283 0053
Apr2014 525 0011
Mar2015 695 0003 Shadingdenotessignificanceatplt005 a pvaluesbasedonMonteCarlotests
TRESBPKirraReefMarineBiotaMonitoring2015 37
60
50
40
30
20
10
0
Soft
Cor
al C
over
()
Kirra Reef Palm Beach Reef
frc environmental
Soft$Coral$
The cover of soft coral was significantly different between sites at both Kirra Reef and PalmBeachReefandduringsomesurveys(notethesignificant interactionbetweensite (location)xsurvey)TherewasnosoftcoralrecordedatKirraReefinMarch2015The coverofsoftcoralhasdeclinedatKirraReefsince2003andhascoveredlessthan2of theavailablesubstratesince2005whichissimilartothecoverofsoftcoraldescribedfor the baseline surveys in 1995 (Figure 317) The cover of soft coral was consistent betweensitesineachsurveyexceptbetweensitesin
sdot April1995atKirraReef
sdot 1996atKirraReef
sdot 2003atPalmBeachReefand
sdot 2014atPalmBeachReef(AppendixD)
Soft corals have historically covered more of the available space on Palm Beach Reef than on Kirra Reef However there was more temporal variability within sites at Palm BeachReefthanatKirraReef(AppendixD)ThecoverofsoftcoralatPalmBeachReef has varied over time and was highest in April 1995 (48 cover) Despite increasing sinceFebruary2005itisstilllowerthanthecoverrecordedduringthebaselinesurveyin April1995(Figure317)
Table39 UnivariatePERMANOVAresults for thedifferences in thecoverofsoft coral betweensurveysandlocations
Factor$ df$ MS$effect$ PseudoF$ p$(perm)$
survey 10 44657 1323 0001
location 1 32922 6620 0117
site(location) 4 49732 266 0036
locationxsurvey 10 40982 1214 0001
site (location) x 40 3376 181 0002 survey
error 924 18688
Shadingdenotessignificanceatplt005
$
TRESBPKirraReefMarineBiotaMonitoring2015 39
frc environmental
Crinoids$
ThereisasignificantdifferencebetweensomesitesatbothKirraReefandParmBeach Reef that varies through time (note the significant interaction between site (location) x survey inTable310) Theabundanceofcrinoidshasbeensimilarbetweensites inall years at Palm Beach ReefH and was different beween sites at Kirra Reef in June 1995 February1996May2003andFebruary2005(AppendixD)Withineachsitetherehas been some natural temporal variability particualrly at Palm Beach Reef sites in 2001 (Appendix D) The mean abundance (individuals 025m2) of crinoids (Figure 318) at KirraReefandPalmBeachReefhasgenerallybeenlessthan2individualsper025m2 andhasdeclinedatboth locationssincethebaselinesurvey inApril1995(Figure319) However the mean abundance of crinoids on Kirra Reef has shown a slight increase sinceFebruary2010(Figure319)
In March 2015 fewer crinoids were recorded at Palm Beach Reef than at Kirra ReefH crinoidshavebeenrareatPalmBeachReefsince2003
The species richness of fish recorded from Kirra Reef across all monitoring events has rangedfrom14to57 InMarch201557specieswereidentifiedat thereefwhichwas similar to April 2014 (53) and higher than previous surveys (Figure 320) Species richnessatPalmBeachReefwas lower(34species)andgenerallyvaried lessbetween surveyscomparedtoKirraReef
InMarch2015 the assemblage of fish at KirraReef comprised species fromall trophic levelsincludingdetritivoresplanktivoresherbivoresandcarnivores(AppendixE)Asin previous surveys the assemblage was dominated by herbivores and planktivores Yellowtail (Trachurus0 novaezelandiae) and striped sea pike (Sphyraena0 obtusata) were the dominant species present in large schools (Figure 321) Australian mado (Atypichthys0 strigatus) ringRtailed surgeon (Acanthurus0 blochii) silver trevally (Pseudocaranx0 georgianus) eastern pomfred (Schuettea0 scalaripinnis) sweep (Scorpis0 lineolatus) and various wrasses were also very abundant releative to other species (AppendixE)
Two new species were observed at Kirra Reef the orangeRband surgeon (Acanthurus0 olivaceus) and the unicornfish (Naso0 sp) Five new species were recorded at Palm BeachReef
No threatened or protected fish species listed under the Queenslandrsquos Nature0 Conservation0Act01992ornationallyundertheEnvironmental0Protection0and0Biodiversity0 Conservation0 Act0 1999 were observed The complete list of species recorded and the relativeabundanceispresentedinAppendixE
TRESBPKirraReefMarineBiotaMonitoring2015 42
60
0
10
20
30
40
50
Num
ber
of F
ish
Spe
cies
Apr-95
Jun-95
Feb-96
Jan-01
May-03
Mar-04
Feb-05
Feb-10
Jul-12
Apr-14
Mar-15
Kirra Reef Palm Beach Reef Location
frc environmental
Figure320 Number of fish species recorded at Kirra Reef and Palm Beach Reef on
ThegreatestchangetotheecologicalconditionofKirraReefsincethebaselinesurveyin 1995 has been the loss of large areas of hard substrate that support benthic flora and faunaThedeliveryoflargesandvolumesduringthestage1dredgingoperations(1995 to1998)andtheinitialoperationofthesandbypasssystem(2001to2008)resultedinan increaseinwaveactionandtidalcurrentsredistributingthissandoverKirraReef
The three major outcrops of Kirra Reef (northern southern and eastern sections) are naturally exposed and covered depending on water and sand movements In March 2015 the rocky outcrops in the northern section of Kirra Reef were exposed and supportedamoderatelydiversebenthicassemblagedominatedbyturfalgaeTherewas arelativelyhighfishdiversityatKirraReefTheecologicalassemblageexhibitedsignsof ongoingstressfromphysicaldisturbanceincludingtheabsenceofsoftcoralsandrarityof hardcoral(MumbyampSteneck2008)HoweverKirraReefhasarelativelyhighcoverof sponges and ascidians Sponges ascidians and crinoids were more abundant at Kirra ReefthanatPalmBeachReefinMarch2015
KirraReefcontinues toprovidehabitatandsupport importantecological functions in the region providing hard substrate for the colonisation of algae and benthic invertebrates and food and refuge for fish As sand levels have stabilised since 2008 assemblages have becomemoresimilar to those recordedprior to implementationof the TRESBP in April1995 Forexamplemacroalgalcover inApril1995andMarch2015wasrelatively similarHoweverassemblagecompositionisstillsignificantlydifferenttothatrecordedin thebaselinesurveysmostnoticeablyduetoa lowercoverofbaresubstrateandhigher coverofturfalgaeandascidianssincesurveyshavebeenperformed
Benthic$Macroalgae$
The cover of macroalgae at Kirra Reef was relatively similar during the 2014 and 2015 surveys and remained well below the peak of nearly 60 cover recorded in January 2001TherewasasteepdeclineinthecoverofmacroalgaebetweenJanuary2001and May2003whichappearedtobestronglyassociatedwith thedecline inreefareaduring that time as well as a decline in the cover of Sargassum sp (an important indicator speciesonKirraReef) SimilardeclineswereevidentatPalmBeachReefbetween the January2001andMay2003surveys
TRESBPKirraReefMarineBiotaMonitoring2015 45
frc environmental
The cover ofmacroalgae at Palm Beach Reef was much lower thanat Kirra Reef over time There are several possible reasons for the lower cover of macroalgae at Palm Beach
sdot PalmBeachReefisdeeperthanKirraReefandgenerallyhashigherturbidityand therefore greater light attenuation The quantity and quality of available light affectsthedistributionandgrowthofmacroalgae(MillerampEtter2008)
sdot Differences in the pattern of recruitment of algal species to the reefs due to differentwatercurrentsandtimingofthesurveys(Kennelly1987b)
sdot Increased competition with turf algae and sessile benthic invertebrates which competeforspacewithmacroalgae(Kennelly1987aHMillerampEtter2008)
sdot PresenceofdifferentspeciesandhigherdensityofherbivoresatPalmBeachReef (particularly sea urchins and herbivorous fish) which graze on macroalgae (McCook1997HJompaampMcCook2002)
Biological assemblages exposed to physical stress typically exhibit greater levels of temporalandspatialvariability(WarwickampClarke1993HChapmanetal1995)Temporal variationinthecoverofmacroalgaeatKirraReefislikelytobeprincipallyduetotheeffect ofphysicaldisturbance fromwaveactionaswellas theassociatedassociatedabrasion andsmotheringbysandTheeffectsofthesephysicaldisturbanceswouldincreasewith thereductionofKirraReefasedgeeffectsarepronouncedandwaterdepth isreduced Increasedsmotheringbysandcanalsoreducediversity(Hatcheretal1989)abundance recruitment growth survival and seasonal regeneration of macroalgae (Umar amp Price 1998HCheshireetal1999)
Changes in the cover of macroalgae on Kirra Reef over time are also likely due to the extentofthereefchangingHthefishandmobileinvertbratesassociatedwiththereefmay have concentrated which would in turn increase grazing pressure Increased grazing pressure from fish and mobile invertebrates can reduce the coverage and diversity of macroalgaeonreefs(McCook1997HJompaampMcCook2002)
Thecoverof turfalgaeatbothKirraReefandPalmBeachReefhasvariedsignificantly betweensurveysPriorto2005turfalgaetypicallycoveredlessoftheavailablesurface areaonKirraReefthanPalmBeachReefInMarch2015themeancoverofturfalgae hasincreasedsincebaselinesurveysin1995andwasrelativelysimilarbetweenreefs(40 plusmn4atKirraReefcomparedto48plusmn4atPalmBeachReef)Thecoverofturfalgaeat Kirra Reef was similar in 2014 and 2015 which was generally higher than previous surveysexceptduringJuly2012whencoverofturfalgaepeakedat67plusmn4
TRESBPKirraReefMarineBiotaMonitoring2015 46
frc environmental
Turfalgaearebecomingadominantcomponentofcommunitiesaroundtheworld likely the result of rapid colonisation of openspace after a disturbance (eg storms) nutrient enrichment andor changes in grazing pressures Turf algae can also reflect a more physically robust growth form suited to high wave energy environments (than foliose macroRalgae)TurfalgaepeakedintheJuly2012surveylikelyrelatedtotheincreasein bare reef exposure following a stormy conditions in early 2009 and between December 2011 and June 2012 Turf algae have been the dominant form of algae on Kirra Reef sincethistimealbeitthecoverlowerthanthe2012survey
Increased cover of turf algae is typically related to good light conditions high concentrationsofnutrientsandlownumbersofgrazerssuchasfish(orconstantgrazing pressure preventing macroalgae colonisation) However the relationship between algal dynamics physical disturbance water quality and herbivore grazing activity is complex andthecoverof turfalgaecanexhibitextremetemporalvariabilityasaconsequenceof the interactionbetween topRdownandbottomRupprocesses (Russ2003HBellwoodetal 2006H Hughes et al 2007H Albert et al 2008H Hoey amp Bellwood 2008H Mumby 2009) Furtherinvestigationwouldberequiredtoreliablydeterminethemechanismsofchangein bothmacroalgaeandturfalgaeassemblagesonthesereefs
Benthic$Macroinvertebrates$
AtKirraReeftheburialandreRemergenceofrockyoutcrops(influencedbytheTRESBP) islikelytohaveincreasedtemporalvariabilityinthedistributionandabundanceofbenthic macroinvertebrates Additional perturbations such as wave action and sand abrasion (each influenced through changes in bathymetry seabed topography and water depth) are likely to have resulted in the decline in cover and diversity of the benthic macroinvertebratesatKirraReefbetweensurveysparticularlybetweenMarch2004and February2005andduringtheseverestormsof2009Benthicmacroinvertebratessuch asascidiansspongeshardcoralandsoftcoralarehighlysusceptible to theeffectsof stormandwavedisturbancephysicalabrasionandburialbysand(KayampKeough1981H Walker et al 2008) which can affect settlement growth rate and survival (Dodge amp Vaisnys1977HRogers1990)
Physical disturbance from sand burial sand abrasion and the action of storm waves appeartokeepthebenthicassemblagesofKirraReefinastateofearlysuccessionItis commonforearlypioneerspeciessuchassomemacroalgaetorecruitrapidlytoahard surface in large numbers allowing these species to dominate assemblages early in the successionaltrajectory(Walkeretal2007)
Afurther indicatorof theearlystateofsuccessionatKirraReef isthatthecoverofhard and soft coral has remained very low (generally lt 5) In March 2015 less than 1
Benthic macroinvertebrate cover may also be affected indirectly through increased competitionwithmacroalgaeforspaceThepresenceoflargemacroalgaecanaffectthe recruitment and survival of sessile benthic invertebrates as fronds moving with wave action sweep and abrade the surface of rocks killing new recruits especially corals (Kennelly1989HMcCooketal2001)Itcantakeseveralyearsforhardandsoftcoralto become dominant on reefs in the SEQ region (SchlacherRHoenlinger et al 2009) Therefore hard coral is not expected to become abundant until several years after the reefhasbeenuncoveredandonlyifthephysicaldisturbanceregimeandsupplyofnew recruitsissufficienttosupportsurvivalandgenerationalsuccessionofthesespeciesThe coverofhardandsoftcoralsatKirraReefwerebothverylowandpatchypriortothestart oftheTRESBP
Sponges and ascidians are highly susceptible to smothering and sand abrasion unless theyhaveathicktunic(outercoveringmadeofkeratin)liketheascidianP0stolonifera0or strong internal keratin silicon or calcareous structures in the case of some species of sponges0(KayampKeough1981HMcGuinness1987HWalkeretal2008)Duetoincreased wave action and sedimentation (which can be influenced by the TRESBP) the mean coverofascidiansandspongeswasexpectedtobemuchloweronKirraReefthanPalm Beach Reef However in March 2015 the cover of sponges was similar between the reefsandthecoverofascidians(otherthanP0stolonifera)wasgreateratKirraReefthan at Palm Beach Reef This suggests that Kirra Reef is slowly recovering from the increasedstressofphysicaldisturbancesuchas increasedwaveactionandsandscour andorthatwaveandstormconditionshavebeenlesssevereinthepastfewyears
Fish$
KirraReefcontinuestosupportahighdiversityofreefRassociatedandpelagic(ienonR reefassociated) fishspecies Despite itsdiminishedsizecompared to1995KirraReef continuestoprovidevaluablehabitatforanumberoffishspeciesfromdifferentfunctional groups
ThereisahighdegreeofinterRannualvariabilityinthespeciesandabundanceofthefish present at Kirra Reef compared with the assemblage at Palm Beach Reef This likely reflectsthetemporalvariabilityintheavailablehabitatasaconsequenceofreefburialand reRemergenceThediversityqualityandarealextentofreefhabitatareimportantfactors influencing the distribution abundance biomass and diversity of reef fish (Bellwood amp Hughes2001HFriedlanderetal2003)Diversityandabundanceoffishcanincreasewith
TRESBPKirraReefMarineBiotaMonitoring2015 48
frc environmental
greaterstructuralcomplexityandincreasedheterogeneityofavailablehabitats(Bellwood ampHughes2001)Thissuggeststhatperiodsofreefburialreducetheoveralldiversityof reefRassociated fish species at Kirra Reef Despite the reduction in overall reef space therewasalargervarietyofhabitats(suchasmarcoalgaeandturfalgae)in2015which was likely to be related to the high diversity of fish assemblages This is particularly importantforseveralspeciesthatdependonthepresenceoflsquostructurersquosuchasprovided by reef habitat (ie oldwife moray eels damselfish and Australian mado that were recordedinMarch2015butwerenotrecordedinJuly2012)
Theabundanceanddiversityof fishare likelytobenegativelyaffectedfollowingperiods of severe weather which create unfavourable conditions for many species and may further exacerbate the affects of abrasion and sedimentation The biomass of fish is knowntodecreasewithincreasingexposuretophysicaldisturbancefromwaveactionand strong currents (Friedlander et al 2003) As our surveys have been undertaken at different times of the year variation in the prevailing conditions at the time of sampling could also influence the types of fish observed (and the amount of reef habitat that is availableatanytime)Manyofthespeciesmayalsobeaffectedbyseasonalchangesin the water temperature such as damselfish which are less abundant in cool waters However theoveralldiversityof the fishassemblageatKirraReef is likely toreflect the sizeoftheoutcropsexposedwithagreaterphysicaldisturbance(fromseaconditionsand sandmovement)andcompetitionHandlesserfoodavailablewhenthereefiscovered
ThepredictedimpactstoKirraReefasaresultoftheTRESBPincludedaccretionofsand around the base of the rock outcrops causing a reduction in extent of reef It was predictedthatsanddeliveryaspartoftheprojectwouldeventuallymimiclsquonaturalrsquopatterns ofsanddispersalandthatthereefwouldreturntoitsnaturalextent(ietheextentpriorto extension of the Tweed River training walls in 1962) The benthic flora and fauna assemblages of the reef the historical reef extent and natural sand transport patterns wereexpectedtoreturntoconditionsobservedbeforetheextensionofthetrainingwalls between 1962 and 1965 However the Environmental Impact Study did not predict the ecologicalconsequencesofboththereducedarealextentandincreasedwaveenergy(a consequenceofdecreaseddepth)thathavebeenrecorded
ThecurrentextentofKirraReef remains less than50of that recorded in1962and in 1995beforethesanddeliverybytheTRESBPcommencedHowevertheextentofreef in1995 wasstrongly influenced by adepletion in sand following the construction of the Tweed River training walls and the Kirra Point groyne Accumulation of sand on Kirra ReefwasobservedtoincreaseasaresultofindirectsandnourishmentbytheTRESBP and the reef has been extensively covered (particuarly between 2005 and 2010) as a result
Whiletheextentofthereefcontinuestochangeovertimethedeliveryofsandaspartof the project now more closely matches the natural rate of longshore sand transport ShortRtermandseasonalchangesintheextentofthereefarenowlikelytobetheresultof waveandcurrentaction(particularlyduringservereweatherevents)thanadirectimpact of the TRESBP Therefore the extent of Kirra Reef in March 2015 is broadly in accordancewithpredictionsmadeintheEISwhichpredictedthatthereefwouldreturnto a condition similar to that exhibited in the preR1960rsquos ie before the extension of the TweedRiverbreakwatersthatinterruptedlittoralsandsupplytothesebeaches
InDecember2013KirraPointgroynewasextendedby30mwiththeexpectationthatthe beach bar would move seaward as a consequence At present Kirra Point groyne is unlikelytohavehadamajorimpactonthearealextentofKirraReefHoweverongoing monitoringbasedonaerialphotographsmayprovidefurtherinsight
Sessile benthic assemblages on Kirra Reef are highly susceptible to the influence of storms and associated wave action (Kay amp Keough 1981H Walker et al 2008) The shallowreefissurroundedbymobilesandwhichcanshiftnaturallyinresponsetowave action during storms causing burial of large sections of Kirra Reef This effect has reduced the availability of rocky substrate for colonisation and the availability of refuge
Fromanexaminationof theextentofKirraReef fromarealmapsandwaveheightdata thereappears tobea relationshipbetween theareaof rockexposedandstormevents Notably in a series of storm events in May 2009 corresponds with large areas of rock becoming exposed (with the reef approximately 100m2 in 2006 and approximately in 1009m2 2009) Further a stormy conditions between December 2011 and July 2012 correspondstotheareaofexposedrockmorethandoublinginsizeWhiletherewasno changetothetotalareaofexposedrockfollowingstormyconditionsinearly2013there wasaclearchangeinthedistibutionofexposedrockduringthistimeSince2013storm conditions have been calm to moderate and there has been little change in the areal extentanddistrubtionofexposedrockatKirraReef
WaveheighttypicallyincreasesduringstormeventsandgiventheshallowdepthofKirra Reef waves are more likely to shoal and break across the reef during storms This increases thephysicaldisturbanceabrasionandsedimentationofbenthicassemblages onKirraReefStormdisturbancecancauselocalreductionsinthespeciesrichnessand abundanceofcoral(Woodleyetal1981HMasselampDone1993HHughes1994HConnellet al 1997) and can alter fish assemblages indirectly through habitat modifications (Kaufman1983HJonesampSyms1998)ordirectlybyincreasingfishmortality(Lassig1983) The hydrodynamic forces produced by wave action are an important source of disturbance in subtidal habitats inflicting damage through direct physical impact and abrasion(UnderwoodampKennelly1990)DirectimpactsfromphysicaldisturbanceatKirra Reefareevidentduringsurveyeventswhenlargefragmentsofmacroalgaearepresentin thewatercolumnoverthereef
Storm and wave action (and associated sedimentation and abrasion) continue to be importantforcesshapingthedistributionandabundanceofbenthicspeciesatKirraReef Increased magnitude and frequency of physical disturbance resulting from increased exposureorsusceptibility tostormsandassociatedwaveaction (asonKirraReef)can lead to a decrease in the diversity of sessile invertebrate assemblages DisturbanceR drivenreductionsinbiodiversityhavethepotentialtoimpactnegativelyonthehealthand productivity of reef ecosystems (Walker et al 2008) Biodiversity is important to reef health given that many of these species (eg sponges bryozoans and ascidians) contribute a range of vital ecosystem services to reefs including nutrient cycling (Scheffers et al 2004) trophic interactions and food webs (Lesser 2006H Pawlik et al 2007) bioRerosion (Rutzler 2002H LopezRVictoria et al 2006) and stabilizing substrata (DiazampRutzler2001HWulff2001)
Theimpactsof increasedwaveactionandsedimentationonthebenthicassemblagesat Kirra Reef are likely to be greatest during and immediately following storm conditions
TRESBPKirraReefMarineBiotaMonitoring2015 51
frc environmental
Partitioningtheinfluenceofstormandwavedrivendisturbancefromthatoftheoperation oftheTRESBPwouldrequireamuchmorestatisticallypowerfulandtemporilyreplicated experimental design Given there is a large collection of wave and storm data by TRESBP this would involve greater temporal sampling of Kirra Reef including event samplingfollowingseverewaveandstormactivity
The data generated by this Kirra Reef biota monitoring program doesnrsquot support statistically rigorous consideration of seasonality (monitoring has been at its most frequentannual)
InApril2014andMarch2015KirraReefcoveredlessthan50ofthereefrsquosextentprior to theoperationof theTRESBP The lossof reefhabitathasreducedtheavailabilityof hard substratum available for colonisation and consequently the abundance of benthic sessileassemblages
The reduced depth of water resulting from the accumulation of sand exacerbates the effects of storms and wave action It is likley that as a consequnece the biological communities of Kirra Reef will reflect earlyRstage succession more frequently and for longerperiods
While there is sufficient structure available frcenvironmentalexpect that Kirra Reef will continuetoprovideimportanthabitatforadiverseassemblageoffishes
TRESBPKirraReefMarineBiotaMonitoring2015 52
frc environmental
5$ Conclusions$
Although there is still a substantial portion of the reef covered compared to before the extension of the Tweed River entrance breakwaters the current extent of Kirra Reef is broadly inaccordancewithpredictionsmadein theEIS Initial lsquocatchRuprsquobypassingand dredgeplacementofsand(between2001and2008)resulted in theburialofKirraReef Subsequentsanddelivery(since2008onwards)morecloselyreflectsnaturalpatternsof longRshoresandtransportandisthereefhasslowlyreRemerged
Theextentofthereefhasbeenrelativelystablesince2013Thishasallowedforsome succession in the benthic assemblages including a relatively high cover of sponges ascidiansandcrinoidsWiththedeliveryofsandmorecloselymatchingthenaturalrateit isexpected the reef willundergoshortRtermchanges in extentdue toseasonal shifts in sand deliveryH however the diversity of benthic assemblages on Kirra Reef is likely to increaseovertimeThiswouldcreatemorespaceforspeciestorecruitandreducesthe influence of sand abrasion and wave damage It was predicted that the areas of Kirra Reef newly exposed in 2012 would undergo a shift from turfRdominated communities to more diverse communities that could include macroalgae sponges ascidians and potentiallyhardandsoftcoralWiththeexceptionofhardandsoftcoralsthisprediction wasconfirmedbytheresultsoftheApril2014andMarch2015surveys
ThediversityoffishesassociatedwithKirraReefisbroadlysimilartothatrecordedprior tothecommencementofsandbypassingin1995Giventhatfisharemobilethegreatest impacts on fish assemblages are likely to be shortRterm changes due to both the prevailingconditionsandchangestheextentofavailablehabitatthatprovidesshelterand foodforavarietyofdifferentspeciesIfKirraReefincreasesinsizethereislikelytobea greater proportion of cryptic benthic species as these species are more typical of assemblagesinalaterstageofsuccession(eg(WillisampAnderson2003))
Assuming a broadly stable delivery rate of sand and consequent stable extent of Kirra ReeflsquorecoveryrsquoislikleytobesubstantivelycompleteFloralandfaunalcommunitieswill undergo succession between severe storm events but are likley to remain relatively dynamic
Albert S Udy J amp Tibbetts I 2008 Responses of algal communities to gradients in herbivorebiomassandwaterqualityinMarovoLagoonSolomonIslandsCoral0 Reefs2773R82
Anderson MJ 2001 A new method for nonRparametric multivariate analysis of varianceAustral0Ecology2632R46
Anderson MJ 2004 PERMDISP0 a0 FORTRAN0 computer0 program0 for0 permutatinoal0 analysis0 of0 multivariate0 dispersions0 (for0 any0 twoSfactor0 ANOVA0 design)0 using0 permutational0 tests Department of Statistics University of Auckland New Zealand
Cannon LR Goeden GB amp Campbell P 1987 Community patterns revealed by trawling in the interRreef regions of the Great Barrier Reef Memoirs0 of0 the0 Queensland0Museum2545R70
Chapman MG Underwood AJ amp Skilleter GA 1995 Variability at different spatial scalesbetweenasubtidalassemblageexposedtothedischargeofsewageand two control assemblages Journal0 of0 Experimental0 Biology0 and0 Ecology 189 103R122
Cheshire AC Miller DJ amp Stewart R (1999) Effect0 of0 dispersed0 sediment0 plumes0 from0beach0sand0replenishment0dredging0on0recruitment0of0phaeophycean0algae0 to0rocky0reefs0in0Gulf0St0Vincent0South0Australia0The0Impact0of0Sand0Dredging0 on0 Benthic0 Community0 Structure0 at0 the0 Port0 Stanvac0 Dredge0 Site0 20 1S39 UniversityofAdelaideAdelaide
ConnellJHHughesTPampWallaceCC1997A30Ryearstudyofcoralabundance recruitment and disturbance at several scales in space and time Ecological0 Monographs67461R488
Diaz MC amp Rutzler K 2001 Sponges an essential component of Caribbean coral reefsBulletin0of0Marine0Science69535R546
DodgeREampVaisnysJR1977Coralpopulationsandgrowthpatternsresponsesto sedimentation and turbidity associated with dredging Journal0 of0 Marine0 Research35715R730
Done TJ 1982 Patterns in the distribution of coral communities across the central GreatBarrierReefCoral0Reefs195R107
Edwards RA amp Smith DA 2005 Subtidal assemblages associated with a geotextile reef insouthReastQueenslandAustraliaMarine0and0Freshwater0Research56 133R142
FisheriesResearchConsultants1991Survey0of0the0Intertidal0and0Subtidal0Rocky0Reefs0 of0 the0 Sunshine0 Coast report prepared for Queensland National Parks and WildlifeService
HarrisonPHarriotVBanksSampHolmesN1998ThecoralcommunitiesofFlinders Reef andMyora Reef in theMoretonBay MarineParkQueensland Australia In Moreton0 Bay0 and0 Catchment Tibbits I Hall N amp Dennison W (Eds) SchoolofMarineScienceUniversityofQueenslandStLuciapp525R536
Hatcher B Johannes R amp Robertson A 1989 Review of research relevant to the conservationofshallowtropicalmarineecosystemsOceanography0and0Marine0 Biology0an0Annual0Review27337R414
Hoey A amp Bellwood D 2008 CrossRshelf variation in the role of parrotfishes on the GreatBarrierReefCoral0Reefs37R47
TRESBPKirraReefMarineBiotaMonitoring2015 56
frc environmental
Hollingsworth P 1975 Environmental Investigation Report Crown Reserve R R68 Currumbin Creek City of the Gold Coast Land Administration Commission unpublishedreport
Hughes TP 1994 Catastrophes phase shifts and large scale degradation of a CaribbeancoralreefScience2651547R1551
Hughes TP Rodrigues MJ Bellwood DR Ceccarelli D HoeghRGuldberg O McCook L Moltschaniwskvi N Pratchett MS Steneck RS amp Willis B 2007Phaseshiftsherbivoryandtheresilienceofcoralreefstoclimatechange Current0Biology17360R365
Hutchinson A Rempel C Taveras V Loder J amp Salmond J 2013 Reef0 Check0 Australia0 South0 East0 Queensland0 Summary0 Report0 2013 report prepared for ReefCheckFoundationLimited
Hyder Consulting 1997 Tweed0 River0 Entrance0 Sand0 Bypassing0 Project0 Permanent0 Bypassing0 System0 0 Environmental0 Impact0 Statement0 0 Impact0 Assessment0 Study report prepared for New South Wales Department of Land and Water Conservation
Jompa J amp McCook LJ 2002 Effects of competition and herbivory on interactions betweenahardcoralandabrownalgaJournal0of0Experimental0Marine0Biology0 and0Ecology27125R39
KayAMampKeoughMJ1981Occupationofpatchesintheepifaunalcommunitieson pier pilings and the bivalve Pinna bicolor at Edithburgh South Australia Oecologia48123R130
KennellyS1987aInhibitionofkelprecruitmentbyturfingalgaeandconsequencesfor an Australian kelp community Journal0 of0 Experimental0 Marine0 Biology0 and0 Ecology11249R60
Kennelly S 1987b Physical disturbances in an Australian kelp community I temporal effectsMarine0Ecology0Progress0Series40145R153
TRESBPKirraReefMarineBiotaMonitoring2015 57
frc environmental
Kennelly S 1989 Effects of kelp canopies on understory species due to shade and scourMarine0Ecology0Progress0Series50215R224
Lassig BR 1983 The effects of a cyclonic storm on coral reef fish assemblages Environmental0Biology0of0Fishes955R63
Lawson S McMahon J amp Boswood P 2001 Environmental management of the construction and operation of a sand bypassing system at the Tweed River EntranceInThe15thAustralasianCoastalandOceanEngineeringConference the 8th Australasian Port and Harbour Conference 25 R 28 September 2001 QueenslandAustralia
Lesser MP 2006 BenthicRpelagic coupling on coral reefs feeding and growth of Caribbean sponges Journal0 of0 Experimental0 Marine0 Biology0 amp0 Ecology 328 277R288
LopezRVictoriaM ZeaSampWei E2006 Competition for spacebetweenencrusting excavatingCaribbeanspongesandothercoral reeforganismsMarine0Ecology0 Progress0Series312113R121
MalcolmHASmithSDAampJordanA2009Usingpatternsofreeffishassemblages to refine a Habitat Classification System for marine parks in NSW Australia Aquatic0Conservation0Marine0and0Freshwater0Ecosystems2083R92
Massel SR amp Done TJ 1993 Effects of cyclone waves on massive coral assemblages on the Great Barrier Reef meteorology hydrodynamics and demographyCoral0Reefs12153R166
Mumby PJ amp Steneck RS 2008 Coral reef management and conservation in light of rapidly evolving ecological paradigms Trends in Ecology amp Evoution 23 555 -563
Murphy HM amp Jenkins GP 2010 Observational methods used in marine spatial monitoring of fishes and associated habitats a review Marine and Freshwater Research 61 236-252
Noriega R 2007 An Overview of Available Information on Sandy Beach Ecology Coastal Sand Dunes Rocky Reefs and Associated Biota on the Gold Coast Griffith Centre for Coastal Management Research Report No 85 report prepared for Griffith University
Parker P (1995) Structure to Reef Fish Assemblages at Julian Rocks Northern New South Wales Masters Thesis Griffith University
Parker PG 1999 Fish assemblages at Julian Rocks and the adjacent waters of northern New South Wales Australia Australian Zoologist 31 134 - 160
Pawlik JR Steindler L Henkel TP Beer S amp Ilan M 2007 Chemical warfare on coral reefs sponge metabolites differentially affect coral symbiosis in situ Limnology and Oceanography 52 907-911
Reef Check 2010 httpwwwreefcheckaustraliaorgdatahtml accessed December 2015
Robinson KI amp Pollard DA 1982 Marine and estuarine reserves in Australia with particular reference to New South Wales Wetlands 2 17 - 26
Rogers CS 1990 Responses of coral reefs and reef organisms to sedimentation Marine Ecology Progress Series 62 185-202
Russ GR 2003 Grazer biomass correlates more strongly with production than with biomass of algal turfs on a coral reef Coral Reefs 22 63-67
Rutzler K 2002 Impact of crustose clionid sponges on Caribbean reef corals Acta Geologica Hispanica 37 61-72
Scheffers SR Nieuwland G Bak RPM amp van Duyl FC 2004 Removal of bacteria and nutrient dynamics within the coral reef framework of Curacao (Netherlands Antilles) Coral Reefs 23 413-422
TRESBP Kirra Reef Marine Biota Monitoring 2015 59
frc environmental
Schlacher-Hoenlinger M Walker S Johnson J Schlacher T amp Hooper J 2009 Biological Monitoring of the Ex-HMAS Brisbane Artificial Reef Phase II - Habitat Values report prepared for Environmental Protection Agency (EPA)
Smith KA 2003 A simple multivariate technique to improve the design of a sampling strategy for age-based fishery monitoring Fisheries Research 64 79-85
Smith S Edwards R Dalton S amp Harrison M 2005 Biological assessment of fish and benthic communities at Palm Beach Bait Reef Gold Coast Queensland report prepared for University of New England
TRESBP 2014 Autum 2009 storms httpwwwtweedsandbypassnswgovauarticles-and-studiesinteresting-itemsautumn-2009-storm updated 4 May 2014 accessed December 2015
TRESBP 2015a Tweed Sand Bypassing Restoring Coastal Sand Drift Improving Boating Access ndash Techinical information httpwwwtweedsandbypassnswgovau__dataassetspdf_file0004552055kir ra-feb-2015pdf acessed December 2015
TRESBP 2015b Waves httpwwwtweedsandbypassnswgovauenvironmental-monitoringcoastal-conditionswaves updated 30 September 2015 accessed December 2015
Umar MJMLJ amp Price IR 1998 Effects of sediment deposition on the seaweed Sargassum on a fringing coral reef Coral Reefs 17 169-177
Underwood AJ amp Kennelly SJ 1990 Ecology of marine algae on rocky shores and subtidal reefs in temperate Australia Hydrobiologia 192 3-20
Walker S Schlacher T amp Schlacher-Hoenlinger M 2007 Spatial heterogeneity of epibenthos on artificial reefs fouling communities in the early stages of colonization on an East Australian shipwreck Marine Ecology 28 435-445
Walker SJ Degnan BM Hooper JNA amp Skilleter GA 2008 Will increased storm intensity from climate change affect biodiversity in non-scleractinian sessile fauna on coral reefs Global Change Biology 14 2755-2770
Warwick RM amp Clarke KR 1993 Increased variability as a symptom of stress in marine communtities Journal of Experimental Marine Biology and Ecology 172 215-216
Thenumberofsitessurveyedhasvariedover timeasaresultof the fluctuating levelof sandcoveringKirraReef
Prior to May 2003 three sites were assessed along the eastern and northern edge of KirraReef(KirraReefOutersites1to3)andthreesiteswereexaminedalongtheinshore marginof the reef (KirraReef Inner sites1 to 3)(MapA1) ReefRedge (ieKirraOuter) siteswerechosentoprovideearlywarningofimpactsfromoffshoreplacementofdredged sandwhilst inshoresites(ieKirraInner)werechosentoindicatewhetherimpactsfrom inshore beach profile development were affecting the reef platform In May 2003 the threeeasternsitesatKirraReef (ieKRO1KRO2andKRI1)werecompletelycovered with bare mobile sand Consequently only the three western sites at Kirra Reef (ie KRO3KRI2andKRI3)supportedbenthicfloraandfaunaInMarch2004theextentof the remainingwesternoutcropof KirraReef had been further reduced so that all inner reefsiteswerecompletelycoveredwithmobilesandConsequentlyonlyasingleoriginal reefsite(ieKRO3)couldbesurveyed(Figure23)Thereforetoprovideanindicationof the condition of the remaining reef two new sites were established (ie KRN1 and KRN2)(Figure23)andsurveyedinMarch2004Theextentofthewesternreefhadbeen further reduced by February 2005 and a third new site (ie KRN3) was established (Figure23)Consequentlyfoursites(KRO3KRN1KRN2andKRN3)weresurveyedin February2005
InFebruary2010fourKirraReefsites(ieKRO3KRO1KRN1andKRN2)wereclearof thesurroundingsandandsupportedbenthic floraand fauna Inaddition several rocks protruded from the sand in the vicinity of site KRI2H these were assessed to provide a quantitativeindicationofbroadRscaletemporalchangestotheinshorereefcommunities
SOURCEScopy Copyright Commonwealth of Australia (Geoscience Australia) 2001 2004 2006copy The State of Queensland (Department of Natural Resources and Mines) 2015copy Nearmap 2014 2015
DATE2015-09-09
DRAWN BYCF
VERSION02
PROJECTIONCoordinate System GDA 1994 MGA Zone 56Projection Transverse MercatorDatum GDA 1994
plusmn SCALE
0 50 100
Metres
Scale 12500 A3
frc environmental
Appendix$B$ Introduction$to$Data$Analysis$Used$
Multivariate$Analyses$
Multivariate statistical techniques are widely used in ecology to assess the similarities relationshipsbetweenassemblagesWhereasunivariateanalysescanonlycompareone variable at a time (eg an index of community structure such as a diversity index or a singleindicatorspecies)multivariateanalysescancomparesamplesbasedontheextent thatassemblagesshareparticulartaxaandabundances(ClarkeampWarwick2001)
Thefirststepofmultivariateanalysisusuallyinvolvesthecreationofamatrixofsimilarity coefficients computed between every pair of samples The coefficient is usually a measureofhowclose theabundance is foreachspecies (definedso that100= total similarity and 0=complete dissimilarity) The Bray Curtis similarity measure is commonlythemostappropriateforbiologicaldata(ClarkeampWarwick2001)
MultidimensionalScaling
NonRmetricmultiRdimensionalscalingordinations(nMDS)attempttoplacesamplesintwo dimensionalspacesothattherankorderofthedistancesbetweensamplesmatchesthe rankorderofthematchingsimilaritiesfromthesimilaritymatrix(ClarkeampWarwick2001) Thisprovidesavisualrepresentationofthesimilaritiesbetweenassemblageswithineach sampleEachoftheaxesisnotrelatedtoanyparticularvalueHinfactaxescanberotated toprovide thebestvisual representationof thedata Ordinationsareparticularlyuseful tools for analysing and visually presenting differences between assemblages Ordinationsareessentiallymapsofsamples inwhich theplacementofsampleson the mapreflectsthesimilarlyofthecommunitytothecommunitiesinothersamples(Clarkeamp Warwick 2001) Distances between samples on an ordination attempt to match the similarities inassemblagestructurenearbypoints representassemblageswithvery few attributes(speciesorabundanceofspecies)Hpoints faraparthavevery fewattributes in common(ClarkeampWarwick2001)
A stress coefficient is calculated to reflect the extent to which the multiRdimensional scalingordinationandthesimilaritymatrixagree(ClarkeampWarwick2001)(iehowwell the multiRdimensional scaling ordination accurately reflects the relationship between samples)Stressvaluesoflt015aregenerallyacceptable
In Figure A1 each freshwater macroinvertebrate sample is represented on the multiRdimensionalscalingordination By lookingat thedistancesbetweeneachsample
ANOSIMisanalogoustoANOVAinunivariatestatistics(Smith2003)AglobalRstatistic iscalculatedtodeterminewhetherthereisasignificantdifferencebetweenallsamplesIf there are differences then pairwise comparisons are conducted to test for differences betweenpairsofsamples(analogoustopostRhoctestsinANOVA)
The R value lies between R1 and +1 (all similarities within groups are less than any similarity between groups) with a value of zero representing the null hypothesis (no differenceamongasetofsamples)(ClarkeampWarwick2001)ComparisonofpairwiseR values can give an indication of how different assemblages are R values close to 0 indicatelittledifferencevaluesaround05indicatesomeoverlapandvaluescloseto1to indicate many or substantial differences In many instances however researches are primarily interestedinwhethertheRvalueisstatisticallydifferentfromzero(usuallyata confidence level of 005) (Clarke amp Warwick 2001) (ie whether they can reject the null hypothesis)
ANOSIM can provide information on whether the (visual) differences between assemblages in the multiRdimensional scaling ordination are significantH it is an independenttestfromthemultiRdimensionalscalingordinationItisbasedontestingthe
TRESBPKirraReefMarineBiotaMonitoring2015 B2
frc environmental
differences between the rank similarities in the similarity matrix not on the distances betweensamplesinthemultiRdimensionalscalingordination(ClarkeampWarwick2001)
PermutationalMultivariateAnalysisofVariance
PERMANOVAisusedtotestsimultaneousresponsesofoneormorevariablestooneor more factors in an a0 priori0 structured design using random permutation of the data to assess significance (Anderson 2004) PERMANOVA generates a pseudo FRstatistic similar to traditional ANOVA but pRvalues are calculated with permutations which does notassumenormaldatadistribution PERMANOVAcanprovide informationonwhether the (visual) differences between assemblages in a multiRdimensional scaling ordination are significantH however it is an independent test from the multiRdimensional scaling ordination
Thelevelofmultivariatedispersionamongsampleswithineachofthetestgroupscanbe examined using the permutational analysis of multivariate dispersions (PERMDISP) routine(Anderson2004)Intraditionalimpactassessmentachangeinthedispersionof datacanalsoindicateanimpact
SimilarityPercentagendashSpeciesContributions
SIMPER analysis provides information on how dissimilar assemblages from various groups are (eg how similar all of the macroinvertebrate samples taken for a particular habitatwithinastreamreachare)andhowsimilareachgroup(egreach)istoanyother group SIMPER analysis also identifies the species taxa that are contributing to the dissimilarity between two assemblages in rank order (ie it identifies which species is contributingthemosttothedifferences)SIMPERanalysismayhelptoidentifypotential lsquoindicatorrsquospeciesForexampleifaparticularspeciesconsistentlycontributesgreatlyto the differences between impacted and unimpacted assemblages it may be a useful indicator Theabundanceofthis indicatorspeciescanthenbecomparedbetweensites usingunivariatetechniquessuchasANOVA
Data is available on request from tresbpprojectofficecrownlandnswgov
TRESBPKirraReefMarineBiotaMonitoring2015 C1
frc environmental
Appendix(D( Pairwise( PERMANOVA( Results
Data is available on request from tresbpprojectofficecrownlandnswgov
TRESBPKirraReefMarineBiotaMonitoring2015 D1
frc environmental
Appendix(E( Relative(Abundance(of(Fish(found(at(Kirra(( ( and(Palm(Beach(Reefs(in(Each(Survey((Data is available on request from tresbpprojectofficecrownlandnswgovau
TRESBPKirraReefMarineBiotaMonitoring2015 E1
Structure Bookmarks
0 50 100 Metres Scale 12500 A3
0 50 100 200 Metres Scale 15000 A3
Kirra Reef
Kirra Reef
Kirra Reef
Kirra Reef
Kirra Reef
Kirra Reef
Map A1Location of Kirra Reef monitoring sites
Table D8 Pairwise comparison of macroalgae cover between sites in each year
Table D15 Pairwise comparison of turf algae cover between sites in each year
Table D29 Pairwise comparison of ascidian cover between sites in each year
Table D43 Pairwise comparison of soft coral cover between sites in each year
frc environmental
3$ Results$
31$ Cover$of$Benthic$Assemblages$
The composition of benthic fauna and flora ( cover and type combined Appendix C) variedbetweenmostsitesatbothKirraReefandPalmBeachReefandbetweennearly allsurveysateachsite(notethesignificantinteractionofsite(location)xsurveyinTable 31X Appendix D) Nevertheless there appeared to be substantial differences in the compositionofthebenthicassemblagesbetweenthetworeefsineachsurveyfrom1995 to2015(Figure31toFigure33)
In2015 therewassomeoverlap in thecompositionofassemblagesonKirraandPalm Beach Reefs (Figure 33) However there was also some clear patterns of difference including
Benthic assemblages at Kirra Reef appeared to show some overlap between surveys (Figure34H) HowevernearlyallsurveysweredifferentateachsiteatbothKirraReef andPalmBeachReef(AppendixD)BenthicassemblagesinMarch2015andApril2014 wereverysimilarcomparedtobenthicassemblages inthebaselinesurvey inApril1995 andMarch2015(notethegreateroverlapinFigure35comparedtoFigure36)
In March 2015 as in previous surveys the macroalgae Sargassum sp dominated the benthic assemblages at all sites at Kirra Reef (Figure 37) Other species present included
sdot Dictyopteris0arostichoides0
sdot Dilophus0intermedius00
sdot Zonariasp
sdot Laurencia0brongniartic0
sdot Amphiroa0anceps0
sdot Caulerpa0lentilliferaand
sdot Halimeda0discoideaand
sdot Macrocystissp
Juvenile kelp (from the genus Macrocystis) was also emerging on some areas of Kirra Reef
ThecoverofmacroalagevariedbetweensitesandsurveysatbothKirraReefandPalm Beach Reef with the magnitude of difference varying over time (note the significant interaction between site (location) x survey in Table 32) Macroalgae cover varied between surveys with 2001 being the most different to the other years (Appendix D) ThereweredifferencesbetweensitesatKirraReefinJune1995February1996January 2001 May 2003 February 2005 and February 2010 and between sites at Palm Beach ReefinJanuary2001andFebruary2010Inrecentsurveys(2012to2015)thecoverof macroalgaeatsitesatbothKirraReefandPalmBeachReefwassimilar (AppendixD) indicatingarelativelyconsistentdistributionacrossbothreefs
ThemeancoverofmacroalgaeatKirraReefhasdeclinedsinceitspeakin2001withthe greatest magnitude of decline recorded between January 2001 and May 2003 (Figure 38)InsurveysbetweenJune1995andMay2003Sargassumspformeddensecarpets overtherockysubstratecoveringupto58oftheavailablesurfaceareaofthereefIn February 2010 macroalgal cover was 12 Macroalgal cover has increased to 26 in March2015ThisissimilartothecoverrecordedinApril1995(23cover)(Figure38)
In2015nomacroalgaewasrecordedwithinthequadratsatPalmBeachReefThecover of macroalgae on Palm Beach Reef has been consistently lower than Kirra Reef since
TRESBPKirraReefMarineBiotaMonitoring2015 26
frc environmental
ecologicalmonitoringbegan typically lessthan5of theavailablesurfacearea(Figure 38)
The mean cover of turf algae varied between sites and surveys at both Kirra Reef and PalmBeachReef(notethesignificantinteractionbetweensite(location)xsurveyinTable 33)SpecificallythereweresignificantdifferencesbetweensitesatbothKirraReefand PalmBeachReefinJune1995January2001February2010July2012andApril2014 (aswellasbetweensitesinFebruary1996atKirraReef)Thecoverofturfalgaevaried betweenmostsurveysatallsitesateachreef(AppendixD)BothKirraandPalmBeach reefs showed major increases in the percent cover of turf algae from 2010 to 2012 followedbyadecreaseincoverbetween2012and2014(Figure310)Thecoverofturf algae is typically lower at Kirra Reef than at Palm Beach Reef (July 2012 being an exception) and was again slightly lower at Kirra Reef in March 2015 (Table 310) In March2015turfalgaewasmoreprevalentatKirraReefthanduringthebaselinesurvey ofApril1995
ThemeancoverofspongesatsomesitesatbothKirraReefandPalmBeachReefhas varied significantly during some surveys (note the significant interaction between site (location)xsurvey inTable34HFigure311) However thecoverofspongestendedto bemore temporallyvariable atKirraReef than at Palm Beach Reef (Figure312) The cover of sponges at Kirra Reef varied between sites in February 1996 January 2001 March2004July2012andApril2014 However thecoverofspongesatPalmBeach Reefonlyvariedbetweensites inJanuary2001andFebruary2010 (AppendixD) The cover of sponges varied between survey at each site with 1995 1996 and 2001 most differenttootheryears(AppendixD)
ThemeancoverofspongesatKirraReefdeclinedbetweenMarch2004(20cover)and February 2010 (less than 1 cover) Since 2010 the cover of sponges has increased slightly with sponges covering 8 of the reef in March 2015 (Figure 312) In March 2015thecoverofspongeswashigherthanrecordedduringthebaselinesurveyinApril 1995(3cover)(Figure312)
Figure312 Mean cover of sponges (plusmnSE) at Kirra Reef and Palm Beach Reef on all
surveys
Table34 Univariate PERMANOVA results for differences in the cover of sponges betweensurveysandlocations
Factor$ df$ MS$effect$ PseudoF$ p$(perm)$
survey 10 18576 276 0018
location 1 39671 589 0210
site(location) 4 67354 477 0001
locationxsurvey 10 1490 221 0032
site(location)xsurvey 40 67331 477 0001
error 924 14108
Shadingdenotessignificanceatplt005
TRESBPKirraReefMarineBiotaMonitoring2015 32
frc environmental
Ascidians$
ThemeanabundanceofallascidiansotherthanPyura0stoloniferahasvariedsignifcantly between sites at Kirra Reef and Palm Beach Reef and between surveys at each site (Figure314andnotethesignificantinteractionbetweensite(location)xsurveyinTable 35) The abundance of ascidians was different between sites at Kirra Reef in January 2001May2003March2004February2005andApril2014HanddifferentatPalmBeach ReefinJanuary2001February2005February2010andMarch2015Theabundance ofascidiansvariedbetweensurveysateachsitewith1995beingmostdifferentwhenthe abundanceofascidianswaslow(AppendixD)InMarch2015theabundanceofallother ascidiansonKirraReefandPalmBeachReefwashigherthanpreviouslyreportedinthe baselinesurveyinApril1995(whennoascidianswererecorded)Themeanabundance washigheratKirraReefthanatPalmBeachReef(Figure314)
ThemeanabundanceofPyura0stoloniferahasvariedconsiderablybetweensitesatKirra Reef and Palm Beach Reef over time (note the significant interaction between site (location) x survey in Table 36) In March 2015 the mean abundance (individual per 025m2plusmnSE)of theascidianPstolonifera (Figure313)wassimilaratKirraReefand PalmBeachReef(Figure315)ThemeanabundanceofP0stoloniferahasrangedfrom 02to17individualsper025m2atbothreefssinceMay2003
Figure315 Mean abundance of ascidians (Pyura0 stolonifera) (individuals025m2)
(plusmnSE)atKirraReefandPalmBeachReefinallsurveys
TRESBPKirraReefMarineBiotaMonitoring2015 34
frc environmental
Table35 Univariate PERMANOVA results for the differences in cover of all ascidians otherthanPyura0stolonifera0betweensurveysandlocations
Factor$ df$ MS$effect$ PseudoF$ p$(perm)$
survey 10 26658 474 0001
location 1 13603 710 0104
site(location) 4 19154 149 0212
locationxsurvey 10 2629 468 0001
site(location)xsurvey 40 5621 438 0001
error 924 12828
Shadingdenotessignificanceatplt005
Table36 Univariate PERMANOVA results for the differences in Pyura0 stolonifera densitybetweensurveysandlocations
Factor$ df$ MS$effect$ PseudoF$ p$(perm)$
survey 10 16254 11842 0001
location 1 12445 60881 0206
site(location) 4 20442 56799 0001
locationxsurvey 10 79724 58082 0001
site (location) x 40 13726 38138 0001 survey
error 924 35991
Shadingdenotessignificanceatplt005
$
TRESBPKirraReefMarineBiotaMonitoring2015 35
frc environmental
Hard$Coral$
There was a significant difference between the cover of hard corals at Kirra Reef and PalmBeachReefduringsomesurveys(notethesignificantinteractionbetweenlocationx surveyinTable37)SpecificallytherewassignificantlymorehardcoralatPalmBeach Reef thanKirraReef inFebraury1996March2004April2014andMarch2015(Table 38)
ThecoverofhardcoralistypicallylowonKirraReefaccountingforlessthan2ofthe availablesubstrateInMarch2015hardcoralcoveredlessthan1oftheareaofKirra Reef which was less than the cover recorded during the baseline survey in April 1995 (Figure 316) In contrast hard coral covered 11 of the surface area at Palm Beach ReefwhichwasgreaterthanthecoverrecordedinApril1995(Figure316)
The cover of hard corals at Palm Beach Reef has been more variable over time comparedtothecoverofhardcoralatKirraReef(Figure316)Withtheexceptionofthe surveys inApril1995andJanuary2001when thecoverofhardcoralwas lowonboth reefshardcoralsaretypicallymoreprevalentatPalmBeachReef(Figure316)
Table38 PERMANOVA post hoc pairwise results for the differences in the cover of hardcoralbetweenlocationsineachsurveyevent
Hard$Corals$ Survey$
t$ p$(MC)$a$
Apr1995 054 0606
Jun1995 182 0140
Feb1996 541 0006
Jan2001 R R
May2003 166 0168
Mar2004 765 0001
Feb2005 049 0646
Feb2010 156 0197
Jul2012 283 0053
Apr2014 525 0011
Mar2015 695 0003 Shadingdenotessignificanceatplt005 a pvaluesbasedonMonteCarlotests
TRESBPKirraReefMarineBiotaMonitoring2015 37
60
50
40
30
20
10
0
Soft
Cor
al C
over
()
Kirra Reef Palm Beach Reef
frc environmental
Soft$Coral$
The cover of soft coral was significantly different between sites at both Kirra Reef and PalmBeachReefandduringsomesurveys(notethesignificant interactionbetweensite (location)xsurvey)TherewasnosoftcoralrecordedatKirraReefinMarch2015The coverofsoftcoralhasdeclinedatKirraReefsince2003andhascoveredlessthan2of theavailablesubstratesince2005whichissimilartothecoverofsoftcoraldescribedfor the baseline surveys in 1995 (Figure 317) The cover of soft coral was consistent betweensitesineachsurveyexceptbetweensitesin
sdot April1995atKirraReef
sdot 1996atKirraReef
sdot 2003atPalmBeachReefand
sdot 2014atPalmBeachReef(AppendixD)
Soft corals have historically covered more of the available space on Palm Beach Reef than on Kirra Reef However there was more temporal variability within sites at Palm BeachReefthanatKirraReef(AppendixD)ThecoverofsoftcoralatPalmBeachReef has varied over time and was highest in April 1995 (48 cover) Despite increasing sinceFebruary2005itisstilllowerthanthecoverrecordedduringthebaselinesurveyin April1995(Figure317)
Table39 UnivariatePERMANOVAresults for thedifferences in thecoverofsoft coral betweensurveysandlocations
Factor$ df$ MS$effect$ PseudoF$ p$(perm)$
survey 10 44657 1323 0001
location 1 32922 6620 0117
site(location) 4 49732 266 0036
locationxsurvey 10 40982 1214 0001
site (location) x 40 3376 181 0002 survey
error 924 18688
Shadingdenotessignificanceatplt005
$
TRESBPKirraReefMarineBiotaMonitoring2015 39
frc environmental
Crinoids$
ThereisasignificantdifferencebetweensomesitesatbothKirraReefandParmBeach Reef that varies through time (note the significant interaction between site (location) x survey inTable310) Theabundanceofcrinoidshasbeensimilarbetweensites inall years at Palm Beach ReefH and was different beween sites at Kirra Reef in June 1995 February1996May2003andFebruary2005(AppendixD)Withineachsitetherehas been some natural temporal variability particualrly at Palm Beach Reef sites in 2001 (Appendix D) The mean abundance (individuals 025m2) of crinoids (Figure 318) at KirraReefandPalmBeachReefhasgenerallybeenlessthan2individualsper025m2 andhasdeclinedatboth locationssincethebaselinesurvey inApril1995(Figure319) However the mean abundance of crinoids on Kirra Reef has shown a slight increase sinceFebruary2010(Figure319)
In March 2015 fewer crinoids were recorded at Palm Beach Reef than at Kirra ReefH crinoidshavebeenrareatPalmBeachReefsince2003
The species richness of fish recorded from Kirra Reef across all monitoring events has rangedfrom14to57 InMarch201557specieswereidentifiedat thereefwhichwas similar to April 2014 (53) and higher than previous surveys (Figure 320) Species richnessatPalmBeachReefwas lower(34species)andgenerallyvaried lessbetween surveyscomparedtoKirraReef
InMarch2015 the assemblage of fish at KirraReef comprised species fromall trophic levelsincludingdetritivoresplanktivoresherbivoresandcarnivores(AppendixE)Asin previous surveys the assemblage was dominated by herbivores and planktivores Yellowtail (Trachurus0 novaezelandiae) and striped sea pike (Sphyraena0 obtusata) were the dominant species present in large schools (Figure 321) Australian mado (Atypichthys0 strigatus) ringRtailed surgeon (Acanthurus0 blochii) silver trevally (Pseudocaranx0 georgianus) eastern pomfred (Schuettea0 scalaripinnis) sweep (Scorpis0 lineolatus) and various wrasses were also very abundant releative to other species (AppendixE)
Two new species were observed at Kirra Reef the orangeRband surgeon (Acanthurus0 olivaceus) and the unicornfish (Naso0 sp) Five new species were recorded at Palm BeachReef
No threatened or protected fish species listed under the Queenslandrsquos Nature0 Conservation0Act01992ornationallyundertheEnvironmental0Protection0and0Biodiversity0 Conservation0 Act0 1999 were observed The complete list of species recorded and the relativeabundanceispresentedinAppendixE
TRESBPKirraReefMarineBiotaMonitoring2015 42
60
0
10
20
30
40
50
Num
ber
of F
ish
Spe
cies
Apr-95
Jun-95
Feb-96
Jan-01
May-03
Mar-04
Feb-05
Feb-10
Jul-12
Apr-14
Mar-15
Kirra Reef Palm Beach Reef Location
frc environmental
Figure320 Number of fish species recorded at Kirra Reef and Palm Beach Reef on
ThegreatestchangetotheecologicalconditionofKirraReefsincethebaselinesurveyin 1995 has been the loss of large areas of hard substrate that support benthic flora and faunaThedeliveryoflargesandvolumesduringthestage1dredgingoperations(1995 to1998)andtheinitialoperationofthesandbypasssystem(2001to2008)resultedinan increaseinwaveactionandtidalcurrentsredistributingthissandoverKirraReef
The three major outcrops of Kirra Reef (northern southern and eastern sections) are naturally exposed and covered depending on water and sand movements In March 2015 the rocky outcrops in the northern section of Kirra Reef were exposed and supportedamoderatelydiversebenthicassemblagedominatedbyturfalgaeTherewas arelativelyhighfishdiversityatKirraReefTheecologicalassemblageexhibitedsignsof ongoingstressfromphysicaldisturbanceincludingtheabsenceofsoftcoralsandrarityof hardcoral(MumbyampSteneck2008)HoweverKirraReefhasarelativelyhighcoverof sponges and ascidians Sponges ascidians and crinoids were more abundant at Kirra ReefthanatPalmBeachReefinMarch2015
KirraReefcontinues toprovidehabitatandsupport importantecological functions in the region providing hard substrate for the colonisation of algae and benthic invertebrates and food and refuge for fish As sand levels have stabilised since 2008 assemblages have becomemoresimilar to those recordedprior to implementationof the TRESBP in April1995 Forexamplemacroalgalcover inApril1995andMarch2015wasrelatively similarHoweverassemblagecompositionisstillsignificantlydifferenttothatrecordedin thebaselinesurveysmostnoticeablyduetoa lowercoverofbaresubstrateandhigher coverofturfalgaeandascidianssincesurveyshavebeenperformed
Benthic$Macroalgae$
The cover of macroalgae at Kirra Reef was relatively similar during the 2014 and 2015 surveys and remained well below the peak of nearly 60 cover recorded in January 2001TherewasasteepdeclineinthecoverofmacroalgaebetweenJanuary2001and May2003whichappearedtobestronglyassociatedwith thedecline inreefareaduring that time as well as a decline in the cover of Sargassum sp (an important indicator speciesonKirraReef) SimilardeclineswereevidentatPalmBeachReefbetween the January2001andMay2003surveys
TRESBPKirraReefMarineBiotaMonitoring2015 45
frc environmental
The cover ofmacroalgae at Palm Beach Reef was much lower thanat Kirra Reef over time There are several possible reasons for the lower cover of macroalgae at Palm Beach
sdot PalmBeachReefisdeeperthanKirraReefandgenerallyhashigherturbidityand therefore greater light attenuation The quantity and quality of available light affectsthedistributionandgrowthofmacroalgae(MillerampEtter2008)
sdot Differences in the pattern of recruitment of algal species to the reefs due to differentwatercurrentsandtimingofthesurveys(Kennelly1987b)
sdot Increased competition with turf algae and sessile benthic invertebrates which competeforspacewithmacroalgae(Kennelly1987aHMillerampEtter2008)
sdot PresenceofdifferentspeciesandhigherdensityofherbivoresatPalmBeachReef (particularly sea urchins and herbivorous fish) which graze on macroalgae (McCook1997HJompaampMcCook2002)
Biological assemblages exposed to physical stress typically exhibit greater levels of temporalandspatialvariability(WarwickampClarke1993HChapmanetal1995)Temporal variationinthecoverofmacroalgaeatKirraReefislikelytobeprincipallyduetotheeffect ofphysicaldisturbance fromwaveactionaswellas theassociatedassociatedabrasion andsmotheringbysandTheeffectsofthesephysicaldisturbanceswouldincreasewith thereductionofKirraReefasedgeeffectsarepronouncedandwaterdepth isreduced Increasedsmotheringbysandcanalsoreducediversity(Hatcheretal1989)abundance recruitment growth survival and seasonal regeneration of macroalgae (Umar amp Price 1998HCheshireetal1999)
Changes in the cover of macroalgae on Kirra Reef over time are also likely due to the extentofthereefchangingHthefishandmobileinvertbratesassociatedwiththereefmay have concentrated which would in turn increase grazing pressure Increased grazing pressure from fish and mobile invertebrates can reduce the coverage and diversity of macroalgaeonreefs(McCook1997HJompaampMcCook2002)
Thecoverof turfalgaeatbothKirraReefandPalmBeachReefhasvariedsignificantly betweensurveysPriorto2005turfalgaetypicallycoveredlessoftheavailablesurface areaonKirraReefthanPalmBeachReefInMarch2015themeancoverofturfalgae hasincreasedsincebaselinesurveysin1995andwasrelativelysimilarbetweenreefs(40 plusmn4atKirraReefcomparedto48plusmn4atPalmBeachReef)Thecoverofturfalgaeat Kirra Reef was similar in 2014 and 2015 which was generally higher than previous surveysexceptduringJuly2012whencoverofturfalgaepeakedat67plusmn4
TRESBPKirraReefMarineBiotaMonitoring2015 46
frc environmental
Turfalgaearebecomingadominantcomponentofcommunitiesaroundtheworld likely the result of rapid colonisation of openspace after a disturbance (eg storms) nutrient enrichment andor changes in grazing pressures Turf algae can also reflect a more physically robust growth form suited to high wave energy environments (than foliose macroRalgae)TurfalgaepeakedintheJuly2012surveylikelyrelatedtotheincreasein bare reef exposure following a stormy conditions in early 2009 and between December 2011 and June 2012 Turf algae have been the dominant form of algae on Kirra Reef sincethistimealbeitthecoverlowerthanthe2012survey
Increased cover of turf algae is typically related to good light conditions high concentrationsofnutrientsandlownumbersofgrazerssuchasfish(orconstantgrazing pressure preventing macroalgae colonisation) However the relationship between algal dynamics physical disturbance water quality and herbivore grazing activity is complex andthecoverof turfalgaecanexhibitextremetemporalvariabilityasaconsequenceof the interactionbetween topRdownandbottomRupprocesses (Russ2003HBellwoodetal 2006H Hughes et al 2007H Albert et al 2008H Hoey amp Bellwood 2008H Mumby 2009) Furtherinvestigationwouldberequiredtoreliablydeterminethemechanismsofchangein bothmacroalgaeandturfalgaeassemblagesonthesereefs
Benthic$Macroinvertebrates$
AtKirraReeftheburialandreRemergenceofrockyoutcrops(influencedbytheTRESBP) islikelytohaveincreasedtemporalvariabilityinthedistributionandabundanceofbenthic macroinvertebrates Additional perturbations such as wave action and sand abrasion (each influenced through changes in bathymetry seabed topography and water depth) are likely to have resulted in the decline in cover and diversity of the benthic macroinvertebratesatKirraReefbetweensurveysparticularlybetweenMarch2004and February2005andduringtheseverestormsof2009Benthicmacroinvertebratessuch asascidiansspongeshardcoralandsoftcoralarehighlysusceptible to theeffectsof stormandwavedisturbancephysicalabrasionandburialbysand(KayampKeough1981H Walker et al 2008) which can affect settlement growth rate and survival (Dodge amp Vaisnys1977HRogers1990)
Physical disturbance from sand burial sand abrasion and the action of storm waves appeartokeepthebenthicassemblagesofKirraReefinastateofearlysuccessionItis commonforearlypioneerspeciessuchassomemacroalgaetorecruitrapidlytoahard surface in large numbers allowing these species to dominate assemblages early in the successionaltrajectory(Walkeretal2007)
Afurther indicatorof theearlystateofsuccessionatKirraReef isthatthecoverofhard and soft coral has remained very low (generally lt 5) In March 2015 less than 1
Benthic macroinvertebrate cover may also be affected indirectly through increased competitionwithmacroalgaeforspaceThepresenceoflargemacroalgaecanaffectthe recruitment and survival of sessile benthic invertebrates as fronds moving with wave action sweep and abrade the surface of rocks killing new recruits especially corals (Kennelly1989HMcCooketal2001)Itcantakeseveralyearsforhardandsoftcoralto become dominant on reefs in the SEQ region (SchlacherRHoenlinger et al 2009) Therefore hard coral is not expected to become abundant until several years after the reefhasbeenuncoveredandonlyifthephysicaldisturbanceregimeandsupplyofnew recruitsissufficienttosupportsurvivalandgenerationalsuccessionofthesespeciesThe coverofhardandsoftcoralsatKirraReefwerebothverylowandpatchypriortothestart oftheTRESBP
Sponges and ascidians are highly susceptible to smothering and sand abrasion unless theyhaveathicktunic(outercoveringmadeofkeratin)liketheascidianP0stolonifera0or strong internal keratin silicon or calcareous structures in the case of some species of sponges0(KayampKeough1981HMcGuinness1987HWalkeretal2008)Duetoincreased wave action and sedimentation (which can be influenced by the TRESBP) the mean coverofascidiansandspongeswasexpectedtobemuchloweronKirraReefthanPalm Beach Reef However in March 2015 the cover of sponges was similar between the reefsandthecoverofascidians(otherthanP0stolonifera)wasgreateratKirraReefthan at Palm Beach Reef This suggests that Kirra Reef is slowly recovering from the increasedstressofphysicaldisturbancesuchas increasedwaveactionandsandscour andorthatwaveandstormconditionshavebeenlesssevereinthepastfewyears
Fish$
KirraReefcontinuestosupportahighdiversityofreefRassociatedandpelagic(ienonR reefassociated) fishspecies Despite itsdiminishedsizecompared to1995KirraReef continuestoprovidevaluablehabitatforanumberoffishspeciesfromdifferentfunctional groups
ThereisahighdegreeofinterRannualvariabilityinthespeciesandabundanceofthefish present at Kirra Reef compared with the assemblage at Palm Beach Reef This likely reflectsthetemporalvariabilityintheavailablehabitatasaconsequenceofreefburialand reRemergenceThediversityqualityandarealextentofreefhabitatareimportantfactors influencing the distribution abundance biomass and diversity of reef fish (Bellwood amp Hughes2001HFriedlanderetal2003)Diversityandabundanceoffishcanincreasewith
TRESBPKirraReefMarineBiotaMonitoring2015 48
frc environmental
greaterstructuralcomplexityandincreasedheterogeneityofavailablehabitats(Bellwood ampHughes2001)Thissuggeststhatperiodsofreefburialreducetheoveralldiversityof reefRassociated fish species at Kirra Reef Despite the reduction in overall reef space therewasalargervarietyofhabitats(suchasmarcoalgaeandturfalgae)in2015which was likely to be related to the high diversity of fish assemblages This is particularly importantforseveralspeciesthatdependonthepresenceoflsquostructurersquosuchasprovided by reef habitat (ie oldwife moray eels damselfish and Australian mado that were recordedinMarch2015butwerenotrecordedinJuly2012)
Theabundanceanddiversityof fishare likelytobenegativelyaffectedfollowingperiods of severe weather which create unfavourable conditions for many species and may further exacerbate the affects of abrasion and sedimentation The biomass of fish is knowntodecreasewithincreasingexposuretophysicaldisturbancefromwaveactionand strong currents (Friedlander et al 2003) As our surveys have been undertaken at different times of the year variation in the prevailing conditions at the time of sampling could also influence the types of fish observed (and the amount of reef habitat that is availableatanytime)Manyofthespeciesmayalsobeaffectedbyseasonalchangesin the water temperature such as damselfish which are less abundant in cool waters However theoveralldiversityof the fishassemblageatKirraReef is likely toreflect the sizeoftheoutcropsexposedwithagreaterphysicaldisturbance(fromseaconditionsand sandmovement)andcompetitionHandlesserfoodavailablewhenthereefiscovered
ThepredictedimpactstoKirraReefasaresultoftheTRESBPincludedaccretionofsand around the base of the rock outcrops causing a reduction in extent of reef It was predictedthatsanddeliveryaspartoftheprojectwouldeventuallymimiclsquonaturalrsquopatterns ofsanddispersalandthatthereefwouldreturntoitsnaturalextent(ietheextentpriorto extension of the Tweed River training walls in 1962) The benthic flora and fauna assemblages of the reef the historical reef extent and natural sand transport patterns wereexpectedtoreturntoconditionsobservedbeforetheextensionofthetrainingwalls between 1962 and 1965 However the Environmental Impact Study did not predict the ecologicalconsequencesofboththereducedarealextentandincreasedwaveenergy(a consequenceofdecreaseddepth)thathavebeenrecorded
ThecurrentextentofKirraReef remains less than50of that recorded in1962and in 1995beforethesanddeliverybytheTRESBPcommencedHowevertheextentofreef in1995 wasstrongly influenced by adepletion in sand following the construction of the Tweed River training walls and the Kirra Point groyne Accumulation of sand on Kirra ReefwasobservedtoincreaseasaresultofindirectsandnourishmentbytheTRESBP and the reef has been extensively covered (particuarly between 2005 and 2010) as a result
Whiletheextentofthereefcontinuestochangeovertimethedeliveryofsandaspartof the project now more closely matches the natural rate of longshore sand transport ShortRtermandseasonalchangesintheextentofthereefarenowlikelytobetheresultof waveandcurrentaction(particularlyduringservereweatherevents)thanadirectimpact of the TRESBP Therefore the extent of Kirra Reef in March 2015 is broadly in accordancewithpredictionsmadeintheEISwhichpredictedthatthereefwouldreturnto a condition similar to that exhibited in the preR1960rsquos ie before the extension of the TweedRiverbreakwatersthatinterruptedlittoralsandsupplytothesebeaches
InDecember2013KirraPointgroynewasextendedby30mwiththeexpectationthatthe beach bar would move seaward as a consequence At present Kirra Point groyne is unlikelytohavehadamajorimpactonthearealextentofKirraReefHoweverongoing monitoringbasedonaerialphotographsmayprovidefurtherinsight
Sessile benthic assemblages on Kirra Reef are highly susceptible to the influence of storms and associated wave action (Kay amp Keough 1981H Walker et al 2008) The shallowreefissurroundedbymobilesandwhichcanshiftnaturallyinresponsetowave action during storms causing burial of large sections of Kirra Reef This effect has reduced the availability of rocky substrate for colonisation and the availability of refuge
Fromanexaminationof theextentofKirraReef fromarealmapsandwaveheightdata thereappears tobea relationshipbetween theareaof rockexposedandstormevents Notably in a series of storm events in May 2009 corresponds with large areas of rock becoming exposed (with the reef approximately 100m2 in 2006 and approximately in 1009m2 2009) Further a stormy conditions between December 2011 and July 2012 correspondstotheareaofexposedrockmorethandoublinginsizeWhiletherewasno changetothetotalareaofexposedrockfollowingstormyconditionsinearly2013there wasaclearchangeinthedistibutionofexposedrockduringthistimeSince2013storm conditions have been calm to moderate and there has been little change in the areal extentanddistrubtionofexposedrockatKirraReef
WaveheighttypicallyincreasesduringstormeventsandgiventheshallowdepthofKirra Reef waves are more likely to shoal and break across the reef during storms This increases thephysicaldisturbanceabrasionandsedimentationofbenthicassemblages onKirraReefStormdisturbancecancauselocalreductionsinthespeciesrichnessand abundanceofcoral(Woodleyetal1981HMasselampDone1993HHughes1994HConnellet al 1997) and can alter fish assemblages indirectly through habitat modifications (Kaufman1983HJonesampSyms1998)ordirectlybyincreasingfishmortality(Lassig1983) The hydrodynamic forces produced by wave action are an important source of disturbance in subtidal habitats inflicting damage through direct physical impact and abrasion(UnderwoodampKennelly1990)DirectimpactsfromphysicaldisturbanceatKirra Reefareevidentduringsurveyeventswhenlargefragmentsofmacroalgaearepresentin thewatercolumnoverthereef
Storm and wave action (and associated sedimentation and abrasion) continue to be importantforcesshapingthedistributionandabundanceofbenthicspeciesatKirraReef Increased magnitude and frequency of physical disturbance resulting from increased exposureorsusceptibility tostormsandassociatedwaveaction (asonKirraReef)can lead to a decrease in the diversity of sessile invertebrate assemblages DisturbanceR drivenreductionsinbiodiversityhavethepotentialtoimpactnegativelyonthehealthand productivity of reef ecosystems (Walker et al 2008) Biodiversity is important to reef health given that many of these species (eg sponges bryozoans and ascidians) contribute a range of vital ecosystem services to reefs including nutrient cycling (Scheffers et al 2004) trophic interactions and food webs (Lesser 2006H Pawlik et al 2007) bioRerosion (Rutzler 2002H LopezRVictoria et al 2006) and stabilizing substrata (DiazampRutzler2001HWulff2001)
Theimpactsof increasedwaveactionandsedimentationonthebenthicassemblagesat Kirra Reef are likely to be greatest during and immediately following storm conditions
TRESBPKirraReefMarineBiotaMonitoring2015 51
frc environmental
Partitioningtheinfluenceofstormandwavedrivendisturbancefromthatoftheoperation oftheTRESBPwouldrequireamuchmorestatisticallypowerfulandtemporilyreplicated experimental design Given there is a large collection of wave and storm data by TRESBP this would involve greater temporal sampling of Kirra Reef including event samplingfollowingseverewaveandstormactivity
The data generated by this Kirra Reef biota monitoring program doesnrsquot support statistically rigorous consideration of seasonality (monitoring has been at its most frequentannual)
InApril2014andMarch2015KirraReefcoveredlessthan50ofthereefrsquosextentprior to theoperationof theTRESBP The lossof reefhabitathasreducedtheavailabilityof hard substratum available for colonisation and consequently the abundance of benthic sessileassemblages
The reduced depth of water resulting from the accumulation of sand exacerbates the effects of storms and wave action It is likley that as a consequnece the biological communities of Kirra Reef will reflect earlyRstage succession more frequently and for longerperiods
While there is sufficient structure available frcenvironmentalexpect that Kirra Reef will continuetoprovideimportanthabitatforadiverseassemblageoffishes
TRESBPKirraReefMarineBiotaMonitoring2015 52
frc environmental
5$ Conclusions$
Although there is still a substantial portion of the reef covered compared to before the extension of the Tweed River entrance breakwaters the current extent of Kirra Reef is broadly inaccordancewithpredictionsmadein theEIS Initial lsquocatchRuprsquobypassingand dredgeplacementofsand(between2001and2008)resulted in theburialofKirraReef Subsequentsanddelivery(since2008onwards)morecloselyreflectsnaturalpatternsof longRshoresandtransportandisthereefhasslowlyreRemerged
Theextentofthereefhasbeenrelativelystablesince2013Thishasallowedforsome succession in the benthic assemblages including a relatively high cover of sponges ascidiansandcrinoidsWiththedeliveryofsandmorecloselymatchingthenaturalrateit isexpected the reef willundergoshortRtermchanges in extentdue toseasonal shifts in sand deliveryH however the diversity of benthic assemblages on Kirra Reef is likely to increaseovertimeThiswouldcreatemorespaceforspeciestorecruitandreducesthe influence of sand abrasion and wave damage It was predicted that the areas of Kirra Reef newly exposed in 2012 would undergo a shift from turfRdominated communities to more diverse communities that could include macroalgae sponges ascidians and potentiallyhardandsoftcoralWiththeexceptionofhardandsoftcoralsthisprediction wasconfirmedbytheresultsoftheApril2014andMarch2015surveys
ThediversityoffishesassociatedwithKirraReefisbroadlysimilartothatrecordedprior tothecommencementofsandbypassingin1995Giventhatfisharemobilethegreatest impacts on fish assemblages are likely to be shortRterm changes due to both the prevailingconditionsandchangestheextentofavailablehabitatthatprovidesshelterand foodforavarietyofdifferentspeciesIfKirraReefincreasesinsizethereislikelytobea greater proportion of cryptic benthic species as these species are more typical of assemblagesinalaterstageofsuccession(eg(WillisampAnderson2003))
Assuming a broadly stable delivery rate of sand and consequent stable extent of Kirra ReeflsquorecoveryrsquoislikleytobesubstantivelycompleteFloralandfaunalcommunitieswill undergo succession between severe storm events but are likley to remain relatively dynamic
Albert S Udy J amp Tibbetts I 2008 Responses of algal communities to gradients in herbivorebiomassandwaterqualityinMarovoLagoonSolomonIslandsCoral0 Reefs2773R82
Anderson MJ 2001 A new method for nonRparametric multivariate analysis of varianceAustral0Ecology2632R46
Anderson MJ 2004 PERMDISP0 a0 FORTRAN0 computer0 program0 for0 permutatinoal0 analysis0 of0 multivariate0 dispersions0 (for0 any0 twoSfactor0 ANOVA0 design)0 using0 permutational0 tests Department of Statistics University of Auckland New Zealand
Cannon LR Goeden GB amp Campbell P 1987 Community patterns revealed by trawling in the interRreef regions of the Great Barrier Reef Memoirs0 of0 the0 Queensland0Museum2545R70
Chapman MG Underwood AJ amp Skilleter GA 1995 Variability at different spatial scalesbetweenasubtidalassemblageexposedtothedischargeofsewageand two control assemblages Journal0 of0 Experimental0 Biology0 and0 Ecology 189 103R122
Cheshire AC Miller DJ amp Stewart R (1999) Effect0 of0 dispersed0 sediment0 plumes0 from0beach0sand0replenishment0dredging0on0recruitment0of0phaeophycean0algae0 to0rocky0reefs0in0Gulf0St0Vincent0South0Australia0The0Impact0of0Sand0Dredging0 on0 Benthic0 Community0 Structure0 at0 the0 Port0 Stanvac0 Dredge0 Site0 20 1S39 UniversityofAdelaideAdelaide
ConnellJHHughesTPampWallaceCC1997A30Ryearstudyofcoralabundance recruitment and disturbance at several scales in space and time Ecological0 Monographs67461R488
Diaz MC amp Rutzler K 2001 Sponges an essential component of Caribbean coral reefsBulletin0of0Marine0Science69535R546
DodgeREampVaisnysJR1977Coralpopulationsandgrowthpatternsresponsesto sedimentation and turbidity associated with dredging Journal0 of0 Marine0 Research35715R730
Done TJ 1982 Patterns in the distribution of coral communities across the central GreatBarrierReefCoral0Reefs195R107
Edwards RA amp Smith DA 2005 Subtidal assemblages associated with a geotextile reef insouthReastQueenslandAustraliaMarine0and0Freshwater0Research56 133R142
FisheriesResearchConsultants1991Survey0of0the0Intertidal0and0Subtidal0Rocky0Reefs0 of0 the0 Sunshine0 Coast report prepared for Queensland National Parks and WildlifeService
HarrisonPHarriotVBanksSampHolmesN1998ThecoralcommunitiesofFlinders Reef andMyora Reef in theMoretonBay MarineParkQueensland Australia In Moreton0 Bay0 and0 Catchment Tibbits I Hall N amp Dennison W (Eds) SchoolofMarineScienceUniversityofQueenslandStLuciapp525R536
Hatcher B Johannes R amp Robertson A 1989 Review of research relevant to the conservationofshallowtropicalmarineecosystemsOceanography0and0Marine0 Biology0an0Annual0Review27337R414
Hoey A amp Bellwood D 2008 CrossRshelf variation in the role of parrotfishes on the GreatBarrierReefCoral0Reefs37R47
TRESBPKirraReefMarineBiotaMonitoring2015 56
frc environmental
Hollingsworth P 1975 Environmental Investigation Report Crown Reserve R R68 Currumbin Creek City of the Gold Coast Land Administration Commission unpublishedreport
Hughes TP 1994 Catastrophes phase shifts and large scale degradation of a CaribbeancoralreefScience2651547R1551
Hughes TP Rodrigues MJ Bellwood DR Ceccarelli D HoeghRGuldberg O McCook L Moltschaniwskvi N Pratchett MS Steneck RS amp Willis B 2007Phaseshiftsherbivoryandtheresilienceofcoralreefstoclimatechange Current0Biology17360R365
Hutchinson A Rempel C Taveras V Loder J amp Salmond J 2013 Reef0 Check0 Australia0 South0 East0 Queensland0 Summary0 Report0 2013 report prepared for ReefCheckFoundationLimited
Hyder Consulting 1997 Tweed0 River0 Entrance0 Sand0 Bypassing0 Project0 Permanent0 Bypassing0 System0 0 Environmental0 Impact0 Statement0 0 Impact0 Assessment0 Study report prepared for New South Wales Department of Land and Water Conservation
Jompa J amp McCook LJ 2002 Effects of competition and herbivory on interactions betweenahardcoralandabrownalgaJournal0of0Experimental0Marine0Biology0 and0Ecology27125R39
KayAMampKeoughMJ1981Occupationofpatchesintheepifaunalcommunitieson pier pilings and the bivalve Pinna bicolor at Edithburgh South Australia Oecologia48123R130
KennellyS1987aInhibitionofkelprecruitmentbyturfingalgaeandconsequencesfor an Australian kelp community Journal0 of0 Experimental0 Marine0 Biology0 and0 Ecology11249R60
Kennelly S 1987b Physical disturbances in an Australian kelp community I temporal effectsMarine0Ecology0Progress0Series40145R153
TRESBPKirraReefMarineBiotaMonitoring2015 57
frc environmental
Kennelly S 1989 Effects of kelp canopies on understory species due to shade and scourMarine0Ecology0Progress0Series50215R224
Lassig BR 1983 The effects of a cyclonic storm on coral reef fish assemblages Environmental0Biology0of0Fishes955R63
Lawson S McMahon J amp Boswood P 2001 Environmental management of the construction and operation of a sand bypassing system at the Tweed River EntranceInThe15thAustralasianCoastalandOceanEngineeringConference the 8th Australasian Port and Harbour Conference 25 R 28 September 2001 QueenslandAustralia
Lesser MP 2006 BenthicRpelagic coupling on coral reefs feeding and growth of Caribbean sponges Journal0 of0 Experimental0 Marine0 Biology0 amp0 Ecology 328 277R288
LopezRVictoriaM ZeaSampWei E2006 Competition for spacebetweenencrusting excavatingCaribbeanspongesandothercoral reeforganismsMarine0Ecology0 Progress0Series312113R121
MalcolmHASmithSDAampJordanA2009Usingpatternsofreeffishassemblages to refine a Habitat Classification System for marine parks in NSW Australia Aquatic0Conservation0Marine0and0Freshwater0Ecosystems2083R92
Massel SR amp Done TJ 1993 Effects of cyclone waves on massive coral assemblages on the Great Barrier Reef meteorology hydrodynamics and demographyCoral0Reefs12153R166
Mumby PJ amp Steneck RS 2008 Coral reef management and conservation in light of rapidly evolving ecological paradigms Trends in Ecology amp Evoution 23 555 -563
Murphy HM amp Jenkins GP 2010 Observational methods used in marine spatial monitoring of fishes and associated habitats a review Marine and Freshwater Research 61 236-252
Noriega R 2007 An Overview of Available Information on Sandy Beach Ecology Coastal Sand Dunes Rocky Reefs and Associated Biota on the Gold Coast Griffith Centre for Coastal Management Research Report No 85 report prepared for Griffith University
Parker P (1995) Structure to Reef Fish Assemblages at Julian Rocks Northern New South Wales Masters Thesis Griffith University
Parker PG 1999 Fish assemblages at Julian Rocks and the adjacent waters of northern New South Wales Australia Australian Zoologist 31 134 - 160
Pawlik JR Steindler L Henkel TP Beer S amp Ilan M 2007 Chemical warfare on coral reefs sponge metabolites differentially affect coral symbiosis in situ Limnology and Oceanography 52 907-911
Reef Check 2010 httpwwwreefcheckaustraliaorgdatahtml accessed December 2015
Robinson KI amp Pollard DA 1982 Marine and estuarine reserves in Australia with particular reference to New South Wales Wetlands 2 17 - 26
Rogers CS 1990 Responses of coral reefs and reef organisms to sedimentation Marine Ecology Progress Series 62 185-202
Russ GR 2003 Grazer biomass correlates more strongly with production than with biomass of algal turfs on a coral reef Coral Reefs 22 63-67
Rutzler K 2002 Impact of crustose clionid sponges on Caribbean reef corals Acta Geologica Hispanica 37 61-72
Scheffers SR Nieuwland G Bak RPM amp van Duyl FC 2004 Removal of bacteria and nutrient dynamics within the coral reef framework of Curacao (Netherlands Antilles) Coral Reefs 23 413-422
TRESBP Kirra Reef Marine Biota Monitoring 2015 59
frc environmental
Schlacher-Hoenlinger M Walker S Johnson J Schlacher T amp Hooper J 2009 Biological Monitoring of the Ex-HMAS Brisbane Artificial Reef Phase II - Habitat Values report prepared for Environmental Protection Agency (EPA)
Smith KA 2003 A simple multivariate technique to improve the design of a sampling strategy for age-based fishery monitoring Fisheries Research 64 79-85
Smith S Edwards R Dalton S amp Harrison M 2005 Biological assessment of fish and benthic communities at Palm Beach Bait Reef Gold Coast Queensland report prepared for University of New England
TRESBP 2014 Autum 2009 storms httpwwwtweedsandbypassnswgovauarticles-and-studiesinteresting-itemsautumn-2009-storm updated 4 May 2014 accessed December 2015
TRESBP 2015a Tweed Sand Bypassing Restoring Coastal Sand Drift Improving Boating Access ndash Techinical information httpwwwtweedsandbypassnswgovau__dataassetspdf_file0004552055kir ra-feb-2015pdf acessed December 2015
TRESBP 2015b Waves httpwwwtweedsandbypassnswgovauenvironmental-monitoringcoastal-conditionswaves updated 30 September 2015 accessed December 2015
Umar MJMLJ amp Price IR 1998 Effects of sediment deposition on the seaweed Sargassum on a fringing coral reef Coral Reefs 17 169-177
Underwood AJ amp Kennelly SJ 1990 Ecology of marine algae on rocky shores and subtidal reefs in temperate Australia Hydrobiologia 192 3-20
Walker S Schlacher T amp Schlacher-Hoenlinger M 2007 Spatial heterogeneity of epibenthos on artificial reefs fouling communities in the early stages of colonization on an East Australian shipwreck Marine Ecology 28 435-445
Walker SJ Degnan BM Hooper JNA amp Skilleter GA 2008 Will increased storm intensity from climate change affect biodiversity in non-scleractinian sessile fauna on coral reefs Global Change Biology 14 2755-2770
Warwick RM amp Clarke KR 1993 Increased variability as a symptom of stress in marine communtities Journal of Experimental Marine Biology and Ecology 172 215-216
Thenumberofsitessurveyedhasvariedover timeasaresultof the fluctuating levelof sandcoveringKirraReef
Prior to May 2003 three sites were assessed along the eastern and northern edge of KirraReef(KirraReefOutersites1to3)andthreesiteswereexaminedalongtheinshore marginof the reef (KirraReef Inner sites1 to 3)(MapA1) ReefRedge (ieKirraOuter) siteswerechosentoprovideearlywarningofimpactsfromoffshoreplacementofdredged sandwhilst inshoresites(ieKirraInner)werechosentoindicatewhetherimpactsfrom inshore beach profile development were affecting the reef platform In May 2003 the threeeasternsitesatKirraReef (ieKRO1KRO2andKRI1)werecompletelycovered with bare mobile sand Consequently only the three western sites at Kirra Reef (ie KRO3KRI2andKRI3)supportedbenthicfloraandfaunaInMarch2004theextentof the remainingwesternoutcropof KirraReef had been further reduced so that all inner reefsiteswerecompletelycoveredwithmobilesandConsequentlyonlyasingleoriginal reefsite(ieKRO3)couldbesurveyed(Figure23)Thereforetoprovideanindicationof the condition of the remaining reef two new sites were established (ie KRN1 and KRN2)(Figure23)andsurveyedinMarch2004Theextentofthewesternreefhadbeen further reduced by February 2005 and a third new site (ie KRN3) was established (Figure23)Consequentlyfoursites(KRO3KRN1KRN2andKRN3)weresurveyedin February2005
InFebruary2010fourKirraReefsites(ieKRO3KRO1KRN1andKRN2)wereclearof thesurroundingsandandsupportedbenthic floraand fauna Inaddition several rocks protruded from the sand in the vicinity of site KRI2H these were assessed to provide a quantitativeindicationofbroadRscaletemporalchangestotheinshorereefcommunities
SOURCEScopy Copyright Commonwealth of Australia (Geoscience Australia) 2001 2004 2006copy The State of Queensland (Department of Natural Resources and Mines) 2015copy Nearmap 2014 2015
DATE2015-09-09
DRAWN BYCF
VERSION02
PROJECTIONCoordinate System GDA 1994 MGA Zone 56Projection Transverse MercatorDatum GDA 1994
plusmn SCALE
0 50 100
Metres
Scale 12500 A3
frc environmental
Appendix$B$ Introduction$to$Data$Analysis$Used$
Multivariate$Analyses$
Multivariate statistical techniques are widely used in ecology to assess the similarities relationshipsbetweenassemblagesWhereasunivariateanalysescanonlycompareone variable at a time (eg an index of community structure such as a diversity index or a singleindicatorspecies)multivariateanalysescancomparesamplesbasedontheextent thatassemblagesshareparticulartaxaandabundances(ClarkeampWarwick2001)
Thefirststepofmultivariateanalysisusuallyinvolvesthecreationofamatrixofsimilarity coefficients computed between every pair of samples The coefficient is usually a measureofhowclose theabundance is foreachspecies (definedso that100= total similarity and 0=complete dissimilarity) The Bray Curtis similarity measure is commonlythemostappropriateforbiologicaldata(ClarkeampWarwick2001)
MultidimensionalScaling
NonRmetricmultiRdimensionalscalingordinations(nMDS)attempttoplacesamplesintwo dimensionalspacesothattherankorderofthedistancesbetweensamplesmatchesthe rankorderofthematchingsimilaritiesfromthesimilaritymatrix(ClarkeampWarwick2001) Thisprovidesavisualrepresentationofthesimilaritiesbetweenassemblageswithineach sampleEachoftheaxesisnotrelatedtoanyparticularvalueHinfactaxescanberotated toprovide thebestvisual representationof thedata Ordinationsareparticularlyuseful tools for analysing and visually presenting differences between assemblages Ordinationsareessentiallymapsofsamples inwhich theplacementofsampleson the mapreflectsthesimilarlyofthecommunitytothecommunitiesinothersamples(Clarkeamp Warwick 2001) Distances between samples on an ordination attempt to match the similarities inassemblagestructurenearbypoints representassemblageswithvery few attributes(speciesorabundanceofspecies)Hpoints faraparthavevery fewattributes in common(ClarkeampWarwick2001)
A stress coefficient is calculated to reflect the extent to which the multiRdimensional scalingordinationandthesimilaritymatrixagree(ClarkeampWarwick2001)(iehowwell the multiRdimensional scaling ordination accurately reflects the relationship between samples)Stressvaluesoflt015aregenerallyacceptable
In Figure A1 each freshwater macroinvertebrate sample is represented on the multiRdimensionalscalingordination By lookingat thedistancesbetweeneachsample
ANOSIMisanalogoustoANOVAinunivariatestatistics(Smith2003)AglobalRstatistic iscalculatedtodeterminewhetherthereisasignificantdifferencebetweenallsamplesIf there are differences then pairwise comparisons are conducted to test for differences betweenpairsofsamples(analogoustopostRhoctestsinANOVA)
The R value lies between R1 and +1 (all similarities within groups are less than any similarity between groups) with a value of zero representing the null hypothesis (no differenceamongasetofsamples)(ClarkeampWarwick2001)ComparisonofpairwiseR values can give an indication of how different assemblages are R values close to 0 indicatelittledifferencevaluesaround05indicatesomeoverlapandvaluescloseto1to indicate many or substantial differences In many instances however researches are primarily interestedinwhethertheRvalueisstatisticallydifferentfromzero(usuallyata confidence level of 005) (Clarke amp Warwick 2001) (ie whether they can reject the null hypothesis)
ANOSIM can provide information on whether the (visual) differences between assemblages in the multiRdimensional scaling ordination are significantH it is an independenttestfromthemultiRdimensionalscalingordinationItisbasedontestingthe
TRESBPKirraReefMarineBiotaMonitoring2015 B2
frc environmental
differences between the rank similarities in the similarity matrix not on the distances betweensamplesinthemultiRdimensionalscalingordination(ClarkeampWarwick2001)
PermutationalMultivariateAnalysisofVariance
PERMANOVAisusedtotestsimultaneousresponsesofoneormorevariablestooneor more factors in an a0 priori0 structured design using random permutation of the data to assess significance (Anderson 2004) PERMANOVA generates a pseudo FRstatistic similar to traditional ANOVA but pRvalues are calculated with permutations which does notassumenormaldatadistribution PERMANOVAcanprovide informationonwhether the (visual) differences between assemblages in a multiRdimensional scaling ordination are significantH however it is an independent test from the multiRdimensional scaling ordination
Thelevelofmultivariatedispersionamongsampleswithineachofthetestgroupscanbe examined using the permutational analysis of multivariate dispersions (PERMDISP) routine(Anderson2004)Intraditionalimpactassessmentachangeinthedispersionof datacanalsoindicateanimpact
SimilarityPercentagendashSpeciesContributions
SIMPER analysis provides information on how dissimilar assemblages from various groups are (eg how similar all of the macroinvertebrate samples taken for a particular habitatwithinastreamreachare)andhowsimilareachgroup(egreach)istoanyother group SIMPER analysis also identifies the species taxa that are contributing to the dissimilarity between two assemblages in rank order (ie it identifies which species is contributingthemosttothedifferences)SIMPERanalysismayhelptoidentifypotential lsquoindicatorrsquospeciesForexampleifaparticularspeciesconsistentlycontributesgreatlyto the differences between impacted and unimpacted assemblages it may be a useful indicator Theabundanceofthis indicatorspeciescanthenbecomparedbetweensites usingunivariatetechniquessuchasANOVA
Data is available on request from tresbpprojectofficecrownlandnswgov
TRESBPKirraReefMarineBiotaMonitoring2015 C1
frc environmental
Appendix(D( Pairwise( PERMANOVA( Results
Data is available on request from tresbpprojectofficecrownlandnswgov
TRESBPKirraReefMarineBiotaMonitoring2015 D1
frc environmental
Appendix(E( Relative(Abundance(of(Fish(found(at(Kirra(( ( and(Palm(Beach(Reefs(in(Each(Survey((Data is available on request from tresbpprojectofficecrownlandnswgovau
TRESBPKirraReefMarineBiotaMonitoring2015 E1
Structure Bookmarks
0 50 100 Metres Scale 12500 A3
0 50 100 200 Metres Scale 15000 A3
Kirra Reef
Kirra Reef
Kirra Reef
Kirra Reef
Kirra Reef
Kirra Reef
Map A1Location of Kirra Reef monitoring sites
Table D8 Pairwise comparison of macroalgae cover between sites in each year
Table D15 Pairwise comparison of turf algae cover between sites in each year
Table D29 Pairwise comparison of ascidian cover between sites in each year
Table D43 Pairwise comparison of soft coral cover between sites in each year
April 1995 Palm Beach June 1995 Palm Beach Reef Reef Kirra Reef Kirra Reef
February 1996 Palm Beach January 2001 Palm Beach Reef Reef Kirra Reef Kirra Reef
Benthic assemblages at Kirra Reef appeared to show some overlap between surveys (Figure34H) HowevernearlyallsurveysweredifferentateachsiteatbothKirraReef andPalmBeachReef(AppendixD)BenthicassemblagesinMarch2015andApril2014 wereverysimilarcomparedtobenthicassemblages inthebaselinesurvey inApril1995 andMarch2015(notethegreateroverlapinFigure35comparedtoFigure36)
In March 2015 as in previous surveys the macroalgae Sargassum sp dominated the benthic assemblages at all sites at Kirra Reef (Figure 37) Other species present included
sdot Dictyopteris0arostichoides0
sdot Dilophus0intermedius00
sdot Zonariasp
sdot Laurencia0brongniartic0
sdot Amphiroa0anceps0
sdot Caulerpa0lentilliferaand
sdot Halimeda0discoideaand
sdot Macrocystissp
Juvenile kelp (from the genus Macrocystis) was also emerging on some areas of Kirra Reef
ThecoverofmacroalagevariedbetweensitesandsurveysatbothKirraReefandPalm Beach Reef with the magnitude of difference varying over time (note the significant interaction between site (location) x survey in Table 32) Macroalgae cover varied between surveys with 2001 being the most different to the other years (Appendix D) ThereweredifferencesbetweensitesatKirraReefinJune1995February1996January 2001 May 2003 February 2005 and February 2010 and between sites at Palm Beach ReefinJanuary2001andFebruary2010Inrecentsurveys(2012to2015)thecoverof macroalgaeatsitesatbothKirraReefandPalmBeachReefwassimilar (AppendixD) indicatingarelativelyconsistentdistributionacrossbothreefs
ThemeancoverofmacroalgaeatKirraReefhasdeclinedsinceitspeakin2001withthe greatest magnitude of decline recorded between January 2001 and May 2003 (Figure 38)InsurveysbetweenJune1995andMay2003Sargassumspformeddensecarpets overtherockysubstratecoveringupto58oftheavailablesurfaceareaofthereefIn February 2010 macroalgal cover was 12 Macroalgal cover has increased to 26 in March2015ThisissimilartothecoverrecordedinApril1995(23cover)(Figure38)
In2015nomacroalgaewasrecordedwithinthequadratsatPalmBeachReefThecover of macroalgae on Palm Beach Reef has been consistently lower than Kirra Reef since
TRESBPKirraReefMarineBiotaMonitoring2015 26
frc environmental
ecologicalmonitoringbegan typically lessthan5of theavailablesurfacearea(Figure 38)
The mean cover of turf algae varied between sites and surveys at both Kirra Reef and PalmBeachReef(notethesignificantinteractionbetweensite(location)xsurveyinTable 33)SpecificallythereweresignificantdifferencesbetweensitesatbothKirraReefand PalmBeachReefinJune1995January2001February2010July2012andApril2014 (aswellasbetweensitesinFebruary1996atKirraReef)Thecoverofturfalgaevaried betweenmostsurveysatallsitesateachreef(AppendixD)BothKirraandPalmBeach reefs showed major increases in the percent cover of turf algae from 2010 to 2012 followedbyadecreaseincoverbetween2012and2014(Figure310)Thecoverofturf algae is typically lower at Kirra Reef than at Palm Beach Reef (July 2012 being an exception) and was again slightly lower at Kirra Reef in March 2015 (Table 310) In March2015turfalgaewasmoreprevalentatKirraReefthanduringthebaselinesurvey ofApril1995
ThemeancoverofspongesatsomesitesatbothKirraReefandPalmBeachReefhas varied significantly during some surveys (note the significant interaction between site (location)xsurvey inTable34HFigure311) However thecoverofspongestendedto bemore temporallyvariable atKirraReef than at Palm Beach Reef (Figure312) The cover of sponges at Kirra Reef varied between sites in February 1996 January 2001 March2004July2012andApril2014 However thecoverofspongesatPalmBeach Reefonlyvariedbetweensites inJanuary2001andFebruary2010 (AppendixD) The cover of sponges varied between survey at each site with 1995 1996 and 2001 most differenttootheryears(AppendixD)
ThemeancoverofspongesatKirraReefdeclinedbetweenMarch2004(20cover)and February 2010 (less than 1 cover) Since 2010 the cover of sponges has increased slightly with sponges covering 8 of the reef in March 2015 (Figure 312) In March 2015thecoverofspongeswashigherthanrecordedduringthebaselinesurveyinApril 1995(3cover)(Figure312)
Figure312 Mean cover of sponges (plusmnSE) at Kirra Reef and Palm Beach Reef on all
surveys
Table34 Univariate PERMANOVA results for differences in the cover of sponges betweensurveysandlocations
Factor$ df$ MS$effect$ PseudoF$ p$(perm)$
survey 10 18576 276 0018
location 1 39671 589 0210
site(location) 4 67354 477 0001
locationxsurvey 10 1490 221 0032
site(location)xsurvey 40 67331 477 0001
error 924 14108
Shadingdenotessignificanceatplt005
TRESBPKirraReefMarineBiotaMonitoring2015 32
frc environmental
Ascidians$
ThemeanabundanceofallascidiansotherthanPyura0stoloniferahasvariedsignifcantly between sites at Kirra Reef and Palm Beach Reef and between surveys at each site (Figure314andnotethesignificantinteractionbetweensite(location)xsurveyinTable 35) The abundance of ascidians was different between sites at Kirra Reef in January 2001May2003March2004February2005andApril2014HanddifferentatPalmBeach ReefinJanuary2001February2005February2010andMarch2015Theabundance ofascidiansvariedbetweensurveysateachsitewith1995beingmostdifferentwhenthe abundanceofascidianswaslow(AppendixD)InMarch2015theabundanceofallother ascidiansonKirraReefandPalmBeachReefwashigherthanpreviouslyreportedinthe baselinesurveyinApril1995(whennoascidianswererecorded)Themeanabundance washigheratKirraReefthanatPalmBeachReef(Figure314)
ThemeanabundanceofPyura0stoloniferahasvariedconsiderablybetweensitesatKirra Reef and Palm Beach Reef over time (note the significant interaction between site (location) x survey in Table 36) In March 2015 the mean abundance (individual per 025m2plusmnSE)of theascidianPstolonifera (Figure313)wassimilaratKirraReefand PalmBeachReef(Figure315)ThemeanabundanceofP0stoloniferahasrangedfrom 02to17individualsper025m2atbothreefssinceMay2003
Figure315 Mean abundance of ascidians (Pyura0 stolonifera) (individuals025m2)
(plusmnSE)atKirraReefandPalmBeachReefinallsurveys
TRESBPKirraReefMarineBiotaMonitoring2015 34
frc environmental
Table35 Univariate PERMANOVA results for the differences in cover of all ascidians otherthanPyura0stolonifera0betweensurveysandlocations
Factor$ df$ MS$effect$ PseudoF$ p$(perm)$
survey 10 26658 474 0001
location 1 13603 710 0104
site(location) 4 19154 149 0212
locationxsurvey 10 2629 468 0001
site(location)xsurvey 40 5621 438 0001
error 924 12828
Shadingdenotessignificanceatplt005
Table36 Univariate PERMANOVA results for the differences in Pyura0 stolonifera densitybetweensurveysandlocations
Factor$ df$ MS$effect$ PseudoF$ p$(perm)$
survey 10 16254 11842 0001
location 1 12445 60881 0206
site(location) 4 20442 56799 0001
locationxsurvey 10 79724 58082 0001
site (location) x 40 13726 38138 0001 survey
error 924 35991
Shadingdenotessignificanceatplt005
$
TRESBPKirraReefMarineBiotaMonitoring2015 35
frc environmental
Hard$Coral$
There was a significant difference between the cover of hard corals at Kirra Reef and PalmBeachReefduringsomesurveys(notethesignificantinteractionbetweenlocationx surveyinTable37)SpecificallytherewassignificantlymorehardcoralatPalmBeach Reef thanKirraReef inFebraury1996March2004April2014andMarch2015(Table 38)
ThecoverofhardcoralistypicallylowonKirraReefaccountingforlessthan2ofthe availablesubstrateInMarch2015hardcoralcoveredlessthan1oftheareaofKirra Reef which was less than the cover recorded during the baseline survey in April 1995 (Figure 316) In contrast hard coral covered 11 of the surface area at Palm Beach ReefwhichwasgreaterthanthecoverrecordedinApril1995(Figure316)
The cover of hard corals at Palm Beach Reef has been more variable over time comparedtothecoverofhardcoralatKirraReef(Figure316)Withtheexceptionofthe surveys inApril1995andJanuary2001when thecoverofhardcoralwas lowonboth reefshardcoralsaretypicallymoreprevalentatPalmBeachReef(Figure316)
Table38 PERMANOVA post hoc pairwise results for the differences in the cover of hardcoralbetweenlocationsineachsurveyevent
Hard$Corals$ Survey$
t$ p$(MC)$a$
Apr1995 054 0606
Jun1995 182 0140
Feb1996 541 0006
Jan2001 R R
May2003 166 0168
Mar2004 765 0001
Feb2005 049 0646
Feb2010 156 0197
Jul2012 283 0053
Apr2014 525 0011
Mar2015 695 0003 Shadingdenotessignificanceatplt005 a pvaluesbasedonMonteCarlotests
TRESBPKirraReefMarineBiotaMonitoring2015 37
60
50
40
30
20
10
0
Soft
Cor
al C
over
()
Kirra Reef Palm Beach Reef
frc environmental
Soft$Coral$
The cover of soft coral was significantly different between sites at both Kirra Reef and PalmBeachReefandduringsomesurveys(notethesignificant interactionbetweensite (location)xsurvey)TherewasnosoftcoralrecordedatKirraReefinMarch2015The coverofsoftcoralhasdeclinedatKirraReefsince2003andhascoveredlessthan2of theavailablesubstratesince2005whichissimilartothecoverofsoftcoraldescribedfor the baseline surveys in 1995 (Figure 317) The cover of soft coral was consistent betweensitesineachsurveyexceptbetweensitesin
sdot April1995atKirraReef
sdot 1996atKirraReef
sdot 2003atPalmBeachReefand
sdot 2014atPalmBeachReef(AppendixD)
Soft corals have historically covered more of the available space on Palm Beach Reef than on Kirra Reef However there was more temporal variability within sites at Palm BeachReefthanatKirraReef(AppendixD)ThecoverofsoftcoralatPalmBeachReef has varied over time and was highest in April 1995 (48 cover) Despite increasing sinceFebruary2005itisstilllowerthanthecoverrecordedduringthebaselinesurveyin April1995(Figure317)
Table39 UnivariatePERMANOVAresults for thedifferences in thecoverofsoft coral betweensurveysandlocations
Factor$ df$ MS$effect$ PseudoF$ p$(perm)$
survey 10 44657 1323 0001
location 1 32922 6620 0117
site(location) 4 49732 266 0036
locationxsurvey 10 40982 1214 0001
site (location) x 40 3376 181 0002 survey
error 924 18688
Shadingdenotessignificanceatplt005
$
TRESBPKirraReefMarineBiotaMonitoring2015 39
frc environmental
Crinoids$
ThereisasignificantdifferencebetweensomesitesatbothKirraReefandParmBeach Reef that varies through time (note the significant interaction between site (location) x survey inTable310) Theabundanceofcrinoidshasbeensimilarbetweensites inall years at Palm Beach ReefH and was different beween sites at Kirra Reef in June 1995 February1996May2003andFebruary2005(AppendixD)Withineachsitetherehas been some natural temporal variability particualrly at Palm Beach Reef sites in 2001 (Appendix D) The mean abundance (individuals 025m2) of crinoids (Figure 318) at KirraReefandPalmBeachReefhasgenerallybeenlessthan2individualsper025m2 andhasdeclinedatboth locationssincethebaselinesurvey inApril1995(Figure319) However the mean abundance of crinoids on Kirra Reef has shown a slight increase sinceFebruary2010(Figure319)
In March 2015 fewer crinoids were recorded at Palm Beach Reef than at Kirra ReefH crinoidshavebeenrareatPalmBeachReefsince2003
The species richness of fish recorded from Kirra Reef across all monitoring events has rangedfrom14to57 InMarch201557specieswereidentifiedat thereefwhichwas similar to April 2014 (53) and higher than previous surveys (Figure 320) Species richnessatPalmBeachReefwas lower(34species)andgenerallyvaried lessbetween surveyscomparedtoKirraReef
InMarch2015 the assemblage of fish at KirraReef comprised species fromall trophic levelsincludingdetritivoresplanktivoresherbivoresandcarnivores(AppendixE)Asin previous surveys the assemblage was dominated by herbivores and planktivores Yellowtail (Trachurus0 novaezelandiae) and striped sea pike (Sphyraena0 obtusata) were the dominant species present in large schools (Figure 321) Australian mado (Atypichthys0 strigatus) ringRtailed surgeon (Acanthurus0 blochii) silver trevally (Pseudocaranx0 georgianus) eastern pomfred (Schuettea0 scalaripinnis) sweep (Scorpis0 lineolatus) and various wrasses were also very abundant releative to other species (AppendixE)
Two new species were observed at Kirra Reef the orangeRband surgeon (Acanthurus0 olivaceus) and the unicornfish (Naso0 sp) Five new species were recorded at Palm BeachReef
No threatened or protected fish species listed under the Queenslandrsquos Nature0 Conservation0Act01992ornationallyundertheEnvironmental0Protection0and0Biodiversity0 Conservation0 Act0 1999 were observed The complete list of species recorded and the relativeabundanceispresentedinAppendixE
TRESBPKirraReefMarineBiotaMonitoring2015 42
60
0
10
20
30
40
50
Num
ber
of F
ish
Spe
cies
Apr-95
Jun-95
Feb-96
Jan-01
May-03
Mar-04
Feb-05
Feb-10
Jul-12
Apr-14
Mar-15
Kirra Reef Palm Beach Reef Location
frc environmental
Figure320 Number of fish species recorded at Kirra Reef and Palm Beach Reef on
ThegreatestchangetotheecologicalconditionofKirraReefsincethebaselinesurveyin 1995 has been the loss of large areas of hard substrate that support benthic flora and faunaThedeliveryoflargesandvolumesduringthestage1dredgingoperations(1995 to1998)andtheinitialoperationofthesandbypasssystem(2001to2008)resultedinan increaseinwaveactionandtidalcurrentsredistributingthissandoverKirraReef
The three major outcrops of Kirra Reef (northern southern and eastern sections) are naturally exposed and covered depending on water and sand movements In March 2015 the rocky outcrops in the northern section of Kirra Reef were exposed and supportedamoderatelydiversebenthicassemblagedominatedbyturfalgaeTherewas arelativelyhighfishdiversityatKirraReefTheecologicalassemblageexhibitedsignsof ongoingstressfromphysicaldisturbanceincludingtheabsenceofsoftcoralsandrarityof hardcoral(MumbyampSteneck2008)HoweverKirraReefhasarelativelyhighcoverof sponges and ascidians Sponges ascidians and crinoids were more abundant at Kirra ReefthanatPalmBeachReefinMarch2015
KirraReefcontinues toprovidehabitatandsupport importantecological functions in the region providing hard substrate for the colonisation of algae and benthic invertebrates and food and refuge for fish As sand levels have stabilised since 2008 assemblages have becomemoresimilar to those recordedprior to implementationof the TRESBP in April1995 Forexamplemacroalgalcover inApril1995andMarch2015wasrelatively similarHoweverassemblagecompositionisstillsignificantlydifferenttothatrecordedin thebaselinesurveysmostnoticeablyduetoa lowercoverofbaresubstrateandhigher coverofturfalgaeandascidianssincesurveyshavebeenperformed
Benthic$Macroalgae$
The cover of macroalgae at Kirra Reef was relatively similar during the 2014 and 2015 surveys and remained well below the peak of nearly 60 cover recorded in January 2001TherewasasteepdeclineinthecoverofmacroalgaebetweenJanuary2001and May2003whichappearedtobestronglyassociatedwith thedecline inreefareaduring that time as well as a decline in the cover of Sargassum sp (an important indicator speciesonKirraReef) SimilardeclineswereevidentatPalmBeachReefbetween the January2001andMay2003surveys
TRESBPKirraReefMarineBiotaMonitoring2015 45
frc environmental
The cover ofmacroalgae at Palm Beach Reef was much lower thanat Kirra Reef over time There are several possible reasons for the lower cover of macroalgae at Palm Beach
sdot PalmBeachReefisdeeperthanKirraReefandgenerallyhashigherturbidityand therefore greater light attenuation The quantity and quality of available light affectsthedistributionandgrowthofmacroalgae(MillerampEtter2008)
sdot Differences in the pattern of recruitment of algal species to the reefs due to differentwatercurrentsandtimingofthesurveys(Kennelly1987b)
sdot Increased competition with turf algae and sessile benthic invertebrates which competeforspacewithmacroalgae(Kennelly1987aHMillerampEtter2008)
sdot PresenceofdifferentspeciesandhigherdensityofherbivoresatPalmBeachReef (particularly sea urchins and herbivorous fish) which graze on macroalgae (McCook1997HJompaampMcCook2002)
Biological assemblages exposed to physical stress typically exhibit greater levels of temporalandspatialvariability(WarwickampClarke1993HChapmanetal1995)Temporal variationinthecoverofmacroalgaeatKirraReefislikelytobeprincipallyduetotheeffect ofphysicaldisturbance fromwaveactionaswellas theassociatedassociatedabrasion andsmotheringbysandTheeffectsofthesephysicaldisturbanceswouldincreasewith thereductionofKirraReefasedgeeffectsarepronouncedandwaterdepth isreduced Increasedsmotheringbysandcanalsoreducediversity(Hatcheretal1989)abundance recruitment growth survival and seasonal regeneration of macroalgae (Umar amp Price 1998HCheshireetal1999)
Changes in the cover of macroalgae on Kirra Reef over time are also likely due to the extentofthereefchangingHthefishandmobileinvertbratesassociatedwiththereefmay have concentrated which would in turn increase grazing pressure Increased grazing pressure from fish and mobile invertebrates can reduce the coverage and diversity of macroalgaeonreefs(McCook1997HJompaampMcCook2002)
Thecoverof turfalgaeatbothKirraReefandPalmBeachReefhasvariedsignificantly betweensurveysPriorto2005turfalgaetypicallycoveredlessoftheavailablesurface areaonKirraReefthanPalmBeachReefInMarch2015themeancoverofturfalgae hasincreasedsincebaselinesurveysin1995andwasrelativelysimilarbetweenreefs(40 plusmn4atKirraReefcomparedto48plusmn4atPalmBeachReef)Thecoverofturfalgaeat Kirra Reef was similar in 2014 and 2015 which was generally higher than previous surveysexceptduringJuly2012whencoverofturfalgaepeakedat67plusmn4
TRESBPKirraReefMarineBiotaMonitoring2015 46
frc environmental
Turfalgaearebecomingadominantcomponentofcommunitiesaroundtheworld likely the result of rapid colonisation of openspace after a disturbance (eg storms) nutrient enrichment andor changes in grazing pressures Turf algae can also reflect a more physically robust growth form suited to high wave energy environments (than foliose macroRalgae)TurfalgaepeakedintheJuly2012surveylikelyrelatedtotheincreasein bare reef exposure following a stormy conditions in early 2009 and between December 2011 and June 2012 Turf algae have been the dominant form of algae on Kirra Reef sincethistimealbeitthecoverlowerthanthe2012survey
Increased cover of turf algae is typically related to good light conditions high concentrationsofnutrientsandlownumbersofgrazerssuchasfish(orconstantgrazing pressure preventing macroalgae colonisation) However the relationship between algal dynamics physical disturbance water quality and herbivore grazing activity is complex andthecoverof turfalgaecanexhibitextremetemporalvariabilityasaconsequenceof the interactionbetween topRdownandbottomRupprocesses (Russ2003HBellwoodetal 2006H Hughes et al 2007H Albert et al 2008H Hoey amp Bellwood 2008H Mumby 2009) Furtherinvestigationwouldberequiredtoreliablydeterminethemechanismsofchangein bothmacroalgaeandturfalgaeassemblagesonthesereefs
Benthic$Macroinvertebrates$
AtKirraReeftheburialandreRemergenceofrockyoutcrops(influencedbytheTRESBP) islikelytohaveincreasedtemporalvariabilityinthedistributionandabundanceofbenthic macroinvertebrates Additional perturbations such as wave action and sand abrasion (each influenced through changes in bathymetry seabed topography and water depth) are likely to have resulted in the decline in cover and diversity of the benthic macroinvertebratesatKirraReefbetweensurveysparticularlybetweenMarch2004and February2005andduringtheseverestormsof2009Benthicmacroinvertebratessuch asascidiansspongeshardcoralandsoftcoralarehighlysusceptible to theeffectsof stormandwavedisturbancephysicalabrasionandburialbysand(KayampKeough1981H Walker et al 2008) which can affect settlement growth rate and survival (Dodge amp Vaisnys1977HRogers1990)
Physical disturbance from sand burial sand abrasion and the action of storm waves appeartokeepthebenthicassemblagesofKirraReefinastateofearlysuccessionItis commonforearlypioneerspeciessuchassomemacroalgaetorecruitrapidlytoahard surface in large numbers allowing these species to dominate assemblages early in the successionaltrajectory(Walkeretal2007)
Afurther indicatorof theearlystateofsuccessionatKirraReef isthatthecoverofhard and soft coral has remained very low (generally lt 5) In March 2015 less than 1
Benthic macroinvertebrate cover may also be affected indirectly through increased competitionwithmacroalgaeforspaceThepresenceoflargemacroalgaecanaffectthe recruitment and survival of sessile benthic invertebrates as fronds moving with wave action sweep and abrade the surface of rocks killing new recruits especially corals (Kennelly1989HMcCooketal2001)Itcantakeseveralyearsforhardandsoftcoralto become dominant on reefs in the SEQ region (SchlacherRHoenlinger et al 2009) Therefore hard coral is not expected to become abundant until several years after the reefhasbeenuncoveredandonlyifthephysicaldisturbanceregimeandsupplyofnew recruitsissufficienttosupportsurvivalandgenerationalsuccessionofthesespeciesThe coverofhardandsoftcoralsatKirraReefwerebothverylowandpatchypriortothestart oftheTRESBP
Sponges and ascidians are highly susceptible to smothering and sand abrasion unless theyhaveathicktunic(outercoveringmadeofkeratin)liketheascidianP0stolonifera0or strong internal keratin silicon or calcareous structures in the case of some species of sponges0(KayampKeough1981HMcGuinness1987HWalkeretal2008)Duetoincreased wave action and sedimentation (which can be influenced by the TRESBP) the mean coverofascidiansandspongeswasexpectedtobemuchloweronKirraReefthanPalm Beach Reef However in March 2015 the cover of sponges was similar between the reefsandthecoverofascidians(otherthanP0stolonifera)wasgreateratKirraReefthan at Palm Beach Reef This suggests that Kirra Reef is slowly recovering from the increasedstressofphysicaldisturbancesuchas increasedwaveactionandsandscour andorthatwaveandstormconditionshavebeenlesssevereinthepastfewyears
Fish$
KirraReefcontinuestosupportahighdiversityofreefRassociatedandpelagic(ienonR reefassociated) fishspecies Despite itsdiminishedsizecompared to1995KirraReef continuestoprovidevaluablehabitatforanumberoffishspeciesfromdifferentfunctional groups
ThereisahighdegreeofinterRannualvariabilityinthespeciesandabundanceofthefish present at Kirra Reef compared with the assemblage at Palm Beach Reef This likely reflectsthetemporalvariabilityintheavailablehabitatasaconsequenceofreefburialand reRemergenceThediversityqualityandarealextentofreefhabitatareimportantfactors influencing the distribution abundance biomass and diversity of reef fish (Bellwood amp Hughes2001HFriedlanderetal2003)Diversityandabundanceoffishcanincreasewith
TRESBPKirraReefMarineBiotaMonitoring2015 48
frc environmental
greaterstructuralcomplexityandincreasedheterogeneityofavailablehabitats(Bellwood ampHughes2001)Thissuggeststhatperiodsofreefburialreducetheoveralldiversityof reefRassociated fish species at Kirra Reef Despite the reduction in overall reef space therewasalargervarietyofhabitats(suchasmarcoalgaeandturfalgae)in2015which was likely to be related to the high diversity of fish assemblages This is particularly importantforseveralspeciesthatdependonthepresenceoflsquostructurersquosuchasprovided by reef habitat (ie oldwife moray eels damselfish and Australian mado that were recordedinMarch2015butwerenotrecordedinJuly2012)
Theabundanceanddiversityof fishare likelytobenegativelyaffectedfollowingperiods of severe weather which create unfavourable conditions for many species and may further exacerbate the affects of abrasion and sedimentation The biomass of fish is knowntodecreasewithincreasingexposuretophysicaldisturbancefromwaveactionand strong currents (Friedlander et al 2003) As our surveys have been undertaken at different times of the year variation in the prevailing conditions at the time of sampling could also influence the types of fish observed (and the amount of reef habitat that is availableatanytime)Manyofthespeciesmayalsobeaffectedbyseasonalchangesin the water temperature such as damselfish which are less abundant in cool waters However theoveralldiversityof the fishassemblageatKirraReef is likely toreflect the sizeoftheoutcropsexposedwithagreaterphysicaldisturbance(fromseaconditionsand sandmovement)andcompetitionHandlesserfoodavailablewhenthereefiscovered
ThepredictedimpactstoKirraReefasaresultoftheTRESBPincludedaccretionofsand around the base of the rock outcrops causing a reduction in extent of reef It was predictedthatsanddeliveryaspartoftheprojectwouldeventuallymimiclsquonaturalrsquopatterns ofsanddispersalandthatthereefwouldreturntoitsnaturalextent(ietheextentpriorto extension of the Tweed River training walls in 1962) The benthic flora and fauna assemblages of the reef the historical reef extent and natural sand transport patterns wereexpectedtoreturntoconditionsobservedbeforetheextensionofthetrainingwalls between 1962 and 1965 However the Environmental Impact Study did not predict the ecologicalconsequencesofboththereducedarealextentandincreasedwaveenergy(a consequenceofdecreaseddepth)thathavebeenrecorded
ThecurrentextentofKirraReef remains less than50of that recorded in1962and in 1995beforethesanddeliverybytheTRESBPcommencedHowevertheextentofreef in1995 wasstrongly influenced by adepletion in sand following the construction of the Tweed River training walls and the Kirra Point groyne Accumulation of sand on Kirra ReefwasobservedtoincreaseasaresultofindirectsandnourishmentbytheTRESBP and the reef has been extensively covered (particuarly between 2005 and 2010) as a result
Whiletheextentofthereefcontinuestochangeovertimethedeliveryofsandaspartof the project now more closely matches the natural rate of longshore sand transport ShortRtermandseasonalchangesintheextentofthereefarenowlikelytobetheresultof waveandcurrentaction(particularlyduringservereweatherevents)thanadirectimpact of the TRESBP Therefore the extent of Kirra Reef in March 2015 is broadly in accordancewithpredictionsmadeintheEISwhichpredictedthatthereefwouldreturnto a condition similar to that exhibited in the preR1960rsquos ie before the extension of the TweedRiverbreakwatersthatinterruptedlittoralsandsupplytothesebeaches
InDecember2013KirraPointgroynewasextendedby30mwiththeexpectationthatthe beach bar would move seaward as a consequence At present Kirra Point groyne is unlikelytohavehadamajorimpactonthearealextentofKirraReefHoweverongoing monitoringbasedonaerialphotographsmayprovidefurtherinsight
Sessile benthic assemblages on Kirra Reef are highly susceptible to the influence of storms and associated wave action (Kay amp Keough 1981H Walker et al 2008) The shallowreefissurroundedbymobilesandwhichcanshiftnaturallyinresponsetowave action during storms causing burial of large sections of Kirra Reef This effect has reduced the availability of rocky substrate for colonisation and the availability of refuge
Fromanexaminationof theextentofKirraReef fromarealmapsandwaveheightdata thereappears tobea relationshipbetween theareaof rockexposedandstormevents Notably in a series of storm events in May 2009 corresponds with large areas of rock becoming exposed (with the reef approximately 100m2 in 2006 and approximately in 1009m2 2009) Further a stormy conditions between December 2011 and July 2012 correspondstotheareaofexposedrockmorethandoublinginsizeWhiletherewasno changetothetotalareaofexposedrockfollowingstormyconditionsinearly2013there wasaclearchangeinthedistibutionofexposedrockduringthistimeSince2013storm conditions have been calm to moderate and there has been little change in the areal extentanddistrubtionofexposedrockatKirraReef
WaveheighttypicallyincreasesduringstormeventsandgiventheshallowdepthofKirra Reef waves are more likely to shoal and break across the reef during storms This increases thephysicaldisturbanceabrasionandsedimentationofbenthicassemblages onKirraReefStormdisturbancecancauselocalreductionsinthespeciesrichnessand abundanceofcoral(Woodleyetal1981HMasselampDone1993HHughes1994HConnellet al 1997) and can alter fish assemblages indirectly through habitat modifications (Kaufman1983HJonesampSyms1998)ordirectlybyincreasingfishmortality(Lassig1983) The hydrodynamic forces produced by wave action are an important source of disturbance in subtidal habitats inflicting damage through direct physical impact and abrasion(UnderwoodampKennelly1990)DirectimpactsfromphysicaldisturbanceatKirra Reefareevidentduringsurveyeventswhenlargefragmentsofmacroalgaearepresentin thewatercolumnoverthereef
Storm and wave action (and associated sedimentation and abrasion) continue to be importantforcesshapingthedistributionandabundanceofbenthicspeciesatKirraReef Increased magnitude and frequency of physical disturbance resulting from increased exposureorsusceptibility tostormsandassociatedwaveaction (asonKirraReef)can lead to a decrease in the diversity of sessile invertebrate assemblages DisturbanceR drivenreductionsinbiodiversityhavethepotentialtoimpactnegativelyonthehealthand productivity of reef ecosystems (Walker et al 2008) Biodiversity is important to reef health given that many of these species (eg sponges bryozoans and ascidians) contribute a range of vital ecosystem services to reefs including nutrient cycling (Scheffers et al 2004) trophic interactions and food webs (Lesser 2006H Pawlik et al 2007) bioRerosion (Rutzler 2002H LopezRVictoria et al 2006) and stabilizing substrata (DiazampRutzler2001HWulff2001)
Theimpactsof increasedwaveactionandsedimentationonthebenthicassemblagesat Kirra Reef are likely to be greatest during and immediately following storm conditions
TRESBPKirraReefMarineBiotaMonitoring2015 51
frc environmental
Partitioningtheinfluenceofstormandwavedrivendisturbancefromthatoftheoperation oftheTRESBPwouldrequireamuchmorestatisticallypowerfulandtemporilyreplicated experimental design Given there is a large collection of wave and storm data by TRESBP this would involve greater temporal sampling of Kirra Reef including event samplingfollowingseverewaveandstormactivity
The data generated by this Kirra Reef biota monitoring program doesnrsquot support statistically rigorous consideration of seasonality (monitoring has been at its most frequentannual)
InApril2014andMarch2015KirraReefcoveredlessthan50ofthereefrsquosextentprior to theoperationof theTRESBP The lossof reefhabitathasreducedtheavailabilityof hard substratum available for colonisation and consequently the abundance of benthic sessileassemblages
The reduced depth of water resulting from the accumulation of sand exacerbates the effects of storms and wave action It is likley that as a consequnece the biological communities of Kirra Reef will reflect earlyRstage succession more frequently and for longerperiods
While there is sufficient structure available frcenvironmentalexpect that Kirra Reef will continuetoprovideimportanthabitatforadiverseassemblageoffishes
TRESBPKirraReefMarineBiotaMonitoring2015 52
frc environmental
5$ Conclusions$
Although there is still a substantial portion of the reef covered compared to before the extension of the Tweed River entrance breakwaters the current extent of Kirra Reef is broadly inaccordancewithpredictionsmadein theEIS Initial lsquocatchRuprsquobypassingand dredgeplacementofsand(between2001and2008)resulted in theburialofKirraReef Subsequentsanddelivery(since2008onwards)morecloselyreflectsnaturalpatternsof longRshoresandtransportandisthereefhasslowlyreRemerged
Theextentofthereefhasbeenrelativelystablesince2013Thishasallowedforsome succession in the benthic assemblages including a relatively high cover of sponges ascidiansandcrinoidsWiththedeliveryofsandmorecloselymatchingthenaturalrateit isexpected the reef willundergoshortRtermchanges in extentdue toseasonal shifts in sand deliveryH however the diversity of benthic assemblages on Kirra Reef is likely to increaseovertimeThiswouldcreatemorespaceforspeciestorecruitandreducesthe influence of sand abrasion and wave damage It was predicted that the areas of Kirra Reef newly exposed in 2012 would undergo a shift from turfRdominated communities to more diverse communities that could include macroalgae sponges ascidians and potentiallyhardandsoftcoralWiththeexceptionofhardandsoftcoralsthisprediction wasconfirmedbytheresultsoftheApril2014andMarch2015surveys
ThediversityoffishesassociatedwithKirraReefisbroadlysimilartothatrecordedprior tothecommencementofsandbypassingin1995Giventhatfisharemobilethegreatest impacts on fish assemblages are likely to be shortRterm changes due to both the prevailingconditionsandchangestheextentofavailablehabitatthatprovidesshelterand foodforavarietyofdifferentspeciesIfKirraReefincreasesinsizethereislikelytobea greater proportion of cryptic benthic species as these species are more typical of assemblagesinalaterstageofsuccession(eg(WillisampAnderson2003))
Assuming a broadly stable delivery rate of sand and consequent stable extent of Kirra ReeflsquorecoveryrsquoislikleytobesubstantivelycompleteFloralandfaunalcommunitieswill undergo succession between severe storm events but are likley to remain relatively dynamic
Albert S Udy J amp Tibbetts I 2008 Responses of algal communities to gradients in herbivorebiomassandwaterqualityinMarovoLagoonSolomonIslandsCoral0 Reefs2773R82
Anderson MJ 2001 A new method for nonRparametric multivariate analysis of varianceAustral0Ecology2632R46
Anderson MJ 2004 PERMDISP0 a0 FORTRAN0 computer0 program0 for0 permutatinoal0 analysis0 of0 multivariate0 dispersions0 (for0 any0 twoSfactor0 ANOVA0 design)0 using0 permutational0 tests Department of Statistics University of Auckland New Zealand
Cannon LR Goeden GB amp Campbell P 1987 Community patterns revealed by trawling in the interRreef regions of the Great Barrier Reef Memoirs0 of0 the0 Queensland0Museum2545R70
Chapman MG Underwood AJ amp Skilleter GA 1995 Variability at different spatial scalesbetweenasubtidalassemblageexposedtothedischargeofsewageand two control assemblages Journal0 of0 Experimental0 Biology0 and0 Ecology 189 103R122
Cheshire AC Miller DJ amp Stewart R (1999) Effect0 of0 dispersed0 sediment0 plumes0 from0beach0sand0replenishment0dredging0on0recruitment0of0phaeophycean0algae0 to0rocky0reefs0in0Gulf0St0Vincent0South0Australia0The0Impact0of0Sand0Dredging0 on0 Benthic0 Community0 Structure0 at0 the0 Port0 Stanvac0 Dredge0 Site0 20 1S39 UniversityofAdelaideAdelaide
ConnellJHHughesTPampWallaceCC1997A30Ryearstudyofcoralabundance recruitment and disturbance at several scales in space and time Ecological0 Monographs67461R488
Diaz MC amp Rutzler K 2001 Sponges an essential component of Caribbean coral reefsBulletin0of0Marine0Science69535R546
DodgeREampVaisnysJR1977Coralpopulationsandgrowthpatternsresponsesto sedimentation and turbidity associated with dredging Journal0 of0 Marine0 Research35715R730
Done TJ 1982 Patterns in the distribution of coral communities across the central GreatBarrierReefCoral0Reefs195R107
Edwards RA amp Smith DA 2005 Subtidal assemblages associated with a geotextile reef insouthReastQueenslandAustraliaMarine0and0Freshwater0Research56 133R142
FisheriesResearchConsultants1991Survey0of0the0Intertidal0and0Subtidal0Rocky0Reefs0 of0 the0 Sunshine0 Coast report prepared for Queensland National Parks and WildlifeService
HarrisonPHarriotVBanksSampHolmesN1998ThecoralcommunitiesofFlinders Reef andMyora Reef in theMoretonBay MarineParkQueensland Australia In Moreton0 Bay0 and0 Catchment Tibbits I Hall N amp Dennison W (Eds) SchoolofMarineScienceUniversityofQueenslandStLuciapp525R536
Hatcher B Johannes R amp Robertson A 1989 Review of research relevant to the conservationofshallowtropicalmarineecosystemsOceanography0and0Marine0 Biology0an0Annual0Review27337R414
Hoey A amp Bellwood D 2008 CrossRshelf variation in the role of parrotfishes on the GreatBarrierReefCoral0Reefs37R47
TRESBPKirraReefMarineBiotaMonitoring2015 56
frc environmental
Hollingsworth P 1975 Environmental Investigation Report Crown Reserve R R68 Currumbin Creek City of the Gold Coast Land Administration Commission unpublishedreport
Hughes TP 1994 Catastrophes phase shifts and large scale degradation of a CaribbeancoralreefScience2651547R1551
Hughes TP Rodrigues MJ Bellwood DR Ceccarelli D HoeghRGuldberg O McCook L Moltschaniwskvi N Pratchett MS Steneck RS amp Willis B 2007Phaseshiftsherbivoryandtheresilienceofcoralreefstoclimatechange Current0Biology17360R365
Hutchinson A Rempel C Taveras V Loder J amp Salmond J 2013 Reef0 Check0 Australia0 South0 East0 Queensland0 Summary0 Report0 2013 report prepared for ReefCheckFoundationLimited
Hyder Consulting 1997 Tweed0 River0 Entrance0 Sand0 Bypassing0 Project0 Permanent0 Bypassing0 System0 0 Environmental0 Impact0 Statement0 0 Impact0 Assessment0 Study report prepared for New South Wales Department of Land and Water Conservation
Jompa J amp McCook LJ 2002 Effects of competition and herbivory on interactions betweenahardcoralandabrownalgaJournal0of0Experimental0Marine0Biology0 and0Ecology27125R39
KayAMampKeoughMJ1981Occupationofpatchesintheepifaunalcommunitieson pier pilings and the bivalve Pinna bicolor at Edithburgh South Australia Oecologia48123R130
KennellyS1987aInhibitionofkelprecruitmentbyturfingalgaeandconsequencesfor an Australian kelp community Journal0 of0 Experimental0 Marine0 Biology0 and0 Ecology11249R60
Kennelly S 1987b Physical disturbances in an Australian kelp community I temporal effectsMarine0Ecology0Progress0Series40145R153
TRESBPKirraReefMarineBiotaMonitoring2015 57
frc environmental
Kennelly S 1989 Effects of kelp canopies on understory species due to shade and scourMarine0Ecology0Progress0Series50215R224
Lassig BR 1983 The effects of a cyclonic storm on coral reef fish assemblages Environmental0Biology0of0Fishes955R63
Lawson S McMahon J amp Boswood P 2001 Environmental management of the construction and operation of a sand bypassing system at the Tweed River EntranceInThe15thAustralasianCoastalandOceanEngineeringConference the 8th Australasian Port and Harbour Conference 25 R 28 September 2001 QueenslandAustralia
Lesser MP 2006 BenthicRpelagic coupling on coral reefs feeding and growth of Caribbean sponges Journal0 of0 Experimental0 Marine0 Biology0 amp0 Ecology 328 277R288
LopezRVictoriaM ZeaSampWei E2006 Competition for spacebetweenencrusting excavatingCaribbeanspongesandothercoral reeforganismsMarine0Ecology0 Progress0Series312113R121
MalcolmHASmithSDAampJordanA2009Usingpatternsofreeffishassemblages to refine a Habitat Classification System for marine parks in NSW Australia Aquatic0Conservation0Marine0and0Freshwater0Ecosystems2083R92
Massel SR amp Done TJ 1993 Effects of cyclone waves on massive coral assemblages on the Great Barrier Reef meteorology hydrodynamics and demographyCoral0Reefs12153R166
Mumby PJ amp Steneck RS 2008 Coral reef management and conservation in light of rapidly evolving ecological paradigms Trends in Ecology amp Evoution 23 555 -563
Murphy HM amp Jenkins GP 2010 Observational methods used in marine spatial monitoring of fishes and associated habitats a review Marine and Freshwater Research 61 236-252
Noriega R 2007 An Overview of Available Information on Sandy Beach Ecology Coastal Sand Dunes Rocky Reefs and Associated Biota on the Gold Coast Griffith Centre for Coastal Management Research Report No 85 report prepared for Griffith University
Parker P (1995) Structure to Reef Fish Assemblages at Julian Rocks Northern New South Wales Masters Thesis Griffith University
Parker PG 1999 Fish assemblages at Julian Rocks and the adjacent waters of northern New South Wales Australia Australian Zoologist 31 134 - 160
Pawlik JR Steindler L Henkel TP Beer S amp Ilan M 2007 Chemical warfare on coral reefs sponge metabolites differentially affect coral symbiosis in situ Limnology and Oceanography 52 907-911
Reef Check 2010 httpwwwreefcheckaustraliaorgdatahtml accessed December 2015
Robinson KI amp Pollard DA 1982 Marine and estuarine reserves in Australia with particular reference to New South Wales Wetlands 2 17 - 26
Rogers CS 1990 Responses of coral reefs and reef organisms to sedimentation Marine Ecology Progress Series 62 185-202
Russ GR 2003 Grazer biomass correlates more strongly with production than with biomass of algal turfs on a coral reef Coral Reefs 22 63-67
Rutzler K 2002 Impact of crustose clionid sponges on Caribbean reef corals Acta Geologica Hispanica 37 61-72
Scheffers SR Nieuwland G Bak RPM amp van Duyl FC 2004 Removal of bacteria and nutrient dynamics within the coral reef framework of Curacao (Netherlands Antilles) Coral Reefs 23 413-422
TRESBP Kirra Reef Marine Biota Monitoring 2015 59
frc environmental
Schlacher-Hoenlinger M Walker S Johnson J Schlacher T amp Hooper J 2009 Biological Monitoring of the Ex-HMAS Brisbane Artificial Reef Phase II - Habitat Values report prepared for Environmental Protection Agency (EPA)
Smith KA 2003 A simple multivariate technique to improve the design of a sampling strategy for age-based fishery monitoring Fisheries Research 64 79-85
Smith S Edwards R Dalton S amp Harrison M 2005 Biological assessment of fish and benthic communities at Palm Beach Bait Reef Gold Coast Queensland report prepared for University of New England
TRESBP 2014 Autum 2009 storms httpwwwtweedsandbypassnswgovauarticles-and-studiesinteresting-itemsautumn-2009-storm updated 4 May 2014 accessed December 2015
TRESBP 2015a Tweed Sand Bypassing Restoring Coastal Sand Drift Improving Boating Access ndash Techinical information httpwwwtweedsandbypassnswgovau__dataassetspdf_file0004552055kir ra-feb-2015pdf acessed December 2015
TRESBP 2015b Waves httpwwwtweedsandbypassnswgovauenvironmental-monitoringcoastal-conditionswaves updated 30 September 2015 accessed December 2015
Umar MJMLJ amp Price IR 1998 Effects of sediment deposition on the seaweed Sargassum on a fringing coral reef Coral Reefs 17 169-177
Underwood AJ amp Kennelly SJ 1990 Ecology of marine algae on rocky shores and subtidal reefs in temperate Australia Hydrobiologia 192 3-20
Walker S Schlacher T amp Schlacher-Hoenlinger M 2007 Spatial heterogeneity of epibenthos on artificial reefs fouling communities in the early stages of colonization on an East Australian shipwreck Marine Ecology 28 435-445
Walker SJ Degnan BM Hooper JNA amp Skilleter GA 2008 Will increased storm intensity from climate change affect biodiversity in non-scleractinian sessile fauna on coral reefs Global Change Biology 14 2755-2770
Warwick RM amp Clarke KR 1993 Increased variability as a symptom of stress in marine communtities Journal of Experimental Marine Biology and Ecology 172 215-216
Thenumberofsitessurveyedhasvariedover timeasaresultof the fluctuating levelof sandcoveringKirraReef
Prior to May 2003 three sites were assessed along the eastern and northern edge of KirraReef(KirraReefOutersites1to3)andthreesiteswereexaminedalongtheinshore marginof the reef (KirraReef Inner sites1 to 3)(MapA1) ReefRedge (ieKirraOuter) siteswerechosentoprovideearlywarningofimpactsfromoffshoreplacementofdredged sandwhilst inshoresites(ieKirraInner)werechosentoindicatewhetherimpactsfrom inshore beach profile development were affecting the reef platform In May 2003 the threeeasternsitesatKirraReef (ieKRO1KRO2andKRI1)werecompletelycovered with bare mobile sand Consequently only the three western sites at Kirra Reef (ie KRO3KRI2andKRI3)supportedbenthicfloraandfaunaInMarch2004theextentof the remainingwesternoutcropof KirraReef had been further reduced so that all inner reefsiteswerecompletelycoveredwithmobilesandConsequentlyonlyasingleoriginal reefsite(ieKRO3)couldbesurveyed(Figure23)Thereforetoprovideanindicationof the condition of the remaining reef two new sites were established (ie KRN1 and KRN2)(Figure23)andsurveyedinMarch2004Theextentofthewesternreefhadbeen further reduced by February 2005 and a third new site (ie KRN3) was established (Figure23)Consequentlyfoursites(KRO3KRN1KRN2andKRN3)weresurveyedin February2005
InFebruary2010fourKirraReefsites(ieKRO3KRO1KRN1andKRN2)wereclearof thesurroundingsandandsupportedbenthic floraand fauna Inaddition several rocks protruded from the sand in the vicinity of site KRI2H these were assessed to provide a quantitativeindicationofbroadRscaletemporalchangestotheinshorereefcommunities
SOURCEScopy Copyright Commonwealth of Australia (Geoscience Australia) 2001 2004 2006copy The State of Queensland (Department of Natural Resources and Mines) 2015copy Nearmap 2014 2015
DATE2015-09-09
DRAWN BYCF
VERSION02
PROJECTIONCoordinate System GDA 1994 MGA Zone 56Projection Transverse MercatorDatum GDA 1994
plusmn SCALE
0 50 100
Metres
Scale 12500 A3
frc environmental
Appendix$B$ Introduction$to$Data$Analysis$Used$
Multivariate$Analyses$
Multivariate statistical techniques are widely used in ecology to assess the similarities relationshipsbetweenassemblagesWhereasunivariateanalysescanonlycompareone variable at a time (eg an index of community structure such as a diversity index or a singleindicatorspecies)multivariateanalysescancomparesamplesbasedontheextent thatassemblagesshareparticulartaxaandabundances(ClarkeampWarwick2001)
Thefirststepofmultivariateanalysisusuallyinvolvesthecreationofamatrixofsimilarity coefficients computed between every pair of samples The coefficient is usually a measureofhowclose theabundance is foreachspecies (definedso that100= total similarity and 0=complete dissimilarity) The Bray Curtis similarity measure is commonlythemostappropriateforbiologicaldata(ClarkeampWarwick2001)
MultidimensionalScaling
NonRmetricmultiRdimensionalscalingordinations(nMDS)attempttoplacesamplesintwo dimensionalspacesothattherankorderofthedistancesbetweensamplesmatchesthe rankorderofthematchingsimilaritiesfromthesimilaritymatrix(ClarkeampWarwick2001) Thisprovidesavisualrepresentationofthesimilaritiesbetweenassemblageswithineach sampleEachoftheaxesisnotrelatedtoanyparticularvalueHinfactaxescanberotated toprovide thebestvisual representationof thedata Ordinationsareparticularlyuseful tools for analysing and visually presenting differences between assemblages Ordinationsareessentiallymapsofsamples inwhich theplacementofsampleson the mapreflectsthesimilarlyofthecommunitytothecommunitiesinothersamples(Clarkeamp Warwick 2001) Distances between samples on an ordination attempt to match the similarities inassemblagestructurenearbypoints representassemblageswithvery few attributes(speciesorabundanceofspecies)Hpoints faraparthavevery fewattributes in common(ClarkeampWarwick2001)
A stress coefficient is calculated to reflect the extent to which the multiRdimensional scalingordinationandthesimilaritymatrixagree(ClarkeampWarwick2001)(iehowwell the multiRdimensional scaling ordination accurately reflects the relationship between samples)Stressvaluesoflt015aregenerallyacceptable
In Figure A1 each freshwater macroinvertebrate sample is represented on the multiRdimensionalscalingordination By lookingat thedistancesbetweeneachsample
ANOSIMisanalogoustoANOVAinunivariatestatistics(Smith2003)AglobalRstatistic iscalculatedtodeterminewhetherthereisasignificantdifferencebetweenallsamplesIf there are differences then pairwise comparisons are conducted to test for differences betweenpairsofsamples(analogoustopostRhoctestsinANOVA)
The R value lies between R1 and +1 (all similarities within groups are less than any similarity between groups) with a value of zero representing the null hypothesis (no differenceamongasetofsamples)(ClarkeampWarwick2001)ComparisonofpairwiseR values can give an indication of how different assemblages are R values close to 0 indicatelittledifferencevaluesaround05indicatesomeoverlapandvaluescloseto1to indicate many or substantial differences In many instances however researches are primarily interestedinwhethertheRvalueisstatisticallydifferentfromzero(usuallyata confidence level of 005) (Clarke amp Warwick 2001) (ie whether they can reject the null hypothesis)
ANOSIM can provide information on whether the (visual) differences between assemblages in the multiRdimensional scaling ordination are significantH it is an independenttestfromthemultiRdimensionalscalingordinationItisbasedontestingthe
TRESBPKirraReefMarineBiotaMonitoring2015 B2
frc environmental
differences between the rank similarities in the similarity matrix not on the distances betweensamplesinthemultiRdimensionalscalingordination(ClarkeampWarwick2001)
PermutationalMultivariateAnalysisofVariance
PERMANOVAisusedtotestsimultaneousresponsesofoneormorevariablestooneor more factors in an a0 priori0 structured design using random permutation of the data to assess significance (Anderson 2004) PERMANOVA generates a pseudo FRstatistic similar to traditional ANOVA but pRvalues are calculated with permutations which does notassumenormaldatadistribution PERMANOVAcanprovide informationonwhether the (visual) differences between assemblages in a multiRdimensional scaling ordination are significantH however it is an independent test from the multiRdimensional scaling ordination
Thelevelofmultivariatedispersionamongsampleswithineachofthetestgroupscanbe examined using the permutational analysis of multivariate dispersions (PERMDISP) routine(Anderson2004)Intraditionalimpactassessmentachangeinthedispersionof datacanalsoindicateanimpact
SimilarityPercentagendashSpeciesContributions
SIMPER analysis provides information on how dissimilar assemblages from various groups are (eg how similar all of the macroinvertebrate samples taken for a particular habitatwithinastreamreachare)andhowsimilareachgroup(egreach)istoanyother group SIMPER analysis also identifies the species taxa that are contributing to the dissimilarity between two assemblages in rank order (ie it identifies which species is contributingthemosttothedifferences)SIMPERanalysismayhelptoidentifypotential lsquoindicatorrsquospeciesForexampleifaparticularspeciesconsistentlycontributesgreatlyto the differences between impacted and unimpacted assemblages it may be a useful indicator Theabundanceofthis indicatorspeciescanthenbecomparedbetweensites usingunivariatetechniquessuchasANOVA
Data is available on request from tresbpprojectofficecrownlandnswgov
TRESBPKirraReefMarineBiotaMonitoring2015 C1
frc environmental
Appendix(D( Pairwise( PERMANOVA( Results
Data is available on request from tresbpprojectofficecrownlandnswgov
TRESBPKirraReefMarineBiotaMonitoring2015 D1
frc environmental
Appendix(E( Relative(Abundance(of(Fish(found(at(Kirra(( ( and(Palm(Beach(Reefs(in(Each(Survey((Data is available on request from tresbpprojectofficecrownlandnswgovau
TRESBPKirraReefMarineBiotaMonitoring2015 E1
Structure Bookmarks
0 50 100 Metres Scale 12500 A3
0 50 100 200 Metres Scale 15000 A3
Kirra Reef
Kirra Reef
Kirra Reef
Kirra Reef
Kirra Reef
Kirra Reef
Map A1Location of Kirra Reef monitoring sites
Table D8 Pairwise comparison of macroalgae cover between sites in each year
Table D15 Pairwise comparison of turf algae cover between sites in each year
Table D29 Pairwise comparison of ascidian cover between sites in each year
Table D43 Pairwise comparison of soft coral cover between sites in each year
May 2003 March 2004Palm Beach Palm Beach Reef Reef Kirra Reef Kirra Reef
February 2005 Palm Beach February 2010 Palm Beach Reef Kirra Reef
Benthic assemblages at Kirra Reef appeared to show some overlap between surveys (Figure34H) HowevernearlyallsurveysweredifferentateachsiteatbothKirraReef andPalmBeachReef(AppendixD)BenthicassemblagesinMarch2015andApril2014 wereverysimilarcomparedtobenthicassemblages inthebaselinesurvey inApril1995 andMarch2015(notethegreateroverlapinFigure35comparedtoFigure36)
In March 2015 as in previous surveys the macroalgae Sargassum sp dominated the benthic assemblages at all sites at Kirra Reef (Figure 37) Other species present included
sdot Dictyopteris0arostichoides0
sdot Dilophus0intermedius00
sdot Zonariasp
sdot Laurencia0brongniartic0
sdot Amphiroa0anceps0
sdot Caulerpa0lentilliferaand
sdot Halimeda0discoideaand
sdot Macrocystissp
Juvenile kelp (from the genus Macrocystis) was also emerging on some areas of Kirra Reef
ThecoverofmacroalagevariedbetweensitesandsurveysatbothKirraReefandPalm Beach Reef with the magnitude of difference varying over time (note the significant interaction between site (location) x survey in Table 32) Macroalgae cover varied between surveys with 2001 being the most different to the other years (Appendix D) ThereweredifferencesbetweensitesatKirraReefinJune1995February1996January 2001 May 2003 February 2005 and February 2010 and between sites at Palm Beach ReefinJanuary2001andFebruary2010Inrecentsurveys(2012to2015)thecoverof macroalgaeatsitesatbothKirraReefandPalmBeachReefwassimilar (AppendixD) indicatingarelativelyconsistentdistributionacrossbothreefs
ThemeancoverofmacroalgaeatKirraReefhasdeclinedsinceitspeakin2001withthe greatest magnitude of decline recorded between January 2001 and May 2003 (Figure 38)InsurveysbetweenJune1995andMay2003Sargassumspformeddensecarpets overtherockysubstratecoveringupto58oftheavailablesurfaceareaofthereefIn February 2010 macroalgal cover was 12 Macroalgal cover has increased to 26 in March2015ThisissimilartothecoverrecordedinApril1995(23cover)(Figure38)
In2015nomacroalgaewasrecordedwithinthequadratsatPalmBeachReefThecover of macroalgae on Palm Beach Reef has been consistently lower than Kirra Reef since
TRESBPKirraReefMarineBiotaMonitoring2015 26
frc environmental
ecologicalmonitoringbegan typically lessthan5of theavailablesurfacearea(Figure 38)
The mean cover of turf algae varied between sites and surveys at both Kirra Reef and PalmBeachReef(notethesignificantinteractionbetweensite(location)xsurveyinTable 33)SpecificallythereweresignificantdifferencesbetweensitesatbothKirraReefand PalmBeachReefinJune1995January2001February2010July2012andApril2014 (aswellasbetweensitesinFebruary1996atKirraReef)Thecoverofturfalgaevaried betweenmostsurveysatallsitesateachreef(AppendixD)BothKirraandPalmBeach reefs showed major increases in the percent cover of turf algae from 2010 to 2012 followedbyadecreaseincoverbetween2012and2014(Figure310)Thecoverofturf algae is typically lower at Kirra Reef than at Palm Beach Reef (July 2012 being an exception) and was again slightly lower at Kirra Reef in March 2015 (Table 310) In March2015turfalgaewasmoreprevalentatKirraReefthanduringthebaselinesurvey ofApril1995
ThemeancoverofspongesatsomesitesatbothKirraReefandPalmBeachReefhas varied significantly during some surveys (note the significant interaction between site (location)xsurvey inTable34HFigure311) However thecoverofspongestendedto bemore temporallyvariable atKirraReef than at Palm Beach Reef (Figure312) The cover of sponges at Kirra Reef varied between sites in February 1996 January 2001 March2004July2012andApril2014 However thecoverofspongesatPalmBeach Reefonlyvariedbetweensites inJanuary2001andFebruary2010 (AppendixD) The cover of sponges varied between survey at each site with 1995 1996 and 2001 most differenttootheryears(AppendixD)
ThemeancoverofspongesatKirraReefdeclinedbetweenMarch2004(20cover)and February 2010 (less than 1 cover) Since 2010 the cover of sponges has increased slightly with sponges covering 8 of the reef in March 2015 (Figure 312) In March 2015thecoverofspongeswashigherthanrecordedduringthebaselinesurveyinApril 1995(3cover)(Figure312)
Figure312 Mean cover of sponges (plusmnSE) at Kirra Reef and Palm Beach Reef on all
surveys
Table34 Univariate PERMANOVA results for differences in the cover of sponges betweensurveysandlocations
Factor$ df$ MS$effect$ PseudoF$ p$(perm)$
survey 10 18576 276 0018
location 1 39671 589 0210
site(location) 4 67354 477 0001
locationxsurvey 10 1490 221 0032
site(location)xsurvey 40 67331 477 0001
error 924 14108
Shadingdenotessignificanceatplt005
TRESBPKirraReefMarineBiotaMonitoring2015 32
frc environmental
Ascidians$
ThemeanabundanceofallascidiansotherthanPyura0stoloniferahasvariedsignifcantly between sites at Kirra Reef and Palm Beach Reef and between surveys at each site (Figure314andnotethesignificantinteractionbetweensite(location)xsurveyinTable 35) The abundance of ascidians was different between sites at Kirra Reef in January 2001May2003March2004February2005andApril2014HanddifferentatPalmBeach ReefinJanuary2001February2005February2010andMarch2015Theabundance ofascidiansvariedbetweensurveysateachsitewith1995beingmostdifferentwhenthe abundanceofascidianswaslow(AppendixD)InMarch2015theabundanceofallother ascidiansonKirraReefandPalmBeachReefwashigherthanpreviouslyreportedinthe baselinesurveyinApril1995(whennoascidianswererecorded)Themeanabundance washigheratKirraReefthanatPalmBeachReef(Figure314)
ThemeanabundanceofPyura0stoloniferahasvariedconsiderablybetweensitesatKirra Reef and Palm Beach Reef over time (note the significant interaction between site (location) x survey in Table 36) In March 2015 the mean abundance (individual per 025m2plusmnSE)of theascidianPstolonifera (Figure313)wassimilaratKirraReefand PalmBeachReef(Figure315)ThemeanabundanceofP0stoloniferahasrangedfrom 02to17individualsper025m2atbothreefssinceMay2003
Figure315 Mean abundance of ascidians (Pyura0 stolonifera) (individuals025m2)
(plusmnSE)atKirraReefandPalmBeachReefinallsurveys
TRESBPKirraReefMarineBiotaMonitoring2015 34
frc environmental
Table35 Univariate PERMANOVA results for the differences in cover of all ascidians otherthanPyura0stolonifera0betweensurveysandlocations
Factor$ df$ MS$effect$ PseudoF$ p$(perm)$
survey 10 26658 474 0001
location 1 13603 710 0104
site(location) 4 19154 149 0212
locationxsurvey 10 2629 468 0001
site(location)xsurvey 40 5621 438 0001
error 924 12828
Shadingdenotessignificanceatplt005
Table36 Univariate PERMANOVA results for the differences in Pyura0 stolonifera densitybetweensurveysandlocations
Factor$ df$ MS$effect$ PseudoF$ p$(perm)$
survey 10 16254 11842 0001
location 1 12445 60881 0206
site(location) 4 20442 56799 0001
locationxsurvey 10 79724 58082 0001
site (location) x 40 13726 38138 0001 survey
error 924 35991
Shadingdenotessignificanceatplt005
$
TRESBPKirraReefMarineBiotaMonitoring2015 35
frc environmental
Hard$Coral$
There was a significant difference between the cover of hard corals at Kirra Reef and PalmBeachReefduringsomesurveys(notethesignificantinteractionbetweenlocationx surveyinTable37)SpecificallytherewassignificantlymorehardcoralatPalmBeach Reef thanKirraReef inFebraury1996March2004April2014andMarch2015(Table 38)
ThecoverofhardcoralistypicallylowonKirraReefaccountingforlessthan2ofthe availablesubstrateInMarch2015hardcoralcoveredlessthan1oftheareaofKirra Reef which was less than the cover recorded during the baseline survey in April 1995 (Figure 316) In contrast hard coral covered 11 of the surface area at Palm Beach ReefwhichwasgreaterthanthecoverrecordedinApril1995(Figure316)
The cover of hard corals at Palm Beach Reef has been more variable over time comparedtothecoverofhardcoralatKirraReef(Figure316)Withtheexceptionofthe surveys inApril1995andJanuary2001when thecoverofhardcoralwas lowonboth reefshardcoralsaretypicallymoreprevalentatPalmBeachReef(Figure316)
Table38 PERMANOVA post hoc pairwise results for the differences in the cover of hardcoralbetweenlocationsineachsurveyevent
Hard$Corals$ Survey$
t$ p$(MC)$a$
Apr1995 054 0606
Jun1995 182 0140
Feb1996 541 0006
Jan2001 R R
May2003 166 0168
Mar2004 765 0001
Feb2005 049 0646
Feb2010 156 0197
Jul2012 283 0053
Apr2014 525 0011
Mar2015 695 0003 Shadingdenotessignificanceatplt005 a pvaluesbasedonMonteCarlotests
TRESBPKirraReefMarineBiotaMonitoring2015 37
60
50
40
30
20
10
0
Soft
Cor
al C
over
()
Kirra Reef Palm Beach Reef
frc environmental
Soft$Coral$
The cover of soft coral was significantly different between sites at both Kirra Reef and PalmBeachReefandduringsomesurveys(notethesignificant interactionbetweensite (location)xsurvey)TherewasnosoftcoralrecordedatKirraReefinMarch2015The coverofsoftcoralhasdeclinedatKirraReefsince2003andhascoveredlessthan2of theavailablesubstratesince2005whichissimilartothecoverofsoftcoraldescribedfor the baseline surveys in 1995 (Figure 317) The cover of soft coral was consistent betweensitesineachsurveyexceptbetweensitesin
sdot April1995atKirraReef
sdot 1996atKirraReef
sdot 2003atPalmBeachReefand
sdot 2014atPalmBeachReef(AppendixD)
Soft corals have historically covered more of the available space on Palm Beach Reef than on Kirra Reef However there was more temporal variability within sites at Palm BeachReefthanatKirraReef(AppendixD)ThecoverofsoftcoralatPalmBeachReef has varied over time and was highest in April 1995 (48 cover) Despite increasing sinceFebruary2005itisstilllowerthanthecoverrecordedduringthebaselinesurveyin April1995(Figure317)
Table39 UnivariatePERMANOVAresults for thedifferences in thecoverofsoft coral betweensurveysandlocations
Factor$ df$ MS$effect$ PseudoF$ p$(perm)$
survey 10 44657 1323 0001
location 1 32922 6620 0117
site(location) 4 49732 266 0036
locationxsurvey 10 40982 1214 0001
site (location) x 40 3376 181 0002 survey
error 924 18688
Shadingdenotessignificanceatplt005
$
TRESBPKirraReefMarineBiotaMonitoring2015 39
frc environmental
Crinoids$
ThereisasignificantdifferencebetweensomesitesatbothKirraReefandParmBeach Reef that varies through time (note the significant interaction between site (location) x survey inTable310) Theabundanceofcrinoidshasbeensimilarbetweensites inall years at Palm Beach ReefH and was different beween sites at Kirra Reef in June 1995 February1996May2003andFebruary2005(AppendixD)Withineachsitetherehas been some natural temporal variability particualrly at Palm Beach Reef sites in 2001 (Appendix D) The mean abundance (individuals 025m2) of crinoids (Figure 318) at KirraReefandPalmBeachReefhasgenerallybeenlessthan2individualsper025m2 andhasdeclinedatboth locationssincethebaselinesurvey inApril1995(Figure319) However the mean abundance of crinoids on Kirra Reef has shown a slight increase sinceFebruary2010(Figure319)
In March 2015 fewer crinoids were recorded at Palm Beach Reef than at Kirra ReefH crinoidshavebeenrareatPalmBeachReefsince2003
The species richness of fish recorded from Kirra Reef across all monitoring events has rangedfrom14to57 InMarch201557specieswereidentifiedat thereefwhichwas similar to April 2014 (53) and higher than previous surveys (Figure 320) Species richnessatPalmBeachReefwas lower(34species)andgenerallyvaried lessbetween surveyscomparedtoKirraReef
InMarch2015 the assemblage of fish at KirraReef comprised species fromall trophic levelsincludingdetritivoresplanktivoresherbivoresandcarnivores(AppendixE)Asin previous surveys the assemblage was dominated by herbivores and planktivores Yellowtail (Trachurus0 novaezelandiae) and striped sea pike (Sphyraena0 obtusata) were the dominant species present in large schools (Figure 321) Australian mado (Atypichthys0 strigatus) ringRtailed surgeon (Acanthurus0 blochii) silver trevally (Pseudocaranx0 georgianus) eastern pomfred (Schuettea0 scalaripinnis) sweep (Scorpis0 lineolatus) and various wrasses were also very abundant releative to other species (AppendixE)
Two new species were observed at Kirra Reef the orangeRband surgeon (Acanthurus0 olivaceus) and the unicornfish (Naso0 sp) Five new species were recorded at Palm BeachReef
No threatened or protected fish species listed under the Queenslandrsquos Nature0 Conservation0Act01992ornationallyundertheEnvironmental0Protection0and0Biodiversity0 Conservation0 Act0 1999 were observed The complete list of species recorded and the relativeabundanceispresentedinAppendixE
TRESBPKirraReefMarineBiotaMonitoring2015 42
60
0
10
20
30
40
50
Num
ber
of F
ish
Spe
cies
Apr-95
Jun-95
Feb-96
Jan-01
May-03
Mar-04
Feb-05
Feb-10
Jul-12
Apr-14
Mar-15
Kirra Reef Palm Beach Reef Location
frc environmental
Figure320 Number of fish species recorded at Kirra Reef and Palm Beach Reef on
ThegreatestchangetotheecologicalconditionofKirraReefsincethebaselinesurveyin 1995 has been the loss of large areas of hard substrate that support benthic flora and faunaThedeliveryoflargesandvolumesduringthestage1dredgingoperations(1995 to1998)andtheinitialoperationofthesandbypasssystem(2001to2008)resultedinan increaseinwaveactionandtidalcurrentsredistributingthissandoverKirraReef
The three major outcrops of Kirra Reef (northern southern and eastern sections) are naturally exposed and covered depending on water and sand movements In March 2015 the rocky outcrops in the northern section of Kirra Reef were exposed and supportedamoderatelydiversebenthicassemblagedominatedbyturfalgaeTherewas arelativelyhighfishdiversityatKirraReefTheecologicalassemblageexhibitedsignsof ongoingstressfromphysicaldisturbanceincludingtheabsenceofsoftcoralsandrarityof hardcoral(MumbyampSteneck2008)HoweverKirraReefhasarelativelyhighcoverof sponges and ascidians Sponges ascidians and crinoids were more abundant at Kirra ReefthanatPalmBeachReefinMarch2015
KirraReefcontinues toprovidehabitatandsupport importantecological functions in the region providing hard substrate for the colonisation of algae and benthic invertebrates and food and refuge for fish As sand levels have stabilised since 2008 assemblages have becomemoresimilar to those recordedprior to implementationof the TRESBP in April1995 Forexamplemacroalgalcover inApril1995andMarch2015wasrelatively similarHoweverassemblagecompositionisstillsignificantlydifferenttothatrecordedin thebaselinesurveysmostnoticeablyduetoa lowercoverofbaresubstrateandhigher coverofturfalgaeandascidianssincesurveyshavebeenperformed
Benthic$Macroalgae$
The cover of macroalgae at Kirra Reef was relatively similar during the 2014 and 2015 surveys and remained well below the peak of nearly 60 cover recorded in January 2001TherewasasteepdeclineinthecoverofmacroalgaebetweenJanuary2001and May2003whichappearedtobestronglyassociatedwith thedecline inreefareaduring that time as well as a decline in the cover of Sargassum sp (an important indicator speciesonKirraReef) SimilardeclineswereevidentatPalmBeachReefbetween the January2001andMay2003surveys
TRESBPKirraReefMarineBiotaMonitoring2015 45
frc environmental
The cover ofmacroalgae at Palm Beach Reef was much lower thanat Kirra Reef over time There are several possible reasons for the lower cover of macroalgae at Palm Beach
sdot PalmBeachReefisdeeperthanKirraReefandgenerallyhashigherturbidityand therefore greater light attenuation The quantity and quality of available light affectsthedistributionandgrowthofmacroalgae(MillerampEtter2008)
sdot Differences in the pattern of recruitment of algal species to the reefs due to differentwatercurrentsandtimingofthesurveys(Kennelly1987b)
sdot Increased competition with turf algae and sessile benthic invertebrates which competeforspacewithmacroalgae(Kennelly1987aHMillerampEtter2008)
sdot PresenceofdifferentspeciesandhigherdensityofherbivoresatPalmBeachReef (particularly sea urchins and herbivorous fish) which graze on macroalgae (McCook1997HJompaampMcCook2002)
Biological assemblages exposed to physical stress typically exhibit greater levels of temporalandspatialvariability(WarwickampClarke1993HChapmanetal1995)Temporal variationinthecoverofmacroalgaeatKirraReefislikelytobeprincipallyduetotheeffect ofphysicaldisturbance fromwaveactionaswellas theassociatedassociatedabrasion andsmotheringbysandTheeffectsofthesephysicaldisturbanceswouldincreasewith thereductionofKirraReefasedgeeffectsarepronouncedandwaterdepth isreduced Increasedsmotheringbysandcanalsoreducediversity(Hatcheretal1989)abundance recruitment growth survival and seasonal regeneration of macroalgae (Umar amp Price 1998HCheshireetal1999)
Changes in the cover of macroalgae on Kirra Reef over time are also likely due to the extentofthereefchangingHthefishandmobileinvertbratesassociatedwiththereefmay have concentrated which would in turn increase grazing pressure Increased grazing pressure from fish and mobile invertebrates can reduce the coverage and diversity of macroalgaeonreefs(McCook1997HJompaampMcCook2002)
Thecoverof turfalgaeatbothKirraReefandPalmBeachReefhasvariedsignificantly betweensurveysPriorto2005turfalgaetypicallycoveredlessoftheavailablesurface areaonKirraReefthanPalmBeachReefInMarch2015themeancoverofturfalgae hasincreasedsincebaselinesurveysin1995andwasrelativelysimilarbetweenreefs(40 plusmn4atKirraReefcomparedto48plusmn4atPalmBeachReef)Thecoverofturfalgaeat Kirra Reef was similar in 2014 and 2015 which was generally higher than previous surveysexceptduringJuly2012whencoverofturfalgaepeakedat67plusmn4
TRESBPKirraReefMarineBiotaMonitoring2015 46
frc environmental
Turfalgaearebecomingadominantcomponentofcommunitiesaroundtheworld likely the result of rapid colonisation of openspace after a disturbance (eg storms) nutrient enrichment andor changes in grazing pressures Turf algae can also reflect a more physically robust growth form suited to high wave energy environments (than foliose macroRalgae)TurfalgaepeakedintheJuly2012surveylikelyrelatedtotheincreasein bare reef exposure following a stormy conditions in early 2009 and between December 2011 and June 2012 Turf algae have been the dominant form of algae on Kirra Reef sincethistimealbeitthecoverlowerthanthe2012survey
Increased cover of turf algae is typically related to good light conditions high concentrationsofnutrientsandlownumbersofgrazerssuchasfish(orconstantgrazing pressure preventing macroalgae colonisation) However the relationship between algal dynamics physical disturbance water quality and herbivore grazing activity is complex andthecoverof turfalgaecanexhibitextremetemporalvariabilityasaconsequenceof the interactionbetween topRdownandbottomRupprocesses (Russ2003HBellwoodetal 2006H Hughes et al 2007H Albert et al 2008H Hoey amp Bellwood 2008H Mumby 2009) Furtherinvestigationwouldberequiredtoreliablydeterminethemechanismsofchangein bothmacroalgaeandturfalgaeassemblagesonthesereefs
Benthic$Macroinvertebrates$
AtKirraReeftheburialandreRemergenceofrockyoutcrops(influencedbytheTRESBP) islikelytohaveincreasedtemporalvariabilityinthedistributionandabundanceofbenthic macroinvertebrates Additional perturbations such as wave action and sand abrasion (each influenced through changes in bathymetry seabed topography and water depth) are likely to have resulted in the decline in cover and diversity of the benthic macroinvertebratesatKirraReefbetweensurveysparticularlybetweenMarch2004and February2005andduringtheseverestormsof2009Benthicmacroinvertebratessuch asascidiansspongeshardcoralandsoftcoralarehighlysusceptible to theeffectsof stormandwavedisturbancephysicalabrasionandburialbysand(KayampKeough1981H Walker et al 2008) which can affect settlement growth rate and survival (Dodge amp Vaisnys1977HRogers1990)
Physical disturbance from sand burial sand abrasion and the action of storm waves appeartokeepthebenthicassemblagesofKirraReefinastateofearlysuccessionItis commonforearlypioneerspeciessuchassomemacroalgaetorecruitrapidlytoahard surface in large numbers allowing these species to dominate assemblages early in the successionaltrajectory(Walkeretal2007)
Afurther indicatorof theearlystateofsuccessionatKirraReef isthatthecoverofhard and soft coral has remained very low (generally lt 5) In March 2015 less than 1
Benthic macroinvertebrate cover may also be affected indirectly through increased competitionwithmacroalgaeforspaceThepresenceoflargemacroalgaecanaffectthe recruitment and survival of sessile benthic invertebrates as fronds moving with wave action sweep and abrade the surface of rocks killing new recruits especially corals (Kennelly1989HMcCooketal2001)Itcantakeseveralyearsforhardandsoftcoralto become dominant on reefs in the SEQ region (SchlacherRHoenlinger et al 2009) Therefore hard coral is not expected to become abundant until several years after the reefhasbeenuncoveredandonlyifthephysicaldisturbanceregimeandsupplyofnew recruitsissufficienttosupportsurvivalandgenerationalsuccessionofthesespeciesThe coverofhardandsoftcoralsatKirraReefwerebothverylowandpatchypriortothestart oftheTRESBP
Sponges and ascidians are highly susceptible to smothering and sand abrasion unless theyhaveathicktunic(outercoveringmadeofkeratin)liketheascidianP0stolonifera0or strong internal keratin silicon or calcareous structures in the case of some species of sponges0(KayampKeough1981HMcGuinness1987HWalkeretal2008)Duetoincreased wave action and sedimentation (which can be influenced by the TRESBP) the mean coverofascidiansandspongeswasexpectedtobemuchloweronKirraReefthanPalm Beach Reef However in March 2015 the cover of sponges was similar between the reefsandthecoverofascidians(otherthanP0stolonifera)wasgreateratKirraReefthan at Palm Beach Reef This suggests that Kirra Reef is slowly recovering from the increasedstressofphysicaldisturbancesuchas increasedwaveactionandsandscour andorthatwaveandstormconditionshavebeenlesssevereinthepastfewyears
Fish$
KirraReefcontinuestosupportahighdiversityofreefRassociatedandpelagic(ienonR reefassociated) fishspecies Despite itsdiminishedsizecompared to1995KirraReef continuestoprovidevaluablehabitatforanumberoffishspeciesfromdifferentfunctional groups
ThereisahighdegreeofinterRannualvariabilityinthespeciesandabundanceofthefish present at Kirra Reef compared with the assemblage at Palm Beach Reef This likely reflectsthetemporalvariabilityintheavailablehabitatasaconsequenceofreefburialand reRemergenceThediversityqualityandarealextentofreefhabitatareimportantfactors influencing the distribution abundance biomass and diversity of reef fish (Bellwood amp Hughes2001HFriedlanderetal2003)Diversityandabundanceoffishcanincreasewith
TRESBPKirraReefMarineBiotaMonitoring2015 48
frc environmental
greaterstructuralcomplexityandincreasedheterogeneityofavailablehabitats(Bellwood ampHughes2001)Thissuggeststhatperiodsofreefburialreducetheoveralldiversityof reefRassociated fish species at Kirra Reef Despite the reduction in overall reef space therewasalargervarietyofhabitats(suchasmarcoalgaeandturfalgae)in2015which was likely to be related to the high diversity of fish assemblages This is particularly importantforseveralspeciesthatdependonthepresenceoflsquostructurersquosuchasprovided by reef habitat (ie oldwife moray eels damselfish and Australian mado that were recordedinMarch2015butwerenotrecordedinJuly2012)
Theabundanceanddiversityof fishare likelytobenegativelyaffectedfollowingperiods of severe weather which create unfavourable conditions for many species and may further exacerbate the affects of abrasion and sedimentation The biomass of fish is knowntodecreasewithincreasingexposuretophysicaldisturbancefromwaveactionand strong currents (Friedlander et al 2003) As our surveys have been undertaken at different times of the year variation in the prevailing conditions at the time of sampling could also influence the types of fish observed (and the amount of reef habitat that is availableatanytime)Manyofthespeciesmayalsobeaffectedbyseasonalchangesin the water temperature such as damselfish which are less abundant in cool waters However theoveralldiversityof the fishassemblageatKirraReef is likely toreflect the sizeoftheoutcropsexposedwithagreaterphysicaldisturbance(fromseaconditionsand sandmovement)andcompetitionHandlesserfoodavailablewhenthereefiscovered
ThepredictedimpactstoKirraReefasaresultoftheTRESBPincludedaccretionofsand around the base of the rock outcrops causing a reduction in extent of reef It was predictedthatsanddeliveryaspartoftheprojectwouldeventuallymimiclsquonaturalrsquopatterns ofsanddispersalandthatthereefwouldreturntoitsnaturalextent(ietheextentpriorto extension of the Tweed River training walls in 1962) The benthic flora and fauna assemblages of the reef the historical reef extent and natural sand transport patterns wereexpectedtoreturntoconditionsobservedbeforetheextensionofthetrainingwalls between 1962 and 1965 However the Environmental Impact Study did not predict the ecologicalconsequencesofboththereducedarealextentandincreasedwaveenergy(a consequenceofdecreaseddepth)thathavebeenrecorded
ThecurrentextentofKirraReef remains less than50of that recorded in1962and in 1995beforethesanddeliverybytheTRESBPcommencedHowevertheextentofreef in1995 wasstrongly influenced by adepletion in sand following the construction of the Tweed River training walls and the Kirra Point groyne Accumulation of sand on Kirra ReefwasobservedtoincreaseasaresultofindirectsandnourishmentbytheTRESBP and the reef has been extensively covered (particuarly between 2005 and 2010) as a result
Whiletheextentofthereefcontinuestochangeovertimethedeliveryofsandaspartof the project now more closely matches the natural rate of longshore sand transport ShortRtermandseasonalchangesintheextentofthereefarenowlikelytobetheresultof waveandcurrentaction(particularlyduringservereweatherevents)thanadirectimpact of the TRESBP Therefore the extent of Kirra Reef in March 2015 is broadly in accordancewithpredictionsmadeintheEISwhichpredictedthatthereefwouldreturnto a condition similar to that exhibited in the preR1960rsquos ie before the extension of the TweedRiverbreakwatersthatinterruptedlittoralsandsupplytothesebeaches
InDecember2013KirraPointgroynewasextendedby30mwiththeexpectationthatthe beach bar would move seaward as a consequence At present Kirra Point groyne is unlikelytohavehadamajorimpactonthearealextentofKirraReefHoweverongoing monitoringbasedonaerialphotographsmayprovidefurtherinsight
Sessile benthic assemblages on Kirra Reef are highly susceptible to the influence of storms and associated wave action (Kay amp Keough 1981H Walker et al 2008) The shallowreefissurroundedbymobilesandwhichcanshiftnaturallyinresponsetowave action during storms causing burial of large sections of Kirra Reef This effect has reduced the availability of rocky substrate for colonisation and the availability of refuge
Fromanexaminationof theextentofKirraReef fromarealmapsandwaveheightdata thereappears tobea relationshipbetween theareaof rockexposedandstormevents Notably in a series of storm events in May 2009 corresponds with large areas of rock becoming exposed (with the reef approximately 100m2 in 2006 and approximately in 1009m2 2009) Further a stormy conditions between December 2011 and July 2012 correspondstotheareaofexposedrockmorethandoublinginsizeWhiletherewasno changetothetotalareaofexposedrockfollowingstormyconditionsinearly2013there wasaclearchangeinthedistibutionofexposedrockduringthistimeSince2013storm conditions have been calm to moderate and there has been little change in the areal extentanddistrubtionofexposedrockatKirraReef
WaveheighttypicallyincreasesduringstormeventsandgiventheshallowdepthofKirra Reef waves are more likely to shoal and break across the reef during storms This increases thephysicaldisturbanceabrasionandsedimentationofbenthicassemblages onKirraReefStormdisturbancecancauselocalreductionsinthespeciesrichnessand abundanceofcoral(Woodleyetal1981HMasselampDone1993HHughes1994HConnellet al 1997) and can alter fish assemblages indirectly through habitat modifications (Kaufman1983HJonesampSyms1998)ordirectlybyincreasingfishmortality(Lassig1983) The hydrodynamic forces produced by wave action are an important source of disturbance in subtidal habitats inflicting damage through direct physical impact and abrasion(UnderwoodampKennelly1990)DirectimpactsfromphysicaldisturbanceatKirra Reefareevidentduringsurveyeventswhenlargefragmentsofmacroalgaearepresentin thewatercolumnoverthereef
Storm and wave action (and associated sedimentation and abrasion) continue to be importantforcesshapingthedistributionandabundanceofbenthicspeciesatKirraReef Increased magnitude and frequency of physical disturbance resulting from increased exposureorsusceptibility tostormsandassociatedwaveaction (asonKirraReef)can lead to a decrease in the diversity of sessile invertebrate assemblages DisturbanceR drivenreductionsinbiodiversityhavethepotentialtoimpactnegativelyonthehealthand productivity of reef ecosystems (Walker et al 2008) Biodiversity is important to reef health given that many of these species (eg sponges bryozoans and ascidians) contribute a range of vital ecosystem services to reefs including nutrient cycling (Scheffers et al 2004) trophic interactions and food webs (Lesser 2006H Pawlik et al 2007) bioRerosion (Rutzler 2002H LopezRVictoria et al 2006) and stabilizing substrata (DiazampRutzler2001HWulff2001)
Theimpactsof increasedwaveactionandsedimentationonthebenthicassemblagesat Kirra Reef are likely to be greatest during and immediately following storm conditions
TRESBPKirraReefMarineBiotaMonitoring2015 51
frc environmental
Partitioningtheinfluenceofstormandwavedrivendisturbancefromthatoftheoperation oftheTRESBPwouldrequireamuchmorestatisticallypowerfulandtemporilyreplicated experimental design Given there is a large collection of wave and storm data by TRESBP this would involve greater temporal sampling of Kirra Reef including event samplingfollowingseverewaveandstormactivity
The data generated by this Kirra Reef biota monitoring program doesnrsquot support statistically rigorous consideration of seasonality (monitoring has been at its most frequentannual)
InApril2014andMarch2015KirraReefcoveredlessthan50ofthereefrsquosextentprior to theoperationof theTRESBP The lossof reefhabitathasreducedtheavailabilityof hard substratum available for colonisation and consequently the abundance of benthic sessileassemblages
The reduced depth of water resulting from the accumulation of sand exacerbates the effects of storms and wave action It is likley that as a consequnece the biological communities of Kirra Reef will reflect earlyRstage succession more frequently and for longerperiods
While there is sufficient structure available frcenvironmentalexpect that Kirra Reef will continuetoprovideimportanthabitatforadiverseassemblageoffishes
TRESBPKirraReefMarineBiotaMonitoring2015 52
frc environmental
5$ Conclusions$
Although there is still a substantial portion of the reef covered compared to before the extension of the Tweed River entrance breakwaters the current extent of Kirra Reef is broadly inaccordancewithpredictionsmadein theEIS Initial lsquocatchRuprsquobypassingand dredgeplacementofsand(between2001and2008)resulted in theburialofKirraReef Subsequentsanddelivery(since2008onwards)morecloselyreflectsnaturalpatternsof longRshoresandtransportandisthereefhasslowlyreRemerged
Theextentofthereefhasbeenrelativelystablesince2013Thishasallowedforsome succession in the benthic assemblages including a relatively high cover of sponges ascidiansandcrinoidsWiththedeliveryofsandmorecloselymatchingthenaturalrateit isexpected the reef willundergoshortRtermchanges in extentdue toseasonal shifts in sand deliveryH however the diversity of benthic assemblages on Kirra Reef is likely to increaseovertimeThiswouldcreatemorespaceforspeciestorecruitandreducesthe influence of sand abrasion and wave damage It was predicted that the areas of Kirra Reef newly exposed in 2012 would undergo a shift from turfRdominated communities to more diverse communities that could include macroalgae sponges ascidians and potentiallyhardandsoftcoralWiththeexceptionofhardandsoftcoralsthisprediction wasconfirmedbytheresultsoftheApril2014andMarch2015surveys
ThediversityoffishesassociatedwithKirraReefisbroadlysimilartothatrecordedprior tothecommencementofsandbypassingin1995Giventhatfisharemobilethegreatest impacts on fish assemblages are likely to be shortRterm changes due to both the prevailingconditionsandchangestheextentofavailablehabitatthatprovidesshelterand foodforavarietyofdifferentspeciesIfKirraReefincreasesinsizethereislikelytobea greater proportion of cryptic benthic species as these species are more typical of assemblagesinalaterstageofsuccession(eg(WillisampAnderson2003))
Assuming a broadly stable delivery rate of sand and consequent stable extent of Kirra ReeflsquorecoveryrsquoislikleytobesubstantivelycompleteFloralandfaunalcommunitieswill undergo succession between severe storm events but are likley to remain relatively dynamic
Albert S Udy J amp Tibbetts I 2008 Responses of algal communities to gradients in herbivorebiomassandwaterqualityinMarovoLagoonSolomonIslandsCoral0 Reefs2773R82
Anderson MJ 2001 A new method for nonRparametric multivariate analysis of varianceAustral0Ecology2632R46
Anderson MJ 2004 PERMDISP0 a0 FORTRAN0 computer0 program0 for0 permutatinoal0 analysis0 of0 multivariate0 dispersions0 (for0 any0 twoSfactor0 ANOVA0 design)0 using0 permutational0 tests Department of Statistics University of Auckland New Zealand
Cannon LR Goeden GB amp Campbell P 1987 Community patterns revealed by trawling in the interRreef regions of the Great Barrier Reef Memoirs0 of0 the0 Queensland0Museum2545R70
Chapman MG Underwood AJ amp Skilleter GA 1995 Variability at different spatial scalesbetweenasubtidalassemblageexposedtothedischargeofsewageand two control assemblages Journal0 of0 Experimental0 Biology0 and0 Ecology 189 103R122
Cheshire AC Miller DJ amp Stewart R (1999) Effect0 of0 dispersed0 sediment0 plumes0 from0beach0sand0replenishment0dredging0on0recruitment0of0phaeophycean0algae0 to0rocky0reefs0in0Gulf0St0Vincent0South0Australia0The0Impact0of0Sand0Dredging0 on0 Benthic0 Community0 Structure0 at0 the0 Port0 Stanvac0 Dredge0 Site0 20 1S39 UniversityofAdelaideAdelaide
ConnellJHHughesTPampWallaceCC1997A30Ryearstudyofcoralabundance recruitment and disturbance at several scales in space and time Ecological0 Monographs67461R488
Diaz MC amp Rutzler K 2001 Sponges an essential component of Caribbean coral reefsBulletin0of0Marine0Science69535R546
DodgeREampVaisnysJR1977Coralpopulationsandgrowthpatternsresponsesto sedimentation and turbidity associated with dredging Journal0 of0 Marine0 Research35715R730
Done TJ 1982 Patterns in the distribution of coral communities across the central GreatBarrierReefCoral0Reefs195R107
Edwards RA amp Smith DA 2005 Subtidal assemblages associated with a geotextile reef insouthReastQueenslandAustraliaMarine0and0Freshwater0Research56 133R142
FisheriesResearchConsultants1991Survey0of0the0Intertidal0and0Subtidal0Rocky0Reefs0 of0 the0 Sunshine0 Coast report prepared for Queensland National Parks and WildlifeService
HarrisonPHarriotVBanksSampHolmesN1998ThecoralcommunitiesofFlinders Reef andMyora Reef in theMoretonBay MarineParkQueensland Australia In Moreton0 Bay0 and0 Catchment Tibbits I Hall N amp Dennison W (Eds) SchoolofMarineScienceUniversityofQueenslandStLuciapp525R536
Hatcher B Johannes R amp Robertson A 1989 Review of research relevant to the conservationofshallowtropicalmarineecosystemsOceanography0and0Marine0 Biology0an0Annual0Review27337R414
Hoey A amp Bellwood D 2008 CrossRshelf variation in the role of parrotfishes on the GreatBarrierReefCoral0Reefs37R47
TRESBPKirraReefMarineBiotaMonitoring2015 56
frc environmental
Hollingsworth P 1975 Environmental Investigation Report Crown Reserve R R68 Currumbin Creek City of the Gold Coast Land Administration Commission unpublishedreport
Hughes TP 1994 Catastrophes phase shifts and large scale degradation of a CaribbeancoralreefScience2651547R1551
Hughes TP Rodrigues MJ Bellwood DR Ceccarelli D HoeghRGuldberg O McCook L Moltschaniwskvi N Pratchett MS Steneck RS amp Willis B 2007Phaseshiftsherbivoryandtheresilienceofcoralreefstoclimatechange Current0Biology17360R365
Hutchinson A Rempel C Taveras V Loder J amp Salmond J 2013 Reef0 Check0 Australia0 South0 East0 Queensland0 Summary0 Report0 2013 report prepared for ReefCheckFoundationLimited
Hyder Consulting 1997 Tweed0 River0 Entrance0 Sand0 Bypassing0 Project0 Permanent0 Bypassing0 System0 0 Environmental0 Impact0 Statement0 0 Impact0 Assessment0 Study report prepared for New South Wales Department of Land and Water Conservation
Jompa J amp McCook LJ 2002 Effects of competition and herbivory on interactions betweenahardcoralandabrownalgaJournal0of0Experimental0Marine0Biology0 and0Ecology27125R39
KayAMampKeoughMJ1981Occupationofpatchesintheepifaunalcommunitieson pier pilings and the bivalve Pinna bicolor at Edithburgh South Australia Oecologia48123R130
KennellyS1987aInhibitionofkelprecruitmentbyturfingalgaeandconsequencesfor an Australian kelp community Journal0 of0 Experimental0 Marine0 Biology0 and0 Ecology11249R60
Kennelly S 1987b Physical disturbances in an Australian kelp community I temporal effectsMarine0Ecology0Progress0Series40145R153
TRESBPKirraReefMarineBiotaMonitoring2015 57
frc environmental
Kennelly S 1989 Effects of kelp canopies on understory species due to shade and scourMarine0Ecology0Progress0Series50215R224
Lassig BR 1983 The effects of a cyclonic storm on coral reef fish assemblages Environmental0Biology0of0Fishes955R63
Lawson S McMahon J amp Boswood P 2001 Environmental management of the construction and operation of a sand bypassing system at the Tweed River EntranceInThe15thAustralasianCoastalandOceanEngineeringConference the 8th Australasian Port and Harbour Conference 25 R 28 September 2001 QueenslandAustralia
Lesser MP 2006 BenthicRpelagic coupling on coral reefs feeding and growth of Caribbean sponges Journal0 of0 Experimental0 Marine0 Biology0 amp0 Ecology 328 277R288
LopezRVictoriaM ZeaSampWei E2006 Competition for spacebetweenencrusting excavatingCaribbeanspongesandothercoral reeforganismsMarine0Ecology0 Progress0Series312113R121
MalcolmHASmithSDAampJordanA2009Usingpatternsofreeffishassemblages to refine a Habitat Classification System for marine parks in NSW Australia Aquatic0Conservation0Marine0and0Freshwater0Ecosystems2083R92
Massel SR amp Done TJ 1993 Effects of cyclone waves on massive coral assemblages on the Great Barrier Reef meteorology hydrodynamics and demographyCoral0Reefs12153R166
Mumby PJ amp Steneck RS 2008 Coral reef management and conservation in light of rapidly evolving ecological paradigms Trends in Ecology amp Evoution 23 555 -563
Murphy HM amp Jenkins GP 2010 Observational methods used in marine spatial monitoring of fishes and associated habitats a review Marine and Freshwater Research 61 236-252
Noriega R 2007 An Overview of Available Information on Sandy Beach Ecology Coastal Sand Dunes Rocky Reefs and Associated Biota on the Gold Coast Griffith Centre for Coastal Management Research Report No 85 report prepared for Griffith University
Parker P (1995) Structure to Reef Fish Assemblages at Julian Rocks Northern New South Wales Masters Thesis Griffith University
Parker PG 1999 Fish assemblages at Julian Rocks and the adjacent waters of northern New South Wales Australia Australian Zoologist 31 134 - 160
Pawlik JR Steindler L Henkel TP Beer S amp Ilan M 2007 Chemical warfare on coral reefs sponge metabolites differentially affect coral symbiosis in situ Limnology and Oceanography 52 907-911
Reef Check 2010 httpwwwreefcheckaustraliaorgdatahtml accessed December 2015
Robinson KI amp Pollard DA 1982 Marine and estuarine reserves in Australia with particular reference to New South Wales Wetlands 2 17 - 26
Rogers CS 1990 Responses of coral reefs and reef organisms to sedimentation Marine Ecology Progress Series 62 185-202
Russ GR 2003 Grazer biomass correlates more strongly with production than with biomass of algal turfs on a coral reef Coral Reefs 22 63-67
Rutzler K 2002 Impact of crustose clionid sponges on Caribbean reef corals Acta Geologica Hispanica 37 61-72
Scheffers SR Nieuwland G Bak RPM amp van Duyl FC 2004 Removal of bacteria and nutrient dynamics within the coral reef framework of Curacao (Netherlands Antilles) Coral Reefs 23 413-422
TRESBP Kirra Reef Marine Biota Monitoring 2015 59
frc environmental
Schlacher-Hoenlinger M Walker S Johnson J Schlacher T amp Hooper J 2009 Biological Monitoring of the Ex-HMAS Brisbane Artificial Reef Phase II - Habitat Values report prepared for Environmental Protection Agency (EPA)
Smith KA 2003 A simple multivariate technique to improve the design of a sampling strategy for age-based fishery monitoring Fisheries Research 64 79-85
Smith S Edwards R Dalton S amp Harrison M 2005 Biological assessment of fish and benthic communities at Palm Beach Bait Reef Gold Coast Queensland report prepared for University of New England
TRESBP 2014 Autum 2009 storms httpwwwtweedsandbypassnswgovauarticles-and-studiesinteresting-itemsautumn-2009-storm updated 4 May 2014 accessed December 2015
TRESBP 2015a Tweed Sand Bypassing Restoring Coastal Sand Drift Improving Boating Access ndash Techinical information httpwwwtweedsandbypassnswgovau__dataassetspdf_file0004552055kir ra-feb-2015pdf acessed December 2015
TRESBP 2015b Waves httpwwwtweedsandbypassnswgovauenvironmental-monitoringcoastal-conditionswaves updated 30 September 2015 accessed December 2015
Umar MJMLJ amp Price IR 1998 Effects of sediment deposition on the seaweed Sargassum on a fringing coral reef Coral Reefs 17 169-177
Underwood AJ amp Kennelly SJ 1990 Ecology of marine algae on rocky shores and subtidal reefs in temperate Australia Hydrobiologia 192 3-20
Walker S Schlacher T amp Schlacher-Hoenlinger M 2007 Spatial heterogeneity of epibenthos on artificial reefs fouling communities in the early stages of colonization on an East Australian shipwreck Marine Ecology 28 435-445
Walker SJ Degnan BM Hooper JNA amp Skilleter GA 2008 Will increased storm intensity from climate change affect biodiversity in non-scleractinian sessile fauna on coral reefs Global Change Biology 14 2755-2770
Warwick RM amp Clarke KR 1993 Increased variability as a symptom of stress in marine communtities Journal of Experimental Marine Biology and Ecology 172 215-216
Thenumberofsitessurveyedhasvariedover timeasaresultof the fluctuating levelof sandcoveringKirraReef
Prior to May 2003 three sites were assessed along the eastern and northern edge of KirraReef(KirraReefOutersites1to3)andthreesiteswereexaminedalongtheinshore marginof the reef (KirraReef Inner sites1 to 3)(MapA1) ReefRedge (ieKirraOuter) siteswerechosentoprovideearlywarningofimpactsfromoffshoreplacementofdredged sandwhilst inshoresites(ieKirraInner)werechosentoindicatewhetherimpactsfrom inshore beach profile development were affecting the reef platform In May 2003 the threeeasternsitesatKirraReef (ieKRO1KRO2andKRI1)werecompletelycovered with bare mobile sand Consequently only the three western sites at Kirra Reef (ie KRO3KRI2andKRI3)supportedbenthicfloraandfaunaInMarch2004theextentof the remainingwesternoutcropof KirraReef had been further reduced so that all inner reefsiteswerecompletelycoveredwithmobilesandConsequentlyonlyasingleoriginal reefsite(ieKRO3)couldbesurveyed(Figure23)Thereforetoprovideanindicationof the condition of the remaining reef two new sites were established (ie KRN1 and KRN2)(Figure23)andsurveyedinMarch2004Theextentofthewesternreefhadbeen further reduced by February 2005 and a third new site (ie KRN3) was established (Figure23)Consequentlyfoursites(KRO3KRN1KRN2andKRN3)weresurveyedin February2005
InFebruary2010fourKirraReefsites(ieKRO3KRO1KRN1andKRN2)wereclearof thesurroundingsandandsupportedbenthic floraand fauna Inaddition several rocks protruded from the sand in the vicinity of site KRI2H these were assessed to provide a quantitativeindicationofbroadRscaletemporalchangestotheinshorereefcommunities
SOURCEScopy Copyright Commonwealth of Australia (Geoscience Australia) 2001 2004 2006copy The State of Queensland (Department of Natural Resources and Mines) 2015copy Nearmap 2014 2015
DATE2015-09-09
DRAWN BYCF
VERSION02
PROJECTIONCoordinate System GDA 1994 MGA Zone 56Projection Transverse MercatorDatum GDA 1994
plusmn SCALE
0 50 100
Metres
Scale 12500 A3
frc environmental
Appendix$B$ Introduction$to$Data$Analysis$Used$
Multivariate$Analyses$
Multivariate statistical techniques are widely used in ecology to assess the similarities relationshipsbetweenassemblagesWhereasunivariateanalysescanonlycompareone variable at a time (eg an index of community structure such as a diversity index or a singleindicatorspecies)multivariateanalysescancomparesamplesbasedontheextent thatassemblagesshareparticulartaxaandabundances(ClarkeampWarwick2001)
Thefirststepofmultivariateanalysisusuallyinvolvesthecreationofamatrixofsimilarity coefficients computed between every pair of samples The coefficient is usually a measureofhowclose theabundance is foreachspecies (definedso that100= total similarity and 0=complete dissimilarity) The Bray Curtis similarity measure is commonlythemostappropriateforbiologicaldata(ClarkeampWarwick2001)
MultidimensionalScaling
NonRmetricmultiRdimensionalscalingordinations(nMDS)attempttoplacesamplesintwo dimensionalspacesothattherankorderofthedistancesbetweensamplesmatchesthe rankorderofthematchingsimilaritiesfromthesimilaritymatrix(ClarkeampWarwick2001) Thisprovidesavisualrepresentationofthesimilaritiesbetweenassemblageswithineach sampleEachoftheaxesisnotrelatedtoanyparticularvalueHinfactaxescanberotated toprovide thebestvisual representationof thedata Ordinationsareparticularlyuseful tools for analysing and visually presenting differences between assemblages Ordinationsareessentiallymapsofsamples inwhich theplacementofsampleson the mapreflectsthesimilarlyofthecommunitytothecommunitiesinothersamples(Clarkeamp Warwick 2001) Distances between samples on an ordination attempt to match the similarities inassemblagestructurenearbypoints representassemblageswithvery few attributes(speciesorabundanceofspecies)Hpoints faraparthavevery fewattributes in common(ClarkeampWarwick2001)
A stress coefficient is calculated to reflect the extent to which the multiRdimensional scalingordinationandthesimilaritymatrixagree(ClarkeampWarwick2001)(iehowwell the multiRdimensional scaling ordination accurately reflects the relationship between samples)Stressvaluesoflt015aregenerallyacceptable
In Figure A1 each freshwater macroinvertebrate sample is represented on the multiRdimensionalscalingordination By lookingat thedistancesbetweeneachsample
ANOSIMisanalogoustoANOVAinunivariatestatistics(Smith2003)AglobalRstatistic iscalculatedtodeterminewhetherthereisasignificantdifferencebetweenallsamplesIf there are differences then pairwise comparisons are conducted to test for differences betweenpairsofsamples(analogoustopostRhoctestsinANOVA)
The R value lies between R1 and +1 (all similarities within groups are less than any similarity between groups) with a value of zero representing the null hypothesis (no differenceamongasetofsamples)(ClarkeampWarwick2001)ComparisonofpairwiseR values can give an indication of how different assemblages are R values close to 0 indicatelittledifferencevaluesaround05indicatesomeoverlapandvaluescloseto1to indicate many or substantial differences In many instances however researches are primarily interestedinwhethertheRvalueisstatisticallydifferentfromzero(usuallyata confidence level of 005) (Clarke amp Warwick 2001) (ie whether they can reject the null hypothesis)
ANOSIM can provide information on whether the (visual) differences between assemblages in the multiRdimensional scaling ordination are significantH it is an independenttestfromthemultiRdimensionalscalingordinationItisbasedontestingthe
TRESBPKirraReefMarineBiotaMonitoring2015 B2
frc environmental
differences between the rank similarities in the similarity matrix not on the distances betweensamplesinthemultiRdimensionalscalingordination(ClarkeampWarwick2001)
PermutationalMultivariateAnalysisofVariance
PERMANOVAisusedtotestsimultaneousresponsesofoneormorevariablestooneor more factors in an a0 priori0 structured design using random permutation of the data to assess significance (Anderson 2004) PERMANOVA generates a pseudo FRstatistic similar to traditional ANOVA but pRvalues are calculated with permutations which does notassumenormaldatadistribution PERMANOVAcanprovide informationonwhether the (visual) differences between assemblages in a multiRdimensional scaling ordination are significantH however it is an independent test from the multiRdimensional scaling ordination
Thelevelofmultivariatedispersionamongsampleswithineachofthetestgroupscanbe examined using the permutational analysis of multivariate dispersions (PERMDISP) routine(Anderson2004)Intraditionalimpactassessmentachangeinthedispersionof datacanalsoindicateanimpact
SimilarityPercentagendashSpeciesContributions
SIMPER analysis provides information on how dissimilar assemblages from various groups are (eg how similar all of the macroinvertebrate samples taken for a particular habitatwithinastreamreachare)andhowsimilareachgroup(egreach)istoanyother group SIMPER analysis also identifies the species taxa that are contributing to the dissimilarity between two assemblages in rank order (ie it identifies which species is contributingthemosttothedifferences)SIMPERanalysismayhelptoidentifypotential lsquoindicatorrsquospeciesForexampleifaparticularspeciesconsistentlycontributesgreatlyto the differences between impacted and unimpacted assemblages it may be a useful indicator Theabundanceofthis indicatorspeciescanthenbecomparedbetweensites usingunivariatetechniquessuchasANOVA
Data is available on request from tresbpprojectofficecrownlandnswgov
TRESBPKirraReefMarineBiotaMonitoring2015 C1
frc environmental
Appendix(D( Pairwise( PERMANOVA( Results
Data is available on request from tresbpprojectofficecrownlandnswgov
TRESBPKirraReefMarineBiotaMonitoring2015 D1
frc environmental
Appendix(E( Relative(Abundance(of(Fish(found(at(Kirra(( ( and(Palm(Beach(Reefs(in(Each(Survey((Data is available on request from tresbpprojectofficecrownlandnswgovau
TRESBPKirraReefMarineBiotaMonitoring2015 E1
Structure Bookmarks
0 50 100 Metres Scale 12500 A3
0 50 100 200 Metres Scale 15000 A3
Kirra Reef
Kirra Reef
Kirra Reef
Kirra Reef
Kirra Reef
Kirra Reef
Map A1Location of Kirra Reef monitoring sites
Table D8 Pairwise comparison of macroalgae cover between sites in each year
Table D15 Pairwise comparison of turf algae cover between sites in each year
Table D29 Pairwise comparison of ascidian cover between sites in each year
Table D43 Pairwise comparison of soft coral cover between sites in each year
frc environmental
July 2012 Palm Beach April 2014 Palm Beach Reef Reef Kirra Reef Kirra Reef
Benthic assemblages at Kirra Reef appeared to show some overlap between surveys (Figure34H) HowevernearlyallsurveysweredifferentateachsiteatbothKirraReef andPalmBeachReef(AppendixD)BenthicassemblagesinMarch2015andApril2014 wereverysimilarcomparedtobenthicassemblages inthebaselinesurvey inApril1995 andMarch2015(notethegreateroverlapinFigure35comparedtoFigure36)
In March 2015 as in previous surveys the macroalgae Sargassum sp dominated the benthic assemblages at all sites at Kirra Reef (Figure 37) Other species present included
sdot Dictyopteris0arostichoides0
sdot Dilophus0intermedius00
sdot Zonariasp
sdot Laurencia0brongniartic0
sdot Amphiroa0anceps0
sdot Caulerpa0lentilliferaand
sdot Halimeda0discoideaand
sdot Macrocystissp
Juvenile kelp (from the genus Macrocystis) was also emerging on some areas of Kirra Reef
ThecoverofmacroalagevariedbetweensitesandsurveysatbothKirraReefandPalm Beach Reef with the magnitude of difference varying over time (note the significant interaction between site (location) x survey in Table 32) Macroalgae cover varied between surveys with 2001 being the most different to the other years (Appendix D) ThereweredifferencesbetweensitesatKirraReefinJune1995February1996January 2001 May 2003 February 2005 and February 2010 and between sites at Palm Beach ReefinJanuary2001andFebruary2010Inrecentsurveys(2012to2015)thecoverof macroalgaeatsitesatbothKirraReefandPalmBeachReefwassimilar (AppendixD) indicatingarelativelyconsistentdistributionacrossbothreefs
ThemeancoverofmacroalgaeatKirraReefhasdeclinedsinceitspeakin2001withthe greatest magnitude of decline recorded between January 2001 and May 2003 (Figure 38)InsurveysbetweenJune1995andMay2003Sargassumspformeddensecarpets overtherockysubstratecoveringupto58oftheavailablesurfaceareaofthereefIn February 2010 macroalgal cover was 12 Macroalgal cover has increased to 26 in March2015ThisissimilartothecoverrecordedinApril1995(23cover)(Figure38)
In2015nomacroalgaewasrecordedwithinthequadratsatPalmBeachReefThecover of macroalgae on Palm Beach Reef has been consistently lower than Kirra Reef since
TRESBPKirraReefMarineBiotaMonitoring2015 26
frc environmental
ecologicalmonitoringbegan typically lessthan5of theavailablesurfacearea(Figure 38)
The mean cover of turf algae varied between sites and surveys at both Kirra Reef and PalmBeachReef(notethesignificantinteractionbetweensite(location)xsurveyinTable 33)SpecificallythereweresignificantdifferencesbetweensitesatbothKirraReefand PalmBeachReefinJune1995January2001February2010July2012andApril2014 (aswellasbetweensitesinFebruary1996atKirraReef)Thecoverofturfalgaevaried betweenmostsurveysatallsitesateachreef(AppendixD)BothKirraandPalmBeach reefs showed major increases in the percent cover of turf algae from 2010 to 2012 followedbyadecreaseincoverbetween2012and2014(Figure310)Thecoverofturf algae is typically lower at Kirra Reef than at Palm Beach Reef (July 2012 being an exception) and was again slightly lower at Kirra Reef in March 2015 (Table 310) In March2015turfalgaewasmoreprevalentatKirraReefthanduringthebaselinesurvey ofApril1995
ThemeancoverofspongesatsomesitesatbothKirraReefandPalmBeachReefhas varied significantly during some surveys (note the significant interaction between site (location)xsurvey inTable34HFigure311) However thecoverofspongestendedto bemore temporallyvariable atKirraReef than at Palm Beach Reef (Figure312) The cover of sponges at Kirra Reef varied between sites in February 1996 January 2001 March2004July2012andApril2014 However thecoverofspongesatPalmBeach Reefonlyvariedbetweensites inJanuary2001andFebruary2010 (AppendixD) The cover of sponges varied between survey at each site with 1995 1996 and 2001 most differenttootheryears(AppendixD)
ThemeancoverofspongesatKirraReefdeclinedbetweenMarch2004(20cover)and February 2010 (less than 1 cover) Since 2010 the cover of sponges has increased slightly with sponges covering 8 of the reef in March 2015 (Figure 312) In March 2015thecoverofspongeswashigherthanrecordedduringthebaselinesurveyinApril 1995(3cover)(Figure312)
Figure312 Mean cover of sponges (plusmnSE) at Kirra Reef and Palm Beach Reef on all
surveys
Table34 Univariate PERMANOVA results for differences in the cover of sponges betweensurveysandlocations
Factor$ df$ MS$effect$ PseudoF$ p$(perm)$
survey 10 18576 276 0018
location 1 39671 589 0210
site(location) 4 67354 477 0001
locationxsurvey 10 1490 221 0032
site(location)xsurvey 40 67331 477 0001
error 924 14108
Shadingdenotessignificanceatplt005
TRESBPKirraReefMarineBiotaMonitoring2015 32
frc environmental
Ascidians$
ThemeanabundanceofallascidiansotherthanPyura0stoloniferahasvariedsignifcantly between sites at Kirra Reef and Palm Beach Reef and between surveys at each site (Figure314andnotethesignificantinteractionbetweensite(location)xsurveyinTable 35) The abundance of ascidians was different between sites at Kirra Reef in January 2001May2003March2004February2005andApril2014HanddifferentatPalmBeach ReefinJanuary2001February2005February2010andMarch2015Theabundance ofascidiansvariedbetweensurveysateachsitewith1995beingmostdifferentwhenthe abundanceofascidianswaslow(AppendixD)InMarch2015theabundanceofallother ascidiansonKirraReefandPalmBeachReefwashigherthanpreviouslyreportedinthe baselinesurveyinApril1995(whennoascidianswererecorded)Themeanabundance washigheratKirraReefthanatPalmBeachReef(Figure314)
ThemeanabundanceofPyura0stoloniferahasvariedconsiderablybetweensitesatKirra Reef and Palm Beach Reef over time (note the significant interaction between site (location) x survey in Table 36) In March 2015 the mean abundance (individual per 025m2plusmnSE)of theascidianPstolonifera (Figure313)wassimilaratKirraReefand PalmBeachReef(Figure315)ThemeanabundanceofP0stoloniferahasrangedfrom 02to17individualsper025m2atbothreefssinceMay2003
Figure315 Mean abundance of ascidians (Pyura0 stolonifera) (individuals025m2)
(plusmnSE)atKirraReefandPalmBeachReefinallsurveys
TRESBPKirraReefMarineBiotaMonitoring2015 34
frc environmental
Table35 Univariate PERMANOVA results for the differences in cover of all ascidians otherthanPyura0stolonifera0betweensurveysandlocations
Factor$ df$ MS$effect$ PseudoF$ p$(perm)$
survey 10 26658 474 0001
location 1 13603 710 0104
site(location) 4 19154 149 0212
locationxsurvey 10 2629 468 0001
site(location)xsurvey 40 5621 438 0001
error 924 12828
Shadingdenotessignificanceatplt005
Table36 Univariate PERMANOVA results for the differences in Pyura0 stolonifera densitybetweensurveysandlocations
Factor$ df$ MS$effect$ PseudoF$ p$(perm)$
survey 10 16254 11842 0001
location 1 12445 60881 0206
site(location) 4 20442 56799 0001
locationxsurvey 10 79724 58082 0001
site (location) x 40 13726 38138 0001 survey
error 924 35991
Shadingdenotessignificanceatplt005
$
TRESBPKirraReefMarineBiotaMonitoring2015 35
frc environmental
Hard$Coral$
There was a significant difference between the cover of hard corals at Kirra Reef and PalmBeachReefduringsomesurveys(notethesignificantinteractionbetweenlocationx surveyinTable37)SpecificallytherewassignificantlymorehardcoralatPalmBeach Reef thanKirraReef inFebraury1996March2004April2014andMarch2015(Table 38)
ThecoverofhardcoralistypicallylowonKirraReefaccountingforlessthan2ofthe availablesubstrateInMarch2015hardcoralcoveredlessthan1oftheareaofKirra Reef which was less than the cover recorded during the baseline survey in April 1995 (Figure 316) In contrast hard coral covered 11 of the surface area at Palm Beach ReefwhichwasgreaterthanthecoverrecordedinApril1995(Figure316)
The cover of hard corals at Palm Beach Reef has been more variable over time comparedtothecoverofhardcoralatKirraReef(Figure316)Withtheexceptionofthe surveys inApril1995andJanuary2001when thecoverofhardcoralwas lowonboth reefshardcoralsaretypicallymoreprevalentatPalmBeachReef(Figure316)
Table38 PERMANOVA post hoc pairwise results for the differences in the cover of hardcoralbetweenlocationsineachsurveyevent
Hard$Corals$ Survey$
t$ p$(MC)$a$
Apr1995 054 0606
Jun1995 182 0140
Feb1996 541 0006
Jan2001 R R
May2003 166 0168
Mar2004 765 0001
Feb2005 049 0646
Feb2010 156 0197
Jul2012 283 0053
Apr2014 525 0011
Mar2015 695 0003 Shadingdenotessignificanceatplt005 a pvaluesbasedonMonteCarlotests
TRESBPKirraReefMarineBiotaMonitoring2015 37
60
50
40
30
20
10
0
Soft
Cor
al C
over
()
Kirra Reef Palm Beach Reef
frc environmental
Soft$Coral$
The cover of soft coral was significantly different between sites at both Kirra Reef and PalmBeachReefandduringsomesurveys(notethesignificant interactionbetweensite (location)xsurvey)TherewasnosoftcoralrecordedatKirraReefinMarch2015The coverofsoftcoralhasdeclinedatKirraReefsince2003andhascoveredlessthan2of theavailablesubstratesince2005whichissimilartothecoverofsoftcoraldescribedfor the baseline surveys in 1995 (Figure 317) The cover of soft coral was consistent betweensitesineachsurveyexceptbetweensitesin
sdot April1995atKirraReef
sdot 1996atKirraReef
sdot 2003atPalmBeachReefand
sdot 2014atPalmBeachReef(AppendixD)
Soft corals have historically covered more of the available space on Palm Beach Reef than on Kirra Reef However there was more temporal variability within sites at Palm BeachReefthanatKirraReef(AppendixD)ThecoverofsoftcoralatPalmBeachReef has varied over time and was highest in April 1995 (48 cover) Despite increasing sinceFebruary2005itisstilllowerthanthecoverrecordedduringthebaselinesurveyin April1995(Figure317)
Table39 UnivariatePERMANOVAresults for thedifferences in thecoverofsoft coral betweensurveysandlocations
Factor$ df$ MS$effect$ PseudoF$ p$(perm)$
survey 10 44657 1323 0001
location 1 32922 6620 0117
site(location) 4 49732 266 0036
locationxsurvey 10 40982 1214 0001
site (location) x 40 3376 181 0002 survey
error 924 18688
Shadingdenotessignificanceatplt005
$
TRESBPKirraReefMarineBiotaMonitoring2015 39
frc environmental
Crinoids$
ThereisasignificantdifferencebetweensomesitesatbothKirraReefandParmBeach Reef that varies through time (note the significant interaction between site (location) x survey inTable310) Theabundanceofcrinoidshasbeensimilarbetweensites inall years at Palm Beach ReefH and was different beween sites at Kirra Reef in June 1995 February1996May2003andFebruary2005(AppendixD)Withineachsitetherehas been some natural temporal variability particualrly at Palm Beach Reef sites in 2001 (Appendix D) The mean abundance (individuals 025m2) of crinoids (Figure 318) at KirraReefandPalmBeachReefhasgenerallybeenlessthan2individualsper025m2 andhasdeclinedatboth locationssincethebaselinesurvey inApril1995(Figure319) However the mean abundance of crinoids on Kirra Reef has shown a slight increase sinceFebruary2010(Figure319)
In March 2015 fewer crinoids were recorded at Palm Beach Reef than at Kirra ReefH crinoidshavebeenrareatPalmBeachReefsince2003
The species richness of fish recorded from Kirra Reef across all monitoring events has rangedfrom14to57 InMarch201557specieswereidentifiedat thereefwhichwas similar to April 2014 (53) and higher than previous surveys (Figure 320) Species richnessatPalmBeachReefwas lower(34species)andgenerallyvaried lessbetween surveyscomparedtoKirraReef
InMarch2015 the assemblage of fish at KirraReef comprised species fromall trophic levelsincludingdetritivoresplanktivoresherbivoresandcarnivores(AppendixE)Asin previous surveys the assemblage was dominated by herbivores and planktivores Yellowtail (Trachurus0 novaezelandiae) and striped sea pike (Sphyraena0 obtusata) were the dominant species present in large schools (Figure 321) Australian mado (Atypichthys0 strigatus) ringRtailed surgeon (Acanthurus0 blochii) silver trevally (Pseudocaranx0 georgianus) eastern pomfred (Schuettea0 scalaripinnis) sweep (Scorpis0 lineolatus) and various wrasses were also very abundant releative to other species (AppendixE)
Two new species were observed at Kirra Reef the orangeRband surgeon (Acanthurus0 olivaceus) and the unicornfish (Naso0 sp) Five new species were recorded at Palm BeachReef
No threatened or protected fish species listed under the Queenslandrsquos Nature0 Conservation0Act01992ornationallyundertheEnvironmental0Protection0and0Biodiversity0 Conservation0 Act0 1999 were observed The complete list of species recorded and the relativeabundanceispresentedinAppendixE
TRESBPKirraReefMarineBiotaMonitoring2015 42
60
0
10
20
30
40
50
Num
ber
of F
ish
Spe
cies
Apr-95
Jun-95
Feb-96
Jan-01
May-03
Mar-04
Feb-05
Feb-10
Jul-12
Apr-14
Mar-15
Kirra Reef Palm Beach Reef Location
frc environmental
Figure320 Number of fish species recorded at Kirra Reef and Palm Beach Reef on
ThegreatestchangetotheecologicalconditionofKirraReefsincethebaselinesurveyin 1995 has been the loss of large areas of hard substrate that support benthic flora and faunaThedeliveryoflargesandvolumesduringthestage1dredgingoperations(1995 to1998)andtheinitialoperationofthesandbypasssystem(2001to2008)resultedinan increaseinwaveactionandtidalcurrentsredistributingthissandoverKirraReef
The three major outcrops of Kirra Reef (northern southern and eastern sections) are naturally exposed and covered depending on water and sand movements In March 2015 the rocky outcrops in the northern section of Kirra Reef were exposed and supportedamoderatelydiversebenthicassemblagedominatedbyturfalgaeTherewas arelativelyhighfishdiversityatKirraReefTheecologicalassemblageexhibitedsignsof ongoingstressfromphysicaldisturbanceincludingtheabsenceofsoftcoralsandrarityof hardcoral(MumbyampSteneck2008)HoweverKirraReefhasarelativelyhighcoverof sponges and ascidians Sponges ascidians and crinoids were more abundant at Kirra ReefthanatPalmBeachReefinMarch2015
KirraReefcontinues toprovidehabitatandsupport importantecological functions in the region providing hard substrate for the colonisation of algae and benthic invertebrates and food and refuge for fish As sand levels have stabilised since 2008 assemblages have becomemoresimilar to those recordedprior to implementationof the TRESBP in April1995 Forexamplemacroalgalcover inApril1995andMarch2015wasrelatively similarHoweverassemblagecompositionisstillsignificantlydifferenttothatrecordedin thebaselinesurveysmostnoticeablyduetoa lowercoverofbaresubstrateandhigher coverofturfalgaeandascidianssincesurveyshavebeenperformed
Benthic$Macroalgae$
The cover of macroalgae at Kirra Reef was relatively similar during the 2014 and 2015 surveys and remained well below the peak of nearly 60 cover recorded in January 2001TherewasasteepdeclineinthecoverofmacroalgaebetweenJanuary2001and May2003whichappearedtobestronglyassociatedwith thedecline inreefareaduring that time as well as a decline in the cover of Sargassum sp (an important indicator speciesonKirraReef) SimilardeclineswereevidentatPalmBeachReefbetween the January2001andMay2003surveys
TRESBPKirraReefMarineBiotaMonitoring2015 45
frc environmental
The cover ofmacroalgae at Palm Beach Reef was much lower thanat Kirra Reef over time There are several possible reasons for the lower cover of macroalgae at Palm Beach
sdot PalmBeachReefisdeeperthanKirraReefandgenerallyhashigherturbidityand therefore greater light attenuation The quantity and quality of available light affectsthedistributionandgrowthofmacroalgae(MillerampEtter2008)
sdot Differences in the pattern of recruitment of algal species to the reefs due to differentwatercurrentsandtimingofthesurveys(Kennelly1987b)
sdot Increased competition with turf algae and sessile benthic invertebrates which competeforspacewithmacroalgae(Kennelly1987aHMillerampEtter2008)
sdot PresenceofdifferentspeciesandhigherdensityofherbivoresatPalmBeachReef (particularly sea urchins and herbivorous fish) which graze on macroalgae (McCook1997HJompaampMcCook2002)
Biological assemblages exposed to physical stress typically exhibit greater levels of temporalandspatialvariability(WarwickampClarke1993HChapmanetal1995)Temporal variationinthecoverofmacroalgaeatKirraReefislikelytobeprincipallyduetotheeffect ofphysicaldisturbance fromwaveactionaswellas theassociatedassociatedabrasion andsmotheringbysandTheeffectsofthesephysicaldisturbanceswouldincreasewith thereductionofKirraReefasedgeeffectsarepronouncedandwaterdepth isreduced Increasedsmotheringbysandcanalsoreducediversity(Hatcheretal1989)abundance recruitment growth survival and seasonal regeneration of macroalgae (Umar amp Price 1998HCheshireetal1999)
Changes in the cover of macroalgae on Kirra Reef over time are also likely due to the extentofthereefchangingHthefishandmobileinvertbratesassociatedwiththereefmay have concentrated which would in turn increase grazing pressure Increased grazing pressure from fish and mobile invertebrates can reduce the coverage and diversity of macroalgaeonreefs(McCook1997HJompaampMcCook2002)
Thecoverof turfalgaeatbothKirraReefandPalmBeachReefhasvariedsignificantly betweensurveysPriorto2005turfalgaetypicallycoveredlessoftheavailablesurface areaonKirraReefthanPalmBeachReefInMarch2015themeancoverofturfalgae hasincreasedsincebaselinesurveysin1995andwasrelativelysimilarbetweenreefs(40 plusmn4atKirraReefcomparedto48plusmn4atPalmBeachReef)Thecoverofturfalgaeat Kirra Reef was similar in 2014 and 2015 which was generally higher than previous surveysexceptduringJuly2012whencoverofturfalgaepeakedat67plusmn4
TRESBPKirraReefMarineBiotaMonitoring2015 46
frc environmental
Turfalgaearebecomingadominantcomponentofcommunitiesaroundtheworld likely the result of rapid colonisation of openspace after a disturbance (eg storms) nutrient enrichment andor changes in grazing pressures Turf algae can also reflect a more physically robust growth form suited to high wave energy environments (than foliose macroRalgae)TurfalgaepeakedintheJuly2012surveylikelyrelatedtotheincreasein bare reef exposure following a stormy conditions in early 2009 and between December 2011 and June 2012 Turf algae have been the dominant form of algae on Kirra Reef sincethistimealbeitthecoverlowerthanthe2012survey
Increased cover of turf algae is typically related to good light conditions high concentrationsofnutrientsandlownumbersofgrazerssuchasfish(orconstantgrazing pressure preventing macroalgae colonisation) However the relationship between algal dynamics physical disturbance water quality and herbivore grazing activity is complex andthecoverof turfalgaecanexhibitextremetemporalvariabilityasaconsequenceof the interactionbetween topRdownandbottomRupprocesses (Russ2003HBellwoodetal 2006H Hughes et al 2007H Albert et al 2008H Hoey amp Bellwood 2008H Mumby 2009) Furtherinvestigationwouldberequiredtoreliablydeterminethemechanismsofchangein bothmacroalgaeandturfalgaeassemblagesonthesereefs
Benthic$Macroinvertebrates$
AtKirraReeftheburialandreRemergenceofrockyoutcrops(influencedbytheTRESBP) islikelytohaveincreasedtemporalvariabilityinthedistributionandabundanceofbenthic macroinvertebrates Additional perturbations such as wave action and sand abrasion (each influenced through changes in bathymetry seabed topography and water depth) are likely to have resulted in the decline in cover and diversity of the benthic macroinvertebratesatKirraReefbetweensurveysparticularlybetweenMarch2004and February2005andduringtheseverestormsof2009Benthicmacroinvertebratessuch asascidiansspongeshardcoralandsoftcoralarehighlysusceptible to theeffectsof stormandwavedisturbancephysicalabrasionandburialbysand(KayampKeough1981H Walker et al 2008) which can affect settlement growth rate and survival (Dodge amp Vaisnys1977HRogers1990)
Physical disturbance from sand burial sand abrasion and the action of storm waves appeartokeepthebenthicassemblagesofKirraReefinastateofearlysuccessionItis commonforearlypioneerspeciessuchassomemacroalgaetorecruitrapidlytoahard surface in large numbers allowing these species to dominate assemblages early in the successionaltrajectory(Walkeretal2007)
Afurther indicatorof theearlystateofsuccessionatKirraReef isthatthecoverofhard and soft coral has remained very low (generally lt 5) In March 2015 less than 1
Benthic macroinvertebrate cover may also be affected indirectly through increased competitionwithmacroalgaeforspaceThepresenceoflargemacroalgaecanaffectthe recruitment and survival of sessile benthic invertebrates as fronds moving with wave action sweep and abrade the surface of rocks killing new recruits especially corals (Kennelly1989HMcCooketal2001)Itcantakeseveralyearsforhardandsoftcoralto become dominant on reefs in the SEQ region (SchlacherRHoenlinger et al 2009) Therefore hard coral is not expected to become abundant until several years after the reefhasbeenuncoveredandonlyifthephysicaldisturbanceregimeandsupplyofnew recruitsissufficienttosupportsurvivalandgenerationalsuccessionofthesespeciesThe coverofhardandsoftcoralsatKirraReefwerebothverylowandpatchypriortothestart oftheTRESBP
Sponges and ascidians are highly susceptible to smothering and sand abrasion unless theyhaveathicktunic(outercoveringmadeofkeratin)liketheascidianP0stolonifera0or strong internal keratin silicon or calcareous structures in the case of some species of sponges0(KayampKeough1981HMcGuinness1987HWalkeretal2008)Duetoincreased wave action and sedimentation (which can be influenced by the TRESBP) the mean coverofascidiansandspongeswasexpectedtobemuchloweronKirraReefthanPalm Beach Reef However in March 2015 the cover of sponges was similar between the reefsandthecoverofascidians(otherthanP0stolonifera)wasgreateratKirraReefthan at Palm Beach Reef This suggests that Kirra Reef is slowly recovering from the increasedstressofphysicaldisturbancesuchas increasedwaveactionandsandscour andorthatwaveandstormconditionshavebeenlesssevereinthepastfewyears
Fish$
KirraReefcontinuestosupportahighdiversityofreefRassociatedandpelagic(ienonR reefassociated) fishspecies Despite itsdiminishedsizecompared to1995KirraReef continuestoprovidevaluablehabitatforanumberoffishspeciesfromdifferentfunctional groups
ThereisahighdegreeofinterRannualvariabilityinthespeciesandabundanceofthefish present at Kirra Reef compared with the assemblage at Palm Beach Reef This likely reflectsthetemporalvariabilityintheavailablehabitatasaconsequenceofreefburialand reRemergenceThediversityqualityandarealextentofreefhabitatareimportantfactors influencing the distribution abundance biomass and diversity of reef fish (Bellwood amp Hughes2001HFriedlanderetal2003)Diversityandabundanceoffishcanincreasewith
TRESBPKirraReefMarineBiotaMonitoring2015 48
frc environmental
greaterstructuralcomplexityandincreasedheterogeneityofavailablehabitats(Bellwood ampHughes2001)Thissuggeststhatperiodsofreefburialreducetheoveralldiversityof reefRassociated fish species at Kirra Reef Despite the reduction in overall reef space therewasalargervarietyofhabitats(suchasmarcoalgaeandturfalgae)in2015which was likely to be related to the high diversity of fish assemblages This is particularly importantforseveralspeciesthatdependonthepresenceoflsquostructurersquosuchasprovided by reef habitat (ie oldwife moray eels damselfish and Australian mado that were recordedinMarch2015butwerenotrecordedinJuly2012)
Theabundanceanddiversityof fishare likelytobenegativelyaffectedfollowingperiods of severe weather which create unfavourable conditions for many species and may further exacerbate the affects of abrasion and sedimentation The biomass of fish is knowntodecreasewithincreasingexposuretophysicaldisturbancefromwaveactionand strong currents (Friedlander et al 2003) As our surveys have been undertaken at different times of the year variation in the prevailing conditions at the time of sampling could also influence the types of fish observed (and the amount of reef habitat that is availableatanytime)Manyofthespeciesmayalsobeaffectedbyseasonalchangesin the water temperature such as damselfish which are less abundant in cool waters However theoveralldiversityof the fishassemblageatKirraReef is likely toreflect the sizeoftheoutcropsexposedwithagreaterphysicaldisturbance(fromseaconditionsand sandmovement)andcompetitionHandlesserfoodavailablewhenthereefiscovered
ThepredictedimpactstoKirraReefasaresultoftheTRESBPincludedaccretionofsand around the base of the rock outcrops causing a reduction in extent of reef It was predictedthatsanddeliveryaspartoftheprojectwouldeventuallymimiclsquonaturalrsquopatterns ofsanddispersalandthatthereefwouldreturntoitsnaturalextent(ietheextentpriorto extension of the Tweed River training walls in 1962) The benthic flora and fauna assemblages of the reef the historical reef extent and natural sand transport patterns wereexpectedtoreturntoconditionsobservedbeforetheextensionofthetrainingwalls between 1962 and 1965 However the Environmental Impact Study did not predict the ecologicalconsequencesofboththereducedarealextentandincreasedwaveenergy(a consequenceofdecreaseddepth)thathavebeenrecorded
ThecurrentextentofKirraReef remains less than50of that recorded in1962and in 1995beforethesanddeliverybytheTRESBPcommencedHowevertheextentofreef in1995 wasstrongly influenced by adepletion in sand following the construction of the Tweed River training walls and the Kirra Point groyne Accumulation of sand on Kirra ReefwasobservedtoincreaseasaresultofindirectsandnourishmentbytheTRESBP and the reef has been extensively covered (particuarly between 2005 and 2010) as a result
Whiletheextentofthereefcontinuestochangeovertimethedeliveryofsandaspartof the project now more closely matches the natural rate of longshore sand transport ShortRtermandseasonalchangesintheextentofthereefarenowlikelytobetheresultof waveandcurrentaction(particularlyduringservereweatherevents)thanadirectimpact of the TRESBP Therefore the extent of Kirra Reef in March 2015 is broadly in accordancewithpredictionsmadeintheEISwhichpredictedthatthereefwouldreturnto a condition similar to that exhibited in the preR1960rsquos ie before the extension of the TweedRiverbreakwatersthatinterruptedlittoralsandsupplytothesebeaches
InDecember2013KirraPointgroynewasextendedby30mwiththeexpectationthatthe beach bar would move seaward as a consequence At present Kirra Point groyne is unlikelytohavehadamajorimpactonthearealextentofKirraReefHoweverongoing monitoringbasedonaerialphotographsmayprovidefurtherinsight
Sessile benthic assemblages on Kirra Reef are highly susceptible to the influence of storms and associated wave action (Kay amp Keough 1981H Walker et al 2008) The shallowreefissurroundedbymobilesandwhichcanshiftnaturallyinresponsetowave action during storms causing burial of large sections of Kirra Reef This effect has reduced the availability of rocky substrate for colonisation and the availability of refuge
Fromanexaminationof theextentofKirraReef fromarealmapsandwaveheightdata thereappears tobea relationshipbetween theareaof rockexposedandstormevents Notably in a series of storm events in May 2009 corresponds with large areas of rock becoming exposed (with the reef approximately 100m2 in 2006 and approximately in 1009m2 2009) Further a stormy conditions between December 2011 and July 2012 correspondstotheareaofexposedrockmorethandoublinginsizeWhiletherewasno changetothetotalareaofexposedrockfollowingstormyconditionsinearly2013there wasaclearchangeinthedistibutionofexposedrockduringthistimeSince2013storm conditions have been calm to moderate and there has been little change in the areal extentanddistrubtionofexposedrockatKirraReef
WaveheighttypicallyincreasesduringstormeventsandgiventheshallowdepthofKirra Reef waves are more likely to shoal and break across the reef during storms This increases thephysicaldisturbanceabrasionandsedimentationofbenthicassemblages onKirraReefStormdisturbancecancauselocalreductionsinthespeciesrichnessand abundanceofcoral(Woodleyetal1981HMasselampDone1993HHughes1994HConnellet al 1997) and can alter fish assemblages indirectly through habitat modifications (Kaufman1983HJonesampSyms1998)ordirectlybyincreasingfishmortality(Lassig1983) The hydrodynamic forces produced by wave action are an important source of disturbance in subtidal habitats inflicting damage through direct physical impact and abrasion(UnderwoodampKennelly1990)DirectimpactsfromphysicaldisturbanceatKirra Reefareevidentduringsurveyeventswhenlargefragmentsofmacroalgaearepresentin thewatercolumnoverthereef
Storm and wave action (and associated sedimentation and abrasion) continue to be importantforcesshapingthedistributionandabundanceofbenthicspeciesatKirraReef Increased magnitude and frequency of physical disturbance resulting from increased exposureorsusceptibility tostormsandassociatedwaveaction (asonKirraReef)can lead to a decrease in the diversity of sessile invertebrate assemblages DisturbanceR drivenreductionsinbiodiversityhavethepotentialtoimpactnegativelyonthehealthand productivity of reef ecosystems (Walker et al 2008) Biodiversity is important to reef health given that many of these species (eg sponges bryozoans and ascidians) contribute a range of vital ecosystem services to reefs including nutrient cycling (Scheffers et al 2004) trophic interactions and food webs (Lesser 2006H Pawlik et al 2007) bioRerosion (Rutzler 2002H LopezRVictoria et al 2006) and stabilizing substrata (DiazampRutzler2001HWulff2001)
Theimpactsof increasedwaveactionandsedimentationonthebenthicassemblagesat Kirra Reef are likely to be greatest during and immediately following storm conditions
TRESBPKirraReefMarineBiotaMonitoring2015 51
frc environmental
Partitioningtheinfluenceofstormandwavedrivendisturbancefromthatoftheoperation oftheTRESBPwouldrequireamuchmorestatisticallypowerfulandtemporilyreplicated experimental design Given there is a large collection of wave and storm data by TRESBP this would involve greater temporal sampling of Kirra Reef including event samplingfollowingseverewaveandstormactivity
The data generated by this Kirra Reef biota monitoring program doesnrsquot support statistically rigorous consideration of seasonality (monitoring has been at its most frequentannual)
InApril2014andMarch2015KirraReefcoveredlessthan50ofthereefrsquosextentprior to theoperationof theTRESBP The lossof reefhabitathasreducedtheavailabilityof hard substratum available for colonisation and consequently the abundance of benthic sessileassemblages
The reduced depth of water resulting from the accumulation of sand exacerbates the effects of storms and wave action It is likley that as a consequnece the biological communities of Kirra Reef will reflect earlyRstage succession more frequently and for longerperiods
While there is sufficient structure available frcenvironmentalexpect that Kirra Reef will continuetoprovideimportanthabitatforadiverseassemblageoffishes
TRESBPKirraReefMarineBiotaMonitoring2015 52
frc environmental
5$ Conclusions$
Although there is still a substantial portion of the reef covered compared to before the extension of the Tweed River entrance breakwaters the current extent of Kirra Reef is broadly inaccordancewithpredictionsmadein theEIS Initial lsquocatchRuprsquobypassingand dredgeplacementofsand(between2001and2008)resulted in theburialofKirraReef Subsequentsanddelivery(since2008onwards)morecloselyreflectsnaturalpatternsof longRshoresandtransportandisthereefhasslowlyreRemerged
Theextentofthereefhasbeenrelativelystablesince2013Thishasallowedforsome succession in the benthic assemblages including a relatively high cover of sponges ascidiansandcrinoidsWiththedeliveryofsandmorecloselymatchingthenaturalrateit isexpected the reef willundergoshortRtermchanges in extentdue toseasonal shifts in sand deliveryH however the diversity of benthic assemblages on Kirra Reef is likely to increaseovertimeThiswouldcreatemorespaceforspeciestorecruitandreducesthe influence of sand abrasion and wave damage It was predicted that the areas of Kirra Reef newly exposed in 2012 would undergo a shift from turfRdominated communities to more diverse communities that could include macroalgae sponges ascidians and potentiallyhardandsoftcoralWiththeexceptionofhardandsoftcoralsthisprediction wasconfirmedbytheresultsoftheApril2014andMarch2015surveys
ThediversityoffishesassociatedwithKirraReefisbroadlysimilartothatrecordedprior tothecommencementofsandbypassingin1995Giventhatfisharemobilethegreatest impacts on fish assemblages are likely to be shortRterm changes due to both the prevailingconditionsandchangestheextentofavailablehabitatthatprovidesshelterand foodforavarietyofdifferentspeciesIfKirraReefincreasesinsizethereislikelytobea greater proportion of cryptic benthic species as these species are more typical of assemblagesinalaterstageofsuccession(eg(WillisampAnderson2003))
Assuming a broadly stable delivery rate of sand and consequent stable extent of Kirra ReeflsquorecoveryrsquoislikleytobesubstantivelycompleteFloralandfaunalcommunitieswill undergo succession between severe storm events but are likley to remain relatively dynamic
Albert S Udy J amp Tibbetts I 2008 Responses of algal communities to gradients in herbivorebiomassandwaterqualityinMarovoLagoonSolomonIslandsCoral0 Reefs2773R82
Anderson MJ 2001 A new method for nonRparametric multivariate analysis of varianceAustral0Ecology2632R46
Anderson MJ 2004 PERMDISP0 a0 FORTRAN0 computer0 program0 for0 permutatinoal0 analysis0 of0 multivariate0 dispersions0 (for0 any0 twoSfactor0 ANOVA0 design)0 using0 permutational0 tests Department of Statistics University of Auckland New Zealand
Cannon LR Goeden GB amp Campbell P 1987 Community patterns revealed by trawling in the interRreef regions of the Great Barrier Reef Memoirs0 of0 the0 Queensland0Museum2545R70
Chapman MG Underwood AJ amp Skilleter GA 1995 Variability at different spatial scalesbetweenasubtidalassemblageexposedtothedischargeofsewageand two control assemblages Journal0 of0 Experimental0 Biology0 and0 Ecology 189 103R122
Cheshire AC Miller DJ amp Stewart R (1999) Effect0 of0 dispersed0 sediment0 plumes0 from0beach0sand0replenishment0dredging0on0recruitment0of0phaeophycean0algae0 to0rocky0reefs0in0Gulf0St0Vincent0South0Australia0The0Impact0of0Sand0Dredging0 on0 Benthic0 Community0 Structure0 at0 the0 Port0 Stanvac0 Dredge0 Site0 20 1S39 UniversityofAdelaideAdelaide
ConnellJHHughesTPampWallaceCC1997A30Ryearstudyofcoralabundance recruitment and disturbance at several scales in space and time Ecological0 Monographs67461R488
Diaz MC amp Rutzler K 2001 Sponges an essential component of Caribbean coral reefsBulletin0of0Marine0Science69535R546
DodgeREampVaisnysJR1977Coralpopulationsandgrowthpatternsresponsesto sedimentation and turbidity associated with dredging Journal0 of0 Marine0 Research35715R730
Done TJ 1982 Patterns in the distribution of coral communities across the central GreatBarrierReefCoral0Reefs195R107
Edwards RA amp Smith DA 2005 Subtidal assemblages associated with a geotextile reef insouthReastQueenslandAustraliaMarine0and0Freshwater0Research56 133R142
FisheriesResearchConsultants1991Survey0of0the0Intertidal0and0Subtidal0Rocky0Reefs0 of0 the0 Sunshine0 Coast report prepared for Queensland National Parks and WildlifeService
HarrisonPHarriotVBanksSampHolmesN1998ThecoralcommunitiesofFlinders Reef andMyora Reef in theMoretonBay MarineParkQueensland Australia In Moreton0 Bay0 and0 Catchment Tibbits I Hall N amp Dennison W (Eds) SchoolofMarineScienceUniversityofQueenslandStLuciapp525R536
Hatcher B Johannes R amp Robertson A 1989 Review of research relevant to the conservationofshallowtropicalmarineecosystemsOceanography0and0Marine0 Biology0an0Annual0Review27337R414
Hoey A amp Bellwood D 2008 CrossRshelf variation in the role of parrotfishes on the GreatBarrierReefCoral0Reefs37R47
TRESBPKirraReefMarineBiotaMonitoring2015 56
frc environmental
Hollingsworth P 1975 Environmental Investigation Report Crown Reserve R R68 Currumbin Creek City of the Gold Coast Land Administration Commission unpublishedreport
Hughes TP 1994 Catastrophes phase shifts and large scale degradation of a CaribbeancoralreefScience2651547R1551
Hughes TP Rodrigues MJ Bellwood DR Ceccarelli D HoeghRGuldberg O McCook L Moltschaniwskvi N Pratchett MS Steneck RS amp Willis B 2007Phaseshiftsherbivoryandtheresilienceofcoralreefstoclimatechange Current0Biology17360R365
Hutchinson A Rempel C Taveras V Loder J amp Salmond J 2013 Reef0 Check0 Australia0 South0 East0 Queensland0 Summary0 Report0 2013 report prepared for ReefCheckFoundationLimited
Hyder Consulting 1997 Tweed0 River0 Entrance0 Sand0 Bypassing0 Project0 Permanent0 Bypassing0 System0 0 Environmental0 Impact0 Statement0 0 Impact0 Assessment0 Study report prepared for New South Wales Department of Land and Water Conservation
Jompa J amp McCook LJ 2002 Effects of competition and herbivory on interactions betweenahardcoralandabrownalgaJournal0of0Experimental0Marine0Biology0 and0Ecology27125R39
KayAMampKeoughMJ1981Occupationofpatchesintheepifaunalcommunitieson pier pilings and the bivalve Pinna bicolor at Edithburgh South Australia Oecologia48123R130
KennellyS1987aInhibitionofkelprecruitmentbyturfingalgaeandconsequencesfor an Australian kelp community Journal0 of0 Experimental0 Marine0 Biology0 and0 Ecology11249R60
Kennelly S 1987b Physical disturbances in an Australian kelp community I temporal effectsMarine0Ecology0Progress0Series40145R153
TRESBPKirraReefMarineBiotaMonitoring2015 57
frc environmental
Kennelly S 1989 Effects of kelp canopies on understory species due to shade and scourMarine0Ecology0Progress0Series50215R224
Lassig BR 1983 The effects of a cyclonic storm on coral reef fish assemblages Environmental0Biology0of0Fishes955R63
Lawson S McMahon J amp Boswood P 2001 Environmental management of the construction and operation of a sand bypassing system at the Tweed River EntranceInThe15thAustralasianCoastalandOceanEngineeringConference the 8th Australasian Port and Harbour Conference 25 R 28 September 2001 QueenslandAustralia
Lesser MP 2006 BenthicRpelagic coupling on coral reefs feeding and growth of Caribbean sponges Journal0 of0 Experimental0 Marine0 Biology0 amp0 Ecology 328 277R288
LopezRVictoriaM ZeaSampWei E2006 Competition for spacebetweenencrusting excavatingCaribbeanspongesandothercoral reeforganismsMarine0Ecology0 Progress0Series312113R121
MalcolmHASmithSDAampJordanA2009Usingpatternsofreeffishassemblages to refine a Habitat Classification System for marine parks in NSW Australia Aquatic0Conservation0Marine0and0Freshwater0Ecosystems2083R92
Massel SR amp Done TJ 1993 Effects of cyclone waves on massive coral assemblages on the Great Barrier Reef meteorology hydrodynamics and demographyCoral0Reefs12153R166
Mumby PJ amp Steneck RS 2008 Coral reef management and conservation in light of rapidly evolving ecological paradigms Trends in Ecology amp Evoution 23 555 -563
Murphy HM amp Jenkins GP 2010 Observational methods used in marine spatial monitoring of fishes and associated habitats a review Marine and Freshwater Research 61 236-252
Noriega R 2007 An Overview of Available Information on Sandy Beach Ecology Coastal Sand Dunes Rocky Reefs and Associated Biota on the Gold Coast Griffith Centre for Coastal Management Research Report No 85 report prepared for Griffith University
Parker P (1995) Structure to Reef Fish Assemblages at Julian Rocks Northern New South Wales Masters Thesis Griffith University
Parker PG 1999 Fish assemblages at Julian Rocks and the adjacent waters of northern New South Wales Australia Australian Zoologist 31 134 - 160
Pawlik JR Steindler L Henkel TP Beer S amp Ilan M 2007 Chemical warfare on coral reefs sponge metabolites differentially affect coral symbiosis in situ Limnology and Oceanography 52 907-911
Reef Check 2010 httpwwwreefcheckaustraliaorgdatahtml accessed December 2015
Robinson KI amp Pollard DA 1982 Marine and estuarine reserves in Australia with particular reference to New South Wales Wetlands 2 17 - 26
Rogers CS 1990 Responses of coral reefs and reef organisms to sedimentation Marine Ecology Progress Series 62 185-202
Russ GR 2003 Grazer biomass correlates more strongly with production than with biomass of algal turfs on a coral reef Coral Reefs 22 63-67
Rutzler K 2002 Impact of crustose clionid sponges on Caribbean reef corals Acta Geologica Hispanica 37 61-72
Scheffers SR Nieuwland G Bak RPM amp van Duyl FC 2004 Removal of bacteria and nutrient dynamics within the coral reef framework of Curacao (Netherlands Antilles) Coral Reefs 23 413-422
TRESBP Kirra Reef Marine Biota Monitoring 2015 59
frc environmental
Schlacher-Hoenlinger M Walker S Johnson J Schlacher T amp Hooper J 2009 Biological Monitoring of the Ex-HMAS Brisbane Artificial Reef Phase II - Habitat Values report prepared for Environmental Protection Agency (EPA)
Smith KA 2003 A simple multivariate technique to improve the design of a sampling strategy for age-based fishery monitoring Fisheries Research 64 79-85
Smith S Edwards R Dalton S amp Harrison M 2005 Biological assessment of fish and benthic communities at Palm Beach Bait Reef Gold Coast Queensland report prepared for University of New England
TRESBP 2014 Autum 2009 storms httpwwwtweedsandbypassnswgovauarticles-and-studiesinteresting-itemsautumn-2009-storm updated 4 May 2014 accessed December 2015
TRESBP 2015a Tweed Sand Bypassing Restoring Coastal Sand Drift Improving Boating Access ndash Techinical information httpwwwtweedsandbypassnswgovau__dataassetspdf_file0004552055kir ra-feb-2015pdf acessed December 2015
TRESBP 2015b Waves httpwwwtweedsandbypassnswgovauenvironmental-monitoringcoastal-conditionswaves updated 30 September 2015 accessed December 2015
Umar MJMLJ amp Price IR 1998 Effects of sediment deposition on the seaweed Sargassum on a fringing coral reef Coral Reefs 17 169-177
Underwood AJ amp Kennelly SJ 1990 Ecology of marine algae on rocky shores and subtidal reefs in temperate Australia Hydrobiologia 192 3-20
Walker S Schlacher T amp Schlacher-Hoenlinger M 2007 Spatial heterogeneity of epibenthos on artificial reefs fouling communities in the early stages of colonization on an East Australian shipwreck Marine Ecology 28 435-445
Walker SJ Degnan BM Hooper JNA amp Skilleter GA 2008 Will increased storm intensity from climate change affect biodiversity in non-scleractinian sessile fauna on coral reefs Global Change Biology 14 2755-2770
Warwick RM amp Clarke KR 1993 Increased variability as a symptom of stress in marine communtities Journal of Experimental Marine Biology and Ecology 172 215-216
Thenumberofsitessurveyedhasvariedover timeasaresultof the fluctuating levelof sandcoveringKirraReef
Prior to May 2003 three sites were assessed along the eastern and northern edge of KirraReef(KirraReefOutersites1to3)andthreesiteswereexaminedalongtheinshore marginof the reef (KirraReef Inner sites1 to 3)(MapA1) ReefRedge (ieKirraOuter) siteswerechosentoprovideearlywarningofimpactsfromoffshoreplacementofdredged sandwhilst inshoresites(ieKirraInner)werechosentoindicatewhetherimpactsfrom inshore beach profile development were affecting the reef platform In May 2003 the threeeasternsitesatKirraReef (ieKRO1KRO2andKRI1)werecompletelycovered with bare mobile sand Consequently only the three western sites at Kirra Reef (ie KRO3KRI2andKRI3)supportedbenthicfloraandfaunaInMarch2004theextentof the remainingwesternoutcropof KirraReef had been further reduced so that all inner reefsiteswerecompletelycoveredwithmobilesandConsequentlyonlyasingleoriginal reefsite(ieKRO3)couldbesurveyed(Figure23)Thereforetoprovideanindicationof the condition of the remaining reef two new sites were established (ie KRN1 and KRN2)(Figure23)andsurveyedinMarch2004Theextentofthewesternreefhadbeen further reduced by February 2005 and a third new site (ie KRN3) was established (Figure23)Consequentlyfoursites(KRO3KRN1KRN2andKRN3)weresurveyedin February2005
InFebruary2010fourKirraReefsites(ieKRO3KRO1KRN1andKRN2)wereclearof thesurroundingsandandsupportedbenthic floraand fauna Inaddition several rocks protruded from the sand in the vicinity of site KRI2H these were assessed to provide a quantitativeindicationofbroadRscaletemporalchangestotheinshorereefcommunities
SOURCEScopy Copyright Commonwealth of Australia (Geoscience Australia) 2001 2004 2006copy The State of Queensland (Department of Natural Resources and Mines) 2015copy Nearmap 2014 2015
DATE2015-09-09
DRAWN BYCF
VERSION02
PROJECTIONCoordinate System GDA 1994 MGA Zone 56Projection Transverse MercatorDatum GDA 1994
plusmn SCALE
0 50 100
Metres
Scale 12500 A3
frc environmental
Appendix$B$ Introduction$to$Data$Analysis$Used$
Multivariate$Analyses$
Multivariate statistical techniques are widely used in ecology to assess the similarities relationshipsbetweenassemblagesWhereasunivariateanalysescanonlycompareone variable at a time (eg an index of community structure such as a diversity index or a singleindicatorspecies)multivariateanalysescancomparesamplesbasedontheextent thatassemblagesshareparticulartaxaandabundances(ClarkeampWarwick2001)
Thefirststepofmultivariateanalysisusuallyinvolvesthecreationofamatrixofsimilarity coefficients computed between every pair of samples The coefficient is usually a measureofhowclose theabundance is foreachspecies (definedso that100= total similarity and 0=complete dissimilarity) The Bray Curtis similarity measure is commonlythemostappropriateforbiologicaldata(ClarkeampWarwick2001)
MultidimensionalScaling
NonRmetricmultiRdimensionalscalingordinations(nMDS)attempttoplacesamplesintwo dimensionalspacesothattherankorderofthedistancesbetweensamplesmatchesthe rankorderofthematchingsimilaritiesfromthesimilaritymatrix(ClarkeampWarwick2001) Thisprovidesavisualrepresentationofthesimilaritiesbetweenassemblageswithineach sampleEachoftheaxesisnotrelatedtoanyparticularvalueHinfactaxescanberotated toprovide thebestvisual representationof thedata Ordinationsareparticularlyuseful tools for analysing and visually presenting differences between assemblages Ordinationsareessentiallymapsofsamples inwhich theplacementofsampleson the mapreflectsthesimilarlyofthecommunitytothecommunitiesinothersamples(Clarkeamp Warwick 2001) Distances between samples on an ordination attempt to match the similarities inassemblagestructurenearbypoints representassemblageswithvery few attributes(speciesorabundanceofspecies)Hpoints faraparthavevery fewattributes in common(ClarkeampWarwick2001)
A stress coefficient is calculated to reflect the extent to which the multiRdimensional scalingordinationandthesimilaritymatrixagree(ClarkeampWarwick2001)(iehowwell the multiRdimensional scaling ordination accurately reflects the relationship between samples)Stressvaluesoflt015aregenerallyacceptable
In Figure A1 each freshwater macroinvertebrate sample is represented on the multiRdimensionalscalingordination By lookingat thedistancesbetweeneachsample
ANOSIMisanalogoustoANOVAinunivariatestatistics(Smith2003)AglobalRstatistic iscalculatedtodeterminewhetherthereisasignificantdifferencebetweenallsamplesIf there are differences then pairwise comparisons are conducted to test for differences betweenpairsofsamples(analogoustopostRhoctestsinANOVA)
The R value lies between R1 and +1 (all similarities within groups are less than any similarity between groups) with a value of zero representing the null hypothesis (no differenceamongasetofsamples)(ClarkeampWarwick2001)ComparisonofpairwiseR values can give an indication of how different assemblages are R values close to 0 indicatelittledifferencevaluesaround05indicatesomeoverlapandvaluescloseto1to indicate many or substantial differences In many instances however researches are primarily interestedinwhethertheRvalueisstatisticallydifferentfromzero(usuallyata confidence level of 005) (Clarke amp Warwick 2001) (ie whether they can reject the null hypothesis)
ANOSIM can provide information on whether the (visual) differences between assemblages in the multiRdimensional scaling ordination are significantH it is an independenttestfromthemultiRdimensionalscalingordinationItisbasedontestingthe
TRESBPKirraReefMarineBiotaMonitoring2015 B2
frc environmental
differences between the rank similarities in the similarity matrix not on the distances betweensamplesinthemultiRdimensionalscalingordination(ClarkeampWarwick2001)
PermutationalMultivariateAnalysisofVariance
PERMANOVAisusedtotestsimultaneousresponsesofoneormorevariablestooneor more factors in an a0 priori0 structured design using random permutation of the data to assess significance (Anderson 2004) PERMANOVA generates a pseudo FRstatistic similar to traditional ANOVA but pRvalues are calculated with permutations which does notassumenormaldatadistribution PERMANOVAcanprovide informationonwhether the (visual) differences between assemblages in a multiRdimensional scaling ordination are significantH however it is an independent test from the multiRdimensional scaling ordination
Thelevelofmultivariatedispersionamongsampleswithineachofthetestgroupscanbe examined using the permutational analysis of multivariate dispersions (PERMDISP) routine(Anderson2004)Intraditionalimpactassessmentachangeinthedispersionof datacanalsoindicateanimpact
SimilarityPercentagendashSpeciesContributions
SIMPER analysis provides information on how dissimilar assemblages from various groups are (eg how similar all of the macroinvertebrate samples taken for a particular habitatwithinastreamreachare)andhowsimilareachgroup(egreach)istoanyother group SIMPER analysis also identifies the species taxa that are contributing to the dissimilarity between two assemblages in rank order (ie it identifies which species is contributingthemosttothedifferences)SIMPERanalysismayhelptoidentifypotential lsquoindicatorrsquospeciesForexampleifaparticularspeciesconsistentlycontributesgreatlyto the differences between impacted and unimpacted assemblages it may be a useful indicator Theabundanceofthis indicatorspeciescanthenbecomparedbetweensites usingunivariatetechniquessuchasANOVA
Data is available on request from tresbpprojectofficecrownlandnswgov
TRESBPKirraReefMarineBiotaMonitoring2015 C1
frc environmental
Appendix(D( Pairwise( PERMANOVA( Results
Data is available on request from tresbpprojectofficecrownlandnswgov
TRESBPKirraReefMarineBiotaMonitoring2015 D1
frc environmental
Appendix(E( Relative(Abundance(of(Fish(found(at(Kirra(( ( and(Palm(Beach(Reefs(in(Each(Survey((Data is available on request from tresbpprojectofficecrownlandnswgovau
TRESBPKirraReefMarineBiotaMonitoring2015 E1
Structure Bookmarks
0 50 100 Metres Scale 12500 A3
0 50 100 200 Metres Scale 15000 A3
Kirra Reef
Kirra Reef
Kirra Reef
Kirra Reef
Kirra Reef
Kirra Reef
Map A1Location of Kirra Reef monitoring sites
Table D8 Pairwise comparison of macroalgae cover between sites in each year
Table D15 Pairwise comparison of turf algae cover between sites in each year
Table D29 Pairwise comparison of ascidian cover between sites in each year
Table D43 Pairwise comparison of soft coral cover between sites in each year
frc environmental
Benthic assemblages at Kirra Reef appeared to show some overlap between surveys (Figure34H) HowevernearlyallsurveysweredifferentateachsiteatbothKirraReef andPalmBeachReef(AppendixD)BenthicassemblagesinMarch2015andApril2014 wereverysimilarcomparedtobenthicassemblages inthebaselinesurvey inApril1995 andMarch2015(notethegreateroverlapinFigure35comparedtoFigure36)
In March 2015 as in previous surveys the macroalgae Sargassum sp dominated the benthic assemblages at all sites at Kirra Reef (Figure 37) Other species present included
sdot Dictyopteris0arostichoides0
sdot Dilophus0intermedius00
sdot Zonariasp
sdot Laurencia0brongniartic0
sdot Amphiroa0anceps0
sdot Caulerpa0lentilliferaand
sdot Halimeda0discoideaand
sdot Macrocystissp
Juvenile kelp (from the genus Macrocystis) was also emerging on some areas of Kirra Reef
ThecoverofmacroalagevariedbetweensitesandsurveysatbothKirraReefandPalm Beach Reef with the magnitude of difference varying over time (note the significant interaction between site (location) x survey in Table 32) Macroalgae cover varied between surveys with 2001 being the most different to the other years (Appendix D) ThereweredifferencesbetweensitesatKirraReefinJune1995February1996January 2001 May 2003 February 2005 and February 2010 and between sites at Palm Beach ReefinJanuary2001andFebruary2010Inrecentsurveys(2012to2015)thecoverof macroalgaeatsitesatbothKirraReefandPalmBeachReefwassimilar (AppendixD) indicatingarelativelyconsistentdistributionacrossbothreefs
ThemeancoverofmacroalgaeatKirraReefhasdeclinedsinceitspeakin2001withthe greatest magnitude of decline recorded between January 2001 and May 2003 (Figure 38)InsurveysbetweenJune1995andMay2003Sargassumspformeddensecarpets overtherockysubstratecoveringupto58oftheavailablesurfaceareaofthereefIn February 2010 macroalgal cover was 12 Macroalgal cover has increased to 26 in March2015ThisissimilartothecoverrecordedinApril1995(23cover)(Figure38)
In2015nomacroalgaewasrecordedwithinthequadratsatPalmBeachReefThecover of macroalgae on Palm Beach Reef has been consistently lower than Kirra Reef since
TRESBPKirraReefMarineBiotaMonitoring2015 26
frc environmental
ecologicalmonitoringbegan typically lessthan5of theavailablesurfacearea(Figure 38)
The mean cover of turf algae varied between sites and surveys at both Kirra Reef and PalmBeachReef(notethesignificantinteractionbetweensite(location)xsurveyinTable 33)SpecificallythereweresignificantdifferencesbetweensitesatbothKirraReefand PalmBeachReefinJune1995January2001February2010July2012andApril2014 (aswellasbetweensitesinFebruary1996atKirraReef)Thecoverofturfalgaevaried betweenmostsurveysatallsitesateachreef(AppendixD)BothKirraandPalmBeach reefs showed major increases in the percent cover of turf algae from 2010 to 2012 followedbyadecreaseincoverbetween2012and2014(Figure310)Thecoverofturf algae is typically lower at Kirra Reef than at Palm Beach Reef (July 2012 being an exception) and was again slightly lower at Kirra Reef in March 2015 (Table 310) In March2015turfalgaewasmoreprevalentatKirraReefthanduringthebaselinesurvey ofApril1995
ThemeancoverofspongesatsomesitesatbothKirraReefandPalmBeachReefhas varied significantly during some surveys (note the significant interaction between site (location)xsurvey inTable34HFigure311) However thecoverofspongestendedto bemore temporallyvariable atKirraReef than at Palm Beach Reef (Figure312) The cover of sponges at Kirra Reef varied between sites in February 1996 January 2001 March2004July2012andApril2014 However thecoverofspongesatPalmBeach Reefonlyvariedbetweensites inJanuary2001andFebruary2010 (AppendixD) The cover of sponges varied between survey at each site with 1995 1996 and 2001 most differenttootheryears(AppendixD)
ThemeancoverofspongesatKirraReefdeclinedbetweenMarch2004(20cover)and February 2010 (less than 1 cover) Since 2010 the cover of sponges has increased slightly with sponges covering 8 of the reef in March 2015 (Figure 312) In March 2015thecoverofspongeswashigherthanrecordedduringthebaselinesurveyinApril 1995(3cover)(Figure312)
Figure312 Mean cover of sponges (plusmnSE) at Kirra Reef and Palm Beach Reef on all
surveys
Table34 Univariate PERMANOVA results for differences in the cover of sponges betweensurveysandlocations
Factor$ df$ MS$effect$ PseudoF$ p$(perm)$
survey 10 18576 276 0018
location 1 39671 589 0210
site(location) 4 67354 477 0001
locationxsurvey 10 1490 221 0032
site(location)xsurvey 40 67331 477 0001
error 924 14108
Shadingdenotessignificanceatplt005
TRESBPKirraReefMarineBiotaMonitoring2015 32
frc environmental
Ascidians$
ThemeanabundanceofallascidiansotherthanPyura0stoloniferahasvariedsignifcantly between sites at Kirra Reef and Palm Beach Reef and between surveys at each site (Figure314andnotethesignificantinteractionbetweensite(location)xsurveyinTable 35) The abundance of ascidians was different between sites at Kirra Reef in January 2001May2003March2004February2005andApril2014HanddifferentatPalmBeach ReefinJanuary2001February2005February2010andMarch2015Theabundance ofascidiansvariedbetweensurveysateachsitewith1995beingmostdifferentwhenthe abundanceofascidianswaslow(AppendixD)InMarch2015theabundanceofallother ascidiansonKirraReefandPalmBeachReefwashigherthanpreviouslyreportedinthe baselinesurveyinApril1995(whennoascidianswererecorded)Themeanabundance washigheratKirraReefthanatPalmBeachReef(Figure314)
ThemeanabundanceofPyura0stoloniferahasvariedconsiderablybetweensitesatKirra Reef and Palm Beach Reef over time (note the significant interaction between site (location) x survey in Table 36) In March 2015 the mean abundance (individual per 025m2plusmnSE)of theascidianPstolonifera (Figure313)wassimilaratKirraReefand PalmBeachReef(Figure315)ThemeanabundanceofP0stoloniferahasrangedfrom 02to17individualsper025m2atbothreefssinceMay2003
Figure315 Mean abundance of ascidians (Pyura0 stolonifera) (individuals025m2)
(plusmnSE)atKirraReefandPalmBeachReefinallsurveys
TRESBPKirraReefMarineBiotaMonitoring2015 34
frc environmental
Table35 Univariate PERMANOVA results for the differences in cover of all ascidians otherthanPyura0stolonifera0betweensurveysandlocations
Factor$ df$ MS$effect$ PseudoF$ p$(perm)$
survey 10 26658 474 0001
location 1 13603 710 0104
site(location) 4 19154 149 0212
locationxsurvey 10 2629 468 0001
site(location)xsurvey 40 5621 438 0001
error 924 12828
Shadingdenotessignificanceatplt005
Table36 Univariate PERMANOVA results for the differences in Pyura0 stolonifera densitybetweensurveysandlocations
Factor$ df$ MS$effect$ PseudoF$ p$(perm)$
survey 10 16254 11842 0001
location 1 12445 60881 0206
site(location) 4 20442 56799 0001
locationxsurvey 10 79724 58082 0001
site (location) x 40 13726 38138 0001 survey
error 924 35991
Shadingdenotessignificanceatplt005
$
TRESBPKirraReefMarineBiotaMonitoring2015 35
frc environmental
Hard$Coral$
There was a significant difference between the cover of hard corals at Kirra Reef and PalmBeachReefduringsomesurveys(notethesignificantinteractionbetweenlocationx surveyinTable37)SpecificallytherewassignificantlymorehardcoralatPalmBeach Reef thanKirraReef inFebraury1996March2004April2014andMarch2015(Table 38)
ThecoverofhardcoralistypicallylowonKirraReefaccountingforlessthan2ofthe availablesubstrateInMarch2015hardcoralcoveredlessthan1oftheareaofKirra Reef which was less than the cover recorded during the baseline survey in April 1995 (Figure 316) In contrast hard coral covered 11 of the surface area at Palm Beach ReefwhichwasgreaterthanthecoverrecordedinApril1995(Figure316)
The cover of hard corals at Palm Beach Reef has been more variable over time comparedtothecoverofhardcoralatKirraReef(Figure316)Withtheexceptionofthe surveys inApril1995andJanuary2001when thecoverofhardcoralwas lowonboth reefshardcoralsaretypicallymoreprevalentatPalmBeachReef(Figure316)
Table38 PERMANOVA post hoc pairwise results for the differences in the cover of hardcoralbetweenlocationsineachsurveyevent
Hard$Corals$ Survey$
t$ p$(MC)$a$
Apr1995 054 0606
Jun1995 182 0140
Feb1996 541 0006
Jan2001 R R
May2003 166 0168
Mar2004 765 0001
Feb2005 049 0646
Feb2010 156 0197
Jul2012 283 0053
Apr2014 525 0011
Mar2015 695 0003 Shadingdenotessignificanceatplt005 a pvaluesbasedonMonteCarlotests
TRESBPKirraReefMarineBiotaMonitoring2015 37
60
50
40
30
20
10
0
Soft
Cor
al C
over
()
Kirra Reef Palm Beach Reef
frc environmental
Soft$Coral$
The cover of soft coral was significantly different between sites at both Kirra Reef and PalmBeachReefandduringsomesurveys(notethesignificant interactionbetweensite (location)xsurvey)TherewasnosoftcoralrecordedatKirraReefinMarch2015The coverofsoftcoralhasdeclinedatKirraReefsince2003andhascoveredlessthan2of theavailablesubstratesince2005whichissimilartothecoverofsoftcoraldescribedfor the baseline surveys in 1995 (Figure 317) The cover of soft coral was consistent betweensitesineachsurveyexceptbetweensitesin
sdot April1995atKirraReef
sdot 1996atKirraReef
sdot 2003atPalmBeachReefand
sdot 2014atPalmBeachReef(AppendixD)
Soft corals have historically covered more of the available space on Palm Beach Reef than on Kirra Reef However there was more temporal variability within sites at Palm BeachReefthanatKirraReef(AppendixD)ThecoverofsoftcoralatPalmBeachReef has varied over time and was highest in April 1995 (48 cover) Despite increasing sinceFebruary2005itisstilllowerthanthecoverrecordedduringthebaselinesurveyin April1995(Figure317)
Table39 UnivariatePERMANOVAresults for thedifferences in thecoverofsoft coral betweensurveysandlocations
Factor$ df$ MS$effect$ PseudoF$ p$(perm)$
survey 10 44657 1323 0001
location 1 32922 6620 0117
site(location) 4 49732 266 0036
locationxsurvey 10 40982 1214 0001
site (location) x 40 3376 181 0002 survey
error 924 18688
Shadingdenotessignificanceatplt005
$
TRESBPKirraReefMarineBiotaMonitoring2015 39
frc environmental
Crinoids$
ThereisasignificantdifferencebetweensomesitesatbothKirraReefandParmBeach Reef that varies through time (note the significant interaction between site (location) x survey inTable310) Theabundanceofcrinoidshasbeensimilarbetweensites inall years at Palm Beach ReefH and was different beween sites at Kirra Reef in June 1995 February1996May2003andFebruary2005(AppendixD)Withineachsitetherehas been some natural temporal variability particualrly at Palm Beach Reef sites in 2001 (Appendix D) The mean abundance (individuals 025m2) of crinoids (Figure 318) at KirraReefandPalmBeachReefhasgenerallybeenlessthan2individualsper025m2 andhasdeclinedatboth locationssincethebaselinesurvey inApril1995(Figure319) However the mean abundance of crinoids on Kirra Reef has shown a slight increase sinceFebruary2010(Figure319)
In March 2015 fewer crinoids were recorded at Palm Beach Reef than at Kirra ReefH crinoidshavebeenrareatPalmBeachReefsince2003
The species richness of fish recorded from Kirra Reef across all monitoring events has rangedfrom14to57 InMarch201557specieswereidentifiedat thereefwhichwas similar to April 2014 (53) and higher than previous surveys (Figure 320) Species richnessatPalmBeachReefwas lower(34species)andgenerallyvaried lessbetween surveyscomparedtoKirraReef
InMarch2015 the assemblage of fish at KirraReef comprised species fromall trophic levelsincludingdetritivoresplanktivoresherbivoresandcarnivores(AppendixE)Asin previous surveys the assemblage was dominated by herbivores and planktivores Yellowtail (Trachurus0 novaezelandiae) and striped sea pike (Sphyraena0 obtusata) were the dominant species present in large schools (Figure 321) Australian mado (Atypichthys0 strigatus) ringRtailed surgeon (Acanthurus0 blochii) silver trevally (Pseudocaranx0 georgianus) eastern pomfred (Schuettea0 scalaripinnis) sweep (Scorpis0 lineolatus) and various wrasses were also very abundant releative to other species (AppendixE)
Two new species were observed at Kirra Reef the orangeRband surgeon (Acanthurus0 olivaceus) and the unicornfish (Naso0 sp) Five new species were recorded at Palm BeachReef
No threatened or protected fish species listed under the Queenslandrsquos Nature0 Conservation0Act01992ornationallyundertheEnvironmental0Protection0and0Biodiversity0 Conservation0 Act0 1999 were observed The complete list of species recorded and the relativeabundanceispresentedinAppendixE
TRESBPKirraReefMarineBiotaMonitoring2015 42
60
0
10
20
30
40
50
Num
ber
of F
ish
Spe
cies
Apr-95
Jun-95
Feb-96
Jan-01
May-03
Mar-04
Feb-05
Feb-10
Jul-12
Apr-14
Mar-15
Kirra Reef Palm Beach Reef Location
frc environmental
Figure320 Number of fish species recorded at Kirra Reef and Palm Beach Reef on
ThegreatestchangetotheecologicalconditionofKirraReefsincethebaselinesurveyin 1995 has been the loss of large areas of hard substrate that support benthic flora and faunaThedeliveryoflargesandvolumesduringthestage1dredgingoperations(1995 to1998)andtheinitialoperationofthesandbypasssystem(2001to2008)resultedinan increaseinwaveactionandtidalcurrentsredistributingthissandoverKirraReef
The three major outcrops of Kirra Reef (northern southern and eastern sections) are naturally exposed and covered depending on water and sand movements In March 2015 the rocky outcrops in the northern section of Kirra Reef were exposed and supportedamoderatelydiversebenthicassemblagedominatedbyturfalgaeTherewas arelativelyhighfishdiversityatKirraReefTheecologicalassemblageexhibitedsignsof ongoingstressfromphysicaldisturbanceincludingtheabsenceofsoftcoralsandrarityof hardcoral(MumbyampSteneck2008)HoweverKirraReefhasarelativelyhighcoverof sponges and ascidians Sponges ascidians and crinoids were more abundant at Kirra ReefthanatPalmBeachReefinMarch2015
KirraReefcontinues toprovidehabitatandsupport importantecological functions in the region providing hard substrate for the colonisation of algae and benthic invertebrates and food and refuge for fish As sand levels have stabilised since 2008 assemblages have becomemoresimilar to those recordedprior to implementationof the TRESBP in April1995 Forexamplemacroalgalcover inApril1995andMarch2015wasrelatively similarHoweverassemblagecompositionisstillsignificantlydifferenttothatrecordedin thebaselinesurveysmostnoticeablyduetoa lowercoverofbaresubstrateandhigher coverofturfalgaeandascidianssincesurveyshavebeenperformed
Benthic$Macroalgae$
The cover of macroalgae at Kirra Reef was relatively similar during the 2014 and 2015 surveys and remained well below the peak of nearly 60 cover recorded in January 2001TherewasasteepdeclineinthecoverofmacroalgaebetweenJanuary2001and May2003whichappearedtobestronglyassociatedwith thedecline inreefareaduring that time as well as a decline in the cover of Sargassum sp (an important indicator speciesonKirraReef) SimilardeclineswereevidentatPalmBeachReefbetween the January2001andMay2003surveys
TRESBPKirraReefMarineBiotaMonitoring2015 45
frc environmental
The cover ofmacroalgae at Palm Beach Reef was much lower thanat Kirra Reef over time There are several possible reasons for the lower cover of macroalgae at Palm Beach
sdot PalmBeachReefisdeeperthanKirraReefandgenerallyhashigherturbidityand therefore greater light attenuation The quantity and quality of available light affectsthedistributionandgrowthofmacroalgae(MillerampEtter2008)
sdot Differences in the pattern of recruitment of algal species to the reefs due to differentwatercurrentsandtimingofthesurveys(Kennelly1987b)
sdot Increased competition with turf algae and sessile benthic invertebrates which competeforspacewithmacroalgae(Kennelly1987aHMillerampEtter2008)
sdot PresenceofdifferentspeciesandhigherdensityofherbivoresatPalmBeachReef (particularly sea urchins and herbivorous fish) which graze on macroalgae (McCook1997HJompaampMcCook2002)
Biological assemblages exposed to physical stress typically exhibit greater levels of temporalandspatialvariability(WarwickampClarke1993HChapmanetal1995)Temporal variationinthecoverofmacroalgaeatKirraReefislikelytobeprincipallyduetotheeffect ofphysicaldisturbance fromwaveactionaswellas theassociatedassociatedabrasion andsmotheringbysandTheeffectsofthesephysicaldisturbanceswouldincreasewith thereductionofKirraReefasedgeeffectsarepronouncedandwaterdepth isreduced Increasedsmotheringbysandcanalsoreducediversity(Hatcheretal1989)abundance recruitment growth survival and seasonal regeneration of macroalgae (Umar amp Price 1998HCheshireetal1999)
Changes in the cover of macroalgae on Kirra Reef over time are also likely due to the extentofthereefchangingHthefishandmobileinvertbratesassociatedwiththereefmay have concentrated which would in turn increase grazing pressure Increased grazing pressure from fish and mobile invertebrates can reduce the coverage and diversity of macroalgaeonreefs(McCook1997HJompaampMcCook2002)
Thecoverof turfalgaeatbothKirraReefandPalmBeachReefhasvariedsignificantly betweensurveysPriorto2005turfalgaetypicallycoveredlessoftheavailablesurface areaonKirraReefthanPalmBeachReefInMarch2015themeancoverofturfalgae hasincreasedsincebaselinesurveysin1995andwasrelativelysimilarbetweenreefs(40 plusmn4atKirraReefcomparedto48plusmn4atPalmBeachReef)Thecoverofturfalgaeat Kirra Reef was similar in 2014 and 2015 which was generally higher than previous surveysexceptduringJuly2012whencoverofturfalgaepeakedat67plusmn4
TRESBPKirraReefMarineBiotaMonitoring2015 46
frc environmental
Turfalgaearebecomingadominantcomponentofcommunitiesaroundtheworld likely the result of rapid colonisation of openspace after a disturbance (eg storms) nutrient enrichment andor changes in grazing pressures Turf algae can also reflect a more physically robust growth form suited to high wave energy environments (than foliose macroRalgae)TurfalgaepeakedintheJuly2012surveylikelyrelatedtotheincreasein bare reef exposure following a stormy conditions in early 2009 and between December 2011 and June 2012 Turf algae have been the dominant form of algae on Kirra Reef sincethistimealbeitthecoverlowerthanthe2012survey
Increased cover of turf algae is typically related to good light conditions high concentrationsofnutrientsandlownumbersofgrazerssuchasfish(orconstantgrazing pressure preventing macroalgae colonisation) However the relationship between algal dynamics physical disturbance water quality and herbivore grazing activity is complex andthecoverof turfalgaecanexhibitextremetemporalvariabilityasaconsequenceof the interactionbetween topRdownandbottomRupprocesses (Russ2003HBellwoodetal 2006H Hughes et al 2007H Albert et al 2008H Hoey amp Bellwood 2008H Mumby 2009) Furtherinvestigationwouldberequiredtoreliablydeterminethemechanismsofchangein bothmacroalgaeandturfalgaeassemblagesonthesereefs
Benthic$Macroinvertebrates$
AtKirraReeftheburialandreRemergenceofrockyoutcrops(influencedbytheTRESBP) islikelytohaveincreasedtemporalvariabilityinthedistributionandabundanceofbenthic macroinvertebrates Additional perturbations such as wave action and sand abrasion (each influenced through changes in bathymetry seabed topography and water depth) are likely to have resulted in the decline in cover and diversity of the benthic macroinvertebratesatKirraReefbetweensurveysparticularlybetweenMarch2004and February2005andduringtheseverestormsof2009Benthicmacroinvertebratessuch asascidiansspongeshardcoralandsoftcoralarehighlysusceptible to theeffectsof stormandwavedisturbancephysicalabrasionandburialbysand(KayampKeough1981H Walker et al 2008) which can affect settlement growth rate and survival (Dodge amp Vaisnys1977HRogers1990)
Physical disturbance from sand burial sand abrasion and the action of storm waves appeartokeepthebenthicassemblagesofKirraReefinastateofearlysuccessionItis commonforearlypioneerspeciessuchassomemacroalgaetorecruitrapidlytoahard surface in large numbers allowing these species to dominate assemblages early in the successionaltrajectory(Walkeretal2007)
Afurther indicatorof theearlystateofsuccessionatKirraReef isthatthecoverofhard and soft coral has remained very low (generally lt 5) In March 2015 less than 1
Benthic macroinvertebrate cover may also be affected indirectly through increased competitionwithmacroalgaeforspaceThepresenceoflargemacroalgaecanaffectthe recruitment and survival of sessile benthic invertebrates as fronds moving with wave action sweep and abrade the surface of rocks killing new recruits especially corals (Kennelly1989HMcCooketal2001)Itcantakeseveralyearsforhardandsoftcoralto become dominant on reefs in the SEQ region (SchlacherRHoenlinger et al 2009) Therefore hard coral is not expected to become abundant until several years after the reefhasbeenuncoveredandonlyifthephysicaldisturbanceregimeandsupplyofnew recruitsissufficienttosupportsurvivalandgenerationalsuccessionofthesespeciesThe coverofhardandsoftcoralsatKirraReefwerebothverylowandpatchypriortothestart oftheTRESBP
Sponges and ascidians are highly susceptible to smothering and sand abrasion unless theyhaveathicktunic(outercoveringmadeofkeratin)liketheascidianP0stolonifera0or strong internal keratin silicon or calcareous structures in the case of some species of sponges0(KayampKeough1981HMcGuinness1987HWalkeretal2008)Duetoincreased wave action and sedimentation (which can be influenced by the TRESBP) the mean coverofascidiansandspongeswasexpectedtobemuchloweronKirraReefthanPalm Beach Reef However in March 2015 the cover of sponges was similar between the reefsandthecoverofascidians(otherthanP0stolonifera)wasgreateratKirraReefthan at Palm Beach Reef This suggests that Kirra Reef is slowly recovering from the increasedstressofphysicaldisturbancesuchas increasedwaveactionandsandscour andorthatwaveandstormconditionshavebeenlesssevereinthepastfewyears
Fish$
KirraReefcontinuestosupportahighdiversityofreefRassociatedandpelagic(ienonR reefassociated) fishspecies Despite itsdiminishedsizecompared to1995KirraReef continuestoprovidevaluablehabitatforanumberoffishspeciesfromdifferentfunctional groups
ThereisahighdegreeofinterRannualvariabilityinthespeciesandabundanceofthefish present at Kirra Reef compared with the assemblage at Palm Beach Reef This likely reflectsthetemporalvariabilityintheavailablehabitatasaconsequenceofreefburialand reRemergenceThediversityqualityandarealextentofreefhabitatareimportantfactors influencing the distribution abundance biomass and diversity of reef fish (Bellwood amp Hughes2001HFriedlanderetal2003)Diversityandabundanceoffishcanincreasewith
TRESBPKirraReefMarineBiotaMonitoring2015 48
frc environmental
greaterstructuralcomplexityandincreasedheterogeneityofavailablehabitats(Bellwood ampHughes2001)Thissuggeststhatperiodsofreefburialreducetheoveralldiversityof reefRassociated fish species at Kirra Reef Despite the reduction in overall reef space therewasalargervarietyofhabitats(suchasmarcoalgaeandturfalgae)in2015which was likely to be related to the high diversity of fish assemblages This is particularly importantforseveralspeciesthatdependonthepresenceoflsquostructurersquosuchasprovided by reef habitat (ie oldwife moray eels damselfish and Australian mado that were recordedinMarch2015butwerenotrecordedinJuly2012)
Theabundanceanddiversityof fishare likelytobenegativelyaffectedfollowingperiods of severe weather which create unfavourable conditions for many species and may further exacerbate the affects of abrasion and sedimentation The biomass of fish is knowntodecreasewithincreasingexposuretophysicaldisturbancefromwaveactionand strong currents (Friedlander et al 2003) As our surveys have been undertaken at different times of the year variation in the prevailing conditions at the time of sampling could also influence the types of fish observed (and the amount of reef habitat that is availableatanytime)Manyofthespeciesmayalsobeaffectedbyseasonalchangesin the water temperature such as damselfish which are less abundant in cool waters However theoveralldiversityof the fishassemblageatKirraReef is likely toreflect the sizeoftheoutcropsexposedwithagreaterphysicaldisturbance(fromseaconditionsand sandmovement)andcompetitionHandlesserfoodavailablewhenthereefiscovered
ThepredictedimpactstoKirraReefasaresultoftheTRESBPincludedaccretionofsand around the base of the rock outcrops causing a reduction in extent of reef It was predictedthatsanddeliveryaspartoftheprojectwouldeventuallymimiclsquonaturalrsquopatterns ofsanddispersalandthatthereefwouldreturntoitsnaturalextent(ietheextentpriorto extension of the Tweed River training walls in 1962) The benthic flora and fauna assemblages of the reef the historical reef extent and natural sand transport patterns wereexpectedtoreturntoconditionsobservedbeforetheextensionofthetrainingwalls between 1962 and 1965 However the Environmental Impact Study did not predict the ecologicalconsequencesofboththereducedarealextentandincreasedwaveenergy(a consequenceofdecreaseddepth)thathavebeenrecorded
ThecurrentextentofKirraReef remains less than50of that recorded in1962and in 1995beforethesanddeliverybytheTRESBPcommencedHowevertheextentofreef in1995 wasstrongly influenced by adepletion in sand following the construction of the Tweed River training walls and the Kirra Point groyne Accumulation of sand on Kirra ReefwasobservedtoincreaseasaresultofindirectsandnourishmentbytheTRESBP and the reef has been extensively covered (particuarly between 2005 and 2010) as a result
Whiletheextentofthereefcontinuestochangeovertimethedeliveryofsandaspartof the project now more closely matches the natural rate of longshore sand transport ShortRtermandseasonalchangesintheextentofthereefarenowlikelytobetheresultof waveandcurrentaction(particularlyduringservereweatherevents)thanadirectimpact of the TRESBP Therefore the extent of Kirra Reef in March 2015 is broadly in accordancewithpredictionsmadeintheEISwhichpredictedthatthereefwouldreturnto a condition similar to that exhibited in the preR1960rsquos ie before the extension of the TweedRiverbreakwatersthatinterruptedlittoralsandsupplytothesebeaches
InDecember2013KirraPointgroynewasextendedby30mwiththeexpectationthatthe beach bar would move seaward as a consequence At present Kirra Point groyne is unlikelytohavehadamajorimpactonthearealextentofKirraReefHoweverongoing monitoringbasedonaerialphotographsmayprovidefurtherinsight
Sessile benthic assemblages on Kirra Reef are highly susceptible to the influence of storms and associated wave action (Kay amp Keough 1981H Walker et al 2008) The shallowreefissurroundedbymobilesandwhichcanshiftnaturallyinresponsetowave action during storms causing burial of large sections of Kirra Reef This effect has reduced the availability of rocky substrate for colonisation and the availability of refuge
Fromanexaminationof theextentofKirraReef fromarealmapsandwaveheightdata thereappears tobea relationshipbetween theareaof rockexposedandstormevents Notably in a series of storm events in May 2009 corresponds with large areas of rock becoming exposed (with the reef approximately 100m2 in 2006 and approximately in 1009m2 2009) Further a stormy conditions between December 2011 and July 2012 correspondstotheareaofexposedrockmorethandoublinginsizeWhiletherewasno changetothetotalareaofexposedrockfollowingstormyconditionsinearly2013there wasaclearchangeinthedistibutionofexposedrockduringthistimeSince2013storm conditions have been calm to moderate and there has been little change in the areal extentanddistrubtionofexposedrockatKirraReef
WaveheighttypicallyincreasesduringstormeventsandgiventheshallowdepthofKirra Reef waves are more likely to shoal and break across the reef during storms This increases thephysicaldisturbanceabrasionandsedimentationofbenthicassemblages onKirraReefStormdisturbancecancauselocalreductionsinthespeciesrichnessand abundanceofcoral(Woodleyetal1981HMasselampDone1993HHughes1994HConnellet al 1997) and can alter fish assemblages indirectly through habitat modifications (Kaufman1983HJonesampSyms1998)ordirectlybyincreasingfishmortality(Lassig1983) The hydrodynamic forces produced by wave action are an important source of disturbance in subtidal habitats inflicting damage through direct physical impact and abrasion(UnderwoodampKennelly1990)DirectimpactsfromphysicaldisturbanceatKirra Reefareevidentduringsurveyeventswhenlargefragmentsofmacroalgaearepresentin thewatercolumnoverthereef
Storm and wave action (and associated sedimentation and abrasion) continue to be importantforcesshapingthedistributionandabundanceofbenthicspeciesatKirraReef Increased magnitude and frequency of physical disturbance resulting from increased exposureorsusceptibility tostormsandassociatedwaveaction (asonKirraReef)can lead to a decrease in the diversity of sessile invertebrate assemblages DisturbanceR drivenreductionsinbiodiversityhavethepotentialtoimpactnegativelyonthehealthand productivity of reef ecosystems (Walker et al 2008) Biodiversity is important to reef health given that many of these species (eg sponges bryozoans and ascidians) contribute a range of vital ecosystem services to reefs including nutrient cycling (Scheffers et al 2004) trophic interactions and food webs (Lesser 2006H Pawlik et al 2007) bioRerosion (Rutzler 2002H LopezRVictoria et al 2006) and stabilizing substrata (DiazampRutzler2001HWulff2001)
Theimpactsof increasedwaveactionandsedimentationonthebenthicassemblagesat Kirra Reef are likely to be greatest during and immediately following storm conditions
TRESBPKirraReefMarineBiotaMonitoring2015 51
frc environmental
Partitioningtheinfluenceofstormandwavedrivendisturbancefromthatoftheoperation oftheTRESBPwouldrequireamuchmorestatisticallypowerfulandtemporilyreplicated experimental design Given there is a large collection of wave and storm data by TRESBP this would involve greater temporal sampling of Kirra Reef including event samplingfollowingseverewaveandstormactivity
The data generated by this Kirra Reef biota monitoring program doesnrsquot support statistically rigorous consideration of seasonality (monitoring has been at its most frequentannual)
InApril2014andMarch2015KirraReefcoveredlessthan50ofthereefrsquosextentprior to theoperationof theTRESBP The lossof reefhabitathasreducedtheavailabilityof hard substratum available for colonisation and consequently the abundance of benthic sessileassemblages
The reduced depth of water resulting from the accumulation of sand exacerbates the effects of storms and wave action It is likley that as a consequnece the biological communities of Kirra Reef will reflect earlyRstage succession more frequently and for longerperiods
While there is sufficient structure available frcenvironmentalexpect that Kirra Reef will continuetoprovideimportanthabitatforadiverseassemblageoffishes
TRESBPKirraReefMarineBiotaMonitoring2015 52
frc environmental
5$ Conclusions$
Although there is still a substantial portion of the reef covered compared to before the extension of the Tweed River entrance breakwaters the current extent of Kirra Reef is broadly inaccordancewithpredictionsmadein theEIS Initial lsquocatchRuprsquobypassingand dredgeplacementofsand(between2001and2008)resulted in theburialofKirraReef Subsequentsanddelivery(since2008onwards)morecloselyreflectsnaturalpatternsof longRshoresandtransportandisthereefhasslowlyreRemerged
Theextentofthereefhasbeenrelativelystablesince2013Thishasallowedforsome succession in the benthic assemblages including a relatively high cover of sponges ascidiansandcrinoidsWiththedeliveryofsandmorecloselymatchingthenaturalrateit isexpected the reef willundergoshortRtermchanges in extentdue toseasonal shifts in sand deliveryH however the diversity of benthic assemblages on Kirra Reef is likely to increaseovertimeThiswouldcreatemorespaceforspeciestorecruitandreducesthe influence of sand abrasion and wave damage It was predicted that the areas of Kirra Reef newly exposed in 2012 would undergo a shift from turfRdominated communities to more diverse communities that could include macroalgae sponges ascidians and potentiallyhardandsoftcoralWiththeexceptionofhardandsoftcoralsthisprediction wasconfirmedbytheresultsoftheApril2014andMarch2015surveys
ThediversityoffishesassociatedwithKirraReefisbroadlysimilartothatrecordedprior tothecommencementofsandbypassingin1995Giventhatfisharemobilethegreatest impacts on fish assemblages are likely to be shortRterm changes due to both the prevailingconditionsandchangestheextentofavailablehabitatthatprovidesshelterand foodforavarietyofdifferentspeciesIfKirraReefincreasesinsizethereislikelytobea greater proportion of cryptic benthic species as these species are more typical of assemblagesinalaterstageofsuccession(eg(WillisampAnderson2003))
Assuming a broadly stable delivery rate of sand and consequent stable extent of Kirra ReeflsquorecoveryrsquoislikleytobesubstantivelycompleteFloralandfaunalcommunitieswill undergo succession between severe storm events but are likley to remain relatively dynamic
Albert S Udy J amp Tibbetts I 2008 Responses of algal communities to gradients in herbivorebiomassandwaterqualityinMarovoLagoonSolomonIslandsCoral0 Reefs2773R82
Anderson MJ 2001 A new method for nonRparametric multivariate analysis of varianceAustral0Ecology2632R46
Anderson MJ 2004 PERMDISP0 a0 FORTRAN0 computer0 program0 for0 permutatinoal0 analysis0 of0 multivariate0 dispersions0 (for0 any0 twoSfactor0 ANOVA0 design)0 using0 permutational0 tests Department of Statistics University of Auckland New Zealand
Cannon LR Goeden GB amp Campbell P 1987 Community patterns revealed by trawling in the interRreef regions of the Great Barrier Reef Memoirs0 of0 the0 Queensland0Museum2545R70
Chapman MG Underwood AJ amp Skilleter GA 1995 Variability at different spatial scalesbetweenasubtidalassemblageexposedtothedischargeofsewageand two control assemblages Journal0 of0 Experimental0 Biology0 and0 Ecology 189 103R122
Cheshire AC Miller DJ amp Stewart R (1999) Effect0 of0 dispersed0 sediment0 plumes0 from0beach0sand0replenishment0dredging0on0recruitment0of0phaeophycean0algae0 to0rocky0reefs0in0Gulf0St0Vincent0South0Australia0The0Impact0of0Sand0Dredging0 on0 Benthic0 Community0 Structure0 at0 the0 Port0 Stanvac0 Dredge0 Site0 20 1S39 UniversityofAdelaideAdelaide
ConnellJHHughesTPampWallaceCC1997A30Ryearstudyofcoralabundance recruitment and disturbance at several scales in space and time Ecological0 Monographs67461R488
Diaz MC amp Rutzler K 2001 Sponges an essential component of Caribbean coral reefsBulletin0of0Marine0Science69535R546
DodgeREampVaisnysJR1977Coralpopulationsandgrowthpatternsresponsesto sedimentation and turbidity associated with dredging Journal0 of0 Marine0 Research35715R730
Done TJ 1982 Patterns in the distribution of coral communities across the central GreatBarrierReefCoral0Reefs195R107
Edwards RA amp Smith DA 2005 Subtidal assemblages associated with a geotextile reef insouthReastQueenslandAustraliaMarine0and0Freshwater0Research56 133R142
FisheriesResearchConsultants1991Survey0of0the0Intertidal0and0Subtidal0Rocky0Reefs0 of0 the0 Sunshine0 Coast report prepared for Queensland National Parks and WildlifeService
HarrisonPHarriotVBanksSampHolmesN1998ThecoralcommunitiesofFlinders Reef andMyora Reef in theMoretonBay MarineParkQueensland Australia In Moreton0 Bay0 and0 Catchment Tibbits I Hall N amp Dennison W (Eds) SchoolofMarineScienceUniversityofQueenslandStLuciapp525R536
Hatcher B Johannes R amp Robertson A 1989 Review of research relevant to the conservationofshallowtropicalmarineecosystemsOceanography0and0Marine0 Biology0an0Annual0Review27337R414
Hoey A amp Bellwood D 2008 CrossRshelf variation in the role of parrotfishes on the GreatBarrierReefCoral0Reefs37R47
TRESBPKirraReefMarineBiotaMonitoring2015 56
frc environmental
Hollingsworth P 1975 Environmental Investigation Report Crown Reserve R R68 Currumbin Creek City of the Gold Coast Land Administration Commission unpublishedreport
Hughes TP 1994 Catastrophes phase shifts and large scale degradation of a CaribbeancoralreefScience2651547R1551
Hughes TP Rodrigues MJ Bellwood DR Ceccarelli D HoeghRGuldberg O McCook L Moltschaniwskvi N Pratchett MS Steneck RS amp Willis B 2007Phaseshiftsherbivoryandtheresilienceofcoralreefstoclimatechange Current0Biology17360R365
Hutchinson A Rempel C Taveras V Loder J amp Salmond J 2013 Reef0 Check0 Australia0 South0 East0 Queensland0 Summary0 Report0 2013 report prepared for ReefCheckFoundationLimited
Hyder Consulting 1997 Tweed0 River0 Entrance0 Sand0 Bypassing0 Project0 Permanent0 Bypassing0 System0 0 Environmental0 Impact0 Statement0 0 Impact0 Assessment0 Study report prepared for New South Wales Department of Land and Water Conservation
Jompa J amp McCook LJ 2002 Effects of competition and herbivory on interactions betweenahardcoralandabrownalgaJournal0of0Experimental0Marine0Biology0 and0Ecology27125R39
KayAMampKeoughMJ1981Occupationofpatchesintheepifaunalcommunitieson pier pilings and the bivalve Pinna bicolor at Edithburgh South Australia Oecologia48123R130
KennellyS1987aInhibitionofkelprecruitmentbyturfingalgaeandconsequencesfor an Australian kelp community Journal0 of0 Experimental0 Marine0 Biology0 and0 Ecology11249R60
Kennelly S 1987b Physical disturbances in an Australian kelp community I temporal effectsMarine0Ecology0Progress0Series40145R153
TRESBPKirraReefMarineBiotaMonitoring2015 57
frc environmental
Kennelly S 1989 Effects of kelp canopies on understory species due to shade and scourMarine0Ecology0Progress0Series50215R224
Lassig BR 1983 The effects of a cyclonic storm on coral reef fish assemblages Environmental0Biology0of0Fishes955R63
Lawson S McMahon J amp Boswood P 2001 Environmental management of the construction and operation of a sand bypassing system at the Tweed River EntranceInThe15thAustralasianCoastalandOceanEngineeringConference the 8th Australasian Port and Harbour Conference 25 R 28 September 2001 QueenslandAustralia
Lesser MP 2006 BenthicRpelagic coupling on coral reefs feeding and growth of Caribbean sponges Journal0 of0 Experimental0 Marine0 Biology0 amp0 Ecology 328 277R288
LopezRVictoriaM ZeaSampWei E2006 Competition for spacebetweenencrusting excavatingCaribbeanspongesandothercoral reeforganismsMarine0Ecology0 Progress0Series312113R121
MalcolmHASmithSDAampJordanA2009Usingpatternsofreeffishassemblages to refine a Habitat Classification System for marine parks in NSW Australia Aquatic0Conservation0Marine0and0Freshwater0Ecosystems2083R92
Massel SR amp Done TJ 1993 Effects of cyclone waves on massive coral assemblages on the Great Barrier Reef meteorology hydrodynamics and demographyCoral0Reefs12153R166
Mumby PJ amp Steneck RS 2008 Coral reef management and conservation in light of rapidly evolving ecological paradigms Trends in Ecology amp Evoution 23 555 -563
Murphy HM amp Jenkins GP 2010 Observational methods used in marine spatial monitoring of fishes and associated habitats a review Marine and Freshwater Research 61 236-252
Noriega R 2007 An Overview of Available Information on Sandy Beach Ecology Coastal Sand Dunes Rocky Reefs and Associated Biota on the Gold Coast Griffith Centre for Coastal Management Research Report No 85 report prepared for Griffith University
Parker P (1995) Structure to Reef Fish Assemblages at Julian Rocks Northern New South Wales Masters Thesis Griffith University
Parker PG 1999 Fish assemblages at Julian Rocks and the adjacent waters of northern New South Wales Australia Australian Zoologist 31 134 - 160
Pawlik JR Steindler L Henkel TP Beer S amp Ilan M 2007 Chemical warfare on coral reefs sponge metabolites differentially affect coral symbiosis in situ Limnology and Oceanography 52 907-911
Reef Check 2010 httpwwwreefcheckaustraliaorgdatahtml accessed December 2015
Robinson KI amp Pollard DA 1982 Marine and estuarine reserves in Australia with particular reference to New South Wales Wetlands 2 17 - 26
Rogers CS 1990 Responses of coral reefs and reef organisms to sedimentation Marine Ecology Progress Series 62 185-202
Russ GR 2003 Grazer biomass correlates more strongly with production than with biomass of algal turfs on a coral reef Coral Reefs 22 63-67
Rutzler K 2002 Impact of crustose clionid sponges on Caribbean reef corals Acta Geologica Hispanica 37 61-72
Scheffers SR Nieuwland G Bak RPM amp van Duyl FC 2004 Removal of bacteria and nutrient dynamics within the coral reef framework of Curacao (Netherlands Antilles) Coral Reefs 23 413-422
TRESBP Kirra Reef Marine Biota Monitoring 2015 59
frc environmental
Schlacher-Hoenlinger M Walker S Johnson J Schlacher T amp Hooper J 2009 Biological Monitoring of the Ex-HMAS Brisbane Artificial Reef Phase II - Habitat Values report prepared for Environmental Protection Agency (EPA)
Smith KA 2003 A simple multivariate technique to improve the design of a sampling strategy for age-based fishery monitoring Fisheries Research 64 79-85
Smith S Edwards R Dalton S amp Harrison M 2005 Biological assessment of fish and benthic communities at Palm Beach Bait Reef Gold Coast Queensland report prepared for University of New England
TRESBP 2014 Autum 2009 storms httpwwwtweedsandbypassnswgovauarticles-and-studiesinteresting-itemsautumn-2009-storm updated 4 May 2014 accessed December 2015
TRESBP 2015a Tweed Sand Bypassing Restoring Coastal Sand Drift Improving Boating Access ndash Techinical information httpwwwtweedsandbypassnswgovau__dataassetspdf_file0004552055kir ra-feb-2015pdf acessed December 2015
TRESBP 2015b Waves httpwwwtweedsandbypassnswgovauenvironmental-monitoringcoastal-conditionswaves updated 30 September 2015 accessed December 2015
Umar MJMLJ amp Price IR 1998 Effects of sediment deposition on the seaweed Sargassum on a fringing coral reef Coral Reefs 17 169-177
Underwood AJ amp Kennelly SJ 1990 Ecology of marine algae on rocky shores and subtidal reefs in temperate Australia Hydrobiologia 192 3-20
Walker S Schlacher T amp Schlacher-Hoenlinger M 2007 Spatial heterogeneity of epibenthos on artificial reefs fouling communities in the early stages of colonization on an East Australian shipwreck Marine Ecology 28 435-445
Walker SJ Degnan BM Hooper JNA amp Skilleter GA 2008 Will increased storm intensity from climate change affect biodiversity in non-scleractinian sessile fauna on coral reefs Global Change Biology 14 2755-2770
Warwick RM amp Clarke KR 1993 Increased variability as a symptom of stress in marine communtities Journal of Experimental Marine Biology and Ecology 172 215-216
Thenumberofsitessurveyedhasvariedover timeasaresultof the fluctuating levelof sandcoveringKirraReef
Prior to May 2003 three sites were assessed along the eastern and northern edge of KirraReef(KirraReefOutersites1to3)andthreesiteswereexaminedalongtheinshore marginof the reef (KirraReef Inner sites1 to 3)(MapA1) ReefRedge (ieKirraOuter) siteswerechosentoprovideearlywarningofimpactsfromoffshoreplacementofdredged sandwhilst inshoresites(ieKirraInner)werechosentoindicatewhetherimpactsfrom inshore beach profile development were affecting the reef platform In May 2003 the threeeasternsitesatKirraReef (ieKRO1KRO2andKRI1)werecompletelycovered with bare mobile sand Consequently only the three western sites at Kirra Reef (ie KRO3KRI2andKRI3)supportedbenthicfloraandfaunaInMarch2004theextentof the remainingwesternoutcropof KirraReef had been further reduced so that all inner reefsiteswerecompletelycoveredwithmobilesandConsequentlyonlyasingleoriginal reefsite(ieKRO3)couldbesurveyed(Figure23)Thereforetoprovideanindicationof the condition of the remaining reef two new sites were established (ie KRN1 and KRN2)(Figure23)andsurveyedinMarch2004Theextentofthewesternreefhadbeen further reduced by February 2005 and a third new site (ie KRN3) was established (Figure23)Consequentlyfoursites(KRO3KRN1KRN2andKRN3)weresurveyedin February2005
InFebruary2010fourKirraReefsites(ieKRO3KRO1KRN1andKRN2)wereclearof thesurroundingsandandsupportedbenthic floraand fauna Inaddition several rocks protruded from the sand in the vicinity of site KRI2H these were assessed to provide a quantitativeindicationofbroadRscaletemporalchangestotheinshorereefcommunities
SOURCEScopy Copyright Commonwealth of Australia (Geoscience Australia) 2001 2004 2006copy The State of Queensland (Department of Natural Resources and Mines) 2015copy Nearmap 2014 2015
DATE2015-09-09
DRAWN BYCF
VERSION02
PROJECTIONCoordinate System GDA 1994 MGA Zone 56Projection Transverse MercatorDatum GDA 1994
plusmn SCALE
0 50 100
Metres
Scale 12500 A3
frc environmental
Appendix$B$ Introduction$to$Data$Analysis$Used$
Multivariate$Analyses$
Multivariate statistical techniques are widely used in ecology to assess the similarities relationshipsbetweenassemblagesWhereasunivariateanalysescanonlycompareone variable at a time (eg an index of community structure such as a diversity index or a singleindicatorspecies)multivariateanalysescancomparesamplesbasedontheextent thatassemblagesshareparticulartaxaandabundances(ClarkeampWarwick2001)
Thefirststepofmultivariateanalysisusuallyinvolvesthecreationofamatrixofsimilarity coefficients computed between every pair of samples The coefficient is usually a measureofhowclose theabundance is foreachspecies (definedso that100= total similarity and 0=complete dissimilarity) The Bray Curtis similarity measure is commonlythemostappropriateforbiologicaldata(ClarkeampWarwick2001)
MultidimensionalScaling
NonRmetricmultiRdimensionalscalingordinations(nMDS)attempttoplacesamplesintwo dimensionalspacesothattherankorderofthedistancesbetweensamplesmatchesthe rankorderofthematchingsimilaritiesfromthesimilaritymatrix(ClarkeampWarwick2001) Thisprovidesavisualrepresentationofthesimilaritiesbetweenassemblageswithineach sampleEachoftheaxesisnotrelatedtoanyparticularvalueHinfactaxescanberotated toprovide thebestvisual representationof thedata Ordinationsareparticularlyuseful tools for analysing and visually presenting differences between assemblages Ordinationsareessentiallymapsofsamples inwhich theplacementofsampleson the mapreflectsthesimilarlyofthecommunitytothecommunitiesinothersamples(Clarkeamp Warwick 2001) Distances between samples on an ordination attempt to match the similarities inassemblagestructurenearbypoints representassemblageswithvery few attributes(speciesorabundanceofspecies)Hpoints faraparthavevery fewattributes in common(ClarkeampWarwick2001)
A stress coefficient is calculated to reflect the extent to which the multiRdimensional scalingordinationandthesimilaritymatrixagree(ClarkeampWarwick2001)(iehowwell the multiRdimensional scaling ordination accurately reflects the relationship between samples)Stressvaluesoflt015aregenerallyacceptable
In Figure A1 each freshwater macroinvertebrate sample is represented on the multiRdimensionalscalingordination By lookingat thedistancesbetweeneachsample
ANOSIMisanalogoustoANOVAinunivariatestatistics(Smith2003)AglobalRstatistic iscalculatedtodeterminewhetherthereisasignificantdifferencebetweenallsamplesIf there are differences then pairwise comparisons are conducted to test for differences betweenpairsofsamples(analogoustopostRhoctestsinANOVA)
The R value lies between R1 and +1 (all similarities within groups are less than any similarity between groups) with a value of zero representing the null hypothesis (no differenceamongasetofsamples)(ClarkeampWarwick2001)ComparisonofpairwiseR values can give an indication of how different assemblages are R values close to 0 indicatelittledifferencevaluesaround05indicatesomeoverlapandvaluescloseto1to indicate many or substantial differences In many instances however researches are primarily interestedinwhethertheRvalueisstatisticallydifferentfromzero(usuallyata confidence level of 005) (Clarke amp Warwick 2001) (ie whether they can reject the null hypothesis)
ANOSIM can provide information on whether the (visual) differences between assemblages in the multiRdimensional scaling ordination are significantH it is an independenttestfromthemultiRdimensionalscalingordinationItisbasedontestingthe
TRESBPKirraReefMarineBiotaMonitoring2015 B2
frc environmental
differences between the rank similarities in the similarity matrix not on the distances betweensamplesinthemultiRdimensionalscalingordination(ClarkeampWarwick2001)
PermutationalMultivariateAnalysisofVariance
PERMANOVAisusedtotestsimultaneousresponsesofoneormorevariablestooneor more factors in an a0 priori0 structured design using random permutation of the data to assess significance (Anderson 2004) PERMANOVA generates a pseudo FRstatistic similar to traditional ANOVA but pRvalues are calculated with permutations which does notassumenormaldatadistribution PERMANOVAcanprovide informationonwhether the (visual) differences between assemblages in a multiRdimensional scaling ordination are significantH however it is an independent test from the multiRdimensional scaling ordination
Thelevelofmultivariatedispersionamongsampleswithineachofthetestgroupscanbe examined using the permutational analysis of multivariate dispersions (PERMDISP) routine(Anderson2004)Intraditionalimpactassessmentachangeinthedispersionof datacanalsoindicateanimpact
SimilarityPercentagendashSpeciesContributions
SIMPER analysis provides information on how dissimilar assemblages from various groups are (eg how similar all of the macroinvertebrate samples taken for a particular habitatwithinastreamreachare)andhowsimilareachgroup(egreach)istoanyother group SIMPER analysis also identifies the species taxa that are contributing to the dissimilarity between two assemblages in rank order (ie it identifies which species is contributingthemosttothedifferences)SIMPERanalysismayhelptoidentifypotential lsquoindicatorrsquospeciesForexampleifaparticularspeciesconsistentlycontributesgreatlyto the differences between impacted and unimpacted assemblages it may be a useful indicator Theabundanceofthis indicatorspeciescanthenbecomparedbetweensites usingunivariatetechniquessuchasANOVA
Data is available on request from tresbpprojectofficecrownlandnswgov
TRESBPKirraReefMarineBiotaMonitoring2015 C1
frc environmental
Appendix(D( Pairwise( PERMANOVA( Results
Data is available on request from tresbpprojectofficecrownlandnswgov
TRESBPKirraReefMarineBiotaMonitoring2015 D1
frc environmental
Appendix(E( Relative(Abundance(of(Fish(found(at(Kirra(( ( and(Palm(Beach(Reefs(in(Each(Survey((Data is available on request from tresbpprojectofficecrownlandnswgovau
TRESBPKirraReefMarineBiotaMonitoring2015 E1
Structure Bookmarks
0 50 100 Metres Scale 12500 A3
0 50 100 200 Metres Scale 15000 A3
Kirra Reef
Kirra Reef
Kirra Reef
Kirra Reef
Kirra Reef
Kirra Reef
Map A1Location of Kirra Reef monitoring sites
Table D8 Pairwise comparison of macroalgae cover between sites in each year
Table D15 Pairwise comparison of turf algae cover between sites in each year
Table D29 Pairwise comparison of ascidian cover between sites in each year
Table D43 Pairwise comparison of soft coral cover between sites in each year
frc environmental
32$ Benthic$Algae$
Macroalgae$
In March 2015 as in previous surveys the macroalgae Sargassum sp dominated the benthic assemblages at all sites at Kirra Reef (Figure 37) Other species present included
sdot Dictyopteris0arostichoides0
sdot Dilophus0intermedius00
sdot Zonariasp
sdot Laurencia0brongniartic0
sdot Amphiroa0anceps0
sdot Caulerpa0lentilliferaand
sdot Halimeda0discoideaand
sdot Macrocystissp
Juvenile kelp (from the genus Macrocystis) was also emerging on some areas of Kirra Reef
ThecoverofmacroalagevariedbetweensitesandsurveysatbothKirraReefandPalm Beach Reef with the magnitude of difference varying over time (note the significant interaction between site (location) x survey in Table 32) Macroalgae cover varied between surveys with 2001 being the most different to the other years (Appendix D) ThereweredifferencesbetweensitesatKirraReefinJune1995February1996January 2001 May 2003 February 2005 and February 2010 and between sites at Palm Beach ReefinJanuary2001andFebruary2010Inrecentsurveys(2012to2015)thecoverof macroalgaeatsitesatbothKirraReefandPalmBeachReefwassimilar (AppendixD) indicatingarelativelyconsistentdistributionacrossbothreefs
ThemeancoverofmacroalgaeatKirraReefhasdeclinedsinceitspeakin2001withthe greatest magnitude of decline recorded between January 2001 and May 2003 (Figure 38)InsurveysbetweenJune1995andMay2003Sargassumspformeddensecarpets overtherockysubstratecoveringupto58oftheavailablesurfaceareaofthereefIn February 2010 macroalgal cover was 12 Macroalgal cover has increased to 26 in March2015ThisissimilartothecoverrecordedinApril1995(23cover)(Figure38)
In2015nomacroalgaewasrecordedwithinthequadratsatPalmBeachReefThecover of macroalgae on Palm Beach Reef has been consistently lower than Kirra Reef since
TRESBPKirraReefMarineBiotaMonitoring2015 26
frc environmental
ecologicalmonitoringbegan typically lessthan5of theavailablesurfacearea(Figure 38)
The mean cover of turf algae varied between sites and surveys at both Kirra Reef and PalmBeachReef(notethesignificantinteractionbetweensite(location)xsurveyinTable 33)SpecificallythereweresignificantdifferencesbetweensitesatbothKirraReefand PalmBeachReefinJune1995January2001February2010July2012andApril2014 (aswellasbetweensitesinFebruary1996atKirraReef)Thecoverofturfalgaevaried betweenmostsurveysatallsitesateachreef(AppendixD)BothKirraandPalmBeach reefs showed major increases in the percent cover of turf algae from 2010 to 2012 followedbyadecreaseincoverbetween2012and2014(Figure310)Thecoverofturf algae is typically lower at Kirra Reef than at Palm Beach Reef (July 2012 being an exception) and was again slightly lower at Kirra Reef in March 2015 (Table 310) In March2015turfalgaewasmoreprevalentatKirraReefthanduringthebaselinesurvey ofApril1995
ThemeancoverofspongesatsomesitesatbothKirraReefandPalmBeachReefhas varied significantly during some surveys (note the significant interaction between site (location)xsurvey inTable34HFigure311) However thecoverofspongestendedto bemore temporallyvariable atKirraReef than at Palm Beach Reef (Figure312) The cover of sponges at Kirra Reef varied between sites in February 1996 January 2001 March2004July2012andApril2014 However thecoverofspongesatPalmBeach Reefonlyvariedbetweensites inJanuary2001andFebruary2010 (AppendixD) The cover of sponges varied between survey at each site with 1995 1996 and 2001 most differenttootheryears(AppendixD)
ThemeancoverofspongesatKirraReefdeclinedbetweenMarch2004(20cover)and February 2010 (less than 1 cover) Since 2010 the cover of sponges has increased slightly with sponges covering 8 of the reef in March 2015 (Figure 312) In March 2015thecoverofspongeswashigherthanrecordedduringthebaselinesurveyinApril 1995(3cover)(Figure312)
Figure312 Mean cover of sponges (plusmnSE) at Kirra Reef and Palm Beach Reef on all
surveys
Table34 Univariate PERMANOVA results for differences in the cover of sponges betweensurveysandlocations
Factor$ df$ MS$effect$ PseudoF$ p$(perm)$
survey 10 18576 276 0018
location 1 39671 589 0210
site(location) 4 67354 477 0001
locationxsurvey 10 1490 221 0032
site(location)xsurvey 40 67331 477 0001
error 924 14108
Shadingdenotessignificanceatplt005
TRESBPKirraReefMarineBiotaMonitoring2015 32
frc environmental
Ascidians$
ThemeanabundanceofallascidiansotherthanPyura0stoloniferahasvariedsignifcantly between sites at Kirra Reef and Palm Beach Reef and between surveys at each site (Figure314andnotethesignificantinteractionbetweensite(location)xsurveyinTable 35) The abundance of ascidians was different between sites at Kirra Reef in January 2001May2003March2004February2005andApril2014HanddifferentatPalmBeach ReefinJanuary2001February2005February2010andMarch2015Theabundance ofascidiansvariedbetweensurveysateachsitewith1995beingmostdifferentwhenthe abundanceofascidianswaslow(AppendixD)InMarch2015theabundanceofallother ascidiansonKirraReefandPalmBeachReefwashigherthanpreviouslyreportedinthe baselinesurveyinApril1995(whennoascidianswererecorded)Themeanabundance washigheratKirraReefthanatPalmBeachReef(Figure314)
ThemeanabundanceofPyura0stoloniferahasvariedconsiderablybetweensitesatKirra Reef and Palm Beach Reef over time (note the significant interaction between site (location) x survey in Table 36) In March 2015 the mean abundance (individual per 025m2plusmnSE)of theascidianPstolonifera (Figure313)wassimilaratKirraReefand PalmBeachReef(Figure315)ThemeanabundanceofP0stoloniferahasrangedfrom 02to17individualsper025m2atbothreefssinceMay2003
Figure315 Mean abundance of ascidians (Pyura0 stolonifera) (individuals025m2)
(plusmnSE)atKirraReefandPalmBeachReefinallsurveys
TRESBPKirraReefMarineBiotaMonitoring2015 34
frc environmental
Table35 Univariate PERMANOVA results for the differences in cover of all ascidians otherthanPyura0stolonifera0betweensurveysandlocations
Factor$ df$ MS$effect$ PseudoF$ p$(perm)$
survey 10 26658 474 0001
location 1 13603 710 0104
site(location) 4 19154 149 0212
locationxsurvey 10 2629 468 0001
site(location)xsurvey 40 5621 438 0001
error 924 12828
Shadingdenotessignificanceatplt005
Table36 Univariate PERMANOVA results for the differences in Pyura0 stolonifera densitybetweensurveysandlocations
Factor$ df$ MS$effect$ PseudoF$ p$(perm)$
survey 10 16254 11842 0001
location 1 12445 60881 0206
site(location) 4 20442 56799 0001
locationxsurvey 10 79724 58082 0001
site (location) x 40 13726 38138 0001 survey
error 924 35991
Shadingdenotessignificanceatplt005
$
TRESBPKirraReefMarineBiotaMonitoring2015 35
frc environmental
Hard$Coral$
There was a significant difference between the cover of hard corals at Kirra Reef and PalmBeachReefduringsomesurveys(notethesignificantinteractionbetweenlocationx surveyinTable37)SpecificallytherewassignificantlymorehardcoralatPalmBeach Reef thanKirraReef inFebraury1996March2004April2014andMarch2015(Table 38)
ThecoverofhardcoralistypicallylowonKirraReefaccountingforlessthan2ofthe availablesubstrateInMarch2015hardcoralcoveredlessthan1oftheareaofKirra Reef which was less than the cover recorded during the baseline survey in April 1995 (Figure 316) In contrast hard coral covered 11 of the surface area at Palm Beach ReefwhichwasgreaterthanthecoverrecordedinApril1995(Figure316)
The cover of hard corals at Palm Beach Reef has been more variable over time comparedtothecoverofhardcoralatKirraReef(Figure316)Withtheexceptionofthe surveys inApril1995andJanuary2001when thecoverofhardcoralwas lowonboth reefshardcoralsaretypicallymoreprevalentatPalmBeachReef(Figure316)
Table38 PERMANOVA post hoc pairwise results for the differences in the cover of hardcoralbetweenlocationsineachsurveyevent
Hard$Corals$ Survey$
t$ p$(MC)$a$
Apr1995 054 0606
Jun1995 182 0140
Feb1996 541 0006
Jan2001 R R
May2003 166 0168
Mar2004 765 0001
Feb2005 049 0646
Feb2010 156 0197
Jul2012 283 0053
Apr2014 525 0011
Mar2015 695 0003 Shadingdenotessignificanceatplt005 a pvaluesbasedonMonteCarlotests
TRESBPKirraReefMarineBiotaMonitoring2015 37
60
50
40
30
20
10
0
Soft
Cor
al C
over
()
Kirra Reef Palm Beach Reef
frc environmental
Soft$Coral$
The cover of soft coral was significantly different between sites at both Kirra Reef and PalmBeachReefandduringsomesurveys(notethesignificant interactionbetweensite (location)xsurvey)TherewasnosoftcoralrecordedatKirraReefinMarch2015The coverofsoftcoralhasdeclinedatKirraReefsince2003andhascoveredlessthan2of theavailablesubstratesince2005whichissimilartothecoverofsoftcoraldescribedfor the baseline surveys in 1995 (Figure 317) The cover of soft coral was consistent betweensitesineachsurveyexceptbetweensitesin
sdot April1995atKirraReef
sdot 1996atKirraReef
sdot 2003atPalmBeachReefand
sdot 2014atPalmBeachReef(AppendixD)
Soft corals have historically covered more of the available space on Palm Beach Reef than on Kirra Reef However there was more temporal variability within sites at Palm BeachReefthanatKirraReef(AppendixD)ThecoverofsoftcoralatPalmBeachReef has varied over time and was highest in April 1995 (48 cover) Despite increasing sinceFebruary2005itisstilllowerthanthecoverrecordedduringthebaselinesurveyin April1995(Figure317)
Table39 UnivariatePERMANOVAresults for thedifferences in thecoverofsoft coral betweensurveysandlocations
Factor$ df$ MS$effect$ PseudoF$ p$(perm)$
survey 10 44657 1323 0001
location 1 32922 6620 0117
site(location) 4 49732 266 0036
locationxsurvey 10 40982 1214 0001
site (location) x 40 3376 181 0002 survey
error 924 18688
Shadingdenotessignificanceatplt005
$
TRESBPKirraReefMarineBiotaMonitoring2015 39
frc environmental
Crinoids$
ThereisasignificantdifferencebetweensomesitesatbothKirraReefandParmBeach Reef that varies through time (note the significant interaction between site (location) x survey inTable310) Theabundanceofcrinoidshasbeensimilarbetweensites inall years at Palm Beach ReefH and was different beween sites at Kirra Reef in June 1995 February1996May2003andFebruary2005(AppendixD)Withineachsitetherehas been some natural temporal variability particualrly at Palm Beach Reef sites in 2001 (Appendix D) The mean abundance (individuals 025m2) of crinoids (Figure 318) at KirraReefandPalmBeachReefhasgenerallybeenlessthan2individualsper025m2 andhasdeclinedatboth locationssincethebaselinesurvey inApril1995(Figure319) However the mean abundance of crinoids on Kirra Reef has shown a slight increase sinceFebruary2010(Figure319)
In March 2015 fewer crinoids were recorded at Palm Beach Reef than at Kirra ReefH crinoidshavebeenrareatPalmBeachReefsince2003
The species richness of fish recorded from Kirra Reef across all monitoring events has rangedfrom14to57 InMarch201557specieswereidentifiedat thereefwhichwas similar to April 2014 (53) and higher than previous surveys (Figure 320) Species richnessatPalmBeachReefwas lower(34species)andgenerallyvaried lessbetween surveyscomparedtoKirraReef
InMarch2015 the assemblage of fish at KirraReef comprised species fromall trophic levelsincludingdetritivoresplanktivoresherbivoresandcarnivores(AppendixE)Asin previous surveys the assemblage was dominated by herbivores and planktivores Yellowtail (Trachurus0 novaezelandiae) and striped sea pike (Sphyraena0 obtusata) were the dominant species present in large schools (Figure 321) Australian mado (Atypichthys0 strigatus) ringRtailed surgeon (Acanthurus0 blochii) silver trevally (Pseudocaranx0 georgianus) eastern pomfred (Schuettea0 scalaripinnis) sweep (Scorpis0 lineolatus) and various wrasses were also very abundant releative to other species (AppendixE)
Two new species were observed at Kirra Reef the orangeRband surgeon (Acanthurus0 olivaceus) and the unicornfish (Naso0 sp) Five new species were recorded at Palm BeachReef
No threatened or protected fish species listed under the Queenslandrsquos Nature0 Conservation0Act01992ornationallyundertheEnvironmental0Protection0and0Biodiversity0 Conservation0 Act0 1999 were observed The complete list of species recorded and the relativeabundanceispresentedinAppendixE
TRESBPKirraReefMarineBiotaMonitoring2015 42
60
0
10
20
30
40
50
Num
ber
of F
ish
Spe
cies
Apr-95
Jun-95
Feb-96
Jan-01
May-03
Mar-04
Feb-05
Feb-10
Jul-12
Apr-14
Mar-15
Kirra Reef Palm Beach Reef Location
frc environmental
Figure320 Number of fish species recorded at Kirra Reef and Palm Beach Reef on
ThegreatestchangetotheecologicalconditionofKirraReefsincethebaselinesurveyin 1995 has been the loss of large areas of hard substrate that support benthic flora and faunaThedeliveryoflargesandvolumesduringthestage1dredgingoperations(1995 to1998)andtheinitialoperationofthesandbypasssystem(2001to2008)resultedinan increaseinwaveactionandtidalcurrentsredistributingthissandoverKirraReef
The three major outcrops of Kirra Reef (northern southern and eastern sections) are naturally exposed and covered depending on water and sand movements In March 2015 the rocky outcrops in the northern section of Kirra Reef were exposed and supportedamoderatelydiversebenthicassemblagedominatedbyturfalgaeTherewas arelativelyhighfishdiversityatKirraReefTheecologicalassemblageexhibitedsignsof ongoingstressfromphysicaldisturbanceincludingtheabsenceofsoftcoralsandrarityof hardcoral(MumbyampSteneck2008)HoweverKirraReefhasarelativelyhighcoverof sponges and ascidians Sponges ascidians and crinoids were more abundant at Kirra ReefthanatPalmBeachReefinMarch2015
KirraReefcontinues toprovidehabitatandsupport importantecological functions in the region providing hard substrate for the colonisation of algae and benthic invertebrates and food and refuge for fish As sand levels have stabilised since 2008 assemblages have becomemoresimilar to those recordedprior to implementationof the TRESBP in April1995 Forexamplemacroalgalcover inApril1995andMarch2015wasrelatively similarHoweverassemblagecompositionisstillsignificantlydifferenttothatrecordedin thebaselinesurveysmostnoticeablyduetoa lowercoverofbaresubstrateandhigher coverofturfalgaeandascidianssincesurveyshavebeenperformed
Benthic$Macroalgae$
The cover of macroalgae at Kirra Reef was relatively similar during the 2014 and 2015 surveys and remained well below the peak of nearly 60 cover recorded in January 2001TherewasasteepdeclineinthecoverofmacroalgaebetweenJanuary2001and May2003whichappearedtobestronglyassociatedwith thedecline inreefareaduring that time as well as a decline in the cover of Sargassum sp (an important indicator speciesonKirraReef) SimilardeclineswereevidentatPalmBeachReefbetween the January2001andMay2003surveys
TRESBPKirraReefMarineBiotaMonitoring2015 45
frc environmental
The cover ofmacroalgae at Palm Beach Reef was much lower thanat Kirra Reef over time There are several possible reasons for the lower cover of macroalgae at Palm Beach
sdot PalmBeachReefisdeeperthanKirraReefandgenerallyhashigherturbidityand therefore greater light attenuation The quantity and quality of available light affectsthedistributionandgrowthofmacroalgae(MillerampEtter2008)
sdot Differences in the pattern of recruitment of algal species to the reefs due to differentwatercurrentsandtimingofthesurveys(Kennelly1987b)
sdot Increased competition with turf algae and sessile benthic invertebrates which competeforspacewithmacroalgae(Kennelly1987aHMillerampEtter2008)
sdot PresenceofdifferentspeciesandhigherdensityofherbivoresatPalmBeachReef (particularly sea urchins and herbivorous fish) which graze on macroalgae (McCook1997HJompaampMcCook2002)
Biological assemblages exposed to physical stress typically exhibit greater levels of temporalandspatialvariability(WarwickampClarke1993HChapmanetal1995)Temporal variationinthecoverofmacroalgaeatKirraReefislikelytobeprincipallyduetotheeffect ofphysicaldisturbance fromwaveactionaswellas theassociatedassociatedabrasion andsmotheringbysandTheeffectsofthesephysicaldisturbanceswouldincreasewith thereductionofKirraReefasedgeeffectsarepronouncedandwaterdepth isreduced Increasedsmotheringbysandcanalsoreducediversity(Hatcheretal1989)abundance recruitment growth survival and seasonal regeneration of macroalgae (Umar amp Price 1998HCheshireetal1999)
Changes in the cover of macroalgae on Kirra Reef over time are also likely due to the extentofthereefchangingHthefishandmobileinvertbratesassociatedwiththereefmay have concentrated which would in turn increase grazing pressure Increased grazing pressure from fish and mobile invertebrates can reduce the coverage and diversity of macroalgaeonreefs(McCook1997HJompaampMcCook2002)
Thecoverof turfalgaeatbothKirraReefandPalmBeachReefhasvariedsignificantly betweensurveysPriorto2005turfalgaetypicallycoveredlessoftheavailablesurface areaonKirraReefthanPalmBeachReefInMarch2015themeancoverofturfalgae hasincreasedsincebaselinesurveysin1995andwasrelativelysimilarbetweenreefs(40 plusmn4atKirraReefcomparedto48plusmn4atPalmBeachReef)Thecoverofturfalgaeat Kirra Reef was similar in 2014 and 2015 which was generally higher than previous surveysexceptduringJuly2012whencoverofturfalgaepeakedat67plusmn4
TRESBPKirraReefMarineBiotaMonitoring2015 46
frc environmental
Turfalgaearebecomingadominantcomponentofcommunitiesaroundtheworld likely the result of rapid colonisation of openspace after a disturbance (eg storms) nutrient enrichment andor changes in grazing pressures Turf algae can also reflect a more physically robust growth form suited to high wave energy environments (than foliose macroRalgae)TurfalgaepeakedintheJuly2012surveylikelyrelatedtotheincreasein bare reef exposure following a stormy conditions in early 2009 and between December 2011 and June 2012 Turf algae have been the dominant form of algae on Kirra Reef sincethistimealbeitthecoverlowerthanthe2012survey
Increased cover of turf algae is typically related to good light conditions high concentrationsofnutrientsandlownumbersofgrazerssuchasfish(orconstantgrazing pressure preventing macroalgae colonisation) However the relationship between algal dynamics physical disturbance water quality and herbivore grazing activity is complex andthecoverof turfalgaecanexhibitextremetemporalvariabilityasaconsequenceof the interactionbetween topRdownandbottomRupprocesses (Russ2003HBellwoodetal 2006H Hughes et al 2007H Albert et al 2008H Hoey amp Bellwood 2008H Mumby 2009) Furtherinvestigationwouldberequiredtoreliablydeterminethemechanismsofchangein bothmacroalgaeandturfalgaeassemblagesonthesereefs
Benthic$Macroinvertebrates$
AtKirraReeftheburialandreRemergenceofrockyoutcrops(influencedbytheTRESBP) islikelytohaveincreasedtemporalvariabilityinthedistributionandabundanceofbenthic macroinvertebrates Additional perturbations such as wave action and sand abrasion (each influenced through changes in bathymetry seabed topography and water depth) are likely to have resulted in the decline in cover and diversity of the benthic macroinvertebratesatKirraReefbetweensurveysparticularlybetweenMarch2004and February2005andduringtheseverestormsof2009Benthicmacroinvertebratessuch asascidiansspongeshardcoralandsoftcoralarehighlysusceptible to theeffectsof stormandwavedisturbancephysicalabrasionandburialbysand(KayampKeough1981H Walker et al 2008) which can affect settlement growth rate and survival (Dodge amp Vaisnys1977HRogers1990)
Physical disturbance from sand burial sand abrasion and the action of storm waves appeartokeepthebenthicassemblagesofKirraReefinastateofearlysuccessionItis commonforearlypioneerspeciessuchassomemacroalgaetorecruitrapidlytoahard surface in large numbers allowing these species to dominate assemblages early in the successionaltrajectory(Walkeretal2007)
Afurther indicatorof theearlystateofsuccessionatKirraReef isthatthecoverofhard and soft coral has remained very low (generally lt 5) In March 2015 less than 1
Benthic macroinvertebrate cover may also be affected indirectly through increased competitionwithmacroalgaeforspaceThepresenceoflargemacroalgaecanaffectthe recruitment and survival of sessile benthic invertebrates as fronds moving with wave action sweep and abrade the surface of rocks killing new recruits especially corals (Kennelly1989HMcCooketal2001)Itcantakeseveralyearsforhardandsoftcoralto become dominant on reefs in the SEQ region (SchlacherRHoenlinger et al 2009) Therefore hard coral is not expected to become abundant until several years after the reefhasbeenuncoveredandonlyifthephysicaldisturbanceregimeandsupplyofnew recruitsissufficienttosupportsurvivalandgenerationalsuccessionofthesespeciesThe coverofhardandsoftcoralsatKirraReefwerebothverylowandpatchypriortothestart oftheTRESBP
Sponges and ascidians are highly susceptible to smothering and sand abrasion unless theyhaveathicktunic(outercoveringmadeofkeratin)liketheascidianP0stolonifera0or strong internal keratin silicon or calcareous structures in the case of some species of sponges0(KayampKeough1981HMcGuinness1987HWalkeretal2008)Duetoincreased wave action and sedimentation (which can be influenced by the TRESBP) the mean coverofascidiansandspongeswasexpectedtobemuchloweronKirraReefthanPalm Beach Reef However in March 2015 the cover of sponges was similar between the reefsandthecoverofascidians(otherthanP0stolonifera)wasgreateratKirraReefthan at Palm Beach Reef This suggests that Kirra Reef is slowly recovering from the increasedstressofphysicaldisturbancesuchas increasedwaveactionandsandscour andorthatwaveandstormconditionshavebeenlesssevereinthepastfewyears
Fish$
KirraReefcontinuestosupportahighdiversityofreefRassociatedandpelagic(ienonR reefassociated) fishspecies Despite itsdiminishedsizecompared to1995KirraReef continuestoprovidevaluablehabitatforanumberoffishspeciesfromdifferentfunctional groups
ThereisahighdegreeofinterRannualvariabilityinthespeciesandabundanceofthefish present at Kirra Reef compared with the assemblage at Palm Beach Reef This likely reflectsthetemporalvariabilityintheavailablehabitatasaconsequenceofreefburialand reRemergenceThediversityqualityandarealextentofreefhabitatareimportantfactors influencing the distribution abundance biomass and diversity of reef fish (Bellwood amp Hughes2001HFriedlanderetal2003)Diversityandabundanceoffishcanincreasewith
TRESBPKirraReefMarineBiotaMonitoring2015 48
frc environmental
greaterstructuralcomplexityandincreasedheterogeneityofavailablehabitats(Bellwood ampHughes2001)Thissuggeststhatperiodsofreefburialreducetheoveralldiversityof reefRassociated fish species at Kirra Reef Despite the reduction in overall reef space therewasalargervarietyofhabitats(suchasmarcoalgaeandturfalgae)in2015which was likely to be related to the high diversity of fish assemblages This is particularly importantforseveralspeciesthatdependonthepresenceoflsquostructurersquosuchasprovided by reef habitat (ie oldwife moray eels damselfish and Australian mado that were recordedinMarch2015butwerenotrecordedinJuly2012)
Theabundanceanddiversityof fishare likelytobenegativelyaffectedfollowingperiods of severe weather which create unfavourable conditions for many species and may further exacerbate the affects of abrasion and sedimentation The biomass of fish is knowntodecreasewithincreasingexposuretophysicaldisturbancefromwaveactionand strong currents (Friedlander et al 2003) As our surveys have been undertaken at different times of the year variation in the prevailing conditions at the time of sampling could also influence the types of fish observed (and the amount of reef habitat that is availableatanytime)Manyofthespeciesmayalsobeaffectedbyseasonalchangesin the water temperature such as damselfish which are less abundant in cool waters However theoveralldiversityof the fishassemblageatKirraReef is likely toreflect the sizeoftheoutcropsexposedwithagreaterphysicaldisturbance(fromseaconditionsand sandmovement)andcompetitionHandlesserfoodavailablewhenthereefiscovered
ThepredictedimpactstoKirraReefasaresultoftheTRESBPincludedaccretionofsand around the base of the rock outcrops causing a reduction in extent of reef It was predictedthatsanddeliveryaspartoftheprojectwouldeventuallymimiclsquonaturalrsquopatterns ofsanddispersalandthatthereefwouldreturntoitsnaturalextent(ietheextentpriorto extension of the Tweed River training walls in 1962) The benthic flora and fauna assemblages of the reef the historical reef extent and natural sand transport patterns wereexpectedtoreturntoconditionsobservedbeforetheextensionofthetrainingwalls between 1962 and 1965 However the Environmental Impact Study did not predict the ecologicalconsequencesofboththereducedarealextentandincreasedwaveenergy(a consequenceofdecreaseddepth)thathavebeenrecorded
ThecurrentextentofKirraReef remains less than50of that recorded in1962and in 1995beforethesanddeliverybytheTRESBPcommencedHowevertheextentofreef in1995 wasstrongly influenced by adepletion in sand following the construction of the Tweed River training walls and the Kirra Point groyne Accumulation of sand on Kirra ReefwasobservedtoincreaseasaresultofindirectsandnourishmentbytheTRESBP and the reef has been extensively covered (particuarly between 2005 and 2010) as a result
Whiletheextentofthereefcontinuestochangeovertimethedeliveryofsandaspartof the project now more closely matches the natural rate of longshore sand transport ShortRtermandseasonalchangesintheextentofthereefarenowlikelytobetheresultof waveandcurrentaction(particularlyduringservereweatherevents)thanadirectimpact of the TRESBP Therefore the extent of Kirra Reef in March 2015 is broadly in accordancewithpredictionsmadeintheEISwhichpredictedthatthereefwouldreturnto a condition similar to that exhibited in the preR1960rsquos ie before the extension of the TweedRiverbreakwatersthatinterruptedlittoralsandsupplytothesebeaches
InDecember2013KirraPointgroynewasextendedby30mwiththeexpectationthatthe beach bar would move seaward as a consequence At present Kirra Point groyne is unlikelytohavehadamajorimpactonthearealextentofKirraReefHoweverongoing monitoringbasedonaerialphotographsmayprovidefurtherinsight
Sessile benthic assemblages on Kirra Reef are highly susceptible to the influence of storms and associated wave action (Kay amp Keough 1981H Walker et al 2008) The shallowreefissurroundedbymobilesandwhichcanshiftnaturallyinresponsetowave action during storms causing burial of large sections of Kirra Reef This effect has reduced the availability of rocky substrate for colonisation and the availability of refuge
Fromanexaminationof theextentofKirraReef fromarealmapsandwaveheightdata thereappears tobea relationshipbetween theareaof rockexposedandstormevents Notably in a series of storm events in May 2009 corresponds with large areas of rock becoming exposed (with the reef approximately 100m2 in 2006 and approximately in 1009m2 2009) Further a stormy conditions between December 2011 and July 2012 correspondstotheareaofexposedrockmorethandoublinginsizeWhiletherewasno changetothetotalareaofexposedrockfollowingstormyconditionsinearly2013there wasaclearchangeinthedistibutionofexposedrockduringthistimeSince2013storm conditions have been calm to moderate and there has been little change in the areal extentanddistrubtionofexposedrockatKirraReef
WaveheighttypicallyincreasesduringstormeventsandgiventheshallowdepthofKirra Reef waves are more likely to shoal and break across the reef during storms This increases thephysicaldisturbanceabrasionandsedimentationofbenthicassemblages onKirraReefStormdisturbancecancauselocalreductionsinthespeciesrichnessand abundanceofcoral(Woodleyetal1981HMasselampDone1993HHughes1994HConnellet al 1997) and can alter fish assemblages indirectly through habitat modifications (Kaufman1983HJonesampSyms1998)ordirectlybyincreasingfishmortality(Lassig1983) The hydrodynamic forces produced by wave action are an important source of disturbance in subtidal habitats inflicting damage through direct physical impact and abrasion(UnderwoodampKennelly1990)DirectimpactsfromphysicaldisturbanceatKirra Reefareevidentduringsurveyeventswhenlargefragmentsofmacroalgaearepresentin thewatercolumnoverthereef
Storm and wave action (and associated sedimentation and abrasion) continue to be importantforcesshapingthedistributionandabundanceofbenthicspeciesatKirraReef Increased magnitude and frequency of physical disturbance resulting from increased exposureorsusceptibility tostormsandassociatedwaveaction (asonKirraReef)can lead to a decrease in the diversity of sessile invertebrate assemblages DisturbanceR drivenreductionsinbiodiversityhavethepotentialtoimpactnegativelyonthehealthand productivity of reef ecosystems (Walker et al 2008) Biodiversity is important to reef health given that many of these species (eg sponges bryozoans and ascidians) contribute a range of vital ecosystem services to reefs including nutrient cycling (Scheffers et al 2004) trophic interactions and food webs (Lesser 2006H Pawlik et al 2007) bioRerosion (Rutzler 2002H LopezRVictoria et al 2006) and stabilizing substrata (DiazampRutzler2001HWulff2001)
Theimpactsof increasedwaveactionandsedimentationonthebenthicassemblagesat Kirra Reef are likely to be greatest during and immediately following storm conditions
TRESBPKirraReefMarineBiotaMonitoring2015 51
frc environmental
Partitioningtheinfluenceofstormandwavedrivendisturbancefromthatoftheoperation oftheTRESBPwouldrequireamuchmorestatisticallypowerfulandtemporilyreplicated experimental design Given there is a large collection of wave and storm data by TRESBP this would involve greater temporal sampling of Kirra Reef including event samplingfollowingseverewaveandstormactivity
The data generated by this Kirra Reef biota monitoring program doesnrsquot support statistically rigorous consideration of seasonality (monitoring has been at its most frequentannual)
InApril2014andMarch2015KirraReefcoveredlessthan50ofthereefrsquosextentprior to theoperationof theTRESBP The lossof reefhabitathasreducedtheavailabilityof hard substratum available for colonisation and consequently the abundance of benthic sessileassemblages
The reduced depth of water resulting from the accumulation of sand exacerbates the effects of storms and wave action It is likley that as a consequnece the biological communities of Kirra Reef will reflect earlyRstage succession more frequently and for longerperiods
While there is sufficient structure available frcenvironmentalexpect that Kirra Reef will continuetoprovideimportanthabitatforadiverseassemblageoffishes
TRESBPKirraReefMarineBiotaMonitoring2015 52
frc environmental
5$ Conclusions$
Although there is still a substantial portion of the reef covered compared to before the extension of the Tweed River entrance breakwaters the current extent of Kirra Reef is broadly inaccordancewithpredictionsmadein theEIS Initial lsquocatchRuprsquobypassingand dredgeplacementofsand(between2001and2008)resulted in theburialofKirraReef Subsequentsanddelivery(since2008onwards)morecloselyreflectsnaturalpatternsof longRshoresandtransportandisthereefhasslowlyreRemerged
Theextentofthereefhasbeenrelativelystablesince2013Thishasallowedforsome succession in the benthic assemblages including a relatively high cover of sponges ascidiansandcrinoidsWiththedeliveryofsandmorecloselymatchingthenaturalrateit isexpected the reef willundergoshortRtermchanges in extentdue toseasonal shifts in sand deliveryH however the diversity of benthic assemblages on Kirra Reef is likely to increaseovertimeThiswouldcreatemorespaceforspeciestorecruitandreducesthe influence of sand abrasion and wave damage It was predicted that the areas of Kirra Reef newly exposed in 2012 would undergo a shift from turfRdominated communities to more diverse communities that could include macroalgae sponges ascidians and potentiallyhardandsoftcoralWiththeexceptionofhardandsoftcoralsthisprediction wasconfirmedbytheresultsoftheApril2014andMarch2015surveys
ThediversityoffishesassociatedwithKirraReefisbroadlysimilartothatrecordedprior tothecommencementofsandbypassingin1995Giventhatfisharemobilethegreatest impacts on fish assemblages are likely to be shortRterm changes due to both the prevailingconditionsandchangestheextentofavailablehabitatthatprovidesshelterand foodforavarietyofdifferentspeciesIfKirraReefincreasesinsizethereislikelytobea greater proportion of cryptic benthic species as these species are more typical of assemblagesinalaterstageofsuccession(eg(WillisampAnderson2003))
Assuming a broadly stable delivery rate of sand and consequent stable extent of Kirra ReeflsquorecoveryrsquoislikleytobesubstantivelycompleteFloralandfaunalcommunitieswill undergo succession between severe storm events but are likley to remain relatively dynamic
Albert S Udy J amp Tibbetts I 2008 Responses of algal communities to gradients in herbivorebiomassandwaterqualityinMarovoLagoonSolomonIslandsCoral0 Reefs2773R82
Anderson MJ 2001 A new method for nonRparametric multivariate analysis of varianceAustral0Ecology2632R46
Anderson MJ 2004 PERMDISP0 a0 FORTRAN0 computer0 program0 for0 permutatinoal0 analysis0 of0 multivariate0 dispersions0 (for0 any0 twoSfactor0 ANOVA0 design)0 using0 permutational0 tests Department of Statistics University of Auckland New Zealand
Cannon LR Goeden GB amp Campbell P 1987 Community patterns revealed by trawling in the interRreef regions of the Great Barrier Reef Memoirs0 of0 the0 Queensland0Museum2545R70
Chapman MG Underwood AJ amp Skilleter GA 1995 Variability at different spatial scalesbetweenasubtidalassemblageexposedtothedischargeofsewageand two control assemblages Journal0 of0 Experimental0 Biology0 and0 Ecology 189 103R122
Cheshire AC Miller DJ amp Stewart R (1999) Effect0 of0 dispersed0 sediment0 plumes0 from0beach0sand0replenishment0dredging0on0recruitment0of0phaeophycean0algae0 to0rocky0reefs0in0Gulf0St0Vincent0South0Australia0The0Impact0of0Sand0Dredging0 on0 Benthic0 Community0 Structure0 at0 the0 Port0 Stanvac0 Dredge0 Site0 20 1S39 UniversityofAdelaideAdelaide
ConnellJHHughesTPampWallaceCC1997A30Ryearstudyofcoralabundance recruitment and disturbance at several scales in space and time Ecological0 Monographs67461R488
Diaz MC amp Rutzler K 2001 Sponges an essential component of Caribbean coral reefsBulletin0of0Marine0Science69535R546
DodgeREampVaisnysJR1977Coralpopulationsandgrowthpatternsresponsesto sedimentation and turbidity associated with dredging Journal0 of0 Marine0 Research35715R730
Done TJ 1982 Patterns in the distribution of coral communities across the central GreatBarrierReefCoral0Reefs195R107
Edwards RA amp Smith DA 2005 Subtidal assemblages associated with a geotextile reef insouthReastQueenslandAustraliaMarine0and0Freshwater0Research56 133R142
FisheriesResearchConsultants1991Survey0of0the0Intertidal0and0Subtidal0Rocky0Reefs0 of0 the0 Sunshine0 Coast report prepared for Queensland National Parks and WildlifeService
HarrisonPHarriotVBanksSampHolmesN1998ThecoralcommunitiesofFlinders Reef andMyora Reef in theMoretonBay MarineParkQueensland Australia In Moreton0 Bay0 and0 Catchment Tibbits I Hall N amp Dennison W (Eds) SchoolofMarineScienceUniversityofQueenslandStLuciapp525R536
Hatcher B Johannes R amp Robertson A 1989 Review of research relevant to the conservationofshallowtropicalmarineecosystemsOceanography0and0Marine0 Biology0an0Annual0Review27337R414
Hoey A amp Bellwood D 2008 CrossRshelf variation in the role of parrotfishes on the GreatBarrierReefCoral0Reefs37R47
TRESBPKirraReefMarineBiotaMonitoring2015 56
frc environmental
Hollingsworth P 1975 Environmental Investigation Report Crown Reserve R R68 Currumbin Creek City of the Gold Coast Land Administration Commission unpublishedreport
Hughes TP 1994 Catastrophes phase shifts and large scale degradation of a CaribbeancoralreefScience2651547R1551
Hughes TP Rodrigues MJ Bellwood DR Ceccarelli D HoeghRGuldberg O McCook L Moltschaniwskvi N Pratchett MS Steneck RS amp Willis B 2007Phaseshiftsherbivoryandtheresilienceofcoralreefstoclimatechange Current0Biology17360R365
Hutchinson A Rempel C Taveras V Loder J amp Salmond J 2013 Reef0 Check0 Australia0 South0 East0 Queensland0 Summary0 Report0 2013 report prepared for ReefCheckFoundationLimited
Hyder Consulting 1997 Tweed0 River0 Entrance0 Sand0 Bypassing0 Project0 Permanent0 Bypassing0 System0 0 Environmental0 Impact0 Statement0 0 Impact0 Assessment0 Study report prepared for New South Wales Department of Land and Water Conservation
Jompa J amp McCook LJ 2002 Effects of competition and herbivory on interactions betweenahardcoralandabrownalgaJournal0of0Experimental0Marine0Biology0 and0Ecology27125R39
KayAMampKeoughMJ1981Occupationofpatchesintheepifaunalcommunitieson pier pilings and the bivalve Pinna bicolor at Edithburgh South Australia Oecologia48123R130
KennellyS1987aInhibitionofkelprecruitmentbyturfingalgaeandconsequencesfor an Australian kelp community Journal0 of0 Experimental0 Marine0 Biology0 and0 Ecology11249R60
Kennelly S 1987b Physical disturbances in an Australian kelp community I temporal effectsMarine0Ecology0Progress0Series40145R153
TRESBPKirraReefMarineBiotaMonitoring2015 57
frc environmental
Kennelly S 1989 Effects of kelp canopies on understory species due to shade and scourMarine0Ecology0Progress0Series50215R224
Lassig BR 1983 The effects of a cyclonic storm on coral reef fish assemblages Environmental0Biology0of0Fishes955R63
Lawson S McMahon J amp Boswood P 2001 Environmental management of the construction and operation of a sand bypassing system at the Tweed River EntranceInThe15thAustralasianCoastalandOceanEngineeringConference the 8th Australasian Port and Harbour Conference 25 R 28 September 2001 QueenslandAustralia
Lesser MP 2006 BenthicRpelagic coupling on coral reefs feeding and growth of Caribbean sponges Journal0 of0 Experimental0 Marine0 Biology0 amp0 Ecology 328 277R288
LopezRVictoriaM ZeaSampWei E2006 Competition for spacebetweenencrusting excavatingCaribbeanspongesandothercoral reeforganismsMarine0Ecology0 Progress0Series312113R121
MalcolmHASmithSDAampJordanA2009Usingpatternsofreeffishassemblages to refine a Habitat Classification System for marine parks in NSW Australia Aquatic0Conservation0Marine0and0Freshwater0Ecosystems2083R92
Massel SR amp Done TJ 1993 Effects of cyclone waves on massive coral assemblages on the Great Barrier Reef meteorology hydrodynamics and demographyCoral0Reefs12153R166
Mumby PJ amp Steneck RS 2008 Coral reef management and conservation in light of rapidly evolving ecological paradigms Trends in Ecology amp Evoution 23 555 -563
Murphy HM amp Jenkins GP 2010 Observational methods used in marine spatial monitoring of fishes and associated habitats a review Marine and Freshwater Research 61 236-252
Noriega R 2007 An Overview of Available Information on Sandy Beach Ecology Coastal Sand Dunes Rocky Reefs and Associated Biota on the Gold Coast Griffith Centre for Coastal Management Research Report No 85 report prepared for Griffith University
Parker P (1995) Structure to Reef Fish Assemblages at Julian Rocks Northern New South Wales Masters Thesis Griffith University
Parker PG 1999 Fish assemblages at Julian Rocks and the adjacent waters of northern New South Wales Australia Australian Zoologist 31 134 - 160
Pawlik JR Steindler L Henkel TP Beer S amp Ilan M 2007 Chemical warfare on coral reefs sponge metabolites differentially affect coral symbiosis in situ Limnology and Oceanography 52 907-911
Reef Check 2010 httpwwwreefcheckaustraliaorgdatahtml accessed December 2015
Robinson KI amp Pollard DA 1982 Marine and estuarine reserves in Australia with particular reference to New South Wales Wetlands 2 17 - 26
Rogers CS 1990 Responses of coral reefs and reef organisms to sedimentation Marine Ecology Progress Series 62 185-202
Russ GR 2003 Grazer biomass correlates more strongly with production than with biomass of algal turfs on a coral reef Coral Reefs 22 63-67
Rutzler K 2002 Impact of crustose clionid sponges on Caribbean reef corals Acta Geologica Hispanica 37 61-72
Scheffers SR Nieuwland G Bak RPM amp van Duyl FC 2004 Removal of bacteria and nutrient dynamics within the coral reef framework of Curacao (Netherlands Antilles) Coral Reefs 23 413-422
TRESBP Kirra Reef Marine Biota Monitoring 2015 59
frc environmental
Schlacher-Hoenlinger M Walker S Johnson J Schlacher T amp Hooper J 2009 Biological Monitoring of the Ex-HMAS Brisbane Artificial Reef Phase II - Habitat Values report prepared for Environmental Protection Agency (EPA)
Smith KA 2003 A simple multivariate technique to improve the design of a sampling strategy for age-based fishery monitoring Fisheries Research 64 79-85
Smith S Edwards R Dalton S amp Harrison M 2005 Biological assessment of fish and benthic communities at Palm Beach Bait Reef Gold Coast Queensland report prepared for University of New England
TRESBP 2014 Autum 2009 storms httpwwwtweedsandbypassnswgovauarticles-and-studiesinteresting-itemsautumn-2009-storm updated 4 May 2014 accessed December 2015
TRESBP 2015a Tweed Sand Bypassing Restoring Coastal Sand Drift Improving Boating Access ndash Techinical information httpwwwtweedsandbypassnswgovau__dataassetspdf_file0004552055kir ra-feb-2015pdf acessed December 2015
TRESBP 2015b Waves httpwwwtweedsandbypassnswgovauenvironmental-monitoringcoastal-conditionswaves updated 30 September 2015 accessed December 2015
Umar MJMLJ amp Price IR 1998 Effects of sediment deposition on the seaweed Sargassum on a fringing coral reef Coral Reefs 17 169-177
Underwood AJ amp Kennelly SJ 1990 Ecology of marine algae on rocky shores and subtidal reefs in temperate Australia Hydrobiologia 192 3-20
Walker S Schlacher T amp Schlacher-Hoenlinger M 2007 Spatial heterogeneity of epibenthos on artificial reefs fouling communities in the early stages of colonization on an East Australian shipwreck Marine Ecology 28 435-445
Walker SJ Degnan BM Hooper JNA amp Skilleter GA 2008 Will increased storm intensity from climate change affect biodiversity in non-scleractinian sessile fauna on coral reefs Global Change Biology 14 2755-2770
Warwick RM amp Clarke KR 1993 Increased variability as a symptom of stress in marine communtities Journal of Experimental Marine Biology and Ecology 172 215-216
Thenumberofsitessurveyedhasvariedover timeasaresultof the fluctuating levelof sandcoveringKirraReef
Prior to May 2003 three sites were assessed along the eastern and northern edge of KirraReef(KirraReefOutersites1to3)andthreesiteswereexaminedalongtheinshore marginof the reef (KirraReef Inner sites1 to 3)(MapA1) ReefRedge (ieKirraOuter) siteswerechosentoprovideearlywarningofimpactsfromoffshoreplacementofdredged sandwhilst inshoresites(ieKirraInner)werechosentoindicatewhetherimpactsfrom inshore beach profile development were affecting the reef platform In May 2003 the threeeasternsitesatKirraReef (ieKRO1KRO2andKRI1)werecompletelycovered with bare mobile sand Consequently only the three western sites at Kirra Reef (ie KRO3KRI2andKRI3)supportedbenthicfloraandfaunaInMarch2004theextentof the remainingwesternoutcropof KirraReef had been further reduced so that all inner reefsiteswerecompletelycoveredwithmobilesandConsequentlyonlyasingleoriginal reefsite(ieKRO3)couldbesurveyed(Figure23)Thereforetoprovideanindicationof the condition of the remaining reef two new sites were established (ie KRN1 and KRN2)(Figure23)andsurveyedinMarch2004Theextentofthewesternreefhadbeen further reduced by February 2005 and a third new site (ie KRN3) was established (Figure23)Consequentlyfoursites(KRO3KRN1KRN2andKRN3)weresurveyedin February2005
InFebruary2010fourKirraReefsites(ieKRO3KRO1KRN1andKRN2)wereclearof thesurroundingsandandsupportedbenthic floraand fauna Inaddition several rocks protruded from the sand in the vicinity of site KRI2H these were assessed to provide a quantitativeindicationofbroadRscaletemporalchangestotheinshorereefcommunities
SOURCEScopy Copyright Commonwealth of Australia (Geoscience Australia) 2001 2004 2006copy The State of Queensland (Department of Natural Resources and Mines) 2015copy Nearmap 2014 2015
DATE2015-09-09
DRAWN BYCF
VERSION02
PROJECTIONCoordinate System GDA 1994 MGA Zone 56Projection Transverse MercatorDatum GDA 1994
plusmn SCALE
0 50 100
Metres
Scale 12500 A3
frc environmental
Appendix$B$ Introduction$to$Data$Analysis$Used$
Multivariate$Analyses$
Multivariate statistical techniques are widely used in ecology to assess the similarities relationshipsbetweenassemblagesWhereasunivariateanalysescanonlycompareone variable at a time (eg an index of community structure such as a diversity index or a singleindicatorspecies)multivariateanalysescancomparesamplesbasedontheextent thatassemblagesshareparticulartaxaandabundances(ClarkeampWarwick2001)
Thefirststepofmultivariateanalysisusuallyinvolvesthecreationofamatrixofsimilarity coefficients computed between every pair of samples The coefficient is usually a measureofhowclose theabundance is foreachspecies (definedso that100= total similarity and 0=complete dissimilarity) The Bray Curtis similarity measure is commonlythemostappropriateforbiologicaldata(ClarkeampWarwick2001)
MultidimensionalScaling
NonRmetricmultiRdimensionalscalingordinations(nMDS)attempttoplacesamplesintwo dimensionalspacesothattherankorderofthedistancesbetweensamplesmatchesthe rankorderofthematchingsimilaritiesfromthesimilaritymatrix(ClarkeampWarwick2001) Thisprovidesavisualrepresentationofthesimilaritiesbetweenassemblageswithineach sampleEachoftheaxesisnotrelatedtoanyparticularvalueHinfactaxescanberotated toprovide thebestvisual representationof thedata Ordinationsareparticularlyuseful tools for analysing and visually presenting differences between assemblages Ordinationsareessentiallymapsofsamples inwhich theplacementofsampleson the mapreflectsthesimilarlyofthecommunitytothecommunitiesinothersamples(Clarkeamp Warwick 2001) Distances between samples on an ordination attempt to match the similarities inassemblagestructurenearbypoints representassemblageswithvery few attributes(speciesorabundanceofspecies)Hpoints faraparthavevery fewattributes in common(ClarkeampWarwick2001)
A stress coefficient is calculated to reflect the extent to which the multiRdimensional scalingordinationandthesimilaritymatrixagree(ClarkeampWarwick2001)(iehowwell the multiRdimensional scaling ordination accurately reflects the relationship between samples)Stressvaluesoflt015aregenerallyacceptable
In Figure A1 each freshwater macroinvertebrate sample is represented on the multiRdimensionalscalingordination By lookingat thedistancesbetweeneachsample
ANOSIMisanalogoustoANOVAinunivariatestatistics(Smith2003)AglobalRstatistic iscalculatedtodeterminewhetherthereisasignificantdifferencebetweenallsamplesIf there are differences then pairwise comparisons are conducted to test for differences betweenpairsofsamples(analogoustopostRhoctestsinANOVA)
The R value lies between R1 and +1 (all similarities within groups are less than any similarity between groups) with a value of zero representing the null hypothesis (no differenceamongasetofsamples)(ClarkeampWarwick2001)ComparisonofpairwiseR values can give an indication of how different assemblages are R values close to 0 indicatelittledifferencevaluesaround05indicatesomeoverlapandvaluescloseto1to indicate many or substantial differences In many instances however researches are primarily interestedinwhethertheRvalueisstatisticallydifferentfromzero(usuallyata confidence level of 005) (Clarke amp Warwick 2001) (ie whether they can reject the null hypothesis)
ANOSIM can provide information on whether the (visual) differences between assemblages in the multiRdimensional scaling ordination are significantH it is an independenttestfromthemultiRdimensionalscalingordinationItisbasedontestingthe
TRESBPKirraReefMarineBiotaMonitoring2015 B2
frc environmental
differences between the rank similarities in the similarity matrix not on the distances betweensamplesinthemultiRdimensionalscalingordination(ClarkeampWarwick2001)
PermutationalMultivariateAnalysisofVariance
PERMANOVAisusedtotestsimultaneousresponsesofoneormorevariablestooneor more factors in an a0 priori0 structured design using random permutation of the data to assess significance (Anderson 2004) PERMANOVA generates a pseudo FRstatistic similar to traditional ANOVA but pRvalues are calculated with permutations which does notassumenormaldatadistribution PERMANOVAcanprovide informationonwhether the (visual) differences between assemblages in a multiRdimensional scaling ordination are significantH however it is an independent test from the multiRdimensional scaling ordination
Thelevelofmultivariatedispersionamongsampleswithineachofthetestgroupscanbe examined using the permutational analysis of multivariate dispersions (PERMDISP) routine(Anderson2004)Intraditionalimpactassessmentachangeinthedispersionof datacanalsoindicateanimpact
SimilarityPercentagendashSpeciesContributions
SIMPER analysis provides information on how dissimilar assemblages from various groups are (eg how similar all of the macroinvertebrate samples taken for a particular habitatwithinastreamreachare)andhowsimilareachgroup(egreach)istoanyother group SIMPER analysis also identifies the species taxa that are contributing to the dissimilarity between two assemblages in rank order (ie it identifies which species is contributingthemosttothedifferences)SIMPERanalysismayhelptoidentifypotential lsquoindicatorrsquospeciesForexampleifaparticularspeciesconsistentlycontributesgreatlyto the differences between impacted and unimpacted assemblages it may be a useful indicator Theabundanceofthis indicatorspeciescanthenbecomparedbetweensites usingunivariatetechniquessuchasANOVA
Data is available on request from tresbpprojectofficecrownlandnswgov
TRESBPKirraReefMarineBiotaMonitoring2015 C1
frc environmental
Appendix(D( Pairwise( PERMANOVA( Results
Data is available on request from tresbpprojectofficecrownlandnswgov
TRESBPKirraReefMarineBiotaMonitoring2015 D1
frc environmental
Appendix(E( Relative(Abundance(of(Fish(found(at(Kirra(( ( and(Palm(Beach(Reefs(in(Each(Survey((Data is available on request from tresbpprojectofficecrownlandnswgovau
TRESBPKirraReefMarineBiotaMonitoring2015 E1
Structure Bookmarks
0 50 100 Metres Scale 12500 A3
0 50 100 200 Metres Scale 15000 A3
Kirra Reef
Kirra Reef
Kirra Reef
Kirra Reef
Kirra Reef
Kirra Reef
Map A1Location of Kirra Reef monitoring sites
Table D8 Pairwise comparison of macroalgae cover between sites in each year
Table D15 Pairwise comparison of turf algae cover between sites in each year
Table D29 Pairwise comparison of ascidian cover between sites in each year
Table D43 Pairwise comparison of soft coral cover between sites in each year
frc environmental
ecologicalmonitoringbegan typically lessthan5of theavailablesurfacearea(Figure 38)
The mean cover of turf algae varied between sites and surveys at both Kirra Reef and PalmBeachReef(notethesignificantinteractionbetweensite(location)xsurveyinTable 33)SpecificallythereweresignificantdifferencesbetweensitesatbothKirraReefand PalmBeachReefinJune1995January2001February2010July2012andApril2014 (aswellasbetweensitesinFebruary1996atKirraReef)Thecoverofturfalgaevaried betweenmostsurveysatallsitesateachreef(AppendixD)BothKirraandPalmBeach reefs showed major increases in the percent cover of turf algae from 2010 to 2012 followedbyadecreaseincoverbetween2012and2014(Figure310)Thecoverofturf algae is typically lower at Kirra Reef than at Palm Beach Reef (July 2012 being an exception) and was again slightly lower at Kirra Reef in March 2015 (Table 310) In March2015turfalgaewasmoreprevalentatKirraReefthanduringthebaselinesurvey ofApril1995
ThemeancoverofspongesatsomesitesatbothKirraReefandPalmBeachReefhas varied significantly during some surveys (note the significant interaction between site (location)xsurvey inTable34HFigure311) However thecoverofspongestendedto bemore temporallyvariable atKirraReef than at Palm Beach Reef (Figure312) The cover of sponges at Kirra Reef varied between sites in February 1996 January 2001 March2004July2012andApril2014 However thecoverofspongesatPalmBeach Reefonlyvariedbetweensites inJanuary2001andFebruary2010 (AppendixD) The cover of sponges varied between survey at each site with 1995 1996 and 2001 most differenttootheryears(AppendixD)
ThemeancoverofspongesatKirraReefdeclinedbetweenMarch2004(20cover)and February 2010 (less than 1 cover) Since 2010 the cover of sponges has increased slightly with sponges covering 8 of the reef in March 2015 (Figure 312) In March 2015thecoverofspongeswashigherthanrecordedduringthebaselinesurveyinApril 1995(3cover)(Figure312)
Figure312 Mean cover of sponges (plusmnSE) at Kirra Reef and Palm Beach Reef on all
surveys
Table34 Univariate PERMANOVA results for differences in the cover of sponges betweensurveysandlocations
Factor$ df$ MS$effect$ PseudoF$ p$(perm)$
survey 10 18576 276 0018
location 1 39671 589 0210
site(location) 4 67354 477 0001
locationxsurvey 10 1490 221 0032
site(location)xsurvey 40 67331 477 0001
error 924 14108
Shadingdenotessignificanceatplt005
TRESBPKirraReefMarineBiotaMonitoring2015 32
frc environmental
Ascidians$
ThemeanabundanceofallascidiansotherthanPyura0stoloniferahasvariedsignifcantly between sites at Kirra Reef and Palm Beach Reef and between surveys at each site (Figure314andnotethesignificantinteractionbetweensite(location)xsurveyinTable 35) The abundance of ascidians was different between sites at Kirra Reef in January 2001May2003March2004February2005andApril2014HanddifferentatPalmBeach ReefinJanuary2001February2005February2010andMarch2015Theabundance ofascidiansvariedbetweensurveysateachsitewith1995beingmostdifferentwhenthe abundanceofascidianswaslow(AppendixD)InMarch2015theabundanceofallother ascidiansonKirraReefandPalmBeachReefwashigherthanpreviouslyreportedinthe baselinesurveyinApril1995(whennoascidianswererecorded)Themeanabundance washigheratKirraReefthanatPalmBeachReef(Figure314)
ThemeanabundanceofPyura0stoloniferahasvariedconsiderablybetweensitesatKirra Reef and Palm Beach Reef over time (note the significant interaction between site (location) x survey in Table 36) In March 2015 the mean abundance (individual per 025m2plusmnSE)of theascidianPstolonifera (Figure313)wassimilaratKirraReefand PalmBeachReef(Figure315)ThemeanabundanceofP0stoloniferahasrangedfrom 02to17individualsper025m2atbothreefssinceMay2003
Figure315 Mean abundance of ascidians (Pyura0 stolonifera) (individuals025m2)
(plusmnSE)atKirraReefandPalmBeachReefinallsurveys
TRESBPKirraReefMarineBiotaMonitoring2015 34
frc environmental
Table35 Univariate PERMANOVA results for the differences in cover of all ascidians otherthanPyura0stolonifera0betweensurveysandlocations
Factor$ df$ MS$effect$ PseudoF$ p$(perm)$
survey 10 26658 474 0001
location 1 13603 710 0104
site(location) 4 19154 149 0212
locationxsurvey 10 2629 468 0001
site(location)xsurvey 40 5621 438 0001
error 924 12828
Shadingdenotessignificanceatplt005
Table36 Univariate PERMANOVA results for the differences in Pyura0 stolonifera densitybetweensurveysandlocations
Factor$ df$ MS$effect$ PseudoF$ p$(perm)$
survey 10 16254 11842 0001
location 1 12445 60881 0206
site(location) 4 20442 56799 0001
locationxsurvey 10 79724 58082 0001
site (location) x 40 13726 38138 0001 survey
error 924 35991
Shadingdenotessignificanceatplt005
$
TRESBPKirraReefMarineBiotaMonitoring2015 35
frc environmental
Hard$Coral$
There was a significant difference between the cover of hard corals at Kirra Reef and PalmBeachReefduringsomesurveys(notethesignificantinteractionbetweenlocationx surveyinTable37)SpecificallytherewassignificantlymorehardcoralatPalmBeach Reef thanKirraReef inFebraury1996March2004April2014andMarch2015(Table 38)
ThecoverofhardcoralistypicallylowonKirraReefaccountingforlessthan2ofthe availablesubstrateInMarch2015hardcoralcoveredlessthan1oftheareaofKirra Reef which was less than the cover recorded during the baseline survey in April 1995 (Figure 316) In contrast hard coral covered 11 of the surface area at Palm Beach ReefwhichwasgreaterthanthecoverrecordedinApril1995(Figure316)
The cover of hard corals at Palm Beach Reef has been more variable over time comparedtothecoverofhardcoralatKirraReef(Figure316)Withtheexceptionofthe surveys inApril1995andJanuary2001when thecoverofhardcoralwas lowonboth reefshardcoralsaretypicallymoreprevalentatPalmBeachReef(Figure316)
Table38 PERMANOVA post hoc pairwise results for the differences in the cover of hardcoralbetweenlocationsineachsurveyevent
Hard$Corals$ Survey$
t$ p$(MC)$a$
Apr1995 054 0606
Jun1995 182 0140
Feb1996 541 0006
Jan2001 R R
May2003 166 0168
Mar2004 765 0001
Feb2005 049 0646
Feb2010 156 0197
Jul2012 283 0053
Apr2014 525 0011
Mar2015 695 0003 Shadingdenotessignificanceatplt005 a pvaluesbasedonMonteCarlotests
TRESBPKirraReefMarineBiotaMonitoring2015 37
60
50
40
30
20
10
0
Soft
Cor
al C
over
()
Kirra Reef Palm Beach Reef
frc environmental
Soft$Coral$
The cover of soft coral was significantly different between sites at both Kirra Reef and PalmBeachReefandduringsomesurveys(notethesignificant interactionbetweensite (location)xsurvey)TherewasnosoftcoralrecordedatKirraReefinMarch2015The coverofsoftcoralhasdeclinedatKirraReefsince2003andhascoveredlessthan2of theavailablesubstratesince2005whichissimilartothecoverofsoftcoraldescribedfor the baseline surveys in 1995 (Figure 317) The cover of soft coral was consistent betweensitesineachsurveyexceptbetweensitesin
sdot April1995atKirraReef
sdot 1996atKirraReef
sdot 2003atPalmBeachReefand
sdot 2014atPalmBeachReef(AppendixD)
Soft corals have historically covered more of the available space on Palm Beach Reef than on Kirra Reef However there was more temporal variability within sites at Palm BeachReefthanatKirraReef(AppendixD)ThecoverofsoftcoralatPalmBeachReef has varied over time and was highest in April 1995 (48 cover) Despite increasing sinceFebruary2005itisstilllowerthanthecoverrecordedduringthebaselinesurveyin April1995(Figure317)
Table39 UnivariatePERMANOVAresults for thedifferences in thecoverofsoft coral betweensurveysandlocations
Factor$ df$ MS$effect$ PseudoF$ p$(perm)$
survey 10 44657 1323 0001
location 1 32922 6620 0117
site(location) 4 49732 266 0036
locationxsurvey 10 40982 1214 0001
site (location) x 40 3376 181 0002 survey
error 924 18688
Shadingdenotessignificanceatplt005
$
TRESBPKirraReefMarineBiotaMonitoring2015 39
frc environmental
Crinoids$
ThereisasignificantdifferencebetweensomesitesatbothKirraReefandParmBeach Reef that varies through time (note the significant interaction between site (location) x survey inTable310) Theabundanceofcrinoidshasbeensimilarbetweensites inall years at Palm Beach ReefH and was different beween sites at Kirra Reef in June 1995 February1996May2003andFebruary2005(AppendixD)Withineachsitetherehas been some natural temporal variability particualrly at Palm Beach Reef sites in 2001 (Appendix D) The mean abundance (individuals 025m2) of crinoids (Figure 318) at KirraReefandPalmBeachReefhasgenerallybeenlessthan2individualsper025m2 andhasdeclinedatboth locationssincethebaselinesurvey inApril1995(Figure319) However the mean abundance of crinoids on Kirra Reef has shown a slight increase sinceFebruary2010(Figure319)
In March 2015 fewer crinoids were recorded at Palm Beach Reef than at Kirra ReefH crinoidshavebeenrareatPalmBeachReefsince2003
The species richness of fish recorded from Kirra Reef across all monitoring events has rangedfrom14to57 InMarch201557specieswereidentifiedat thereefwhichwas similar to April 2014 (53) and higher than previous surveys (Figure 320) Species richnessatPalmBeachReefwas lower(34species)andgenerallyvaried lessbetween surveyscomparedtoKirraReef
InMarch2015 the assemblage of fish at KirraReef comprised species fromall trophic levelsincludingdetritivoresplanktivoresherbivoresandcarnivores(AppendixE)Asin previous surveys the assemblage was dominated by herbivores and planktivores Yellowtail (Trachurus0 novaezelandiae) and striped sea pike (Sphyraena0 obtusata) were the dominant species present in large schools (Figure 321) Australian mado (Atypichthys0 strigatus) ringRtailed surgeon (Acanthurus0 blochii) silver trevally (Pseudocaranx0 georgianus) eastern pomfred (Schuettea0 scalaripinnis) sweep (Scorpis0 lineolatus) and various wrasses were also very abundant releative to other species (AppendixE)
Two new species were observed at Kirra Reef the orangeRband surgeon (Acanthurus0 olivaceus) and the unicornfish (Naso0 sp) Five new species were recorded at Palm BeachReef
No threatened or protected fish species listed under the Queenslandrsquos Nature0 Conservation0Act01992ornationallyundertheEnvironmental0Protection0and0Biodiversity0 Conservation0 Act0 1999 were observed The complete list of species recorded and the relativeabundanceispresentedinAppendixE
TRESBPKirraReefMarineBiotaMonitoring2015 42
60
0
10
20
30
40
50
Num
ber
of F
ish
Spe
cies
Apr-95
Jun-95
Feb-96
Jan-01
May-03
Mar-04
Feb-05
Feb-10
Jul-12
Apr-14
Mar-15
Kirra Reef Palm Beach Reef Location
frc environmental
Figure320 Number of fish species recorded at Kirra Reef and Palm Beach Reef on
ThegreatestchangetotheecologicalconditionofKirraReefsincethebaselinesurveyin 1995 has been the loss of large areas of hard substrate that support benthic flora and faunaThedeliveryoflargesandvolumesduringthestage1dredgingoperations(1995 to1998)andtheinitialoperationofthesandbypasssystem(2001to2008)resultedinan increaseinwaveactionandtidalcurrentsredistributingthissandoverKirraReef
The three major outcrops of Kirra Reef (northern southern and eastern sections) are naturally exposed and covered depending on water and sand movements In March 2015 the rocky outcrops in the northern section of Kirra Reef were exposed and supportedamoderatelydiversebenthicassemblagedominatedbyturfalgaeTherewas arelativelyhighfishdiversityatKirraReefTheecologicalassemblageexhibitedsignsof ongoingstressfromphysicaldisturbanceincludingtheabsenceofsoftcoralsandrarityof hardcoral(MumbyampSteneck2008)HoweverKirraReefhasarelativelyhighcoverof sponges and ascidians Sponges ascidians and crinoids were more abundant at Kirra ReefthanatPalmBeachReefinMarch2015
KirraReefcontinues toprovidehabitatandsupport importantecological functions in the region providing hard substrate for the colonisation of algae and benthic invertebrates and food and refuge for fish As sand levels have stabilised since 2008 assemblages have becomemoresimilar to those recordedprior to implementationof the TRESBP in April1995 Forexamplemacroalgalcover inApril1995andMarch2015wasrelatively similarHoweverassemblagecompositionisstillsignificantlydifferenttothatrecordedin thebaselinesurveysmostnoticeablyduetoa lowercoverofbaresubstrateandhigher coverofturfalgaeandascidianssincesurveyshavebeenperformed
Benthic$Macroalgae$
The cover of macroalgae at Kirra Reef was relatively similar during the 2014 and 2015 surveys and remained well below the peak of nearly 60 cover recorded in January 2001TherewasasteepdeclineinthecoverofmacroalgaebetweenJanuary2001and May2003whichappearedtobestronglyassociatedwith thedecline inreefareaduring that time as well as a decline in the cover of Sargassum sp (an important indicator speciesonKirraReef) SimilardeclineswereevidentatPalmBeachReefbetween the January2001andMay2003surveys
TRESBPKirraReefMarineBiotaMonitoring2015 45
frc environmental
The cover ofmacroalgae at Palm Beach Reef was much lower thanat Kirra Reef over time There are several possible reasons for the lower cover of macroalgae at Palm Beach
sdot PalmBeachReefisdeeperthanKirraReefandgenerallyhashigherturbidityand therefore greater light attenuation The quantity and quality of available light affectsthedistributionandgrowthofmacroalgae(MillerampEtter2008)
sdot Differences in the pattern of recruitment of algal species to the reefs due to differentwatercurrentsandtimingofthesurveys(Kennelly1987b)
sdot Increased competition with turf algae and sessile benthic invertebrates which competeforspacewithmacroalgae(Kennelly1987aHMillerampEtter2008)
sdot PresenceofdifferentspeciesandhigherdensityofherbivoresatPalmBeachReef (particularly sea urchins and herbivorous fish) which graze on macroalgae (McCook1997HJompaampMcCook2002)
Biological assemblages exposed to physical stress typically exhibit greater levels of temporalandspatialvariability(WarwickampClarke1993HChapmanetal1995)Temporal variationinthecoverofmacroalgaeatKirraReefislikelytobeprincipallyduetotheeffect ofphysicaldisturbance fromwaveactionaswellas theassociatedassociatedabrasion andsmotheringbysandTheeffectsofthesephysicaldisturbanceswouldincreasewith thereductionofKirraReefasedgeeffectsarepronouncedandwaterdepth isreduced Increasedsmotheringbysandcanalsoreducediversity(Hatcheretal1989)abundance recruitment growth survival and seasonal regeneration of macroalgae (Umar amp Price 1998HCheshireetal1999)
Changes in the cover of macroalgae on Kirra Reef over time are also likely due to the extentofthereefchangingHthefishandmobileinvertbratesassociatedwiththereefmay have concentrated which would in turn increase grazing pressure Increased grazing pressure from fish and mobile invertebrates can reduce the coverage and diversity of macroalgaeonreefs(McCook1997HJompaampMcCook2002)
Thecoverof turfalgaeatbothKirraReefandPalmBeachReefhasvariedsignificantly betweensurveysPriorto2005turfalgaetypicallycoveredlessoftheavailablesurface areaonKirraReefthanPalmBeachReefInMarch2015themeancoverofturfalgae hasincreasedsincebaselinesurveysin1995andwasrelativelysimilarbetweenreefs(40 plusmn4atKirraReefcomparedto48plusmn4atPalmBeachReef)Thecoverofturfalgaeat Kirra Reef was similar in 2014 and 2015 which was generally higher than previous surveysexceptduringJuly2012whencoverofturfalgaepeakedat67plusmn4
TRESBPKirraReefMarineBiotaMonitoring2015 46
frc environmental
Turfalgaearebecomingadominantcomponentofcommunitiesaroundtheworld likely the result of rapid colonisation of openspace after a disturbance (eg storms) nutrient enrichment andor changes in grazing pressures Turf algae can also reflect a more physically robust growth form suited to high wave energy environments (than foliose macroRalgae)TurfalgaepeakedintheJuly2012surveylikelyrelatedtotheincreasein bare reef exposure following a stormy conditions in early 2009 and between December 2011 and June 2012 Turf algae have been the dominant form of algae on Kirra Reef sincethistimealbeitthecoverlowerthanthe2012survey
Increased cover of turf algae is typically related to good light conditions high concentrationsofnutrientsandlownumbersofgrazerssuchasfish(orconstantgrazing pressure preventing macroalgae colonisation) However the relationship between algal dynamics physical disturbance water quality and herbivore grazing activity is complex andthecoverof turfalgaecanexhibitextremetemporalvariabilityasaconsequenceof the interactionbetween topRdownandbottomRupprocesses (Russ2003HBellwoodetal 2006H Hughes et al 2007H Albert et al 2008H Hoey amp Bellwood 2008H Mumby 2009) Furtherinvestigationwouldberequiredtoreliablydeterminethemechanismsofchangein bothmacroalgaeandturfalgaeassemblagesonthesereefs
Benthic$Macroinvertebrates$
AtKirraReeftheburialandreRemergenceofrockyoutcrops(influencedbytheTRESBP) islikelytohaveincreasedtemporalvariabilityinthedistributionandabundanceofbenthic macroinvertebrates Additional perturbations such as wave action and sand abrasion (each influenced through changes in bathymetry seabed topography and water depth) are likely to have resulted in the decline in cover and diversity of the benthic macroinvertebratesatKirraReefbetweensurveysparticularlybetweenMarch2004and February2005andduringtheseverestormsof2009Benthicmacroinvertebratessuch asascidiansspongeshardcoralandsoftcoralarehighlysusceptible to theeffectsof stormandwavedisturbancephysicalabrasionandburialbysand(KayampKeough1981H Walker et al 2008) which can affect settlement growth rate and survival (Dodge amp Vaisnys1977HRogers1990)
Physical disturbance from sand burial sand abrasion and the action of storm waves appeartokeepthebenthicassemblagesofKirraReefinastateofearlysuccessionItis commonforearlypioneerspeciessuchassomemacroalgaetorecruitrapidlytoahard surface in large numbers allowing these species to dominate assemblages early in the successionaltrajectory(Walkeretal2007)
Afurther indicatorof theearlystateofsuccessionatKirraReef isthatthecoverofhard and soft coral has remained very low (generally lt 5) In March 2015 less than 1
Benthic macroinvertebrate cover may also be affected indirectly through increased competitionwithmacroalgaeforspaceThepresenceoflargemacroalgaecanaffectthe recruitment and survival of sessile benthic invertebrates as fronds moving with wave action sweep and abrade the surface of rocks killing new recruits especially corals (Kennelly1989HMcCooketal2001)Itcantakeseveralyearsforhardandsoftcoralto become dominant on reefs in the SEQ region (SchlacherRHoenlinger et al 2009) Therefore hard coral is not expected to become abundant until several years after the reefhasbeenuncoveredandonlyifthephysicaldisturbanceregimeandsupplyofnew recruitsissufficienttosupportsurvivalandgenerationalsuccessionofthesespeciesThe coverofhardandsoftcoralsatKirraReefwerebothverylowandpatchypriortothestart oftheTRESBP
Sponges and ascidians are highly susceptible to smothering and sand abrasion unless theyhaveathicktunic(outercoveringmadeofkeratin)liketheascidianP0stolonifera0or strong internal keratin silicon or calcareous structures in the case of some species of sponges0(KayampKeough1981HMcGuinness1987HWalkeretal2008)Duetoincreased wave action and sedimentation (which can be influenced by the TRESBP) the mean coverofascidiansandspongeswasexpectedtobemuchloweronKirraReefthanPalm Beach Reef However in March 2015 the cover of sponges was similar between the reefsandthecoverofascidians(otherthanP0stolonifera)wasgreateratKirraReefthan at Palm Beach Reef This suggests that Kirra Reef is slowly recovering from the increasedstressofphysicaldisturbancesuchas increasedwaveactionandsandscour andorthatwaveandstormconditionshavebeenlesssevereinthepastfewyears
Fish$
KirraReefcontinuestosupportahighdiversityofreefRassociatedandpelagic(ienonR reefassociated) fishspecies Despite itsdiminishedsizecompared to1995KirraReef continuestoprovidevaluablehabitatforanumberoffishspeciesfromdifferentfunctional groups
ThereisahighdegreeofinterRannualvariabilityinthespeciesandabundanceofthefish present at Kirra Reef compared with the assemblage at Palm Beach Reef This likely reflectsthetemporalvariabilityintheavailablehabitatasaconsequenceofreefburialand reRemergenceThediversityqualityandarealextentofreefhabitatareimportantfactors influencing the distribution abundance biomass and diversity of reef fish (Bellwood amp Hughes2001HFriedlanderetal2003)Diversityandabundanceoffishcanincreasewith
TRESBPKirraReefMarineBiotaMonitoring2015 48
frc environmental
greaterstructuralcomplexityandincreasedheterogeneityofavailablehabitats(Bellwood ampHughes2001)Thissuggeststhatperiodsofreefburialreducetheoveralldiversityof reefRassociated fish species at Kirra Reef Despite the reduction in overall reef space therewasalargervarietyofhabitats(suchasmarcoalgaeandturfalgae)in2015which was likely to be related to the high diversity of fish assemblages This is particularly importantforseveralspeciesthatdependonthepresenceoflsquostructurersquosuchasprovided by reef habitat (ie oldwife moray eels damselfish and Australian mado that were recordedinMarch2015butwerenotrecordedinJuly2012)
Theabundanceanddiversityof fishare likelytobenegativelyaffectedfollowingperiods of severe weather which create unfavourable conditions for many species and may further exacerbate the affects of abrasion and sedimentation The biomass of fish is knowntodecreasewithincreasingexposuretophysicaldisturbancefromwaveactionand strong currents (Friedlander et al 2003) As our surveys have been undertaken at different times of the year variation in the prevailing conditions at the time of sampling could also influence the types of fish observed (and the amount of reef habitat that is availableatanytime)Manyofthespeciesmayalsobeaffectedbyseasonalchangesin the water temperature such as damselfish which are less abundant in cool waters However theoveralldiversityof the fishassemblageatKirraReef is likely toreflect the sizeoftheoutcropsexposedwithagreaterphysicaldisturbance(fromseaconditionsand sandmovement)andcompetitionHandlesserfoodavailablewhenthereefiscovered
ThepredictedimpactstoKirraReefasaresultoftheTRESBPincludedaccretionofsand around the base of the rock outcrops causing a reduction in extent of reef It was predictedthatsanddeliveryaspartoftheprojectwouldeventuallymimiclsquonaturalrsquopatterns ofsanddispersalandthatthereefwouldreturntoitsnaturalextent(ietheextentpriorto extension of the Tweed River training walls in 1962) The benthic flora and fauna assemblages of the reef the historical reef extent and natural sand transport patterns wereexpectedtoreturntoconditionsobservedbeforetheextensionofthetrainingwalls between 1962 and 1965 However the Environmental Impact Study did not predict the ecologicalconsequencesofboththereducedarealextentandincreasedwaveenergy(a consequenceofdecreaseddepth)thathavebeenrecorded
ThecurrentextentofKirraReef remains less than50of that recorded in1962and in 1995beforethesanddeliverybytheTRESBPcommencedHowevertheextentofreef in1995 wasstrongly influenced by adepletion in sand following the construction of the Tweed River training walls and the Kirra Point groyne Accumulation of sand on Kirra ReefwasobservedtoincreaseasaresultofindirectsandnourishmentbytheTRESBP and the reef has been extensively covered (particuarly between 2005 and 2010) as a result
Whiletheextentofthereefcontinuestochangeovertimethedeliveryofsandaspartof the project now more closely matches the natural rate of longshore sand transport ShortRtermandseasonalchangesintheextentofthereefarenowlikelytobetheresultof waveandcurrentaction(particularlyduringservereweatherevents)thanadirectimpact of the TRESBP Therefore the extent of Kirra Reef in March 2015 is broadly in accordancewithpredictionsmadeintheEISwhichpredictedthatthereefwouldreturnto a condition similar to that exhibited in the preR1960rsquos ie before the extension of the TweedRiverbreakwatersthatinterruptedlittoralsandsupplytothesebeaches
InDecember2013KirraPointgroynewasextendedby30mwiththeexpectationthatthe beach bar would move seaward as a consequence At present Kirra Point groyne is unlikelytohavehadamajorimpactonthearealextentofKirraReefHoweverongoing monitoringbasedonaerialphotographsmayprovidefurtherinsight
Sessile benthic assemblages on Kirra Reef are highly susceptible to the influence of storms and associated wave action (Kay amp Keough 1981H Walker et al 2008) The shallowreefissurroundedbymobilesandwhichcanshiftnaturallyinresponsetowave action during storms causing burial of large sections of Kirra Reef This effect has reduced the availability of rocky substrate for colonisation and the availability of refuge
Fromanexaminationof theextentofKirraReef fromarealmapsandwaveheightdata thereappears tobea relationshipbetween theareaof rockexposedandstormevents Notably in a series of storm events in May 2009 corresponds with large areas of rock becoming exposed (with the reef approximately 100m2 in 2006 and approximately in 1009m2 2009) Further a stormy conditions between December 2011 and July 2012 correspondstotheareaofexposedrockmorethandoublinginsizeWhiletherewasno changetothetotalareaofexposedrockfollowingstormyconditionsinearly2013there wasaclearchangeinthedistibutionofexposedrockduringthistimeSince2013storm conditions have been calm to moderate and there has been little change in the areal extentanddistrubtionofexposedrockatKirraReef
WaveheighttypicallyincreasesduringstormeventsandgiventheshallowdepthofKirra Reef waves are more likely to shoal and break across the reef during storms This increases thephysicaldisturbanceabrasionandsedimentationofbenthicassemblages onKirraReefStormdisturbancecancauselocalreductionsinthespeciesrichnessand abundanceofcoral(Woodleyetal1981HMasselampDone1993HHughes1994HConnellet al 1997) and can alter fish assemblages indirectly through habitat modifications (Kaufman1983HJonesampSyms1998)ordirectlybyincreasingfishmortality(Lassig1983) The hydrodynamic forces produced by wave action are an important source of disturbance in subtidal habitats inflicting damage through direct physical impact and abrasion(UnderwoodampKennelly1990)DirectimpactsfromphysicaldisturbanceatKirra Reefareevidentduringsurveyeventswhenlargefragmentsofmacroalgaearepresentin thewatercolumnoverthereef
Storm and wave action (and associated sedimentation and abrasion) continue to be importantforcesshapingthedistributionandabundanceofbenthicspeciesatKirraReef Increased magnitude and frequency of physical disturbance resulting from increased exposureorsusceptibility tostormsandassociatedwaveaction (asonKirraReef)can lead to a decrease in the diversity of sessile invertebrate assemblages DisturbanceR drivenreductionsinbiodiversityhavethepotentialtoimpactnegativelyonthehealthand productivity of reef ecosystems (Walker et al 2008) Biodiversity is important to reef health given that many of these species (eg sponges bryozoans and ascidians) contribute a range of vital ecosystem services to reefs including nutrient cycling (Scheffers et al 2004) trophic interactions and food webs (Lesser 2006H Pawlik et al 2007) bioRerosion (Rutzler 2002H LopezRVictoria et al 2006) and stabilizing substrata (DiazampRutzler2001HWulff2001)
Theimpactsof increasedwaveactionandsedimentationonthebenthicassemblagesat Kirra Reef are likely to be greatest during and immediately following storm conditions
TRESBPKirraReefMarineBiotaMonitoring2015 51
frc environmental
Partitioningtheinfluenceofstormandwavedrivendisturbancefromthatoftheoperation oftheTRESBPwouldrequireamuchmorestatisticallypowerfulandtemporilyreplicated experimental design Given there is a large collection of wave and storm data by TRESBP this would involve greater temporal sampling of Kirra Reef including event samplingfollowingseverewaveandstormactivity
The data generated by this Kirra Reef biota monitoring program doesnrsquot support statistically rigorous consideration of seasonality (monitoring has been at its most frequentannual)
InApril2014andMarch2015KirraReefcoveredlessthan50ofthereefrsquosextentprior to theoperationof theTRESBP The lossof reefhabitathasreducedtheavailabilityof hard substratum available for colonisation and consequently the abundance of benthic sessileassemblages
The reduced depth of water resulting from the accumulation of sand exacerbates the effects of storms and wave action It is likley that as a consequnece the biological communities of Kirra Reef will reflect earlyRstage succession more frequently and for longerperiods
While there is sufficient structure available frcenvironmentalexpect that Kirra Reef will continuetoprovideimportanthabitatforadiverseassemblageoffishes
TRESBPKirraReefMarineBiotaMonitoring2015 52
frc environmental
5$ Conclusions$
Although there is still a substantial portion of the reef covered compared to before the extension of the Tweed River entrance breakwaters the current extent of Kirra Reef is broadly inaccordancewithpredictionsmadein theEIS Initial lsquocatchRuprsquobypassingand dredgeplacementofsand(between2001and2008)resulted in theburialofKirraReef Subsequentsanddelivery(since2008onwards)morecloselyreflectsnaturalpatternsof longRshoresandtransportandisthereefhasslowlyreRemerged
Theextentofthereefhasbeenrelativelystablesince2013Thishasallowedforsome succession in the benthic assemblages including a relatively high cover of sponges ascidiansandcrinoidsWiththedeliveryofsandmorecloselymatchingthenaturalrateit isexpected the reef willundergoshortRtermchanges in extentdue toseasonal shifts in sand deliveryH however the diversity of benthic assemblages on Kirra Reef is likely to increaseovertimeThiswouldcreatemorespaceforspeciestorecruitandreducesthe influence of sand abrasion and wave damage It was predicted that the areas of Kirra Reef newly exposed in 2012 would undergo a shift from turfRdominated communities to more diverse communities that could include macroalgae sponges ascidians and potentiallyhardandsoftcoralWiththeexceptionofhardandsoftcoralsthisprediction wasconfirmedbytheresultsoftheApril2014andMarch2015surveys
ThediversityoffishesassociatedwithKirraReefisbroadlysimilartothatrecordedprior tothecommencementofsandbypassingin1995Giventhatfisharemobilethegreatest impacts on fish assemblages are likely to be shortRterm changes due to both the prevailingconditionsandchangestheextentofavailablehabitatthatprovidesshelterand foodforavarietyofdifferentspeciesIfKirraReefincreasesinsizethereislikelytobea greater proportion of cryptic benthic species as these species are more typical of assemblagesinalaterstageofsuccession(eg(WillisampAnderson2003))
Assuming a broadly stable delivery rate of sand and consequent stable extent of Kirra ReeflsquorecoveryrsquoislikleytobesubstantivelycompleteFloralandfaunalcommunitieswill undergo succession between severe storm events but are likley to remain relatively dynamic
Albert S Udy J amp Tibbetts I 2008 Responses of algal communities to gradients in herbivorebiomassandwaterqualityinMarovoLagoonSolomonIslandsCoral0 Reefs2773R82
Anderson MJ 2001 A new method for nonRparametric multivariate analysis of varianceAustral0Ecology2632R46
Anderson MJ 2004 PERMDISP0 a0 FORTRAN0 computer0 program0 for0 permutatinoal0 analysis0 of0 multivariate0 dispersions0 (for0 any0 twoSfactor0 ANOVA0 design)0 using0 permutational0 tests Department of Statistics University of Auckland New Zealand
Cannon LR Goeden GB amp Campbell P 1987 Community patterns revealed by trawling in the interRreef regions of the Great Barrier Reef Memoirs0 of0 the0 Queensland0Museum2545R70
Chapman MG Underwood AJ amp Skilleter GA 1995 Variability at different spatial scalesbetweenasubtidalassemblageexposedtothedischargeofsewageand two control assemblages Journal0 of0 Experimental0 Biology0 and0 Ecology 189 103R122
Cheshire AC Miller DJ amp Stewart R (1999) Effect0 of0 dispersed0 sediment0 plumes0 from0beach0sand0replenishment0dredging0on0recruitment0of0phaeophycean0algae0 to0rocky0reefs0in0Gulf0St0Vincent0South0Australia0The0Impact0of0Sand0Dredging0 on0 Benthic0 Community0 Structure0 at0 the0 Port0 Stanvac0 Dredge0 Site0 20 1S39 UniversityofAdelaideAdelaide
ConnellJHHughesTPampWallaceCC1997A30Ryearstudyofcoralabundance recruitment and disturbance at several scales in space and time Ecological0 Monographs67461R488
Diaz MC amp Rutzler K 2001 Sponges an essential component of Caribbean coral reefsBulletin0of0Marine0Science69535R546
DodgeREampVaisnysJR1977Coralpopulationsandgrowthpatternsresponsesto sedimentation and turbidity associated with dredging Journal0 of0 Marine0 Research35715R730
Done TJ 1982 Patterns in the distribution of coral communities across the central GreatBarrierReefCoral0Reefs195R107
Edwards RA amp Smith DA 2005 Subtidal assemblages associated with a geotextile reef insouthReastQueenslandAustraliaMarine0and0Freshwater0Research56 133R142
FisheriesResearchConsultants1991Survey0of0the0Intertidal0and0Subtidal0Rocky0Reefs0 of0 the0 Sunshine0 Coast report prepared for Queensland National Parks and WildlifeService
HarrisonPHarriotVBanksSampHolmesN1998ThecoralcommunitiesofFlinders Reef andMyora Reef in theMoretonBay MarineParkQueensland Australia In Moreton0 Bay0 and0 Catchment Tibbits I Hall N amp Dennison W (Eds) SchoolofMarineScienceUniversityofQueenslandStLuciapp525R536
Hatcher B Johannes R amp Robertson A 1989 Review of research relevant to the conservationofshallowtropicalmarineecosystemsOceanography0and0Marine0 Biology0an0Annual0Review27337R414
Hoey A amp Bellwood D 2008 CrossRshelf variation in the role of parrotfishes on the GreatBarrierReefCoral0Reefs37R47
TRESBPKirraReefMarineBiotaMonitoring2015 56
frc environmental
Hollingsworth P 1975 Environmental Investigation Report Crown Reserve R R68 Currumbin Creek City of the Gold Coast Land Administration Commission unpublishedreport
Hughes TP 1994 Catastrophes phase shifts and large scale degradation of a CaribbeancoralreefScience2651547R1551
Hughes TP Rodrigues MJ Bellwood DR Ceccarelli D HoeghRGuldberg O McCook L Moltschaniwskvi N Pratchett MS Steneck RS amp Willis B 2007Phaseshiftsherbivoryandtheresilienceofcoralreefstoclimatechange Current0Biology17360R365
Hutchinson A Rempel C Taveras V Loder J amp Salmond J 2013 Reef0 Check0 Australia0 South0 East0 Queensland0 Summary0 Report0 2013 report prepared for ReefCheckFoundationLimited
Hyder Consulting 1997 Tweed0 River0 Entrance0 Sand0 Bypassing0 Project0 Permanent0 Bypassing0 System0 0 Environmental0 Impact0 Statement0 0 Impact0 Assessment0 Study report prepared for New South Wales Department of Land and Water Conservation
Jompa J amp McCook LJ 2002 Effects of competition and herbivory on interactions betweenahardcoralandabrownalgaJournal0of0Experimental0Marine0Biology0 and0Ecology27125R39
KayAMampKeoughMJ1981Occupationofpatchesintheepifaunalcommunitieson pier pilings and the bivalve Pinna bicolor at Edithburgh South Australia Oecologia48123R130
KennellyS1987aInhibitionofkelprecruitmentbyturfingalgaeandconsequencesfor an Australian kelp community Journal0 of0 Experimental0 Marine0 Biology0 and0 Ecology11249R60
Kennelly S 1987b Physical disturbances in an Australian kelp community I temporal effectsMarine0Ecology0Progress0Series40145R153
TRESBPKirraReefMarineBiotaMonitoring2015 57
frc environmental
Kennelly S 1989 Effects of kelp canopies on understory species due to shade and scourMarine0Ecology0Progress0Series50215R224
Lassig BR 1983 The effects of a cyclonic storm on coral reef fish assemblages Environmental0Biology0of0Fishes955R63
Lawson S McMahon J amp Boswood P 2001 Environmental management of the construction and operation of a sand bypassing system at the Tweed River EntranceInThe15thAustralasianCoastalandOceanEngineeringConference the 8th Australasian Port and Harbour Conference 25 R 28 September 2001 QueenslandAustralia
Lesser MP 2006 BenthicRpelagic coupling on coral reefs feeding and growth of Caribbean sponges Journal0 of0 Experimental0 Marine0 Biology0 amp0 Ecology 328 277R288
LopezRVictoriaM ZeaSampWei E2006 Competition for spacebetweenencrusting excavatingCaribbeanspongesandothercoral reeforganismsMarine0Ecology0 Progress0Series312113R121
MalcolmHASmithSDAampJordanA2009Usingpatternsofreeffishassemblages to refine a Habitat Classification System for marine parks in NSW Australia Aquatic0Conservation0Marine0and0Freshwater0Ecosystems2083R92
Massel SR amp Done TJ 1993 Effects of cyclone waves on massive coral assemblages on the Great Barrier Reef meteorology hydrodynamics and demographyCoral0Reefs12153R166
Mumby PJ amp Steneck RS 2008 Coral reef management and conservation in light of rapidly evolving ecological paradigms Trends in Ecology amp Evoution 23 555 -563
Murphy HM amp Jenkins GP 2010 Observational methods used in marine spatial monitoring of fishes and associated habitats a review Marine and Freshwater Research 61 236-252
Noriega R 2007 An Overview of Available Information on Sandy Beach Ecology Coastal Sand Dunes Rocky Reefs and Associated Biota on the Gold Coast Griffith Centre for Coastal Management Research Report No 85 report prepared for Griffith University
Parker P (1995) Structure to Reef Fish Assemblages at Julian Rocks Northern New South Wales Masters Thesis Griffith University
Parker PG 1999 Fish assemblages at Julian Rocks and the adjacent waters of northern New South Wales Australia Australian Zoologist 31 134 - 160
Pawlik JR Steindler L Henkel TP Beer S amp Ilan M 2007 Chemical warfare on coral reefs sponge metabolites differentially affect coral symbiosis in situ Limnology and Oceanography 52 907-911
Reef Check 2010 httpwwwreefcheckaustraliaorgdatahtml accessed December 2015
Robinson KI amp Pollard DA 1982 Marine and estuarine reserves in Australia with particular reference to New South Wales Wetlands 2 17 - 26
Rogers CS 1990 Responses of coral reefs and reef organisms to sedimentation Marine Ecology Progress Series 62 185-202
Russ GR 2003 Grazer biomass correlates more strongly with production than with biomass of algal turfs on a coral reef Coral Reefs 22 63-67
Rutzler K 2002 Impact of crustose clionid sponges on Caribbean reef corals Acta Geologica Hispanica 37 61-72
Scheffers SR Nieuwland G Bak RPM amp van Duyl FC 2004 Removal of bacteria and nutrient dynamics within the coral reef framework of Curacao (Netherlands Antilles) Coral Reefs 23 413-422
TRESBP Kirra Reef Marine Biota Monitoring 2015 59
frc environmental
Schlacher-Hoenlinger M Walker S Johnson J Schlacher T amp Hooper J 2009 Biological Monitoring of the Ex-HMAS Brisbane Artificial Reef Phase II - Habitat Values report prepared for Environmental Protection Agency (EPA)
Smith KA 2003 A simple multivariate technique to improve the design of a sampling strategy for age-based fishery monitoring Fisheries Research 64 79-85
Smith S Edwards R Dalton S amp Harrison M 2005 Biological assessment of fish and benthic communities at Palm Beach Bait Reef Gold Coast Queensland report prepared for University of New England
TRESBP 2014 Autum 2009 storms httpwwwtweedsandbypassnswgovauarticles-and-studiesinteresting-itemsautumn-2009-storm updated 4 May 2014 accessed December 2015
TRESBP 2015a Tweed Sand Bypassing Restoring Coastal Sand Drift Improving Boating Access ndash Techinical information httpwwwtweedsandbypassnswgovau__dataassetspdf_file0004552055kir ra-feb-2015pdf acessed December 2015
TRESBP 2015b Waves httpwwwtweedsandbypassnswgovauenvironmental-monitoringcoastal-conditionswaves updated 30 September 2015 accessed December 2015
Umar MJMLJ amp Price IR 1998 Effects of sediment deposition on the seaweed Sargassum on a fringing coral reef Coral Reefs 17 169-177
Underwood AJ amp Kennelly SJ 1990 Ecology of marine algae on rocky shores and subtidal reefs in temperate Australia Hydrobiologia 192 3-20
Walker S Schlacher T amp Schlacher-Hoenlinger M 2007 Spatial heterogeneity of epibenthos on artificial reefs fouling communities in the early stages of colonization on an East Australian shipwreck Marine Ecology 28 435-445
Walker SJ Degnan BM Hooper JNA amp Skilleter GA 2008 Will increased storm intensity from climate change affect biodiversity in non-scleractinian sessile fauna on coral reefs Global Change Biology 14 2755-2770
Warwick RM amp Clarke KR 1993 Increased variability as a symptom of stress in marine communtities Journal of Experimental Marine Biology and Ecology 172 215-216
Thenumberofsitessurveyedhasvariedover timeasaresultof the fluctuating levelof sandcoveringKirraReef
Prior to May 2003 three sites were assessed along the eastern and northern edge of KirraReef(KirraReefOutersites1to3)andthreesiteswereexaminedalongtheinshore marginof the reef (KirraReef Inner sites1 to 3)(MapA1) ReefRedge (ieKirraOuter) siteswerechosentoprovideearlywarningofimpactsfromoffshoreplacementofdredged sandwhilst inshoresites(ieKirraInner)werechosentoindicatewhetherimpactsfrom inshore beach profile development were affecting the reef platform In May 2003 the threeeasternsitesatKirraReef (ieKRO1KRO2andKRI1)werecompletelycovered with bare mobile sand Consequently only the three western sites at Kirra Reef (ie KRO3KRI2andKRI3)supportedbenthicfloraandfaunaInMarch2004theextentof the remainingwesternoutcropof KirraReef had been further reduced so that all inner reefsiteswerecompletelycoveredwithmobilesandConsequentlyonlyasingleoriginal reefsite(ieKRO3)couldbesurveyed(Figure23)Thereforetoprovideanindicationof the condition of the remaining reef two new sites were established (ie KRN1 and KRN2)(Figure23)andsurveyedinMarch2004Theextentofthewesternreefhadbeen further reduced by February 2005 and a third new site (ie KRN3) was established (Figure23)Consequentlyfoursites(KRO3KRN1KRN2andKRN3)weresurveyedin February2005
InFebruary2010fourKirraReefsites(ieKRO3KRO1KRN1andKRN2)wereclearof thesurroundingsandandsupportedbenthic floraand fauna Inaddition several rocks protruded from the sand in the vicinity of site KRI2H these were assessed to provide a quantitativeindicationofbroadRscaletemporalchangestotheinshorereefcommunities
SOURCEScopy Copyright Commonwealth of Australia (Geoscience Australia) 2001 2004 2006copy The State of Queensland (Department of Natural Resources and Mines) 2015copy Nearmap 2014 2015
DATE2015-09-09
DRAWN BYCF
VERSION02
PROJECTIONCoordinate System GDA 1994 MGA Zone 56Projection Transverse MercatorDatum GDA 1994
plusmn SCALE
0 50 100
Metres
Scale 12500 A3
frc environmental
Appendix$B$ Introduction$to$Data$Analysis$Used$
Multivariate$Analyses$
Multivariate statistical techniques are widely used in ecology to assess the similarities relationshipsbetweenassemblagesWhereasunivariateanalysescanonlycompareone variable at a time (eg an index of community structure such as a diversity index or a singleindicatorspecies)multivariateanalysescancomparesamplesbasedontheextent thatassemblagesshareparticulartaxaandabundances(ClarkeampWarwick2001)
Thefirststepofmultivariateanalysisusuallyinvolvesthecreationofamatrixofsimilarity coefficients computed between every pair of samples The coefficient is usually a measureofhowclose theabundance is foreachspecies (definedso that100= total similarity and 0=complete dissimilarity) The Bray Curtis similarity measure is commonlythemostappropriateforbiologicaldata(ClarkeampWarwick2001)
MultidimensionalScaling
NonRmetricmultiRdimensionalscalingordinations(nMDS)attempttoplacesamplesintwo dimensionalspacesothattherankorderofthedistancesbetweensamplesmatchesthe rankorderofthematchingsimilaritiesfromthesimilaritymatrix(ClarkeampWarwick2001) Thisprovidesavisualrepresentationofthesimilaritiesbetweenassemblageswithineach sampleEachoftheaxesisnotrelatedtoanyparticularvalueHinfactaxescanberotated toprovide thebestvisual representationof thedata Ordinationsareparticularlyuseful tools for analysing and visually presenting differences between assemblages Ordinationsareessentiallymapsofsamples inwhich theplacementofsampleson the mapreflectsthesimilarlyofthecommunitytothecommunitiesinothersamples(Clarkeamp Warwick 2001) Distances between samples on an ordination attempt to match the similarities inassemblagestructurenearbypoints representassemblageswithvery few attributes(speciesorabundanceofspecies)Hpoints faraparthavevery fewattributes in common(ClarkeampWarwick2001)
A stress coefficient is calculated to reflect the extent to which the multiRdimensional scalingordinationandthesimilaritymatrixagree(ClarkeampWarwick2001)(iehowwell the multiRdimensional scaling ordination accurately reflects the relationship between samples)Stressvaluesoflt015aregenerallyacceptable
In Figure A1 each freshwater macroinvertebrate sample is represented on the multiRdimensionalscalingordination By lookingat thedistancesbetweeneachsample
ANOSIMisanalogoustoANOVAinunivariatestatistics(Smith2003)AglobalRstatistic iscalculatedtodeterminewhetherthereisasignificantdifferencebetweenallsamplesIf there are differences then pairwise comparisons are conducted to test for differences betweenpairsofsamples(analogoustopostRhoctestsinANOVA)
The R value lies between R1 and +1 (all similarities within groups are less than any similarity between groups) with a value of zero representing the null hypothesis (no differenceamongasetofsamples)(ClarkeampWarwick2001)ComparisonofpairwiseR values can give an indication of how different assemblages are R values close to 0 indicatelittledifferencevaluesaround05indicatesomeoverlapandvaluescloseto1to indicate many or substantial differences In many instances however researches are primarily interestedinwhethertheRvalueisstatisticallydifferentfromzero(usuallyata confidence level of 005) (Clarke amp Warwick 2001) (ie whether they can reject the null hypothesis)
ANOSIM can provide information on whether the (visual) differences between assemblages in the multiRdimensional scaling ordination are significantH it is an independenttestfromthemultiRdimensionalscalingordinationItisbasedontestingthe
TRESBPKirraReefMarineBiotaMonitoring2015 B2
frc environmental
differences between the rank similarities in the similarity matrix not on the distances betweensamplesinthemultiRdimensionalscalingordination(ClarkeampWarwick2001)
PermutationalMultivariateAnalysisofVariance
PERMANOVAisusedtotestsimultaneousresponsesofoneormorevariablestooneor more factors in an a0 priori0 structured design using random permutation of the data to assess significance (Anderson 2004) PERMANOVA generates a pseudo FRstatistic similar to traditional ANOVA but pRvalues are calculated with permutations which does notassumenormaldatadistribution PERMANOVAcanprovide informationonwhether the (visual) differences between assemblages in a multiRdimensional scaling ordination are significantH however it is an independent test from the multiRdimensional scaling ordination
Thelevelofmultivariatedispersionamongsampleswithineachofthetestgroupscanbe examined using the permutational analysis of multivariate dispersions (PERMDISP) routine(Anderson2004)Intraditionalimpactassessmentachangeinthedispersionof datacanalsoindicateanimpact
SimilarityPercentagendashSpeciesContributions
SIMPER analysis provides information on how dissimilar assemblages from various groups are (eg how similar all of the macroinvertebrate samples taken for a particular habitatwithinastreamreachare)andhowsimilareachgroup(egreach)istoanyother group SIMPER analysis also identifies the species taxa that are contributing to the dissimilarity between two assemblages in rank order (ie it identifies which species is contributingthemosttothedifferences)SIMPERanalysismayhelptoidentifypotential lsquoindicatorrsquospeciesForexampleifaparticularspeciesconsistentlycontributesgreatlyto the differences between impacted and unimpacted assemblages it may be a useful indicator Theabundanceofthis indicatorspeciescanthenbecomparedbetweensites usingunivariatetechniquessuchasANOVA
Data is available on request from tresbpprojectofficecrownlandnswgov
TRESBPKirraReefMarineBiotaMonitoring2015 C1
frc environmental
Appendix(D( Pairwise( PERMANOVA( Results
Data is available on request from tresbpprojectofficecrownlandnswgov
TRESBPKirraReefMarineBiotaMonitoring2015 D1
frc environmental
Appendix(E( Relative(Abundance(of(Fish(found(at(Kirra(( ( and(Palm(Beach(Reefs(in(Each(Survey((Data is available on request from tresbpprojectofficecrownlandnswgovau
TRESBPKirraReefMarineBiotaMonitoring2015 E1
Structure Bookmarks
0 50 100 Metres Scale 12500 A3
0 50 100 200 Metres Scale 15000 A3
Kirra Reef
Kirra Reef
Kirra Reef
Kirra Reef
Kirra Reef
Kirra Reef
Map A1Location of Kirra Reef monitoring sites
Table D8 Pairwise comparison of macroalgae cover between sites in each year
Table D15 Pairwise comparison of turf algae cover between sites in each year
Table D29 Pairwise comparison of ascidian cover between sites in each year
Table D43 Pairwise comparison of soft coral cover between sites in each year
frc environmental
Turf$Algae$
The mean cover of turf algae varied between sites and surveys at both Kirra Reef and PalmBeachReef(notethesignificantinteractionbetweensite(location)xsurveyinTable 33)SpecificallythereweresignificantdifferencesbetweensitesatbothKirraReefand PalmBeachReefinJune1995January2001February2010July2012andApril2014 (aswellasbetweensitesinFebruary1996atKirraReef)Thecoverofturfalgaevaried betweenmostsurveysatallsitesateachreef(AppendixD)BothKirraandPalmBeach reefs showed major increases in the percent cover of turf algae from 2010 to 2012 followedbyadecreaseincoverbetween2012and2014(Figure310)Thecoverofturf algae is typically lower at Kirra Reef than at Palm Beach Reef (July 2012 being an exception) and was again slightly lower at Kirra Reef in March 2015 (Table 310) In March2015turfalgaewasmoreprevalentatKirraReefthanduringthebaselinesurvey ofApril1995
ThemeancoverofspongesatsomesitesatbothKirraReefandPalmBeachReefhas varied significantly during some surveys (note the significant interaction between site (location)xsurvey inTable34HFigure311) However thecoverofspongestendedto bemore temporallyvariable atKirraReef than at Palm Beach Reef (Figure312) The cover of sponges at Kirra Reef varied between sites in February 1996 January 2001 March2004July2012andApril2014 However thecoverofspongesatPalmBeach Reefonlyvariedbetweensites inJanuary2001andFebruary2010 (AppendixD) The cover of sponges varied between survey at each site with 1995 1996 and 2001 most differenttootheryears(AppendixD)
ThemeancoverofspongesatKirraReefdeclinedbetweenMarch2004(20cover)and February 2010 (less than 1 cover) Since 2010 the cover of sponges has increased slightly with sponges covering 8 of the reef in March 2015 (Figure 312) In March 2015thecoverofspongeswashigherthanrecordedduringthebaselinesurveyinApril 1995(3cover)(Figure312)
Figure312 Mean cover of sponges (plusmnSE) at Kirra Reef and Palm Beach Reef on all
surveys
Table34 Univariate PERMANOVA results for differences in the cover of sponges betweensurveysandlocations
Factor$ df$ MS$effect$ PseudoF$ p$(perm)$
survey 10 18576 276 0018
location 1 39671 589 0210
site(location) 4 67354 477 0001
locationxsurvey 10 1490 221 0032
site(location)xsurvey 40 67331 477 0001
error 924 14108
Shadingdenotessignificanceatplt005
TRESBPKirraReefMarineBiotaMonitoring2015 32
frc environmental
Ascidians$
ThemeanabundanceofallascidiansotherthanPyura0stoloniferahasvariedsignifcantly between sites at Kirra Reef and Palm Beach Reef and between surveys at each site (Figure314andnotethesignificantinteractionbetweensite(location)xsurveyinTable 35) The abundance of ascidians was different between sites at Kirra Reef in January 2001May2003March2004February2005andApril2014HanddifferentatPalmBeach ReefinJanuary2001February2005February2010andMarch2015Theabundance ofascidiansvariedbetweensurveysateachsitewith1995beingmostdifferentwhenthe abundanceofascidianswaslow(AppendixD)InMarch2015theabundanceofallother ascidiansonKirraReefandPalmBeachReefwashigherthanpreviouslyreportedinthe baselinesurveyinApril1995(whennoascidianswererecorded)Themeanabundance washigheratKirraReefthanatPalmBeachReef(Figure314)
ThemeanabundanceofPyura0stoloniferahasvariedconsiderablybetweensitesatKirra Reef and Palm Beach Reef over time (note the significant interaction between site (location) x survey in Table 36) In March 2015 the mean abundance (individual per 025m2plusmnSE)of theascidianPstolonifera (Figure313)wassimilaratKirraReefand PalmBeachReef(Figure315)ThemeanabundanceofP0stoloniferahasrangedfrom 02to17individualsper025m2atbothreefssinceMay2003
Figure315 Mean abundance of ascidians (Pyura0 stolonifera) (individuals025m2)
(plusmnSE)atKirraReefandPalmBeachReefinallsurveys
TRESBPKirraReefMarineBiotaMonitoring2015 34
frc environmental
Table35 Univariate PERMANOVA results for the differences in cover of all ascidians otherthanPyura0stolonifera0betweensurveysandlocations
Factor$ df$ MS$effect$ PseudoF$ p$(perm)$
survey 10 26658 474 0001
location 1 13603 710 0104
site(location) 4 19154 149 0212
locationxsurvey 10 2629 468 0001
site(location)xsurvey 40 5621 438 0001
error 924 12828
Shadingdenotessignificanceatplt005
Table36 Univariate PERMANOVA results for the differences in Pyura0 stolonifera densitybetweensurveysandlocations
Factor$ df$ MS$effect$ PseudoF$ p$(perm)$
survey 10 16254 11842 0001
location 1 12445 60881 0206
site(location) 4 20442 56799 0001
locationxsurvey 10 79724 58082 0001
site (location) x 40 13726 38138 0001 survey
error 924 35991
Shadingdenotessignificanceatplt005
$
TRESBPKirraReefMarineBiotaMonitoring2015 35
frc environmental
Hard$Coral$
There was a significant difference between the cover of hard corals at Kirra Reef and PalmBeachReefduringsomesurveys(notethesignificantinteractionbetweenlocationx surveyinTable37)SpecificallytherewassignificantlymorehardcoralatPalmBeach Reef thanKirraReef inFebraury1996March2004April2014andMarch2015(Table 38)
ThecoverofhardcoralistypicallylowonKirraReefaccountingforlessthan2ofthe availablesubstrateInMarch2015hardcoralcoveredlessthan1oftheareaofKirra Reef which was less than the cover recorded during the baseline survey in April 1995 (Figure 316) In contrast hard coral covered 11 of the surface area at Palm Beach ReefwhichwasgreaterthanthecoverrecordedinApril1995(Figure316)
The cover of hard corals at Palm Beach Reef has been more variable over time comparedtothecoverofhardcoralatKirraReef(Figure316)Withtheexceptionofthe surveys inApril1995andJanuary2001when thecoverofhardcoralwas lowonboth reefshardcoralsaretypicallymoreprevalentatPalmBeachReef(Figure316)
Table38 PERMANOVA post hoc pairwise results for the differences in the cover of hardcoralbetweenlocationsineachsurveyevent
Hard$Corals$ Survey$
t$ p$(MC)$a$
Apr1995 054 0606
Jun1995 182 0140
Feb1996 541 0006
Jan2001 R R
May2003 166 0168
Mar2004 765 0001
Feb2005 049 0646
Feb2010 156 0197
Jul2012 283 0053
Apr2014 525 0011
Mar2015 695 0003 Shadingdenotessignificanceatplt005 a pvaluesbasedonMonteCarlotests
TRESBPKirraReefMarineBiotaMonitoring2015 37
60
50
40
30
20
10
0
Soft
Cor
al C
over
()
Kirra Reef Palm Beach Reef
frc environmental
Soft$Coral$
The cover of soft coral was significantly different between sites at both Kirra Reef and PalmBeachReefandduringsomesurveys(notethesignificant interactionbetweensite (location)xsurvey)TherewasnosoftcoralrecordedatKirraReefinMarch2015The coverofsoftcoralhasdeclinedatKirraReefsince2003andhascoveredlessthan2of theavailablesubstratesince2005whichissimilartothecoverofsoftcoraldescribedfor the baseline surveys in 1995 (Figure 317) The cover of soft coral was consistent betweensitesineachsurveyexceptbetweensitesin
sdot April1995atKirraReef
sdot 1996atKirraReef
sdot 2003atPalmBeachReefand
sdot 2014atPalmBeachReef(AppendixD)
Soft corals have historically covered more of the available space on Palm Beach Reef than on Kirra Reef However there was more temporal variability within sites at Palm BeachReefthanatKirraReef(AppendixD)ThecoverofsoftcoralatPalmBeachReef has varied over time and was highest in April 1995 (48 cover) Despite increasing sinceFebruary2005itisstilllowerthanthecoverrecordedduringthebaselinesurveyin April1995(Figure317)
Table39 UnivariatePERMANOVAresults for thedifferences in thecoverofsoft coral betweensurveysandlocations
Factor$ df$ MS$effect$ PseudoF$ p$(perm)$
survey 10 44657 1323 0001
location 1 32922 6620 0117
site(location) 4 49732 266 0036
locationxsurvey 10 40982 1214 0001
site (location) x 40 3376 181 0002 survey
error 924 18688
Shadingdenotessignificanceatplt005
$
TRESBPKirraReefMarineBiotaMonitoring2015 39
frc environmental
Crinoids$
ThereisasignificantdifferencebetweensomesitesatbothKirraReefandParmBeach Reef that varies through time (note the significant interaction between site (location) x survey inTable310) Theabundanceofcrinoidshasbeensimilarbetweensites inall years at Palm Beach ReefH and was different beween sites at Kirra Reef in June 1995 February1996May2003andFebruary2005(AppendixD)Withineachsitetherehas been some natural temporal variability particualrly at Palm Beach Reef sites in 2001 (Appendix D) The mean abundance (individuals 025m2) of crinoids (Figure 318) at KirraReefandPalmBeachReefhasgenerallybeenlessthan2individualsper025m2 andhasdeclinedatboth locationssincethebaselinesurvey inApril1995(Figure319) However the mean abundance of crinoids on Kirra Reef has shown a slight increase sinceFebruary2010(Figure319)
In March 2015 fewer crinoids were recorded at Palm Beach Reef than at Kirra ReefH crinoidshavebeenrareatPalmBeachReefsince2003
The species richness of fish recorded from Kirra Reef across all monitoring events has rangedfrom14to57 InMarch201557specieswereidentifiedat thereefwhichwas similar to April 2014 (53) and higher than previous surveys (Figure 320) Species richnessatPalmBeachReefwas lower(34species)andgenerallyvaried lessbetween surveyscomparedtoKirraReef
InMarch2015 the assemblage of fish at KirraReef comprised species fromall trophic levelsincludingdetritivoresplanktivoresherbivoresandcarnivores(AppendixE)Asin previous surveys the assemblage was dominated by herbivores and planktivores Yellowtail (Trachurus0 novaezelandiae) and striped sea pike (Sphyraena0 obtusata) were the dominant species present in large schools (Figure 321) Australian mado (Atypichthys0 strigatus) ringRtailed surgeon (Acanthurus0 blochii) silver trevally (Pseudocaranx0 georgianus) eastern pomfred (Schuettea0 scalaripinnis) sweep (Scorpis0 lineolatus) and various wrasses were also very abundant releative to other species (AppendixE)
Two new species were observed at Kirra Reef the orangeRband surgeon (Acanthurus0 olivaceus) and the unicornfish (Naso0 sp) Five new species were recorded at Palm BeachReef
No threatened or protected fish species listed under the Queenslandrsquos Nature0 Conservation0Act01992ornationallyundertheEnvironmental0Protection0and0Biodiversity0 Conservation0 Act0 1999 were observed The complete list of species recorded and the relativeabundanceispresentedinAppendixE
TRESBPKirraReefMarineBiotaMonitoring2015 42
60
0
10
20
30
40
50
Num
ber
of F
ish
Spe
cies
Apr-95
Jun-95
Feb-96
Jan-01
May-03
Mar-04
Feb-05
Feb-10
Jul-12
Apr-14
Mar-15
Kirra Reef Palm Beach Reef Location
frc environmental
Figure320 Number of fish species recorded at Kirra Reef and Palm Beach Reef on
ThegreatestchangetotheecologicalconditionofKirraReefsincethebaselinesurveyin 1995 has been the loss of large areas of hard substrate that support benthic flora and faunaThedeliveryoflargesandvolumesduringthestage1dredgingoperations(1995 to1998)andtheinitialoperationofthesandbypasssystem(2001to2008)resultedinan increaseinwaveactionandtidalcurrentsredistributingthissandoverKirraReef
The three major outcrops of Kirra Reef (northern southern and eastern sections) are naturally exposed and covered depending on water and sand movements In March 2015 the rocky outcrops in the northern section of Kirra Reef were exposed and supportedamoderatelydiversebenthicassemblagedominatedbyturfalgaeTherewas arelativelyhighfishdiversityatKirraReefTheecologicalassemblageexhibitedsignsof ongoingstressfromphysicaldisturbanceincludingtheabsenceofsoftcoralsandrarityof hardcoral(MumbyampSteneck2008)HoweverKirraReefhasarelativelyhighcoverof sponges and ascidians Sponges ascidians and crinoids were more abundant at Kirra ReefthanatPalmBeachReefinMarch2015
KirraReefcontinues toprovidehabitatandsupport importantecological functions in the region providing hard substrate for the colonisation of algae and benthic invertebrates and food and refuge for fish As sand levels have stabilised since 2008 assemblages have becomemoresimilar to those recordedprior to implementationof the TRESBP in April1995 Forexamplemacroalgalcover inApril1995andMarch2015wasrelatively similarHoweverassemblagecompositionisstillsignificantlydifferenttothatrecordedin thebaselinesurveysmostnoticeablyduetoa lowercoverofbaresubstrateandhigher coverofturfalgaeandascidianssincesurveyshavebeenperformed
Benthic$Macroalgae$
The cover of macroalgae at Kirra Reef was relatively similar during the 2014 and 2015 surveys and remained well below the peak of nearly 60 cover recorded in January 2001TherewasasteepdeclineinthecoverofmacroalgaebetweenJanuary2001and May2003whichappearedtobestronglyassociatedwith thedecline inreefareaduring that time as well as a decline in the cover of Sargassum sp (an important indicator speciesonKirraReef) SimilardeclineswereevidentatPalmBeachReefbetween the January2001andMay2003surveys
TRESBPKirraReefMarineBiotaMonitoring2015 45
frc environmental
The cover ofmacroalgae at Palm Beach Reef was much lower thanat Kirra Reef over time There are several possible reasons for the lower cover of macroalgae at Palm Beach
sdot PalmBeachReefisdeeperthanKirraReefandgenerallyhashigherturbidityand therefore greater light attenuation The quantity and quality of available light affectsthedistributionandgrowthofmacroalgae(MillerampEtter2008)
sdot Differences in the pattern of recruitment of algal species to the reefs due to differentwatercurrentsandtimingofthesurveys(Kennelly1987b)
sdot Increased competition with turf algae and sessile benthic invertebrates which competeforspacewithmacroalgae(Kennelly1987aHMillerampEtter2008)
sdot PresenceofdifferentspeciesandhigherdensityofherbivoresatPalmBeachReef (particularly sea urchins and herbivorous fish) which graze on macroalgae (McCook1997HJompaampMcCook2002)
Biological assemblages exposed to physical stress typically exhibit greater levels of temporalandspatialvariability(WarwickampClarke1993HChapmanetal1995)Temporal variationinthecoverofmacroalgaeatKirraReefislikelytobeprincipallyduetotheeffect ofphysicaldisturbance fromwaveactionaswellas theassociatedassociatedabrasion andsmotheringbysandTheeffectsofthesephysicaldisturbanceswouldincreasewith thereductionofKirraReefasedgeeffectsarepronouncedandwaterdepth isreduced Increasedsmotheringbysandcanalsoreducediversity(Hatcheretal1989)abundance recruitment growth survival and seasonal regeneration of macroalgae (Umar amp Price 1998HCheshireetal1999)
Changes in the cover of macroalgae on Kirra Reef over time are also likely due to the extentofthereefchangingHthefishandmobileinvertbratesassociatedwiththereefmay have concentrated which would in turn increase grazing pressure Increased grazing pressure from fish and mobile invertebrates can reduce the coverage and diversity of macroalgaeonreefs(McCook1997HJompaampMcCook2002)
Thecoverof turfalgaeatbothKirraReefandPalmBeachReefhasvariedsignificantly betweensurveysPriorto2005turfalgaetypicallycoveredlessoftheavailablesurface areaonKirraReefthanPalmBeachReefInMarch2015themeancoverofturfalgae hasincreasedsincebaselinesurveysin1995andwasrelativelysimilarbetweenreefs(40 plusmn4atKirraReefcomparedto48plusmn4atPalmBeachReef)Thecoverofturfalgaeat Kirra Reef was similar in 2014 and 2015 which was generally higher than previous surveysexceptduringJuly2012whencoverofturfalgaepeakedat67plusmn4
TRESBPKirraReefMarineBiotaMonitoring2015 46
frc environmental
Turfalgaearebecomingadominantcomponentofcommunitiesaroundtheworld likely the result of rapid colonisation of openspace after a disturbance (eg storms) nutrient enrichment andor changes in grazing pressures Turf algae can also reflect a more physically robust growth form suited to high wave energy environments (than foliose macroRalgae)TurfalgaepeakedintheJuly2012surveylikelyrelatedtotheincreasein bare reef exposure following a stormy conditions in early 2009 and between December 2011 and June 2012 Turf algae have been the dominant form of algae on Kirra Reef sincethistimealbeitthecoverlowerthanthe2012survey
Increased cover of turf algae is typically related to good light conditions high concentrationsofnutrientsandlownumbersofgrazerssuchasfish(orconstantgrazing pressure preventing macroalgae colonisation) However the relationship between algal dynamics physical disturbance water quality and herbivore grazing activity is complex andthecoverof turfalgaecanexhibitextremetemporalvariabilityasaconsequenceof the interactionbetween topRdownandbottomRupprocesses (Russ2003HBellwoodetal 2006H Hughes et al 2007H Albert et al 2008H Hoey amp Bellwood 2008H Mumby 2009) Furtherinvestigationwouldberequiredtoreliablydeterminethemechanismsofchangein bothmacroalgaeandturfalgaeassemblagesonthesereefs
Benthic$Macroinvertebrates$
AtKirraReeftheburialandreRemergenceofrockyoutcrops(influencedbytheTRESBP) islikelytohaveincreasedtemporalvariabilityinthedistributionandabundanceofbenthic macroinvertebrates Additional perturbations such as wave action and sand abrasion (each influenced through changes in bathymetry seabed topography and water depth) are likely to have resulted in the decline in cover and diversity of the benthic macroinvertebratesatKirraReefbetweensurveysparticularlybetweenMarch2004and February2005andduringtheseverestormsof2009Benthicmacroinvertebratessuch asascidiansspongeshardcoralandsoftcoralarehighlysusceptible to theeffectsof stormandwavedisturbancephysicalabrasionandburialbysand(KayampKeough1981H Walker et al 2008) which can affect settlement growth rate and survival (Dodge amp Vaisnys1977HRogers1990)
Physical disturbance from sand burial sand abrasion and the action of storm waves appeartokeepthebenthicassemblagesofKirraReefinastateofearlysuccessionItis commonforearlypioneerspeciessuchassomemacroalgaetorecruitrapidlytoahard surface in large numbers allowing these species to dominate assemblages early in the successionaltrajectory(Walkeretal2007)
Afurther indicatorof theearlystateofsuccessionatKirraReef isthatthecoverofhard and soft coral has remained very low (generally lt 5) In March 2015 less than 1
Benthic macroinvertebrate cover may also be affected indirectly through increased competitionwithmacroalgaeforspaceThepresenceoflargemacroalgaecanaffectthe recruitment and survival of sessile benthic invertebrates as fronds moving with wave action sweep and abrade the surface of rocks killing new recruits especially corals (Kennelly1989HMcCooketal2001)Itcantakeseveralyearsforhardandsoftcoralto become dominant on reefs in the SEQ region (SchlacherRHoenlinger et al 2009) Therefore hard coral is not expected to become abundant until several years after the reefhasbeenuncoveredandonlyifthephysicaldisturbanceregimeandsupplyofnew recruitsissufficienttosupportsurvivalandgenerationalsuccessionofthesespeciesThe coverofhardandsoftcoralsatKirraReefwerebothverylowandpatchypriortothestart oftheTRESBP
Sponges and ascidians are highly susceptible to smothering and sand abrasion unless theyhaveathicktunic(outercoveringmadeofkeratin)liketheascidianP0stolonifera0or strong internal keratin silicon or calcareous structures in the case of some species of sponges0(KayampKeough1981HMcGuinness1987HWalkeretal2008)Duetoincreased wave action and sedimentation (which can be influenced by the TRESBP) the mean coverofascidiansandspongeswasexpectedtobemuchloweronKirraReefthanPalm Beach Reef However in March 2015 the cover of sponges was similar between the reefsandthecoverofascidians(otherthanP0stolonifera)wasgreateratKirraReefthan at Palm Beach Reef This suggests that Kirra Reef is slowly recovering from the increasedstressofphysicaldisturbancesuchas increasedwaveactionandsandscour andorthatwaveandstormconditionshavebeenlesssevereinthepastfewyears
Fish$
KirraReefcontinuestosupportahighdiversityofreefRassociatedandpelagic(ienonR reefassociated) fishspecies Despite itsdiminishedsizecompared to1995KirraReef continuestoprovidevaluablehabitatforanumberoffishspeciesfromdifferentfunctional groups
ThereisahighdegreeofinterRannualvariabilityinthespeciesandabundanceofthefish present at Kirra Reef compared with the assemblage at Palm Beach Reef This likely reflectsthetemporalvariabilityintheavailablehabitatasaconsequenceofreefburialand reRemergenceThediversityqualityandarealextentofreefhabitatareimportantfactors influencing the distribution abundance biomass and diversity of reef fish (Bellwood amp Hughes2001HFriedlanderetal2003)Diversityandabundanceoffishcanincreasewith
TRESBPKirraReefMarineBiotaMonitoring2015 48
frc environmental
greaterstructuralcomplexityandincreasedheterogeneityofavailablehabitats(Bellwood ampHughes2001)Thissuggeststhatperiodsofreefburialreducetheoveralldiversityof reefRassociated fish species at Kirra Reef Despite the reduction in overall reef space therewasalargervarietyofhabitats(suchasmarcoalgaeandturfalgae)in2015which was likely to be related to the high diversity of fish assemblages This is particularly importantforseveralspeciesthatdependonthepresenceoflsquostructurersquosuchasprovided by reef habitat (ie oldwife moray eels damselfish and Australian mado that were recordedinMarch2015butwerenotrecordedinJuly2012)
Theabundanceanddiversityof fishare likelytobenegativelyaffectedfollowingperiods of severe weather which create unfavourable conditions for many species and may further exacerbate the affects of abrasion and sedimentation The biomass of fish is knowntodecreasewithincreasingexposuretophysicaldisturbancefromwaveactionand strong currents (Friedlander et al 2003) As our surveys have been undertaken at different times of the year variation in the prevailing conditions at the time of sampling could also influence the types of fish observed (and the amount of reef habitat that is availableatanytime)Manyofthespeciesmayalsobeaffectedbyseasonalchangesin the water temperature such as damselfish which are less abundant in cool waters However theoveralldiversityof the fishassemblageatKirraReef is likely toreflect the sizeoftheoutcropsexposedwithagreaterphysicaldisturbance(fromseaconditionsand sandmovement)andcompetitionHandlesserfoodavailablewhenthereefiscovered
ThepredictedimpactstoKirraReefasaresultoftheTRESBPincludedaccretionofsand around the base of the rock outcrops causing a reduction in extent of reef It was predictedthatsanddeliveryaspartoftheprojectwouldeventuallymimiclsquonaturalrsquopatterns ofsanddispersalandthatthereefwouldreturntoitsnaturalextent(ietheextentpriorto extension of the Tweed River training walls in 1962) The benthic flora and fauna assemblages of the reef the historical reef extent and natural sand transport patterns wereexpectedtoreturntoconditionsobservedbeforetheextensionofthetrainingwalls between 1962 and 1965 However the Environmental Impact Study did not predict the ecologicalconsequencesofboththereducedarealextentandincreasedwaveenergy(a consequenceofdecreaseddepth)thathavebeenrecorded
ThecurrentextentofKirraReef remains less than50of that recorded in1962and in 1995beforethesanddeliverybytheTRESBPcommencedHowevertheextentofreef in1995 wasstrongly influenced by adepletion in sand following the construction of the Tweed River training walls and the Kirra Point groyne Accumulation of sand on Kirra ReefwasobservedtoincreaseasaresultofindirectsandnourishmentbytheTRESBP and the reef has been extensively covered (particuarly between 2005 and 2010) as a result
Whiletheextentofthereefcontinuestochangeovertimethedeliveryofsandaspartof the project now more closely matches the natural rate of longshore sand transport ShortRtermandseasonalchangesintheextentofthereefarenowlikelytobetheresultof waveandcurrentaction(particularlyduringservereweatherevents)thanadirectimpact of the TRESBP Therefore the extent of Kirra Reef in March 2015 is broadly in accordancewithpredictionsmadeintheEISwhichpredictedthatthereefwouldreturnto a condition similar to that exhibited in the preR1960rsquos ie before the extension of the TweedRiverbreakwatersthatinterruptedlittoralsandsupplytothesebeaches
InDecember2013KirraPointgroynewasextendedby30mwiththeexpectationthatthe beach bar would move seaward as a consequence At present Kirra Point groyne is unlikelytohavehadamajorimpactonthearealextentofKirraReefHoweverongoing monitoringbasedonaerialphotographsmayprovidefurtherinsight
Sessile benthic assemblages on Kirra Reef are highly susceptible to the influence of storms and associated wave action (Kay amp Keough 1981H Walker et al 2008) The shallowreefissurroundedbymobilesandwhichcanshiftnaturallyinresponsetowave action during storms causing burial of large sections of Kirra Reef This effect has reduced the availability of rocky substrate for colonisation and the availability of refuge
Fromanexaminationof theextentofKirraReef fromarealmapsandwaveheightdata thereappears tobea relationshipbetween theareaof rockexposedandstormevents Notably in a series of storm events in May 2009 corresponds with large areas of rock becoming exposed (with the reef approximately 100m2 in 2006 and approximately in 1009m2 2009) Further a stormy conditions between December 2011 and July 2012 correspondstotheareaofexposedrockmorethandoublinginsizeWhiletherewasno changetothetotalareaofexposedrockfollowingstormyconditionsinearly2013there wasaclearchangeinthedistibutionofexposedrockduringthistimeSince2013storm conditions have been calm to moderate and there has been little change in the areal extentanddistrubtionofexposedrockatKirraReef
WaveheighttypicallyincreasesduringstormeventsandgiventheshallowdepthofKirra Reef waves are more likely to shoal and break across the reef during storms This increases thephysicaldisturbanceabrasionandsedimentationofbenthicassemblages onKirraReefStormdisturbancecancauselocalreductionsinthespeciesrichnessand abundanceofcoral(Woodleyetal1981HMasselampDone1993HHughes1994HConnellet al 1997) and can alter fish assemblages indirectly through habitat modifications (Kaufman1983HJonesampSyms1998)ordirectlybyincreasingfishmortality(Lassig1983) The hydrodynamic forces produced by wave action are an important source of disturbance in subtidal habitats inflicting damage through direct physical impact and abrasion(UnderwoodampKennelly1990)DirectimpactsfromphysicaldisturbanceatKirra Reefareevidentduringsurveyeventswhenlargefragmentsofmacroalgaearepresentin thewatercolumnoverthereef
Storm and wave action (and associated sedimentation and abrasion) continue to be importantforcesshapingthedistributionandabundanceofbenthicspeciesatKirraReef Increased magnitude and frequency of physical disturbance resulting from increased exposureorsusceptibility tostormsandassociatedwaveaction (asonKirraReef)can lead to a decrease in the diversity of sessile invertebrate assemblages DisturbanceR drivenreductionsinbiodiversityhavethepotentialtoimpactnegativelyonthehealthand productivity of reef ecosystems (Walker et al 2008) Biodiversity is important to reef health given that many of these species (eg sponges bryozoans and ascidians) contribute a range of vital ecosystem services to reefs including nutrient cycling (Scheffers et al 2004) trophic interactions and food webs (Lesser 2006H Pawlik et al 2007) bioRerosion (Rutzler 2002H LopezRVictoria et al 2006) and stabilizing substrata (DiazampRutzler2001HWulff2001)
Theimpactsof increasedwaveactionandsedimentationonthebenthicassemblagesat Kirra Reef are likely to be greatest during and immediately following storm conditions
TRESBPKirraReefMarineBiotaMonitoring2015 51
frc environmental
Partitioningtheinfluenceofstormandwavedrivendisturbancefromthatoftheoperation oftheTRESBPwouldrequireamuchmorestatisticallypowerfulandtemporilyreplicated experimental design Given there is a large collection of wave and storm data by TRESBP this would involve greater temporal sampling of Kirra Reef including event samplingfollowingseverewaveandstormactivity
The data generated by this Kirra Reef biota monitoring program doesnrsquot support statistically rigorous consideration of seasonality (monitoring has been at its most frequentannual)
InApril2014andMarch2015KirraReefcoveredlessthan50ofthereefrsquosextentprior to theoperationof theTRESBP The lossof reefhabitathasreducedtheavailabilityof hard substratum available for colonisation and consequently the abundance of benthic sessileassemblages
The reduced depth of water resulting from the accumulation of sand exacerbates the effects of storms and wave action It is likley that as a consequnece the biological communities of Kirra Reef will reflect earlyRstage succession more frequently and for longerperiods
While there is sufficient structure available frcenvironmentalexpect that Kirra Reef will continuetoprovideimportanthabitatforadiverseassemblageoffishes
TRESBPKirraReefMarineBiotaMonitoring2015 52
frc environmental
5$ Conclusions$
Although there is still a substantial portion of the reef covered compared to before the extension of the Tweed River entrance breakwaters the current extent of Kirra Reef is broadly inaccordancewithpredictionsmadein theEIS Initial lsquocatchRuprsquobypassingand dredgeplacementofsand(between2001and2008)resulted in theburialofKirraReef Subsequentsanddelivery(since2008onwards)morecloselyreflectsnaturalpatternsof longRshoresandtransportandisthereefhasslowlyreRemerged
Theextentofthereefhasbeenrelativelystablesince2013Thishasallowedforsome succession in the benthic assemblages including a relatively high cover of sponges ascidiansandcrinoidsWiththedeliveryofsandmorecloselymatchingthenaturalrateit isexpected the reef willundergoshortRtermchanges in extentdue toseasonal shifts in sand deliveryH however the diversity of benthic assemblages on Kirra Reef is likely to increaseovertimeThiswouldcreatemorespaceforspeciestorecruitandreducesthe influence of sand abrasion and wave damage It was predicted that the areas of Kirra Reef newly exposed in 2012 would undergo a shift from turfRdominated communities to more diverse communities that could include macroalgae sponges ascidians and potentiallyhardandsoftcoralWiththeexceptionofhardandsoftcoralsthisprediction wasconfirmedbytheresultsoftheApril2014andMarch2015surveys
ThediversityoffishesassociatedwithKirraReefisbroadlysimilartothatrecordedprior tothecommencementofsandbypassingin1995Giventhatfisharemobilethegreatest impacts on fish assemblages are likely to be shortRterm changes due to both the prevailingconditionsandchangestheextentofavailablehabitatthatprovidesshelterand foodforavarietyofdifferentspeciesIfKirraReefincreasesinsizethereislikelytobea greater proportion of cryptic benthic species as these species are more typical of assemblagesinalaterstageofsuccession(eg(WillisampAnderson2003))
Assuming a broadly stable delivery rate of sand and consequent stable extent of Kirra ReeflsquorecoveryrsquoislikleytobesubstantivelycompleteFloralandfaunalcommunitieswill undergo succession between severe storm events but are likley to remain relatively dynamic
Albert S Udy J amp Tibbetts I 2008 Responses of algal communities to gradients in herbivorebiomassandwaterqualityinMarovoLagoonSolomonIslandsCoral0 Reefs2773R82
Anderson MJ 2001 A new method for nonRparametric multivariate analysis of varianceAustral0Ecology2632R46
Anderson MJ 2004 PERMDISP0 a0 FORTRAN0 computer0 program0 for0 permutatinoal0 analysis0 of0 multivariate0 dispersions0 (for0 any0 twoSfactor0 ANOVA0 design)0 using0 permutational0 tests Department of Statistics University of Auckland New Zealand
Cannon LR Goeden GB amp Campbell P 1987 Community patterns revealed by trawling in the interRreef regions of the Great Barrier Reef Memoirs0 of0 the0 Queensland0Museum2545R70
Chapman MG Underwood AJ amp Skilleter GA 1995 Variability at different spatial scalesbetweenasubtidalassemblageexposedtothedischargeofsewageand two control assemblages Journal0 of0 Experimental0 Biology0 and0 Ecology 189 103R122
Cheshire AC Miller DJ amp Stewart R (1999) Effect0 of0 dispersed0 sediment0 plumes0 from0beach0sand0replenishment0dredging0on0recruitment0of0phaeophycean0algae0 to0rocky0reefs0in0Gulf0St0Vincent0South0Australia0The0Impact0of0Sand0Dredging0 on0 Benthic0 Community0 Structure0 at0 the0 Port0 Stanvac0 Dredge0 Site0 20 1S39 UniversityofAdelaideAdelaide
ConnellJHHughesTPampWallaceCC1997A30Ryearstudyofcoralabundance recruitment and disturbance at several scales in space and time Ecological0 Monographs67461R488
Diaz MC amp Rutzler K 2001 Sponges an essential component of Caribbean coral reefsBulletin0of0Marine0Science69535R546
DodgeREampVaisnysJR1977Coralpopulationsandgrowthpatternsresponsesto sedimentation and turbidity associated with dredging Journal0 of0 Marine0 Research35715R730
Done TJ 1982 Patterns in the distribution of coral communities across the central GreatBarrierReefCoral0Reefs195R107
Edwards RA amp Smith DA 2005 Subtidal assemblages associated with a geotextile reef insouthReastQueenslandAustraliaMarine0and0Freshwater0Research56 133R142
FisheriesResearchConsultants1991Survey0of0the0Intertidal0and0Subtidal0Rocky0Reefs0 of0 the0 Sunshine0 Coast report prepared for Queensland National Parks and WildlifeService
HarrisonPHarriotVBanksSampHolmesN1998ThecoralcommunitiesofFlinders Reef andMyora Reef in theMoretonBay MarineParkQueensland Australia In Moreton0 Bay0 and0 Catchment Tibbits I Hall N amp Dennison W (Eds) SchoolofMarineScienceUniversityofQueenslandStLuciapp525R536
Hatcher B Johannes R amp Robertson A 1989 Review of research relevant to the conservationofshallowtropicalmarineecosystemsOceanography0and0Marine0 Biology0an0Annual0Review27337R414
Hoey A amp Bellwood D 2008 CrossRshelf variation in the role of parrotfishes on the GreatBarrierReefCoral0Reefs37R47
TRESBPKirraReefMarineBiotaMonitoring2015 56
frc environmental
Hollingsworth P 1975 Environmental Investigation Report Crown Reserve R R68 Currumbin Creek City of the Gold Coast Land Administration Commission unpublishedreport
Hughes TP 1994 Catastrophes phase shifts and large scale degradation of a CaribbeancoralreefScience2651547R1551
Hughes TP Rodrigues MJ Bellwood DR Ceccarelli D HoeghRGuldberg O McCook L Moltschaniwskvi N Pratchett MS Steneck RS amp Willis B 2007Phaseshiftsherbivoryandtheresilienceofcoralreefstoclimatechange Current0Biology17360R365
Hutchinson A Rempel C Taveras V Loder J amp Salmond J 2013 Reef0 Check0 Australia0 South0 East0 Queensland0 Summary0 Report0 2013 report prepared for ReefCheckFoundationLimited
Hyder Consulting 1997 Tweed0 River0 Entrance0 Sand0 Bypassing0 Project0 Permanent0 Bypassing0 System0 0 Environmental0 Impact0 Statement0 0 Impact0 Assessment0 Study report prepared for New South Wales Department of Land and Water Conservation
Jompa J amp McCook LJ 2002 Effects of competition and herbivory on interactions betweenahardcoralandabrownalgaJournal0of0Experimental0Marine0Biology0 and0Ecology27125R39
KayAMampKeoughMJ1981Occupationofpatchesintheepifaunalcommunitieson pier pilings and the bivalve Pinna bicolor at Edithburgh South Australia Oecologia48123R130
KennellyS1987aInhibitionofkelprecruitmentbyturfingalgaeandconsequencesfor an Australian kelp community Journal0 of0 Experimental0 Marine0 Biology0 and0 Ecology11249R60
Kennelly S 1987b Physical disturbances in an Australian kelp community I temporal effectsMarine0Ecology0Progress0Series40145R153
TRESBPKirraReefMarineBiotaMonitoring2015 57
frc environmental
Kennelly S 1989 Effects of kelp canopies on understory species due to shade and scourMarine0Ecology0Progress0Series50215R224
Lassig BR 1983 The effects of a cyclonic storm on coral reef fish assemblages Environmental0Biology0of0Fishes955R63
Lawson S McMahon J amp Boswood P 2001 Environmental management of the construction and operation of a sand bypassing system at the Tweed River EntranceInThe15thAustralasianCoastalandOceanEngineeringConference the 8th Australasian Port and Harbour Conference 25 R 28 September 2001 QueenslandAustralia
Lesser MP 2006 BenthicRpelagic coupling on coral reefs feeding and growth of Caribbean sponges Journal0 of0 Experimental0 Marine0 Biology0 amp0 Ecology 328 277R288
LopezRVictoriaM ZeaSampWei E2006 Competition for spacebetweenencrusting excavatingCaribbeanspongesandothercoral reeforganismsMarine0Ecology0 Progress0Series312113R121
MalcolmHASmithSDAampJordanA2009Usingpatternsofreeffishassemblages to refine a Habitat Classification System for marine parks in NSW Australia Aquatic0Conservation0Marine0and0Freshwater0Ecosystems2083R92
Massel SR amp Done TJ 1993 Effects of cyclone waves on massive coral assemblages on the Great Barrier Reef meteorology hydrodynamics and demographyCoral0Reefs12153R166
Mumby PJ amp Steneck RS 2008 Coral reef management and conservation in light of rapidly evolving ecological paradigms Trends in Ecology amp Evoution 23 555 -563
Murphy HM amp Jenkins GP 2010 Observational methods used in marine spatial monitoring of fishes and associated habitats a review Marine and Freshwater Research 61 236-252
Noriega R 2007 An Overview of Available Information on Sandy Beach Ecology Coastal Sand Dunes Rocky Reefs and Associated Biota on the Gold Coast Griffith Centre for Coastal Management Research Report No 85 report prepared for Griffith University
Parker P (1995) Structure to Reef Fish Assemblages at Julian Rocks Northern New South Wales Masters Thesis Griffith University
Parker PG 1999 Fish assemblages at Julian Rocks and the adjacent waters of northern New South Wales Australia Australian Zoologist 31 134 - 160
Pawlik JR Steindler L Henkel TP Beer S amp Ilan M 2007 Chemical warfare on coral reefs sponge metabolites differentially affect coral symbiosis in situ Limnology and Oceanography 52 907-911
Reef Check 2010 httpwwwreefcheckaustraliaorgdatahtml accessed December 2015
Robinson KI amp Pollard DA 1982 Marine and estuarine reserves in Australia with particular reference to New South Wales Wetlands 2 17 - 26
Rogers CS 1990 Responses of coral reefs and reef organisms to sedimentation Marine Ecology Progress Series 62 185-202
Russ GR 2003 Grazer biomass correlates more strongly with production than with biomass of algal turfs on a coral reef Coral Reefs 22 63-67
Rutzler K 2002 Impact of crustose clionid sponges on Caribbean reef corals Acta Geologica Hispanica 37 61-72
Scheffers SR Nieuwland G Bak RPM amp van Duyl FC 2004 Removal of bacteria and nutrient dynamics within the coral reef framework of Curacao (Netherlands Antilles) Coral Reefs 23 413-422
TRESBP Kirra Reef Marine Biota Monitoring 2015 59
frc environmental
Schlacher-Hoenlinger M Walker S Johnson J Schlacher T amp Hooper J 2009 Biological Monitoring of the Ex-HMAS Brisbane Artificial Reef Phase II - Habitat Values report prepared for Environmental Protection Agency (EPA)
Smith KA 2003 A simple multivariate technique to improve the design of a sampling strategy for age-based fishery monitoring Fisheries Research 64 79-85
Smith S Edwards R Dalton S amp Harrison M 2005 Biological assessment of fish and benthic communities at Palm Beach Bait Reef Gold Coast Queensland report prepared for University of New England
TRESBP 2014 Autum 2009 storms httpwwwtweedsandbypassnswgovauarticles-and-studiesinteresting-itemsautumn-2009-storm updated 4 May 2014 accessed December 2015
TRESBP 2015a Tweed Sand Bypassing Restoring Coastal Sand Drift Improving Boating Access ndash Techinical information httpwwwtweedsandbypassnswgovau__dataassetspdf_file0004552055kir ra-feb-2015pdf acessed December 2015
TRESBP 2015b Waves httpwwwtweedsandbypassnswgovauenvironmental-monitoringcoastal-conditionswaves updated 30 September 2015 accessed December 2015
Umar MJMLJ amp Price IR 1998 Effects of sediment deposition on the seaweed Sargassum on a fringing coral reef Coral Reefs 17 169-177
Underwood AJ amp Kennelly SJ 1990 Ecology of marine algae on rocky shores and subtidal reefs in temperate Australia Hydrobiologia 192 3-20
Walker S Schlacher T amp Schlacher-Hoenlinger M 2007 Spatial heterogeneity of epibenthos on artificial reefs fouling communities in the early stages of colonization on an East Australian shipwreck Marine Ecology 28 435-445
Walker SJ Degnan BM Hooper JNA amp Skilleter GA 2008 Will increased storm intensity from climate change affect biodiversity in non-scleractinian sessile fauna on coral reefs Global Change Biology 14 2755-2770
Warwick RM amp Clarke KR 1993 Increased variability as a symptom of stress in marine communtities Journal of Experimental Marine Biology and Ecology 172 215-216
Thenumberofsitessurveyedhasvariedover timeasaresultof the fluctuating levelof sandcoveringKirraReef
Prior to May 2003 three sites were assessed along the eastern and northern edge of KirraReef(KirraReefOutersites1to3)andthreesiteswereexaminedalongtheinshore marginof the reef (KirraReef Inner sites1 to 3)(MapA1) ReefRedge (ieKirraOuter) siteswerechosentoprovideearlywarningofimpactsfromoffshoreplacementofdredged sandwhilst inshoresites(ieKirraInner)werechosentoindicatewhetherimpactsfrom inshore beach profile development were affecting the reef platform In May 2003 the threeeasternsitesatKirraReef (ieKRO1KRO2andKRI1)werecompletelycovered with bare mobile sand Consequently only the three western sites at Kirra Reef (ie KRO3KRI2andKRI3)supportedbenthicfloraandfaunaInMarch2004theextentof the remainingwesternoutcropof KirraReef had been further reduced so that all inner reefsiteswerecompletelycoveredwithmobilesandConsequentlyonlyasingleoriginal reefsite(ieKRO3)couldbesurveyed(Figure23)Thereforetoprovideanindicationof the condition of the remaining reef two new sites were established (ie KRN1 and KRN2)(Figure23)andsurveyedinMarch2004Theextentofthewesternreefhadbeen further reduced by February 2005 and a third new site (ie KRN3) was established (Figure23)Consequentlyfoursites(KRO3KRN1KRN2andKRN3)weresurveyedin February2005
InFebruary2010fourKirraReefsites(ieKRO3KRO1KRN1andKRN2)wereclearof thesurroundingsandandsupportedbenthic floraand fauna Inaddition several rocks protruded from the sand in the vicinity of site KRI2H these were assessed to provide a quantitativeindicationofbroadRscaletemporalchangestotheinshorereefcommunities
SOURCEScopy Copyright Commonwealth of Australia (Geoscience Australia) 2001 2004 2006copy The State of Queensland (Department of Natural Resources and Mines) 2015copy Nearmap 2014 2015
DATE2015-09-09
DRAWN BYCF
VERSION02
PROJECTIONCoordinate System GDA 1994 MGA Zone 56Projection Transverse MercatorDatum GDA 1994
plusmn SCALE
0 50 100
Metres
Scale 12500 A3
frc environmental
Appendix$B$ Introduction$to$Data$Analysis$Used$
Multivariate$Analyses$
Multivariate statistical techniques are widely used in ecology to assess the similarities relationshipsbetweenassemblagesWhereasunivariateanalysescanonlycompareone variable at a time (eg an index of community structure such as a diversity index or a singleindicatorspecies)multivariateanalysescancomparesamplesbasedontheextent thatassemblagesshareparticulartaxaandabundances(ClarkeampWarwick2001)
Thefirststepofmultivariateanalysisusuallyinvolvesthecreationofamatrixofsimilarity coefficients computed between every pair of samples The coefficient is usually a measureofhowclose theabundance is foreachspecies (definedso that100= total similarity and 0=complete dissimilarity) The Bray Curtis similarity measure is commonlythemostappropriateforbiologicaldata(ClarkeampWarwick2001)
MultidimensionalScaling
NonRmetricmultiRdimensionalscalingordinations(nMDS)attempttoplacesamplesintwo dimensionalspacesothattherankorderofthedistancesbetweensamplesmatchesthe rankorderofthematchingsimilaritiesfromthesimilaritymatrix(ClarkeampWarwick2001) Thisprovidesavisualrepresentationofthesimilaritiesbetweenassemblageswithineach sampleEachoftheaxesisnotrelatedtoanyparticularvalueHinfactaxescanberotated toprovide thebestvisual representationof thedata Ordinationsareparticularlyuseful tools for analysing and visually presenting differences between assemblages Ordinationsareessentiallymapsofsamples inwhich theplacementofsampleson the mapreflectsthesimilarlyofthecommunitytothecommunitiesinothersamples(Clarkeamp Warwick 2001) Distances between samples on an ordination attempt to match the similarities inassemblagestructurenearbypoints representassemblageswithvery few attributes(speciesorabundanceofspecies)Hpoints faraparthavevery fewattributes in common(ClarkeampWarwick2001)
A stress coefficient is calculated to reflect the extent to which the multiRdimensional scalingordinationandthesimilaritymatrixagree(ClarkeampWarwick2001)(iehowwell the multiRdimensional scaling ordination accurately reflects the relationship between samples)Stressvaluesoflt015aregenerallyacceptable
In Figure A1 each freshwater macroinvertebrate sample is represented on the multiRdimensionalscalingordination By lookingat thedistancesbetweeneachsample
ANOSIMisanalogoustoANOVAinunivariatestatistics(Smith2003)AglobalRstatistic iscalculatedtodeterminewhetherthereisasignificantdifferencebetweenallsamplesIf there are differences then pairwise comparisons are conducted to test for differences betweenpairsofsamples(analogoustopostRhoctestsinANOVA)
The R value lies between R1 and +1 (all similarities within groups are less than any similarity between groups) with a value of zero representing the null hypothesis (no differenceamongasetofsamples)(ClarkeampWarwick2001)ComparisonofpairwiseR values can give an indication of how different assemblages are R values close to 0 indicatelittledifferencevaluesaround05indicatesomeoverlapandvaluescloseto1to indicate many or substantial differences In many instances however researches are primarily interestedinwhethertheRvalueisstatisticallydifferentfromzero(usuallyata confidence level of 005) (Clarke amp Warwick 2001) (ie whether they can reject the null hypothesis)
ANOSIM can provide information on whether the (visual) differences between assemblages in the multiRdimensional scaling ordination are significantH it is an independenttestfromthemultiRdimensionalscalingordinationItisbasedontestingthe
TRESBPKirraReefMarineBiotaMonitoring2015 B2
frc environmental
differences between the rank similarities in the similarity matrix not on the distances betweensamplesinthemultiRdimensionalscalingordination(ClarkeampWarwick2001)
PermutationalMultivariateAnalysisofVariance
PERMANOVAisusedtotestsimultaneousresponsesofoneormorevariablestooneor more factors in an a0 priori0 structured design using random permutation of the data to assess significance (Anderson 2004) PERMANOVA generates a pseudo FRstatistic similar to traditional ANOVA but pRvalues are calculated with permutations which does notassumenormaldatadistribution PERMANOVAcanprovide informationonwhether the (visual) differences between assemblages in a multiRdimensional scaling ordination are significantH however it is an independent test from the multiRdimensional scaling ordination
Thelevelofmultivariatedispersionamongsampleswithineachofthetestgroupscanbe examined using the permutational analysis of multivariate dispersions (PERMDISP) routine(Anderson2004)Intraditionalimpactassessmentachangeinthedispersionof datacanalsoindicateanimpact
SimilarityPercentagendashSpeciesContributions
SIMPER analysis provides information on how dissimilar assemblages from various groups are (eg how similar all of the macroinvertebrate samples taken for a particular habitatwithinastreamreachare)andhowsimilareachgroup(egreach)istoanyother group SIMPER analysis also identifies the species taxa that are contributing to the dissimilarity between two assemblages in rank order (ie it identifies which species is contributingthemosttothedifferences)SIMPERanalysismayhelptoidentifypotential lsquoindicatorrsquospeciesForexampleifaparticularspeciesconsistentlycontributesgreatlyto the differences between impacted and unimpacted assemblages it may be a useful indicator Theabundanceofthis indicatorspeciescanthenbecomparedbetweensites usingunivariatetechniquessuchasANOVA
Data is available on request from tresbpprojectofficecrownlandnswgov
TRESBPKirraReefMarineBiotaMonitoring2015 C1
frc environmental
Appendix(D( Pairwise( PERMANOVA( Results
Data is available on request from tresbpprojectofficecrownlandnswgov
TRESBPKirraReefMarineBiotaMonitoring2015 D1
frc environmental
Appendix(E( Relative(Abundance(of(Fish(found(at(Kirra(( ( and(Palm(Beach(Reefs(in(Each(Survey((Data is available on request from tresbpprojectofficecrownlandnswgovau
TRESBPKirraReefMarineBiotaMonitoring2015 E1
Structure Bookmarks
0 50 100 Metres Scale 12500 A3
0 50 100 200 Metres Scale 15000 A3
Kirra Reef
Kirra Reef
Kirra Reef
Kirra Reef
Kirra Reef
Kirra Reef
Map A1Location of Kirra Reef monitoring sites
Table D8 Pairwise comparison of macroalgae cover between sites in each year
Table D15 Pairwise comparison of turf algae cover between sites in each year
Table D29 Pairwise comparison of ascidian cover between sites in each year
Table D43 Pairwise comparison of soft coral cover between sites in each year
Apr-95
Jun-95
Feb-96
Jan-01
May-03
Mar-04
Feb-05
Feb-10
Jul-12
Apr-14
Mar-15
frc environmental
Turf
Alg
ae C
over
()
80
70
60
50
40
30
20
10
0 Kirra Reef Palm Beach Reef
Location
Figure310 Mean cover of turf algae (plusmnSE) at Kirra Reef and Palm Beach Reef in all
surveys
Table33 Univariate PERMANOVA results for differences in the cover of turf algae betweensurveysandlocations
ThemeancoverofspongesatsomesitesatbothKirraReefandPalmBeachReefhas varied significantly during some surveys (note the significant interaction between site (location)xsurvey inTable34HFigure311) However thecoverofspongestendedto bemore temporallyvariable atKirraReef than at Palm Beach Reef (Figure312) The cover of sponges at Kirra Reef varied between sites in February 1996 January 2001 March2004July2012andApril2014 However thecoverofspongesatPalmBeach Reefonlyvariedbetweensites inJanuary2001andFebruary2010 (AppendixD) The cover of sponges varied between survey at each site with 1995 1996 and 2001 most differenttootheryears(AppendixD)
ThemeancoverofspongesatKirraReefdeclinedbetweenMarch2004(20cover)and February 2010 (less than 1 cover) Since 2010 the cover of sponges has increased slightly with sponges covering 8 of the reef in March 2015 (Figure 312) In March 2015thecoverofspongeswashigherthanrecordedduringthebaselinesurveyinApril 1995(3cover)(Figure312)
Figure312 Mean cover of sponges (plusmnSE) at Kirra Reef and Palm Beach Reef on all
surveys
Table34 Univariate PERMANOVA results for differences in the cover of sponges betweensurveysandlocations
Factor$ df$ MS$effect$ PseudoF$ p$(perm)$
survey 10 18576 276 0018
location 1 39671 589 0210
site(location) 4 67354 477 0001
locationxsurvey 10 1490 221 0032
site(location)xsurvey 40 67331 477 0001
error 924 14108
Shadingdenotessignificanceatplt005
TRESBPKirraReefMarineBiotaMonitoring2015 32
frc environmental
Ascidians$
ThemeanabundanceofallascidiansotherthanPyura0stoloniferahasvariedsignifcantly between sites at Kirra Reef and Palm Beach Reef and between surveys at each site (Figure314andnotethesignificantinteractionbetweensite(location)xsurveyinTable 35) The abundance of ascidians was different between sites at Kirra Reef in January 2001May2003March2004February2005andApril2014HanddifferentatPalmBeach ReefinJanuary2001February2005February2010andMarch2015Theabundance ofascidiansvariedbetweensurveysateachsitewith1995beingmostdifferentwhenthe abundanceofascidianswaslow(AppendixD)InMarch2015theabundanceofallother ascidiansonKirraReefandPalmBeachReefwashigherthanpreviouslyreportedinthe baselinesurveyinApril1995(whennoascidianswererecorded)Themeanabundance washigheratKirraReefthanatPalmBeachReef(Figure314)
ThemeanabundanceofPyura0stoloniferahasvariedconsiderablybetweensitesatKirra Reef and Palm Beach Reef over time (note the significant interaction between site (location) x survey in Table 36) In March 2015 the mean abundance (individual per 025m2plusmnSE)of theascidianPstolonifera (Figure313)wassimilaratKirraReefand PalmBeachReef(Figure315)ThemeanabundanceofP0stoloniferahasrangedfrom 02to17individualsper025m2atbothreefssinceMay2003
Figure315 Mean abundance of ascidians (Pyura0 stolonifera) (individuals025m2)
(plusmnSE)atKirraReefandPalmBeachReefinallsurveys
TRESBPKirraReefMarineBiotaMonitoring2015 34
frc environmental
Table35 Univariate PERMANOVA results for the differences in cover of all ascidians otherthanPyura0stolonifera0betweensurveysandlocations
Factor$ df$ MS$effect$ PseudoF$ p$(perm)$
survey 10 26658 474 0001
location 1 13603 710 0104
site(location) 4 19154 149 0212
locationxsurvey 10 2629 468 0001
site(location)xsurvey 40 5621 438 0001
error 924 12828
Shadingdenotessignificanceatplt005
Table36 Univariate PERMANOVA results for the differences in Pyura0 stolonifera densitybetweensurveysandlocations
Factor$ df$ MS$effect$ PseudoF$ p$(perm)$
survey 10 16254 11842 0001
location 1 12445 60881 0206
site(location) 4 20442 56799 0001
locationxsurvey 10 79724 58082 0001
site (location) x 40 13726 38138 0001 survey
error 924 35991
Shadingdenotessignificanceatplt005
$
TRESBPKirraReefMarineBiotaMonitoring2015 35
frc environmental
Hard$Coral$
There was a significant difference between the cover of hard corals at Kirra Reef and PalmBeachReefduringsomesurveys(notethesignificantinteractionbetweenlocationx surveyinTable37)SpecificallytherewassignificantlymorehardcoralatPalmBeach Reef thanKirraReef inFebraury1996March2004April2014andMarch2015(Table 38)
ThecoverofhardcoralistypicallylowonKirraReefaccountingforlessthan2ofthe availablesubstrateInMarch2015hardcoralcoveredlessthan1oftheareaofKirra Reef which was less than the cover recorded during the baseline survey in April 1995 (Figure 316) In contrast hard coral covered 11 of the surface area at Palm Beach ReefwhichwasgreaterthanthecoverrecordedinApril1995(Figure316)
The cover of hard corals at Palm Beach Reef has been more variable over time comparedtothecoverofhardcoralatKirraReef(Figure316)Withtheexceptionofthe surveys inApril1995andJanuary2001when thecoverofhardcoralwas lowonboth reefshardcoralsaretypicallymoreprevalentatPalmBeachReef(Figure316)
Table38 PERMANOVA post hoc pairwise results for the differences in the cover of hardcoralbetweenlocationsineachsurveyevent
Hard$Corals$ Survey$
t$ p$(MC)$a$
Apr1995 054 0606
Jun1995 182 0140
Feb1996 541 0006
Jan2001 R R
May2003 166 0168
Mar2004 765 0001
Feb2005 049 0646
Feb2010 156 0197
Jul2012 283 0053
Apr2014 525 0011
Mar2015 695 0003 Shadingdenotessignificanceatplt005 a pvaluesbasedonMonteCarlotests
TRESBPKirraReefMarineBiotaMonitoring2015 37
60
50
40
30
20
10
0
Soft
Cor
al C
over
()
Kirra Reef Palm Beach Reef
frc environmental
Soft$Coral$
The cover of soft coral was significantly different between sites at both Kirra Reef and PalmBeachReefandduringsomesurveys(notethesignificant interactionbetweensite (location)xsurvey)TherewasnosoftcoralrecordedatKirraReefinMarch2015The coverofsoftcoralhasdeclinedatKirraReefsince2003andhascoveredlessthan2of theavailablesubstratesince2005whichissimilartothecoverofsoftcoraldescribedfor the baseline surveys in 1995 (Figure 317) The cover of soft coral was consistent betweensitesineachsurveyexceptbetweensitesin
sdot April1995atKirraReef
sdot 1996atKirraReef
sdot 2003atPalmBeachReefand
sdot 2014atPalmBeachReef(AppendixD)
Soft corals have historically covered more of the available space on Palm Beach Reef than on Kirra Reef However there was more temporal variability within sites at Palm BeachReefthanatKirraReef(AppendixD)ThecoverofsoftcoralatPalmBeachReef has varied over time and was highest in April 1995 (48 cover) Despite increasing sinceFebruary2005itisstilllowerthanthecoverrecordedduringthebaselinesurveyin April1995(Figure317)
Table39 UnivariatePERMANOVAresults for thedifferences in thecoverofsoft coral betweensurveysandlocations
Factor$ df$ MS$effect$ PseudoF$ p$(perm)$
survey 10 44657 1323 0001
location 1 32922 6620 0117
site(location) 4 49732 266 0036
locationxsurvey 10 40982 1214 0001
site (location) x 40 3376 181 0002 survey
error 924 18688
Shadingdenotessignificanceatplt005
$
TRESBPKirraReefMarineBiotaMonitoring2015 39
frc environmental
Crinoids$
ThereisasignificantdifferencebetweensomesitesatbothKirraReefandParmBeach Reef that varies through time (note the significant interaction between site (location) x survey inTable310) Theabundanceofcrinoidshasbeensimilarbetweensites inall years at Palm Beach ReefH and was different beween sites at Kirra Reef in June 1995 February1996May2003andFebruary2005(AppendixD)Withineachsitetherehas been some natural temporal variability particualrly at Palm Beach Reef sites in 2001 (Appendix D) The mean abundance (individuals 025m2) of crinoids (Figure 318) at KirraReefandPalmBeachReefhasgenerallybeenlessthan2individualsper025m2 andhasdeclinedatboth locationssincethebaselinesurvey inApril1995(Figure319) However the mean abundance of crinoids on Kirra Reef has shown a slight increase sinceFebruary2010(Figure319)
In March 2015 fewer crinoids were recorded at Palm Beach Reef than at Kirra ReefH crinoidshavebeenrareatPalmBeachReefsince2003
The species richness of fish recorded from Kirra Reef across all monitoring events has rangedfrom14to57 InMarch201557specieswereidentifiedat thereefwhichwas similar to April 2014 (53) and higher than previous surveys (Figure 320) Species richnessatPalmBeachReefwas lower(34species)andgenerallyvaried lessbetween surveyscomparedtoKirraReef
InMarch2015 the assemblage of fish at KirraReef comprised species fromall trophic levelsincludingdetritivoresplanktivoresherbivoresandcarnivores(AppendixE)Asin previous surveys the assemblage was dominated by herbivores and planktivores Yellowtail (Trachurus0 novaezelandiae) and striped sea pike (Sphyraena0 obtusata) were the dominant species present in large schools (Figure 321) Australian mado (Atypichthys0 strigatus) ringRtailed surgeon (Acanthurus0 blochii) silver trevally (Pseudocaranx0 georgianus) eastern pomfred (Schuettea0 scalaripinnis) sweep (Scorpis0 lineolatus) and various wrasses were also very abundant releative to other species (AppendixE)
Two new species were observed at Kirra Reef the orangeRband surgeon (Acanthurus0 olivaceus) and the unicornfish (Naso0 sp) Five new species were recorded at Palm BeachReef
No threatened or protected fish species listed under the Queenslandrsquos Nature0 Conservation0Act01992ornationallyundertheEnvironmental0Protection0and0Biodiversity0 Conservation0 Act0 1999 were observed The complete list of species recorded and the relativeabundanceispresentedinAppendixE
TRESBPKirraReefMarineBiotaMonitoring2015 42
60
0
10
20
30
40
50
Num
ber
of F
ish
Spe
cies
Apr-95
Jun-95
Feb-96
Jan-01
May-03
Mar-04
Feb-05
Feb-10
Jul-12
Apr-14
Mar-15
Kirra Reef Palm Beach Reef Location
frc environmental
Figure320 Number of fish species recorded at Kirra Reef and Palm Beach Reef on
ThegreatestchangetotheecologicalconditionofKirraReefsincethebaselinesurveyin 1995 has been the loss of large areas of hard substrate that support benthic flora and faunaThedeliveryoflargesandvolumesduringthestage1dredgingoperations(1995 to1998)andtheinitialoperationofthesandbypasssystem(2001to2008)resultedinan increaseinwaveactionandtidalcurrentsredistributingthissandoverKirraReef
The three major outcrops of Kirra Reef (northern southern and eastern sections) are naturally exposed and covered depending on water and sand movements In March 2015 the rocky outcrops in the northern section of Kirra Reef were exposed and supportedamoderatelydiversebenthicassemblagedominatedbyturfalgaeTherewas arelativelyhighfishdiversityatKirraReefTheecologicalassemblageexhibitedsignsof ongoingstressfromphysicaldisturbanceincludingtheabsenceofsoftcoralsandrarityof hardcoral(MumbyampSteneck2008)HoweverKirraReefhasarelativelyhighcoverof sponges and ascidians Sponges ascidians and crinoids were more abundant at Kirra ReefthanatPalmBeachReefinMarch2015
KirraReefcontinues toprovidehabitatandsupport importantecological functions in the region providing hard substrate for the colonisation of algae and benthic invertebrates and food and refuge for fish As sand levels have stabilised since 2008 assemblages have becomemoresimilar to those recordedprior to implementationof the TRESBP in April1995 Forexamplemacroalgalcover inApril1995andMarch2015wasrelatively similarHoweverassemblagecompositionisstillsignificantlydifferenttothatrecordedin thebaselinesurveysmostnoticeablyduetoa lowercoverofbaresubstrateandhigher coverofturfalgaeandascidianssincesurveyshavebeenperformed
Benthic$Macroalgae$
The cover of macroalgae at Kirra Reef was relatively similar during the 2014 and 2015 surveys and remained well below the peak of nearly 60 cover recorded in January 2001TherewasasteepdeclineinthecoverofmacroalgaebetweenJanuary2001and May2003whichappearedtobestronglyassociatedwith thedecline inreefareaduring that time as well as a decline in the cover of Sargassum sp (an important indicator speciesonKirraReef) SimilardeclineswereevidentatPalmBeachReefbetween the January2001andMay2003surveys
TRESBPKirraReefMarineBiotaMonitoring2015 45
frc environmental
The cover ofmacroalgae at Palm Beach Reef was much lower thanat Kirra Reef over time There are several possible reasons for the lower cover of macroalgae at Palm Beach
sdot PalmBeachReefisdeeperthanKirraReefandgenerallyhashigherturbidityand therefore greater light attenuation The quantity and quality of available light affectsthedistributionandgrowthofmacroalgae(MillerampEtter2008)
sdot Differences in the pattern of recruitment of algal species to the reefs due to differentwatercurrentsandtimingofthesurveys(Kennelly1987b)
sdot Increased competition with turf algae and sessile benthic invertebrates which competeforspacewithmacroalgae(Kennelly1987aHMillerampEtter2008)
sdot PresenceofdifferentspeciesandhigherdensityofherbivoresatPalmBeachReef (particularly sea urchins and herbivorous fish) which graze on macroalgae (McCook1997HJompaampMcCook2002)
Biological assemblages exposed to physical stress typically exhibit greater levels of temporalandspatialvariability(WarwickampClarke1993HChapmanetal1995)Temporal variationinthecoverofmacroalgaeatKirraReefislikelytobeprincipallyduetotheeffect ofphysicaldisturbance fromwaveactionaswellas theassociatedassociatedabrasion andsmotheringbysandTheeffectsofthesephysicaldisturbanceswouldincreasewith thereductionofKirraReefasedgeeffectsarepronouncedandwaterdepth isreduced Increasedsmotheringbysandcanalsoreducediversity(Hatcheretal1989)abundance recruitment growth survival and seasonal regeneration of macroalgae (Umar amp Price 1998HCheshireetal1999)
Changes in the cover of macroalgae on Kirra Reef over time are also likely due to the extentofthereefchangingHthefishandmobileinvertbratesassociatedwiththereefmay have concentrated which would in turn increase grazing pressure Increased grazing pressure from fish and mobile invertebrates can reduce the coverage and diversity of macroalgaeonreefs(McCook1997HJompaampMcCook2002)
Thecoverof turfalgaeatbothKirraReefandPalmBeachReefhasvariedsignificantly betweensurveysPriorto2005turfalgaetypicallycoveredlessoftheavailablesurface areaonKirraReefthanPalmBeachReefInMarch2015themeancoverofturfalgae hasincreasedsincebaselinesurveysin1995andwasrelativelysimilarbetweenreefs(40 plusmn4atKirraReefcomparedto48plusmn4atPalmBeachReef)Thecoverofturfalgaeat Kirra Reef was similar in 2014 and 2015 which was generally higher than previous surveysexceptduringJuly2012whencoverofturfalgaepeakedat67plusmn4
TRESBPKirraReefMarineBiotaMonitoring2015 46
frc environmental
Turfalgaearebecomingadominantcomponentofcommunitiesaroundtheworld likely the result of rapid colonisation of openspace after a disturbance (eg storms) nutrient enrichment andor changes in grazing pressures Turf algae can also reflect a more physically robust growth form suited to high wave energy environments (than foliose macroRalgae)TurfalgaepeakedintheJuly2012surveylikelyrelatedtotheincreasein bare reef exposure following a stormy conditions in early 2009 and between December 2011 and June 2012 Turf algae have been the dominant form of algae on Kirra Reef sincethistimealbeitthecoverlowerthanthe2012survey
Increased cover of turf algae is typically related to good light conditions high concentrationsofnutrientsandlownumbersofgrazerssuchasfish(orconstantgrazing pressure preventing macroalgae colonisation) However the relationship between algal dynamics physical disturbance water quality and herbivore grazing activity is complex andthecoverof turfalgaecanexhibitextremetemporalvariabilityasaconsequenceof the interactionbetween topRdownandbottomRupprocesses (Russ2003HBellwoodetal 2006H Hughes et al 2007H Albert et al 2008H Hoey amp Bellwood 2008H Mumby 2009) Furtherinvestigationwouldberequiredtoreliablydeterminethemechanismsofchangein bothmacroalgaeandturfalgaeassemblagesonthesereefs
Benthic$Macroinvertebrates$
AtKirraReeftheburialandreRemergenceofrockyoutcrops(influencedbytheTRESBP) islikelytohaveincreasedtemporalvariabilityinthedistributionandabundanceofbenthic macroinvertebrates Additional perturbations such as wave action and sand abrasion (each influenced through changes in bathymetry seabed topography and water depth) are likely to have resulted in the decline in cover and diversity of the benthic macroinvertebratesatKirraReefbetweensurveysparticularlybetweenMarch2004and February2005andduringtheseverestormsof2009Benthicmacroinvertebratessuch asascidiansspongeshardcoralandsoftcoralarehighlysusceptible to theeffectsof stormandwavedisturbancephysicalabrasionandburialbysand(KayampKeough1981H Walker et al 2008) which can affect settlement growth rate and survival (Dodge amp Vaisnys1977HRogers1990)
Physical disturbance from sand burial sand abrasion and the action of storm waves appeartokeepthebenthicassemblagesofKirraReefinastateofearlysuccessionItis commonforearlypioneerspeciessuchassomemacroalgaetorecruitrapidlytoahard surface in large numbers allowing these species to dominate assemblages early in the successionaltrajectory(Walkeretal2007)
Afurther indicatorof theearlystateofsuccessionatKirraReef isthatthecoverofhard and soft coral has remained very low (generally lt 5) In March 2015 less than 1
Benthic macroinvertebrate cover may also be affected indirectly through increased competitionwithmacroalgaeforspaceThepresenceoflargemacroalgaecanaffectthe recruitment and survival of sessile benthic invertebrates as fronds moving with wave action sweep and abrade the surface of rocks killing new recruits especially corals (Kennelly1989HMcCooketal2001)Itcantakeseveralyearsforhardandsoftcoralto become dominant on reefs in the SEQ region (SchlacherRHoenlinger et al 2009) Therefore hard coral is not expected to become abundant until several years after the reefhasbeenuncoveredandonlyifthephysicaldisturbanceregimeandsupplyofnew recruitsissufficienttosupportsurvivalandgenerationalsuccessionofthesespeciesThe coverofhardandsoftcoralsatKirraReefwerebothverylowandpatchypriortothestart oftheTRESBP
Sponges and ascidians are highly susceptible to smothering and sand abrasion unless theyhaveathicktunic(outercoveringmadeofkeratin)liketheascidianP0stolonifera0or strong internal keratin silicon or calcareous structures in the case of some species of sponges0(KayampKeough1981HMcGuinness1987HWalkeretal2008)Duetoincreased wave action and sedimentation (which can be influenced by the TRESBP) the mean coverofascidiansandspongeswasexpectedtobemuchloweronKirraReefthanPalm Beach Reef However in March 2015 the cover of sponges was similar between the reefsandthecoverofascidians(otherthanP0stolonifera)wasgreateratKirraReefthan at Palm Beach Reef This suggests that Kirra Reef is slowly recovering from the increasedstressofphysicaldisturbancesuchas increasedwaveactionandsandscour andorthatwaveandstormconditionshavebeenlesssevereinthepastfewyears
Fish$
KirraReefcontinuestosupportahighdiversityofreefRassociatedandpelagic(ienonR reefassociated) fishspecies Despite itsdiminishedsizecompared to1995KirraReef continuestoprovidevaluablehabitatforanumberoffishspeciesfromdifferentfunctional groups
ThereisahighdegreeofinterRannualvariabilityinthespeciesandabundanceofthefish present at Kirra Reef compared with the assemblage at Palm Beach Reef This likely reflectsthetemporalvariabilityintheavailablehabitatasaconsequenceofreefburialand reRemergenceThediversityqualityandarealextentofreefhabitatareimportantfactors influencing the distribution abundance biomass and diversity of reef fish (Bellwood amp Hughes2001HFriedlanderetal2003)Diversityandabundanceoffishcanincreasewith
TRESBPKirraReefMarineBiotaMonitoring2015 48
frc environmental
greaterstructuralcomplexityandincreasedheterogeneityofavailablehabitats(Bellwood ampHughes2001)Thissuggeststhatperiodsofreefburialreducetheoveralldiversityof reefRassociated fish species at Kirra Reef Despite the reduction in overall reef space therewasalargervarietyofhabitats(suchasmarcoalgaeandturfalgae)in2015which was likely to be related to the high diversity of fish assemblages This is particularly importantforseveralspeciesthatdependonthepresenceoflsquostructurersquosuchasprovided by reef habitat (ie oldwife moray eels damselfish and Australian mado that were recordedinMarch2015butwerenotrecordedinJuly2012)
Theabundanceanddiversityof fishare likelytobenegativelyaffectedfollowingperiods of severe weather which create unfavourable conditions for many species and may further exacerbate the affects of abrasion and sedimentation The biomass of fish is knowntodecreasewithincreasingexposuretophysicaldisturbancefromwaveactionand strong currents (Friedlander et al 2003) As our surveys have been undertaken at different times of the year variation in the prevailing conditions at the time of sampling could also influence the types of fish observed (and the amount of reef habitat that is availableatanytime)Manyofthespeciesmayalsobeaffectedbyseasonalchangesin the water temperature such as damselfish which are less abundant in cool waters However theoveralldiversityof the fishassemblageatKirraReef is likely toreflect the sizeoftheoutcropsexposedwithagreaterphysicaldisturbance(fromseaconditionsand sandmovement)andcompetitionHandlesserfoodavailablewhenthereefiscovered
ThepredictedimpactstoKirraReefasaresultoftheTRESBPincludedaccretionofsand around the base of the rock outcrops causing a reduction in extent of reef It was predictedthatsanddeliveryaspartoftheprojectwouldeventuallymimiclsquonaturalrsquopatterns ofsanddispersalandthatthereefwouldreturntoitsnaturalextent(ietheextentpriorto extension of the Tweed River training walls in 1962) The benthic flora and fauna assemblages of the reef the historical reef extent and natural sand transport patterns wereexpectedtoreturntoconditionsobservedbeforetheextensionofthetrainingwalls between 1962 and 1965 However the Environmental Impact Study did not predict the ecologicalconsequencesofboththereducedarealextentandincreasedwaveenergy(a consequenceofdecreaseddepth)thathavebeenrecorded
ThecurrentextentofKirraReef remains less than50of that recorded in1962and in 1995beforethesanddeliverybytheTRESBPcommencedHowevertheextentofreef in1995 wasstrongly influenced by adepletion in sand following the construction of the Tweed River training walls and the Kirra Point groyne Accumulation of sand on Kirra ReefwasobservedtoincreaseasaresultofindirectsandnourishmentbytheTRESBP and the reef has been extensively covered (particuarly between 2005 and 2010) as a result
Whiletheextentofthereefcontinuestochangeovertimethedeliveryofsandaspartof the project now more closely matches the natural rate of longshore sand transport ShortRtermandseasonalchangesintheextentofthereefarenowlikelytobetheresultof waveandcurrentaction(particularlyduringservereweatherevents)thanadirectimpact of the TRESBP Therefore the extent of Kirra Reef in March 2015 is broadly in accordancewithpredictionsmadeintheEISwhichpredictedthatthereefwouldreturnto a condition similar to that exhibited in the preR1960rsquos ie before the extension of the TweedRiverbreakwatersthatinterruptedlittoralsandsupplytothesebeaches
InDecember2013KirraPointgroynewasextendedby30mwiththeexpectationthatthe beach bar would move seaward as a consequence At present Kirra Point groyne is unlikelytohavehadamajorimpactonthearealextentofKirraReefHoweverongoing monitoringbasedonaerialphotographsmayprovidefurtherinsight
Sessile benthic assemblages on Kirra Reef are highly susceptible to the influence of storms and associated wave action (Kay amp Keough 1981H Walker et al 2008) The shallowreefissurroundedbymobilesandwhichcanshiftnaturallyinresponsetowave action during storms causing burial of large sections of Kirra Reef This effect has reduced the availability of rocky substrate for colonisation and the availability of refuge
Fromanexaminationof theextentofKirraReef fromarealmapsandwaveheightdata thereappears tobea relationshipbetween theareaof rockexposedandstormevents Notably in a series of storm events in May 2009 corresponds with large areas of rock becoming exposed (with the reef approximately 100m2 in 2006 and approximately in 1009m2 2009) Further a stormy conditions between December 2011 and July 2012 correspondstotheareaofexposedrockmorethandoublinginsizeWhiletherewasno changetothetotalareaofexposedrockfollowingstormyconditionsinearly2013there wasaclearchangeinthedistibutionofexposedrockduringthistimeSince2013storm conditions have been calm to moderate and there has been little change in the areal extentanddistrubtionofexposedrockatKirraReef
WaveheighttypicallyincreasesduringstormeventsandgiventheshallowdepthofKirra Reef waves are more likely to shoal and break across the reef during storms This increases thephysicaldisturbanceabrasionandsedimentationofbenthicassemblages onKirraReefStormdisturbancecancauselocalreductionsinthespeciesrichnessand abundanceofcoral(Woodleyetal1981HMasselampDone1993HHughes1994HConnellet al 1997) and can alter fish assemblages indirectly through habitat modifications (Kaufman1983HJonesampSyms1998)ordirectlybyincreasingfishmortality(Lassig1983) The hydrodynamic forces produced by wave action are an important source of disturbance in subtidal habitats inflicting damage through direct physical impact and abrasion(UnderwoodampKennelly1990)DirectimpactsfromphysicaldisturbanceatKirra Reefareevidentduringsurveyeventswhenlargefragmentsofmacroalgaearepresentin thewatercolumnoverthereef
Storm and wave action (and associated sedimentation and abrasion) continue to be importantforcesshapingthedistributionandabundanceofbenthicspeciesatKirraReef Increased magnitude and frequency of physical disturbance resulting from increased exposureorsusceptibility tostormsandassociatedwaveaction (asonKirraReef)can lead to a decrease in the diversity of sessile invertebrate assemblages DisturbanceR drivenreductionsinbiodiversityhavethepotentialtoimpactnegativelyonthehealthand productivity of reef ecosystems (Walker et al 2008) Biodiversity is important to reef health given that many of these species (eg sponges bryozoans and ascidians) contribute a range of vital ecosystem services to reefs including nutrient cycling (Scheffers et al 2004) trophic interactions and food webs (Lesser 2006H Pawlik et al 2007) bioRerosion (Rutzler 2002H LopezRVictoria et al 2006) and stabilizing substrata (DiazampRutzler2001HWulff2001)
Theimpactsof increasedwaveactionandsedimentationonthebenthicassemblagesat Kirra Reef are likely to be greatest during and immediately following storm conditions
TRESBPKirraReefMarineBiotaMonitoring2015 51
frc environmental
Partitioningtheinfluenceofstormandwavedrivendisturbancefromthatoftheoperation oftheTRESBPwouldrequireamuchmorestatisticallypowerfulandtemporilyreplicated experimental design Given there is a large collection of wave and storm data by TRESBP this would involve greater temporal sampling of Kirra Reef including event samplingfollowingseverewaveandstormactivity
The data generated by this Kirra Reef biota monitoring program doesnrsquot support statistically rigorous consideration of seasonality (monitoring has been at its most frequentannual)
InApril2014andMarch2015KirraReefcoveredlessthan50ofthereefrsquosextentprior to theoperationof theTRESBP The lossof reefhabitathasreducedtheavailabilityof hard substratum available for colonisation and consequently the abundance of benthic sessileassemblages
The reduced depth of water resulting from the accumulation of sand exacerbates the effects of storms and wave action It is likley that as a consequnece the biological communities of Kirra Reef will reflect earlyRstage succession more frequently and for longerperiods
While there is sufficient structure available frcenvironmentalexpect that Kirra Reef will continuetoprovideimportanthabitatforadiverseassemblageoffishes
TRESBPKirraReefMarineBiotaMonitoring2015 52
frc environmental
5$ Conclusions$
Although there is still a substantial portion of the reef covered compared to before the extension of the Tweed River entrance breakwaters the current extent of Kirra Reef is broadly inaccordancewithpredictionsmadein theEIS Initial lsquocatchRuprsquobypassingand dredgeplacementofsand(between2001and2008)resulted in theburialofKirraReef Subsequentsanddelivery(since2008onwards)morecloselyreflectsnaturalpatternsof longRshoresandtransportandisthereefhasslowlyreRemerged
Theextentofthereefhasbeenrelativelystablesince2013Thishasallowedforsome succession in the benthic assemblages including a relatively high cover of sponges ascidiansandcrinoidsWiththedeliveryofsandmorecloselymatchingthenaturalrateit isexpected the reef willundergoshortRtermchanges in extentdue toseasonal shifts in sand deliveryH however the diversity of benthic assemblages on Kirra Reef is likely to increaseovertimeThiswouldcreatemorespaceforspeciestorecruitandreducesthe influence of sand abrasion and wave damage It was predicted that the areas of Kirra Reef newly exposed in 2012 would undergo a shift from turfRdominated communities to more diverse communities that could include macroalgae sponges ascidians and potentiallyhardandsoftcoralWiththeexceptionofhardandsoftcoralsthisprediction wasconfirmedbytheresultsoftheApril2014andMarch2015surveys
ThediversityoffishesassociatedwithKirraReefisbroadlysimilartothatrecordedprior tothecommencementofsandbypassingin1995Giventhatfisharemobilethegreatest impacts on fish assemblages are likely to be shortRterm changes due to both the prevailingconditionsandchangestheextentofavailablehabitatthatprovidesshelterand foodforavarietyofdifferentspeciesIfKirraReefincreasesinsizethereislikelytobea greater proportion of cryptic benthic species as these species are more typical of assemblagesinalaterstageofsuccession(eg(WillisampAnderson2003))
Assuming a broadly stable delivery rate of sand and consequent stable extent of Kirra ReeflsquorecoveryrsquoislikleytobesubstantivelycompleteFloralandfaunalcommunitieswill undergo succession between severe storm events but are likley to remain relatively dynamic
Albert S Udy J amp Tibbetts I 2008 Responses of algal communities to gradients in herbivorebiomassandwaterqualityinMarovoLagoonSolomonIslandsCoral0 Reefs2773R82
Anderson MJ 2001 A new method for nonRparametric multivariate analysis of varianceAustral0Ecology2632R46
Anderson MJ 2004 PERMDISP0 a0 FORTRAN0 computer0 program0 for0 permutatinoal0 analysis0 of0 multivariate0 dispersions0 (for0 any0 twoSfactor0 ANOVA0 design)0 using0 permutational0 tests Department of Statistics University of Auckland New Zealand
Cannon LR Goeden GB amp Campbell P 1987 Community patterns revealed by trawling in the interRreef regions of the Great Barrier Reef Memoirs0 of0 the0 Queensland0Museum2545R70
Chapman MG Underwood AJ amp Skilleter GA 1995 Variability at different spatial scalesbetweenasubtidalassemblageexposedtothedischargeofsewageand two control assemblages Journal0 of0 Experimental0 Biology0 and0 Ecology 189 103R122
Cheshire AC Miller DJ amp Stewart R (1999) Effect0 of0 dispersed0 sediment0 plumes0 from0beach0sand0replenishment0dredging0on0recruitment0of0phaeophycean0algae0 to0rocky0reefs0in0Gulf0St0Vincent0South0Australia0The0Impact0of0Sand0Dredging0 on0 Benthic0 Community0 Structure0 at0 the0 Port0 Stanvac0 Dredge0 Site0 20 1S39 UniversityofAdelaideAdelaide
ConnellJHHughesTPampWallaceCC1997A30Ryearstudyofcoralabundance recruitment and disturbance at several scales in space and time Ecological0 Monographs67461R488
Diaz MC amp Rutzler K 2001 Sponges an essential component of Caribbean coral reefsBulletin0of0Marine0Science69535R546
DodgeREampVaisnysJR1977Coralpopulationsandgrowthpatternsresponsesto sedimentation and turbidity associated with dredging Journal0 of0 Marine0 Research35715R730
Done TJ 1982 Patterns in the distribution of coral communities across the central GreatBarrierReefCoral0Reefs195R107
Edwards RA amp Smith DA 2005 Subtidal assemblages associated with a geotextile reef insouthReastQueenslandAustraliaMarine0and0Freshwater0Research56 133R142
FisheriesResearchConsultants1991Survey0of0the0Intertidal0and0Subtidal0Rocky0Reefs0 of0 the0 Sunshine0 Coast report prepared for Queensland National Parks and WildlifeService
HarrisonPHarriotVBanksSampHolmesN1998ThecoralcommunitiesofFlinders Reef andMyora Reef in theMoretonBay MarineParkQueensland Australia In Moreton0 Bay0 and0 Catchment Tibbits I Hall N amp Dennison W (Eds) SchoolofMarineScienceUniversityofQueenslandStLuciapp525R536
Hatcher B Johannes R amp Robertson A 1989 Review of research relevant to the conservationofshallowtropicalmarineecosystemsOceanography0and0Marine0 Biology0an0Annual0Review27337R414
Hoey A amp Bellwood D 2008 CrossRshelf variation in the role of parrotfishes on the GreatBarrierReefCoral0Reefs37R47
TRESBPKirraReefMarineBiotaMonitoring2015 56
frc environmental
Hollingsworth P 1975 Environmental Investigation Report Crown Reserve R R68 Currumbin Creek City of the Gold Coast Land Administration Commission unpublishedreport
Hughes TP 1994 Catastrophes phase shifts and large scale degradation of a CaribbeancoralreefScience2651547R1551
Hughes TP Rodrigues MJ Bellwood DR Ceccarelli D HoeghRGuldberg O McCook L Moltschaniwskvi N Pratchett MS Steneck RS amp Willis B 2007Phaseshiftsherbivoryandtheresilienceofcoralreefstoclimatechange Current0Biology17360R365
Hutchinson A Rempel C Taveras V Loder J amp Salmond J 2013 Reef0 Check0 Australia0 South0 East0 Queensland0 Summary0 Report0 2013 report prepared for ReefCheckFoundationLimited
Hyder Consulting 1997 Tweed0 River0 Entrance0 Sand0 Bypassing0 Project0 Permanent0 Bypassing0 System0 0 Environmental0 Impact0 Statement0 0 Impact0 Assessment0 Study report prepared for New South Wales Department of Land and Water Conservation
Jompa J amp McCook LJ 2002 Effects of competition and herbivory on interactions betweenahardcoralandabrownalgaJournal0of0Experimental0Marine0Biology0 and0Ecology27125R39
KayAMampKeoughMJ1981Occupationofpatchesintheepifaunalcommunitieson pier pilings and the bivalve Pinna bicolor at Edithburgh South Australia Oecologia48123R130
KennellyS1987aInhibitionofkelprecruitmentbyturfingalgaeandconsequencesfor an Australian kelp community Journal0 of0 Experimental0 Marine0 Biology0 and0 Ecology11249R60
Kennelly S 1987b Physical disturbances in an Australian kelp community I temporal effectsMarine0Ecology0Progress0Series40145R153
TRESBPKirraReefMarineBiotaMonitoring2015 57
frc environmental
Kennelly S 1989 Effects of kelp canopies on understory species due to shade and scourMarine0Ecology0Progress0Series50215R224
Lassig BR 1983 The effects of a cyclonic storm on coral reef fish assemblages Environmental0Biology0of0Fishes955R63
Lawson S McMahon J amp Boswood P 2001 Environmental management of the construction and operation of a sand bypassing system at the Tweed River EntranceInThe15thAustralasianCoastalandOceanEngineeringConference the 8th Australasian Port and Harbour Conference 25 R 28 September 2001 QueenslandAustralia
Lesser MP 2006 BenthicRpelagic coupling on coral reefs feeding and growth of Caribbean sponges Journal0 of0 Experimental0 Marine0 Biology0 amp0 Ecology 328 277R288
LopezRVictoriaM ZeaSampWei E2006 Competition for spacebetweenencrusting excavatingCaribbeanspongesandothercoral reeforganismsMarine0Ecology0 Progress0Series312113R121
MalcolmHASmithSDAampJordanA2009Usingpatternsofreeffishassemblages to refine a Habitat Classification System for marine parks in NSW Australia Aquatic0Conservation0Marine0and0Freshwater0Ecosystems2083R92
Massel SR amp Done TJ 1993 Effects of cyclone waves on massive coral assemblages on the Great Barrier Reef meteorology hydrodynamics and demographyCoral0Reefs12153R166
Mumby PJ amp Steneck RS 2008 Coral reef management and conservation in light of rapidly evolving ecological paradigms Trends in Ecology amp Evoution 23 555 -563
Murphy HM amp Jenkins GP 2010 Observational methods used in marine spatial monitoring of fishes and associated habitats a review Marine and Freshwater Research 61 236-252
Noriega R 2007 An Overview of Available Information on Sandy Beach Ecology Coastal Sand Dunes Rocky Reefs and Associated Biota on the Gold Coast Griffith Centre for Coastal Management Research Report No 85 report prepared for Griffith University
Parker P (1995) Structure to Reef Fish Assemblages at Julian Rocks Northern New South Wales Masters Thesis Griffith University
Parker PG 1999 Fish assemblages at Julian Rocks and the adjacent waters of northern New South Wales Australia Australian Zoologist 31 134 - 160
Pawlik JR Steindler L Henkel TP Beer S amp Ilan M 2007 Chemical warfare on coral reefs sponge metabolites differentially affect coral symbiosis in situ Limnology and Oceanography 52 907-911
Reef Check 2010 httpwwwreefcheckaustraliaorgdatahtml accessed December 2015
Robinson KI amp Pollard DA 1982 Marine and estuarine reserves in Australia with particular reference to New South Wales Wetlands 2 17 - 26
Rogers CS 1990 Responses of coral reefs and reef organisms to sedimentation Marine Ecology Progress Series 62 185-202
Russ GR 2003 Grazer biomass correlates more strongly with production than with biomass of algal turfs on a coral reef Coral Reefs 22 63-67
Rutzler K 2002 Impact of crustose clionid sponges on Caribbean reef corals Acta Geologica Hispanica 37 61-72
Scheffers SR Nieuwland G Bak RPM amp van Duyl FC 2004 Removal of bacteria and nutrient dynamics within the coral reef framework of Curacao (Netherlands Antilles) Coral Reefs 23 413-422
TRESBP Kirra Reef Marine Biota Monitoring 2015 59
frc environmental
Schlacher-Hoenlinger M Walker S Johnson J Schlacher T amp Hooper J 2009 Biological Monitoring of the Ex-HMAS Brisbane Artificial Reef Phase II - Habitat Values report prepared for Environmental Protection Agency (EPA)
Smith KA 2003 A simple multivariate technique to improve the design of a sampling strategy for age-based fishery monitoring Fisheries Research 64 79-85
Smith S Edwards R Dalton S amp Harrison M 2005 Biological assessment of fish and benthic communities at Palm Beach Bait Reef Gold Coast Queensland report prepared for University of New England
TRESBP 2014 Autum 2009 storms httpwwwtweedsandbypassnswgovauarticles-and-studiesinteresting-itemsautumn-2009-storm updated 4 May 2014 accessed December 2015
TRESBP 2015a Tweed Sand Bypassing Restoring Coastal Sand Drift Improving Boating Access ndash Techinical information httpwwwtweedsandbypassnswgovau__dataassetspdf_file0004552055kir ra-feb-2015pdf acessed December 2015
TRESBP 2015b Waves httpwwwtweedsandbypassnswgovauenvironmental-monitoringcoastal-conditionswaves updated 30 September 2015 accessed December 2015
Umar MJMLJ amp Price IR 1998 Effects of sediment deposition on the seaweed Sargassum on a fringing coral reef Coral Reefs 17 169-177
Underwood AJ amp Kennelly SJ 1990 Ecology of marine algae on rocky shores and subtidal reefs in temperate Australia Hydrobiologia 192 3-20
Walker S Schlacher T amp Schlacher-Hoenlinger M 2007 Spatial heterogeneity of epibenthos on artificial reefs fouling communities in the early stages of colonization on an East Australian shipwreck Marine Ecology 28 435-445
Walker SJ Degnan BM Hooper JNA amp Skilleter GA 2008 Will increased storm intensity from climate change affect biodiversity in non-scleractinian sessile fauna on coral reefs Global Change Biology 14 2755-2770
Warwick RM amp Clarke KR 1993 Increased variability as a symptom of stress in marine communtities Journal of Experimental Marine Biology and Ecology 172 215-216
Thenumberofsitessurveyedhasvariedover timeasaresultof the fluctuating levelof sandcoveringKirraReef
Prior to May 2003 three sites were assessed along the eastern and northern edge of KirraReef(KirraReefOutersites1to3)andthreesiteswereexaminedalongtheinshore marginof the reef (KirraReef Inner sites1 to 3)(MapA1) ReefRedge (ieKirraOuter) siteswerechosentoprovideearlywarningofimpactsfromoffshoreplacementofdredged sandwhilst inshoresites(ieKirraInner)werechosentoindicatewhetherimpactsfrom inshore beach profile development were affecting the reef platform In May 2003 the threeeasternsitesatKirraReef (ieKRO1KRO2andKRI1)werecompletelycovered with bare mobile sand Consequently only the three western sites at Kirra Reef (ie KRO3KRI2andKRI3)supportedbenthicfloraandfaunaInMarch2004theextentof the remainingwesternoutcropof KirraReef had been further reduced so that all inner reefsiteswerecompletelycoveredwithmobilesandConsequentlyonlyasingleoriginal reefsite(ieKRO3)couldbesurveyed(Figure23)Thereforetoprovideanindicationof the condition of the remaining reef two new sites were established (ie KRN1 and KRN2)(Figure23)andsurveyedinMarch2004Theextentofthewesternreefhadbeen further reduced by February 2005 and a third new site (ie KRN3) was established (Figure23)Consequentlyfoursites(KRO3KRN1KRN2andKRN3)weresurveyedin February2005
InFebruary2010fourKirraReefsites(ieKRO3KRO1KRN1andKRN2)wereclearof thesurroundingsandandsupportedbenthic floraand fauna Inaddition several rocks protruded from the sand in the vicinity of site KRI2H these were assessed to provide a quantitativeindicationofbroadRscaletemporalchangestotheinshorereefcommunities
SOURCEScopy Copyright Commonwealth of Australia (Geoscience Australia) 2001 2004 2006copy The State of Queensland (Department of Natural Resources and Mines) 2015copy Nearmap 2014 2015
DATE2015-09-09
DRAWN BYCF
VERSION02
PROJECTIONCoordinate System GDA 1994 MGA Zone 56Projection Transverse MercatorDatum GDA 1994
plusmn SCALE
0 50 100
Metres
Scale 12500 A3
frc environmental
Appendix$B$ Introduction$to$Data$Analysis$Used$
Multivariate$Analyses$
Multivariate statistical techniques are widely used in ecology to assess the similarities relationshipsbetweenassemblagesWhereasunivariateanalysescanonlycompareone variable at a time (eg an index of community structure such as a diversity index or a singleindicatorspecies)multivariateanalysescancomparesamplesbasedontheextent thatassemblagesshareparticulartaxaandabundances(ClarkeampWarwick2001)
Thefirststepofmultivariateanalysisusuallyinvolvesthecreationofamatrixofsimilarity coefficients computed between every pair of samples The coefficient is usually a measureofhowclose theabundance is foreachspecies (definedso that100= total similarity and 0=complete dissimilarity) The Bray Curtis similarity measure is commonlythemostappropriateforbiologicaldata(ClarkeampWarwick2001)
MultidimensionalScaling
NonRmetricmultiRdimensionalscalingordinations(nMDS)attempttoplacesamplesintwo dimensionalspacesothattherankorderofthedistancesbetweensamplesmatchesthe rankorderofthematchingsimilaritiesfromthesimilaritymatrix(ClarkeampWarwick2001) Thisprovidesavisualrepresentationofthesimilaritiesbetweenassemblageswithineach sampleEachoftheaxesisnotrelatedtoanyparticularvalueHinfactaxescanberotated toprovide thebestvisual representationof thedata Ordinationsareparticularlyuseful tools for analysing and visually presenting differences between assemblages Ordinationsareessentiallymapsofsamples inwhich theplacementofsampleson the mapreflectsthesimilarlyofthecommunitytothecommunitiesinothersamples(Clarkeamp Warwick 2001) Distances between samples on an ordination attempt to match the similarities inassemblagestructurenearbypoints representassemblageswithvery few attributes(speciesorabundanceofspecies)Hpoints faraparthavevery fewattributes in common(ClarkeampWarwick2001)
A stress coefficient is calculated to reflect the extent to which the multiRdimensional scalingordinationandthesimilaritymatrixagree(ClarkeampWarwick2001)(iehowwell the multiRdimensional scaling ordination accurately reflects the relationship between samples)Stressvaluesoflt015aregenerallyacceptable
In Figure A1 each freshwater macroinvertebrate sample is represented on the multiRdimensionalscalingordination By lookingat thedistancesbetweeneachsample
ANOSIMisanalogoustoANOVAinunivariatestatistics(Smith2003)AglobalRstatistic iscalculatedtodeterminewhetherthereisasignificantdifferencebetweenallsamplesIf there are differences then pairwise comparisons are conducted to test for differences betweenpairsofsamples(analogoustopostRhoctestsinANOVA)
The R value lies between R1 and +1 (all similarities within groups are less than any similarity between groups) with a value of zero representing the null hypothesis (no differenceamongasetofsamples)(ClarkeampWarwick2001)ComparisonofpairwiseR values can give an indication of how different assemblages are R values close to 0 indicatelittledifferencevaluesaround05indicatesomeoverlapandvaluescloseto1to indicate many or substantial differences In many instances however researches are primarily interestedinwhethertheRvalueisstatisticallydifferentfromzero(usuallyata confidence level of 005) (Clarke amp Warwick 2001) (ie whether they can reject the null hypothesis)
ANOSIM can provide information on whether the (visual) differences between assemblages in the multiRdimensional scaling ordination are significantH it is an independenttestfromthemultiRdimensionalscalingordinationItisbasedontestingthe
TRESBPKirraReefMarineBiotaMonitoring2015 B2
frc environmental
differences between the rank similarities in the similarity matrix not on the distances betweensamplesinthemultiRdimensionalscalingordination(ClarkeampWarwick2001)
PermutationalMultivariateAnalysisofVariance
PERMANOVAisusedtotestsimultaneousresponsesofoneormorevariablestooneor more factors in an a0 priori0 structured design using random permutation of the data to assess significance (Anderson 2004) PERMANOVA generates a pseudo FRstatistic similar to traditional ANOVA but pRvalues are calculated with permutations which does notassumenormaldatadistribution PERMANOVAcanprovide informationonwhether the (visual) differences between assemblages in a multiRdimensional scaling ordination are significantH however it is an independent test from the multiRdimensional scaling ordination
Thelevelofmultivariatedispersionamongsampleswithineachofthetestgroupscanbe examined using the permutational analysis of multivariate dispersions (PERMDISP) routine(Anderson2004)Intraditionalimpactassessmentachangeinthedispersionof datacanalsoindicateanimpact
SimilarityPercentagendashSpeciesContributions
SIMPER analysis provides information on how dissimilar assemblages from various groups are (eg how similar all of the macroinvertebrate samples taken for a particular habitatwithinastreamreachare)andhowsimilareachgroup(egreach)istoanyother group SIMPER analysis also identifies the species taxa that are contributing to the dissimilarity between two assemblages in rank order (ie it identifies which species is contributingthemosttothedifferences)SIMPERanalysismayhelptoidentifypotential lsquoindicatorrsquospeciesForexampleifaparticularspeciesconsistentlycontributesgreatlyto the differences between impacted and unimpacted assemblages it may be a useful indicator Theabundanceofthis indicatorspeciescanthenbecomparedbetweensites usingunivariatetechniquessuchasANOVA
Data is available on request from tresbpprojectofficecrownlandnswgov
TRESBPKirraReefMarineBiotaMonitoring2015 C1
frc environmental
Appendix(D( Pairwise( PERMANOVA( Results
Data is available on request from tresbpprojectofficecrownlandnswgov
TRESBPKirraReefMarineBiotaMonitoring2015 D1
frc environmental
Appendix(E( Relative(Abundance(of(Fish(found(at(Kirra(( ( and(Palm(Beach(Reefs(in(Each(Survey((Data is available on request from tresbpprojectofficecrownlandnswgovau
TRESBPKirraReefMarineBiotaMonitoring2015 E1
Structure Bookmarks
0 50 100 Metres Scale 12500 A3
0 50 100 200 Metres Scale 15000 A3
Kirra Reef
Kirra Reef
Kirra Reef
Kirra Reef
Kirra Reef
Kirra Reef
Map A1Location of Kirra Reef monitoring sites
Table D8 Pairwise comparison of macroalgae cover between sites in each year
Table D15 Pairwise comparison of turf algae cover between sites in each year
Table D29 Pairwise comparison of ascidian cover between sites in each year
Table D43 Pairwise comparison of soft coral cover between sites in each year
frc environmental
33$ Benthic$Macroinvertebrates$
Sponges$
ThemeancoverofspongesatsomesitesatbothKirraReefandPalmBeachReefhas varied significantly during some surveys (note the significant interaction between site (location)xsurvey inTable34HFigure311) However thecoverofspongestendedto bemore temporallyvariable atKirraReef than at Palm Beach Reef (Figure312) The cover of sponges at Kirra Reef varied between sites in February 1996 January 2001 March2004July2012andApril2014 However thecoverofspongesatPalmBeach Reefonlyvariedbetweensites inJanuary2001andFebruary2010 (AppendixD) The cover of sponges varied between survey at each site with 1995 1996 and 2001 most differenttootheryears(AppendixD)
ThemeancoverofspongesatKirraReefdeclinedbetweenMarch2004(20cover)and February 2010 (less than 1 cover) Since 2010 the cover of sponges has increased slightly with sponges covering 8 of the reef in March 2015 (Figure 312) In March 2015thecoverofspongeswashigherthanrecordedduringthebaselinesurveyinApril 1995(3cover)(Figure312)
Figure312 Mean cover of sponges (plusmnSE) at Kirra Reef and Palm Beach Reef on all
surveys
Table34 Univariate PERMANOVA results for differences in the cover of sponges betweensurveysandlocations
Factor$ df$ MS$effect$ PseudoF$ p$(perm)$
survey 10 18576 276 0018
location 1 39671 589 0210
site(location) 4 67354 477 0001
locationxsurvey 10 1490 221 0032
site(location)xsurvey 40 67331 477 0001
error 924 14108
Shadingdenotessignificanceatplt005
TRESBPKirraReefMarineBiotaMonitoring2015 32
frc environmental
Ascidians$
ThemeanabundanceofallascidiansotherthanPyura0stoloniferahasvariedsignifcantly between sites at Kirra Reef and Palm Beach Reef and between surveys at each site (Figure314andnotethesignificantinteractionbetweensite(location)xsurveyinTable 35) The abundance of ascidians was different between sites at Kirra Reef in January 2001May2003March2004February2005andApril2014HanddifferentatPalmBeach ReefinJanuary2001February2005February2010andMarch2015Theabundance ofascidiansvariedbetweensurveysateachsitewith1995beingmostdifferentwhenthe abundanceofascidianswaslow(AppendixD)InMarch2015theabundanceofallother ascidiansonKirraReefandPalmBeachReefwashigherthanpreviouslyreportedinthe baselinesurveyinApril1995(whennoascidianswererecorded)Themeanabundance washigheratKirraReefthanatPalmBeachReef(Figure314)
ThemeanabundanceofPyura0stoloniferahasvariedconsiderablybetweensitesatKirra Reef and Palm Beach Reef over time (note the significant interaction between site (location) x survey in Table 36) In March 2015 the mean abundance (individual per 025m2plusmnSE)of theascidianPstolonifera (Figure313)wassimilaratKirraReefand PalmBeachReef(Figure315)ThemeanabundanceofP0stoloniferahasrangedfrom 02to17individualsper025m2atbothreefssinceMay2003
Figure315 Mean abundance of ascidians (Pyura0 stolonifera) (individuals025m2)
(plusmnSE)atKirraReefandPalmBeachReefinallsurveys
TRESBPKirraReefMarineBiotaMonitoring2015 34
frc environmental
Table35 Univariate PERMANOVA results for the differences in cover of all ascidians otherthanPyura0stolonifera0betweensurveysandlocations
Factor$ df$ MS$effect$ PseudoF$ p$(perm)$
survey 10 26658 474 0001
location 1 13603 710 0104
site(location) 4 19154 149 0212
locationxsurvey 10 2629 468 0001
site(location)xsurvey 40 5621 438 0001
error 924 12828
Shadingdenotessignificanceatplt005
Table36 Univariate PERMANOVA results for the differences in Pyura0 stolonifera densitybetweensurveysandlocations
Factor$ df$ MS$effect$ PseudoF$ p$(perm)$
survey 10 16254 11842 0001
location 1 12445 60881 0206
site(location) 4 20442 56799 0001
locationxsurvey 10 79724 58082 0001
site (location) x 40 13726 38138 0001 survey
error 924 35991
Shadingdenotessignificanceatplt005
$
TRESBPKirraReefMarineBiotaMonitoring2015 35
frc environmental
Hard$Coral$
There was a significant difference between the cover of hard corals at Kirra Reef and PalmBeachReefduringsomesurveys(notethesignificantinteractionbetweenlocationx surveyinTable37)SpecificallytherewassignificantlymorehardcoralatPalmBeach Reef thanKirraReef inFebraury1996March2004April2014andMarch2015(Table 38)
ThecoverofhardcoralistypicallylowonKirraReefaccountingforlessthan2ofthe availablesubstrateInMarch2015hardcoralcoveredlessthan1oftheareaofKirra Reef which was less than the cover recorded during the baseline survey in April 1995 (Figure 316) In contrast hard coral covered 11 of the surface area at Palm Beach ReefwhichwasgreaterthanthecoverrecordedinApril1995(Figure316)
The cover of hard corals at Palm Beach Reef has been more variable over time comparedtothecoverofhardcoralatKirraReef(Figure316)Withtheexceptionofthe surveys inApril1995andJanuary2001when thecoverofhardcoralwas lowonboth reefshardcoralsaretypicallymoreprevalentatPalmBeachReef(Figure316)
Table38 PERMANOVA post hoc pairwise results for the differences in the cover of hardcoralbetweenlocationsineachsurveyevent
Hard$Corals$ Survey$
t$ p$(MC)$a$
Apr1995 054 0606
Jun1995 182 0140
Feb1996 541 0006
Jan2001 R R
May2003 166 0168
Mar2004 765 0001
Feb2005 049 0646
Feb2010 156 0197
Jul2012 283 0053
Apr2014 525 0011
Mar2015 695 0003 Shadingdenotessignificanceatplt005 a pvaluesbasedonMonteCarlotests
TRESBPKirraReefMarineBiotaMonitoring2015 37
60
50
40
30
20
10
0
Soft
Cor
al C
over
()
Kirra Reef Palm Beach Reef
frc environmental
Soft$Coral$
The cover of soft coral was significantly different between sites at both Kirra Reef and PalmBeachReefandduringsomesurveys(notethesignificant interactionbetweensite (location)xsurvey)TherewasnosoftcoralrecordedatKirraReefinMarch2015The coverofsoftcoralhasdeclinedatKirraReefsince2003andhascoveredlessthan2of theavailablesubstratesince2005whichissimilartothecoverofsoftcoraldescribedfor the baseline surveys in 1995 (Figure 317) The cover of soft coral was consistent betweensitesineachsurveyexceptbetweensitesin
sdot April1995atKirraReef
sdot 1996atKirraReef
sdot 2003atPalmBeachReefand
sdot 2014atPalmBeachReef(AppendixD)
Soft corals have historically covered more of the available space on Palm Beach Reef than on Kirra Reef However there was more temporal variability within sites at Palm BeachReefthanatKirraReef(AppendixD)ThecoverofsoftcoralatPalmBeachReef has varied over time and was highest in April 1995 (48 cover) Despite increasing sinceFebruary2005itisstilllowerthanthecoverrecordedduringthebaselinesurveyin April1995(Figure317)
Table39 UnivariatePERMANOVAresults for thedifferences in thecoverofsoft coral betweensurveysandlocations
Factor$ df$ MS$effect$ PseudoF$ p$(perm)$
survey 10 44657 1323 0001
location 1 32922 6620 0117
site(location) 4 49732 266 0036
locationxsurvey 10 40982 1214 0001
site (location) x 40 3376 181 0002 survey
error 924 18688
Shadingdenotessignificanceatplt005
$
TRESBPKirraReefMarineBiotaMonitoring2015 39
frc environmental
Crinoids$
ThereisasignificantdifferencebetweensomesitesatbothKirraReefandParmBeach Reef that varies through time (note the significant interaction between site (location) x survey inTable310) Theabundanceofcrinoidshasbeensimilarbetweensites inall years at Palm Beach ReefH and was different beween sites at Kirra Reef in June 1995 February1996May2003andFebruary2005(AppendixD)Withineachsitetherehas been some natural temporal variability particualrly at Palm Beach Reef sites in 2001 (Appendix D) The mean abundance (individuals 025m2) of crinoids (Figure 318) at KirraReefandPalmBeachReefhasgenerallybeenlessthan2individualsper025m2 andhasdeclinedatboth locationssincethebaselinesurvey inApril1995(Figure319) However the mean abundance of crinoids on Kirra Reef has shown a slight increase sinceFebruary2010(Figure319)
In March 2015 fewer crinoids were recorded at Palm Beach Reef than at Kirra ReefH crinoidshavebeenrareatPalmBeachReefsince2003
The species richness of fish recorded from Kirra Reef across all monitoring events has rangedfrom14to57 InMarch201557specieswereidentifiedat thereefwhichwas similar to April 2014 (53) and higher than previous surveys (Figure 320) Species richnessatPalmBeachReefwas lower(34species)andgenerallyvaried lessbetween surveyscomparedtoKirraReef
InMarch2015 the assemblage of fish at KirraReef comprised species fromall trophic levelsincludingdetritivoresplanktivoresherbivoresandcarnivores(AppendixE)Asin previous surveys the assemblage was dominated by herbivores and planktivores Yellowtail (Trachurus0 novaezelandiae) and striped sea pike (Sphyraena0 obtusata) were the dominant species present in large schools (Figure 321) Australian mado (Atypichthys0 strigatus) ringRtailed surgeon (Acanthurus0 blochii) silver trevally (Pseudocaranx0 georgianus) eastern pomfred (Schuettea0 scalaripinnis) sweep (Scorpis0 lineolatus) and various wrasses were also very abundant releative to other species (AppendixE)
Two new species were observed at Kirra Reef the orangeRband surgeon (Acanthurus0 olivaceus) and the unicornfish (Naso0 sp) Five new species were recorded at Palm BeachReef
No threatened or protected fish species listed under the Queenslandrsquos Nature0 Conservation0Act01992ornationallyundertheEnvironmental0Protection0and0Biodiversity0 Conservation0 Act0 1999 were observed The complete list of species recorded and the relativeabundanceispresentedinAppendixE
TRESBPKirraReefMarineBiotaMonitoring2015 42
60
0
10
20
30
40
50
Num
ber
of F
ish
Spe
cies
Apr-95
Jun-95
Feb-96
Jan-01
May-03
Mar-04
Feb-05
Feb-10
Jul-12
Apr-14
Mar-15
Kirra Reef Palm Beach Reef Location
frc environmental
Figure320 Number of fish species recorded at Kirra Reef and Palm Beach Reef on
ThegreatestchangetotheecologicalconditionofKirraReefsincethebaselinesurveyin 1995 has been the loss of large areas of hard substrate that support benthic flora and faunaThedeliveryoflargesandvolumesduringthestage1dredgingoperations(1995 to1998)andtheinitialoperationofthesandbypasssystem(2001to2008)resultedinan increaseinwaveactionandtidalcurrentsredistributingthissandoverKirraReef
The three major outcrops of Kirra Reef (northern southern and eastern sections) are naturally exposed and covered depending on water and sand movements In March 2015 the rocky outcrops in the northern section of Kirra Reef were exposed and supportedamoderatelydiversebenthicassemblagedominatedbyturfalgaeTherewas arelativelyhighfishdiversityatKirraReefTheecologicalassemblageexhibitedsignsof ongoingstressfromphysicaldisturbanceincludingtheabsenceofsoftcoralsandrarityof hardcoral(MumbyampSteneck2008)HoweverKirraReefhasarelativelyhighcoverof sponges and ascidians Sponges ascidians and crinoids were more abundant at Kirra ReefthanatPalmBeachReefinMarch2015
KirraReefcontinues toprovidehabitatandsupport importantecological functions in the region providing hard substrate for the colonisation of algae and benthic invertebrates and food and refuge for fish As sand levels have stabilised since 2008 assemblages have becomemoresimilar to those recordedprior to implementationof the TRESBP in April1995 Forexamplemacroalgalcover inApril1995andMarch2015wasrelatively similarHoweverassemblagecompositionisstillsignificantlydifferenttothatrecordedin thebaselinesurveysmostnoticeablyduetoa lowercoverofbaresubstrateandhigher coverofturfalgaeandascidianssincesurveyshavebeenperformed
Benthic$Macroalgae$
The cover of macroalgae at Kirra Reef was relatively similar during the 2014 and 2015 surveys and remained well below the peak of nearly 60 cover recorded in January 2001TherewasasteepdeclineinthecoverofmacroalgaebetweenJanuary2001and May2003whichappearedtobestronglyassociatedwith thedecline inreefareaduring that time as well as a decline in the cover of Sargassum sp (an important indicator speciesonKirraReef) SimilardeclineswereevidentatPalmBeachReefbetween the January2001andMay2003surveys
TRESBPKirraReefMarineBiotaMonitoring2015 45
frc environmental
The cover ofmacroalgae at Palm Beach Reef was much lower thanat Kirra Reef over time There are several possible reasons for the lower cover of macroalgae at Palm Beach
sdot PalmBeachReefisdeeperthanKirraReefandgenerallyhashigherturbidityand therefore greater light attenuation The quantity and quality of available light affectsthedistributionandgrowthofmacroalgae(MillerampEtter2008)
sdot Differences in the pattern of recruitment of algal species to the reefs due to differentwatercurrentsandtimingofthesurveys(Kennelly1987b)
sdot Increased competition with turf algae and sessile benthic invertebrates which competeforspacewithmacroalgae(Kennelly1987aHMillerampEtter2008)
sdot PresenceofdifferentspeciesandhigherdensityofherbivoresatPalmBeachReef (particularly sea urchins and herbivorous fish) which graze on macroalgae (McCook1997HJompaampMcCook2002)
Biological assemblages exposed to physical stress typically exhibit greater levels of temporalandspatialvariability(WarwickampClarke1993HChapmanetal1995)Temporal variationinthecoverofmacroalgaeatKirraReefislikelytobeprincipallyduetotheeffect ofphysicaldisturbance fromwaveactionaswellas theassociatedassociatedabrasion andsmotheringbysandTheeffectsofthesephysicaldisturbanceswouldincreasewith thereductionofKirraReefasedgeeffectsarepronouncedandwaterdepth isreduced Increasedsmotheringbysandcanalsoreducediversity(Hatcheretal1989)abundance recruitment growth survival and seasonal regeneration of macroalgae (Umar amp Price 1998HCheshireetal1999)
Changes in the cover of macroalgae on Kirra Reef over time are also likely due to the extentofthereefchangingHthefishandmobileinvertbratesassociatedwiththereefmay have concentrated which would in turn increase grazing pressure Increased grazing pressure from fish and mobile invertebrates can reduce the coverage and diversity of macroalgaeonreefs(McCook1997HJompaampMcCook2002)
Thecoverof turfalgaeatbothKirraReefandPalmBeachReefhasvariedsignificantly betweensurveysPriorto2005turfalgaetypicallycoveredlessoftheavailablesurface areaonKirraReefthanPalmBeachReefInMarch2015themeancoverofturfalgae hasincreasedsincebaselinesurveysin1995andwasrelativelysimilarbetweenreefs(40 plusmn4atKirraReefcomparedto48plusmn4atPalmBeachReef)Thecoverofturfalgaeat Kirra Reef was similar in 2014 and 2015 which was generally higher than previous surveysexceptduringJuly2012whencoverofturfalgaepeakedat67plusmn4
TRESBPKirraReefMarineBiotaMonitoring2015 46
frc environmental
Turfalgaearebecomingadominantcomponentofcommunitiesaroundtheworld likely the result of rapid colonisation of openspace after a disturbance (eg storms) nutrient enrichment andor changes in grazing pressures Turf algae can also reflect a more physically robust growth form suited to high wave energy environments (than foliose macroRalgae)TurfalgaepeakedintheJuly2012surveylikelyrelatedtotheincreasein bare reef exposure following a stormy conditions in early 2009 and between December 2011 and June 2012 Turf algae have been the dominant form of algae on Kirra Reef sincethistimealbeitthecoverlowerthanthe2012survey
Increased cover of turf algae is typically related to good light conditions high concentrationsofnutrientsandlownumbersofgrazerssuchasfish(orconstantgrazing pressure preventing macroalgae colonisation) However the relationship between algal dynamics physical disturbance water quality and herbivore grazing activity is complex andthecoverof turfalgaecanexhibitextremetemporalvariabilityasaconsequenceof the interactionbetween topRdownandbottomRupprocesses (Russ2003HBellwoodetal 2006H Hughes et al 2007H Albert et al 2008H Hoey amp Bellwood 2008H Mumby 2009) Furtherinvestigationwouldberequiredtoreliablydeterminethemechanismsofchangein bothmacroalgaeandturfalgaeassemblagesonthesereefs
Benthic$Macroinvertebrates$
AtKirraReeftheburialandreRemergenceofrockyoutcrops(influencedbytheTRESBP) islikelytohaveincreasedtemporalvariabilityinthedistributionandabundanceofbenthic macroinvertebrates Additional perturbations such as wave action and sand abrasion (each influenced through changes in bathymetry seabed topography and water depth) are likely to have resulted in the decline in cover and diversity of the benthic macroinvertebratesatKirraReefbetweensurveysparticularlybetweenMarch2004and February2005andduringtheseverestormsof2009Benthicmacroinvertebratessuch asascidiansspongeshardcoralandsoftcoralarehighlysusceptible to theeffectsof stormandwavedisturbancephysicalabrasionandburialbysand(KayampKeough1981H Walker et al 2008) which can affect settlement growth rate and survival (Dodge amp Vaisnys1977HRogers1990)
Physical disturbance from sand burial sand abrasion and the action of storm waves appeartokeepthebenthicassemblagesofKirraReefinastateofearlysuccessionItis commonforearlypioneerspeciessuchassomemacroalgaetorecruitrapidlytoahard surface in large numbers allowing these species to dominate assemblages early in the successionaltrajectory(Walkeretal2007)
Afurther indicatorof theearlystateofsuccessionatKirraReef isthatthecoverofhard and soft coral has remained very low (generally lt 5) In March 2015 less than 1
Benthic macroinvertebrate cover may also be affected indirectly through increased competitionwithmacroalgaeforspaceThepresenceoflargemacroalgaecanaffectthe recruitment and survival of sessile benthic invertebrates as fronds moving with wave action sweep and abrade the surface of rocks killing new recruits especially corals (Kennelly1989HMcCooketal2001)Itcantakeseveralyearsforhardandsoftcoralto become dominant on reefs in the SEQ region (SchlacherRHoenlinger et al 2009) Therefore hard coral is not expected to become abundant until several years after the reefhasbeenuncoveredandonlyifthephysicaldisturbanceregimeandsupplyofnew recruitsissufficienttosupportsurvivalandgenerationalsuccessionofthesespeciesThe coverofhardandsoftcoralsatKirraReefwerebothverylowandpatchypriortothestart oftheTRESBP
Sponges and ascidians are highly susceptible to smothering and sand abrasion unless theyhaveathicktunic(outercoveringmadeofkeratin)liketheascidianP0stolonifera0or strong internal keratin silicon or calcareous structures in the case of some species of sponges0(KayampKeough1981HMcGuinness1987HWalkeretal2008)Duetoincreased wave action and sedimentation (which can be influenced by the TRESBP) the mean coverofascidiansandspongeswasexpectedtobemuchloweronKirraReefthanPalm Beach Reef However in March 2015 the cover of sponges was similar between the reefsandthecoverofascidians(otherthanP0stolonifera)wasgreateratKirraReefthan at Palm Beach Reef This suggests that Kirra Reef is slowly recovering from the increasedstressofphysicaldisturbancesuchas increasedwaveactionandsandscour andorthatwaveandstormconditionshavebeenlesssevereinthepastfewyears
Fish$
KirraReefcontinuestosupportahighdiversityofreefRassociatedandpelagic(ienonR reefassociated) fishspecies Despite itsdiminishedsizecompared to1995KirraReef continuestoprovidevaluablehabitatforanumberoffishspeciesfromdifferentfunctional groups
ThereisahighdegreeofinterRannualvariabilityinthespeciesandabundanceofthefish present at Kirra Reef compared with the assemblage at Palm Beach Reef This likely reflectsthetemporalvariabilityintheavailablehabitatasaconsequenceofreefburialand reRemergenceThediversityqualityandarealextentofreefhabitatareimportantfactors influencing the distribution abundance biomass and diversity of reef fish (Bellwood amp Hughes2001HFriedlanderetal2003)Diversityandabundanceoffishcanincreasewith
TRESBPKirraReefMarineBiotaMonitoring2015 48
frc environmental
greaterstructuralcomplexityandincreasedheterogeneityofavailablehabitats(Bellwood ampHughes2001)Thissuggeststhatperiodsofreefburialreducetheoveralldiversityof reefRassociated fish species at Kirra Reef Despite the reduction in overall reef space therewasalargervarietyofhabitats(suchasmarcoalgaeandturfalgae)in2015which was likely to be related to the high diversity of fish assemblages This is particularly importantforseveralspeciesthatdependonthepresenceoflsquostructurersquosuchasprovided by reef habitat (ie oldwife moray eels damselfish and Australian mado that were recordedinMarch2015butwerenotrecordedinJuly2012)
Theabundanceanddiversityof fishare likelytobenegativelyaffectedfollowingperiods of severe weather which create unfavourable conditions for many species and may further exacerbate the affects of abrasion and sedimentation The biomass of fish is knowntodecreasewithincreasingexposuretophysicaldisturbancefromwaveactionand strong currents (Friedlander et al 2003) As our surveys have been undertaken at different times of the year variation in the prevailing conditions at the time of sampling could also influence the types of fish observed (and the amount of reef habitat that is availableatanytime)Manyofthespeciesmayalsobeaffectedbyseasonalchangesin the water temperature such as damselfish which are less abundant in cool waters However theoveralldiversityof the fishassemblageatKirraReef is likely toreflect the sizeoftheoutcropsexposedwithagreaterphysicaldisturbance(fromseaconditionsand sandmovement)andcompetitionHandlesserfoodavailablewhenthereefiscovered
ThepredictedimpactstoKirraReefasaresultoftheTRESBPincludedaccretionofsand around the base of the rock outcrops causing a reduction in extent of reef It was predictedthatsanddeliveryaspartoftheprojectwouldeventuallymimiclsquonaturalrsquopatterns ofsanddispersalandthatthereefwouldreturntoitsnaturalextent(ietheextentpriorto extension of the Tweed River training walls in 1962) The benthic flora and fauna assemblages of the reef the historical reef extent and natural sand transport patterns wereexpectedtoreturntoconditionsobservedbeforetheextensionofthetrainingwalls between 1962 and 1965 However the Environmental Impact Study did not predict the ecologicalconsequencesofboththereducedarealextentandincreasedwaveenergy(a consequenceofdecreaseddepth)thathavebeenrecorded
ThecurrentextentofKirraReef remains less than50of that recorded in1962and in 1995beforethesanddeliverybytheTRESBPcommencedHowevertheextentofreef in1995 wasstrongly influenced by adepletion in sand following the construction of the Tweed River training walls and the Kirra Point groyne Accumulation of sand on Kirra ReefwasobservedtoincreaseasaresultofindirectsandnourishmentbytheTRESBP and the reef has been extensively covered (particuarly between 2005 and 2010) as a result
Whiletheextentofthereefcontinuestochangeovertimethedeliveryofsandaspartof the project now more closely matches the natural rate of longshore sand transport ShortRtermandseasonalchangesintheextentofthereefarenowlikelytobetheresultof waveandcurrentaction(particularlyduringservereweatherevents)thanadirectimpact of the TRESBP Therefore the extent of Kirra Reef in March 2015 is broadly in accordancewithpredictionsmadeintheEISwhichpredictedthatthereefwouldreturnto a condition similar to that exhibited in the preR1960rsquos ie before the extension of the TweedRiverbreakwatersthatinterruptedlittoralsandsupplytothesebeaches
InDecember2013KirraPointgroynewasextendedby30mwiththeexpectationthatthe beach bar would move seaward as a consequence At present Kirra Point groyne is unlikelytohavehadamajorimpactonthearealextentofKirraReefHoweverongoing monitoringbasedonaerialphotographsmayprovidefurtherinsight
Sessile benthic assemblages on Kirra Reef are highly susceptible to the influence of storms and associated wave action (Kay amp Keough 1981H Walker et al 2008) The shallowreefissurroundedbymobilesandwhichcanshiftnaturallyinresponsetowave action during storms causing burial of large sections of Kirra Reef This effect has reduced the availability of rocky substrate for colonisation and the availability of refuge
Fromanexaminationof theextentofKirraReef fromarealmapsandwaveheightdata thereappears tobea relationshipbetween theareaof rockexposedandstormevents Notably in a series of storm events in May 2009 corresponds with large areas of rock becoming exposed (with the reef approximately 100m2 in 2006 and approximately in 1009m2 2009) Further a stormy conditions between December 2011 and July 2012 correspondstotheareaofexposedrockmorethandoublinginsizeWhiletherewasno changetothetotalareaofexposedrockfollowingstormyconditionsinearly2013there wasaclearchangeinthedistibutionofexposedrockduringthistimeSince2013storm conditions have been calm to moderate and there has been little change in the areal extentanddistrubtionofexposedrockatKirraReef
WaveheighttypicallyincreasesduringstormeventsandgiventheshallowdepthofKirra Reef waves are more likely to shoal and break across the reef during storms This increases thephysicaldisturbanceabrasionandsedimentationofbenthicassemblages onKirraReefStormdisturbancecancauselocalreductionsinthespeciesrichnessand abundanceofcoral(Woodleyetal1981HMasselampDone1993HHughes1994HConnellet al 1997) and can alter fish assemblages indirectly through habitat modifications (Kaufman1983HJonesampSyms1998)ordirectlybyincreasingfishmortality(Lassig1983) The hydrodynamic forces produced by wave action are an important source of disturbance in subtidal habitats inflicting damage through direct physical impact and abrasion(UnderwoodampKennelly1990)DirectimpactsfromphysicaldisturbanceatKirra Reefareevidentduringsurveyeventswhenlargefragmentsofmacroalgaearepresentin thewatercolumnoverthereef
Storm and wave action (and associated sedimentation and abrasion) continue to be importantforcesshapingthedistributionandabundanceofbenthicspeciesatKirraReef Increased magnitude and frequency of physical disturbance resulting from increased exposureorsusceptibility tostormsandassociatedwaveaction (asonKirraReef)can lead to a decrease in the diversity of sessile invertebrate assemblages DisturbanceR drivenreductionsinbiodiversityhavethepotentialtoimpactnegativelyonthehealthand productivity of reef ecosystems (Walker et al 2008) Biodiversity is important to reef health given that many of these species (eg sponges bryozoans and ascidians) contribute a range of vital ecosystem services to reefs including nutrient cycling (Scheffers et al 2004) trophic interactions and food webs (Lesser 2006H Pawlik et al 2007) bioRerosion (Rutzler 2002H LopezRVictoria et al 2006) and stabilizing substrata (DiazampRutzler2001HWulff2001)
Theimpactsof increasedwaveactionandsedimentationonthebenthicassemblagesat Kirra Reef are likely to be greatest during and immediately following storm conditions
TRESBPKirraReefMarineBiotaMonitoring2015 51
frc environmental
Partitioningtheinfluenceofstormandwavedrivendisturbancefromthatoftheoperation oftheTRESBPwouldrequireamuchmorestatisticallypowerfulandtemporilyreplicated experimental design Given there is a large collection of wave and storm data by TRESBP this would involve greater temporal sampling of Kirra Reef including event samplingfollowingseverewaveandstormactivity
The data generated by this Kirra Reef biota monitoring program doesnrsquot support statistically rigorous consideration of seasonality (monitoring has been at its most frequentannual)
InApril2014andMarch2015KirraReefcoveredlessthan50ofthereefrsquosextentprior to theoperationof theTRESBP The lossof reefhabitathasreducedtheavailabilityof hard substratum available for colonisation and consequently the abundance of benthic sessileassemblages
The reduced depth of water resulting from the accumulation of sand exacerbates the effects of storms and wave action It is likley that as a consequnece the biological communities of Kirra Reef will reflect earlyRstage succession more frequently and for longerperiods
While there is sufficient structure available frcenvironmentalexpect that Kirra Reef will continuetoprovideimportanthabitatforadiverseassemblageoffishes
TRESBPKirraReefMarineBiotaMonitoring2015 52
frc environmental
5$ Conclusions$
Although there is still a substantial portion of the reef covered compared to before the extension of the Tweed River entrance breakwaters the current extent of Kirra Reef is broadly inaccordancewithpredictionsmadein theEIS Initial lsquocatchRuprsquobypassingand dredgeplacementofsand(between2001and2008)resulted in theburialofKirraReef Subsequentsanddelivery(since2008onwards)morecloselyreflectsnaturalpatternsof longRshoresandtransportandisthereefhasslowlyreRemerged
Theextentofthereefhasbeenrelativelystablesince2013Thishasallowedforsome succession in the benthic assemblages including a relatively high cover of sponges ascidiansandcrinoidsWiththedeliveryofsandmorecloselymatchingthenaturalrateit isexpected the reef willundergoshortRtermchanges in extentdue toseasonal shifts in sand deliveryH however the diversity of benthic assemblages on Kirra Reef is likely to increaseovertimeThiswouldcreatemorespaceforspeciestorecruitandreducesthe influence of sand abrasion and wave damage It was predicted that the areas of Kirra Reef newly exposed in 2012 would undergo a shift from turfRdominated communities to more diverse communities that could include macroalgae sponges ascidians and potentiallyhardandsoftcoralWiththeexceptionofhardandsoftcoralsthisprediction wasconfirmedbytheresultsoftheApril2014andMarch2015surveys
ThediversityoffishesassociatedwithKirraReefisbroadlysimilartothatrecordedprior tothecommencementofsandbypassingin1995Giventhatfisharemobilethegreatest impacts on fish assemblages are likely to be shortRterm changes due to both the prevailingconditionsandchangestheextentofavailablehabitatthatprovidesshelterand foodforavarietyofdifferentspeciesIfKirraReefincreasesinsizethereislikelytobea greater proportion of cryptic benthic species as these species are more typical of assemblagesinalaterstageofsuccession(eg(WillisampAnderson2003))
Assuming a broadly stable delivery rate of sand and consequent stable extent of Kirra ReeflsquorecoveryrsquoislikleytobesubstantivelycompleteFloralandfaunalcommunitieswill undergo succession between severe storm events but are likley to remain relatively dynamic
Albert S Udy J amp Tibbetts I 2008 Responses of algal communities to gradients in herbivorebiomassandwaterqualityinMarovoLagoonSolomonIslandsCoral0 Reefs2773R82
Anderson MJ 2001 A new method for nonRparametric multivariate analysis of varianceAustral0Ecology2632R46
Anderson MJ 2004 PERMDISP0 a0 FORTRAN0 computer0 program0 for0 permutatinoal0 analysis0 of0 multivariate0 dispersions0 (for0 any0 twoSfactor0 ANOVA0 design)0 using0 permutational0 tests Department of Statistics University of Auckland New Zealand
Cannon LR Goeden GB amp Campbell P 1987 Community patterns revealed by trawling in the interRreef regions of the Great Barrier Reef Memoirs0 of0 the0 Queensland0Museum2545R70
Chapman MG Underwood AJ amp Skilleter GA 1995 Variability at different spatial scalesbetweenasubtidalassemblageexposedtothedischargeofsewageand two control assemblages Journal0 of0 Experimental0 Biology0 and0 Ecology 189 103R122
Cheshire AC Miller DJ amp Stewart R (1999) Effect0 of0 dispersed0 sediment0 plumes0 from0beach0sand0replenishment0dredging0on0recruitment0of0phaeophycean0algae0 to0rocky0reefs0in0Gulf0St0Vincent0South0Australia0The0Impact0of0Sand0Dredging0 on0 Benthic0 Community0 Structure0 at0 the0 Port0 Stanvac0 Dredge0 Site0 20 1S39 UniversityofAdelaideAdelaide
ConnellJHHughesTPampWallaceCC1997A30Ryearstudyofcoralabundance recruitment and disturbance at several scales in space and time Ecological0 Monographs67461R488
Diaz MC amp Rutzler K 2001 Sponges an essential component of Caribbean coral reefsBulletin0of0Marine0Science69535R546
DodgeREampVaisnysJR1977Coralpopulationsandgrowthpatternsresponsesto sedimentation and turbidity associated with dredging Journal0 of0 Marine0 Research35715R730
Done TJ 1982 Patterns in the distribution of coral communities across the central GreatBarrierReefCoral0Reefs195R107
Edwards RA amp Smith DA 2005 Subtidal assemblages associated with a geotextile reef insouthReastQueenslandAustraliaMarine0and0Freshwater0Research56 133R142
FisheriesResearchConsultants1991Survey0of0the0Intertidal0and0Subtidal0Rocky0Reefs0 of0 the0 Sunshine0 Coast report prepared for Queensland National Parks and WildlifeService
HarrisonPHarriotVBanksSampHolmesN1998ThecoralcommunitiesofFlinders Reef andMyora Reef in theMoretonBay MarineParkQueensland Australia In Moreton0 Bay0 and0 Catchment Tibbits I Hall N amp Dennison W (Eds) SchoolofMarineScienceUniversityofQueenslandStLuciapp525R536
Hatcher B Johannes R amp Robertson A 1989 Review of research relevant to the conservationofshallowtropicalmarineecosystemsOceanography0and0Marine0 Biology0an0Annual0Review27337R414
Hoey A amp Bellwood D 2008 CrossRshelf variation in the role of parrotfishes on the GreatBarrierReefCoral0Reefs37R47
TRESBPKirraReefMarineBiotaMonitoring2015 56
frc environmental
Hollingsworth P 1975 Environmental Investigation Report Crown Reserve R R68 Currumbin Creek City of the Gold Coast Land Administration Commission unpublishedreport
Hughes TP 1994 Catastrophes phase shifts and large scale degradation of a CaribbeancoralreefScience2651547R1551
Hughes TP Rodrigues MJ Bellwood DR Ceccarelli D HoeghRGuldberg O McCook L Moltschaniwskvi N Pratchett MS Steneck RS amp Willis B 2007Phaseshiftsherbivoryandtheresilienceofcoralreefstoclimatechange Current0Biology17360R365
Hutchinson A Rempel C Taveras V Loder J amp Salmond J 2013 Reef0 Check0 Australia0 South0 East0 Queensland0 Summary0 Report0 2013 report prepared for ReefCheckFoundationLimited
Hyder Consulting 1997 Tweed0 River0 Entrance0 Sand0 Bypassing0 Project0 Permanent0 Bypassing0 System0 0 Environmental0 Impact0 Statement0 0 Impact0 Assessment0 Study report prepared for New South Wales Department of Land and Water Conservation
Jompa J amp McCook LJ 2002 Effects of competition and herbivory on interactions betweenahardcoralandabrownalgaJournal0of0Experimental0Marine0Biology0 and0Ecology27125R39
KayAMampKeoughMJ1981Occupationofpatchesintheepifaunalcommunitieson pier pilings and the bivalve Pinna bicolor at Edithburgh South Australia Oecologia48123R130
KennellyS1987aInhibitionofkelprecruitmentbyturfingalgaeandconsequencesfor an Australian kelp community Journal0 of0 Experimental0 Marine0 Biology0 and0 Ecology11249R60
Kennelly S 1987b Physical disturbances in an Australian kelp community I temporal effectsMarine0Ecology0Progress0Series40145R153
TRESBPKirraReefMarineBiotaMonitoring2015 57
frc environmental
Kennelly S 1989 Effects of kelp canopies on understory species due to shade and scourMarine0Ecology0Progress0Series50215R224
Lassig BR 1983 The effects of a cyclonic storm on coral reef fish assemblages Environmental0Biology0of0Fishes955R63
Lawson S McMahon J amp Boswood P 2001 Environmental management of the construction and operation of a sand bypassing system at the Tweed River EntranceInThe15thAustralasianCoastalandOceanEngineeringConference the 8th Australasian Port and Harbour Conference 25 R 28 September 2001 QueenslandAustralia
Lesser MP 2006 BenthicRpelagic coupling on coral reefs feeding and growth of Caribbean sponges Journal0 of0 Experimental0 Marine0 Biology0 amp0 Ecology 328 277R288
LopezRVictoriaM ZeaSampWei E2006 Competition for spacebetweenencrusting excavatingCaribbeanspongesandothercoral reeforganismsMarine0Ecology0 Progress0Series312113R121
MalcolmHASmithSDAampJordanA2009Usingpatternsofreeffishassemblages to refine a Habitat Classification System for marine parks in NSW Australia Aquatic0Conservation0Marine0and0Freshwater0Ecosystems2083R92
Massel SR amp Done TJ 1993 Effects of cyclone waves on massive coral assemblages on the Great Barrier Reef meteorology hydrodynamics and demographyCoral0Reefs12153R166
Mumby PJ amp Steneck RS 2008 Coral reef management and conservation in light of rapidly evolving ecological paradigms Trends in Ecology amp Evoution 23 555 -563
Murphy HM amp Jenkins GP 2010 Observational methods used in marine spatial monitoring of fishes and associated habitats a review Marine and Freshwater Research 61 236-252
Noriega R 2007 An Overview of Available Information on Sandy Beach Ecology Coastal Sand Dunes Rocky Reefs and Associated Biota on the Gold Coast Griffith Centre for Coastal Management Research Report No 85 report prepared for Griffith University
Parker P (1995) Structure to Reef Fish Assemblages at Julian Rocks Northern New South Wales Masters Thesis Griffith University
Parker PG 1999 Fish assemblages at Julian Rocks and the adjacent waters of northern New South Wales Australia Australian Zoologist 31 134 - 160
Pawlik JR Steindler L Henkel TP Beer S amp Ilan M 2007 Chemical warfare on coral reefs sponge metabolites differentially affect coral symbiosis in situ Limnology and Oceanography 52 907-911
Reef Check 2010 httpwwwreefcheckaustraliaorgdatahtml accessed December 2015
Robinson KI amp Pollard DA 1982 Marine and estuarine reserves in Australia with particular reference to New South Wales Wetlands 2 17 - 26
Rogers CS 1990 Responses of coral reefs and reef organisms to sedimentation Marine Ecology Progress Series 62 185-202
Russ GR 2003 Grazer biomass correlates more strongly with production than with biomass of algal turfs on a coral reef Coral Reefs 22 63-67
Rutzler K 2002 Impact of crustose clionid sponges on Caribbean reef corals Acta Geologica Hispanica 37 61-72
Scheffers SR Nieuwland G Bak RPM amp van Duyl FC 2004 Removal of bacteria and nutrient dynamics within the coral reef framework of Curacao (Netherlands Antilles) Coral Reefs 23 413-422
TRESBP Kirra Reef Marine Biota Monitoring 2015 59
frc environmental
Schlacher-Hoenlinger M Walker S Johnson J Schlacher T amp Hooper J 2009 Biological Monitoring of the Ex-HMAS Brisbane Artificial Reef Phase II - Habitat Values report prepared for Environmental Protection Agency (EPA)
Smith KA 2003 A simple multivariate technique to improve the design of a sampling strategy for age-based fishery monitoring Fisheries Research 64 79-85
Smith S Edwards R Dalton S amp Harrison M 2005 Biological assessment of fish and benthic communities at Palm Beach Bait Reef Gold Coast Queensland report prepared for University of New England
TRESBP 2014 Autum 2009 storms httpwwwtweedsandbypassnswgovauarticles-and-studiesinteresting-itemsautumn-2009-storm updated 4 May 2014 accessed December 2015
TRESBP 2015a Tweed Sand Bypassing Restoring Coastal Sand Drift Improving Boating Access ndash Techinical information httpwwwtweedsandbypassnswgovau__dataassetspdf_file0004552055kir ra-feb-2015pdf acessed December 2015
TRESBP 2015b Waves httpwwwtweedsandbypassnswgovauenvironmental-monitoringcoastal-conditionswaves updated 30 September 2015 accessed December 2015
Umar MJMLJ amp Price IR 1998 Effects of sediment deposition on the seaweed Sargassum on a fringing coral reef Coral Reefs 17 169-177
Underwood AJ amp Kennelly SJ 1990 Ecology of marine algae on rocky shores and subtidal reefs in temperate Australia Hydrobiologia 192 3-20
Walker S Schlacher T amp Schlacher-Hoenlinger M 2007 Spatial heterogeneity of epibenthos on artificial reefs fouling communities in the early stages of colonization on an East Australian shipwreck Marine Ecology 28 435-445
Walker SJ Degnan BM Hooper JNA amp Skilleter GA 2008 Will increased storm intensity from climate change affect biodiversity in non-scleractinian sessile fauna on coral reefs Global Change Biology 14 2755-2770
Warwick RM amp Clarke KR 1993 Increased variability as a symptom of stress in marine communtities Journal of Experimental Marine Biology and Ecology 172 215-216
Thenumberofsitessurveyedhasvariedover timeasaresultof the fluctuating levelof sandcoveringKirraReef
Prior to May 2003 three sites were assessed along the eastern and northern edge of KirraReef(KirraReefOutersites1to3)andthreesiteswereexaminedalongtheinshore marginof the reef (KirraReef Inner sites1 to 3)(MapA1) ReefRedge (ieKirraOuter) siteswerechosentoprovideearlywarningofimpactsfromoffshoreplacementofdredged sandwhilst inshoresites(ieKirraInner)werechosentoindicatewhetherimpactsfrom inshore beach profile development were affecting the reef platform In May 2003 the threeeasternsitesatKirraReef (ieKRO1KRO2andKRI1)werecompletelycovered with bare mobile sand Consequently only the three western sites at Kirra Reef (ie KRO3KRI2andKRI3)supportedbenthicfloraandfaunaInMarch2004theextentof the remainingwesternoutcropof KirraReef had been further reduced so that all inner reefsiteswerecompletelycoveredwithmobilesandConsequentlyonlyasingleoriginal reefsite(ieKRO3)couldbesurveyed(Figure23)Thereforetoprovideanindicationof the condition of the remaining reef two new sites were established (ie KRN1 and KRN2)(Figure23)andsurveyedinMarch2004Theextentofthewesternreefhadbeen further reduced by February 2005 and a third new site (ie KRN3) was established (Figure23)Consequentlyfoursites(KRO3KRN1KRN2andKRN3)weresurveyedin February2005
InFebruary2010fourKirraReefsites(ieKRO3KRO1KRN1andKRN2)wereclearof thesurroundingsandandsupportedbenthic floraand fauna Inaddition several rocks protruded from the sand in the vicinity of site KRI2H these were assessed to provide a quantitativeindicationofbroadRscaletemporalchangestotheinshorereefcommunities
SOURCEScopy Copyright Commonwealth of Australia (Geoscience Australia) 2001 2004 2006copy The State of Queensland (Department of Natural Resources and Mines) 2015copy Nearmap 2014 2015
DATE2015-09-09
DRAWN BYCF
VERSION02
PROJECTIONCoordinate System GDA 1994 MGA Zone 56Projection Transverse MercatorDatum GDA 1994
plusmn SCALE
0 50 100
Metres
Scale 12500 A3
frc environmental
Appendix$B$ Introduction$to$Data$Analysis$Used$
Multivariate$Analyses$
Multivariate statistical techniques are widely used in ecology to assess the similarities relationshipsbetweenassemblagesWhereasunivariateanalysescanonlycompareone variable at a time (eg an index of community structure such as a diversity index or a singleindicatorspecies)multivariateanalysescancomparesamplesbasedontheextent thatassemblagesshareparticulartaxaandabundances(ClarkeampWarwick2001)
Thefirststepofmultivariateanalysisusuallyinvolvesthecreationofamatrixofsimilarity coefficients computed between every pair of samples The coefficient is usually a measureofhowclose theabundance is foreachspecies (definedso that100= total similarity and 0=complete dissimilarity) The Bray Curtis similarity measure is commonlythemostappropriateforbiologicaldata(ClarkeampWarwick2001)
MultidimensionalScaling
NonRmetricmultiRdimensionalscalingordinations(nMDS)attempttoplacesamplesintwo dimensionalspacesothattherankorderofthedistancesbetweensamplesmatchesthe rankorderofthematchingsimilaritiesfromthesimilaritymatrix(ClarkeampWarwick2001) Thisprovidesavisualrepresentationofthesimilaritiesbetweenassemblageswithineach sampleEachoftheaxesisnotrelatedtoanyparticularvalueHinfactaxescanberotated toprovide thebestvisual representationof thedata Ordinationsareparticularlyuseful tools for analysing and visually presenting differences between assemblages Ordinationsareessentiallymapsofsamples inwhich theplacementofsampleson the mapreflectsthesimilarlyofthecommunitytothecommunitiesinothersamples(Clarkeamp Warwick 2001) Distances between samples on an ordination attempt to match the similarities inassemblagestructurenearbypoints representassemblageswithvery few attributes(speciesorabundanceofspecies)Hpoints faraparthavevery fewattributes in common(ClarkeampWarwick2001)
A stress coefficient is calculated to reflect the extent to which the multiRdimensional scalingordinationandthesimilaritymatrixagree(ClarkeampWarwick2001)(iehowwell the multiRdimensional scaling ordination accurately reflects the relationship between samples)Stressvaluesoflt015aregenerallyacceptable
In Figure A1 each freshwater macroinvertebrate sample is represented on the multiRdimensionalscalingordination By lookingat thedistancesbetweeneachsample
ANOSIMisanalogoustoANOVAinunivariatestatistics(Smith2003)AglobalRstatistic iscalculatedtodeterminewhetherthereisasignificantdifferencebetweenallsamplesIf there are differences then pairwise comparisons are conducted to test for differences betweenpairsofsamples(analogoustopostRhoctestsinANOVA)
The R value lies between R1 and +1 (all similarities within groups are less than any similarity between groups) with a value of zero representing the null hypothesis (no differenceamongasetofsamples)(ClarkeampWarwick2001)ComparisonofpairwiseR values can give an indication of how different assemblages are R values close to 0 indicatelittledifferencevaluesaround05indicatesomeoverlapandvaluescloseto1to indicate many or substantial differences In many instances however researches are primarily interestedinwhethertheRvalueisstatisticallydifferentfromzero(usuallyata confidence level of 005) (Clarke amp Warwick 2001) (ie whether they can reject the null hypothesis)
ANOSIM can provide information on whether the (visual) differences between assemblages in the multiRdimensional scaling ordination are significantH it is an independenttestfromthemultiRdimensionalscalingordinationItisbasedontestingthe
TRESBPKirraReefMarineBiotaMonitoring2015 B2
frc environmental
differences between the rank similarities in the similarity matrix not on the distances betweensamplesinthemultiRdimensionalscalingordination(ClarkeampWarwick2001)
PermutationalMultivariateAnalysisofVariance
PERMANOVAisusedtotestsimultaneousresponsesofoneormorevariablestooneor more factors in an a0 priori0 structured design using random permutation of the data to assess significance (Anderson 2004) PERMANOVA generates a pseudo FRstatistic similar to traditional ANOVA but pRvalues are calculated with permutations which does notassumenormaldatadistribution PERMANOVAcanprovide informationonwhether the (visual) differences between assemblages in a multiRdimensional scaling ordination are significantH however it is an independent test from the multiRdimensional scaling ordination
Thelevelofmultivariatedispersionamongsampleswithineachofthetestgroupscanbe examined using the permutational analysis of multivariate dispersions (PERMDISP) routine(Anderson2004)Intraditionalimpactassessmentachangeinthedispersionof datacanalsoindicateanimpact
SimilarityPercentagendashSpeciesContributions
SIMPER analysis provides information on how dissimilar assemblages from various groups are (eg how similar all of the macroinvertebrate samples taken for a particular habitatwithinastreamreachare)andhowsimilareachgroup(egreach)istoanyother group SIMPER analysis also identifies the species taxa that are contributing to the dissimilarity between two assemblages in rank order (ie it identifies which species is contributingthemosttothedifferences)SIMPERanalysismayhelptoidentifypotential lsquoindicatorrsquospeciesForexampleifaparticularspeciesconsistentlycontributesgreatlyto the differences between impacted and unimpacted assemblages it may be a useful indicator Theabundanceofthis indicatorspeciescanthenbecomparedbetweensites usingunivariatetechniquessuchasANOVA
Data is available on request from tresbpprojectofficecrownlandnswgov
TRESBPKirraReefMarineBiotaMonitoring2015 C1
frc environmental
Appendix(D( Pairwise( PERMANOVA( Results
Data is available on request from tresbpprojectofficecrownlandnswgov
TRESBPKirraReefMarineBiotaMonitoring2015 D1
frc environmental
Appendix(E( Relative(Abundance(of(Fish(found(at(Kirra(( ( and(Palm(Beach(Reefs(in(Each(Survey((Data is available on request from tresbpprojectofficecrownlandnswgovau
TRESBPKirraReefMarineBiotaMonitoring2015 E1
Structure Bookmarks
0 50 100 Metres Scale 12500 A3
0 50 100 200 Metres Scale 15000 A3
Kirra Reef
Kirra Reef
Kirra Reef
Kirra Reef
Kirra Reef
Kirra Reef
Map A1Location of Kirra Reef monitoring sites
Table D8 Pairwise comparison of macroalgae cover between sites in each year
Table D15 Pairwise comparison of turf algae cover between sites in each year
Table D29 Pairwise comparison of ascidian cover between sites in each year
Table D43 Pairwise comparison of soft coral cover between sites in each year
Apr-95
Jun-95
Feb-96
Jan-01
May-03
Mar-04
Feb-05
Feb-10
Jul-12
Apr-14
Mar-15
frc environmental
Spo
nge
Cov
er (
)
25
20
15
10
5
0 Kirra Reef Palm Beach Reef
Location
Figure312 Mean cover of sponges (plusmnSE) at Kirra Reef and Palm Beach Reef on all
surveys
Table34 Univariate PERMANOVA results for differences in the cover of sponges betweensurveysandlocations
Factor$ df$ MS$effect$ PseudoF$ p$(perm)$
survey 10 18576 276 0018
location 1 39671 589 0210
site(location) 4 67354 477 0001
locationxsurvey 10 1490 221 0032
site(location)xsurvey 40 67331 477 0001
error 924 14108
Shadingdenotessignificanceatplt005
TRESBPKirraReefMarineBiotaMonitoring2015 32
frc environmental
Ascidians$
ThemeanabundanceofallascidiansotherthanPyura0stoloniferahasvariedsignifcantly between sites at Kirra Reef and Palm Beach Reef and between surveys at each site (Figure314andnotethesignificantinteractionbetweensite(location)xsurveyinTable 35) The abundance of ascidians was different between sites at Kirra Reef in January 2001May2003March2004February2005andApril2014HanddifferentatPalmBeach ReefinJanuary2001February2005February2010andMarch2015Theabundance ofascidiansvariedbetweensurveysateachsitewith1995beingmostdifferentwhenthe abundanceofascidianswaslow(AppendixD)InMarch2015theabundanceofallother ascidiansonKirraReefandPalmBeachReefwashigherthanpreviouslyreportedinthe baselinesurveyinApril1995(whennoascidianswererecorded)Themeanabundance washigheratKirraReefthanatPalmBeachReef(Figure314)
ThemeanabundanceofPyura0stoloniferahasvariedconsiderablybetweensitesatKirra Reef and Palm Beach Reef over time (note the significant interaction between site (location) x survey in Table 36) In March 2015 the mean abundance (individual per 025m2plusmnSE)of theascidianPstolonifera (Figure313)wassimilaratKirraReefand PalmBeachReef(Figure315)ThemeanabundanceofP0stoloniferahasrangedfrom 02to17individualsper025m2atbothreefssinceMay2003
Figure315 Mean abundance of ascidians (Pyura0 stolonifera) (individuals025m2)
(plusmnSE)atKirraReefandPalmBeachReefinallsurveys
TRESBPKirraReefMarineBiotaMonitoring2015 34
frc environmental
Table35 Univariate PERMANOVA results for the differences in cover of all ascidians otherthanPyura0stolonifera0betweensurveysandlocations
Factor$ df$ MS$effect$ PseudoF$ p$(perm)$
survey 10 26658 474 0001
location 1 13603 710 0104
site(location) 4 19154 149 0212
locationxsurvey 10 2629 468 0001
site(location)xsurvey 40 5621 438 0001
error 924 12828
Shadingdenotessignificanceatplt005
Table36 Univariate PERMANOVA results for the differences in Pyura0 stolonifera densitybetweensurveysandlocations
Factor$ df$ MS$effect$ PseudoF$ p$(perm)$
survey 10 16254 11842 0001
location 1 12445 60881 0206
site(location) 4 20442 56799 0001
locationxsurvey 10 79724 58082 0001
site (location) x 40 13726 38138 0001 survey
error 924 35991
Shadingdenotessignificanceatplt005
$
TRESBPKirraReefMarineBiotaMonitoring2015 35
frc environmental
Hard$Coral$
There was a significant difference between the cover of hard corals at Kirra Reef and PalmBeachReefduringsomesurveys(notethesignificantinteractionbetweenlocationx surveyinTable37)SpecificallytherewassignificantlymorehardcoralatPalmBeach Reef thanKirraReef inFebraury1996March2004April2014andMarch2015(Table 38)
ThecoverofhardcoralistypicallylowonKirraReefaccountingforlessthan2ofthe availablesubstrateInMarch2015hardcoralcoveredlessthan1oftheareaofKirra Reef which was less than the cover recorded during the baseline survey in April 1995 (Figure 316) In contrast hard coral covered 11 of the surface area at Palm Beach ReefwhichwasgreaterthanthecoverrecordedinApril1995(Figure316)
The cover of hard corals at Palm Beach Reef has been more variable over time comparedtothecoverofhardcoralatKirraReef(Figure316)Withtheexceptionofthe surveys inApril1995andJanuary2001when thecoverofhardcoralwas lowonboth reefshardcoralsaretypicallymoreprevalentatPalmBeachReef(Figure316)
Table38 PERMANOVA post hoc pairwise results for the differences in the cover of hardcoralbetweenlocationsineachsurveyevent
Hard$Corals$ Survey$
t$ p$(MC)$a$
Apr1995 054 0606
Jun1995 182 0140
Feb1996 541 0006
Jan2001 R R
May2003 166 0168
Mar2004 765 0001
Feb2005 049 0646
Feb2010 156 0197
Jul2012 283 0053
Apr2014 525 0011
Mar2015 695 0003 Shadingdenotessignificanceatplt005 a pvaluesbasedonMonteCarlotests
TRESBPKirraReefMarineBiotaMonitoring2015 37
60
50
40
30
20
10
0
Soft
Cor
al C
over
()
Kirra Reef Palm Beach Reef
frc environmental
Soft$Coral$
The cover of soft coral was significantly different between sites at both Kirra Reef and PalmBeachReefandduringsomesurveys(notethesignificant interactionbetweensite (location)xsurvey)TherewasnosoftcoralrecordedatKirraReefinMarch2015The coverofsoftcoralhasdeclinedatKirraReefsince2003andhascoveredlessthan2of theavailablesubstratesince2005whichissimilartothecoverofsoftcoraldescribedfor the baseline surveys in 1995 (Figure 317) The cover of soft coral was consistent betweensitesineachsurveyexceptbetweensitesin
sdot April1995atKirraReef
sdot 1996atKirraReef
sdot 2003atPalmBeachReefand
sdot 2014atPalmBeachReef(AppendixD)
Soft corals have historically covered more of the available space on Palm Beach Reef than on Kirra Reef However there was more temporal variability within sites at Palm BeachReefthanatKirraReef(AppendixD)ThecoverofsoftcoralatPalmBeachReef has varied over time and was highest in April 1995 (48 cover) Despite increasing sinceFebruary2005itisstilllowerthanthecoverrecordedduringthebaselinesurveyin April1995(Figure317)
Table39 UnivariatePERMANOVAresults for thedifferences in thecoverofsoft coral betweensurveysandlocations
Factor$ df$ MS$effect$ PseudoF$ p$(perm)$
survey 10 44657 1323 0001
location 1 32922 6620 0117
site(location) 4 49732 266 0036
locationxsurvey 10 40982 1214 0001
site (location) x 40 3376 181 0002 survey
error 924 18688
Shadingdenotessignificanceatplt005
$
TRESBPKirraReefMarineBiotaMonitoring2015 39
frc environmental
Crinoids$
ThereisasignificantdifferencebetweensomesitesatbothKirraReefandParmBeach Reef that varies through time (note the significant interaction between site (location) x survey inTable310) Theabundanceofcrinoidshasbeensimilarbetweensites inall years at Palm Beach ReefH and was different beween sites at Kirra Reef in June 1995 February1996May2003andFebruary2005(AppendixD)Withineachsitetherehas been some natural temporal variability particualrly at Palm Beach Reef sites in 2001 (Appendix D) The mean abundance (individuals 025m2) of crinoids (Figure 318) at KirraReefandPalmBeachReefhasgenerallybeenlessthan2individualsper025m2 andhasdeclinedatboth locationssincethebaselinesurvey inApril1995(Figure319) However the mean abundance of crinoids on Kirra Reef has shown a slight increase sinceFebruary2010(Figure319)
In March 2015 fewer crinoids were recorded at Palm Beach Reef than at Kirra ReefH crinoidshavebeenrareatPalmBeachReefsince2003
The species richness of fish recorded from Kirra Reef across all monitoring events has rangedfrom14to57 InMarch201557specieswereidentifiedat thereefwhichwas similar to April 2014 (53) and higher than previous surveys (Figure 320) Species richnessatPalmBeachReefwas lower(34species)andgenerallyvaried lessbetween surveyscomparedtoKirraReef
InMarch2015 the assemblage of fish at KirraReef comprised species fromall trophic levelsincludingdetritivoresplanktivoresherbivoresandcarnivores(AppendixE)Asin previous surveys the assemblage was dominated by herbivores and planktivores Yellowtail (Trachurus0 novaezelandiae) and striped sea pike (Sphyraena0 obtusata) were the dominant species present in large schools (Figure 321) Australian mado (Atypichthys0 strigatus) ringRtailed surgeon (Acanthurus0 blochii) silver trevally (Pseudocaranx0 georgianus) eastern pomfred (Schuettea0 scalaripinnis) sweep (Scorpis0 lineolatus) and various wrasses were also very abundant releative to other species (AppendixE)
Two new species were observed at Kirra Reef the orangeRband surgeon (Acanthurus0 olivaceus) and the unicornfish (Naso0 sp) Five new species were recorded at Palm BeachReef
No threatened or protected fish species listed under the Queenslandrsquos Nature0 Conservation0Act01992ornationallyundertheEnvironmental0Protection0and0Biodiversity0 Conservation0 Act0 1999 were observed The complete list of species recorded and the relativeabundanceispresentedinAppendixE
TRESBPKirraReefMarineBiotaMonitoring2015 42
60
0
10
20
30
40
50
Num
ber
of F
ish
Spe
cies
Apr-95
Jun-95
Feb-96
Jan-01
May-03
Mar-04
Feb-05
Feb-10
Jul-12
Apr-14
Mar-15
Kirra Reef Palm Beach Reef Location
frc environmental
Figure320 Number of fish species recorded at Kirra Reef and Palm Beach Reef on
ThegreatestchangetotheecologicalconditionofKirraReefsincethebaselinesurveyin 1995 has been the loss of large areas of hard substrate that support benthic flora and faunaThedeliveryoflargesandvolumesduringthestage1dredgingoperations(1995 to1998)andtheinitialoperationofthesandbypasssystem(2001to2008)resultedinan increaseinwaveactionandtidalcurrentsredistributingthissandoverKirraReef
The three major outcrops of Kirra Reef (northern southern and eastern sections) are naturally exposed and covered depending on water and sand movements In March 2015 the rocky outcrops in the northern section of Kirra Reef were exposed and supportedamoderatelydiversebenthicassemblagedominatedbyturfalgaeTherewas arelativelyhighfishdiversityatKirraReefTheecologicalassemblageexhibitedsignsof ongoingstressfromphysicaldisturbanceincludingtheabsenceofsoftcoralsandrarityof hardcoral(MumbyampSteneck2008)HoweverKirraReefhasarelativelyhighcoverof sponges and ascidians Sponges ascidians and crinoids were more abundant at Kirra ReefthanatPalmBeachReefinMarch2015
KirraReefcontinues toprovidehabitatandsupport importantecological functions in the region providing hard substrate for the colonisation of algae and benthic invertebrates and food and refuge for fish As sand levels have stabilised since 2008 assemblages have becomemoresimilar to those recordedprior to implementationof the TRESBP in April1995 Forexamplemacroalgalcover inApril1995andMarch2015wasrelatively similarHoweverassemblagecompositionisstillsignificantlydifferenttothatrecordedin thebaselinesurveysmostnoticeablyduetoa lowercoverofbaresubstrateandhigher coverofturfalgaeandascidianssincesurveyshavebeenperformed
Benthic$Macroalgae$
The cover of macroalgae at Kirra Reef was relatively similar during the 2014 and 2015 surveys and remained well below the peak of nearly 60 cover recorded in January 2001TherewasasteepdeclineinthecoverofmacroalgaebetweenJanuary2001and May2003whichappearedtobestronglyassociatedwith thedecline inreefareaduring that time as well as a decline in the cover of Sargassum sp (an important indicator speciesonKirraReef) SimilardeclineswereevidentatPalmBeachReefbetween the January2001andMay2003surveys
TRESBPKirraReefMarineBiotaMonitoring2015 45
frc environmental
The cover ofmacroalgae at Palm Beach Reef was much lower thanat Kirra Reef over time There are several possible reasons for the lower cover of macroalgae at Palm Beach
sdot PalmBeachReefisdeeperthanKirraReefandgenerallyhashigherturbidityand therefore greater light attenuation The quantity and quality of available light affectsthedistributionandgrowthofmacroalgae(MillerampEtter2008)
sdot Differences in the pattern of recruitment of algal species to the reefs due to differentwatercurrentsandtimingofthesurveys(Kennelly1987b)
sdot Increased competition with turf algae and sessile benthic invertebrates which competeforspacewithmacroalgae(Kennelly1987aHMillerampEtter2008)
sdot PresenceofdifferentspeciesandhigherdensityofherbivoresatPalmBeachReef (particularly sea urchins and herbivorous fish) which graze on macroalgae (McCook1997HJompaampMcCook2002)
Biological assemblages exposed to physical stress typically exhibit greater levels of temporalandspatialvariability(WarwickampClarke1993HChapmanetal1995)Temporal variationinthecoverofmacroalgaeatKirraReefislikelytobeprincipallyduetotheeffect ofphysicaldisturbance fromwaveactionaswellas theassociatedassociatedabrasion andsmotheringbysandTheeffectsofthesephysicaldisturbanceswouldincreasewith thereductionofKirraReefasedgeeffectsarepronouncedandwaterdepth isreduced Increasedsmotheringbysandcanalsoreducediversity(Hatcheretal1989)abundance recruitment growth survival and seasonal regeneration of macroalgae (Umar amp Price 1998HCheshireetal1999)
Changes in the cover of macroalgae on Kirra Reef over time are also likely due to the extentofthereefchangingHthefishandmobileinvertbratesassociatedwiththereefmay have concentrated which would in turn increase grazing pressure Increased grazing pressure from fish and mobile invertebrates can reduce the coverage and diversity of macroalgaeonreefs(McCook1997HJompaampMcCook2002)
Thecoverof turfalgaeatbothKirraReefandPalmBeachReefhasvariedsignificantly betweensurveysPriorto2005turfalgaetypicallycoveredlessoftheavailablesurface areaonKirraReefthanPalmBeachReefInMarch2015themeancoverofturfalgae hasincreasedsincebaselinesurveysin1995andwasrelativelysimilarbetweenreefs(40 plusmn4atKirraReefcomparedto48plusmn4atPalmBeachReef)Thecoverofturfalgaeat Kirra Reef was similar in 2014 and 2015 which was generally higher than previous surveysexceptduringJuly2012whencoverofturfalgaepeakedat67plusmn4
TRESBPKirraReefMarineBiotaMonitoring2015 46
frc environmental
Turfalgaearebecomingadominantcomponentofcommunitiesaroundtheworld likely the result of rapid colonisation of openspace after a disturbance (eg storms) nutrient enrichment andor changes in grazing pressures Turf algae can also reflect a more physically robust growth form suited to high wave energy environments (than foliose macroRalgae)TurfalgaepeakedintheJuly2012surveylikelyrelatedtotheincreasein bare reef exposure following a stormy conditions in early 2009 and between December 2011 and June 2012 Turf algae have been the dominant form of algae on Kirra Reef sincethistimealbeitthecoverlowerthanthe2012survey
Increased cover of turf algae is typically related to good light conditions high concentrationsofnutrientsandlownumbersofgrazerssuchasfish(orconstantgrazing pressure preventing macroalgae colonisation) However the relationship between algal dynamics physical disturbance water quality and herbivore grazing activity is complex andthecoverof turfalgaecanexhibitextremetemporalvariabilityasaconsequenceof the interactionbetween topRdownandbottomRupprocesses (Russ2003HBellwoodetal 2006H Hughes et al 2007H Albert et al 2008H Hoey amp Bellwood 2008H Mumby 2009) Furtherinvestigationwouldberequiredtoreliablydeterminethemechanismsofchangein bothmacroalgaeandturfalgaeassemblagesonthesereefs
Benthic$Macroinvertebrates$
AtKirraReeftheburialandreRemergenceofrockyoutcrops(influencedbytheTRESBP) islikelytohaveincreasedtemporalvariabilityinthedistributionandabundanceofbenthic macroinvertebrates Additional perturbations such as wave action and sand abrasion (each influenced through changes in bathymetry seabed topography and water depth) are likely to have resulted in the decline in cover and diversity of the benthic macroinvertebratesatKirraReefbetweensurveysparticularlybetweenMarch2004and February2005andduringtheseverestormsof2009Benthicmacroinvertebratessuch asascidiansspongeshardcoralandsoftcoralarehighlysusceptible to theeffectsof stormandwavedisturbancephysicalabrasionandburialbysand(KayampKeough1981H Walker et al 2008) which can affect settlement growth rate and survival (Dodge amp Vaisnys1977HRogers1990)
Physical disturbance from sand burial sand abrasion and the action of storm waves appeartokeepthebenthicassemblagesofKirraReefinastateofearlysuccessionItis commonforearlypioneerspeciessuchassomemacroalgaetorecruitrapidlytoahard surface in large numbers allowing these species to dominate assemblages early in the successionaltrajectory(Walkeretal2007)
Afurther indicatorof theearlystateofsuccessionatKirraReef isthatthecoverofhard and soft coral has remained very low (generally lt 5) In March 2015 less than 1
Benthic macroinvertebrate cover may also be affected indirectly through increased competitionwithmacroalgaeforspaceThepresenceoflargemacroalgaecanaffectthe recruitment and survival of sessile benthic invertebrates as fronds moving with wave action sweep and abrade the surface of rocks killing new recruits especially corals (Kennelly1989HMcCooketal2001)Itcantakeseveralyearsforhardandsoftcoralto become dominant on reefs in the SEQ region (SchlacherRHoenlinger et al 2009) Therefore hard coral is not expected to become abundant until several years after the reefhasbeenuncoveredandonlyifthephysicaldisturbanceregimeandsupplyofnew recruitsissufficienttosupportsurvivalandgenerationalsuccessionofthesespeciesThe coverofhardandsoftcoralsatKirraReefwerebothverylowandpatchypriortothestart oftheTRESBP
Sponges and ascidians are highly susceptible to smothering and sand abrasion unless theyhaveathicktunic(outercoveringmadeofkeratin)liketheascidianP0stolonifera0or strong internal keratin silicon or calcareous structures in the case of some species of sponges0(KayampKeough1981HMcGuinness1987HWalkeretal2008)Duetoincreased wave action and sedimentation (which can be influenced by the TRESBP) the mean coverofascidiansandspongeswasexpectedtobemuchloweronKirraReefthanPalm Beach Reef However in March 2015 the cover of sponges was similar between the reefsandthecoverofascidians(otherthanP0stolonifera)wasgreateratKirraReefthan at Palm Beach Reef This suggests that Kirra Reef is slowly recovering from the increasedstressofphysicaldisturbancesuchas increasedwaveactionandsandscour andorthatwaveandstormconditionshavebeenlesssevereinthepastfewyears
Fish$
KirraReefcontinuestosupportahighdiversityofreefRassociatedandpelagic(ienonR reefassociated) fishspecies Despite itsdiminishedsizecompared to1995KirraReef continuestoprovidevaluablehabitatforanumberoffishspeciesfromdifferentfunctional groups
ThereisahighdegreeofinterRannualvariabilityinthespeciesandabundanceofthefish present at Kirra Reef compared with the assemblage at Palm Beach Reef This likely reflectsthetemporalvariabilityintheavailablehabitatasaconsequenceofreefburialand reRemergenceThediversityqualityandarealextentofreefhabitatareimportantfactors influencing the distribution abundance biomass and diversity of reef fish (Bellwood amp Hughes2001HFriedlanderetal2003)Diversityandabundanceoffishcanincreasewith
TRESBPKirraReefMarineBiotaMonitoring2015 48
frc environmental
greaterstructuralcomplexityandincreasedheterogeneityofavailablehabitats(Bellwood ampHughes2001)Thissuggeststhatperiodsofreefburialreducetheoveralldiversityof reefRassociated fish species at Kirra Reef Despite the reduction in overall reef space therewasalargervarietyofhabitats(suchasmarcoalgaeandturfalgae)in2015which was likely to be related to the high diversity of fish assemblages This is particularly importantforseveralspeciesthatdependonthepresenceoflsquostructurersquosuchasprovided by reef habitat (ie oldwife moray eels damselfish and Australian mado that were recordedinMarch2015butwerenotrecordedinJuly2012)
Theabundanceanddiversityof fishare likelytobenegativelyaffectedfollowingperiods of severe weather which create unfavourable conditions for many species and may further exacerbate the affects of abrasion and sedimentation The biomass of fish is knowntodecreasewithincreasingexposuretophysicaldisturbancefromwaveactionand strong currents (Friedlander et al 2003) As our surveys have been undertaken at different times of the year variation in the prevailing conditions at the time of sampling could also influence the types of fish observed (and the amount of reef habitat that is availableatanytime)Manyofthespeciesmayalsobeaffectedbyseasonalchangesin the water temperature such as damselfish which are less abundant in cool waters However theoveralldiversityof the fishassemblageatKirraReef is likely toreflect the sizeoftheoutcropsexposedwithagreaterphysicaldisturbance(fromseaconditionsand sandmovement)andcompetitionHandlesserfoodavailablewhenthereefiscovered
ThepredictedimpactstoKirraReefasaresultoftheTRESBPincludedaccretionofsand around the base of the rock outcrops causing a reduction in extent of reef It was predictedthatsanddeliveryaspartoftheprojectwouldeventuallymimiclsquonaturalrsquopatterns ofsanddispersalandthatthereefwouldreturntoitsnaturalextent(ietheextentpriorto extension of the Tweed River training walls in 1962) The benthic flora and fauna assemblages of the reef the historical reef extent and natural sand transport patterns wereexpectedtoreturntoconditionsobservedbeforetheextensionofthetrainingwalls between 1962 and 1965 However the Environmental Impact Study did not predict the ecologicalconsequencesofboththereducedarealextentandincreasedwaveenergy(a consequenceofdecreaseddepth)thathavebeenrecorded
ThecurrentextentofKirraReef remains less than50of that recorded in1962and in 1995beforethesanddeliverybytheTRESBPcommencedHowevertheextentofreef in1995 wasstrongly influenced by adepletion in sand following the construction of the Tweed River training walls and the Kirra Point groyne Accumulation of sand on Kirra ReefwasobservedtoincreaseasaresultofindirectsandnourishmentbytheTRESBP and the reef has been extensively covered (particuarly between 2005 and 2010) as a result
Whiletheextentofthereefcontinuestochangeovertimethedeliveryofsandaspartof the project now more closely matches the natural rate of longshore sand transport ShortRtermandseasonalchangesintheextentofthereefarenowlikelytobetheresultof waveandcurrentaction(particularlyduringservereweatherevents)thanadirectimpact of the TRESBP Therefore the extent of Kirra Reef in March 2015 is broadly in accordancewithpredictionsmadeintheEISwhichpredictedthatthereefwouldreturnto a condition similar to that exhibited in the preR1960rsquos ie before the extension of the TweedRiverbreakwatersthatinterruptedlittoralsandsupplytothesebeaches
InDecember2013KirraPointgroynewasextendedby30mwiththeexpectationthatthe beach bar would move seaward as a consequence At present Kirra Point groyne is unlikelytohavehadamajorimpactonthearealextentofKirraReefHoweverongoing monitoringbasedonaerialphotographsmayprovidefurtherinsight
Sessile benthic assemblages on Kirra Reef are highly susceptible to the influence of storms and associated wave action (Kay amp Keough 1981H Walker et al 2008) The shallowreefissurroundedbymobilesandwhichcanshiftnaturallyinresponsetowave action during storms causing burial of large sections of Kirra Reef This effect has reduced the availability of rocky substrate for colonisation and the availability of refuge
Fromanexaminationof theextentofKirraReef fromarealmapsandwaveheightdata thereappears tobea relationshipbetween theareaof rockexposedandstormevents Notably in a series of storm events in May 2009 corresponds with large areas of rock becoming exposed (with the reef approximately 100m2 in 2006 and approximately in 1009m2 2009) Further a stormy conditions between December 2011 and July 2012 correspondstotheareaofexposedrockmorethandoublinginsizeWhiletherewasno changetothetotalareaofexposedrockfollowingstormyconditionsinearly2013there wasaclearchangeinthedistibutionofexposedrockduringthistimeSince2013storm conditions have been calm to moderate and there has been little change in the areal extentanddistrubtionofexposedrockatKirraReef
WaveheighttypicallyincreasesduringstormeventsandgiventheshallowdepthofKirra Reef waves are more likely to shoal and break across the reef during storms This increases thephysicaldisturbanceabrasionandsedimentationofbenthicassemblages onKirraReefStormdisturbancecancauselocalreductionsinthespeciesrichnessand abundanceofcoral(Woodleyetal1981HMasselampDone1993HHughes1994HConnellet al 1997) and can alter fish assemblages indirectly through habitat modifications (Kaufman1983HJonesampSyms1998)ordirectlybyincreasingfishmortality(Lassig1983) The hydrodynamic forces produced by wave action are an important source of disturbance in subtidal habitats inflicting damage through direct physical impact and abrasion(UnderwoodampKennelly1990)DirectimpactsfromphysicaldisturbanceatKirra Reefareevidentduringsurveyeventswhenlargefragmentsofmacroalgaearepresentin thewatercolumnoverthereef
Storm and wave action (and associated sedimentation and abrasion) continue to be importantforcesshapingthedistributionandabundanceofbenthicspeciesatKirraReef Increased magnitude and frequency of physical disturbance resulting from increased exposureorsusceptibility tostormsandassociatedwaveaction (asonKirraReef)can lead to a decrease in the diversity of sessile invertebrate assemblages DisturbanceR drivenreductionsinbiodiversityhavethepotentialtoimpactnegativelyonthehealthand productivity of reef ecosystems (Walker et al 2008) Biodiversity is important to reef health given that many of these species (eg sponges bryozoans and ascidians) contribute a range of vital ecosystem services to reefs including nutrient cycling (Scheffers et al 2004) trophic interactions and food webs (Lesser 2006H Pawlik et al 2007) bioRerosion (Rutzler 2002H LopezRVictoria et al 2006) and stabilizing substrata (DiazampRutzler2001HWulff2001)
Theimpactsof increasedwaveactionandsedimentationonthebenthicassemblagesat Kirra Reef are likely to be greatest during and immediately following storm conditions
TRESBPKirraReefMarineBiotaMonitoring2015 51
frc environmental
Partitioningtheinfluenceofstormandwavedrivendisturbancefromthatoftheoperation oftheTRESBPwouldrequireamuchmorestatisticallypowerfulandtemporilyreplicated experimental design Given there is a large collection of wave and storm data by TRESBP this would involve greater temporal sampling of Kirra Reef including event samplingfollowingseverewaveandstormactivity
The data generated by this Kirra Reef biota monitoring program doesnrsquot support statistically rigorous consideration of seasonality (monitoring has been at its most frequentannual)
InApril2014andMarch2015KirraReefcoveredlessthan50ofthereefrsquosextentprior to theoperationof theTRESBP The lossof reefhabitathasreducedtheavailabilityof hard substratum available for colonisation and consequently the abundance of benthic sessileassemblages
The reduced depth of water resulting from the accumulation of sand exacerbates the effects of storms and wave action It is likley that as a consequnece the biological communities of Kirra Reef will reflect earlyRstage succession more frequently and for longerperiods
While there is sufficient structure available frcenvironmentalexpect that Kirra Reef will continuetoprovideimportanthabitatforadiverseassemblageoffishes
TRESBPKirraReefMarineBiotaMonitoring2015 52
frc environmental
5$ Conclusions$
Although there is still a substantial portion of the reef covered compared to before the extension of the Tweed River entrance breakwaters the current extent of Kirra Reef is broadly inaccordancewithpredictionsmadein theEIS Initial lsquocatchRuprsquobypassingand dredgeplacementofsand(between2001and2008)resulted in theburialofKirraReef Subsequentsanddelivery(since2008onwards)morecloselyreflectsnaturalpatternsof longRshoresandtransportandisthereefhasslowlyreRemerged
Theextentofthereefhasbeenrelativelystablesince2013Thishasallowedforsome succession in the benthic assemblages including a relatively high cover of sponges ascidiansandcrinoidsWiththedeliveryofsandmorecloselymatchingthenaturalrateit isexpected the reef willundergoshortRtermchanges in extentdue toseasonal shifts in sand deliveryH however the diversity of benthic assemblages on Kirra Reef is likely to increaseovertimeThiswouldcreatemorespaceforspeciestorecruitandreducesthe influence of sand abrasion and wave damage It was predicted that the areas of Kirra Reef newly exposed in 2012 would undergo a shift from turfRdominated communities to more diverse communities that could include macroalgae sponges ascidians and potentiallyhardandsoftcoralWiththeexceptionofhardandsoftcoralsthisprediction wasconfirmedbytheresultsoftheApril2014andMarch2015surveys
ThediversityoffishesassociatedwithKirraReefisbroadlysimilartothatrecordedprior tothecommencementofsandbypassingin1995Giventhatfisharemobilethegreatest impacts on fish assemblages are likely to be shortRterm changes due to both the prevailingconditionsandchangestheextentofavailablehabitatthatprovidesshelterand foodforavarietyofdifferentspeciesIfKirraReefincreasesinsizethereislikelytobea greater proportion of cryptic benthic species as these species are more typical of assemblagesinalaterstageofsuccession(eg(WillisampAnderson2003))
Assuming a broadly stable delivery rate of sand and consequent stable extent of Kirra ReeflsquorecoveryrsquoislikleytobesubstantivelycompleteFloralandfaunalcommunitieswill undergo succession between severe storm events but are likley to remain relatively dynamic
Albert S Udy J amp Tibbetts I 2008 Responses of algal communities to gradients in herbivorebiomassandwaterqualityinMarovoLagoonSolomonIslandsCoral0 Reefs2773R82
Anderson MJ 2001 A new method for nonRparametric multivariate analysis of varianceAustral0Ecology2632R46
Anderson MJ 2004 PERMDISP0 a0 FORTRAN0 computer0 program0 for0 permutatinoal0 analysis0 of0 multivariate0 dispersions0 (for0 any0 twoSfactor0 ANOVA0 design)0 using0 permutational0 tests Department of Statistics University of Auckland New Zealand
Cannon LR Goeden GB amp Campbell P 1987 Community patterns revealed by trawling in the interRreef regions of the Great Barrier Reef Memoirs0 of0 the0 Queensland0Museum2545R70
Chapman MG Underwood AJ amp Skilleter GA 1995 Variability at different spatial scalesbetweenasubtidalassemblageexposedtothedischargeofsewageand two control assemblages Journal0 of0 Experimental0 Biology0 and0 Ecology 189 103R122
Cheshire AC Miller DJ amp Stewart R (1999) Effect0 of0 dispersed0 sediment0 plumes0 from0beach0sand0replenishment0dredging0on0recruitment0of0phaeophycean0algae0 to0rocky0reefs0in0Gulf0St0Vincent0South0Australia0The0Impact0of0Sand0Dredging0 on0 Benthic0 Community0 Structure0 at0 the0 Port0 Stanvac0 Dredge0 Site0 20 1S39 UniversityofAdelaideAdelaide
ConnellJHHughesTPampWallaceCC1997A30Ryearstudyofcoralabundance recruitment and disturbance at several scales in space and time Ecological0 Monographs67461R488
Diaz MC amp Rutzler K 2001 Sponges an essential component of Caribbean coral reefsBulletin0of0Marine0Science69535R546
DodgeREampVaisnysJR1977Coralpopulationsandgrowthpatternsresponsesto sedimentation and turbidity associated with dredging Journal0 of0 Marine0 Research35715R730
Done TJ 1982 Patterns in the distribution of coral communities across the central GreatBarrierReefCoral0Reefs195R107
Edwards RA amp Smith DA 2005 Subtidal assemblages associated with a geotextile reef insouthReastQueenslandAustraliaMarine0and0Freshwater0Research56 133R142
FisheriesResearchConsultants1991Survey0of0the0Intertidal0and0Subtidal0Rocky0Reefs0 of0 the0 Sunshine0 Coast report prepared for Queensland National Parks and WildlifeService
HarrisonPHarriotVBanksSampHolmesN1998ThecoralcommunitiesofFlinders Reef andMyora Reef in theMoretonBay MarineParkQueensland Australia In Moreton0 Bay0 and0 Catchment Tibbits I Hall N amp Dennison W (Eds) SchoolofMarineScienceUniversityofQueenslandStLuciapp525R536
Hatcher B Johannes R amp Robertson A 1989 Review of research relevant to the conservationofshallowtropicalmarineecosystemsOceanography0and0Marine0 Biology0an0Annual0Review27337R414
Hoey A amp Bellwood D 2008 CrossRshelf variation in the role of parrotfishes on the GreatBarrierReefCoral0Reefs37R47
TRESBPKirraReefMarineBiotaMonitoring2015 56
frc environmental
Hollingsworth P 1975 Environmental Investigation Report Crown Reserve R R68 Currumbin Creek City of the Gold Coast Land Administration Commission unpublishedreport
Hughes TP 1994 Catastrophes phase shifts and large scale degradation of a CaribbeancoralreefScience2651547R1551
Hughes TP Rodrigues MJ Bellwood DR Ceccarelli D HoeghRGuldberg O McCook L Moltschaniwskvi N Pratchett MS Steneck RS amp Willis B 2007Phaseshiftsherbivoryandtheresilienceofcoralreefstoclimatechange Current0Biology17360R365
Hutchinson A Rempel C Taveras V Loder J amp Salmond J 2013 Reef0 Check0 Australia0 South0 East0 Queensland0 Summary0 Report0 2013 report prepared for ReefCheckFoundationLimited
Hyder Consulting 1997 Tweed0 River0 Entrance0 Sand0 Bypassing0 Project0 Permanent0 Bypassing0 System0 0 Environmental0 Impact0 Statement0 0 Impact0 Assessment0 Study report prepared for New South Wales Department of Land and Water Conservation
Jompa J amp McCook LJ 2002 Effects of competition and herbivory on interactions betweenahardcoralandabrownalgaJournal0of0Experimental0Marine0Biology0 and0Ecology27125R39
KayAMampKeoughMJ1981Occupationofpatchesintheepifaunalcommunitieson pier pilings and the bivalve Pinna bicolor at Edithburgh South Australia Oecologia48123R130
KennellyS1987aInhibitionofkelprecruitmentbyturfingalgaeandconsequencesfor an Australian kelp community Journal0 of0 Experimental0 Marine0 Biology0 and0 Ecology11249R60
Kennelly S 1987b Physical disturbances in an Australian kelp community I temporal effectsMarine0Ecology0Progress0Series40145R153
TRESBPKirraReefMarineBiotaMonitoring2015 57
frc environmental
Kennelly S 1989 Effects of kelp canopies on understory species due to shade and scourMarine0Ecology0Progress0Series50215R224
Lassig BR 1983 The effects of a cyclonic storm on coral reef fish assemblages Environmental0Biology0of0Fishes955R63
Lawson S McMahon J amp Boswood P 2001 Environmental management of the construction and operation of a sand bypassing system at the Tweed River EntranceInThe15thAustralasianCoastalandOceanEngineeringConference the 8th Australasian Port and Harbour Conference 25 R 28 September 2001 QueenslandAustralia
Lesser MP 2006 BenthicRpelagic coupling on coral reefs feeding and growth of Caribbean sponges Journal0 of0 Experimental0 Marine0 Biology0 amp0 Ecology 328 277R288
LopezRVictoriaM ZeaSampWei E2006 Competition for spacebetweenencrusting excavatingCaribbeanspongesandothercoral reeforganismsMarine0Ecology0 Progress0Series312113R121
MalcolmHASmithSDAampJordanA2009Usingpatternsofreeffishassemblages to refine a Habitat Classification System for marine parks in NSW Australia Aquatic0Conservation0Marine0and0Freshwater0Ecosystems2083R92
Massel SR amp Done TJ 1993 Effects of cyclone waves on massive coral assemblages on the Great Barrier Reef meteorology hydrodynamics and demographyCoral0Reefs12153R166
Mumby PJ amp Steneck RS 2008 Coral reef management and conservation in light of rapidly evolving ecological paradigms Trends in Ecology amp Evoution 23 555 -563
Murphy HM amp Jenkins GP 2010 Observational methods used in marine spatial monitoring of fishes and associated habitats a review Marine and Freshwater Research 61 236-252
Noriega R 2007 An Overview of Available Information on Sandy Beach Ecology Coastal Sand Dunes Rocky Reefs and Associated Biota on the Gold Coast Griffith Centre for Coastal Management Research Report No 85 report prepared for Griffith University
Parker P (1995) Structure to Reef Fish Assemblages at Julian Rocks Northern New South Wales Masters Thesis Griffith University
Parker PG 1999 Fish assemblages at Julian Rocks and the adjacent waters of northern New South Wales Australia Australian Zoologist 31 134 - 160
Pawlik JR Steindler L Henkel TP Beer S amp Ilan M 2007 Chemical warfare on coral reefs sponge metabolites differentially affect coral symbiosis in situ Limnology and Oceanography 52 907-911
Reef Check 2010 httpwwwreefcheckaustraliaorgdatahtml accessed December 2015
Robinson KI amp Pollard DA 1982 Marine and estuarine reserves in Australia with particular reference to New South Wales Wetlands 2 17 - 26
Rogers CS 1990 Responses of coral reefs and reef organisms to sedimentation Marine Ecology Progress Series 62 185-202
Russ GR 2003 Grazer biomass correlates more strongly with production than with biomass of algal turfs on a coral reef Coral Reefs 22 63-67
Rutzler K 2002 Impact of crustose clionid sponges on Caribbean reef corals Acta Geologica Hispanica 37 61-72
Scheffers SR Nieuwland G Bak RPM amp van Duyl FC 2004 Removal of bacteria and nutrient dynamics within the coral reef framework of Curacao (Netherlands Antilles) Coral Reefs 23 413-422
TRESBP Kirra Reef Marine Biota Monitoring 2015 59
frc environmental
Schlacher-Hoenlinger M Walker S Johnson J Schlacher T amp Hooper J 2009 Biological Monitoring of the Ex-HMAS Brisbane Artificial Reef Phase II - Habitat Values report prepared for Environmental Protection Agency (EPA)
Smith KA 2003 A simple multivariate technique to improve the design of a sampling strategy for age-based fishery monitoring Fisheries Research 64 79-85
Smith S Edwards R Dalton S amp Harrison M 2005 Biological assessment of fish and benthic communities at Palm Beach Bait Reef Gold Coast Queensland report prepared for University of New England
TRESBP 2014 Autum 2009 storms httpwwwtweedsandbypassnswgovauarticles-and-studiesinteresting-itemsautumn-2009-storm updated 4 May 2014 accessed December 2015
TRESBP 2015a Tweed Sand Bypassing Restoring Coastal Sand Drift Improving Boating Access ndash Techinical information httpwwwtweedsandbypassnswgovau__dataassetspdf_file0004552055kir ra-feb-2015pdf acessed December 2015
TRESBP 2015b Waves httpwwwtweedsandbypassnswgovauenvironmental-monitoringcoastal-conditionswaves updated 30 September 2015 accessed December 2015
Umar MJMLJ amp Price IR 1998 Effects of sediment deposition on the seaweed Sargassum on a fringing coral reef Coral Reefs 17 169-177
Underwood AJ amp Kennelly SJ 1990 Ecology of marine algae on rocky shores and subtidal reefs in temperate Australia Hydrobiologia 192 3-20
Walker S Schlacher T amp Schlacher-Hoenlinger M 2007 Spatial heterogeneity of epibenthos on artificial reefs fouling communities in the early stages of colonization on an East Australian shipwreck Marine Ecology 28 435-445
Walker SJ Degnan BM Hooper JNA amp Skilleter GA 2008 Will increased storm intensity from climate change affect biodiversity in non-scleractinian sessile fauna on coral reefs Global Change Biology 14 2755-2770
Warwick RM amp Clarke KR 1993 Increased variability as a symptom of stress in marine communtities Journal of Experimental Marine Biology and Ecology 172 215-216
Thenumberofsitessurveyedhasvariedover timeasaresultof the fluctuating levelof sandcoveringKirraReef
Prior to May 2003 three sites were assessed along the eastern and northern edge of KirraReef(KirraReefOutersites1to3)andthreesiteswereexaminedalongtheinshore marginof the reef (KirraReef Inner sites1 to 3)(MapA1) ReefRedge (ieKirraOuter) siteswerechosentoprovideearlywarningofimpactsfromoffshoreplacementofdredged sandwhilst inshoresites(ieKirraInner)werechosentoindicatewhetherimpactsfrom inshore beach profile development were affecting the reef platform In May 2003 the threeeasternsitesatKirraReef (ieKRO1KRO2andKRI1)werecompletelycovered with bare mobile sand Consequently only the three western sites at Kirra Reef (ie KRO3KRI2andKRI3)supportedbenthicfloraandfaunaInMarch2004theextentof the remainingwesternoutcropof KirraReef had been further reduced so that all inner reefsiteswerecompletelycoveredwithmobilesandConsequentlyonlyasingleoriginal reefsite(ieKRO3)couldbesurveyed(Figure23)Thereforetoprovideanindicationof the condition of the remaining reef two new sites were established (ie KRN1 and KRN2)(Figure23)andsurveyedinMarch2004Theextentofthewesternreefhadbeen further reduced by February 2005 and a third new site (ie KRN3) was established (Figure23)Consequentlyfoursites(KRO3KRN1KRN2andKRN3)weresurveyedin February2005
InFebruary2010fourKirraReefsites(ieKRO3KRO1KRN1andKRN2)wereclearof thesurroundingsandandsupportedbenthic floraand fauna Inaddition several rocks protruded from the sand in the vicinity of site KRI2H these were assessed to provide a quantitativeindicationofbroadRscaletemporalchangestotheinshorereefcommunities
SOURCEScopy Copyright Commonwealth of Australia (Geoscience Australia) 2001 2004 2006copy The State of Queensland (Department of Natural Resources and Mines) 2015copy Nearmap 2014 2015
DATE2015-09-09
DRAWN BYCF
VERSION02
PROJECTIONCoordinate System GDA 1994 MGA Zone 56Projection Transverse MercatorDatum GDA 1994
plusmn SCALE
0 50 100
Metres
Scale 12500 A3
frc environmental
Appendix$B$ Introduction$to$Data$Analysis$Used$
Multivariate$Analyses$
Multivariate statistical techniques are widely used in ecology to assess the similarities relationshipsbetweenassemblagesWhereasunivariateanalysescanonlycompareone variable at a time (eg an index of community structure such as a diversity index or a singleindicatorspecies)multivariateanalysescancomparesamplesbasedontheextent thatassemblagesshareparticulartaxaandabundances(ClarkeampWarwick2001)
Thefirststepofmultivariateanalysisusuallyinvolvesthecreationofamatrixofsimilarity coefficients computed between every pair of samples The coefficient is usually a measureofhowclose theabundance is foreachspecies (definedso that100= total similarity and 0=complete dissimilarity) The Bray Curtis similarity measure is commonlythemostappropriateforbiologicaldata(ClarkeampWarwick2001)
MultidimensionalScaling
NonRmetricmultiRdimensionalscalingordinations(nMDS)attempttoplacesamplesintwo dimensionalspacesothattherankorderofthedistancesbetweensamplesmatchesthe rankorderofthematchingsimilaritiesfromthesimilaritymatrix(ClarkeampWarwick2001) Thisprovidesavisualrepresentationofthesimilaritiesbetweenassemblageswithineach sampleEachoftheaxesisnotrelatedtoanyparticularvalueHinfactaxescanberotated toprovide thebestvisual representationof thedata Ordinationsareparticularlyuseful tools for analysing and visually presenting differences between assemblages Ordinationsareessentiallymapsofsamples inwhich theplacementofsampleson the mapreflectsthesimilarlyofthecommunitytothecommunitiesinothersamples(Clarkeamp Warwick 2001) Distances between samples on an ordination attempt to match the similarities inassemblagestructurenearbypoints representassemblageswithvery few attributes(speciesorabundanceofspecies)Hpoints faraparthavevery fewattributes in common(ClarkeampWarwick2001)
A stress coefficient is calculated to reflect the extent to which the multiRdimensional scalingordinationandthesimilaritymatrixagree(ClarkeampWarwick2001)(iehowwell the multiRdimensional scaling ordination accurately reflects the relationship between samples)Stressvaluesoflt015aregenerallyacceptable
In Figure A1 each freshwater macroinvertebrate sample is represented on the multiRdimensionalscalingordination By lookingat thedistancesbetweeneachsample
ANOSIMisanalogoustoANOVAinunivariatestatistics(Smith2003)AglobalRstatistic iscalculatedtodeterminewhetherthereisasignificantdifferencebetweenallsamplesIf there are differences then pairwise comparisons are conducted to test for differences betweenpairsofsamples(analogoustopostRhoctestsinANOVA)
The R value lies between R1 and +1 (all similarities within groups are less than any similarity between groups) with a value of zero representing the null hypothesis (no differenceamongasetofsamples)(ClarkeampWarwick2001)ComparisonofpairwiseR values can give an indication of how different assemblages are R values close to 0 indicatelittledifferencevaluesaround05indicatesomeoverlapandvaluescloseto1to indicate many or substantial differences In many instances however researches are primarily interestedinwhethertheRvalueisstatisticallydifferentfromzero(usuallyata confidence level of 005) (Clarke amp Warwick 2001) (ie whether they can reject the null hypothesis)
ANOSIM can provide information on whether the (visual) differences between assemblages in the multiRdimensional scaling ordination are significantH it is an independenttestfromthemultiRdimensionalscalingordinationItisbasedontestingthe
TRESBPKirraReefMarineBiotaMonitoring2015 B2
frc environmental
differences between the rank similarities in the similarity matrix not on the distances betweensamplesinthemultiRdimensionalscalingordination(ClarkeampWarwick2001)
PermutationalMultivariateAnalysisofVariance
PERMANOVAisusedtotestsimultaneousresponsesofoneormorevariablestooneor more factors in an a0 priori0 structured design using random permutation of the data to assess significance (Anderson 2004) PERMANOVA generates a pseudo FRstatistic similar to traditional ANOVA but pRvalues are calculated with permutations which does notassumenormaldatadistribution PERMANOVAcanprovide informationonwhether the (visual) differences between assemblages in a multiRdimensional scaling ordination are significantH however it is an independent test from the multiRdimensional scaling ordination
Thelevelofmultivariatedispersionamongsampleswithineachofthetestgroupscanbe examined using the permutational analysis of multivariate dispersions (PERMDISP) routine(Anderson2004)Intraditionalimpactassessmentachangeinthedispersionof datacanalsoindicateanimpact
SimilarityPercentagendashSpeciesContributions
SIMPER analysis provides information on how dissimilar assemblages from various groups are (eg how similar all of the macroinvertebrate samples taken for a particular habitatwithinastreamreachare)andhowsimilareachgroup(egreach)istoanyother group SIMPER analysis also identifies the species taxa that are contributing to the dissimilarity between two assemblages in rank order (ie it identifies which species is contributingthemosttothedifferences)SIMPERanalysismayhelptoidentifypotential lsquoindicatorrsquospeciesForexampleifaparticularspeciesconsistentlycontributesgreatlyto the differences between impacted and unimpacted assemblages it may be a useful indicator Theabundanceofthis indicatorspeciescanthenbecomparedbetweensites usingunivariatetechniquessuchasANOVA
Data is available on request from tresbpprojectofficecrownlandnswgov
TRESBPKirraReefMarineBiotaMonitoring2015 C1
frc environmental
Appendix(D( Pairwise( PERMANOVA( Results
Data is available on request from tresbpprojectofficecrownlandnswgov
TRESBPKirraReefMarineBiotaMonitoring2015 D1
frc environmental
Appendix(E( Relative(Abundance(of(Fish(found(at(Kirra(( ( and(Palm(Beach(Reefs(in(Each(Survey((Data is available on request from tresbpprojectofficecrownlandnswgovau
TRESBPKirraReefMarineBiotaMonitoring2015 E1
Structure Bookmarks
0 50 100 Metres Scale 12500 A3
0 50 100 200 Metres Scale 15000 A3
Kirra Reef
Kirra Reef
Kirra Reef
Kirra Reef
Kirra Reef
Kirra Reef
Map A1Location of Kirra Reef monitoring sites
Table D8 Pairwise comparison of macroalgae cover between sites in each year
Table D15 Pairwise comparison of turf algae cover between sites in each year
Table D29 Pairwise comparison of ascidian cover between sites in each year
Table D43 Pairwise comparison of soft coral cover between sites in each year
frc environmental
Ascidians$
ThemeanabundanceofallascidiansotherthanPyura0stoloniferahasvariedsignifcantly between sites at Kirra Reef and Palm Beach Reef and between surveys at each site (Figure314andnotethesignificantinteractionbetweensite(location)xsurveyinTable 35) The abundance of ascidians was different between sites at Kirra Reef in January 2001May2003March2004February2005andApril2014HanddifferentatPalmBeach ReefinJanuary2001February2005February2010andMarch2015Theabundance ofascidiansvariedbetweensurveysateachsitewith1995beingmostdifferentwhenthe abundanceofascidianswaslow(AppendixD)InMarch2015theabundanceofallother ascidiansonKirraReefandPalmBeachReefwashigherthanpreviouslyreportedinthe baselinesurveyinApril1995(whennoascidianswererecorded)Themeanabundance washigheratKirraReefthanatPalmBeachReef(Figure314)
ThemeanabundanceofPyura0stoloniferahasvariedconsiderablybetweensitesatKirra Reef and Palm Beach Reef over time (note the significant interaction between site (location) x survey in Table 36) In March 2015 the mean abundance (individual per 025m2plusmnSE)of theascidianPstolonifera (Figure313)wassimilaratKirraReefand PalmBeachReef(Figure315)ThemeanabundanceofP0stoloniferahasrangedfrom 02to17individualsper025m2atbothreefssinceMay2003
Figure315 Mean abundance of ascidians (Pyura0 stolonifera) (individuals025m2)
(plusmnSE)atKirraReefandPalmBeachReefinallsurveys
TRESBPKirraReefMarineBiotaMonitoring2015 34
frc environmental
Table35 Univariate PERMANOVA results for the differences in cover of all ascidians otherthanPyura0stolonifera0betweensurveysandlocations
Factor$ df$ MS$effect$ PseudoF$ p$(perm)$
survey 10 26658 474 0001
location 1 13603 710 0104
site(location) 4 19154 149 0212
locationxsurvey 10 2629 468 0001
site(location)xsurvey 40 5621 438 0001
error 924 12828
Shadingdenotessignificanceatplt005
Table36 Univariate PERMANOVA results for the differences in Pyura0 stolonifera densitybetweensurveysandlocations
Factor$ df$ MS$effect$ PseudoF$ p$(perm)$
survey 10 16254 11842 0001
location 1 12445 60881 0206
site(location) 4 20442 56799 0001
locationxsurvey 10 79724 58082 0001
site (location) x 40 13726 38138 0001 survey
error 924 35991
Shadingdenotessignificanceatplt005
$
TRESBPKirraReefMarineBiotaMonitoring2015 35
frc environmental
Hard$Coral$
There was a significant difference between the cover of hard corals at Kirra Reef and PalmBeachReefduringsomesurveys(notethesignificantinteractionbetweenlocationx surveyinTable37)SpecificallytherewassignificantlymorehardcoralatPalmBeach Reef thanKirraReef inFebraury1996March2004April2014andMarch2015(Table 38)
ThecoverofhardcoralistypicallylowonKirraReefaccountingforlessthan2ofthe availablesubstrateInMarch2015hardcoralcoveredlessthan1oftheareaofKirra Reef which was less than the cover recorded during the baseline survey in April 1995 (Figure 316) In contrast hard coral covered 11 of the surface area at Palm Beach ReefwhichwasgreaterthanthecoverrecordedinApril1995(Figure316)
The cover of hard corals at Palm Beach Reef has been more variable over time comparedtothecoverofhardcoralatKirraReef(Figure316)Withtheexceptionofthe surveys inApril1995andJanuary2001when thecoverofhardcoralwas lowonboth reefshardcoralsaretypicallymoreprevalentatPalmBeachReef(Figure316)
Table38 PERMANOVA post hoc pairwise results for the differences in the cover of hardcoralbetweenlocationsineachsurveyevent
Hard$Corals$ Survey$
t$ p$(MC)$a$
Apr1995 054 0606
Jun1995 182 0140
Feb1996 541 0006
Jan2001 R R
May2003 166 0168
Mar2004 765 0001
Feb2005 049 0646
Feb2010 156 0197
Jul2012 283 0053
Apr2014 525 0011
Mar2015 695 0003 Shadingdenotessignificanceatplt005 a pvaluesbasedonMonteCarlotests
TRESBPKirraReefMarineBiotaMonitoring2015 37
60
50
40
30
20
10
0
Soft
Cor
al C
over
()
Kirra Reef Palm Beach Reef
frc environmental
Soft$Coral$
The cover of soft coral was significantly different between sites at both Kirra Reef and PalmBeachReefandduringsomesurveys(notethesignificant interactionbetweensite (location)xsurvey)TherewasnosoftcoralrecordedatKirraReefinMarch2015The coverofsoftcoralhasdeclinedatKirraReefsince2003andhascoveredlessthan2of theavailablesubstratesince2005whichissimilartothecoverofsoftcoraldescribedfor the baseline surveys in 1995 (Figure 317) The cover of soft coral was consistent betweensitesineachsurveyexceptbetweensitesin
sdot April1995atKirraReef
sdot 1996atKirraReef
sdot 2003atPalmBeachReefand
sdot 2014atPalmBeachReef(AppendixD)
Soft corals have historically covered more of the available space on Palm Beach Reef than on Kirra Reef However there was more temporal variability within sites at Palm BeachReefthanatKirraReef(AppendixD)ThecoverofsoftcoralatPalmBeachReef has varied over time and was highest in April 1995 (48 cover) Despite increasing sinceFebruary2005itisstilllowerthanthecoverrecordedduringthebaselinesurveyin April1995(Figure317)
Table39 UnivariatePERMANOVAresults for thedifferences in thecoverofsoft coral betweensurveysandlocations
Factor$ df$ MS$effect$ PseudoF$ p$(perm)$
survey 10 44657 1323 0001
location 1 32922 6620 0117
site(location) 4 49732 266 0036
locationxsurvey 10 40982 1214 0001
site (location) x 40 3376 181 0002 survey
error 924 18688
Shadingdenotessignificanceatplt005
$
TRESBPKirraReefMarineBiotaMonitoring2015 39
frc environmental
Crinoids$
ThereisasignificantdifferencebetweensomesitesatbothKirraReefandParmBeach Reef that varies through time (note the significant interaction between site (location) x survey inTable310) Theabundanceofcrinoidshasbeensimilarbetweensites inall years at Palm Beach ReefH and was different beween sites at Kirra Reef in June 1995 February1996May2003andFebruary2005(AppendixD)Withineachsitetherehas been some natural temporal variability particualrly at Palm Beach Reef sites in 2001 (Appendix D) The mean abundance (individuals 025m2) of crinoids (Figure 318) at KirraReefandPalmBeachReefhasgenerallybeenlessthan2individualsper025m2 andhasdeclinedatboth locationssincethebaselinesurvey inApril1995(Figure319) However the mean abundance of crinoids on Kirra Reef has shown a slight increase sinceFebruary2010(Figure319)
In March 2015 fewer crinoids were recorded at Palm Beach Reef than at Kirra ReefH crinoidshavebeenrareatPalmBeachReefsince2003
The species richness of fish recorded from Kirra Reef across all monitoring events has rangedfrom14to57 InMarch201557specieswereidentifiedat thereefwhichwas similar to April 2014 (53) and higher than previous surveys (Figure 320) Species richnessatPalmBeachReefwas lower(34species)andgenerallyvaried lessbetween surveyscomparedtoKirraReef
InMarch2015 the assemblage of fish at KirraReef comprised species fromall trophic levelsincludingdetritivoresplanktivoresherbivoresandcarnivores(AppendixE)Asin previous surveys the assemblage was dominated by herbivores and planktivores Yellowtail (Trachurus0 novaezelandiae) and striped sea pike (Sphyraena0 obtusata) were the dominant species present in large schools (Figure 321) Australian mado (Atypichthys0 strigatus) ringRtailed surgeon (Acanthurus0 blochii) silver trevally (Pseudocaranx0 georgianus) eastern pomfred (Schuettea0 scalaripinnis) sweep (Scorpis0 lineolatus) and various wrasses were also very abundant releative to other species (AppendixE)
Two new species were observed at Kirra Reef the orangeRband surgeon (Acanthurus0 olivaceus) and the unicornfish (Naso0 sp) Five new species were recorded at Palm BeachReef
No threatened or protected fish species listed under the Queenslandrsquos Nature0 Conservation0Act01992ornationallyundertheEnvironmental0Protection0and0Biodiversity0 Conservation0 Act0 1999 were observed The complete list of species recorded and the relativeabundanceispresentedinAppendixE
TRESBPKirraReefMarineBiotaMonitoring2015 42
60
0
10
20
30
40
50
Num
ber
of F
ish
Spe
cies
Apr-95
Jun-95
Feb-96
Jan-01
May-03
Mar-04
Feb-05
Feb-10
Jul-12
Apr-14
Mar-15
Kirra Reef Palm Beach Reef Location
frc environmental
Figure320 Number of fish species recorded at Kirra Reef and Palm Beach Reef on
ThegreatestchangetotheecologicalconditionofKirraReefsincethebaselinesurveyin 1995 has been the loss of large areas of hard substrate that support benthic flora and faunaThedeliveryoflargesandvolumesduringthestage1dredgingoperations(1995 to1998)andtheinitialoperationofthesandbypasssystem(2001to2008)resultedinan increaseinwaveactionandtidalcurrentsredistributingthissandoverKirraReef
The three major outcrops of Kirra Reef (northern southern and eastern sections) are naturally exposed and covered depending on water and sand movements In March 2015 the rocky outcrops in the northern section of Kirra Reef were exposed and supportedamoderatelydiversebenthicassemblagedominatedbyturfalgaeTherewas arelativelyhighfishdiversityatKirraReefTheecologicalassemblageexhibitedsignsof ongoingstressfromphysicaldisturbanceincludingtheabsenceofsoftcoralsandrarityof hardcoral(MumbyampSteneck2008)HoweverKirraReefhasarelativelyhighcoverof sponges and ascidians Sponges ascidians and crinoids were more abundant at Kirra ReefthanatPalmBeachReefinMarch2015
KirraReefcontinues toprovidehabitatandsupport importantecological functions in the region providing hard substrate for the colonisation of algae and benthic invertebrates and food and refuge for fish As sand levels have stabilised since 2008 assemblages have becomemoresimilar to those recordedprior to implementationof the TRESBP in April1995 Forexamplemacroalgalcover inApril1995andMarch2015wasrelatively similarHoweverassemblagecompositionisstillsignificantlydifferenttothatrecordedin thebaselinesurveysmostnoticeablyduetoa lowercoverofbaresubstrateandhigher coverofturfalgaeandascidianssincesurveyshavebeenperformed
Benthic$Macroalgae$
The cover of macroalgae at Kirra Reef was relatively similar during the 2014 and 2015 surveys and remained well below the peak of nearly 60 cover recorded in January 2001TherewasasteepdeclineinthecoverofmacroalgaebetweenJanuary2001and May2003whichappearedtobestronglyassociatedwith thedecline inreefareaduring that time as well as a decline in the cover of Sargassum sp (an important indicator speciesonKirraReef) SimilardeclineswereevidentatPalmBeachReefbetween the January2001andMay2003surveys
TRESBPKirraReefMarineBiotaMonitoring2015 45
frc environmental
The cover ofmacroalgae at Palm Beach Reef was much lower thanat Kirra Reef over time There are several possible reasons for the lower cover of macroalgae at Palm Beach
sdot PalmBeachReefisdeeperthanKirraReefandgenerallyhashigherturbidityand therefore greater light attenuation The quantity and quality of available light affectsthedistributionandgrowthofmacroalgae(MillerampEtter2008)
sdot Differences in the pattern of recruitment of algal species to the reefs due to differentwatercurrentsandtimingofthesurveys(Kennelly1987b)
sdot Increased competition with turf algae and sessile benthic invertebrates which competeforspacewithmacroalgae(Kennelly1987aHMillerampEtter2008)
sdot PresenceofdifferentspeciesandhigherdensityofherbivoresatPalmBeachReef (particularly sea urchins and herbivorous fish) which graze on macroalgae (McCook1997HJompaampMcCook2002)
Biological assemblages exposed to physical stress typically exhibit greater levels of temporalandspatialvariability(WarwickampClarke1993HChapmanetal1995)Temporal variationinthecoverofmacroalgaeatKirraReefislikelytobeprincipallyduetotheeffect ofphysicaldisturbance fromwaveactionaswellas theassociatedassociatedabrasion andsmotheringbysandTheeffectsofthesephysicaldisturbanceswouldincreasewith thereductionofKirraReefasedgeeffectsarepronouncedandwaterdepth isreduced Increasedsmotheringbysandcanalsoreducediversity(Hatcheretal1989)abundance recruitment growth survival and seasonal regeneration of macroalgae (Umar amp Price 1998HCheshireetal1999)
Changes in the cover of macroalgae on Kirra Reef over time are also likely due to the extentofthereefchangingHthefishandmobileinvertbratesassociatedwiththereefmay have concentrated which would in turn increase grazing pressure Increased grazing pressure from fish and mobile invertebrates can reduce the coverage and diversity of macroalgaeonreefs(McCook1997HJompaampMcCook2002)
Thecoverof turfalgaeatbothKirraReefandPalmBeachReefhasvariedsignificantly betweensurveysPriorto2005turfalgaetypicallycoveredlessoftheavailablesurface areaonKirraReefthanPalmBeachReefInMarch2015themeancoverofturfalgae hasincreasedsincebaselinesurveysin1995andwasrelativelysimilarbetweenreefs(40 plusmn4atKirraReefcomparedto48plusmn4atPalmBeachReef)Thecoverofturfalgaeat Kirra Reef was similar in 2014 and 2015 which was generally higher than previous surveysexceptduringJuly2012whencoverofturfalgaepeakedat67plusmn4
TRESBPKirraReefMarineBiotaMonitoring2015 46
frc environmental
Turfalgaearebecomingadominantcomponentofcommunitiesaroundtheworld likely the result of rapid colonisation of openspace after a disturbance (eg storms) nutrient enrichment andor changes in grazing pressures Turf algae can also reflect a more physically robust growth form suited to high wave energy environments (than foliose macroRalgae)TurfalgaepeakedintheJuly2012surveylikelyrelatedtotheincreasein bare reef exposure following a stormy conditions in early 2009 and between December 2011 and June 2012 Turf algae have been the dominant form of algae on Kirra Reef sincethistimealbeitthecoverlowerthanthe2012survey
Increased cover of turf algae is typically related to good light conditions high concentrationsofnutrientsandlownumbersofgrazerssuchasfish(orconstantgrazing pressure preventing macroalgae colonisation) However the relationship between algal dynamics physical disturbance water quality and herbivore grazing activity is complex andthecoverof turfalgaecanexhibitextremetemporalvariabilityasaconsequenceof the interactionbetween topRdownandbottomRupprocesses (Russ2003HBellwoodetal 2006H Hughes et al 2007H Albert et al 2008H Hoey amp Bellwood 2008H Mumby 2009) Furtherinvestigationwouldberequiredtoreliablydeterminethemechanismsofchangein bothmacroalgaeandturfalgaeassemblagesonthesereefs
Benthic$Macroinvertebrates$
AtKirraReeftheburialandreRemergenceofrockyoutcrops(influencedbytheTRESBP) islikelytohaveincreasedtemporalvariabilityinthedistributionandabundanceofbenthic macroinvertebrates Additional perturbations such as wave action and sand abrasion (each influenced through changes in bathymetry seabed topography and water depth) are likely to have resulted in the decline in cover and diversity of the benthic macroinvertebratesatKirraReefbetweensurveysparticularlybetweenMarch2004and February2005andduringtheseverestormsof2009Benthicmacroinvertebratessuch asascidiansspongeshardcoralandsoftcoralarehighlysusceptible to theeffectsof stormandwavedisturbancephysicalabrasionandburialbysand(KayampKeough1981H Walker et al 2008) which can affect settlement growth rate and survival (Dodge amp Vaisnys1977HRogers1990)
Physical disturbance from sand burial sand abrasion and the action of storm waves appeartokeepthebenthicassemblagesofKirraReefinastateofearlysuccessionItis commonforearlypioneerspeciessuchassomemacroalgaetorecruitrapidlytoahard surface in large numbers allowing these species to dominate assemblages early in the successionaltrajectory(Walkeretal2007)
Afurther indicatorof theearlystateofsuccessionatKirraReef isthatthecoverofhard and soft coral has remained very low (generally lt 5) In March 2015 less than 1
Benthic macroinvertebrate cover may also be affected indirectly through increased competitionwithmacroalgaeforspaceThepresenceoflargemacroalgaecanaffectthe recruitment and survival of sessile benthic invertebrates as fronds moving with wave action sweep and abrade the surface of rocks killing new recruits especially corals (Kennelly1989HMcCooketal2001)Itcantakeseveralyearsforhardandsoftcoralto become dominant on reefs in the SEQ region (SchlacherRHoenlinger et al 2009) Therefore hard coral is not expected to become abundant until several years after the reefhasbeenuncoveredandonlyifthephysicaldisturbanceregimeandsupplyofnew recruitsissufficienttosupportsurvivalandgenerationalsuccessionofthesespeciesThe coverofhardandsoftcoralsatKirraReefwerebothverylowandpatchypriortothestart oftheTRESBP
Sponges and ascidians are highly susceptible to smothering and sand abrasion unless theyhaveathicktunic(outercoveringmadeofkeratin)liketheascidianP0stolonifera0or strong internal keratin silicon or calcareous structures in the case of some species of sponges0(KayampKeough1981HMcGuinness1987HWalkeretal2008)Duetoincreased wave action and sedimentation (which can be influenced by the TRESBP) the mean coverofascidiansandspongeswasexpectedtobemuchloweronKirraReefthanPalm Beach Reef However in March 2015 the cover of sponges was similar between the reefsandthecoverofascidians(otherthanP0stolonifera)wasgreateratKirraReefthan at Palm Beach Reef This suggests that Kirra Reef is slowly recovering from the increasedstressofphysicaldisturbancesuchas increasedwaveactionandsandscour andorthatwaveandstormconditionshavebeenlesssevereinthepastfewyears
Fish$
KirraReefcontinuestosupportahighdiversityofreefRassociatedandpelagic(ienonR reefassociated) fishspecies Despite itsdiminishedsizecompared to1995KirraReef continuestoprovidevaluablehabitatforanumberoffishspeciesfromdifferentfunctional groups
ThereisahighdegreeofinterRannualvariabilityinthespeciesandabundanceofthefish present at Kirra Reef compared with the assemblage at Palm Beach Reef This likely reflectsthetemporalvariabilityintheavailablehabitatasaconsequenceofreefburialand reRemergenceThediversityqualityandarealextentofreefhabitatareimportantfactors influencing the distribution abundance biomass and diversity of reef fish (Bellwood amp Hughes2001HFriedlanderetal2003)Diversityandabundanceoffishcanincreasewith
TRESBPKirraReefMarineBiotaMonitoring2015 48
frc environmental
greaterstructuralcomplexityandincreasedheterogeneityofavailablehabitats(Bellwood ampHughes2001)Thissuggeststhatperiodsofreefburialreducetheoveralldiversityof reefRassociated fish species at Kirra Reef Despite the reduction in overall reef space therewasalargervarietyofhabitats(suchasmarcoalgaeandturfalgae)in2015which was likely to be related to the high diversity of fish assemblages This is particularly importantforseveralspeciesthatdependonthepresenceoflsquostructurersquosuchasprovided by reef habitat (ie oldwife moray eels damselfish and Australian mado that were recordedinMarch2015butwerenotrecordedinJuly2012)
Theabundanceanddiversityof fishare likelytobenegativelyaffectedfollowingperiods of severe weather which create unfavourable conditions for many species and may further exacerbate the affects of abrasion and sedimentation The biomass of fish is knowntodecreasewithincreasingexposuretophysicaldisturbancefromwaveactionand strong currents (Friedlander et al 2003) As our surveys have been undertaken at different times of the year variation in the prevailing conditions at the time of sampling could also influence the types of fish observed (and the amount of reef habitat that is availableatanytime)Manyofthespeciesmayalsobeaffectedbyseasonalchangesin the water temperature such as damselfish which are less abundant in cool waters However theoveralldiversityof the fishassemblageatKirraReef is likely toreflect the sizeoftheoutcropsexposedwithagreaterphysicaldisturbance(fromseaconditionsand sandmovement)andcompetitionHandlesserfoodavailablewhenthereefiscovered
ThepredictedimpactstoKirraReefasaresultoftheTRESBPincludedaccretionofsand around the base of the rock outcrops causing a reduction in extent of reef It was predictedthatsanddeliveryaspartoftheprojectwouldeventuallymimiclsquonaturalrsquopatterns ofsanddispersalandthatthereefwouldreturntoitsnaturalextent(ietheextentpriorto extension of the Tweed River training walls in 1962) The benthic flora and fauna assemblages of the reef the historical reef extent and natural sand transport patterns wereexpectedtoreturntoconditionsobservedbeforetheextensionofthetrainingwalls between 1962 and 1965 However the Environmental Impact Study did not predict the ecologicalconsequencesofboththereducedarealextentandincreasedwaveenergy(a consequenceofdecreaseddepth)thathavebeenrecorded
ThecurrentextentofKirraReef remains less than50of that recorded in1962and in 1995beforethesanddeliverybytheTRESBPcommencedHowevertheextentofreef in1995 wasstrongly influenced by adepletion in sand following the construction of the Tweed River training walls and the Kirra Point groyne Accumulation of sand on Kirra ReefwasobservedtoincreaseasaresultofindirectsandnourishmentbytheTRESBP and the reef has been extensively covered (particuarly between 2005 and 2010) as a result
Whiletheextentofthereefcontinuestochangeovertimethedeliveryofsandaspartof the project now more closely matches the natural rate of longshore sand transport ShortRtermandseasonalchangesintheextentofthereefarenowlikelytobetheresultof waveandcurrentaction(particularlyduringservereweatherevents)thanadirectimpact of the TRESBP Therefore the extent of Kirra Reef in March 2015 is broadly in accordancewithpredictionsmadeintheEISwhichpredictedthatthereefwouldreturnto a condition similar to that exhibited in the preR1960rsquos ie before the extension of the TweedRiverbreakwatersthatinterruptedlittoralsandsupplytothesebeaches
InDecember2013KirraPointgroynewasextendedby30mwiththeexpectationthatthe beach bar would move seaward as a consequence At present Kirra Point groyne is unlikelytohavehadamajorimpactonthearealextentofKirraReefHoweverongoing monitoringbasedonaerialphotographsmayprovidefurtherinsight
Sessile benthic assemblages on Kirra Reef are highly susceptible to the influence of storms and associated wave action (Kay amp Keough 1981H Walker et al 2008) The shallowreefissurroundedbymobilesandwhichcanshiftnaturallyinresponsetowave action during storms causing burial of large sections of Kirra Reef This effect has reduced the availability of rocky substrate for colonisation and the availability of refuge
Fromanexaminationof theextentofKirraReef fromarealmapsandwaveheightdata thereappears tobea relationshipbetween theareaof rockexposedandstormevents Notably in a series of storm events in May 2009 corresponds with large areas of rock becoming exposed (with the reef approximately 100m2 in 2006 and approximately in 1009m2 2009) Further a stormy conditions between December 2011 and July 2012 correspondstotheareaofexposedrockmorethandoublinginsizeWhiletherewasno changetothetotalareaofexposedrockfollowingstormyconditionsinearly2013there wasaclearchangeinthedistibutionofexposedrockduringthistimeSince2013storm conditions have been calm to moderate and there has been little change in the areal extentanddistrubtionofexposedrockatKirraReef
WaveheighttypicallyincreasesduringstormeventsandgiventheshallowdepthofKirra Reef waves are more likely to shoal and break across the reef during storms This increases thephysicaldisturbanceabrasionandsedimentationofbenthicassemblages onKirraReefStormdisturbancecancauselocalreductionsinthespeciesrichnessand abundanceofcoral(Woodleyetal1981HMasselampDone1993HHughes1994HConnellet al 1997) and can alter fish assemblages indirectly through habitat modifications (Kaufman1983HJonesampSyms1998)ordirectlybyincreasingfishmortality(Lassig1983) The hydrodynamic forces produced by wave action are an important source of disturbance in subtidal habitats inflicting damage through direct physical impact and abrasion(UnderwoodampKennelly1990)DirectimpactsfromphysicaldisturbanceatKirra Reefareevidentduringsurveyeventswhenlargefragmentsofmacroalgaearepresentin thewatercolumnoverthereef
Storm and wave action (and associated sedimentation and abrasion) continue to be importantforcesshapingthedistributionandabundanceofbenthicspeciesatKirraReef Increased magnitude and frequency of physical disturbance resulting from increased exposureorsusceptibility tostormsandassociatedwaveaction (asonKirraReef)can lead to a decrease in the diversity of sessile invertebrate assemblages DisturbanceR drivenreductionsinbiodiversityhavethepotentialtoimpactnegativelyonthehealthand productivity of reef ecosystems (Walker et al 2008) Biodiversity is important to reef health given that many of these species (eg sponges bryozoans and ascidians) contribute a range of vital ecosystem services to reefs including nutrient cycling (Scheffers et al 2004) trophic interactions and food webs (Lesser 2006H Pawlik et al 2007) bioRerosion (Rutzler 2002H LopezRVictoria et al 2006) and stabilizing substrata (DiazampRutzler2001HWulff2001)
Theimpactsof increasedwaveactionandsedimentationonthebenthicassemblagesat Kirra Reef are likely to be greatest during and immediately following storm conditions
TRESBPKirraReefMarineBiotaMonitoring2015 51
frc environmental
Partitioningtheinfluenceofstormandwavedrivendisturbancefromthatoftheoperation oftheTRESBPwouldrequireamuchmorestatisticallypowerfulandtemporilyreplicated experimental design Given there is a large collection of wave and storm data by TRESBP this would involve greater temporal sampling of Kirra Reef including event samplingfollowingseverewaveandstormactivity
The data generated by this Kirra Reef biota monitoring program doesnrsquot support statistically rigorous consideration of seasonality (monitoring has been at its most frequentannual)
InApril2014andMarch2015KirraReefcoveredlessthan50ofthereefrsquosextentprior to theoperationof theTRESBP The lossof reefhabitathasreducedtheavailabilityof hard substratum available for colonisation and consequently the abundance of benthic sessileassemblages
The reduced depth of water resulting from the accumulation of sand exacerbates the effects of storms and wave action It is likley that as a consequnece the biological communities of Kirra Reef will reflect earlyRstage succession more frequently and for longerperiods
While there is sufficient structure available frcenvironmentalexpect that Kirra Reef will continuetoprovideimportanthabitatforadiverseassemblageoffishes
TRESBPKirraReefMarineBiotaMonitoring2015 52
frc environmental
5$ Conclusions$
Although there is still a substantial portion of the reef covered compared to before the extension of the Tweed River entrance breakwaters the current extent of Kirra Reef is broadly inaccordancewithpredictionsmadein theEIS Initial lsquocatchRuprsquobypassingand dredgeplacementofsand(between2001and2008)resulted in theburialofKirraReef Subsequentsanddelivery(since2008onwards)morecloselyreflectsnaturalpatternsof longRshoresandtransportandisthereefhasslowlyreRemerged
Theextentofthereefhasbeenrelativelystablesince2013Thishasallowedforsome succession in the benthic assemblages including a relatively high cover of sponges ascidiansandcrinoidsWiththedeliveryofsandmorecloselymatchingthenaturalrateit isexpected the reef willundergoshortRtermchanges in extentdue toseasonal shifts in sand deliveryH however the diversity of benthic assemblages on Kirra Reef is likely to increaseovertimeThiswouldcreatemorespaceforspeciestorecruitandreducesthe influence of sand abrasion and wave damage It was predicted that the areas of Kirra Reef newly exposed in 2012 would undergo a shift from turfRdominated communities to more diverse communities that could include macroalgae sponges ascidians and potentiallyhardandsoftcoralWiththeexceptionofhardandsoftcoralsthisprediction wasconfirmedbytheresultsoftheApril2014andMarch2015surveys
ThediversityoffishesassociatedwithKirraReefisbroadlysimilartothatrecordedprior tothecommencementofsandbypassingin1995Giventhatfisharemobilethegreatest impacts on fish assemblages are likely to be shortRterm changes due to both the prevailingconditionsandchangestheextentofavailablehabitatthatprovidesshelterand foodforavarietyofdifferentspeciesIfKirraReefincreasesinsizethereislikelytobea greater proportion of cryptic benthic species as these species are more typical of assemblagesinalaterstageofsuccession(eg(WillisampAnderson2003))
Assuming a broadly stable delivery rate of sand and consequent stable extent of Kirra ReeflsquorecoveryrsquoislikleytobesubstantivelycompleteFloralandfaunalcommunitieswill undergo succession between severe storm events but are likley to remain relatively dynamic
Albert S Udy J amp Tibbetts I 2008 Responses of algal communities to gradients in herbivorebiomassandwaterqualityinMarovoLagoonSolomonIslandsCoral0 Reefs2773R82
Anderson MJ 2001 A new method for nonRparametric multivariate analysis of varianceAustral0Ecology2632R46
Anderson MJ 2004 PERMDISP0 a0 FORTRAN0 computer0 program0 for0 permutatinoal0 analysis0 of0 multivariate0 dispersions0 (for0 any0 twoSfactor0 ANOVA0 design)0 using0 permutational0 tests Department of Statistics University of Auckland New Zealand
Cannon LR Goeden GB amp Campbell P 1987 Community patterns revealed by trawling in the interRreef regions of the Great Barrier Reef Memoirs0 of0 the0 Queensland0Museum2545R70
Chapman MG Underwood AJ amp Skilleter GA 1995 Variability at different spatial scalesbetweenasubtidalassemblageexposedtothedischargeofsewageand two control assemblages Journal0 of0 Experimental0 Biology0 and0 Ecology 189 103R122
Cheshire AC Miller DJ amp Stewart R (1999) Effect0 of0 dispersed0 sediment0 plumes0 from0beach0sand0replenishment0dredging0on0recruitment0of0phaeophycean0algae0 to0rocky0reefs0in0Gulf0St0Vincent0South0Australia0The0Impact0of0Sand0Dredging0 on0 Benthic0 Community0 Structure0 at0 the0 Port0 Stanvac0 Dredge0 Site0 20 1S39 UniversityofAdelaideAdelaide
ConnellJHHughesTPampWallaceCC1997A30Ryearstudyofcoralabundance recruitment and disturbance at several scales in space and time Ecological0 Monographs67461R488
Diaz MC amp Rutzler K 2001 Sponges an essential component of Caribbean coral reefsBulletin0of0Marine0Science69535R546
DodgeREampVaisnysJR1977Coralpopulationsandgrowthpatternsresponsesto sedimentation and turbidity associated with dredging Journal0 of0 Marine0 Research35715R730
Done TJ 1982 Patterns in the distribution of coral communities across the central GreatBarrierReefCoral0Reefs195R107
Edwards RA amp Smith DA 2005 Subtidal assemblages associated with a geotextile reef insouthReastQueenslandAustraliaMarine0and0Freshwater0Research56 133R142
FisheriesResearchConsultants1991Survey0of0the0Intertidal0and0Subtidal0Rocky0Reefs0 of0 the0 Sunshine0 Coast report prepared for Queensland National Parks and WildlifeService
HarrisonPHarriotVBanksSampHolmesN1998ThecoralcommunitiesofFlinders Reef andMyora Reef in theMoretonBay MarineParkQueensland Australia In Moreton0 Bay0 and0 Catchment Tibbits I Hall N amp Dennison W (Eds) SchoolofMarineScienceUniversityofQueenslandStLuciapp525R536
Hatcher B Johannes R amp Robertson A 1989 Review of research relevant to the conservationofshallowtropicalmarineecosystemsOceanography0and0Marine0 Biology0an0Annual0Review27337R414
Hoey A amp Bellwood D 2008 CrossRshelf variation in the role of parrotfishes on the GreatBarrierReefCoral0Reefs37R47
TRESBPKirraReefMarineBiotaMonitoring2015 56
frc environmental
Hollingsworth P 1975 Environmental Investigation Report Crown Reserve R R68 Currumbin Creek City of the Gold Coast Land Administration Commission unpublishedreport
Hughes TP 1994 Catastrophes phase shifts and large scale degradation of a CaribbeancoralreefScience2651547R1551
Hughes TP Rodrigues MJ Bellwood DR Ceccarelli D HoeghRGuldberg O McCook L Moltschaniwskvi N Pratchett MS Steneck RS amp Willis B 2007Phaseshiftsherbivoryandtheresilienceofcoralreefstoclimatechange Current0Biology17360R365
Hutchinson A Rempel C Taveras V Loder J amp Salmond J 2013 Reef0 Check0 Australia0 South0 East0 Queensland0 Summary0 Report0 2013 report prepared for ReefCheckFoundationLimited
Hyder Consulting 1997 Tweed0 River0 Entrance0 Sand0 Bypassing0 Project0 Permanent0 Bypassing0 System0 0 Environmental0 Impact0 Statement0 0 Impact0 Assessment0 Study report prepared for New South Wales Department of Land and Water Conservation
Jompa J amp McCook LJ 2002 Effects of competition and herbivory on interactions betweenahardcoralandabrownalgaJournal0of0Experimental0Marine0Biology0 and0Ecology27125R39
KayAMampKeoughMJ1981Occupationofpatchesintheepifaunalcommunitieson pier pilings and the bivalve Pinna bicolor at Edithburgh South Australia Oecologia48123R130
KennellyS1987aInhibitionofkelprecruitmentbyturfingalgaeandconsequencesfor an Australian kelp community Journal0 of0 Experimental0 Marine0 Biology0 and0 Ecology11249R60
Kennelly S 1987b Physical disturbances in an Australian kelp community I temporal effectsMarine0Ecology0Progress0Series40145R153
TRESBPKirraReefMarineBiotaMonitoring2015 57
frc environmental
Kennelly S 1989 Effects of kelp canopies on understory species due to shade and scourMarine0Ecology0Progress0Series50215R224
Lassig BR 1983 The effects of a cyclonic storm on coral reef fish assemblages Environmental0Biology0of0Fishes955R63
Lawson S McMahon J amp Boswood P 2001 Environmental management of the construction and operation of a sand bypassing system at the Tweed River EntranceInThe15thAustralasianCoastalandOceanEngineeringConference the 8th Australasian Port and Harbour Conference 25 R 28 September 2001 QueenslandAustralia
Lesser MP 2006 BenthicRpelagic coupling on coral reefs feeding and growth of Caribbean sponges Journal0 of0 Experimental0 Marine0 Biology0 amp0 Ecology 328 277R288
LopezRVictoriaM ZeaSampWei E2006 Competition for spacebetweenencrusting excavatingCaribbeanspongesandothercoral reeforganismsMarine0Ecology0 Progress0Series312113R121
MalcolmHASmithSDAampJordanA2009Usingpatternsofreeffishassemblages to refine a Habitat Classification System for marine parks in NSW Australia Aquatic0Conservation0Marine0and0Freshwater0Ecosystems2083R92
Massel SR amp Done TJ 1993 Effects of cyclone waves on massive coral assemblages on the Great Barrier Reef meteorology hydrodynamics and demographyCoral0Reefs12153R166
Mumby PJ amp Steneck RS 2008 Coral reef management and conservation in light of rapidly evolving ecological paradigms Trends in Ecology amp Evoution 23 555 -563
Murphy HM amp Jenkins GP 2010 Observational methods used in marine spatial monitoring of fishes and associated habitats a review Marine and Freshwater Research 61 236-252
Noriega R 2007 An Overview of Available Information on Sandy Beach Ecology Coastal Sand Dunes Rocky Reefs and Associated Biota on the Gold Coast Griffith Centre for Coastal Management Research Report No 85 report prepared for Griffith University
Parker P (1995) Structure to Reef Fish Assemblages at Julian Rocks Northern New South Wales Masters Thesis Griffith University
Parker PG 1999 Fish assemblages at Julian Rocks and the adjacent waters of northern New South Wales Australia Australian Zoologist 31 134 - 160
Pawlik JR Steindler L Henkel TP Beer S amp Ilan M 2007 Chemical warfare on coral reefs sponge metabolites differentially affect coral symbiosis in situ Limnology and Oceanography 52 907-911
Reef Check 2010 httpwwwreefcheckaustraliaorgdatahtml accessed December 2015
Robinson KI amp Pollard DA 1982 Marine and estuarine reserves in Australia with particular reference to New South Wales Wetlands 2 17 - 26
Rogers CS 1990 Responses of coral reefs and reef organisms to sedimentation Marine Ecology Progress Series 62 185-202
Russ GR 2003 Grazer biomass correlates more strongly with production than with biomass of algal turfs on a coral reef Coral Reefs 22 63-67
Rutzler K 2002 Impact of crustose clionid sponges on Caribbean reef corals Acta Geologica Hispanica 37 61-72
Scheffers SR Nieuwland G Bak RPM amp van Duyl FC 2004 Removal of bacteria and nutrient dynamics within the coral reef framework of Curacao (Netherlands Antilles) Coral Reefs 23 413-422
TRESBP Kirra Reef Marine Biota Monitoring 2015 59
frc environmental
Schlacher-Hoenlinger M Walker S Johnson J Schlacher T amp Hooper J 2009 Biological Monitoring of the Ex-HMAS Brisbane Artificial Reef Phase II - Habitat Values report prepared for Environmental Protection Agency (EPA)
Smith KA 2003 A simple multivariate technique to improve the design of a sampling strategy for age-based fishery monitoring Fisheries Research 64 79-85
Smith S Edwards R Dalton S amp Harrison M 2005 Biological assessment of fish and benthic communities at Palm Beach Bait Reef Gold Coast Queensland report prepared for University of New England
TRESBP 2014 Autum 2009 storms httpwwwtweedsandbypassnswgovauarticles-and-studiesinteresting-itemsautumn-2009-storm updated 4 May 2014 accessed December 2015
TRESBP 2015a Tweed Sand Bypassing Restoring Coastal Sand Drift Improving Boating Access ndash Techinical information httpwwwtweedsandbypassnswgovau__dataassetspdf_file0004552055kir ra-feb-2015pdf acessed December 2015
TRESBP 2015b Waves httpwwwtweedsandbypassnswgovauenvironmental-monitoringcoastal-conditionswaves updated 30 September 2015 accessed December 2015
Umar MJMLJ amp Price IR 1998 Effects of sediment deposition on the seaweed Sargassum on a fringing coral reef Coral Reefs 17 169-177
Underwood AJ amp Kennelly SJ 1990 Ecology of marine algae on rocky shores and subtidal reefs in temperate Australia Hydrobiologia 192 3-20
Walker S Schlacher T amp Schlacher-Hoenlinger M 2007 Spatial heterogeneity of epibenthos on artificial reefs fouling communities in the early stages of colonization on an East Australian shipwreck Marine Ecology 28 435-445
Walker SJ Degnan BM Hooper JNA amp Skilleter GA 2008 Will increased storm intensity from climate change affect biodiversity in non-scleractinian sessile fauna on coral reefs Global Change Biology 14 2755-2770
Warwick RM amp Clarke KR 1993 Increased variability as a symptom of stress in marine communtities Journal of Experimental Marine Biology and Ecology 172 215-216
Thenumberofsitessurveyedhasvariedover timeasaresultof the fluctuating levelof sandcoveringKirraReef
Prior to May 2003 three sites were assessed along the eastern and northern edge of KirraReef(KirraReefOutersites1to3)andthreesiteswereexaminedalongtheinshore marginof the reef (KirraReef Inner sites1 to 3)(MapA1) ReefRedge (ieKirraOuter) siteswerechosentoprovideearlywarningofimpactsfromoffshoreplacementofdredged sandwhilst inshoresites(ieKirraInner)werechosentoindicatewhetherimpactsfrom inshore beach profile development were affecting the reef platform In May 2003 the threeeasternsitesatKirraReef (ieKRO1KRO2andKRI1)werecompletelycovered with bare mobile sand Consequently only the three western sites at Kirra Reef (ie KRO3KRI2andKRI3)supportedbenthicfloraandfaunaInMarch2004theextentof the remainingwesternoutcropof KirraReef had been further reduced so that all inner reefsiteswerecompletelycoveredwithmobilesandConsequentlyonlyasingleoriginal reefsite(ieKRO3)couldbesurveyed(Figure23)Thereforetoprovideanindicationof the condition of the remaining reef two new sites were established (ie KRN1 and KRN2)(Figure23)andsurveyedinMarch2004Theextentofthewesternreefhadbeen further reduced by February 2005 and a third new site (ie KRN3) was established (Figure23)Consequentlyfoursites(KRO3KRN1KRN2andKRN3)weresurveyedin February2005
InFebruary2010fourKirraReefsites(ieKRO3KRO1KRN1andKRN2)wereclearof thesurroundingsandandsupportedbenthic floraand fauna Inaddition several rocks protruded from the sand in the vicinity of site KRI2H these were assessed to provide a quantitativeindicationofbroadRscaletemporalchangestotheinshorereefcommunities
SOURCEScopy Copyright Commonwealth of Australia (Geoscience Australia) 2001 2004 2006copy The State of Queensland (Department of Natural Resources and Mines) 2015copy Nearmap 2014 2015
DATE2015-09-09
DRAWN BYCF
VERSION02
PROJECTIONCoordinate System GDA 1994 MGA Zone 56Projection Transverse MercatorDatum GDA 1994
plusmn SCALE
0 50 100
Metres
Scale 12500 A3
frc environmental
Appendix$B$ Introduction$to$Data$Analysis$Used$
Multivariate$Analyses$
Multivariate statistical techniques are widely used in ecology to assess the similarities relationshipsbetweenassemblagesWhereasunivariateanalysescanonlycompareone variable at a time (eg an index of community structure such as a diversity index or a singleindicatorspecies)multivariateanalysescancomparesamplesbasedontheextent thatassemblagesshareparticulartaxaandabundances(ClarkeampWarwick2001)
Thefirststepofmultivariateanalysisusuallyinvolvesthecreationofamatrixofsimilarity coefficients computed between every pair of samples The coefficient is usually a measureofhowclose theabundance is foreachspecies (definedso that100= total similarity and 0=complete dissimilarity) The Bray Curtis similarity measure is commonlythemostappropriateforbiologicaldata(ClarkeampWarwick2001)
MultidimensionalScaling
NonRmetricmultiRdimensionalscalingordinations(nMDS)attempttoplacesamplesintwo dimensionalspacesothattherankorderofthedistancesbetweensamplesmatchesthe rankorderofthematchingsimilaritiesfromthesimilaritymatrix(ClarkeampWarwick2001) Thisprovidesavisualrepresentationofthesimilaritiesbetweenassemblageswithineach sampleEachoftheaxesisnotrelatedtoanyparticularvalueHinfactaxescanberotated toprovide thebestvisual representationof thedata Ordinationsareparticularlyuseful tools for analysing and visually presenting differences between assemblages Ordinationsareessentiallymapsofsamples inwhich theplacementofsampleson the mapreflectsthesimilarlyofthecommunitytothecommunitiesinothersamples(Clarkeamp Warwick 2001) Distances between samples on an ordination attempt to match the similarities inassemblagestructurenearbypoints representassemblageswithvery few attributes(speciesorabundanceofspecies)Hpoints faraparthavevery fewattributes in common(ClarkeampWarwick2001)
A stress coefficient is calculated to reflect the extent to which the multiRdimensional scalingordinationandthesimilaritymatrixagree(ClarkeampWarwick2001)(iehowwell the multiRdimensional scaling ordination accurately reflects the relationship between samples)Stressvaluesoflt015aregenerallyacceptable
In Figure A1 each freshwater macroinvertebrate sample is represented on the multiRdimensionalscalingordination By lookingat thedistancesbetweeneachsample
ANOSIMisanalogoustoANOVAinunivariatestatistics(Smith2003)AglobalRstatistic iscalculatedtodeterminewhetherthereisasignificantdifferencebetweenallsamplesIf there are differences then pairwise comparisons are conducted to test for differences betweenpairsofsamples(analogoustopostRhoctestsinANOVA)
The R value lies between R1 and +1 (all similarities within groups are less than any similarity between groups) with a value of zero representing the null hypothesis (no differenceamongasetofsamples)(ClarkeampWarwick2001)ComparisonofpairwiseR values can give an indication of how different assemblages are R values close to 0 indicatelittledifferencevaluesaround05indicatesomeoverlapandvaluescloseto1to indicate many or substantial differences In many instances however researches are primarily interestedinwhethertheRvalueisstatisticallydifferentfromzero(usuallyata confidence level of 005) (Clarke amp Warwick 2001) (ie whether they can reject the null hypothesis)
ANOSIM can provide information on whether the (visual) differences between assemblages in the multiRdimensional scaling ordination are significantH it is an independenttestfromthemultiRdimensionalscalingordinationItisbasedontestingthe
TRESBPKirraReefMarineBiotaMonitoring2015 B2
frc environmental
differences between the rank similarities in the similarity matrix not on the distances betweensamplesinthemultiRdimensionalscalingordination(ClarkeampWarwick2001)
PermutationalMultivariateAnalysisofVariance
PERMANOVAisusedtotestsimultaneousresponsesofoneormorevariablestooneor more factors in an a0 priori0 structured design using random permutation of the data to assess significance (Anderson 2004) PERMANOVA generates a pseudo FRstatistic similar to traditional ANOVA but pRvalues are calculated with permutations which does notassumenormaldatadistribution PERMANOVAcanprovide informationonwhether the (visual) differences between assemblages in a multiRdimensional scaling ordination are significantH however it is an independent test from the multiRdimensional scaling ordination
Thelevelofmultivariatedispersionamongsampleswithineachofthetestgroupscanbe examined using the permutational analysis of multivariate dispersions (PERMDISP) routine(Anderson2004)Intraditionalimpactassessmentachangeinthedispersionof datacanalsoindicateanimpact
SimilarityPercentagendashSpeciesContributions
SIMPER analysis provides information on how dissimilar assemblages from various groups are (eg how similar all of the macroinvertebrate samples taken for a particular habitatwithinastreamreachare)andhowsimilareachgroup(egreach)istoanyother group SIMPER analysis also identifies the species taxa that are contributing to the dissimilarity between two assemblages in rank order (ie it identifies which species is contributingthemosttothedifferences)SIMPERanalysismayhelptoidentifypotential lsquoindicatorrsquospeciesForexampleifaparticularspeciesconsistentlycontributesgreatlyto the differences between impacted and unimpacted assemblages it may be a useful indicator Theabundanceofthis indicatorspeciescanthenbecomparedbetweensites usingunivariatetechniquessuchasANOVA
Data is available on request from tresbpprojectofficecrownlandnswgov
TRESBPKirraReefMarineBiotaMonitoring2015 C1
frc environmental
Appendix(D( Pairwise( PERMANOVA( Results
Data is available on request from tresbpprojectofficecrownlandnswgov
TRESBPKirraReefMarineBiotaMonitoring2015 D1
frc environmental
Appendix(E( Relative(Abundance(of(Fish(found(at(Kirra(( ( and(Palm(Beach(Reefs(in(Each(Survey((Data is available on request from tresbpprojectofficecrownlandnswgovau
TRESBPKirraReefMarineBiotaMonitoring2015 E1
Structure Bookmarks
0 50 100 Metres Scale 12500 A3
0 50 100 200 Metres Scale 15000 A3
Kirra Reef
Kirra Reef
Kirra Reef
Kirra Reef
Kirra Reef
Kirra Reef
Map A1Location of Kirra Reef monitoring sites
Table D8 Pairwise comparison of macroalgae cover between sites in each year
Table D15 Pairwise comparison of turf algae cover between sites in each year
Table D29 Pairwise comparison of ascidian cover between sites in each year
Table D43 Pairwise comparison of soft coral cover between sites in each year
frc environmental
Hard$Coral$
There was a significant difference between the cover of hard corals at Kirra Reef and PalmBeachReefduringsomesurveys(notethesignificantinteractionbetweenlocationx surveyinTable37)SpecificallytherewassignificantlymorehardcoralatPalmBeach Reef thanKirraReef inFebraury1996March2004April2014andMarch2015(Table 38)
ThecoverofhardcoralistypicallylowonKirraReefaccountingforlessthan2ofthe availablesubstrateInMarch2015hardcoralcoveredlessthan1oftheareaofKirra Reef which was less than the cover recorded during the baseline survey in April 1995 (Figure 316) In contrast hard coral covered 11 of the surface area at Palm Beach ReefwhichwasgreaterthanthecoverrecordedinApril1995(Figure316)
The cover of hard corals at Palm Beach Reef has been more variable over time comparedtothecoverofhardcoralatKirraReef(Figure316)Withtheexceptionofthe surveys inApril1995andJanuary2001when thecoverofhardcoralwas lowonboth reefshardcoralsaretypicallymoreprevalentatPalmBeachReef(Figure316)
Table38 PERMANOVA post hoc pairwise results for the differences in the cover of hardcoralbetweenlocationsineachsurveyevent
Hard$Corals$ Survey$
t$ p$(MC)$a$
Apr1995 054 0606
Jun1995 182 0140
Feb1996 541 0006
Jan2001 R R
May2003 166 0168
Mar2004 765 0001
Feb2005 049 0646
Feb2010 156 0197
Jul2012 283 0053
Apr2014 525 0011
Mar2015 695 0003 Shadingdenotessignificanceatplt005 a pvaluesbasedonMonteCarlotests
TRESBPKirraReefMarineBiotaMonitoring2015 37
60
50
40
30
20
10
0
Soft
Cor
al C
over
()
Kirra Reef Palm Beach Reef
frc environmental
Soft$Coral$
The cover of soft coral was significantly different between sites at both Kirra Reef and PalmBeachReefandduringsomesurveys(notethesignificant interactionbetweensite (location)xsurvey)TherewasnosoftcoralrecordedatKirraReefinMarch2015The coverofsoftcoralhasdeclinedatKirraReefsince2003andhascoveredlessthan2of theavailablesubstratesince2005whichissimilartothecoverofsoftcoraldescribedfor the baseline surveys in 1995 (Figure 317) The cover of soft coral was consistent betweensitesineachsurveyexceptbetweensitesin
sdot April1995atKirraReef
sdot 1996atKirraReef
sdot 2003atPalmBeachReefand
sdot 2014atPalmBeachReef(AppendixD)
Soft corals have historically covered more of the available space on Palm Beach Reef than on Kirra Reef However there was more temporal variability within sites at Palm BeachReefthanatKirraReef(AppendixD)ThecoverofsoftcoralatPalmBeachReef has varied over time and was highest in April 1995 (48 cover) Despite increasing sinceFebruary2005itisstilllowerthanthecoverrecordedduringthebaselinesurveyin April1995(Figure317)
Table39 UnivariatePERMANOVAresults for thedifferences in thecoverofsoft coral betweensurveysandlocations
Factor$ df$ MS$effect$ PseudoF$ p$(perm)$
survey 10 44657 1323 0001
location 1 32922 6620 0117
site(location) 4 49732 266 0036
locationxsurvey 10 40982 1214 0001
site (location) x 40 3376 181 0002 survey
error 924 18688
Shadingdenotessignificanceatplt005
$
TRESBPKirraReefMarineBiotaMonitoring2015 39
frc environmental
Crinoids$
ThereisasignificantdifferencebetweensomesitesatbothKirraReefandParmBeach Reef that varies through time (note the significant interaction between site (location) x survey inTable310) Theabundanceofcrinoidshasbeensimilarbetweensites inall years at Palm Beach ReefH and was different beween sites at Kirra Reef in June 1995 February1996May2003andFebruary2005(AppendixD)Withineachsitetherehas been some natural temporal variability particualrly at Palm Beach Reef sites in 2001 (Appendix D) The mean abundance (individuals 025m2) of crinoids (Figure 318) at KirraReefandPalmBeachReefhasgenerallybeenlessthan2individualsper025m2 andhasdeclinedatboth locationssincethebaselinesurvey inApril1995(Figure319) However the mean abundance of crinoids on Kirra Reef has shown a slight increase sinceFebruary2010(Figure319)
In March 2015 fewer crinoids were recorded at Palm Beach Reef than at Kirra ReefH crinoidshavebeenrareatPalmBeachReefsince2003
The species richness of fish recorded from Kirra Reef across all monitoring events has rangedfrom14to57 InMarch201557specieswereidentifiedat thereefwhichwas similar to April 2014 (53) and higher than previous surveys (Figure 320) Species richnessatPalmBeachReefwas lower(34species)andgenerallyvaried lessbetween surveyscomparedtoKirraReef
InMarch2015 the assemblage of fish at KirraReef comprised species fromall trophic levelsincludingdetritivoresplanktivoresherbivoresandcarnivores(AppendixE)Asin previous surveys the assemblage was dominated by herbivores and planktivores Yellowtail (Trachurus0 novaezelandiae) and striped sea pike (Sphyraena0 obtusata) were the dominant species present in large schools (Figure 321) Australian mado (Atypichthys0 strigatus) ringRtailed surgeon (Acanthurus0 blochii) silver trevally (Pseudocaranx0 georgianus) eastern pomfred (Schuettea0 scalaripinnis) sweep (Scorpis0 lineolatus) and various wrasses were also very abundant releative to other species (AppendixE)
Two new species were observed at Kirra Reef the orangeRband surgeon (Acanthurus0 olivaceus) and the unicornfish (Naso0 sp) Five new species were recorded at Palm BeachReef
No threatened or protected fish species listed under the Queenslandrsquos Nature0 Conservation0Act01992ornationallyundertheEnvironmental0Protection0and0Biodiversity0 Conservation0 Act0 1999 were observed The complete list of species recorded and the relativeabundanceispresentedinAppendixE
TRESBPKirraReefMarineBiotaMonitoring2015 42
60
0
10
20
30
40
50
Num
ber
of F
ish
Spe
cies
Apr-95
Jun-95
Feb-96
Jan-01
May-03
Mar-04
Feb-05
Feb-10
Jul-12
Apr-14
Mar-15
Kirra Reef Palm Beach Reef Location
frc environmental
Figure320 Number of fish species recorded at Kirra Reef and Palm Beach Reef on
ThegreatestchangetotheecologicalconditionofKirraReefsincethebaselinesurveyin 1995 has been the loss of large areas of hard substrate that support benthic flora and faunaThedeliveryoflargesandvolumesduringthestage1dredgingoperations(1995 to1998)andtheinitialoperationofthesandbypasssystem(2001to2008)resultedinan increaseinwaveactionandtidalcurrentsredistributingthissandoverKirraReef
The three major outcrops of Kirra Reef (northern southern and eastern sections) are naturally exposed and covered depending on water and sand movements In March 2015 the rocky outcrops in the northern section of Kirra Reef were exposed and supportedamoderatelydiversebenthicassemblagedominatedbyturfalgaeTherewas arelativelyhighfishdiversityatKirraReefTheecologicalassemblageexhibitedsignsof ongoingstressfromphysicaldisturbanceincludingtheabsenceofsoftcoralsandrarityof hardcoral(MumbyampSteneck2008)HoweverKirraReefhasarelativelyhighcoverof sponges and ascidians Sponges ascidians and crinoids were more abundant at Kirra ReefthanatPalmBeachReefinMarch2015
KirraReefcontinues toprovidehabitatandsupport importantecological functions in the region providing hard substrate for the colonisation of algae and benthic invertebrates and food and refuge for fish As sand levels have stabilised since 2008 assemblages have becomemoresimilar to those recordedprior to implementationof the TRESBP in April1995 Forexamplemacroalgalcover inApril1995andMarch2015wasrelatively similarHoweverassemblagecompositionisstillsignificantlydifferenttothatrecordedin thebaselinesurveysmostnoticeablyduetoa lowercoverofbaresubstrateandhigher coverofturfalgaeandascidianssincesurveyshavebeenperformed
Benthic$Macroalgae$
The cover of macroalgae at Kirra Reef was relatively similar during the 2014 and 2015 surveys and remained well below the peak of nearly 60 cover recorded in January 2001TherewasasteepdeclineinthecoverofmacroalgaebetweenJanuary2001and May2003whichappearedtobestronglyassociatedwith thedecline inreefareaduring that time as well as a decline in the cover of Sargassum sp (an important indicator speciesonKirraReef) SimilardeclineswereevidentatPalmBeachReefbetween the January2001andMay2003surveys
TRESBPKirraReefMarineBiotaMonitoring2015 45
frc environmental
The cover ofmacroalgae at Palm Beach Reef was much lower thanat Kirra Reef over time There are several possible reasons for the lower cover of macroalgae at Palm Beach
sdot PalmBeachReefisdeeperthanKirraReefandgenerallyhashigherturbidityand therefore greater light attenuation The quantity and quality of available light affectsthedistributionandgrowthofmacroalgae(MillerampEtter2008)
sdot Differences in the pattern of recruitment of algal species to the reefs due to differentwatercurrentsandtimingofthesurveys(Kennelly1987b)
sdot Increased competition with turf algae and sessile benthic invertebrates which competeforspacewithmacroalgae(Kennelly1987aHMillerampEtter2008)
sdot PresenceofdifferentspeciesandhigherdensityofherbivoresatPalmBeachReef (particularly sea urchins and herbivorous fish) which graze on macroalgae (McCook1997HJompaampMcCook2002)
Biological assemblages exposed to physical stress typically exhibit greater levels of temporalandspatialvariability(WarwickampClarke1993HChapmanetal1995)Temporal variationinthecoverofmacroalgaeatKirraReefislikelytobeprincipallyduetotheeffect ofphysicaldisturbance fromwaveactionaswellas theassociatedassociatedabrasion andsmotheringbysandTheeffectsofthesephysicaldisturbanceswouldincreasewith thereductionofKirraReefasedgeeffectsarepronouncedandwaterdepth isreduced Increasedsmotheringbysandcanalsoreducediversity(Hatcheretal1989)abundance recruitment growth survival and seasonal regeneration of macroalgae (Umar amp Price 1998HCheshireetal1999)
Changes in the cover of macroalgae on Kirra Reef over time are also likely due to the extentofthereefchangingHthefishandmobileinvertbratesassociatedwiththereefmay have concentrated which would in turn increase grazing pressure Increased grazing pressure from fish and mobile invertebrates can reduce the coverage and diversity of macroalgaeonreefs(McCook1997HJompaampMcCook2002)
Thecoverof turfalgaeatbothKirraReefandPalmBeachReefhasvariedsignificantly betweensurveysPriorto2005turfalgaetypicallycoveredlessoftheavailablesurface areaonKirraReefthanPalmBeachReefInMarch2015themeancoverofturfalgae hasincreasedsincebaselinesurveysin1995andwasrelativelysimilarbetweenreefs(40 plusmn4atKirraReefcomparedto48plusmn4atPalmBeachReef)Thecoverofturfalgaeat Kirra Reef was similar in 2014 and 2015 which was generally higher than previous surveysexceptduringJuly2012whencoverofturfalgaepeakedat67plusmn4
TRESBPKirraReefMarineBiotaMonitoring2015 46
frc environmental
Turfalgaearebecomingadominantcomponentofcommunitiesaroundtheworld likely the result of rapid colonisation of openspace after a disturbance (eg storms) nutrient enrichment andor changes in grazing pressures Turf algae can also reflect a more physically robust growth form suited to high wave energy environments (than foliose macroRalgae)TurfalgaepeakedintheJuly2012surveylikelyrelatedtotheincreasein bare reef exposure following a stormy conditions in early 2009 and between December 2011 and June 2012 Turf algae have been the dominant form of algae on Kirra Reef sincethistimealbeitthecoverlowerthanthe2012survey
Increased cover of turf algae is typically related to good light conditions high concentrationsofnutrientsandlownumbersofgrazerssuchasfish(orconstantgrazing pressure preventing macroalgae colonisation) However the relationship between algal dynamics physical disturbance water quality and herbivore grazing activity is complex andthecoverof turfalgaecanexhibitextremetemporalvariabilityasaconsequenceof the interactionbetween topRdownandbottomRupprocesses (Russ2003HBellwoodetal 2006H Hughes et al 2007H Albert et al 2008H Hoey amp Bellwood 2008H Mumby 2009) Furtherinvestigationwouldberequiredtoreliablydeterminethemechanismsofchangein bothmacroalgaeandturfalgaeassemblagesonthesereefs
Benthic$Macroinvertebrates$
AtKirraReeftheburialandreRemergenceofrockyoutcrops(influencedbytheTRESBP) islikelytohaveincreasedtemporalvariabilityinthedistributionandabundanceofbenthic macroinvertebrates Additional perturbations such as wave action and sand abrasion (each influenced through changes in bathymetry seabed topography and water depth) are likely to have resulted in the decline in cover and diversity of the benthic macroinvertebratesatKirraReefbetweensurveysparticularlybetweenMarch2004and February2005andduringtheseverestormsof2009Benthicmacroinvertebratessuch asascidiansspongeshardcoralandsoftcoralarehighlysusceptible to theeffectsof stormandwavedisturbancephysicalabrasionandburialbysand(KayampKeough1981H Walker et al 2008) which can affect settlement growth rate and survival (Dodge amp Vaisnys1977HRogers1990)
Physical disturbance from sand burial sand abrasion and the action of storm waves appeartokeepthebenthicassemblagesofKirraReefinastateofearlysuccessionItis commonforearlypioneerspeciessuchassomemacroalgaetorecruitrapidlytoahard surface in large numbers allowing these species to dominate assemblages early in the successionaltrajectory(Walkeretal2007)
Afurther indicatorof theearlystateofsuccessionatKirraReef isthatthecoverofhard and soft coral has remained very low (generally lt 5) In March 2015 less than 1
Benthic macroinvertebrate cover may also be affected indirectly through increased competitionwithmacroalgaeforspaceThepresenceoflargemacroalgaecanaffectthe recruitment and survival of sessile benthic invertebrates as fronds moving with wave action sweep and abrade the surface of rocks killing new recruits especially corals (Kennelly1989HMcCooketal2001)Itcantakeseveralyearsforhardandsoftcoralto become dominant on reefs in the SEQ region (SchlacherRHoenlinger et al 2009) Therefore hard coral is not expected to become abundant until several years after the reefhasbeenuncoveredandonlyifthephysicaldisturbanceregimeandsupplyofnew recruitsissufficienttosupportsurvivalandgenerationalsuccessionofthesespeciesThe coverofhardandsoftcoralsatKirraReefwerebothverylowandpatchypriortothestart oftheTRESBP
Sponges and ascidians are highly susceptible to smothering and sand abrasion unless theyhaveathicktunic(outercoveringmadeofkeratin)liketheascidianP0stolonifera0or strong internal keratin silicon or calcareous structures in the case of some species of sponges0(KayampKeough1981HMcGuinness1987HWalkeretal2008)Duetoincreased wave action and sedimentation (which can be influenced by the TRESBP) the mean coverofascidiansandspongeswasexpectedtobemuchloweronKirraReefthanPalm Beach Reef However in March 2015 the cover of sponges was similar between the reefsandthecoverofascidians(otherthanP0stolonifera)wasgreateratKirraReefthan at Palm Beach Reef This suggests that Kirra Reef is slowly recovering from the increasedstressofphysicaldisturbancesuchas increasedwaveactionandsandscour andorthatwaveandstormconditionshavebeenlesssevereinthepastfewyears
Fish$
KirraReefcontinuestosupportahighdiversityofreefRassociatedandpelagic(ienonR reefassociated) fishspecies Despite itsdiminishedsizecompared to1995KirraReef continuestoprovidevaluablehabitatforanumberoffishspeciesfromdifferentfunctional groups
ThereisahighdegreeofinterRannualvariabilityinthespeciesandabundanceofthefish present at Kirra Reef compared with the assemblage at Palm Beach Reef This likely reflectsthetemporalvariabilityintheavailablehabitatasaconsequenceofreefburialand reRemergenceThediversityqualityandarealextentofreefhabitatareimportantfactors influencing the distribution abundance biomass and diversity of reef fish (Bellwood amp Hughes2001HFriedlanderetal2003)Diversityandabundanceoffishcanincreasewith
TRESBPKirraReefMarineBiotaMonitoring2015 48
frc environmental
greaterstructuralcomplexityandincreasedheterogeneityofavailablehabitats(Bellwood ampHughes2001)Thissuggeststhatperiodsofreefburialreducetheoveralldiversityof reefRassociated fish species at Kirra Reef Despite the reduction in overall reef space therewasalargervarietyofhabitats(suchasmarcoalgaeandturfalgae)in2015which was likely to be related to the high diversity of fish assemblages This is particularly importantforseveralspeciesthatdependonthepresenceoflsquostructurersquosuchasprovided by reef habitat (ie oldwife moray eels damselfish and Australian mado that were recordedinMarch2015butwerenotrecordedinJuly2012)
Theabundanceanddiversityof fishare likelytobenegativelyaffectedfollowingperiods of severe weather which create unfavourable conditions for many species and may further exacerbate the affects of abrasion and sedimentation The biomass of fish is knowntodecreasewithincreasingexposuretophysicaldisturbancefromwaveactionand strong currents (Friedlander et al 2003) As our surveys have been undertaken at different times of the year variation in the prevailing conditions at the time of sampling could also influence the types of fish observed (and the amount of reef habitat that is availableatanytime)Manyofthespeciesmayalsobeaffectedbyseasonalchangesin the water temperature such as damselfish which are less abundant in cool waters However theoveralldiversityof the fishassemblageatKirraReef is likely toreflect the sizeoftheoutcropsexposedwithagreaterphysicaldisturbance(fromseaconditionsand sandmovement)andcompetitionHandlesserfoodavailablewhenthereefiscovered
ThepredictedimpactstoKirraReefasaresultoftheTRESBPincludedaccretionofsand around the base of the rock outcrops causing a reduction in extent of reef It was predictedthatsanddeliveryaspartoftheprojectwouldeventuallymimiclsquonaturalrsquopatterns ofsanddispersalandthatthereefwouldreturntoitsnaturalextent(ietheextentpriorto extension of the Tweed River training walls in 1962) The benthic flora and fauna assemblages of the reef the historical reef extent and natural sand transport patterns wereexpectedtoreturntoconditionsobservedbeforetheextensionofthetrainingwalls between 1962 and 1965 However the Environmental Impact Study did not predict the ecologicalconsequencesofboththereducedarealextentandincreasedwaveenergy(a consequenceofdecreaseddepth)thathavebeenrecorded
ThecurrentextentofKirraReef remains less than50of that recorded in1962and in 1995beforethesanddeliverybytheTRESBPcommencedHowevertheextentofreef in1995 wasstrongly influenced by adepletion in sand following the construction of the Tweed River training walls and the Kirra Point groyne Accumulation of sand on Kirra ReefwasobservedtoincreaseasaresultofindirectsandnourishmentbytheTRESBP and the reef has been extensively covered (particuarly between 2005 and 2010) as a result
Whiletheextentofthereefcontinuestochangeovertimethedeliveryofsandaspartof the project now more closely matches the natural rate of longshore sand transport ShortRtermandseasonalchangesintheextentofthereefarenowlikelytobetheresultof waveandcurrentaction(particularlyduringservereweatherevents)thanadirectimpact of the TRESBP Therefore the extent of Kirra Reef in March 2015 is broadly in accordancewithpredictionsmadeintheEISwhichpredictedthatthereefwouldreturnto a condition similar to that exhibited in the preR1960rsquos ie before the extension of the TweedRiverbreakwatersthatinterruptedlittoralsandsupplytothesebeaches
InDecember2013KirraPointgroynewasextendedby30mwiththeexpectationthatthe beach bar would move seaward as a consequence At present Kirra Point groyne is unlikelytohavehadamajorimpactonthearealextentofKirraReefHoweverongoing monitoringbasedonaerialphotographsmayprovidefurtherinsight
Sessile benthic assemblages on Kirra Reef are highly susceptible to the influence of storms and associated wave action (Kay amp Keough 1981H Walker et al 2008) The shallowreefissurroundedbymobilesandwhichcanshiftnaturallyinresponsetowave action during storms causing burial of large sections of Kirra Reef This effect has reduced the availability of rocky substrate for colonisation and the availability of refuge
Fromanexaminationof theextentofKirraReef fromarealmapsandwaveheightdata thereappears tobea relationshipbetween theareaof rockexposedandstormevents Notably in a series of storm events in May 2009 corresponds with large areas of rock becoming exposed (with the reef approximately 100m2 in 2006 and approximately in 1009m2 2009) Further a stormy conditions between December 2011 and July 2012 correspondstotheareaofexposedrockmorethandoublinginsizeWhiletherewasno changetothetotalareaofexposedrockfollowingstormyconditionsinearly2013there wasaclearchangeinthedistibutionofexposedrockduringthistimeSince2013storm conditions have been calm to moderate and there has been little change in the areal extentanddistrubtionofexposedrockatKirraReef
WaveheighttypicallyincreasesduringstormeventsandgiventheshallowdepthofKirra Reef waves are more likely to shoal and break across the reef during storms This increases thephysicaldisturbanceabrasionandsedimentationofbenthicassemblages onKirraReefStormdisturbancecancauselocalreductionsinthespeciesrichnessand abundanceofcoral(Woodleyetal1981HMasselampDone1993HHughes1994HConnellet al 1997) and can alter fish assemblages indirectly through habitat modifications (Kaufman1983HJonesampSyms1998)ordirectlybyincreasingfishmortality(Lassig1983) The hydrodynamic forces produced by wave action are an important source of disturbance in subtidal habitats inflicting damage through direct physical impact and abrasion(UnderwoodampKennelly1990)DirectimpactsfromphysicaldisturbanceatKirra Reefareevidentduringsurveyeventswhenlargefragmentsofmacroalgaearepresentin thewatercolumnoverthereef
Storm and wave action (and associated sedimentation and abrasion) continue to be importantforcesshapingthedistributionandabundanceofbenthicspeciesatKirraReef Increased magnitude and frequency of physical disturbance resulting from increased exposureorsusceptibility tostormsandassociatedwaveaction (asonKirraReef)can lead to a decrease in the diversity of sessile invertebrate assemblages DisturbanceR drivenreductionsinbiodiversityhavethepotentialtoimpactnegativelyonthehealthand productivity of reef ecosystems (Walker et al 2008) Biodiversity is important to reef health given that many of these species (eg sponges bryozoans and ascidians) contribute a range of vital ecosystem services to reefs including nutrient cycling (Scheffers et al 2004) trophic interactions and food webs (Lesser 2006H Pawlik et al 2007) bioRerosion (Rutzler 2002H LopezRVictoria et al 2006) and stabilizing substrata (DiazampRutzler2001HWulff2001)
Theimpactsof increasedwaveactionandsedimentationonthebenthicassemblagesat Kirra Reef are likely to be greatest during and immediately following storm conditions
TRESBPKirraReefMarineBiotaMonitoring2015 51
frc environmental
Partitioningtheinfluenceofstormandwavedrivendisturbancefromthatoftheoperation oftheTRESBPwouldrequireamuchmorestatisticallypowerfulandtemporilyreplicated experimental design Given there is a large collection of wave and storm data by TRESBP this would involve greater temporal sampling of Kirra Reef including event samplingfollowingseverewaveandstormactivity
The data generated by this Kirra Reef biota monitoring program doesnrsquot support statistically rigorous consideration of seasonality (monitoring has been at its most frequentannual)
InApril2014andMarch2015KirraReefcoveredlessthan50ofthereefrsquosextentprior to theoperationof theTRESBP The lossof reefhabitathasreducedtheavailabilityof hard substratum available for colonisation and consequently the abundance of benthic sessileassemblages
The reduced depth of water resulting from the accumulation of sand exacerbates the effects of storms and wave action It is likley that as a consequnece the biological communities of Kirra Reef will reflect earlyRstage succession more frequently and for longerperiods
While there is sufficient structure available frcenvironmentalexpect that Kirra Reef will continuetoprovideimportanthabitatforadiverseassemblageoffishes
TRESBPKirraReefMarineBiotaMonitoring2015 52
frc environmental
5$ Conclusions$
Although there is still a substantial portion of the reef covered compared to before the extension of the Tweed River entrance breakwaters the current extent of Kirra Reef is broadly inaccordancewithpredictionsmadein theEIS Initial lsquocatchRuprsquobypassingand dredgeplacementofsand(between2001and2008)resulted in theburialofKirraReef Subsequentsanddelivery(since2008onwards)morecloselyreflectsnaturalpatternsof longRshoresandtransportandisthereefhasslowlyreRemerged
Theextentofthereefhasbeenrelativelystablesince2013Thishasallowedforsome succession in the benthic assemblages including a relatively high cover of sponges ascidiansandcrinoidsWiththedeliveryofsandmorecloselymatchingthenaturalrateit isexpected the reef willundergoshortRtermchanges in extentdue toseasonal shifts in sand deliveryH however the diversity of benthic assemblages on Kirra Reef is likely to increaseovertimeThiswouldcreatemorespaceforspeciestorecruitandreducesthe influence of sand abrasion and wave damage It was predicted that the areas of Kirra Reef newly exposed in 2012 would undergo a shift from turfRdominated communities to more diverse communities that could include macroalgae sponges ascidians and potentiallyhardandsoftcoralWiththeexceptionofhardandsoftcoralsthisprediction wasconfirmedbytheresultsoftheApril2014andMarch2015surveys
ThediversityoffishesassociatedwithKirraReefisbroadlysimilartothatrecordedprior tothecommencementofsandbypassingin1995Giventhatfisharemobilethegreatest impacts on fish assemblages are likely to be shortRterm changes due to both the prevailingconditionsandchangestheextentofavailablehabitatthatprovidesshelterand foodforavarietyofdifferentspeciesIfKirraReefincreasesinsizethereislikelytobea greater proportion of cryptic benthic species as these species are more typical of assemblagesinalaterstageofsuccession(eg(WillisampAnderson2003))
Assuming a broadly stable delivery rate of sand and consequent stable extent of Kirra ReeflsquorecoveryrsquoislikleytobesubstantivelycompleteFloralandfaunalcommunitieswill undergo succession between severe storm events but are likley to remain relatively dynamic
Albert S Udy J amp Tibbetts I 2008 Responses of algal communities to gradients in herbivorebiomassandwaterqualityinMarovoLagoonSolomonIslandsCoral0 Reefs2773R82
Anderson MJ 2001 A new method for nonRparametric multivariate analysis of varianceAustral0Ecology2632R46
Anderson MJ 2004 PERMDISP0 a0 FORTRAN0 computer0 program0 for0 permutatinoal0 analysis0 of0 multivariate0 dispersions0 (for0 any0 twoSfactor0 ANOVA0 design)0 using0 permutational0 tests Department of Statistics University of Auckland New Zealand
Cannon LR Goeden GB amp Campbell P 1987 Community patterns revealed by trawling in the interRreef regions of the Great Barrier Reef Memoirs0 of0 the0 Queensland0Museum2545R70
Chapman MG Underwood AJ amp Skilleter GA 1995 Variability at different spatial scalesbetweenasubtidalassemblageexposedtothedischargeofsewageand two control assemblages Journal0 of0 Experimental0 Biology0 and0 Ecology 189 103R122
Cheshire AC Miller DJ amp Stewart R (1999) Effect0 of0 dispersed0 sediment0 plumes0 from0beach0sand0replenishment0dredging0on0recruitment0of0phaeophycean0algae0 to0rocky0reefs0in0Gulf0St0Vincent0South0Australia0The0Impact0of0Sand0Dredging0 on0 Benthic0 Community0 Structure0 at0 the0 Port0 Stanvac0 Dredge0 Site0 20 1S39 UniversityofAdelaideAdelaide
ConnellJHHughesTPampWallaceCC1997A30Ryearstudyofcoralabundance recruitment and disturbance at several scales in space and time Ecological0 Monographs67461R488
Diaz MC amp Rutzler K 2001 Sponges an essential component of Caribbean coral reefsBulletin0of0Marine0Science69535R546
DodgeREampVaisnysJR1977Coralpopulationsandgrowthpatternsresponsesto sedimentation and turbidity associated with dredging Journal0 of0 Marine0 Research35715R730
Done TJ 1982 Patterns in the distribution of coral communities across the central GreatBarrierReefCoral0Reefs195R107
Edwards RA amp Smith DA 2005 Subtidal assemblages associated with a geotextile reef insouthReastQueenslandAustraliaMarine0and0Freshwater0Research56 133R142
FisheriesResearchConsultants1991Survey0of0the0Intertidal0and0Subtidal0Rocky0Reefs0 of0 the0 Sunshine0 Coast report prepared for Queensland National Parks and WildlifeService
HarrisonPHarriotVBanksSampHolmesN1998ThecoralcommunitiesofFlinders Reef andMyora Reef in theMoretonBay MarineParkQueensland Australia In Moreton0 Bay0 and0 Catchment Tibbits I Hall N amp Dennison W (Eds) SchoolofMarineScienceUniversityofQueenslandStLuciapp525R536
Hatcher B Johannes R amp Robertson A 1989 Review of research relevant to the conservationofshallowtropicalmarineecosystemsOceanography0and0Marine0 Biology0an0Annual0Review27337R414
Hoey A amp Bellwood D 2008 CrossRshelf variation in the role of parrotfishes on the GreatBarrierReefCoral0Reefs37R47
TRESBPKirraReefMarineBiotaMonitoring2015 56
frc environmental
Hollingsworth P 1975 Environmental Investigation Report Crown Reserve R R68 Currumbin Creek City of the Gold Coast Land Administration Commission unpublishedreport
Hughes TP 1994 Catastrophes phase shifts and large scale degradation of a CaribbeancoralreefScience2651547R1551
Hughes TP Rodrigues MJ Bellwood DR Ceccarelli D HoeghRGuldberg O McCook L Moltschaniwskvi N Pratchett MS Steneck RS amp Willis B 2007Phaseshiftsherbivoryandtheresilienceofcoralreefstoclimatechange Current0Biology17360R365
Hutchinson A Rempel C Taveras V Loder J amp Salmond J 2013 Reef0 Check0 Australia0 South0 East0 Queensland0 Summary0 Report0 2013 report prepared for ReefCheckFoundationLimited
Hyder Consulting 1997 Tweed0 River0 Entrance0 Sand0 Bypassing0 Project0 Permanent0 Bypassing0 System0 0 Environmental0 Impact0 Statement0 0 Impact0 Assessment0 Study report prepared for New South Wales Department of Land and Water Conservation
Jompa J amp McCook LJ 2002 Effects of competition and herbivory on interactions betweenahardcoralandabrownalgaJournal0of0Experimental0Marine0Biology0 and0Ecology27125R39
KayAMampKeoughMJ1981Occupationofpatchesintheepifaunalcommunitieson pier pilings and the bivalve Pinna bicolor at Edithburgh South Australia Oecologia48123R130
KennellyS1987aInhibitionofkelprecruitmentbyturfingalgaeandconsequencesfor an Australian kelp community Journal0 of0 Experimental0 Marine0 Biology0 and0 Ecology11249R60
Kennelly S 1987b Physical disturbances in an Australian kelp community I temporal effectsMarine0Ecology0Progress0Series40145R153
TRESBPKirraReefMarineBiotaMonitoring2015 57
frc environmental
Kennelly S 1989 Effects of kelp canopies on understory species due to shade and scourMarine0Ecology0Progress0Series50215R224
Lassig BR 1983 The effects of a cyclonic storm on coral reef fish assemblages Environmental0Biology0of0Fishes955R63
Lawson S McMahon J amp Boswood P 2001 Environmental management of the construction and operation of a sand bypassing system at the Tweed River EntranceInThe15thAustralasianCoastalandOceanEngineeringConference the 8th Australasian Port and Harbour Conference 25 R 28 September 2001 QueenslandAustralia
Lesser MP 2006 BenthicRpelagic coupling on coral reefs feeding and growth of Caribbean sponges Journal0 of0 Experimental0 Marine0 Biology0 amp0 Ecology 328 277R288
LopezRVictoriaM ZeaSampWei E2006 Competition for spacebetweenencrusting excavatingCaribbeanspongesandothercoral reeforganismsMarine0Ecology0 Progress0Series312113R121
MalcolmHASmithSDAampJordanA2009Usingpatternsofreeffishassemblages to refine a Habitat Classification System for marine parks in NSW Australia Aquatic0Conservation0Marine0and0Freshwater0Ecosystems2083R92
Massel SR amp Done TJ 1993 Effects of cyclone waves on massive coral assemblages on the Great Barrier Reef meteorology hydrodynamics and demographyCoral0Reefs12153R166
Mumby PJ amp Steneck RS 2008 Coral reef management and conservation in light of rapidly evolving ecological paradigms Trends in Ecology amp Evoution 23 555 -563
Murphy HM amp Jenkins GP 2010 Observational methods used in marine spatial monitoring of fishes and associated habitats a review Marine and Freshwater Research 61 236-252
Noriega R 2007 An Overview of Available Information on Sandy Beach Ecology Coastal Sand Dunes Rocky Reefs and Associated Biota on the Gold Coast Griffith Centre for Coastal Management Research Report No 85 report prepared for Griffith University
Parker P (1995) Structure to Reef Fish Assemblages at Julian Rocks Northern New South Wales Masters Thesis Griffith University
Parker PG 1999 Fish assemblages at Julian Rocks and the adjacent waters of northern New South Wales Australia Australian Zoologist 31 134 - 160
Pawlik JR Steindler L Henkel TP Beer S amp Ilan M 2007 Chemical warfare on coral reefs sponge metabolites differentially affect coral symbiosis in situ Limnology and Oceanography 52 907-911
Reef Check 2010 httpwwwreefcheckaustraliaorgdatahtml accessed December 2015
Robinson KI amp Pollard DA 1982 Marine and estuarine reserves in Australia with particular reference to New South Wales Wetlands 2 17 - 26
Rogers CS 1990 Responses of coral reefs and reef organisms to sedimentation Marine Ecology Progress Series 62 185-202
Russ GR 2003 Grazer biomass correlates more strongly with production than with biomass of algal turfs on a coral reef Coral Reefs 22 63-67
Rutzler K 2002 Impact of crustose clionid sponges on Caribbean reef corals Acta Geologica Hispanica 37 61-72
Scheffers SR Nieuwland G Bak RPM amp van Duyl FC 2004 Removal of bacteria and nutrient dynamics within the coral reef framework of Curacao (Netherlands Antilles) Coral Reefs 23 413-422
TRESBP Kirra Reef Marine Biota Monitoring 2015 59
frc environmental
Schlacher-Hoenlinger M Walker S Johnson J Schlacher T amp Hooper J 2009 Biological Monitoring of the Ex-HMAS Brisbane Artificial Reef Phase II - Habitat Values report prepared for Environmental Protection Agency (EPA)
Smith KA 2003 A simple multivariate technique to improve the design of a sampling strategy for age-based fishery monitoring Fisheries Research 64 79-85
Smith S Edwards R Dalton S amp Harrison M 2005 Biological assessment of fish and benthic communities at Palm Beach Bait Reef Gold Coast Queensland report prepared for University of New England
TRESBP 2014 Autum 2009 storms httpwwwtweedsandbypassnswgovauarticles-and-studiesinteresting-itemsautumn-2009-storm updated 4 May 2014 accessed December 2015
TRESBP 2015a Tweed Sand Bypassing Restoring Coastal Sand Drift Improving Boating Access ndash Techinical information httpwwwtweedsandbypassnswgovau__dataassetspdf_file0004552055kir ra-feb-2015pdf acessed December 2015
TRESBP 2015b Waves httpwwwtweedsandbypassnswgovauenvironmental-monitoringcoastal-conditionswaves updated 30 September 2015 accessed December 2015
Umar MJMLJ amp Price IR 1998 Effects of sediment deposition on the seaweed Sargassum on a fringing coral reef Coral Reefs 17 169-177
Underwood AJ amp Kennelly SJ 1990 Ecology of marine algae on rocky shores and subtidal reefs in temperate Australia Hydrobiologia 192 3-20
Walker S Schlacher T amp Schlacher-Hoenlinger M 2007 Spatial heterogeneity of epibenthos on artificial reefs fouling communities in the early stages of colonization on an East Australian shipwreck Marine Ecology 28 435-445
Walker SJ Degnan BM Hooper JNA amp Skilleter GA 2008 Will increased storm intensity from climate change affect biodiversity in non-scleractinian sessile fauna on coral reefs Global Change Biology 14 2755-2770
Warwick RM amp Clarke KR 1993 Increased variability as a symptom of stress in marine communtities Journal of Experimental Marine Biology and Ecology 172 215-216
Thenumberofsitessurveyedhasvariedover timeasaresultof the fluctuating levelof sandcoveringKirraReef
Prior to May 2003 three sites were assessed along the eastern and northern edge of KirraReef(KirraReefOutersites1to3)andthreesiteswereexaminedalongtheinshore marginof the reef (KirraReef Inner sites1 to 3)(MapA1) ReefRedge (ieKirraOuter) siteswerechosentoprovideearlywarningofimpactsfromoffshoreplacementofdredged sandwhilst inshoresites(ieKirraInner)werechosentoindicatewhetherimpactsfrom inshore beach profile development were affecting the reef platform In May 2003 the threeeasternsitesatKirraReef (ieKRO1KRO2andKRI1)werecompletelycovered with bare mobile sand Consequently only the three western sites at Kirra Reef (ie KRO3KRI2andKRI3)supportedbenthicfloraandfaunaInMarch2004theextentof the remainingwesternoutcropof KirraReef had been further reduced so that all inner reefsiteswerecompletelycoveredwithmobilesandConsequentlyonlyasingleoriginal reefsite(ieKRO3)couldbesurveyed(Figure23)Thereforetoprovideanindicationof the condition of the remaining reef two new sites were established (ie KRN1 and KRN2)(Figure23)andsurveyedinMarch2004Theextentofthewesternreefhadbeen further reduced by February 2005 and a third new site (ie KRN3) was established (Figure23)Consequentlyfoursites(KRO3KRN1KRN2andKRN3)weresurveyedin February2005
InFebruary2010fourKirraReefsites(ieKRO3KRO1KRN1andKRN2)wereclearof thesurroundingsandandsupportedbenthic floraand fauna Inaddition several rocks protruded from the sand in the vicinity of site KRI2H these were assessed to provide a quantitativeindicationofbroadRscaletemporalchangestotheinshorereefcommunities
SOURCEScopy Copyright Commonwealth of Australia (Geoscience Australia) 2001 2004 2006copy The State of Queensland (Department of Natural Resources and Mines) 2015copy Nearmap 2014 2015
DATE2015-09-09
DRAWN BYCF
VERSION02
PROJECTIONCoordinate System GDA 1994 MGA Zone 56Projection Transverse MercatorDatum GDA 1994
plusmn SCALE
0 50 100
Metres
Scale 12500 A3
frc environmental
Appendix$B$ Introduction$to$Data$Analysis$Used$
Multivariate$Analyses$
Multivariate statistical techniques are widely used in ecology to assess the similarities relationshipsbetweenassemblagesWhereasunivariateanalysescanonlycompareone variable at a time (eg an index of community structure such as a diversity index or a singleindicatorspecies)multivariateanalysescancomparesamplesbasedontheextent thatassemblagesshareparticulartaxaandabundances(ClarkeampWarwick2001)
Thefirststepofmultivariateanalysisusuallyinvolvesthecreationofamatrixofsimilarity coefficients computed between every pair of samples The coefficient is usually a measureofhowclose theabundance is foreachspecies (definedso that100= total similarity and 0=complete dissimilarity) The Bray Curtis similarity measure is commonlythemostappropriateforbiologicaldata(ClarkeampWarwick2001)
MultidimensionalScaling
NonRmetricmultiRdimensionalscalingordinations(nMDS)attempttoplacesamplesintwo dimensionalspacesothattherankorderofthedistancesbetweensamplesmatchesthe rankorderofthematchingsimilaritiesfromthesimilaritymatrix(ClarkeampWarwick2001) Thisprovidesavisualrepresentationofthesimilaritiesbetweenassemblageswithineach sampleEachoftheaxesisnotrelatedtoanyparticularvalueHinfactaxescanberotated toprovide thebestvisual representationof thedata Ordinationsareparticularlyuseful tools for analysing and visually presenting differences between assemblages Ordinationsareessentiallymapsofsamples inwhich theplacementofsampleson the mapreflectsthesimilarlyofthecommunitytothecommunitiesinothersamples(Clarkeamp Warwick 2001) Distances between samples on an ordination attempt to match the similarities inassemblagestructurenearbypoints representassemblageswithvery few attributes(speciesorabundanceofspecies)Hpoints faraparthavevery fewattributes in common(ClarkeampWarwick2001)
A stress coefficient is calculated to reflect the extent to which the multiRdimensional scalingordinationandthesimilaritymatrixagree(ClarkeampWarwick2001)(iehowwell the multiRdimensional scaling ordination accurately reflects the relationship between samples)Stressvaluesoflt015aregenerallyacceptable
In Figure A1 each freshwater macroinvertebrate sample is represented on the multiRdimensionalscalingordination By lookingat thedistancesbetweeneachsample
ANOSIMisanalogoustoANOVAinunivariatestatistics(Smith2003)AglobalRstatistic iscalculatedtodeterminewhetherthereisasignificantdifferencebetweenallsamplesIf there are differences then pairwise comparisons are conducted to test for differences betweenpairsofsamples(analogoustopostRhoctestsinANOVA)
The R value lies between R1 and +1 (all similarities within groups are less than any similarity between groups) with a value of zero representing the null hypothesis (no differenceamongasetofsamples)(ClarkeampWarwick2001)ComparisonofpairwiseR values can give an indication of how different assemblages are R values close to 0 indicatelittledifferencevaluesaround05indicatesomeoverlapandvaluescloseto1to indicate many or substantial differences In many instances however researches are primarily interestedinwhethertheRvalueisstatisticallydifferentfromzero(usuallyata confidence level of 005) (Clarke amp Warwick 2001) (ie whether they can reject the null hypothesis)
ANOSIM can provide information on whether the (visual) differences between assemblages in the multiRdimensional scaling ordination are significantH it is an independenttestfromthemultiRdimensionalscalingordinationItisbasedontestingthe
TRESBPKirraReefMarineBiotaMonitoring2015 B2
frc environmental
differences between the rank similarities in the similarity matrix not on the distances betweensamplesinthemultiRdimensionalscalingordination(ClarkeampWarwick2001)
PermutationalMultivariateAnalysisofVariance
PERMANOVAisusedtotestsimultaneousresponsesofoneormorevariablestooneor more factors in an a0 priori0 structured design using random permutation of the data to assess significance (Anderson 2004) PERMANOVA generates a pseudo FRstatistic similar to traditional ANOVA but pRvalues are calculated with permutations which does notassumenormaldatadistribution PERMANOVAcanprovide informationonwhether the (visual) differences between assemblages in a multiRdimensional scaling ordination are significantH however it is an independent test from the multiRdimensional scaling ordination
Thelevelofmultivariatedispersionamongsampleswithineachofthetestgroupscanbe examined using the permutational analysis of multivariate dispersions (PERMDISP) routine(Anderson2004)Intraditionalimpactassessmentachangeinthedispersionof datacanalsoindicateanimpact
SimilarityPercentagendashSpeciesContributions
SIMPER analysis provides information on how dissimilar assemblages from various groups are (eg how similar all of the macroinvertebrate samples taken for a particular habitatwithinastreamreachare)andhowsimilareachgroup(egreach)istoanyother group SIMPER analysis also identifies the species taxa that are contributing to the dissimilarity between two assemblages in rank order (ie it identifies which species is contributingthemosttothedifferences)SIMPERanalysismayhelptoidentifypotential lsquoindicatorrsquospeciesForexampleifaparticularspeciesconsistentlycontributesgreatlyto the differences between impacted and unimpacted assemblages it may be a useful indicator Theabundanceofthis indicatorspeciescanthenbecomparedbetweensites usingunivariatetechniquessuchasANOVA
Data is available on request from tresbpprojectofficecrownlandnswgov
TRESBPKirraReefMarineBiotaMonitoring2015 C1
frc environmental
Appendix(D( Pairwise( PERMANOVA( Results
Data is available on request from tresbpprojectofficecrownlandnswgov
TRESBPKirraReefMarineBiotaMonitoring2015 D1
frc environmental
Appendix(E( Relative(Abundance(of(Fish(found(at(Kirra(( ( and(Palm(Beach(Reefs(in(Each(Survey((Data is available on request from tresbpprojectofficecrownlandnswgovau
TRESBPKirraReefMarineBiotaMonitoring2015 E1
Structure Bookmarks
0 50 100 Metres Scale 12500 A3
0 50 100 200 Metres Scale 15000 A3
Kirra Reef
Kirra Reef
Kirra Reef
Kirra Reef
Kirra Reef
Kirra Reef
Map A1Location of Kirra Reef monitoring sites
Table D8 Pairwise comparison of macroalgae cover between sites in each year
Table D15 Pairwise comparison of turf algae cover between sites in each year
Table D29 Pairwise comparison of ascidian cover between sites in each year
Table D43 Pairwise comparison of soft coral cover between sites in each year
60
50
40
30
20
10
0
Soft
Cor
al C
over
()
Kirra Reef Palm Beach Reef
frc environmental
Soft$Coral$
The cover of soft coral was significantly different between sites at both Kirra Reef and PalmBeachReefandduringsomesurveys(notethesignificant interactionbetweensite (location)xsurvey)TherewasnosoftcoralrecordedatKirraReefinMarch2015The coverofsoftcoralhasdeclinedatKirraReefsince2003andhascoveredlessthan2of theavailablesubstratesince2005whichissimilartothecoverofsoftcoraldescribedfor the baseline surveys in 1995 (Figure 317) The cover of soft coral was consistent betweensitesineachsurveyexceptbetweensitesin
sdot April1995atKirraReef
sdot 1996atKirraReef
sdot 2003atPalmBeachReefand
sdot 2014atPalmBeachReef(AppendixD)
Soft corals have historically covered more of the available space on Palm Beach Reef than on Kirra Reef However there was more temporal variability within sites at Palm BeachReefthanatKirraReef(AppendixD)ThecoverofsoftcoralatPalmBeachReef has varied over time and was highest in April 1995 (48 cover) Despite increasing sinceFebruary2005itisstilllowerthanthecoverrecordedduringthebaselinesurveyin April1995(Figure317)
Table39 UnivariatePERMANOVAresults for thedifferences in thecoverofsoft coral betweensurveysandlocations
Factor$ df$ MS$effect$ PseudoF$ p$(perm)$
survey 10 44657 1323 0001
location 1 32922 6620 0117
site(location) 4 49732 266 0036
locationxsurvey 10 40982 1214 0001
site (location) x 40 3376 181 0002 survey
error 924 18688
Shadingdenotessignificanceatplt005
$
TRESBPKirraReefMarineBiotaMonitoring2015 39
frc environmental
Crinoids$
ThereisasignificantdifferencebetweensomesitesatbothKirraReefandParmBeach Reef that varies through time (note the significant interaction between site (location) x survey inTable310) Theabundanceofcrinoidshasbeensimilarbetweensites inall years at Palm Beach ReefH and was different beween sites at Kirra Reef in June 1995 February1996May2003andFebruary2005(AppendixD)Withineachsitetherehas been some natural temporal variability particualrly at Palm Beach Reef sites in 2001 (Appendix D) The mean abundance (individuals 025m2) of crinoids (Figure 318) at KirraReefandPalmBeachReefhasgenerallybeenlessthan2individualsper025m2 andhasdeclinedatboth locationssincethebaselinesurvey inApril1995(Figure319) However the mean abundance of crinoids on Kirra Reef has shown a slight increase sinceFebruary2010(Figure319)
In March 2015 fewer crinoids were recorded at Palm Beach Reef than at Kirra ReefH crinoidshavebeenrareatPalmBeachReefsince2003
The species richness of fish recorded from Kirra Reef across all monitoring events has rangedfrom14to57 InMarch201557specieswereidentifiedat thereefwhichwas similar to April 2014 (53) and higher than previous surveys (Figure 320) Species richnessatPalmBeachReefwas lower(34species)andgenerallyvaried lessbetween surveyscomparedtoKirraReef
InMarch2015 the assemblage of fish at KirraReef comprised species fromall trophic levelsincludingdetritivoresplanktivoresherbivoresandcarnivores(AppendixE)Asin previous surveys the assemblage was dominated by herbivores and planktivores Yellowtail (Trachurus0 novaezelandiae) and striped sea pike (Sphyraena0 obtusata) were the dominant species present in large schools (Figure 321) Australian mado (Atypichthys0 strigatus) ringRtailed surgeon (Acanthurus0 blochii) silver trevally (Pseudocaranx0 georgianus) eastern pomfred (Schuettea0 scalaripinnis) sweep (Scorpis0 lineolatus) and various wrasses were also very abundant releative to other species (AppendixE)
Two new species were observed at Kirra Reef the orangeRband surgeon (Acanthurus0 olivaceus) and the unicornfish (Naso0 sp) Five new species were recorded at Palm BeachReef
No threatened or protected fish species listed under the Queenslandrsquos Nature0 Conservation0Act01992ornationallyundertheEnvironmental0Protection0and0Biodiversity0 Conservation0 Act0 1999 were observed The complete list of species recorded and the relativeabundanceispresentedinAppendixE
TRESBPKirraReefMarineBiotaMonitoring2015 42
60
0
10
20
30
40
50
Num
ber
of F
ish
Spe
cies
Apr-95
Jun-95
Feb-96
Jan-01
May-03
Mar-04
Feb-05
Feb-10
Jul-12
Apr-14
Mar-15
Kirra Reef Palm Beach Reef Location
frc environmental
Figure320 Number of fish species recorded at Kirra Reef and Palm Beach Reef on
ThegreatestchangetotheecologicalconditionofKirraReefsincethebaselinesurveyin 1995 has been the loss of large areas of hard substrate that support benthic flora and faunaThedeliveryoflargesandvolumesduringthestage1dredgingoperations(1995 to1998)andtheinitialoperationofthesandbypasssystem(2001to2008)resultedinan increaseinwaveactionandtidalcurrentsredistributingthissandoverKirraReef
The three major outcrops of Kirra Reef (northern southern and eastern sections) are naturally exposed and covered depending on water and sand movements In March 2015 the rocky outcrops in the northern section of Kirra Reef were exposed and supportedamoderatelydiversebenthicassemblagedominatedbyturfalgaeTherewas arelativelyhighfishdiversityatKirraReefTheecologicalassemblageexhibitedsignsof ongoingstressfromphysicaldisturbanceincludingtheabsenceofsoftcoralsandrarityof hardcoral(MumbyampSteneck2008)HoweverKirraReefhasarelativelyhighcoverof sponges and ascidians Sponges ascidians and crinoids were more abundant at Kirra ReefthanatPalmBeachReefinMarch2015
KirraReefcontinues toprovidehabitatandsupport importantecological functions in the region providing hard substrate for the colonisation of algae and benthic invertebrates and food and refuge for fish As sand levels have stabilised since 2008 assemblages have becomemoresimilar to those recordedprior to implementationof the TRESBP in April1995 Forexamplemacroalgalcover inApril1995andMarch2015wasrelatively similarHoweverassemblagecompositionisstillsignificantlydifferenttothatrecordedin thebaselinesurveysmostnoticeablyduetoa lowercoverofbaresubstrateandhigher coverofturfalgaeandascidianssincesurveyshavebeenperformed
Benthic$Macroalgae$
The cover of macroalgae at Kirra Reef was relatively similar during the 2014 and 2015 surveys and remained well below the peak of nearly 60 cover recorded in January 2001TherewasasteepdeclineinthecoverofmacroalgaebetweenJanuary2001and May2003whichappearedtobestronglyassociatedwith thedecline inreefareaduring that time as well as a decline in the cover of Sargassum sp (an important indicator speciesonKirraReef) SimilardeclineswereevidentatPalmBeachReefbetween the January2001andMay2003surveys
TRESBPKirraReefMarineBiotaMonitoring2015 45
frc environmental
The cover ofmacroalgae at Palm Beach Reef was much lower thanat Kirra Reef over time There are several possible reasons for the lower cover of macroalgae at Palm Beach
sdot PalmBeachReefisdeeperthanKirraReefandgenerallyhashigherturbidityand therefore greater light attenuation The quantity and quality of available light affectsthedistributionandgrowthofmacroalgae(MillerampEtter2008)
sdot Differences in the pattern of recruitment of algal species to the reefs due to differentwatercurrentsandtimingofthesurveys(Kennelly1987b)
sdot Increased competition with turf algae and sessile benthic invertebrates which competeforspacewithmacroalgae(Kennelly1987aHMillerampEtter2008)
sdot PresenceofdifferentspeciesandhigherdensityofherbivoresatPalmBeachReef (particularly sea urchins and herbivorous fish) which graze on macroalgae (McCook1997HJompaampMcCook2002)
Biological assemblages exposed to physical stress typically exhibit greater levels of temporalandspatialvariability(WarwickampClarke1993HChapmanetal1995)Temporal variationinthecoverofmacroalgaeatKirraReefislikelytobeprincipallyduetotheeffect ofphysicaldisturbance fromwaveactionaswellas theassociatedassociatedabrasion andsmotheringbysandTheeffectsofthesephysicaldisturbanceswouldincreasewith thereductionofKirraReefasedgeeffectsarepronouncedandwaterdepth isreduced Increasedsmotheringbysandcanalsoreducediversity(Hatcheretal1989)abundance recruitment growth survival and seasonal regeneration of macroalgae (Umar amp Price 1998HCheshireetal1999)
Changes in the cover of macroalgae on Kirra Reef over time are also likely due to the extentofthereefchangingHthefishandmobileinvertbratesassociatedwiththereefmay have concentrated which would in turn increase grazing pressure Increased grazing pressure from fish and mobile invertebrates can reduce the coverage and diversity of macroalgaeonreefs(McCook1997HJompaampMcCook2002)
Thecoverof turfalgaeatbothKirraReefandPalmBeachReefhasvariedsignificantly betweensurveysPriorto2005turfalgaetypicallycoveredlessoftheavailablesurface areaonKirraReefthanPalmBeachReefInMarch2015themeancoverofturfalgae hasincreasedsincebaselinesurveysin1995andwasrelativelysimilarbetweenreefs(40 plusmn4atKirraReefcomparedto48plusmn4atPalmBeachReef)Thecoverofturfalgaeat Kirra Reef was similar in 2014 and 2015 which was generally higher than previous surveysexceptduringJuly2012whencoverofturfalgaepeakedat67plusmn4
TRESBPKirraReefMarineBiotaMonitoring2015 46
frc environmental
Turfalgaearebecomingadominantcomponentofcommunitiesaroundtheworld likely the result of rapid colonisation of openspace after a disturbance (eg storms) nutrient enrichment andor changes in grazing pressures Turf algae can also reflect a more physically robust growth form suited to high wave energy environments (than foliose macroRalgae)TurfalgaepeakedintheJuly2012surveylikelyrelatedtotheincreasein bare reef exposure following a stormy conditions in early 2009 and between December 2011 and June 2012 Turf algae have been the dominant form of algae on Kirra Reef sincethistimealbeitthecoverlowerthanthe2012survey
Increased cover of turf algae is typically related to good light conditions high concentrationsofnutrientsandlownumbersofgrazerssuchasfish(orconstantgrazing pressure preventing macroalgae colonisation) However the relationship between algal dynamics physical disturbance water quality and herbivore grazing activity is complex andthecoverof turfalgaecanexhibitextremetemporalvariabilityasaconsequenceof the interactionbetween topRdownandbottomRupprocesses (Russ2003HBellwoodetal 2006H Hughes et al 2007H Albert et al 2008H Hoey amp Bellwood 2008H Mumby 2009) Furtherinvestigationwouldberequiredtoreliablydeterminethemechanismsofchangein bothmacroalgaeandturfalgaeassemblagesonthesereefs
Benthic$Macroinvertebrates$
AtKirraReeftheburialandreRemergenceofrockyoutcrops(influencedbytheTRESBP) islikelytohaveincreasedtemporalvariabilityinthedistributionandabundanceofbenthic macroinvertebrates Additional perturbations such as wave action and sand abrasion (each influenced through changes in bathymetry seabed topography and water depth) are likely to have resulted in the decline in cover and diversity of the benthic macroinvertebratesatKirraReefbetweensurveysparticularlybetweenMarch2004and February2005andduringtheseverestormsof2009Benthicmacroinvertebratessuch asascidiansspongeshardcoralandsoftcoralarehighlysusceptible to theeffectsof stormandwavedisturbancephysicalabrasionandburialbysand(KayampKeough1981H Walker et al 2008) which can affect settlement growth rate and survival (Dodge amp Vaisnys1977HRogers1990)
Physical disturbance from sand burial sand abrasion and the action of storm waves appeartokeepthebenthicassemblagesofKirraReefinastateofearlysuccessionItis commonforearlypioneerspeciessuchassomemacroalgaetorecruitrapidlytoahard surface in large numbers allowing these species to dominate assemblages early in the successionaltrajectory(Walkeretal2007)
Afurther indicatorof theearlystateofsuccessionatKirraReef isthatthecoverofhard and soft coral has remained very low (generally lt 5) In March 2015 less than 1
Benthic macroinvertebrate cover may also be affected indirectly through increased competitionwithmacroalgaeforspaceThepresenceoflargemacroalgaecanaffectthe recruitment and survival of sessile benthic invertebrates as fronds moving with wave action sweep and abrade the surface of rocks killing new recruits especially corals (Kennelly1989HMcCooketal2001)Itcantakeseveralyearsforhardandsoftcoralto become dominant on reefs in the SEQ region (SchlacherRHoenlinger et al 2009) Therefore hard coral is not expected to become abundant until several years after the reefhasbeenuncoveredandonlyifthephysicaldisturbanceregimeandsupplyofnew recruitsissufficienttosupportsurvivalandgenerationalsuccessionofthesespeciesThe coverofhardandsoftcoralsatKirraReefwerebothverylowandpatchypriortothestart oftheTRESBP
Sponges and ascidians are highly susceptible to smothering and sand abrasion unless theyhaveathicktunic(outercoveringmadeofkeratin)liketheascidianP0stolonifera0or strong internal keratin silicon or calcareous structures in the case of some species of sponges0(KayampKeough1981HMcGuinness1987HWalkeretal2008)Duetoincreased wave action and sedimentation (which can be influenced by the TRESBP) the mean coverofascidiansandspongeswasexpectedtobemuchloweronKirraReefthanPalm Beach Reef However in March 2015 the cover of sponges was similar between the reefsandthecoverofascidians(otherthanP0stolonifera)wasgreateratKirraReefthan at Palm Beach Reef This suggests that Kirra Reef is slowly recovering from the increasedstressofphysicaldisturbancesuchas increasedwaveactionandsandscour andorthatwaveandstormconditionshavebeenlesssevereinthepastfewyears
Fish$
KirraReefcontinuestosupportahighdiversityofreefRassociatedandpelagic(ienonR reefassociated) fishspecies Despite itsdiminishedsizecompared to1995KirraReef continuestoprovidevaluablehabitatforanumberoffishspeciesfromdifferentfunctional groups
ThereisahighdegreeofinterRannualvariabilityinthespeciesandabundanceofthefish present at Kirra Reef compared with the assemblage at Palm Beach Reef This likely reflectsthetemporalvariabilityintheavailablehabitatasaconsequenceofreefburialand reRemergenceThediversityqualityandarealextentofreefhabitatareimportantfactors influencing the distribution abundance biomass and diversity of reef fish (Bellwood amp Hughes2001HFriedlanderetal2003)Diversityandabundanceoffishcanincreasewith
TRESBPKirraReefMarineBiotaMonitoring2015 48
frc environmental
greaterstructuralcomplexityandincreasedheterogeneityofavailablehabitats(Bellwood ampHughes2001)Thissuggeststhatperiodsofreefburialreducetheoveralldiversityof reefRassociated fish species at Kirra Reef Despite the reduction in overall reef space therewasalargervarietyofhabitats(suchasmarcoalgaeandturfalgae)in2015which was likely to be related to the high diversity of fish assemblages This is particularly importantforseveralspeciesthatdependonthepresenceoflsquostructurersquosuchasprovided by reef habitat (ie oldwife moray eels damselfish and Australian mado that were recordedinMarch2015butwerenotrecordedinJuly2012)
Theabundanceanddiversityof fishare likelytobenegativelyaffectedfollowingperiods of severe weather which create unfavourable conditions for many species and may further exacerbate the affects of abrasion and sedimentation The biomass of fish is knowntodecreasewithincreasingexposuretophysicaldisturbancefromwaveactionand strong currents (Friedlander et al 2003) As our surveys have been undertaken at different times of the year variation in the prevailing conditions at the time of sampling could also influence the types of fish observed (and the amount of reef habitat that is availableatanytime)Manyofthespeciesmayalsobeaffectedbyseasonalchangesin the water temperature such as damselfish which are less abundant in cool waters However theoveralldiversityof the fishassemblageatKirraReef is likely toreflect the sizeoftheoutcropsexposedwithagreaterphysicaldisturbance(fromseaconditionsand sandmovement)andcompetitionHandlesserfoodavailablewhenthereefiscovered
ThepredictedimpactstoKirraReefasaresultoftheTRESBPincludedaccretionofsand around the base of the rock outcrops causing a reduction in extent of reef It was predictedthatsanddeliveryaspartoftheprojectwouldeventuallymimiclsquonaturalrsquopatterns ofsanddispersalandthatthereefwouldreturntoitsnaturalextent(ietheextentpriorto extension of the Tweed River training walls in 1962) The benthic flora and fauna assemblages of the reef the historical reef extent and natural sand transport patterns wereexpectedtoreturntoconditionsobservedbeforetheextensionofthetrainingwalls between 1962 and 1965 However the Environmental Impact Study did not predict the ecologicalconsequencesofboththereducedarealextentandincreasedwaveenergy(a consequenceofdecreaseddepth)thathavebeenrecorded
ThecurrentextentofKirraReef remains less than50of that recorded in1962and in 1995beforethesanddeliverybytheTRESBPcommencedHowevertheextentofreef in1995 wasstrongly influenced by adepletion in sand following the construction of the Tweed River training walls and the Kirra Point groyne Accumulation of sand on Kirra ReefwasobservedtoincreaseasaresultofindirectsandnourishmentbytheTRESBP and the reef has been extensively covered (particuarly between 2005 and 2010) as a result
Whiletheextentofthereefcontinuestochangeovertimethedeliveryofsandaspartof the project now more closely matches the natural rate of longshore sand transport ShortRtermandseasonalchangesintheextentofthereefarenowlikelytobetheresultof waveandcurrentaction(particularlyduringservereweatherevents)thanadirectimpact of the TRESBP Therefore the extent of Kirra Reef in March 2015 is broadly in accordancewithpredictionsmadeintheEISwhichpredictedthatthereefwouldreturnto a condition similar to that exhibited in the preR1960rsquos ie before the extension of the TweedRiverbreakwatersthatinterruptedlittoralsandsupplytothesebeaches
InDecember2013KirraPointgroynewasextendedby30mwiththeexpectationthatthe beach bar would move seaward as a consequence At present Kirra Point groyne is unlikelytohavehadamajorimpactonthearealextentofKirraReefHoweverongoing monitoringbasedonaerialphotographsmayprovidefurtherinsight
Sessile benthic assemblages on Kirra Reef are highly susceptible to the influence of storms and associated wave action (Kay amp Keough 1981H Walker et al 2008) The shallowreefissurroundedbymobilesandwhichcanshiftnaturallyinresponsetowave action during storms causing burial of large sections of Kirra Reef This effect has reduced the availability of rocky substrate for colonisation and the availability of refuge
Fromanexaminationof theextentofKirraReef fromarealmapsandwaveheightdata thereappears tobea relationshipbetween theareaof rockexposedandstormevents Notably in a series of storm events in May 2009 corresponds with large areas of rock becoming exposed (with the reef approximately 100m2 in 2006 and approximately in 1009m2 2009) Further a stormy conditions between December 2011 and July 2012 correspondstotheareaofexposedrockmorethandoublinginsizeWhiletherewasno changetothetotalareaofexposedrockfollowingstormyconditionsinearly2013there wasaclearchangeinthedistibutionofexposedrockduringthistimeSince2013storm conditions have been calm to moderate and there has been little change in the areal extentanddistrubtionofexposedrockatKirraReef
WaveheighttypicallyincreasesduringstormeventsandgiventheshallowdepthofKirra Reef waves are more likely to shoal and break across the reef during storms This increases thephysicaldisturbanceabrasionandsedimentationofbenthicassemblages onKirraReefStormdisturbancecancauselocalreductionsinthespeciesrichnessand abundanceofcoral(Woodleyetal1981HMasselampDone1993HHughes1994HConnellet al 1997) and can alter fish assemblages indirectly through habitat modifications (Kaufman1983HJonesampSyms1998)ordirectlybyincreasingfishmortality(Lassig1983) The hydrodynamic forces produced by wave action are an important source of disturbance in subtidal habitats inflicting damage through direct physical impact and abrasion(UnderwoodampKennelly1990)DirectimpactsfromphysicaldisturbanceatKirra Reefareevidentduringsurveyeventswhenlargefragmentsofmacroalgaearepresentin thewatercolumnoverthereef
Storm and wave action (and associated sedimentation and abrasion) continue to be importantforcesshapingthedistributionandabundanceofbenthicspeciesatKirraReef Increased magnitude and frequency of physical disturbance resulting from increased exposureorsusceptibility tostormsandassociatedwaveaction (asonKirraReef)can lead to a decrease in the diversity of sessile invertebrate assemblages DisturbanceR drivenreductionsinbiodiversityhavethepotentialtoimpactnegativelyonthehealthand productivity of reef ecosystems (Walker et al 2008) Biodiversity is important to reef health given that many of these species (eg sponges bryozoans and ascidians) contribute a range of vital ecosystem services to reefs including nutrient cycling (Scheffers et al 2004) trophic interactions and food webs (Lesser 2006H Pawlik et al 2007) bioRerosion (Rutzler 2002H LopezRVictoria et al 2006) and stabilizing substrata (DiazampRutzler2001HWulff2001)
Theimpactsof increasedwaveactionandsedimentationonthebenthicassemblagesat Kirra Reef are likely to be greatest during and immediately following storm conditions
TRESBPKirraReefMarineBiotaMonitoring2015 51
frc environmental
Partitioningtheinfluenceofstormandwavedrivendisturbancefromthatoftheoperation oftheTRESBPwouldrequireamuchmorestatisticallypowerfulandtemporilyreplicated experimental design Given there is a large collection of wave and storm data by TRESBP this would involve greater temporal sampling of Kirra Reef including event samplingfollowingseverewaveandstormactivity
The data generated by this Kirra Reef biota monitoring program doesnrsquot support statistically rigorous consideration of seasonality (monitoring has been at its most frequentannual)
InApril2014andMarch2015KirraReefcoveredlessthan50ofthereefrsquosextentprior to theoperationof theTRESBP The lossof reefhabitathasreducedtheavailabilityof hard substratum available for colonisation and consequently the abundance of benthic sessileassemblages
The reduced depth of water resulting from the accumulation of sand exacerbates the effects of storms and wave action It is likley that as a consequnece the biological communities of Kirra Reef will reflect earlyRstage succession more frequently and for longerperiods
While there is sufficient structure available frcenvironmentalexpect that Kirra Reef will continuetoprovideimportanthabitatforadiverseassemblageoffishes
TRESBPKirraReefMarineBiotaMonitoring2015 52
frc environmental
5$ Conclusions$
Although there is still a substantial portion of the reef covered compared to before the extension of the Tweed River entrance breakwaters the current extent of Kirra Reef is broadly inaccordancewithpredictionsmadein theEIS Initial lsquocatchRuprsquobypassingand dredgeplacementofsand(between2001and2008)resulted in theburialofKirraReef Subsequentsanddelivery(since2008onwards)morecloselyreflectsnaturalpatternsof longRshoresandtransportandisthereefhasslowlyreRemerged
Theextentofthereefhasbeenrelativelystablesince2013Thishasallowedforsome succession in the benthic assemblages including a relatively high cover of sponges ascidiansandcrinoidsWiththedeliveryofsandmorecloselymatchingthenaturalrateit isexpected the reef willundergoshortRtermchanges in extentdue toseasonal shifts in sand deliveryH however the diversity of benthic assemblages on Kirra Reef is likely to increaseovertimeThiswouldcreatemorespaceforspeciestorecruitandreducesthe influence of sand abrasion and wave damage It was predicted that the areas of Kirra Reef newly exposed in 2012 would undergo a shift from turfRdominated communities to more diverse communities that could include macroalgae sponges ascidians and potentiallyhardandsoftcoralWiththeexceptionofhardandsoftcoralsthisprediction wasconfirmedbytheresultsoftheApril2014andMarch2015surveys
ThediversityoffishesassociatedwithKirraReefisbroadlysimilartothatrecordedprior tothecommencementofsandbypassingin1995Giventhatfisharemobilethegreatest impacts on fish assemblages are likely to be shortRterm changes due to both the prevailingconditionsandchangestheextentofavailablehabitatthatprovidesshelterand foodforavarietyofdifferentspeciesIfKirraReefincreasesinsizethereislikelytobea greater proportion of cryptic benthic species as these species are more typical of assemblagesinalaterstageofsuccession(eg(WillisampAnderson2003))
Assuming a broadly stable delivery rate of sand and consequent stable extent of Kirra ReeflsquorecoveryrsquoislikleytobesubstantivelycompleteFloralandfaunalcommunitieswill undergo succession between severe storm events but are likley to remain relatively dynamic
Albert S Udy J amp Tibbetts I 2008 Responses of algal communities to gradients in herbivorebiomassandwaterqualityinMarovoLagoonSolomonIslandsCoral0 Reefs2773R82
Anderson MJ 2001 A new method for nonRparametric multivariate analysis of varianceAustral0Ecology2632R46
Anderson MJ 2004 PERMDISP0 a0 FORTRAN0 computer0 program0 for0 permutatinoal0 analysis0 of0 multivariate0 dispersions0 (for0 any0 twoSfactor0 ANOVA0 design)0 using0 permutational0 tests Department of Statistics University of Auckland New Zealand
Cannon LR Goeden GB amp Campbell P 1987 Community patterns revealed by trawling in the interRreef regions of the Great Barrier Reef Memoirs0 of0 the0 Queensland0Museum2545R70
Chapman MG Underwood AJ amp Skilleter GA 1995 Variability at different spatial scalesbetweenasubtidalassemblageexposedtothedischargeofsewageand two control assemblages Journal0 of0 Experimental0 Biology0 and0 Ecology 189 103R122
Cheshire AC Miller DJ amp Stewart R (1999) Effect0 of0 dispersed0 sediment0 plumes0 from0beach0sand0replenishment0dredging0on0recruitment0of0phaeophycean0algae0 to0rocky0reefs0in0Gulf0St0Vincent0South0Australia0The0Impact0of0Sand0Dredging0 on0 Benthic0 Community0 Structure0 at0 the0 Port0 Stanvac0 Dredge0 Site0 20 1S39 UniversityofAdelaideAdelaide
ConnellJHHughesTPampWallaceCC1997A30Ryearstudyofcoralabundance recruitment and disturbance at several scales in space and time Ecological0 Monographs67461R488
Diaz MC amp Rutzler K 2001 Sponges an essential component of Caribbean coral reefsBulletin0of0Marine0Science69535R546
DodgeREampVaisnysJR1977Coralpopulationsandgrowthpatternsresponsesto sedimentation and turbidity associated with dredging Journal0 of0 Marine0 Research35715R730
Done TJ 1982 Patterns in the distribution of coral communities across the central GreatBarrierReefCoral0Reefs195R107
Edwards RA amp Smith DA 2005 Subtidal assemblages associated with a geotextile reef insouthReastQueenslandAustraliaMarine0and0Freshwater0Research56 133R142
FisheriesResearchConsultants1991Survey0of0the0Intertidal0and0Subtidal0Rocky0Reefs0 of0 the0 Sunshine0 Coast report prepared for Queensland National Parks and WildlifeService
HarrisonPHarriotVBanksSampHolmesN1998ThecoralcommunitiesofFlinders Reef andMyora Reef in theMoretonBay MarineParkQueensland Australia In Moreton0 Bay0 and0 Catchment Tibbits I Hall N amp Dennison W (Eds) SchoolofMarineScienceUniversityofQueenslandStLuciapp525R536
Hatcher B Johannes R amp Robertson A 1989 Review of research relevant to the conservationofshallowtropicalmarineecosystemsOceanography0and0Marine0 Biology0an0Annual0Review27337R414
Hoey A amp Bellwood D 2008 CrossRshelf variation in the role of parrotfishes on the GreatBarrierReefCoral0Reefs37R47
TRESBPKirraReefMarineBiotaMonitoring2015 56
frc environmental
Hollingsworth P 1975 Environmental Investigation Report Crown Reserve R R68 Currumbin Creek City of the Gold Coast Land Administration Commission unpublishedreport
Hughes TP 1994 Catastrophes phase shifts and large scale degradation of a CaribbeancoralreefScience2651547R1551
Hughes TP Rodrigues MJ Bellwood DR Ceccarelli D HoeghRGuldberg O McCook L Moltschaniwskvi N Pratchett MS Steneck RS amp Willis B 2007Phaseshiftsherbivoryandtheresilienceofcoralreefstoclimatechange Current0Biology17360R365
Hutchinson A Rempel C Taveras V Loder J amp Salmond J 2013 Reef0 Check0 Australia0 South0 East0 Queensland0 Summary0 Report0 2013 report prepared for ReefCheckFoundationLimited
Hyder Consulting 1997 Tweed0 River0 Entrance0 Sand0 Bypassing0 Project0 Permanent0 Bypassing0 System0 0 Environmental0 Impact0 Statement0 0 Impact0 Assessment0 Study report prepared for New South Wales Department of Land and Water Conservation
Jompa J amp McCook LJ 2002 Effects of competition and herbivory on interactions betweenahardcoralandabrownalgaJournal0of0Experimental0Marine0Biology0 and0Ecology27125R39
KayAMampKeoughMJ1981Occupationofpatchesintheepifaunalcommunitieson pier pilings and the bivalve Pinna bicolor at Edithburgh South Australia Oecologia48123R130
KennellyS1987aInhibitionofkelprecruitmentbyturfingalgaeandconsequencesfor an Australian kelp community Journal0 of0 Experimental0 Marine0 Biology0 and0 Ecology11249R60
Kennelly S 1987b Physical disturbances in an Australian kelp community I temporal effectsMarine0Ecology0Progress0Series40145R153
TRESBPKirraReefMarineBiotaMonitoring2015 57
frc environmental
Kennelly S 1989 Effects of kelp canopies on understory species due to shade and scourMarine0Ecology0Progress0Series50215R224
Lassig BR 1983 The effects of a cyclonic storm on coral reef fish assemblages Environmental0Biology0of0Fishes955R63
Lawson S McMahon J amp Boswood P 2001 Environmental management of the construction and operation of a sand bypassing system at the Tweed River EntranceInThe15thAustralasianCoastalandOceanEngineeringConference the 8th Australasian Port and Harbour Conference 25 R 28 September 2001 QueenslandAustralia
Lesser MP 2006 BenthicRpelagic coupling on coral reefs feeding and growth of Caribbean sponges Journal0 of0 Experimental0 Marine0 Biology0 amp0 Ecology 328 277R288
LopezRVictoriaM ZeaSampWei E2006 Competition for spacebetweenencrusting excavatingCaribbeanspongesandothercoral reeforganismsMarine0Ecology0 Progress0Series312113R121
MalcolmHASmithSDAampJordanA2009Usingpatternsofreeffishassemblages to refine a Habitat Classification System for marine parks in NSW Australia Aquatic0Conservation0Marine0and0Freshwater0Ecosystems2083R92
Massel SR amp Done TJ 1993 Effects of cyclone waves on massive coral assemblages on the Great Barrier Reef meteorology hydrodynamics and demographyCoral0Reefs12153R166
Mumby PJ amp Steneck RS 2008 Coral reef management and conservation in light of rapidly evolving ecological paradigms Trends in Ecology amp Evoution 23 555 -563
Murphy HM amp Jenkins GP 2010 Observational methods used in marine spatial monitoring of fishes and associated habitats a review Marine and Freshwater Research 61 236-252
Noriega R 2007 An Overview of Available Information on Sandy Beach Ecology Coastal Sand Dunes Rocky Reefs and Associated Biota on the Gold Coast Griffith Centre for Coastal Management Research Report No 85 report prepared for Griffith University
Parker P (1995) Structure to Reef Fish Assemblages at Julian Rocks Northern New South Wales Masters Thesis Griffith University
Parker PG 1999 Fish assemblages at Julian Rocks and the adjacent waters of northern New South Wales Australia Australian Zoologist 31 134 - 160
Pawlik JR Steindler L Henkel TP Beer S amp Ilan M 2007 Chemical warfare on coral reefs sponge metabolites differentially affect coral symbiosis in situ Limnology and Oceanography 52 907-911
Reef Check 2010 httpwwwreefcheckaustraliaorgdatahtml accessed December 2015
Robinson KI amp Pollard DA 1982 Marine and estuarine reserves in Australia with particular reference to New South Wales Wetlands 2 17 - 26
Rogers CS 1990 Responses of coral reefs and reef organisms to sedimentation Marine Ecology Progress Series 62 185-202
Russ GR 2003 Grazer biomass correlates more strongly with production than with biomass of algal turfs on a coral reef Coral Reefs 22 63-67
Rutzler K 2002 Impact of crustose clionid sponges on Caribbean reef corals Acta Geologica Hispanica 37 61-72
Scheffers SR Nieuwland G Bak RPM amp van Duyl FC 2004 Removal of bacteria and nutrient dynamics within the coral reef framework of Curacao (Netherlands Antilles) Coral Reefs 23 413-422
TRESBP Kirra Reef Marine Biota Monitoring 2015 59
frc environmental
Schlacher-Hoenlinger M Walker S Johnson J Schlacher T amp Hooper J 2009 Biological Monitoring of the Ex-HMAS Brisbane Artificial Reef Phase II - Habitat Values report prepared for Environmental Protection Agency (EPA)
Smith KA 2003 A simple multivariate technique to improve the design of a sampling strategy for age-based fishery monitoring Fisheries Research 64 79-85
Smith S Edwards R Dalton S amp Harrison M 2005 Biological assessment of fish and benthic communities at Palm Beach Bait Reef Gold Coast Queensland report prepared for University of New England
TRESBP 2014 Autum 2009 storms httpwwwtweedsandbypassnswgovauarticles-and-studiesinteresting-itemsautumn-2009-storm updated 4 May 2014 accessed December 2015
TRESBP 2015a Tweed Sand Bypassing Restoring Coastal Sand Drift Improving Boating Access ndash Techinical information httpwwwtweedsandbypassnswgovau__dataassetspdf_file0004552055kir ra-feb-2015pdf acessed December 2015
TRESBP 2015b Waves httpwwwtweedsandbypassnswgovauenvironmental-monitoringcoastal-conditionswaves updated 30 September 2015 accessed December 2015
Umar MJMLJ amp Price IR 1998 Effects of sediment deposition on the seaweed Sargassum on a fringing coral reef Coral Reefs 17 169-177
Underwood AJ amp Kennelly SJ 1990 Ecology of marine algae on rocky shores and subtidal reefs in temperate Australia Hydrobiologia 192 3-20
Walker S Schlacher T amp Schlacher-Hoenlinger M 2007 Spatial heterogeneity of epibenthos on artificial reefs fouling communities in the early stages of colonization on an East Australian shipwreck Marine Ecology 28 435-445
Walker SJ Degnan BM Hooper JNA amp Skilleter GA 2008 Will increased storm intensity from climate change affect biodiversity in non-scleractinian sessile fauna on coral reefs Global Change Biology 14 2755-2770
Warwick RM amp Clarke KR 1993 Increased variability as a symptom of stress in marine communtities Journal of Experimental Marine Biology and Ecology 172 215-216
Thenumberofsitessurveyedhasvariedover timeasaresultof the fluctuating levelof sandcoveringKirraReef
Prior to May 2003 three sites were assessed along the eastern and northern edge of KirraReef(KirraReefOutersites1to3)andthreesiteswereexaminedalongtheinshore marginof the reef (KirraReef Inner sites1 to 3)(MapA1) ReefRedge (ieKirraOuter) siteswerechosentoprovideearlywarningofimpactsfromoffshoreplacementofdredged sandwhilst inshoresites(ieKirraInner)werechosentoindicatewhetherimpactsfrom inshore beach profile development were affecting the reef platform In May 2003 the threeeasternsitesatKirraReef (ieKRO1KRO2andKRI1)werecompletelycovered with bare mobile sand Consequently only the three western sites at Kirra Reef (ie KRO3KRI2andKRI3)supportedbenthicfloraandfaunaInMarch2004theextentof the remainingwesternoutcropof KirraReef had been further reduced so that all inner reefsiteswerecompletelycoveredwithmobilesandConsequentlyonlyasingleoriginal reefsite(ieKRO3)couldbesurveyed(Figure23)Thereforetoprovideanindicationof the condition of the remaining reef two new sites were established (ie KRN1 and KRN2)(Figure23)andsurveyedinMarch2004Theextentofthewesternreefhadbeen further reduced by February 2005 and a third new site (ie KRN3) was established (Figure23)Consequentlyfoursites(KRO3KRN1KRN2andKRN3)weresurveyedin February2005
InFebruary2010fourKirraReefsites(ieKRO3KRO1KRN1andKRN2)wereclearof thesurroundingsandandsupportedbenthic floraand fauna Inaddition several rocks protruded from the sand in the vicinity of site KRI2H these were assessed to provide a quantitativeindicationofbroadRscaletemporalchangestotheinshorereefcommunities
SOURCEScopy Copyright Commonwealth of Australia (Geoscience Australia) 2001 2004 2006copy The State of Queensland (Department of Natural Resources and Mines) 2015copy Nearmap 2014 2015
DATE2015-09-09
DRAWN BYCF
VERSION02
PROJECTIONCoordinate System GDA 1994 MGA Zone 56Projection Transverse MercatorDatum GDA 1994
plusmn SCALE
0 50 100
Metres
Scale 12500 A3
frc environmental
Appendix$B$ Introduction$to$Data$Analysis$Used$
Multivariate$Analyses$
Multivariate statistical techniques are widely used in ecology to assess the similarities relationshipsbetweenassemblagesWhereasunivariateanalysescanonlycompareone variable at a time (eg an index of community structure such as a diversity index or a singleindicatorspecies)multivariateanalysescancomparesamplesbasedontheextent thatassemblagesshareparticulartaxaandabundances(ClarkeampWarwick2001)
Thefirststepofmultivariateanalysisusuallyinvolvesthecreationofamatrixofsimilarity coefficients computed between every pair of samples The coefficient is usually a measureofhowclose theabundance is foreachspecies (definedso that100= total similarity and 0=complete dissimilarity) The Bray Curtis similarity measure is commonlythemostappropriateforbiologicaldata(ClarkeampWarwick2001)
MultidimensionalScaling
NonRmetricmultiRdimensionalscalingordinations(nMDS)attempttoplacesamplesintwo dimensionalspacesothattherankorderofthedistancesbetweensamplesmatchesthe rankorderofthematchingsimilaritiesfromthesimilaritymatrix(ClarkeampWarwick2001) Thisprovidesavisualrepresentationofthesimilaritiesbetweenassemblageswithineach sampleEachoftheaxesisnotrelatedtoanyparticularvalueHinfactaxescanberotated toprovide thebestvisual representationof thedata Ordinationsareparticularlyuseful tools for analysing and visually presenting differences between assemblages Ordinationsareessentiallymapsofsamples inwhich theplacementofsampleson the mapreflectsthesimilarlyofthecommunitytothecommunitiesinothersamples(Clarkeamp Warwick 2001) Distances between samples on an ordination attempt to match the similarities inassemblagestructurenearbypoints representassemblageswithvery few attributes(speciesorabundanceofspecies)Hpoints faraparthavevery fewattributes in common(ClarkeampWarwick2001)
A stress coefficient is calculated to reflect the extent to which the multiRdimensional scalingordinationandthesimilaritymatrixagree(ClarkeampWarwick2001)(iehowwell the multiRdimensional scaling ordination accurately reflects the relationship between samples)Stressvaluesoflt015aregenerallyacceptable
In Figure A1 each freshwater macroinvertebrate sample is represented on the multiRdimensionalscalingordination By lookingat thedistancesbetweeneachsample
ANOSIMisanalogoustoANOVAinunivariatestatistics(Smith2003)AglobalRstatistic iscalculatedtodeterminewhetherthereisasignificantdifferencebetweenallsamplesIf there are differences then pairwise comparisons are conducted to test for differences betweenpairsofsamples(analogoustopostRhoctestsinANOVA)
The R value lies between R1 and +1 (all similarities within groups are less than any similarity between groups) with a value of zero representing the null hypothesis (no differenceamongasetofsamples)(ClarkeampWarwick2001)ComparisonofpairwiseR values can give an indication of how different assemblages are R values close to 0 indicatelittledifferencevaluesaround05indicatesomeoverlapandvaluescloseto1to indicate many or substantial differences In many instances however researches are primarily interestedinwhethertheRvalueisstatisticallydifferentfromzero(usuallyata confidence level of 005) (Clarke amp Warwick 2001) (ie whether they can reject the null hypothesis)
ANOSIM can provide information on whether the (visual) differences between assemblages in the multiRdimensional scaling ordination are significantH it is an independenttestfromthemultiRdimensionalscalingordinationItisbasedontestingthe
TRESBPKirraReefMarineBiotaMonitoring2015 B2
frc environmental
differences between the rank similarities in the similarity matrix not on the distances betweensamplesinthemultiRdimensionalscalingordination(ClarkeampWarwick2001)
PermutationalMultivariateAnalysisofVariance
PERMANOVAisusedtotestsimultaneousresponsesofoneormorevariablestooneor more factors in an a0 priori0 structured design using random permutation of the data to assess significance (Anderson 2004) PERMANOVA generates a pseudo FRstatistic similar to traditional ANOVA but pRvalues are calculated with permutations which does notassumenormaldatadistribution PERMANOVAcanprovide informationonwhether the (visual) differences between assemblages in a multiRdimensional scaling ordination are significantH however it is an independent test from the multiRdimensional scaling ordination
Thelevelofmultivariatedispersionamongsampleswithineachofthetestgroupscanbe examined using the permutational analysis of multivariate dispersions (PERMDISP) routine(Anderson2004)Intraditionalimpactassessmentachangeinthedispersionof datacanalsoindicateanimpact
SimilarityPercentagendashSpeciesContributions
SIMPER analysis provides information on how dissimilar assemblages from various groups are (eg how similar all of the macroinvertebrate samples taken for a particular habitatwithinastreamreachare)andhowsimilareachgroup(egreach)istoanyother group SIMPER analysis also identifies the species taxa that are contributing to the dissimilarity between two assemblages in rank order (ie it identifies which species is contributingthemosttothedifferences)SIMPERanalysismayhelptoidentifypotential lsquoindicatorrsquospeciesForexampleifaparticularspeciesconsistentlycontributesgreatlyto the differences between impacted and unimpacted assemblages it may be a useful indicator Theabundanceofthis indicatorspeciescanthenbecomparedbetweensites usingunivariatetechniquessuchasANOVA
Data is available on request from tresbpprojectofficecrownlandnswgov
TRESBPKirraReefMarineBiotaMonitoring2015 C1
frc environmental
Appendix(D( Pairwise( PERMANOVA( Results
Data is available on request from tresbpprojectofficecrownlandnswgov
TRESBPKirraReefMarineBiotaMonitoring2015 D1
frc environmental
Appendix(E( Relative(Abundance(of(Fish(found(at(Kirra(( ( and(Palm(Beach(Reefs(in(Each(Survey((Data is available on request from tresbpprojectofficecrownlandnswgovau
TRESBPKirraReefMarineBiotaMonitoring2015 E1
Structure Bookmarks
0 50 100 Metres Scale 12500 A3
0 50 100 200 Metres Scale 15000 A3
Kirra Reef
Kirra Reef
Kirra Reef
Kirra Reef
Kirra Reef
Kirra Reef
Map A1Location of Kirra Reef monitoring sites
Table D8 Pairwise comparison of macroalgae cover between sites in each year
Table D15 Pairwise comparison of turf algae cover between sites in each year
Table D29 Pairwise comparison of ascidian cover between sites in each year
Table D43 Pairwise comparison of soft coral cover between sites in each year
frc environmental
Crinoids$
ThereisasignificantdifferencebetweensomesitesatbothKirraReefandParmBeach Reef that varies through time (note the significant interaction between site (location) x survey inTable310) Theabundanceofcrinoidshasbeensimilarbetweensites inall years at Palm Beach ReefH and was different beween sites at Kirra Reef in June 1995 February1996May2003andFebruary2005(AppendixD)Withineachsitetherehas been some natural temporal variability particualrly at Palm Beach Reef sites in 2001 (Appendix D) The mean abundance (individuals 025m2) of crinoids (Figure 318) at KirraReefandPalmBeachReefhasgenerallybeenlessthan2individualsper025m2 andhasdeclinedatboth locationssincethebaselinesurvey inApril1995(Figure319) However the mean abundance of crinoids on Kirra Reef has shown a slight increase sinceFebruary2010(Figure319)
In March 2015 fewer crinoids were recorded at Palm Beach Reef than at Kirra ReefH crinoidshavebeenrareatPalmBeachReefsince2003
The species richness of fish recorded from Kirra Reef across all monitoring events has rangedfrom14to57 InMarch201557specieswereidentifiedat thereefwhichwas similar to April 2014 (53) and higher than previous surveys (Figure 320) Species richnessatPalmBeachReefwas lower(34species)andgenerallyvaried lessbetween surveyscomparedtoKirraReef
InMarch2015 the assemblage of fish at KirraReef comprised species fromall trophic levelsincludingdetritivoresplanktivoresherbivoresandcarnivores(AppendixE)Asin previous surveys the assemblage was dominated by herbivores and planktivores Yellowtail (Trachurus0 novaezelandiae) and striped sea pike (Sphyraena0 obtusata) were the dominant species present in large schools (Figure 321) Australian mado (Atypichthys0 strigatus) ringRtailed surgeon (Acanthurus0 blochii) silver trevally (Pseudocaranx0 georgianus) eastern pomfred (Schuettea0 scalaripinnis) sweep (Scorpis0 lineolatus) and various wrasses were also very abundant releative to other species (AppendixE)
Two new species were observed at Kirra Reef the orangeRband surgeon (Acanthurus0 olivaceus) and the unicornfish (Naso0 sp) Five new species were recorded at Palm BeachReef
No threatened or protected fish species listed under the Queenslandrsquos Nature0 Conservation0Act01992ornationallyundertheEnvironmental0Protection0and0Biodiversity0 Conservation0 Act0 1999 were observed The complete list of species recorded and the relativeabundanceispresentedinAppendixE
TRESBPKirraReefMarineBiotaMonitoring2015 42
60
0
10
20
30
40
50
Num
ber
of F
ish
Spe
cies
Apr-95
Jun-95
Feb-96
Jan-01
May-03
Mar-04
Feb-05
Feb-10
Jul-12
Apr-14
Mar-15
Kirra Reef Palm Beach Reef Location
frc environmental
Figure320 Number of fish species recorded at Kirra Reef and Palm Beach Reef on
ThegreatestchangetotheecologicalconditionofKirraReefsincethebaselinesurveyin 1995 has been the loss of large areas of hard substrate that support benthic flora and faunaThedeliveryoflargesandvolumesduringthestage1dredgingoperations(1995 to1998)andtheinitialoperationofthesandbypasssystem(2001to2008)resultedinan increaseinwaveactionandtidalcurrentsredistributingthissandoverKirraReef
The three major outcrops of Kirra Reef (northern southern and eastern sections) are naturally exposed and covered depending on water and sand movements In March 2015 the rocky outcrops in the northern section of Kirra Reef were exposed and supportedamoderatelydiversebenthicassemblagedominatedbyturfalgaeTherewas arelativelyhighfishdiversityatKirraReefTheecologicalassemblageexhibitedsignsof ongoingstressfromphysicaldisturbanceincludingtheabsenceofsoftcoralsandrarityof hardcoral(MumbyampSteneck2008)HoweverKirraReefhasarelativelyhighcoverof sponges and ascidians Sponges ascidians and crinoids were more abundant at Kirra ReefthanatPalmBeachReefinMarch2015
KirraReefcontinues toprovidehabitatandsupport importantecological functions in the region providing hard substrate for the colonisation of algae and benthic invertebrates and food and refuge for fish As sand levels have stabilised since 2008 assemblages have becomemoresimilar to those recordedprior to implementationof the TRESBP in April1995 Forexamplemacroalgalcover inApril1995andMarch2015wasrelatively similarHoweverassemblagecompositionisstillsignificantlydifferenttothatrecordedin thebaselinesurveysmostnoticeablyduetoa lowercoverofbaresubstrateandhigher coverofturfalgaeandascidianssincesurveyshavebeenperformed
Benthic$Macroalgae$
The cover of macroalgae at Kirra Reef was relatively similar during the 2014 and 2015 surveys and remained well below the peak of nearly 60 cover recorded in January 2001TherewasasteepdeclineinthecoverofmacroalgaebetweenJanuary2001and May2003whichappearedtobestronglyassociatedwith thedecline inreefareaduring that time as well as a decline in the cover of Sargassum sp (an important indicator speciesonKirraReef) SimilardeclineswereevidentatPalmBeachReefbetween the January2001andMay2003surveys
TRESBPKirraReefMarineBiotaMonitoring2015 45
frc environmental
The cover ofmacroalgae at Palm Beach Reef was much lower thanat Kirra Reef over time There are several possible reasons for the lower cover of macroalgae at Palm Beach
sdot PalmBeachReefisdeeperthanKirraReefandgenerallyhashigherturbidityand therefore greater light attenuation The quantity and quality of available light affectsthedistributionandgrowthofmacroalgae(MillerampEtter2008)
sdot Differences in the pattern of recruitment of algal species to the reefs due to differentwatercurrentsandtimingofthesurveys(Kennelly1987b)
sdot Increased competition with turf algae and sessile benthic invertebrates which competeforspacewithmacroalgae(Kennelly1987aHMillerampEtter2008)
sdot PresenceofdifferentspeciesandhigherdensityofherbivoresatPalmBeachReef (particularly sea urchins and herbivorous fish) which graze on macroalgae (McCook1997HJompaampMcCook2002)
Biological assemblages exposed to physical stress typically exhibit greater levels of temporalandspatialvariability(WarwickampClarke1993HChapmanetal1995)Temporal variationinthecoverofmacroalgaeatKirraReefislikelytobeprincipallyduetotheeffect ofphysicaldisturbance fromwaveactionaswellas theassociatedassociatedabrasion andsmotheringbysandTheeffectsofthesephysicaldisturbanceswouldincreasewith thereductionofKirraReefasedgeeffectsarepronouncedandwaterdepth isreduced Increasedsmotheringbysandcanalsoreducediversity(Hatcheretal1989)abundance recruitment growth survival and seasonal regeneration of macroalgae (Umar amp Price 1998HCheshireetal1999)
Changes in the cover of macroalgae on Kirra Reef over time are also likely due to the extentofthereefchangingHthefishandmobileinvertbratesassociatedwiththereefmay have concentrated which would in turn increase grazing pressure Increased grazing pressure from fish and mobile invertebrates can reduce the coverage and diversity of macroalgaeonreefs(McCook1997HJompaampMcCook2002)
Thecoverof turfalgaeatbothKirraReefandPalmBeachReefhasvariedsignificantly betweensurveysPriorto2005turfalgaetypicallycoveredlessoftheavailablesurface areaonKirraReefthanPalmBeachReefInMarch2015themeancoverofturfalgae hasincreasedsincebaselinesurveysin1995andwasrelativelysimilarbetweenreefs(40 plusmn4atKirraReefcomparedto48plusmn4atPalmBeachReef)Thecoverofturfalgaeat Kirra Reef was similar in 2014 and 2015 which was generally higher than previous surveysexceptduringJuly2012whencoverofturfalgaepeakedat67plusmn4
TRESBPKirraReefMarineBiotaMonitoring2015 46
frc environmental
Turfalgaearebecomingadominantcomponentofcommunitiesaroundtheworld likely the result of rapid colonisation of openspace after a disturbance (eg storms) nutrient enrichment andor changes in grazing pressures Turf algae can also reflect a more physically robust growth form suited to high wave energy environments (than foliose macroRalgae)TurfalgaepeakedintheJuly2012surveylikelyrelatedtotheincreasein bare reef exposure following a stormy conditions in early 2009 and between December 2011 and June 2012 Turf algae have been the dominant form of algae on Kirra Reef sincethistimealbeitthecoverlowerthanthe2012survey
Increased cover of turf algae is typically related to good light conditions high concentrationsofnutrientsandlownumbersofgrazerssuchasfish(orconstantgrazing pressure preventing macroalgae colonisation) However the relationship between algal dynamics physical disturbance water quality and herbivore grazing activity is complex andthecoverof turfalgaecanexhibitextremetemporalvariabilityasaconsequenceof the interactionbetween topRdownandbottomRupprocesses (Russ2003HBellwoodetal 2006H Hughes et al 2007H Albert et al 2008H Hoey amp Bellwood 2008H Mumby 2009) Furtherinvestigationwouldberequiredtoreliablydeterminethemechanismsofchangein bothmacroalgaeandturfalgaeassemblagesonthesereefs
Benthic$Macroinvertebrates$
AtKirraReeftheburialandreRemergenceofrockyoutcrops(influencedbytheTRESBP) islikelytohaveincreasedtemporalvariabilityinthedistributionandabundanceofbenthic macroinvertebrates Additional perturbations such as wave action and sand abrasion (each influenced through changes in bathymetry seabed topography and water depth) are likely to have resulted in the decline in cover and diversity of the benthic macroinvertebratesatKirraReefbetweensurveysparticularlybetweenMarch2004and February2005andduringtheseverestormsof2009Benthicmacroinvertebratessuch asascidiansspongeshardcoralandsoftcoralarehighlysusceptible to theeffectsof stormandwavedisturbancephysicalabrasionandburialbysand(KayampKeough1981H Walker et al 2008) which can affect settlement growth rate and survival (Dodge amp Vaisnys1977HRogers1990)
Physical disturbance from sand burial sand abrasion and the action of storm waves appeartokeepthebenthicassemblagesofKirraReefinastateofearlysuccessionItis commonforearlypioneerspeciessuchassomemacroalgaetorecruitrapidlytoahard surface in large numbers allowing these species to dominate assemblages early in the successionaltrajectory(Walkeretal2007)
Afurther indicatorof theearlystateofsuccessionatKirraReef isthatthecoverofhard and soft coral has remained very low (generally lt 5) In March 2015 less than 1
Benthic macroinvertebrate cover may also be affected indirectly through increased competitionwithmacroalgaeforspaceThepresenceoflargemacroalgaecanaffectthe recruitment and survival of sessile benthic invertebrates as fronds moving with wave action sweep and abrade the surface of rocks killing new recruits especially corals (Kennelly1989HMcCooketal2001)Itcantakeseveralyearsforhardandsoftcoralto become dominant on reefs in the SEQ region (SchlacherRHoenlinger et al 2009) Therefore hard coral is not expected to become abundant until several years after the reefhasbeenuncoveredandonlyifthephysicaldisturbanceregimeandsupplyofnew recruitsissufficienttosupportsurvivalandgenerationalsuccessionofthesespeciesThe coverofhardandsoftcoralsatKirraReefwerebothverylowandpatchypriortothestart oftheTRESBP
Sponges and ascidians are highly susceptible to smothering and sand abrasion unless theyhaveathicktunic(outercoveringmadeofkeratin)liketheascidianP0stolonifera0or strong internal keratin silicon or calcareous structures in the case of some species of sponges0(KayampKeough1981HMcGuinness1987HWalkeretal2008)Duetoincreased wave action and sedimentation (which can be influenced by the TRESBP) the mean coverofascidiansandspongeswasexpectedtobemuchloweronKirraReefthanPalm Beach Reef However in March 2015 the cover of sponges was similar between the reefsandthecoverofascidians(otherthanP0stolonifera)wasgreateratKirraReefthan at Palm Beach Reef This suggests that Kirra Reef is slowly recovering from the increasedstressofphysicaldisturbancesuchas increasedwaveactionandsandscour andorthatwaveandstormconditionshavebeenlesssevereinthepastfewyears
Fish$
KirraReefcontinuestosupportahighdiversityofreefRassociatedandpelagic(ienonR reefassociated) fishspecies Despite itsdiminishedsizecompared to1995KirraReef continuestoprovidevaluablehabitatforanumberoffishspeciesfromdifferentfunctional groups
ThereisahighdegreeofinterRannualvariabilityinthespeciesandabundanceofthefish present at Kirra Reef compared with the assemblage at Palm Beach Reef This likely reflectsthetemporalvariabilityintheavailablehabitatasaconsequenceofreefburialand reRemergenceThediversityqualityandarealextentofreefhabitatareimportantfactors influencing the distribution abundance biomass and diversity of reef fish (Bellwood amp Hughes2001HFriedlanderetal2003)Diversityandabundanceoffishcanincreasewith
TRESBPKirraReefMarineBiotaMonitoring2015 48
frc environmental
greaterstructuralcomplexityandincreasedheterogeneityofavailablehabitats(Bellwood ampHughes2001)Thissuggeststhatperiodsofreefburialreducetheoveralldiversityof reefRassociated fish species at Kirra Reef Despite the reduction in overall reef space therewasalargervarietyofhabitats(suchasmarcoalgaeandturfalgae)in2015which was likely to be related to the high diversity of fish assemblages This is particularly importantforseveralspeciesthatdependonthepresenceoflsquostructurersquosuchasprovided by reef habitat (ie oldwife moray eels damselfish and Australian mado that were recordedinMarch2015butwerenotrecordedinJuly2012)
Theabundanceanddiversityof fishare likelytobenegativelyaffectedfollowingperiods of severe weather which create unfavourable conditions for many species and may further exacerbate the affects of abrasion and sedimentation The biomass of fish is knowntodecreasewithincreasingexposuretophysicaldisturbancefromwaveactionand strong currents (Friedlander et al 2003) As our surveys have been undertaken at different times of the year variation in the prevailing conditions at the time of sampling could also influence the types of fish observed (and the amount of reef habitat that is availableatanytime)Manyofthespeciesmayalsobeaffectedbyseasonalchangesin the water temperature such as damselfish which are less abundant in cool waters However theoveralldiversityof the fishassemblageatKirraReef is likely toreflect the sizeoftheoutcropsexposedwithagreaterphysicaldisturbance(fromseaconditionsand sandmovement)andcompetitionHandlesserfoodavailablewhenthereefiscovered
ThepredictedimpactstoKirraReefasaresultoftheTRESBPincludedaccretionofsand around the base of the rock outcrops causing a reduction in extent of reef It was predictedthatsanddeliveryaspartoftheprojectwouldeventuallymimiclsquonaturalrsquopatterns ofsanddispersalandthatthereefwouldreturntoitsnaturalextent(ietheextentpriorto extension of the Tweed River training walls in 1962) The benthic flora and fauna assemblages of the reef the historical reef extent and natural sand transport patterns wereexpectedtoreturntoconditionsobservedbeforetheextensionofthetrainingwalls between 1962 and 1965 However the Environmental Impact Study did not predict the ecologicalconsequencesofboththereducedarealextentandincreasedwaveenergy(a consequenceofdecreaseddepth)thathavebeenrecorded
ThecurrentextentofKirraReef remains less than50of that recorded in1962and in 1995beforethesanddeliverybytheTRESBPcommencedHowevertheextentofreef in1995 wasstrongly influenced by adepletion in sand following the construction of the Tweed River training walls and the Kirra Point groyne Accumulation of sand on Kirra ReefwasobservedtoincreaseasaresultofindirectsandnourishmentbytheTRESBP and the reef has been extensively covered (particuarly between 2005 and 2010) as a result
Whiletheextentofthereefcontinuestochangeovertimethedeliveryofsandaspartof the project now more closely matches the natural rate of longshore sand transport ShortRtermandseasonalchangesintheextentofthereefarenowlikelytobetheresultof waveandcurrentaction(particularlyduringservereweatherevents)thanadirectimpact of the TRESBP Therefore the extent of Kirra Reef in March 2015 is broadly in accordancewithpredictionsmadeintheEISwhichpredictedthatthereefwouldreturnto a condition similar to that exhibited in the preR1960rsquos ie before the extension of the TweedRiverbreakwatersthatinterruptedlittoralsandsupplytothesebeaches
InDecember2013KirraPointgroynewasextendedby30mwiththeexpectationthatthe beach bar would move seaward as a consequence At present Kirra Point groyne is unlikelytohavehadamajorimpactonthearealextentofKirraReefHoweverongoing monitoringbasedonaerialphotographsmayprovidefurtherinsight
Sessile benthic assemblages on Kirra Reef are highly susceptible to the influence of storms and associated wave action (Kay amp Keough 1981H Walker et al 2008) The shallowreefissurroundedbymobilesandwhichcanshiftnaturallyinresponsetowave action during storms causing burial of large sections of Kirra Reef This effect has reduced the availability of rocky substrate for colonisation and the availability of refuge
Fromanexaminationof theextentofKirraReef fromarealmapsandwaveheightdata thereappears tobea relationshipbetween theareaof rockexposedandstormevents Notably in a series of storm events in May 2009 corresponds with large areas of rock becoming exposed (with the reef approximately 100m2 in 2006 and approximately in 1009m2 2009) Further a stormy conditions between December 2011 and July 2012 correspondstotheareaofexposedrockmorethandoublinginsizeWhiletherewasno changetothetotalareaofexposedrockfollowingstormyconditionsinearly2013there wasaclearchangeinthedistibutionofexposedrockduringthistimeSince2013storm conditions have been calm to moderate and there has been little change in the areal extentanddistrubtionofexposedrockatKirraReef
WaveheighttypicallyincreasesduringstormeventsandgiventheshallowdepthofKirra Reef waves are more likely to shoal and break across the reef during storms This increases thephysicaldisturbanceabrasionandsedimentationofbenthicassemblages onKirraReefStormdisturbancecancauselocalreductionsinthespeciesrichnessand abundanceofcoral(Woodleyetal1981HMasselampDone1993HHughes1994HConnellet al 1997) and can alter fish assemblages indirectly through habitat modifications (Kaufman1983HJonesampSyms1998)ordirectlybyincreasingfishmortality(Lassig1983) The hydrodynamic forces produced by wave action are an important source of disturbance in subtidal habitats inflicting damage through direct physical impact and abrasion(UnderwoodampKennelly1990)DirectimpactsfromphysicaldisturbanceatKirra Reefareevidentduringsurveyeventswhenlargefragmentsofmacroalgaearepresentin thewatercolumnoverthereef
Storm and wave action (and associated sedimentation and abrasion) continue to be importantforcesshapingthedistributionandabundanceofbenthicspeciesatKirraReef Increased magnitude and frequency of physical disturbance resulting from increased exposureorsusceptibility tostormsandassociatedwaveaction (asonKirraReef)can lead to a decrease in the diversity of sessile invertebrate assemblages DisturbanceR drivenreductionsinbiodiversityhavethepotentialtoimpactnegativelyonthehealthand productivity of reef ecosystems (Walker et al 2008) Biodiversity is important to reef health given that many of these species (eg sponges bryozoans and ascidians) contribute a range of vital ecosystem services to reefs including nutrient cycling (Scheffers et al 2004) trophic interactions and food webs (Lesser 2006H Pawlik et al 2007) bioRerosion (Rutzler 2002H LopezRVictoria et al 2006) and stabilizing substrata (DiazampRutzler2001HWulff2001)
Theimpactsof increasedwaveactionandsedimentationonthebenthicassemblagesat Kirra Reef are likely to be greatest during and immediately following storm conditions
TRESBPKirraReefMarineBiotaMonitoring2015 51
frc environmental
Partitioningtheinfluenceofstormandwavedrivendisturbancefromthatoftheoperation oftheTRESBPwouldrequireamuchmorestatisticallypowerfulandtemporilyreplicated experimental design Given there is a large collection of wave and storm data by TRESBP this would involve greater temporal sampling of Kirra Reef including event samplingfollowingseverewaveandstormactivity
The data generated by this Kirra Reef biota monitoring program doesnrsquot support statistically rigorous consideration of seasonality (monitoring has been at its most frequentannual)
InApril2014andMarch2015KirraReefcoveredlessthan50ofthereefrsquosextentprior to theoperationof theTRESBP The lossof reefhabitathasreducedtheavailabilityof hard substratum available for colonisation and consequently the abundance of benthic sessileassemblages
The reduced depth of water resulting from the accumulation of sand exacerbates the effects of storms and wave action It is likley that as a consequnece the biological communities of Kirra Reef will reflect earlyRstage succession more frequently and for longerperiods
While there is sufficient structure available frcenvironmentalexpect that Kirra Reef will continuetoprovideimportanthabitatforadiverseassemblageoffishes
TRESBPKirraReefMarineBiotaMonitoring2015 52
frc environmental
5$ Conclusions$
Although there is still a substantial portion of the reef covered compared to before the extension of the Tweed River entrance breakwaters the current extent of Kirra Reef is broadly inaccordancewithpredictionsmadein theEIS Initial lsquocatchRuprsquobypassingand dredgeplacementofsand(between2001and2008)resulted in theburialofKirraReef Subsequentsanddelivery(since2008onwards)morecloselyreflectsnaturalpatternsof longRshoresandtransportandisthereefhasslowlyreRemerged
Theextentofthereefhasbeenrelativelystablesince2013Thishasallowedforsome succession in the benthic assemblages including a relatively high cover of sponges ascidiansandcrinoidsWiththedeliveryofsandmorecloselymatchingthenaturalrateit isexpected the reef willundergoshortRtermchanges in extentdue toseasonal shifts in sand deliveryH however the diversity of benthic assemblages on Kirra Reef is likely to increaseovertimeThiswouldcreatemorespaceforspeciestorecruitandreducesthe influence of sand abrasion and wave damage It was predicted that the areas of Kirra Reef newly exposed in 2012 would undergo a shift from turfRdominated communities to more diverse communities that could include macroalgae sponges ascidians and potentiallyhardandsoftcoralWiththeexceptionofhardandsoftcoralsthisprediction wasconfirmedbytheresultsoftheApril2014andMarch2015surveys
ThediversityoffishesassociatedwithKirraReefisbroadlysimilartothatrecordedprior tothecommencementofsandbypassingin1995Giventhatfisharemobilethegreatest impacts on fish assemblages are likely to be shortRterm changes due to both the prevailingconditionsandchangestheextentofavailablehabitatthatprovidesshelterand foodforavarietyofdifferentspeciesIfKirraReefincreasesinsizethereislikelytobea greater proportion of cryptic benthic species as these species are more typical of assemblagesinalaterstageofsuccession(eg(WillisampAnderson2003))
Assuming a broadly stable delivery rate of sand and consequent stable extent of Kirra ReeflsquorecoveryrsquoislikleytobesubstantivelycompleteFloralandfaunalcommunitieswill undergo succession between severe storm events but are likley to remain relatively dynamic
Albert S Udy J amp Tibbetts I 2008 Responses of algal communities to gradients in herbivorebiomassandwaterqualityinMarovoLagoonSolomonIslandsCoral0 Reefs2773R82
Anderson MJ 2001 A new method for nonRparametric multivariate analysis of varianceAustral0Ecology2632R46
Anderson MJ 2004 PERMDISP0 a0 FORTRAN0 computer0 program0 for0 permutatinoal0 analysis0 of0 multivariate0 dispersions0 (for0 any0 twoSfactor0 ANOVA0 design)0 using0 permutational0 tests Department of Statistics University of Auckland New Zealand
Cannon LR Goeden GB amp Campbell P 1987 Community patterns revealed by trawling in the interRreef regions of the Great Barrier Reef Memoirs0 of0 the0 Queensland0Museum2545R70
Chapman MG Underwood AJ amp Skilleter GA 1995 Variability at different spatial scalesbetweenasubtidalassemblageexposedtothedischargeofsewageand two control assemblages Journal0 of0 Experimental0 Biology0 and0 Ecology 189 103R122
Cheshire AC Miller DJ amp Stewart R (1999) Effect0 of0 dispersed0 sediment0 plumes0 from0beach0sand0replenishment0dredging0on0recruitment0of0phaeophycean0algae0 to0rocky0reefs0in0Gulf0St0Vincent0South0Australia0The0Impact0of0Sand0Dredging0 on0 Benthic0 Community0 Structure0 at0 the0 Port0 Stanvac0 Dredge0 Site0 20 1S39 UniversityofAdelaideAdelaide
ConnellJHHughesTPampWallaceCC1997A30Ryearstudyofcoralabundance recruitment and disturbance at several scales in space and time Ecological0 Monographs67461R488
Diaz MC amp Rutzler K 2001 Sponges an essential component of Caribbean coral reefsBulletin0of0Marine0Science69535R546
DodgeREampVaisnysJR1977Coralpopulationsandgrowthpatternsresponsesto sedimentation and turbidity associated with dredging Journal0 of0 Marine0 Research35715R730
Done TJ 1982 Patterns in the distribution of coral communities across the central GreatBarrierReefCoral0Reefs195R107
Edwards RA amp Smith DA 2005 Subtidal assemblages associated with a geotextile reef insouthReastQueenslandAustraliaMarine0and0Freshwater0Research56 133R142
FisheriesResearchConsultants1991Survey0of0the0Intertidal0and0Subtidal0Rocky0Reefs0 of0 the0 Sunshine0 Coast report prepared for Queensland National Parks and WildlifeService
HarrisonPHarriotVBanksSampHolmesN1998ThecoralcommunitiesofFlinders Reef andMyora Reef in theMoretonBay MarineParkQueensland Australia In Moreton0 Bay0 and0 Catchment Tibbits I Hall N amp Dennison W (Eds) SchoolofMarineScienceUniversityofQueenslandStLuciapp525R536
Hatcher B Johannes R amp Robertson A 1989 Review of research relevant to the conservationofshallowtropicalmarineecosystemsOceanography0and0Marine0 Biology0an0Annual0Review27337R414
Hoey A amp Bellwood D 2008 CrossRshelf variation in the role of parrotfishes on the GreatBarrierReefCoral0Reefs37R47
TRESBPKirraReefMarineBiotaMonitoring2015 56
frc environmental
Hollingsworth P 1975 Environmental Investigation Report Crown Reserve R R68 Currumbin Creek City of the Gold Coast Land Administration Commission unpublishedreport
Hughes TP 1994 Catastrophes phase shifts and large scale degradation of a CaribbeancoralreefScience2651547R1551
Hughes TP Rodrigues MJ Bellwood DR Ceccarelli D HoeghRGuldberg O McCook L Moltschaniwskvi N Pratchett MS Steneck RS amp Willis B 2007Phaseshiftsherbivoryandtheresilienceofcoralreefstoclimatechange Current0Biology17360R365
Hutchinson A Rempel C Taveras V Loder J amp Salmond J 2013 Reef0 Check0 Australia0 South0 East0 Queensland0 Summary0 Report0 2013 report prepared for ReefCheckFoundationLimited
Hyder Consulting 1997 Tweed0 River0 Entrance0 Sand0 Bypassing0 Project0 Permanent0 Bypassing0 System0 0 Environmental0 Impact0 Statement0 0 Impact0 Assessment0 Study report prepared for New South Wales Department of Land and Water Conservation
Jompa J amp McCook LJ 2002 Effects of competition and herbivory on interactions betweenahardcoralandabrownalgaJournal0of0Experimental0Marine0Biology0 and0Ecology27125R39
KayAMampKeoughMJ1981Occupationofpatchesintheepifaunalcommunitieson pier pilings and the bivalve Pinna bicolor at Edithburgh South Australia Oecologia48123R130
KennellyS1987aInhibitionofkelprecruitmentbyturfingalgaeandconsequencesfor an Australian kelp community Journal0 of0 Experimental0 Marine0 Biology0 and0 Ecology11249R60
Kennelly S 1987b Physical disturbances in an Australian kelp community I temporal effectsMarine0Ecology0Progress0Series40145R153
TRESBPKirraReefMarineBiotaMonitoring2015 57
frc environmental
Kennelly S 1989 Effects of kelp canopies on understory species due to shade and scourMarine0Ecology0Progress0Series50215R224
Lassig BR 1983 The effects of a cyclonic storm on coral reef fish assemblages Environmental0Biology0of0Fishes955R63
Lawson S McMahon J amp Boswood P 2001 Environmental management of the construction and operation of a sand bypassing system at the Tweed River EntranceInThe15thAustralasianCoastalandOceanEngineeringConference the 8th Australasian Port and Harbour Conference 25 R 28 September 2001 QueenslandAustralia
Lesser MP 2006 BenthicRpelagic coupling on coral reefs feeding and growth of Caribbean sponges Journal0 of0 Experimental0 Marine0 Biology0 amp0 Ecology 328 277R288
LopezRVictoriaM ZeaSampWei E2006 Competition for spacebetweenencrusting excavatingCaribbeanspongesandothercoral reeforganismsMarine0Ecology0 Progress0Series312113R121
MalcolmHASmithSDAampJordanA2009Usingpatternsofreeffishassemblages to refine a Habitat Classification System for marine parks in NSW Australia Aquatic0Conservation0Marine0and0Freshwater0Ecosystems2083R92
Massel SR amp Done TJ 1993 Effects of cyclone waves on massive coral assemblages on the Great Barrier Reef meteorology hydrodynamics and demographyCoral0Reefs12153R166
Mumby PJ amp Steneck RS 2008 Coral reef management and conservation in light of rapidly evolving ecological paradigms Trends in Ecology amp Evoution 23 555 -563
Murphy HM amp Jenkins GP 2010 Observational methods used in marine spatial monitoring of fishes and associated habitats a review Marine and Freshwater Research 61 236-252
Noriega R 2007 An Overview of Available Information on Sandy Beach Ecology Coastal Sand Dunes Rocky Reefs and Associated Biota on the Gold Coast Griffith Centre for Coastal Management Research Report No 85 report prepared for Griffith University
Parker P (1995) Structure to Reef Fish Assemblages at Julian Rocks Northern New South Wales Masters Thesis Griffith University
Parker PG 1999 Fish assemblages at Julian Rocks and the adjacent waters of northern New South Wales Australia Australian Zoologist 31 134 - 160
Pawlik JR Steindler L Henkel TP Beer S amp Ilan M 2007 Chemical warfare on coral reefs sponge metabolites differentially affect coral symbiosis in situ Limnology and Oceanography 52 907-911
Reef Check 2010 httpwwwreefcheckaustraliaorgdatahtml accessed December 2015
Robinson KI amp Pollard DA 1982 Marine and estuarine reserves in Australia with particular reference to New South Wales Wetlands 2 17 - 26
Rogers CS 1990 Responses of coral reefs and reef organisms to sedimentation Marine Ecology Progress Series 62 185-202
Russ GR 2003 Grazer biomass correlates more strongly with production than with biomass of algal turfs on a coral reef Coral Reefs 22 63-67
Rutzler K 2002 Impact of crustose clionid sponges on Caribbean reef corals Acta Geologica Hispanica 37 61-72
Scheffers SR Nieuwland G Bak RPM amp van Duyl FC 2004 Removal of bacteria and nutrient dynamics within the coral reef framework of Curacao (Netherlands Antilles) Coral Reefs 23 413-422
TRESBP Kirra Reef Marine Biota Monitoring 2015 59
frc environmental
Schlacher-Hoenlinger M Walker S Johnson J Schlacher T amp Hooper J 2009 Biological Monitoring of the Ex-HMAS Brisbane Artificial Reef Phase II - Habitat Values report prepared for Environmental Protection Agency (EPA)
Smith KA 2003 A simple multivariate technique to improve the design of a sampling strategy for age-based fishery monitoring Fisheries Research 64 79-85
Smith S Edwards R Dalton S amp Harrison M 2005 Biological assessment of fish and benthic communities at Palm Beach Bait Reef Gold Coast Queensland report prepared for University of New England
TRESBP 2014 Autum 2009 storms httpwwwtweedsandbypassnswgovauarticles-and-studiesinteresting-itemsautumn-2009-storm updated 4 May 2014 accessed December 2015
TRESBP 2015a Tweed Sand Bypassing Restoring Coastal Sand Drift Improving Boating Access ndash Techinical information httpwwwtweedsandbypassnswgovau__dataassetspdf_file0004552055kir ra-feb-2015pdf acessed December 2015
TRESBP 2015b Waves httpwwwtweedsandbypassnswgovauenvironmental-monitoringcoastal-conditionswaves updated 30 September 2015 accessed December 2015
Umar MJMLJ amp Price IR 1998 Effects of sediment deposition on the seaweed Sargassum on a fringing coral reef Coral Reefs 17 169-177
Underwood AJ amp Kennelly SJ 1990 Ecology of marine algae on rocky shores and subtidal reefs in temperate Australia Hydrobiologia 192 3-20
Walker S Schlacher T amp Schlacher-Hoenlinger M 2007 Spatial heterogeneity of epibenthos on artificial reefs fouling communities in the early stages of colonization on an East Australian shipwreck Marine Ecology 28 435-445
Walker SJ Degnan BM Hooper JNA amp Skilleter GA 2008 Will increased storm intensity from climate change affect biodiversity in non-scleractinian sessile fauna on coral reefs Global Change Biology 14 2755-2770
Warwick RM amp Clarke KR 1993 Increased variability as a symptom of stress in marine communtities Journal of Experimental Marine Biology and Ecology 172 215-216
Thenumberofsitessurveyedhasvariedover timeasaresultof the fluctuating levelof sandcoveringKirraReef
Prior to May 2003 three sites were assessed along the eastern and northern edge of KirraReef(KirraReefOutersites1to3)andthreesiteswereexaminedalongtheinshore marginof the reef (KirraReef Inner sites1 to 3)(MapA1) ReefRedge (ieKirraOuter) siteswerechosentoprovideearlywarningofimpactsfromoffshoreplacementofdredged sandwhilst inshoresites(ieKirraInner)werechosentoindicatewhetherimpactsfrom inshore beach profile development were affecting the reef platform In May 2003 the threeeasternsitesatKirraReef (ieKRO1KRO2andKRI1)werecompletelycovered with bare mobile sand Consequently only the three western sites at Kirra Reef (ie KRO3KRI2andKRI3)supportedbenthicfloraandfaunaInMarch2004theextentof the remainingwesternoutcropof KirraReef had been further reduced so that all inner reefsiteswerecompletelycoveredwithmobilesandConsequentlyonlyasingleoriginal reefsite(ieKRO3)couldbesurveyed(Figure23)Thereforetoprovideanindicationof the condition of the remaining reef two new sites were established (ie KRN1 and KRN2)(Figure23)andsurveyedinMarch2004Theextentofthewesternreefhadbeen further reduced by February 2005 and a third new site (ie KRN3) was established (Figure23)Consequentlyfoursites(KRO3KRN1KRN2andKRN3)weresurveyedin February2005
InFebruary2010fourKirraReefsites(ieKRO3KRO1KRN1andKRN2)wereclearof thesurroundingsandandsupportedbenthic floraand fauna Inaddition several rocks protruded from the sand in the vicinity of site KRI2H these were assessed to provide a quantitativeindicationofbroadRscaletemporalchangestotheinshorereefcommunities
SOURCEScopy Copyright Commonwealth of Australia (Geoscience Australia) 2001 2004 2006copy The State of Queensland (Department of Natural Resources and Mines) 2015copy Nearmap 2014 2015
DATE2015-09-09
DRAWN BYCF
VERSION02
PROJECTIONCoordinate System GDA 1994 MGA Zone 56Projection Transverse MercatorDatum GDA 1994
plusmn SCALE
0 50 100
Metres
Scale 12500 A3
frc environmental
Appendix$B$ Introduction$to$Data$Analysis$Used$
Multivariate$Analyses$
Multivariate statistical techniques are widely used in ecology to assess the similarities relationshipsbetweenassemblagesWhereasunivariateanalysescanonlycompareone variable at a time (eg an index of community structure such as a diversity index or a singleindicatorspecies)multivariateanalysescancomparesamplesbasedontheextent thatassemblagesshareparticulartaxaandabundances(ClarkeampWarwick2001)
Thefirststepofmultivariateanalysisusuallyinvolvesthecreationofamatrixofsimilarity coefficients computed between every pair of samples The coefficient is usually a measureofhowclose theabundance is foreachspecies (definedso that100= total similarity and 0=complete dissimilarity) The Bray Curtis similarity measure is commonlythemostappropriateforbiologicaldata(ClarkeampWarwick2001)
MultidimensionalScaling
NonRmetricmultiRdimensionalscalingordinations(nMDS)attempttoplacesamplesintwo dimensionalspacesothattherankorderofthedistancesbetweensamplesmatchesthe rankorderofthematchingsimilaritiesfromthesimilaritymatrix(ClarkeampWarwick2001) Thisprovidesavisualrepresentationofthesimilaritiesbetweenassemblageswithineach sampleEachoftheaxesisnotrelatedtoanyparticularvalueHinfactaxescanberotated toprovide thebestvisual representationof thedata Ordinationsareparticularlyuseful tools for analysing and visually presenting differences between assemblages Ordinationsareessentiallymapsofsamples inwhich theplacementofsampleson the mapreflectsthesimilarlyofthecommunitytothecommunitiesinothersamples(Clarkeamp Warwick 2001) Distances between samples on an ordination attempt to match the similarities inassemblagestructurenearbypoints representassemblageswithvery few attributes(speciesorabundanceofspecies)Hpoints faraparthavevery fewattributes in common(ClarkeampWarwick2001)
A stress coefficient is calculated to reflect the extent to which the multiRdimensional scalingordinationandthesimilaritymatrixagree(ClarkeampWarwick2001)(iehowwell the multiRdimensional scaling ordination accurately reflects the relationship between samples)Stressvaluesoflt015aregenerallyacceptable
In Figure A1 each freshwater macroinvertebrate sample is represented on the multiRdimensionalscalingordination By lookingat thedistancesbetweeneachsample
ANOSIMisanalogoustoANOVAinunivariatestatistics(Smith2003)AglobalRstatistic iscalculatedtodeterminewhetherthereisasignificantdifferencebetweenallsamplesIf there are differences then pairwise comparisons are conducted to test for differences betweenpairsofsamples(analogoustopostRhoctestsinANOVA)
The R value lies between R1 and +1 (all similarities within groups are less than any similarity between groups) with a value of zero representing the null hypothesis (no differenceamongasetofsamples)(ClarkeampWarwick2001)ComparisonofpairwiseR values can give an indication of how different assemblages are R values close to 0 indicatelittledifferencevaluesaround05indicatesomeoverlapandvaluescloseto1to indicate many or substantial differences In many instances however researches are primarily interestedinwhethertheRvalueisstatisticallydifferentfromzero(usuallyata confidence level of 005) (Clarke amp Warwick 2001) (ie whether they can reject the null hypothesis)
ANOSIM can provide information on whether the (visual) differences between assemblages in the multiRdimensional scaling ordination are significantH it is an independenttestfromthemultiRdimensionalscalingordinationItisbasedontestingthe
TRESBPKirraReefMarineBiotaMonitoring2015 B2
frc environmental
differences between the rank similarities in the similarity matrix not on the distances betweensamplesinthemultiRdimensionalscalingordination(ClarkeampWarwick2001)
PermutationalMultivariateAnalysisofVariance
PERMANOVAisusedtotestsimultaneousresponsesofoneormorevariablestooneor more factors in an a0 priori0 structured design using random permutation of the data to assess significance (Anderson 2004) PERMANOVA generates a pseudo FRstatistic similar to traditional ANOVA but pRvalues are calculated with permutations which does notassumenormaldatadistribution PERMANOVAcanprovide informationonwhether the (visual) differences between assemblages in a multiRdimensional scaling ordination are significantH however it is an independent test from the multiRdimensional scaling ordination
Thelevelofmultivariatedispersionamongsampleswithineachofthetestgroupscanbe examined using the permutational analysis of multivariate dispersions (PERMDISP) routine(Anderson2004)Intraditionalimpactassessmentachangeinthedispersionof datacanalsoindicateanimpact
SimilarityPercentagendashSpeciesContributions
SIMPER analysis provides information on how dissimilar assemblages from various groups are (eg how similar all of the macroinvertebrate samples taken for a particular habitatwithinastreamreachare)andhowsimilareachgroup(egreach)istoanyother group SIMPER analysis also identifies the species taxa that are contributing to the dissimilarity between two assemblages in rank order (ie it identifies which species is contributingthemosttothedifferences)SIMPERanalysismayhelptoidentifypotential lsquoindicatorrsquospeciesForexampleifaparticularspeciesconsistentlycontributesgreatlyto the differences between impacted and unimpacted assemblages it may be a useful indicator Theabundanceofthis indicatorspeciescanthenbecomparedbetweensites usingunivariatetechniquessuchasANOVA
Data is available on request from tresbpprojectofficecrownlandnswgov
TRESBPKirraReefMarineBiotaMonitoring2015 C1
frc environmental
Appendix(D( Pairwise( PERMANOVA( Results
Data is available on request from tresbpprojectofficecrownlandnswgov
TRESBPKirraReefMarineBiotaMonitoring2015 D1
frc environmental
Appendix(E( Relative(Abundance(of(Fish(found(at(Kirra(( ( and(Palm(Beach(Reefs(in(Each(Survey((Data is available on request from tresbpprojectofficecrownlandnswgovau
TRESBPKirraReefMarineBiotaMonitoring2015 E1
Structure Bookmarks
0 50 100 Metres Scale 12500 A3
0 50 100 200 Metres Scale 15000 A3
Kirra Reef
Kirra Reef
Kirra Reef
Kirra Reef
Kirra Reef
Kirra Reef
Map A1Location of Kirra Reef monitoring sites
Table D8 Pairwise comparison of macroalgae cover between sites in each year
Table D15 Pairwise comparison of turf algae cover between sites in each year
Table D29 Pairwise comparison of ascidian cover between sites in each year
Table D43 Pairwise comparison of soft coral cover between sites in each year
frc environmental
34$ Fish$
The species richness of fish recorded from Kirra Reef across all monitoring events has rangedfrom14to57 InMarch201557specieswereidentifiedat thereefwhichwas similar to April 2014 (53) and higher than previous surveys (Figure 320) Species richnessatPalmBeachReefwas lower(34species)andgenerallyvaried lessbetween surveyscomparedtoKirraReef
InMarch2015 the assemblage of fish at KirraReef comprised species fromall trophic levelsincludingdetritivoresplanktivoresherbivoresandcarnivores(AppendixE)Asin previous surveys the assemblage was dominated by herbivores and planktivores Yellowtail (Trachurus0 novaezelandiae) and striped sea pike (Sphyraena0 obtusata) were the dominant species present in large schools (Figure 321) Australian mado (Atypichthys0 strigatus) ringRtailed surgeon (Acanthurus0 blochii) silver trevally (Pseudocaranx0 georgianus) eastern pomfred (Schuettea0 scalaripinnis) sweep (Scorpis0 lineolatus) and various wrasses were also very abundant releative to other species (AppendixE)
Two new species were observed at Kirra Reef the orangeRband surgeon (Acanthurus0 olivaceus) and the unicornfish (Naso0 sp) Five new species were recorded at Palm BeachReef
No threatened or protected fish species listed under the Queenslandrsquos Nature0 Conservation0Act01992ornationallyundertheEnvironmental0Protection0and0Biodiversity0 Conservation0 Act0 1999 were observed The complete list of species recorded and the relativeabundanceispresentedinAppendixE
TRESBPKirraReefMarineBiotaMonitoring2015 42
60
0
10
20
30
40
50
Num
ber
of F
ish
Spe
cies
Apr-95
Jun-95
Feb-96
Jan-01
May-03
Mar-04
Feb-05
Feb-10
Jul-12
Apr-14
Mar-15
Kirra Reef Palm Beach Reef Location
frc environmental
Figure320 Number of fish species recorded at Kirra Reef and Palm Beach Reef on
ThegreatestchangetotheecologicalconditionofKirraReefsincethebaselinesurveyin 1995 has been the loss of large areas of hard substrate that support benthic flora and faunaThedeliveryoflargesandvolumesduringthestage1dredgingoperations(1995 to1998)andtheinitialoperationofthesandbypasssystem(2001to2008)resultedinan increaseinwaveactionandtidalcurrentsredistributingthissandoverKirraReef
The three major outcrops of Kirra Reef (northern southern and eastern sections) are naturally exposed and covered depending on water and sand movements In March 2015 the rocky outcrops in the northern section of Kirra Reef were exposed and supportedamoderatelydiversebenthicassemblagedominatedbyturfalgaeTherewas arelativelyhighfishdiversityatKirraReefTheecologicalassemblageexhibitedsignsof ongoingstressfromphysicaldisturbanceincludingtheabsenceofsoftcoralsandrarityof hardcoral(MumbyampSteneck2008)HoweverKirraReefhasarelativelyhighcoverof sponges and ascidians Sponges ascidians and crinoids were more abundant at Kirra ReefthanatPalmBeachReefinMarch2015
KirraReefcontinues toprovidehabitatandsupport importantecological functions in the region providing hard substrate for the colonisation of algae and benthic invertebrates and food and refuge for fish As sand levels have stabilised since 2008 assemblages have becomemoresimilar to those recordedprior to implementationof the TRESBP in April1995 Forexamplemacroalgalcover inApril1995andMarch2015wasrelatively similarHoweverassemblagecompositionisstillsignificantlydifferenttothatrecordedin thebaselinesurveysmostnoticeablyduetoa lowercoverofbaresubstrateandhigher coverofturfalgaeandascidianssincesurveyshavebeenperformed
Benthic$Macroalgae$
The cover of macroalgae at Kirra Reef was relatively similar during the 2014 and 2015 surveys and remained well below the peak of nearly 60 cover recorded in January 2001TherewasasteepdeclineinthecoverofmacroalgaebetweenJanuary2001and May2003whichappearedtobestronglyassociatedwith thedecline inreefareaduring that time as well as a decline in the cover of Sargassum sp (an important indicator speciesonKirraReef) SimilardeclineswereevidentatPalmBeachReefbetween the January2001andMay2003surveys
TRESBPKirraReefMarineBiotaMonitoring2015 45
frc environmental
The cover ofmacroalgae at Palm Beach Reef was much lower thanat Kirra Reef over time There are several possible reasons for the lower cover of macroalgae at Palm Beach
sdot PalmBeachReefisdeeperthanKirraReefandgenerallyhashigherturbidityand therefore greater light attenuation The quantity and quality of available light affectsthedistributionandgrowthofmacroalgae(MillerampEtter2008)
sdot Differences in the pattern of recruitment of algal species to the reefs due to differentwatercurrentsandtimingofthesurveys(Kennelly1987b)
sdot Increased competition with turf algae and sessile benthic invertebrates which competeforspacewithmacroalgae(Kennelly1987aHMillerampEtter2008)
sdot PresenceofdifferentspeciesandhigherdensityofherbivoresatPalmBeachReef (particularly sea urchins and herbivorous fish) which graze on macroalgae (McCook1997HJompaampMcCook2002)
Biological assemblages exposed to physical stress typically exhibit greater levels of temporalandspatialvariability(WarwickampClarke1993HChapmanetal1995)Temporal variationinthecoverofmacroalgaeatKirraReefislikelytobeprincipallyduetotheeffect ofphysicaldisturbance fromwaveactionaswellas theassociatedassociatedabrasion andsmotheringbysandTheeffectsofthesephysicaldisturbanceswouldincreasewith thereductionofKirraReefasedgeeffectsarepronouncedandwaterdepth isreduced Increasedsmotheringbysandcanalsoreducediversity(Hatcheretal1989)abundance recruitment growth survival and seasonal regeneration of macroalgae (Umar amp Price 1998HCheshireetal1999)
Changes in the cover of macroalgae on Kirra Reef over time are also likely due to the extentofthereefchangingHthefishandmobileinvertbratesassociatedwiththereefmay have concentrated which would in turn increase grazing pressure Increased grazing pressure from fish and mobile invertebrates can reduce the coverage and diversity of macroalgaeonreefs(McCook1997HJompaampMcCook2002)
Thecoverof turfalgaeatbothKirraReefandPalmBeachReefhasvariedsignificantly betweensurveysPriorto2005turfalgaetypicallycoveredlessoftheavailablesurface areaonKirraReefthanPalmBeachReefInMarch2015themeancoverofturfalgae hasincreasedsincebaselinesurveysin1995andwasrelativelysimilarbetweenreefs(40 plusmn4atKirraReefcomparedto48plusmn4atPalmBeachReef)Thecoverofturfalgaeat Kirra Reef was similar in 2014 and 2015 which was generally higher than previous surveysexceptduringJuly2012whencoverofturfalgaepeakedat67plusmn4
TRESBPKirraReefMarineBiotaMonitoring2015 46
frc environmental
Turfalgaearebecomingadominantcomponentofcommunitiesaroundtheworld likely the result of rapid colonisation of openspace after a disturbance (eg storms) nutrient enrichment andor changes in grazing pressures Turf algae can also reflect a more physically robust growth form suited to high wave energy environments (than foliose macroRalgae)TurfalgaepeakedintheJuly2012surveylikelyrelatedtotheincreasein bare reef exposure following a stormy conditions in early 2009 and between December 2011 and June 2012 Turf algae have been the dominant form of algae on Kirra Reef sincethistimealbeitthecoverlowerthanthe2012survey
Increased cover of turf algae is typically related to good light conditions high concentrationsofnutrientsandlownumbersofgrazerssuchasfish(orconstantgrazing pressure preventing macroalgae colonisation) However the relationship between algal dynamics physical disturbance water quality and herbivore grazing activity is complex andthecoverof turfalgaecanexhibitextremetemporalvariabilityasaconsequenceof the interactionbetween topRdownandbottomRupprocesses (Russ2003HBellwoodetal 2006H Hughes et al 2007H Albert et al 2008H Hoey amp Bellwood 2008H Mumby 2009) Furtherinvestigationwouldberequiredtoreliablydeterminethemechanismsofchangein bothmacroalgaeandturfalgaeassemblagesonthesereefs
Benthic$Macroinvertebrates$
AtKirraReeftheburialandreRemergenceofrockyoutcrops(influencedbytheTRESBP) islikelytohaveincreasedtemporalvariabilityinthedistributionandabundanceofbenthic macroinvertebrates Additional perturbations such as wave action and sand abrasion (each influenced through changes in bathymetry seabed topography and water depth) are likely to have resulted in the decline in cover and diversity of the benthic macroinvertebratesatKirraReefbetweensurveysparticularlybetweenMarch2004and February2005andduringtheseverestormsof2009Benthicmacroinvertebratessuch asascidiansspongeshardcoralandsoftcoralarehighlysusceptible to theeffectsof stormandwavedisturbancephysicalabrasionandburialbysand(KayampKeough1981H Walker et al 2008) which can affect settlement growth rate and survival (Dodge amp Vaisnys1977HRogers1990)
Physical disturbance from sand burial sand abrasion and the action of storm waves appeartokeepthebenthicassemblagesofKirraReefinastateofearlysuccessionItis commonforearlypioneerspeciessuchassomemacroalgaetorecruitrapidlytoahard surface in large numbers allowing these species to dominate assemblages early in the successionaltrajectory(Walkeretal2007)
Afurther indicatorof theearlystateofsuccessionatKirraReef isthatthecoverofhard and soft coral has remained very low (generally lt 5) In March 2015 less than 1
Benthic macroinvertebrate cover may also be affected indirectly through increased competitionwithmacroalgaeforspaceThepresenceoflargemacroalgaecanaffectthe recruitment and survival of sessile benthic invertebrates as fronds moving with wave action sweep and abrade the surface of rocks killing new recruits especially corals (Kennelly1989HMcCooketal2001)Itcantakeseveralyearsforhardandsoftcoralto become dominant on reefs in the SEQ region (SchlacherRHoenlinger et al 2009) Therefore hard coral is not expected to become abundant until several years after the reefhasbeenuncoveredandonlyifthephysicaldisturbanceregimeandsupplyofnew recruitsissufficienttosupportsurvivalandgenerationalsuccessionofthesespeciesThe coverofhardandsoftcoralsatKirraReefwerebothverylowandpatchypriortothestart oftheTRESBP
Sponges and ascidians are highly susceptible to smothering and sand abrasion unless theyhaveathicktunic(outercoveringmadeofkeratin)liketheascidianP0stolonifera0or strong internal keratin silicon or calcareous structures in the case of some species of sponges0(KayampKeough1981HMcGuinness1987HWalkeretal2008)Duetoincreased wave action and sedimentation (which can be influenced by the TRESBP) the mean coverofascidiansandspongeswasexpectedtobemuchloweronKirraReefthanPalm Beach Reef However in March 2015 the cover of sponges was similar between the reefsandthecoverofascidians(otherthanP0stolonifera)wasgreateratKirraReefthan at Palm Beach Reef This suggests that Kirra Reef is slowly recovering from the increasedstressofphysicaldisturbancesuchas increasedwaveactionandsandscour andorthatwaveandstormconditionshavebeenlesssevereinthepastfewyears
Fish$
KirraReefcontinuestosupportahighdiversityofreefRassociatedandpelagic(ienonR reefassociated) fishspecies Despite itsdiminishedsizecompared to1995KirraReef continuestoprovidevaluablehabitatforanumberoffishspeciesfromdifferentfunctional groups
ThereisahighdegreeofinterRannualvariabilityinthespeciesandabundanceofthefish present at Kirra Reef compared with the assemblage at Palm Beach Reef This likely reflectsthetemporalvariabilityintheavailablehabitatasaconsequenceofreefburialand reRemergenceThediversityqualityandarealextentofreefhabitatareimportantfactors influencing the distribution abundance biomass and diversity of reef fish (Bellwood amp Hughes2001HFriedlanderetal2003)Diversityandabundanceoffishcanincreasewith
TRESBPKirraReefMarineBiotaMonitoring2015 48
frc environmental
greaterstructuralcomplexityandincreasedheterogeneityofavailablehabitats(Bellwood ampHughes2001)Thissuggeststhatperiodsofreefburialreducetheoveralldiversityof reefRassociated fish species at Kirra Reef Despite the reduction in overall reef space therewasalargervarietyofhabitats(suchasmarcoalgaeandturfalgae)in2015which was likely to be related to the high diversity of fish assemblages This is particularly importantforseveralspeciesthatdependonthepresenceoflsquostructurersquosuchasprovided by reef habitat (ie oldwife moray eels damselfish and Australian mado that were recordedinMarch2015butwerenotrecordedinJuly2012)
Theabundanceanddiversityof fishare likelytobenegativelyaffectedfollowingperiods of severe weather which create unfavourable conditions for many species and may further exacerbate the affects of abrasion and sedimentation The biomass of fish is knowntodecreasewithincreasingexposuretophysicaldisturbancefromwaveactionand strong currents (Friedlander et al 2003) As our surveys have been undertaken at different times of the year variation in the prevailing conditions at the time of sampling could also influence the types of fish observed (and the amount of reef habitat that is availableatanytime)Manyofthespeciesmayalsobeaffectedbyseasonalchangesin the water temperature such as damselfish which are less abundant in cool waters However theoveralldiversityof the fishassemblageatKirraReef is likely toreflect the sizeoftheoutcropsexposedwithagreaterphysicaldisturbance(fromseaconditionsand sandmovement)andcompetitionHandlesserfoodavailablewhenthereefiscovered
ThepredictedimpactstoKirraReefasaresultoftheTRESBPincludedaccretionofsand around the base of the rock outcrops causing a reduction in extent of reef It was predictedthatsanddeliveryaspartoftheprojectwouldeventuallymimiclsquonaturalrsquopatterns ofsanddispersalandthatthereefwouldreturntoitsnaturalextent(ietheextentpriorto extension of the Tweed River training walls in 1962) The benthic flora and fauna assemblages of the reef the historical reef extent and natural sand transport patterns wereexpectedtoreturntoconditionsobservedbeforetheextensionofthetrainingwalls between 1962 and 1965 However the Environmental Impact Study did not predict the ecologicalconsequencesofboththereducedarealextentandincreasedwaveenergy(a consequenceofdecreaseddepth)thathavebeenrecorded
ThecurrentextentofKirraReef remains less than50of that recorded in1962and in 1995beforethesanddeliverybytheTRESBPcommencedHowevertheextentofreef in1995 wasstrongly influenced by adepletion in sand following the construction of the Tweed River training walls and the Kirra Point groyne Accumulation of sand on Kirra ReefwasobservedtoincreaseasaresultofindirectsandnourishmentbytheTRESBP and the reef has been extensively covered (particuarly between 2005 and 2010) as a result
Whiletheextentofthereefcontinuestochangeovertimethedeliveryofsandaspartof the project now more closely matches the natural rate of longshore sand transport ShortRtermandseasonalchangesintheextentofthereefarenowlikelytobetheresultof waveandcurrentaction(particularlyduringservereweatherevents)thanadirectimpact of the TRESBP Therefore the extent of Kirra Reef in March 2015 is broadly in accordancewithpredictionsmadeintheEISwhichpredictedthatthereefwouldreturnto a condition similar to that exhibited in the preR1960rsquos ie before the extension of the TweedRiverbreakwatersthatinterruptedlittoralsandsupplytothesebeaches
InDecember2013KirraPointgroynewasextendedby30mwiththeexpectationthatthe beach bar would move seaward as a consequence At present Kirra Point groyne is unlikelytohavehadamajorimpactonthearealextentofKirraReefHoweverongoing monitoringbasedonaerialphotographsmayprovidefurtherinsight
Sessile benthic assemblages on Kirra Reef are highly susceptible to the influence of storms and associated wave action (Kay amp Keough 1981H Walker et al 2008) The shallowreefissurroundedbymobilesandwhichcanshiftnaturallyinresponsetowave action during storms causing burial of large sections of Kirra Reef This effect has reduced the availability of rocky substrate for colonisation and the availability of refuge
Fromanexaminationof theextentofKirraReef fromarealmapsandwaveheightdata thereappears tobea relationshipbetween theareaof rockexposedandstormevents Notably in a series of storm events in May 2009 corresponds with large areas of rock becoming exposed (with the reef approximately 100m2 in 2006 and approximately in 1009m2 2009) Further a stormy conditions between December 2011 and July 2012 correspondstotheareaofexposedrockmorethandoublinginsizeWhiletherewasno changetothetotalareaofexposedrockfollowingstormyconditionsinearly2013there wasaclearchangeinthedistibutionofexposedrockduringthistimeSince2013storm conditions have been calm to moderate and there has been little change in the areal extentanddistrubtionofexposedrockatKirraReef
WaveheighttypicallyincreasesduringstormeventsandgiventheshallowdepthofKirra Reef waves are more likely to shoal and break across the reef during storms This increases thephysicaldisturbanceabrasionandsedimentationofbenthicassemblages onKirraReefStormdisturbancecancauselocalreductionsinthespeciesrichnessand abundanceofcoral(Woodleyetal1981HMasselampDone1993HHughes1994HConnellet al 1997) and can alter fish assemblages indirectly through habitat modifications (Kaufman1983HJonesampSyms1998)ordirectlybyincreasingfishmortality(Lassig1983) The hydrodynamic forces produced by wave action are an important source of disturbance in subtidal habitats inflicting damage through direct physical impact and abrasion(UnderwoodampKennelly1990)DirectimpactsfromphysicaldisturbanceatKirra Reefareevidentduringsurveyeventswhenlargefragmentsofmacroalgaearepresentin thewatercolumnoverthereef
Storm and wave action (and associated sedimentation and abrasion) continue to be importantforcesshapingthedistributionandabundanceofbenthicspeciesatKirraReef Increased magnitude and frequency of physical disturbance resulting from increased exposureorsusceptibility tostormsandassociatedwaveaction (asonKirraReef)can lead to a decrease in the diversity of sessile invertebrate assemblages DisturbanceR drivenreductionsinbiodiversityhavethepotentialtoimpactnegativelyonthehealthand productivity of reef ecosystems (Walker et al 2008) Biodiversity is important to reef health given that many of these species (eg sponges bryozoans and ascidians) contribute a range of vital ecosystem services to reefs including nutrient cycling (Scheffers et al 2004) trophic interactions and food webs (Lesser 2006H Pawlik et al 2007) bioRerosion (Rutzler 2002H LopezRVictoria et al 2006) and stabilizing substrata (DiazampRutzler2001HWulff2001)
Theimpactsof increasedwaveactionandsedimentationonthebenthicassemblagesat Kirra Reef are likely to be greatest during and immediately following storm conditions
TRESBPKirraReefMarineBiotaMonitoring2015 51
frc environmental
Partitioningtheinfluenceofstormandwavedrivendisturbancefromthatoftheoperation oftheTRESBPwouldrequireamuchmorestatisticallypowerfulandtemporilyreplicated experimental design Given there is a large collection of wave and storm data by TRESBP this would involve greater temporal sampling of Kirra Reef including event samplingfollowingseverewaveandstormactivity
The data generated by this Kirra Reef biota monitoring program doesnrsquot support statistically rigorous consideration of seasonality (monitoring has been at its most frequentannual)
InApril2014andMarch2015KirraReefcoveredlessthan50ofthereefrsquosextentprior to theoperationof theTRESBP The lossof reefhabitathasreducedtheavailabilityof hard substratum available for colonisation and consequently the abundance of benthic sessileassemblages
The reduced depth of water resulting from the accumulation of sand exacerbates the effects of storms and wave action It is likley that as a consequnece the biological communities of Kirra Reef will reflect earlyRstage succession more frequently and for longerperiods
While there is sufficient structure available frcenvironmentalexpect that Kirra Reef will continuetoprovideimportanthabitatforadiverseassemblageoffishes
TRESBPKirraReefMarineBiotaMonitoring2015 52
frc environmental
5$ Conclusions$
Although there is still a substantial portion of the reef covered compared to before the extension of the Tweed River entrance breakwaters the current extent of Kirra Reef is broadly inaccordancewithpredictionsmadein theEIS Initial lsquocatchRuprsquobypassingand dredgeplacementofsand(between2001and2008)resulted in theburialofKirraReef Subsequentsanddelivery(since2008onwards)morecloselyreflectsnaturalpatternsof longRshoresandtransportandisthereefhasslowlyreRemerged
Theextentofthereefhasbeenrelativelystablesince2013Thishasallowedforsome succession in the benthic assemblages including a relatively high cover of sponges ascidiansandcrinoidsWiththedeliveryofsandmorecloselymatchingthenaturalrateit isexpected the reef willundergoshortRtermchanges in extentdue toseasonal shifts in sand deliveryH however the diversity of benthic assemblages on Kirra Reef is likely to increaseovertimeThiswouldcreatemorespaceforspeciestorecruitandreducesthe influence of sand abrasion and wave damage It was predicted that the areas of Kirra Reef newly exposed in 2012 would undergo a shift from turfRdominated communities to more diverse communities that could include macroalgae sponges ascidians and potentiallyhardandsoftcoralWiththeexceptionofhardandsoftcoralsthisprediction wasconfirmedbytheresultsoftheApril2014andMarch2015surveys
ThediversityoffishesassociatedwithKirraReefisbroadlysimilartothatrecordedprior tothecommencementofsandbypassingin1995Giventhatfisharemobilethegreatest impacts on fish assemblages are likely to be shortRterm changes due to both the prevailingconditionsandchangestheextentofavailablehabitatthatprovidesshelterand foodforavarietyofdifferentspeciesIfKirraReefincreasesinsizethereislikelytobea greater proportion of cryptic benthic species as these species are more typical of assemblagesinalaterstageofsuccession(eg(WillisampAnderson2003))
Assuming a broadly stable delivery rate of sand and consequent stable extent of Kirra ReeflsquorecoveryrsquoislikleytobesubstantivelycompleteFloralandfaunalcommunitieswill undergo succession between severe storm events but are likley to remain relatively dynamic
Albert S Udy J amp Tibbetts I 2008 Responses of algal communities to gradients in herbivorebiomassandwaterqualityinMarovoLagoonSolomonIslandsCoral0 Reefs2773R82
Anderson MJ 2001 A new method for nonRparametric multivariate analysis of varianceAustral0Ecology2632R46
Anderson MJ 2004 PERMDISP0 a0 FORTRAN0 computer0 program0 for0 permutatinoal0 analysis0 of0 multivariate0 dispersions0 (for0 any0 twoSfactor0 ANOVA0 design)0 using0 permutational0 tests Department of Statistics University of Auckland New Zealand
Cannon LR Goeden GB amp Campbell P 1987 Community patterns revealed by trawling in the interRreef regions of the Great Barrier Reef Memoirs0 of0 the0 Queensland0Museum2545R70
Chapman MG Underwood AJ amp Skilleter GA 1995 Variability at different spatial scalesbetweenasubtidalassemblageexposedtothedischargeofsewageand two control assemblages Journal0 of0 Experimental0 Biology0 and0 Ecology 189 103R122
Cheshire AC Miller DJ amp Stewart R (1999) Effect0 of0 dispersed0 sediment0 plumes0 from0beach0sand0replenishment0dredging0on0recruitment0of0phaeophycean0algae0 to0rocky0reefs0in0Gulf0St0Vincent0South0Australia0The0Impact0of0Sand0Dredging0 on0 Benthic0 Community0 Structure0 at0 the0 Port0 Stanvac0 Dredge0 Site0 20 1S39 UniversityofAdelaideAdelaide
ConnellJHHughesTPampWallaceCC1997A30Ryearstudyofcoralabundance recruitment and disturbance at several scales in space and time Ecological0 Monographs67461R488
Diaz MC amp Rutzler K 2001 Sponges an essential component of Caribbean coral reefsBulletin0of0Marine0Science69535R546
DodgeREampVaisnysJR1977Coralpopulationsandgrowthpatternsresponsesto sedimentation and turbidity associated with dredging Journal0 of0 Marine0 Research35715R730
Done TJ 1982 Patterns in the distribution of coral communities across the central GreatBarrierReefCoral0Reefs195R107
Edwards RA amp Smith DA 2005 Subtidal assemblages associated with a geotextile reef insouthReastQueenslandAustraliaMarine0and0Freshwater0Research56 133R142
FisheriesResearchConsultants1991Survey0of0the0Intertidal0and0Subtidal0Rocky0Reefs0 of0 the0 Sunshine0 Coast report prepared for Queensland National Parks and WildlifeService
HarrisonPHarriotVBanksSampHolmesN1998ThecoralcommunitiesofFlinders Reef andMyora Reef in theMoretonBay MarineParkQueensland Australia In Moreton0 Bay0 and0 Catchment Tibbits I Hall N amp Dennison W (Eds) SchoolofMarineScienceUniversityofQueenslandStLuciapp525R536
Hatcher B Johannes R amp Robertson A 1989 Review of research relevant to the conservationofshallowtropicalmarineecosystemsOceanography0and0Marine0 Biology0an0Annual0Review27337R414
Hoey A amp Bellwood D 2008 CrossRshelf variation in the role of parrotfishes on the GreatBarrierReefCoral0Reefs37R47
TRESBPKirraReefMarineBiotaMonitoring2015 56
frc environmental
Hollingsworth P 1975 Environmental Investigation Report Crown Reserve R R68 Currumbin Creek City of the Gold Coast Land Administration Commission unpublishedreport
Hughes TP 1994 Catastrophes phase shifts and large scale degradation of a CaribbeancoralreefScience2651547R1551
Hughes TP Rodrigues MJ Bellwood DR Ceccarelli D HoeghRGuldberg O McCook L Moltschaniwskvi N Pratchett MS Steneck RS amp Willis B 2007Phaseshiftsherbivoryandtheresilienceofcoralreefstoclimatechange Current0Biology17360R365
Hutchinson A Rempel C Taveras V Loder J amp Salmond J 2013 Reef0 Check0 Australia0 South0 East0 Queensland0 Summary0 Report0 2013 report prepared for ReefCheckFoundationLimited
Hyder Consulting 1997 Tweed0 River0 Entrance0 Sand0 Bypassing0 Project0 Permanent0 Bypassing0 System0 0 Environmental0 Impact0 Statement0 0 Impact0 Assessment0 Study report prepared for New South Wales Department of Land and Water Conservation
Jompa J amp McCook LJ 2002 Effects of competition and herbivory on interactions betweenahardcoralandabrownalgaJournal0of0Experimental0Marine0Biology0 and0Ecology27125R39
KayAMampKeoughMJ1981Occupationofpatchesintheepifaunalcommunitieson pier pilings and the bivalve Pinna bicolor at Edithburgh South Australia Oecologia48123R130
KennellyS1987aInhibitionofkelprecruitmentbyturfingalgaeandconsequencesfor an Australian kelp community Journal0 of0 Experimental0 Marine0 Biology0 and0 Ecology11249R60
Kennelly S 1987b Physical disturbances in an Australian kelp community I temporal effectsMarine0Ecology0Progress0Series40145R153
TRESBPKirraReefMarineBiotaMonitoring2015 57
frc environmental
Kennelly S 1989 Effects of kelp canopies on understory species due to shade and scourMarine0Ecology0Progress0Series50215R224
Lassig BR 1983 The effects of a cyclonic storm on coral reef fish assemblages Environmental0Biology0of0Fishes955R63
Lawson S McMahon J amp Boswood P 2001 Environmental management of the construction and operation of a sand bypassing system at the Tweed River EntranceInThe15thAustralasianCoastalandOceanEngineeringConference the 8th Australasian Port and Harbour Conference 25 R 28 September 2001 QueenslandAustralia
Lesser MP 2006 BenthicRpelagic coupling on coral reefs feeding and growth of Caribbean sponges Journal0 of0 Experimental0 Marine0 Biology0 amp0 Ecology 328 277R288
LopezRVictoriaM ZeaSampWei E2006 Competition for spacebetweenencrusting excavatingCaribbeanspongesandothercoral reeforganismsMarine0Ecology0 Progress0Series312113R121
MalcolmHASmithSDAampJordanA2009Usingpatternsofreeffishassemblages to refine a Habitat Classification System for marine parks in NSW Australia Aquatic0Conservation0Marine0and0Freshwater0Ecosystems2083R92
Massel SR amp Done TJ 1993 Effects of cyclone waves on massive coral assemblages on the Great Barrier Reef meteorology hydrodynamics and demographyCoral0Reefs12153R166
Mumby PJ amp Steneck RS 2008 Coral reef management and conservation in light of rapidly evolving ecological paradigms Trends in Ecology amp Evoution 23 555 -563
Murphy HM amp Jenkins GP 2010 Observational methods used in marine spatial monitoring of fishes and associated habitats a review Marine and Freshwater Research 61 236-252
Noriega R 2007 An Overview of Available Information on Sandy Beach Ecology Coastal Sand Dunes Rocky Reefs and Associated Biota on the Gold Coast Griffith Centre for Coastal Management Research Report No 85 report prepared for Griffith University
Parker P (1995) Structure to Reef Fish Assemblages at Julian Rocks Northern New South Wales Masters Thesis Griffith University
Parker PG 1999 Fish assemblages at Julian Rocks and the adjacent waters of northern New South Wales Australia Australian Zoologist 31 134 - 160
Pawlik JR Steindler L Henkel TP Beer S amp Ilan M 2007 Chemical warfare on coral reefs sponge metabolites differentially affect coral symbiosis in situ Limnology and Oceanography 52 907-911
Reef Check 2010 httpwwwreefcheckaustraliaorgdatahtml accessed December 2015
Robinson KI amp Pollard DA 1982 Marine and estuarine reserves in Australia with particular reference to New South Wales Wetlands 2 17 - 26
Rogers CS 1990 Responses of coral reefs and reef organisms to sedimentation Marine Ecology Progress Series 62 185-202
Russ GR 2003 Grazer biomass correlates more strongly with production than with biomass of algal turfs on a coral reef Coral Reefs 22 63-67
Rutzler K 2002 Impact of crustose clionid sponges on Caribbean reef corals Acta Geologica Hispanica 37 61-72
Scheffers SR Nieuwland G Bak RPM amp van Duyl FC 2004 Removal of bacteria and nutrient dynamics within the coral reef framework of Curacao (Netherlands Antilles) Coral Reefs 23 413-422
TRESBP Kirra Reef Marine Biota Monitoring 2015 59
frc environmental
Schlacher-Hoenlinger M Walker S Johnson J Schlacher T amp Hooper J 2009 Biological Monitoring of the Ex-HMAS Brisbane Artificial Reef Phase II - Habitat Values report prepared for Environmental Protection Agency (EPA)
Smith KA 2003 A simple multivariate technique to improve the design of a sampling strategy for age-based fishery monitoring Fisheries Research 64 79-85
Smith S Edwards R Dalton S amp Harrison M 2005 Biological assessment of fish and benthic communities at Palm Beach Bait Reef Gold Coast Queensland report prepared for University of New England
TRESBP 2014 Autum 2009 storms httpwwwtweedsandbypassnswgovauarticles-and-studiesinteresting-itemsautumn-2009-storm updated 4 May 2014 accessed December 2015
TRESBP 2015a Tweed Sand Bypassing Restoring Coastal Sand Drift Improving Boating Access ndash Techinical information httpwwwtweedsandbypassnswgovau__dataassetspdf_file0004552055kir ra-feb-2015pdf acessed December 2015
TRESBP 2015b Waves httpwwwtweedsandbypassnswgovauenvironmental-monitoringcoastal-conditionswaves updated 30 September 2015 accessed December 2015
Umar MJMLJ amp Price IR 1998 Effects of sediment deposition on the seaweed Sargassum on a fringing coral reef Coral Reefs 17 169-177
Underwood AJ amp Kennelly SJ 1990 Ecology of marine algae on rocky shores and subtidal reefs in temperate Australia Hydrobiologia 192 3-20
Walker S Schlacher T amp Schlacher-Hoenlinger M 2007 Spatial heterogeneity of epibenthos on artificial reefs fouling communities in the early stages of colonization on an East Australian shipwreck Marine Ecology 28 435-445
Walker SJ Degnan BM Hooper JNA amp Skilleter GA 2008 Will increased storm intensity from climate change affect biodiversity in non-scleractinian sessile fauna on coral reefs Global Change Biology 14 2755-2770
Warwick RM amp Clarke KR 1993 Increased variability as a symptom of stress in marine communtities Journal of Experimental Marine Biology and Ecology 172 215-216
Thenumberofsitessurveyedhasvariedover timeasaresultof the fluctuating levelof sandcoveringKirraReef
Prior to May 2003 three sites were assessed along the eastern and northern edge of KirraReef(KirraReefOutersites1to3)andthreesiteswereexaminedalongtheinshore marginof the reef (KirraReef Inner sites1 to 3)(MapA1) ReefRedge (ieKirraOuter) siteswerechosentoprovideearlywarningofimpactsfromoffshoreplacementofdredged sandwhilst inshoresites(ieKirraInner)werechosentoindicatewhetherimpactsfrom inshore beach profile development were affecting the reef platform In May 2003 the threeeasternsitesatKirraReef (ieKRO1KRO2andKRI1)werecompletelycovered with bare mobile sand Consequently only the three western sites at Kirra Reef (ie KRO3KRI2andKRI3)supportedbenthicfloraandfaunaInMarch2004theextentof the remainingwesternoutcropof KirraReef had been further reduced so that all inner reefsiteswerecompletelycoveredwithmobilesandConsequentlyonlyasingleoriginal reefsite(ieKRO3)couldbesurveyed(Figure23)Thereforetoprovideanindicationof the condition of the remaining reef two new sites were established (ie KRN1 and KRN2)(Figure23)andsurveyedinMarch2004Theextentofthewesternreefhadbeen further reduced by February 2005 and a third new site (ie KRN3) was established (Figure23)Consequentlyfoursites(KRO3KRN1KRN2andKRN3)weresurveyedin February2005
InFebruary2010fourKirraReefsites(ieKRO3KRO1KRN1andKRN2)wereclearof thesurroundingsandandsupportedbenthic floraand fauna Inaddition several rocks protruded from the sand in the vicinity of site KRI2H these were assessed to provide a quantitativeindicationofbroadRscaletemporalchangestotheinshorereefcommunities
SOURCEScopy Copyright Commonwealth of Australia (Geoscience Australia) 2001 2004 2006copy The State of Queensland (Department of Natural Resources and Mines) 2015copy Nearmap 2014 2015
DATE2015-09-09
DRAWN BYCF
VERSION02
PROJECTIONCoordinate System GDA 1994 MGA Zone 56Projection Transverse MercatorDatum GDA 1994
plusmn SCALE
0 50 100
Metres
Scale 12500 A3
frc environmental
Appendix$B$ Introduction$to$Data$Analysis$Used$
Multivariate$Analyses$
Multivariate statistical techniques are widely used in ecology to assess the similarities relationshipsbetweenassemblagesWhereasunivariateanalysescanonlycompareone variable at a time (eg an index of community structure such as a diversity index or a singleindicatorspecies)multivariateanalysescancomparesamplesbasedontheextent thatassemblagesshareparticulartaxaandabundances(ClarkeampWarwick2001)
Thefirststepofmultivariateanalysisusuallyinvolvesthecreationofamatrixofsimilarity coefficients computed between every pair of samples The coefficient is usually a measureofhowclose theabundance is foreachspecies (definedso that100= total similarity and 0=complete dissimilarity) The Bray Curtis similarity measure is commonlythemostappropriateforbiologicaldata(ClarkeampWarwick2001)
MultidimensionalScaling
NonRmetricmultiRdimensionalscalingordinations(nMDS)attempttoplacesamplesintwo dimensionalspacesothattherankorderofthedistancesbetweensamplesmatchesthe rankorderofthematchingsimilaritiesfromthesimilaritymatrix(ClarkeampWarwick2001) Thisprovidesavisualrepresentationofthesimilaritiesbetweenassemblageswithineach sampleEachoftheaxesisnotrelatedtoanyparticularvalueHinfactaxescanberotated toprovide thebestvisual representationof thedata Ordinationsareparticularlyuseful tools for analysing and visually presenting differences between assemblages Ordinationsareessentiallymapsofsamples inwhich theplacementofsampleson the mapreflectsthesimilarlyofthecommunitytothecommunitiesinothersamples(Clarkeamp Warwick 2001) Distances between samples on an ordination attempt to match the similarities inassemblagestructurenearbypoints representassemblageswithvery few attributes(speciesorabundanceofspecies)Hpoints faraparthavevery fewattributes in common(ClarkeampWarwick2001)
A stress coefficient is calculated to reflect the extent to which the multiRdimensional scalingordinationandthesimilaritymatrixagree(ClarkeampWarwick2001)(iehowwell the multiRdimensional scaling ordination accurately reflects the relationship between samples)Stressvaluesoflt015aregenerallyacceptable
In Figure A1 each freshwater macroinvertebrate sample is represented on the multiRdimensionalscalingordination By lookingat thedistancesbetweeneachsample
ANOSIMisanalogoustoANOVAinunivariatestatistics(Smith2003)AglobalRstatistic iscalculatedtodeterminewhetherthereisasignificantdifferencebetweenallsamplesIf there are differences then pairwise comparisons are conducted to test for differences betweenpairsofsamples(analogoustopostRhoctestsinANOVA)
The R value lies between R1 and +1 (all similarities within groups are less than any similarity between groups) with a value of zero representing the null hypothesis (no differenceamongasetofsamples)(ClarkeampWarwick2001)ComparisonofpairwiseR values can give an indication of how different assemblages are R values close to 0 indicatelittledifferencevaluesaround05indicatesomeoverlapandvaluescloseto1to indicate many or substantial differences In many instances however researches are primarily interestedinwhethertheRvalueisstatisticallydifferentfromzero(usuallyata confidence level of 005) (Clarke amp Warwick 2001) (ie whether they can reject the null hypothesis)
ANOSIM can provide information on whether the (visual) differences between assemblages in the multiRdimensional scaling ordination are significantH it is an independenttestfromthemultiRdimensionalscalingordinationItisbasedontestingthe
TRESBPKirraReefMarineBiotaMonitoring2015 B2
frc environmental
differences between the rank similarities in the similarity matrix not on the distances betweensamplesinthemultiRdimensionalscalingordination(ClarkeampWarwick2001)
PermutationalMultivariateAnalysisofVariance
PERMANOVAisusedtotestsimultaneousresponsesofoneormorevariablestooneor more factors in an a0 priori0 structured design using random permutation of the data to assess significance (Anderson 2004) PERMANOVA generates a pseudo FRstatistic similar to traditional ANOVA but pRvalues are calculated with permutations which does notassumenormaldatadistribution PERMANOVAcanprovide informationonwhether the (visual) differences between assemblages in a multiRdimensional scaling ordination are significantH however it is an independent test from the multiRdimensional scaling ordination
Thelevelofmultivariatedispersionamongsampleswithineachofthetestgroupscanbe examined using the permutational analysis of multivariate dispersions (PERMDISP) routine(Anderson2004)Intraditionalimpactassessmentachangeinthedispersionof datacanalsoindicateanimpact
SimilarityPercentagendashSpeciesContributions
SIMPER analysis provides information on how dissimilar assemblages from various groups are (eg how similar all of the macroinvertebrate samples taken for a particular habitatwithinastreamreachare)andhowsimilareachgroup(egreach)istoanyother group SIMPER analysis also identifies the species taxa that are contributing to the dissimilarity between two assemblages in rank order (ie it identifies which species is contributingthemosttothedifferences)SIMPERanalysismayhelptoidentifypotential lsquoindicatorrsquospeciesForexampleifaparticularspeciesconsistentlycontributesgreatlyto the differences between impacted and unimpacted assemblages it may be a useful indicator Theabundanceofthis indicatorspeciescanthenbecomparedbetweensites usingunivariatetechniquessuchasANOVA
Data is available on request from tresbpprojectofficecrownlandnswgov
TRESBPKirraReefMarineBiotaMonitoring2015 C1
frc environmental
Appendix(D( Pairwise( PERMANOVA( Results
Data is available on request from tresbpprojectofficecrownlandnswgov
TRESBPKirraReefMarineBiotaMonitoring2015 D1
frc environmental
Appendix(E( Relative(Abundance(of(Fish(found(at(Kirra(( ( and(Palm(Beach(Reefs(in(Each(Survey((Data is available on request from tresbpprojectofficecrownlandnswgovau
TRESBPKirraReefMarineBiotaMonitoring2015 E1
Structure Bookmarks
0 50 100 Metres Scale 12500 A3
0 50 100 200 Metres Scale 15000 A3
Kirra Reef
Kirra Reef
Kirra Reef
Kirra Reef
Kirra Reef
Kirra Reef
Map A1Location of Kirra Reef monitoring sites
Table D8 Pairwise comparison of macroalgae cover between sites in each year
Table D15 Pairwise comparison of turf algae cover between sites in each year
Table D29 Pairwise comparison of ascidian cover between sites in each year
Table D43 Pairwise comparison of soft coral cover between sites in each year
frc environmental
Turfalgaearebecomingadominantcomponentofcommunitiesaroundtheworld likely the result of rapid colonisation of openspace after a disturbance (eg storms) nutrient enrichment andor changes in grazing pressures Turf algae can also reflect a more physically robust growth form suited to high wave energy environments (than foliose macroRalgae)TurfalgaepeakedintheJuly2012surveylikelyrelatedtotheincreasein bare reef exposure following a stormy conditions in early 2009 and between December 2011 and June 2012 Turf algae have been the dominant form of algae on Kirra Reef sincethistimealbeitthecoverlowerthanthe2012survey
Increased cover of turf algae is typically related to good light conditions high concentrationsofnutrientsandlownumbersofgrazerssuchasfish(orconstantgrazing pressure preventing macroalgae colonisation) However the relationship between algal dynamics physical disturbance water quality and herbivore grazing activity is complex andthecoverof turfalgaecanexhibitextremetemporalvariabilityasaconsequenceof the interactionbetween topRdownandbottomRupprocesses (Russ2003HBellwoodetal 2006H Hughes et al 2007H Albert et al 2008H Hoey amp Bellwood 2008H Mumby 2009) Furtherinvestigationwouldberequiredtoreliablydeterminethemechanismsofchangein bothmacroalgaeandturfalgaeassemblagesonthesereefs
Benthic$Macroinvertebrates$
AtKirraReeftheburialandreRemergenceofrockyoutcrops(influencedbytheTRESBP) islikelytohaveincreasedtemporalvariabilityinthedistributionandabundanceofbenthic macroinvertebrates Additional perturbations such as wave action and sand abrasion (each influenced through changes in bathymetry seabed topography and water depth) are likely to have resulted in the decline in cover and diversity of the benthic macroinvertebratesatKirraReefbetweensurveysparticularlybetweenMarch2004and February2005andduringtheseverestormsof2009Benthicmacroinvertebratessuch asascidiansspongeshardcoralandsoftcoralarehighlysusceptible to theeffectsof stormandwavedisturbancephysicalabrasionandburialbysand(KayampKeough1981H Walker et al 2008) which can affect settlement growth rate and survival (Dodge amp Vaisnys1977HRogers1990)
Physical disturbance from sand burial sand abrasion and the action of storm waves appeartokeepthebenthicassemblagesofKirraReefinastateofearlysuccessionItis commonforearlypioneerspeciessuchassomemacroalgaetorecruitrapidlytoahard surface in large numbers allowing these species to dominate assemblages early in the successionaltrajectory(Walkeretal2007)
Afurther indicatorof theearlystateofsuccessionatKirraReef isthatthecoverofhard and soft coral has remained very low (generally lt 5) In March 2015 less than 1
Benthic macroinvertebrate cover may also be affected indirectly through increased competitionwithmacroalgaeforspaceThepresenceoflargemacroalgaecanaffectthe recruitment and survival of sessile benthic invertebrates as fronds moving with wave action sweep and abrade the surface of rocks killing new recruits especially corals (Kennelly1989HMcCooketal2001)Itcantakeseveralyearsforhardandsoftcoralto become dominant on reefs in the SEQ region (SchlacherRHoenlinger et al 2009) Therefore hard coral is not expected to become abundant until several years after the reefhasbeenuncoveredandonlyifthephysicaldisturbanceregimeandsupplyofnew recruitsissufficienttosupportsurvivalandgenerationalsuccessionofthesespeciesThe coverofhardandsoftcoralsatKirraReefwerebothverylowandpatchypriortothestart oftheTRESBP
Sponges and ascidians are highly susceptible to smothering and sand abrasion unless theyhaveathicktunic(outercoveringmadeofkeratin)liketheascidianP0stolonifera0or strong internal keratin silicon or calcareous structures in the case of some species of sponges0(KayampKeough1981HMcGuinness1987HWalkeretal2008)Duetoincreased wave action and sedimentation (which can be influenced by the TRESBP) the mean coverofascidiansandspongeswasexpectedtobemuchloweronKirraReefthanPalm Beach Reef However in March 2015 the cover of sponges was similar between the reefsandthecoverofascidians(otherthanP0stolonifera)wasgreateratKirraReefthan at Palm Beach Reef This suggests that Kirra Reef is slowly recovering from the increasedstressofphysicaldisturbancesuchas increasedwaveactionandsandscour andorthatwaveandstormconditionshavebeenlesssevereinthepastfewyears
Fish$
KirraReefcontinuestosupportahighdiversityofreefRassociatedandpelagic(ienonR reefassociated) fishspecies Despite itsdiminishedsizecompared to1995KirraReef continuestoprovidevaluablehabitatforanumberoffishspeciesfromdifferentfunctional groups
ThereisahighdegreeofinterRannualvariabilityinthespeciesandabundanceofthefish present at Kirra Reef compared with the assemblage at Palm Beach Reef This likely reflectsthetemporalvariabilityintheavailablehabitatasaconsequenceofreefburialand reRemergenceThediversityqualityandarealextentofreefhabitatareimportantfactors influencing the distribution abundance biomass and diversity of reef fish (Bellwood amp Hughes2001HFriedlanderetal2003)Diversityandabundanceoffishcanincreasewith
TRESBPKirraReefMarineBiotaMonitoring2015 48
frc environmental
greaterstructuralcomplexityandincreasedheterogeneityofavailablehabitats(Bellwood ampHughes2001)Thissuggeststhatperiodsofreefburialreducetheoveralldiversityof reefRassociated fish species at Kirra Reef Despite the reduction in overall reef space therewasalargervarietyofhabitats(suchasmarcoalgaeandturfalgae)in2015which was likely to be related to the high diversity of fish assemblages This is particularly importantforseveralspeciesthatdependonthepresenceoflsquostructurersquosuchasprovided by reef habitat (ie oldwife moray eels damselfish and Australian mado that were recordedinMarch2015butwerenotrecordedinJuly2012)
Theabundanceanddiversityof fishare likelytobenegativelyaffectedfollowingperiods of severe weather which create unfavourable conditions for many species and may further exacerbate the affects of abrasion and sedimentation The biomass of fish is knowntodecreasewithincreasingexposuretophysicaldisturbancefromwaveactionand strong currents (Friedlander et al 2003) As our surveys have been undertaken at different times of the year variation in the prevailing conditions at the time of sampling could also influence the types of fish observed (and the amount of reef habitat that is availableatanytime)Manyofthespeciesmayalsobeaffectedbyseasonalchangesin the water temperature such as damselfish which are less abundant in cool waters However theoveralldiversityof the fishassemblageatKirraReef is likely toreflect the sizeoftheoutcropsexposedwithagreaterphysicaldisturbance(fromseaconditionsand sandmovement)andcompetitionHandlesserfoodavailablewhenthereefiscovered
ThepredictedimpactstoKirraReefasaresultoftheTRESBPincludedaccretionofsand around the base of the rock outcrops causing a reduction in extent of reef It was predictedthatsanddeliveryaspartoftheprojectwouldeventuallymimiclsquonaturalrsquopatterns ofsanddispersalandthatthereefwouldreturntoitsnaturalextent(ietheextentpriorto extension of the Tweed River training walls in 1962) The benthic flora and fauna assemblages of the reef the historical reef extent and natural sand transport patterns wereexpectedtoreturntoconditionsobservedbeforetheextensionofthetrainingwalls between 1962 and 1965 However the Environmental Impact Study did not predict the ecologicalconsequencesofboththereducedarealextentandincreasedwaveenergy(a consequenceofdecreaseddepth)thathavebeenrecorded
ThecurrentextentofKirraReef remains less than50of that recorded in1962and in 1995beforethesanddeliverybytheTRESBPcommencedHowevertheextentofreef in1995 wasstrongly influenced by adepletion in sand following the construction of the Tweed River training walls and the Kirra Point groyne Accumulation of sand on Kirra ReefwasobservedtoincreaseasaresultofindirectsandnourishmentbytheTRESBP and the reef has been extensively covered (particuarly between 2005 and 2010) as a result
Whiletheextentofthereefcontinuestochangeovertimethedeliveryofsandaspartof the project now more closely matches the natural rate of longshore sand transport ShortRtermandseasonalchangesintheextentofthereefarenowlikelytobetheresultof waveandcurrentaction(particularlyduringservereweatherevents)thanadirectimpact of the TRESBP Therefore the extent of Kirra Reef in March 2015 is broadly in accordancewithpredictionsmadeintheEISwhichpredictedthatthereefwouldreturnto a condition similar to that exhibited in the preR1960rsquos ie before the extension of the TweedRiverbreakwatersthatinterruptedlittoralsandsupplytothesebeaches
InDecember2013KirraPointgroynewasextendedby30mwiththeexpectationthatthe beach bar would move seaward as a consequence At present Kirra Point groyne is unlikelytohavehadamajorimpactonthearealextentofKirraReefHoweverongoing monitoringbasedonaerialphotographsmayprovidefurtherinsight
Sessile benthic assemblages on Kirra Reef are highly susceptible to the influence of storms and associated wave action (Kay amp Keough 1981H Walker et al 2008) The shallowreefissurroundedbymobilesandwhichcanshiftnaturallyinresponsetowave action during storms causing burial of large sections of Kirra Reef This effect has reduced the availability of rocky substrate for colonisation and the availability of refuge
Fromanexaminationof theextentofKirraReef fromarealmapsandwaveheightdata thereappears tobea relationshipbetween theareaof rockexposedandstormevents Notably in a series of storm events in May 2009 corresponds with large areas of rock becoming exposed (with the reef approximately 100m2 in 2006 and approximately in 1009m2 2009) Further a stormy conditions between December 2011 and July 2012 correspondstotheareaofexposedrockmorethandoublinginsizeWhiletherewasno changetothetotalareaofexposedrockfollowingstormyconditionsinearly2013there wasaclearchangeinthedistibutionofexposedrockduringthistimeSince2013storm conditions have been calm to moderate and there has been little change in the areal extentanddistrubtionofexposedrockatKirraReef
WaveheighttypicallyincreasesduringstormeventsandgiventheshallowdepthofKirra Reef waves are more likely to shoal and break across the reef during storms This increases thephysicaldisturbanceabrasionandsedimentationofbenthicassemblages onKirraReefStormdisturbancecancauselocalreductionsinthespeciesrichnessand abundanceofcoral(Woodleyetal1981HMasselampDone1993HHughes1994HConnellet al 1997) and can alter fish assemblages indirectly through habitat modifications (Kaufman1983HJonesampSyms1998)ordirectlybyincreasingfishmortality(Lassig1983) The hydrodynamic forces produced by wave action are an important source of disturbance in subtidal habitats inflicting damage through direct physical impact and abrasion(UnderwoodampKennelly1990)DirectimpactsfromphysicaldisturbanceatKirra Reefareevidentduringsurveyeventswhenlargefragmentsofmacroalgaearepresentin thewatercolumnoverthereef
Storm and wave action (and associated sedimentation and abrasion) continue to be importantforcesshapingthedistributionandabundanceofbenthicspeciesatKirraReef Increased magnitude and frequency of physical disturbance resulting from increased exposureorsusceptibility tostormsandassociatedwaveaction (asonKirraReef)can lead to a decrease in the diversity of sessile invertebrate assemblages DisturbanceR drivenreductionsinbiodiversityhavethepotentialtoimpactnegativelyonthehealthand productivity of reef ecosystems (Walker et al 2008) Biodiversity is important to reef health given that many of these species (eg sponges bryozoans and ascidians) contribute a range of vital ecosystem services to reefs including nutrient cycling (Scheffers et al 2004) trophic interactions and food webs (Lesser 2006H Pawlik et al 2007) bioRerosion (Rutzler 2002H LopezRVictoria et al 2006) and stabilizing substrata (DiazampRutzler2001HWulff2001)
Theimpactsof increasedwaveactionandsedimentationonthebenthicassemblagesat Kirra Reef are likely to be greatest during and immediately following storm conditions
TRESBPKirraReefMarineBiotaMonitoring2015 51
frc environmental
Partitioningtheinfluenceofstormandwavedrivendisturbancefromthatoftheoperation oftheTRESBPwouldrequireamuchmorestatisticallypowerfulandtemporilyreplicated experimental design Given there is a large collection of wave and storm data by TRESBP this would involve greater temporal sampling of Kirra Reef including event samplingfollowingseverewaveandstormactivity
The data generated by this Kirra Reef biota monitoring program doesnrsquot support statistically rigorous consideration of seasonality (monitoring has been at its most frequentannual)
InApril2014andMarch2015KirraReefcoveredlessthan50ofthereefrsquosextentprior to theoperationof theTRESBP The lossof reefhabitathasreducedtheavailabilityof hard substratum available for colonisation and consequently the abundance of benthic sessileassemblages
The reduced depth of water resulting from the accumulation of sand exacerbates the effects of storms and wave action It is likley that as a consequnece the biological communities of Kirra Reef will reflect earlyRstage succession more frequently and for longerperiods
While there is sufficient structure available frcenvironmentalexpect that Kirra Reef will continuetoprovideimportanthabitatforadiverseassemblageoffishes
TRESBPKirraReefMarineBiotaMonitoring2015 52
frc environmental
5$ Conclusions$
Although there is still a substantial portion of the reef covered compared to before the extension of the Tweed River entrance breakwaters the current extent of Kirra Reef is broadly inaccordancewithpredictionsmadein theEIS Initial lsquocatchRuprsquobypassingand dredgeplacementofsand(between2001and2008)resulted in theburialofKirraReef Subsequentsanddelivery(since2008onwards)morecloselyreflectsnaturalpatternsof longRshoresandtransportandisthereefhasslowlyreRemerged
Theextentofthereefhasbeenrelativelystablesince2013Thishasallowedforsome succession in the benthic assemblages including a relatively high cover of sponges ascidiansandcrinoidsWiththedeliveryofsandmorecloselymatchingthenaturalrateit isexpected the reef willundergoshortRtermchanges in extentdue toseasonal shifts in sand deliveryH however the diversity of benthic assemblages on Kirra Reef is likely to increaseovertimeThiswouldcreatemorespaceforspeciestorecruitandreducesthe influence of sand abrasion and wave damage It was predicted that the areas of Kirra Reef newly exposed in 2012 would undergo a shift from turfRdominated communities to more diverse communities that could include macroalgae sponges ascidians and potentiallyhardandsoftcoralWiththeexceptionofhardandsoftcoralsthisprediction wasconfirmedbytheresultsoftheApril2014andMarch2015surveys
ThediversityoffishesassociatedwithKirraReefisbroadlysimilartothatrecordedprior tothecommencementofsandbypassingin1995Giventhatfisharemobilethegreatest impacts on fish assemblages are likely to be shortRterm changes due to both the prevailingconditionsandchangestheextentofavailablehabitatthatprovidesshelterand foodforavarietyofdifferentspeciesIfKirraReefincreasesinsizethereislikelytobea greater proportion of cryptic benthic species as these species are more typical of assemblagesinalaterstageofsuccession(eg(WillisampAnderson2003))
Assuming a broadly stable delivery rate of sand and consequent stable extent of Kirra ReeflsquorecoveryrsquoislikleytobesubstantivelycompleteFloralandfaunalcommunitieswill undergo succession between severe storm events but are likley to remain relatively dynamic
Albert S Udy J amp Tibbetts I 2008 Responses of algal communities to gradients in herbivorebiomassandwaterqualityinMarovoLagoonSolomonIslandsCoral0 Reefs2773R82
Anderson MJ 2001 A new method for nonRparametric multivariate analysis of varianceAustral0Ecology2632R46
Anderson MJ 2004 PERMDISP0 a0 FORTRAN0 computer0 program0 for0 permutatinoal0 analysis0 of0 multivariate0 dispersions0 (for0 any0 twoSfactor0 ANOVA0 design)0 using0 permutational0 tests Department of Statistics University of Auckland New Zealand
Cannon LR Goeden GB amp Campbell P 1987 Community patterns revealed by trawling in the interRreef regions of the Great Barrier Reef Memoirs0 of0 the0 Queensland0Museum2545R70
Chapman MG Underwood AJ amp Skilleter GA 1995 Variability at different spatial scalesbetweenasubtidalassemblageexposedtothedischargeofsewageand two control assemblages Journal0 of0 Experimental0 Biology0 and0 Ecology 189 103R122
Cheshire AC Miller DJ amp Stewart R (1999) Effect0 of0 dispersed0 sediment0 plumes0 from0beach0sand0replenishment0dredging0on0recruitment0of0phaeophycean0algae0 to0rocky0reefs0in0Gulf0St0Vincent0South0Australia0The0Impact0of0Sand0Dredging0 on0 Benthic0 Community0 Structure0 at0 the0 Port0 Stanvac0 Dredge0 Site0 20 1S39 UniversityofAdelaideAdelaide
ConnellJHHughesTPampWallaceCC1997A30Ryearstudyofcoralabundance recruitment and disturbance at several scales in space and time Ecological0 Monographs67461R488
Diaz MC amp Rutzler K 2001 Sponges an essential component of Caribbean coral reefsBulletin0of0Marine0Science69535R546
DodgeREampVaisnysJR1977Coralpopulationsandgrowthpatternsresponsesto sedimentation and turbidity associated with dredging Journal0 of0 Marine0 Research35715R730
Done TJ 1982 Patterns in the distribution of coral communities across the central GreatBarrierReefCoral0Reefs195R107
Edwards RA amp Smith DA 2005 Subtidal assemblages associated with a geotextile reef insouthReastQueenslandAustraliaMarine0and0Freshwater0Research56 133R142
FisheriesResearchConsultants1991Survey0of0the0Intertidal0and0Subtidal0Rocky0Reefs0 of0 the0 Sunshine0 Coast report prepared for Queensland National Parks and WildlifeService
HarrisonPHarriotVBanksSampHolmesN1998ThecoralcommunitiesofFlinders Reef andMyora Reef in theMoretonBay MarineParkQueensland Australia In Moreton0 Bay0 and0 Catchment Tibbits I Hall N amp Dennison W (Eds) SchoolofMarineScienceUniversityofQueenslandStLuciapp525R536
Hatcher B Johannes R amp Robertson A 1989 Review of research relevant to the conservationofshallowtropicalmarineecosystemsOceanography0and0Marine0 Biology0an0Annual0Review27337R414
Hoey A amp Bellwood D 2008 CrossRshelf variation in the role of parrotfishes on the GreatBarrierReefCoral0Reefs37R47
TRESBPKirraReefMarineBiotaMonitoring2015 56
frc environmental
Hollingsworth P 1975 Environmental Investigation Report Crown Reserve R R68 Currumbin Creek City of the Gold Coast Land Administration Commission unpublishedreport
Hughes TP 1994 Catastrophes phase shifts and large scale degradation of a CaribbeancoralreefScience2651547R1551
Hughes TP Rodrigues MJ Bellwood DR Ceccarelli D HoeghRGuldberg O McCook L Moltschaniwskvi N Pratchett MS Steneck RS amp Willis B 2007Phaseshiftsherbivoryandtheresilienceofcoralreefstoclimatechange Current0Biology17360R365
Hutchinson A Rempel C Taveras V Loder J amp Salmond J 2013 Reef0 Check0 Australia0 South0 East0 Queensland0 Summary0 Report0 2013 report prepared for ReefCheckFoundationLimited
Hyder Consulting 1997 Tweed0 River0 Entrance0 Sand0 Bypassing0 Project0 Permanent0 Bypassing0 System0 0 Environmental0 Impact0 Statement0 0 Impact0 Assessment0 Study report prepared for New South Wales Department of Land and Water Conservation
Jompa J amp McCook LJ 2002 Effects of competition and herbivory on interactions betweenahardcoralandabrownalgaJournal0of0Experimental0Marine0Biology0 and0Ecology27125R39
KayAMampKeoughMJ1981Occupationofpatchesintheepifaunalcommunitieson pier pilings and the bivalve Pinna bicolor at Edithburgh South Australia Oecologia48123R130
KennellyS1987aInhibitionofkelprecruitmentbyturfingalgaeandconsequencesfor an Australian kelp community Journal0 of0 Experimental0 Marine0 Biology0 and0 Ecology11249R60
Kennelly S 1987b Physical disturbances in an Australian kelp community I temporal effectsMarine0Ecology0Progress0Series40145R153
TRESBPKirraReefMarineBiotaMonitoring2015 57
frc environmental
Kennelly S 1989 Effects of kelp canopies on understory species due to shade and scourMarine0Ecology0Progress0Series50215R224
Lassig BR 1983 The effects of a cyclonic storm on coral reef fish assemblages Environmental0Biology0of0Fishes955R63
Lawson S McMahon J amp Boswood P 2001 Environmental management of the construction and operation of a sand bypassing system at the Tweed River EntranceInThe15thAustralasianCoastalandOceanEngineeringConference the 8th Australasian Port and Harbour Conference 25 R 28 September 2001 QueenslandAustralia
Lesser MP 2006 BenthicRpelagic coupling on coral reefs feeding and growth of Caribbean sponges Journal0 of0 Experimental0 Marine0 Biology0 amp0 Ecology 328 277R288
LopezRVictoriaM ZeaSampWei E2006 Competition for spacebetweenencrusting excavatingCaribbeanspongesandothercoral reeforganismsMarine0Ecology0 Progress0Series312113R121
MalcolmHASmithSDAampJordanA2009Usingpatternsofreeffishassemblages to refine a Habitat Classification System for marine parks in NSW Australia Aquatic0Conservation0Marine0and0Freshwater0Ecosystems2083R92
Massel SR amp Done TJ 1993 Effects of cyclone waves on massive coral assemblages on the Great Barrier Reef meteorology hydrodynamics and demographyCoral0Reefs12153R166
Mumby PJ amp Steneck RS 2008 Coral reef management and conservation in light of rapidly evolving ecological paradigms Trends in Ecology amp Evoution 23 555 -563
Murphy HM amp Jenkins GP 2010 Observational methods used in marine spatial monitoring of fishes and associated habitats a review Marine and Freshwater Research 61 236-252
Noriega R 2007 An Overview of Available Information on Sandy Beach Ecology Coastal Sand Dunes Rocky Reefs and Associated Biota on the Gold Coast Griffith Centre for Coastal Management Research Report No 85 report prepared for Griffith University
Parker P (1995) Structure to Reef Fish Assemblages at Julian Rocks Northern New South Wales Masters Thesis Griffith University
Parker PG 1999 Fish assemblages at Julian Rocks and the adjacent waters of northern New South Wales Australia Australian Zoologist 31 134 - 160
Pawlik JR Steindler L Henkel TP Beer S amp Ilan M 2007 Chemical warfare on coral reefs sponge metabolites differentially affect coral symbiosis in situ Limnology and Oceanography 52 907-911
Reef Check 2010 httpwwwreefcheckaustraliaorgdatahtml accessed December 2015
Robinson KI amp Pollard DA 1982 Marine and estuarine reserves in Australia with particular reference to New South Wales Wetlands 2 17 - 26
Rogers CS 1990 Responses of coral reefs and reef organisms to sedimentation Marine Ecology Progress Series 62 185-202
Russ GR 2003 Grazer biomass correlates more strongly with production than with biomass of algal turfs on a coral reef Coral Reefs 22 63-67
Rutzler K 2002 Impact of crustose clionid sponges on Caribbean reef corals Acta Geologica Hispanica 37 61-72
Scheffers SR Nieuwland G Bak RPM amp van Duyl FC 2004 Removal of bacteria and nutrient dynamics within the coral reef framework of Curacao (Netherlands Antilles) Coral Reefs 23 413-422
TRESBP Kirra Reef Marine Biota Monitoring 2015 59
frc environmental
Schlacher-Hoenlinger M Walker S Johnson J Schlacher T amp Hooper J 2009 Biological Monitoring of the Ex-HMAS Brisbane Artificial Reef Phase II - Habitat Values report prepared for Environmental Protection Agency (EPA)
Smith KA 2003 A simple multivariate technique to improve the design of a sampling strategy for age-based fishery monitoring Fisheries Research 64 79-85
Smith S Edwards R Dalton S amp Harrison M 2005 Biological assessment of fish and benthic communities at Palm Beach Bait Reef Gold Coast Queensland report prepared for University of New England
TRESBP 2014 Autum 2009 storms httpwwwtweedsandbypassnswgovauarticles-and-studiesinteresting-itemsautumn-2009-storm updated 4 May 2014 accessed December 2015
TRESBP 2015a Tweed Sand Bypassing Restoring Coastal Sand Drift Improving Boating Access ndash Techinical information httpwwwtweedsandbypassnswgovau__dataassetspdf_file0004552055kir ra-feb-2015pdf acessed December 2015
TRESBP 2015b Waves httpwwwtweedsandbypassnswgovauenvironmental-monitoringcoastal-conditionswaves updated 30 September 2015 accessed December 2015
Umar MJMLJ amp Price IR 1998 Effects of sediment deposition on the seaweed Sargassum on a fringing coral reef Coral Reefs 17 169-177
Underwood AJ amp Kennelly SJ 1990 Ecology of marine algae on rocky shores and subtidal reefs in temperate Australia Hydrobiologia 192 3-20
Walker S Schlacher T amp Schlacher-Hoenlinger M 2007 Spatial heterogeneity of epibenthos on artificial reefs fouling communities in the early stages of colonization on an East Australian shipwreck Marine Ecology 28 435-445
Walker SJ Degnan BM Hooper JNA amp Skilleter GA 2008 Will increased storm intensity from climate change affect biodiversity in non-scleractinian sessile fauna on coral reefs Global Change Biology 14 2755-2770
Warwick RM amp Clarke KR 1993 Increased variability as a symptom of stress in marine communtities Journal of Experimental Marine Biology and Ecology 172 215-216
Thenumberofsitessurveyedhasvariedover timeasaresultof the fluctuating levelof sandcoveringKirraReef
Prior to May 2003 three sites were assessed along the eastern and northern edge of KirraReef(KirraReefOutersites1to3)andthreesiteswereexaminedalongtheinshore marginof the reef (KirraReef Inner sites1 to 3)(MapA1) ReefRedge (ieKirraOuter) siteswerechosentoprovideearlywarningofimpactsfromoffshoreplacementofdredged sandwhilst inshoresites(ieKirraInner)werechosentoindicatewhetherimpactsfrom inshore beach profile development were affecting the reef platform In May 2003 the threeeasternsitesatKirraReef (ieKRO1KRO2andKRI1)werecompletelycovered with bare mobile sand Consequently only the three western sites at Kirra Reef (ie KRO3KRI2andKRI3)supportedbenthicfloraandfaunaInMarch2004theextentof the remainingwesternoutcropof KirraReef had been further reduced so that all inner reefsiteswerecompletelycoveredwithmobilesandConsequentlyonlyasingleoriginal reefsite(ieKRO3)couldbesurveyed(Figure23)Thereforetoprovideanindicationof the condition of the remaining reef two new sites were established (ie KRN1 and KRN2)(Figure23)andsurveyedinMarch2004Theextentofthewesternreefhadbeen further reduced by February 2005 and a third new site (ie KRN3) was established (Figure23)Consequentlyfoursites(KRO3KRN1KRN2andKRN3)weresurveyedin February2005
InFebruary2010fourKirraReefsites(ieKRO3KRO1KRN1andKRN2)wereclearof thesurroundingsandandsupportedbenthic floraand fauna Inaddition several rocks protruded from the sand in the vicinity of site KRI2H these were assessed to provide a quantitativeindicationofbroadRscaletemporalchangestotheinshorereefcommunities
SOURCEScopy Copyright Commonwealth of Australia (Geoscience Australia) 2001 2004 2006copy The State of Queensland (Department of Natural Resources and Mines) 2015copy Nearmap 2014 2015
DATE2015-09-09
DRAWN BYCF
VERSION02
PROJECTIONCoordinate System GDA 1994 MGA Zone 56Projection Transverse MercatorDatum GDA 1994
plusmn SCALE
0 50 100
Metres
Scale 12500 A3
frc environmental
Appendix$B$ Introduction$to$Data$Analysis$Used$
Multivariate$Analyses$
Multivariate statistical techniques are widely used in ecology to assess the similarities relationshipsbetweenassemblagesWhereasunivariateanalysescanonlycompareone variable at a time (eg an index of community structure such as a diversity index or a singleindicatorspecies)multivariateanalysescancomparesamplesbasedontheextent thatassemblagesshareparticulartaxaandabundances(ClarkeampWarwick2001)
Thefirststepofmultivariateanalysisusuallyinvolvesthecreationofamatrixofsimilarity coefficients computed between every pair of samples The coefficient is usually a measureofhowclose theabundance is foreachspecies (definedso that100= total similarity and 0=complete dissimilarity) The Bray Curtis similarity measure is commonlythemostappropriateforbiologicaldata(ClarkeampWarwick2001)
MultidimensionalScaling
NonRmetricmultiRdimensionalscalingordinations(nMDS)attempttoplacesamplesintwo dimensionalspacesothattherankorderofthedistancesbetweensamplesmatchesthe rankorderofthematchingsimilaritiesfromthesimilaritymatrix(ClarkeampWarwick2001) Thisprovidesavisualrepresentationofthesimilaritiesbetweenassemblageswithineach sampleEachoftheaxesisnotrelatedtoanyparticularvalueHinfactaxescanberotated toprovide thebestvisual representationof thedata Ordinationsareparticularlyuseful tools for analysing and visually presenting differences between assemblages Ordinationsareessentiallymapsofsamples inwhich theplacementofsampleson the mapreflectsthesimilarlyofthecommunitytothecommunitiesinothersamples(Clarkeamp Warwick 2001) Distances between samples on an ordination attempt to match the similarities inassemblagestructurenearbypoints representassemblageswithvery few attributes(speciesorabundanceofspecies)Hpoints faraparthavevery fewattributes in common(ClarkeampWarwick2001)
A stress coefficient is calculated to reflect the extent to which the multiRdimensional scalingordinationandthesimilaritymatrixagree(ClarkeampWarwick2001)(iehowwell the multiRdimensional scaling ordination accurately reflects the relationship between samples)Stressvaluesoflt015aregenerallyacceptable
In Figure A1 each freshwater macroinvertebrate sample is represented on the multiRdimensionalscalingordination By lookingat thedistancesbetweeneachsample
ANOSIMisanalogoustoANOVAinunivariatestatistics(Smith2003)AglobalRstatistic iscalculatedtodeterminewhetherthereisasignificantdifferencebetweenallsamplesIf there are differences then pairwise comparisons are conducted to test for differences betweenpairsofsamples(analogoustopostRhoctestsinANOVA)
The R value lies between R1 and +1 (all similarities within groups are less than any similarity between groups) with a value of zero representing the null hypothesis (no differenceamongasetofsamples)(ClarkeampWarwick2001)ComparisonofpairwiseR values can give an indication of how different assemblages are R values close to 0 indicatelittledifferencevaluesaround05indicatesomeoverlapandvaluescloseto1to indicate many or substantial differences In many instances however researches are primarily interestedinwhethertheRvalueisstatisticallydifferentfromzero(usuallyata confidence level of 005) (Clarke amp Warwick 2001) (ie whether they can reject the null hypothesis)
ANOSIM can provide information on whether the (visual) differences between assemblages in the multiRdimensional scaling ordination are significantH it is an independenttestfromthemultiRdimensionalscalingordinationItisbasedontestingthe
TRESBPKirraReefMarineBiotaMonitoring2015 B2
frc environmental
differences between the rank similarities in the similarity matrix not on the distances betweensamplesinthemultiRdimensionalscalingordination(ClarkeampWarwick2001)
PermutationalMultivariateAnalysisofVariance
PERMANOVAisusedtotestsimultaneousresponsesofoneormorevariablestooneor more factors in an a0 priori0 structured design using random permutation of the data to assess significance (Anderson 2004) PERMANOVA generates a pseudo FRstatistic similar to traditional ANOVA but pRvalues are calculated with permutations which does notassumenormaldatadistribution PERMANOVAcanprovide informationonwhether the (visual) differences between assemblages in a multiRdimensional scaling ordination are significantH however it is an independent test from the multiRdimensional scaling ordination
Thelevelofmultivariatedispersionamongsampleswithineachofthetestgroupscanbe examined using the permutational analysis of multivariate dispersions (PERMDISP) routine(Anderson2004)Intraditionalimpactassessmentachangeinthedispersionof datacanalsoindicateanimpact
SimilarityPercentagendashSpeciesContributions
SIMPER analysis provides information on how dissimilar assemblages from various groups are (eg how similar all of the macroinvertebrate samples taken for a particular habitatwithinastreamreachare)andhowsimilareachgroup(egreach)istoanyother group SIMPER analysis also identifies the species taxa that are contributing to the dissimilarity between two assemblages in rank order (ie it identifies which species is contributingthemosttothedifferences)SIMPERanalysismayhelptoidentifypotential lsquoindicatorrsquospeciesForexampleifaparticularspeciesconsistentlycontributesgreatlyto the differences between impacted and unimpacted assemblages it may be a useful indicator Theabundanceofthis indicatorspeciescanthenbecomparedbetweensites usingunivariatetechniquessuchasANOVA
Data is available on request from tresbpprojectofficecrownlandnswgov
TRESBPKirraReefMarineBiotaMonitoring2015 C1
frc environmental
Appendix(D( Pairwise( PERMANOVA( Results
Data is available on request from tresbpprojectofficecrownlandnswgov
TRESBPKirraReefMarineBiotaMonitoring2015 D1
frc environmental
Appendix(E( Relative(Abundance(of(Fish(found(at(Kirra(( ( and(Palm(Beach(Reefs(in(Each(Survey((Data is available on request from tresbpprojectofficecrownlandnswgovau
TRESBPKirraReefMarineBiotaMonitoring2015 E1
Structure Bookmarks
0 50 100 Metres Scale 12500 A3
0 50 100 200 Metres Scale 15000 A3
Kirra Reef
Kirra Reef
Kirra Reef
Kirra Reef
Kirra Reef
Kirra Reef
Map A1Location of Kirra Reef monitoring sites
Table D8 Pairwise comparison of macroalgae cover between sites in each year
Table D15 Pairwise comparison of turf algae cover between sites in each year
Table D29 Pairwise comparison of ascidian cover between sites in each year
Table D43 Pairwise comparison of soft coral cover between sites in each year
frc environmental
ThepredictedimpactstoKirraReefasaresultoftheTRESBPincludedaccretionofsand around the base of the rock outcrops causing a reduction in extent of reef It was predictedthatsanddeliveryaspartoftheprojectwouldeventuallymimiclsquonaturalrsquopatterns ofsanddispersalandthatthereefwouldreturntoitsnaturalextent(ietheextentpriorto extension of the Tweed River training walls in 1962) The benthic flora and fauna assemblages of the reef the historical reef extent and natural sand transport patterns wereexpectedtoreturntoconditionsobservedbeforetheextensionofthetrainingwalls between 1962 and 1965 However the Environmental Impact Study did not predict the ecologicalconsequencesofboththereducedarealextentandincreasedwaveenergy(a consequenceofdecreaseddepth)thathavebeenrecorded
ThecurrentextentofKirraReef remains less than50of that recorded in1962and in 1995beforethesanddeliverybytheTRESBPcommencedHowevertheextentofreef in1995 wasstrongly influenced by adepletion in sand following the construction of the Tweed River training walls and the Kirra Point groyne Accumulation of sand on Kirra ReefwasobservedtoincreaseasaresultofindirectsandnourishmentbytheTRESBP and the reef has been extensively covered (particuarly between 2005 and 2010) as a result
Whiletheextentofthereefcontinuestochangeovertimethedeliveryofsandaspartof the project now more closely matches the natural rate of longshore sand transport ShortRtermandseasonalchangesintheextentofthereefarenowlikelytobetheresultof waveandcurrentaction(particularlyduringservereweatherevents)thanadirectimpact of the TRESBP Therefore the extent of Kirra Reef in March 2015 is broadly in accordancewithpredictionsmadeintheEISwhichpredictedthatthereefwouldreturnto a condition similar to that exhibited in the preR1960rsquos ie before the extension of the TweedRiverbreakwatersthatinterruptedlittoralsandsupplytothesebeaches
InDecember2013KirraPointgroynewasextendedby30mwiththeexpectationthatthe beach bar would move seaward as a consequence At present Kirra Point groyne is unlikelytohavehadamajorimpactonthearealextentofKirraReefHoweverongoing monitoringbasedonaerialphotographsmayprovidefurtherinsight
Sessile benthic assemblages on Kirra Reef are highly susceptible to the influence of storms and associated wave action (Kay amp Keough 1981H Walker et al 2008) The shallowreefissurroundedbymobilesandwhichcanshiftnaturallyinresponsetowave action during storms causing burial of large sections of Kirra Reef This effect has reduced the availability of rocky substrate for colonisation and the availability of refuge
Fromanexaminationof theextentofKirraReef fromarealmapsandwaveheightdata thereappears tobea relationshipbetween theareaof rockexposedandstormevents Notably in a series of storm events in May 2009 corresponds with large areas of rock becoming exposed (with the reef approximately 100m2 in 2006 and approximately in 1009m2 2009) Further a stormy conditions between December 2011 and July 2012 correspondstotheareaofexposedrockmorethandoublinginsizeWhiletherewasno changetothetotalareaofexposedrockfollowingstormyconditionsinearly2013there wasaclearchangeinthedistibutionofexposedrockduringthistimeSince2013storm conditions have been calm to moderate and there has been little change in the areal extentanddistrubtionofexposedrockatKirraReef
WaveheighttypicallyincreasesduringstormeventsandgiventheshallowdepthofKirra Reef waves are more likely to shoal and break across the reef during storms This increases thephysicaldisturbanceabrasionandsedimentationofbenthicassemblages onKirraReefStormdisturbancecancauselocalreductionsinthespeciesrichnessand abundanceofcoral(Woodleyetal1981HMasselampDone1993HHughes1994HConnellet al 1997) and can alter fish assemblages indirectly through habitat modifications (Kaufman1983HJonesampSyms1998)ordirectlybyincreasingfishmortality(Lassig1983) The hydrodynamic forces produced by wave action are an important source of disturbance in subtidal habitats inflicting damage through direct physical impact and abrasion(UnderwoodampKennelly1990)DirectimpactsfromphysicaldisturbanceatKirra Reefareevidentduringsurveyeventswhenlargefragmentsofmacroalgaearepresentin thewatercolumnoverthereef
Storm and wave action (and associated sedimentation and abrasion) continue to be importantforcesshapingthedistributionandabundanceofbenthicspeciesatKirraReef Increased magnitude and frequency of physical disturbance resulting from increased exposureorsusceptibility tostormsandassociatedwaveaction (asonKirraReef)can lead to a decrease in the diversity of sessile invertebrate assemblages DisturbanceR drivenreductionsinbiodiversityhavethepotentialtoimpactnegativelyonthehealthand productivity of reef ecosystems (Walker et al 2008) Biodiversity is important to reef health given that many of these species (eg sponges bryozoans and ascidians) contribute a range of vital ecosystem services to reefs including nutrient cycling (Scheffers et al 2004) trophic interactions and food webs (Lesser 2006H Pawlik et al 2007) bioRerosion (Rutzler 2002H LopezRVictoria et al 2006) and stabilizing substrata (DiazampRutzler2001HWulff2001)
Theimpactsof increasedwaveactionandsedimentationonthebenthicassemblagesat Kirra Reef are likely to be greatest during and immediately following storm conditions
TRESBPKirraReefMarineBiotaMonitoring2015 51
frc environmental
Partitioningtheinfluenceofstormandwavedrivendisturbancefromthatoftheoperation oftheTRESBPwouldrequireamuchmorestatisticallypowerfulandtemporilyreplicated experimental design Given there is a large collection of wave and storm data by TRESBP this would involve greater temporal sampling of Kirra Reef including event samplingfollowingseverewaveandstormactivity
The data generated by this Kirra Reef biota monitoring program doesnrsquot support statistically rigorous consideration of seasonality (monitoring has been at its most frequentannual)
InApril2014andMarch2015KirraReefcoveredlessthan50ofthereefrsquosextentprior to theoperationof theTRESBP The lossof reefhabitathasreducedtheavailabilityof hard substratum available for colonisation and consequently the abundance of benthic sessileassemblages
The reduced depth of water resulting from the accumulation of sand exacerbates the effects of storms and wave action It is likley that as a consequnece the biological communities of Kirra Reef will reflect earlyRstage succession more frequently and for longerperiods
While there is sufficient structure available frcenvironmentalexpect that Kirra Reef will continuetoprovideimportanthabitatforadiverseassemblageoffishes
TRESBPKirraReefMarineBiotaMonitoring2015 52
frc environmental
5$ Conclusions$
Although there is still a substantial portion of the reef covered compared to before the extension of the Tweed River entrance breakwaters the current extent of Kirra Reef is broadly inaccordancewithpredictionsmadein theEIS Initial lsquocatchRuprsquobypassingand dredgeplacementofsand(between2001and2008)resulted in theburialofKirraReef Subsequentsanddelivery(since2008onwards)morecloselyreflectsnaturalpatternsof longRshoresandtransportandisthereefhasslowlyreRemerged
Theextentofthereefhasbeenrelativelystablesince2013Thishasallowedforsome succession in the benthic assemblages including a relatively high cover of sponges ascidiansandcrinoidsWiththedeliveryofsandmorecloselymatchingthenaturalrateit isexpected the reef willundergoshortRtermchanges in extentdue toseasonal shifts in sand deliveryH however the diversity of benthic assemblages on Kirra Reef is likely to increaseovertimeThiswouldcreatemorespaceforspeciestorecruitandreducesthe influence of sand abrasion and wave damage It was predicted that the areas of Kirra Reef newly exposed in 2012 would undergo a shift from turfRdominated communities to more diverse communities that could include macroalgae sponges ascidians and potentiallyhardandsoftcoralWiththeexceptionofhardandsoftcoralsthisprediction wasconfirmedbytheresultsoftheApril2014andMarch2015surveys
ThediversityoffishesassociatedwithKirraReefisbroadlysimilartothatrecordedprior tothecommencementofsandbypassingin1995Giventhatfisharemobilethegreatest impacts on fish assemblages are likely to be shortRterm changes due to both the prevailingconditionsandchangestheextentofavailablehabitatthatprovidesshelterand foodforavarietyofdifferentspeciesIfKirraReefincreasesinsizethereislikelytobea greater proportion of cryptic benthic species as these species are more typical of assemblagesinalaterstageofsuccession(eg(WillisampAnderson2003))
Assuming a broadly stable delivery rate of sand and consequent stable extent of Kirra ReeflsquorecoveryrsquoislikleytobesubstantivelycompleteFloralandfaunalcommunitieswill undergo succession between severe storm events but are likley to remain relatively dynamic
Albert S Udy J amp Tibbetts I 2008 Responses of algal communities to gradients in herbivorebiomassandwaterqualityinMarovoLagoonSolomonIslandsCoral0 Reefs2773R82
Anderson MJ 2001 A new method for nonRparametric multivariate analysis of varianceAustral0Ecology2632R46
Anderson MJ 2004 PERMDISP0 a0 FORTRAN0 computer0 program0 for0 permutatinoal0 analysis0 of0 multivariate0 dispersions0 (for0 any0 twoSfactor0 ANOVA0 design)0 using0 permutational0 tests Department of Statistics University of Auckland New Zealand
Cannon LR Goeden GB amp Campbell P 1987 Community patterns revealed by trawling in the interRreef regions of the Great Barrier Reef Memoirs0 of0 the0 Queensland0Museum2545R70
Chapman MG Underwood AJ amp Skilleter GA 1995 Variability at different spatial scalesbetweenasubtidalassemblageexposedtothedischargeofsewageand two control assemblages Journal0 of0 Experimental0 Biology0 and0 Ecology 189 103R122
Cheshire AC Miller DJ amp Stewart R (1999) Effect0 of0 dispersed0 sediment0 plumes0 from0beach0sand0replenishment0dredging0on0recruitment0of0phaeophycean0algae0 to0rocky0reefs0in0Gulf0St0Vincent0South0Australia0The0Impact0of0Sand0Dredging0 on0 Benthic0 Community0 Structure0 at0 the0 Port0 Stanvac0 Dredge0 Site0 20 1S39 UniversityofAdelaideAdelaide
ConnellJHHughesTPampWallaceCC1997A30Ryearstudyofcoralabundance recruitment and disturbance at several scales in space and time Ecological0 Monographs67461R488
Diaz MC amp Rutzler K 2001 Sponges an essential component of Caribbean coral reefsBulletin0of0Marine0Science69535R546
DodgeREampVaisnysJR1977Coralpopulationsandgrowthpatternsresponsesto sedimentation and turbidity associated with dredging Journal0 of0 Marine0 Research35715R730
Done TJ 1982 Patterns in the distribution of coral communities across the central GreatBarrierReefCoral0Reefs195R107
Edwards RA amp Smith DA 2005 Subtidal assemblages associated with a geotextile reef insouthReastQueenslandAustraliaMarine0and0Freshwater0Research56 133R142
FisheriesResearchConsultants1991Survey0of0the0Intertidal0and0Subtidal0Rocky0Reefs0 of0 the0 Sunshine0 Coast report prepared for Queensland National Parks and WildlifeService
HarrisonPHarriotVBanksSampHolmesN1998ThecoralcommunitiesofFlinders Reef andMyora Reef in theMoretonBay MarineParkQueensland Australia In Moreton0 Bay0 and0 Catchment Tibbits I Hall N amp Dennison W (Eds) SchoolofMarineScienceUniversityofQueenslandStLuciapp525R536
Hatcher B Johannes R amp Robertson A 1989 Review of research relevant to the conservationofshallowtropicalmarineecosystemsOceanography0and0Marine0 Biology0an0Annual0Review27337R414
Hoey A amp Bellwood D 2008 CrossRshelf variation in the role of parrotfishes on the GreatBarrierReefCoral0Reefs37R47
TRESBPKirraReefMarineBiotaMonitoring2015 56
frc environmental
Hollingsworth P 1975 Environmental Investigation Report Crown Reserve R R68 Currumbin Creek City of the Gold Coast Land Administration Commission unpublishedreport
Hughes TP 1994 Catastrophes phase shifts and large scale degradation of a CaribbeancoralreefScience2651547R1551
Hughes TP Rodrigues MJ Bellwood DR Ceccarelli D HoeghRGuldberg O McCook L Moltschaniwskvi N Pratchett MS Steneck RS amp Willis B 2007Phaseshiftsherbivoryandtheresilienceofcoralreefstoclimatechange Current0Biology17360R365
Hutchinson A Rempel C Taveras V Loder J amp Salmond J 2013 Reef0 Check0 Australia0 South0 East0 Queensland0 Summary0 Report0 2013 report prepared for ReefCheckFoundationLimited
Hyder Consulting 1997 Tweed0 River0 Entrance0 Sand0 Bypassing0 Project0 Permanent0 Bypassing0 System0 0 Environmental0 Impact0 Statement0 0 Impact0 Assessment0 Study report prepared for New South Wales Department of Land and Water Conservation
Jompa J amp McCook LJ 2002 Effects of competition and herbivory on interactions betweenahardcoralandabrownalgaJournal0of0Experimental0Marine0Biology0 and0Ecology27125R39
KayAMampKeoughMJ1981Occupationofpatchesintheepifaunalcommunitieson pier pilings and the bivalve Pinna bicolor at Edithburgh South Australia Oecologia48123R130
KennellyS1987aInhibitionofkelprecruitmentbyturfingalgaeandconsequencesfor an Australian kelp community Journal0 of0 Experimental0 Marine0 Biology0 and0 Ecology11249R60
Kennelly S 1987b Physical disturbances in an Australian kelp community I temporal effectsMarine0Ecology0Progress0Series40145R153
TRESBPKirraReefMarineBiotaMonitoring2015 57
frc environmental
Kennelly S 1989 Effects of kelp canopies on understory species due to shade and scourMarine0Ecology0Progress0Series50215R224
Lassig BR 1983 The effects of a cyclonic storm on coral reef fish assemblages Environmental0Biology0of0Fishes955R63
Lawson S McMahon J amp Boswood P 2001 Environmental management of the construction and operation of a sand bypassing system at the Tweed River EntranceInThe15thAustralasianCoastalandOceanEngineeringConference the 8th Australasian Port and Harbour Conference 25 R 28 September 2001 QueenslandAustralia
Lesser MP 2006 BenthicRpelagic coupling on coral reefs feeding and growth of Caribbean sponges Journal0 of0 Experimental0 Marine0 Biology0 amp0 Ecology 328 277R288
LopezRVictoriaM ZeaSampWei E2006 Competition for spacebetweenencrusting excavatingCaribbeanspongesandothercoral reeforganismsMarine0Ecology0 Progress0Series312113R121
MalcolmHASmithSDAampJordanA2009Usingpatternsofreeffishassemblages to refine a Habitat Classification System for marine parks in NSW Australia Aquatic0Conservation0Marine0and0Freshwater0Ecosystems2083R92
Massel SR amp Done TJ 1993 Effects of cyclone waves on massive coral assemblages on the Great Barrier Reef meteorology hydrodynamics and demographyCoral0Reefs12153R166
Mumby PJ amp Steneck RS 2008 Coral reef management and conservation in light of rapidly evolving ecological paradigms Trends in Ecology amp Evoution 23 555 -563
Murphy HM amp Jenkins GP 2010 Observational methods used in marine spatial monitoring of fishes and associated habitats a review Marine and Freshwater Research 61 236-252
Noriega R 2007 An Overview of Available Information on Sandy Beach Ecology Coastal Sand Dunes Rocky Reefs and Associated Biota on the Gold Coast Griffith Centre for Coastal Management Research Report No 85 report prepared for Griffith University
Parker P (1995) Structure to Reef Fish Assemblages at Julian Rocks Northern New South Wales Masters Thesis Griffith University
Parker PG 1999 Fish assemblages at Julian Rocks and the adjacent waters of northern New South Wales Australia Australian Zoologist 31 134 - 160
Pawlik JR Steindler L Henkel TP Beer S amp Ilan M 2007 Chemical warfare on coral reefs sponge metabolites differentially affect coral symbiosis in situ Limnology and Oceanography 52 907-911
Reef Check 2010 httpwwwreefcheckaustraliaorgdatahtml accessed December 2015
Robinson KI amp Pollard DA 1982 Marine and estuarine reserves in Australia with particular reference to New South Wales Wetlands 2 17 - 26
Rogers CS 1990 Responses of coral reefs and reef organisms to sedimentation Marine Ecology Progress Series 62 185-202
Russ GR 2003 Grazer biomass correlates more strongly with production than with biomass of algal turfs on a coral reef Coral Reefs 22 63-67
Rutzler K 2002 Impact of crustose clionid sponges on Caribbean reef corals Acta Geologica Hispanica 37 61-72
Scheffers SR Nieuwland G Bak RPM amp van Duyl FC 2004 Removal of bacteria and nutrient dynamics within the coral reef framework of Curacao (Netherlands Antilles) Coral Reefs 23 413-422
TRESBP Kirra Reef Marine Biota Monitoring 2015 59
frc environmental
Schlacher-Hoenlinger M Walker S Johnson J Schlacher T amp Hooper J 2009 Biological Monitoring of the Ex-HMAS Brisbane Artificial Reef Phase II - Habitat Values report prepared for Environmental Protection Agency (EPA)
Smith KA 2003 A simple multivariate technique to improve the design of a sampling strategy for age-based fishery monitoring Fisheries Research 64 79-85
Smith S Edwards R Dalton S amp Harrison M 2005 Biological assessment of fish and benthic communities at Palm Beach Bait Reef Gold Coast Queensland report prepared for University of New England
TRESBP 2014 Autum 2009 storms httpwwwtweedsandbypassnswgovauarticles-and-studiesinteresting-itemsautumn-2009-storm updated 4 May 2014 accessed December 2015
TRESBP 2015a Tweed Sand Bypassing Restoring Coastal Sand Drift Improving Boating Access ndash Techinical information httpwwwtweedsandbypassnswgovau__dataassetspdf_file0004552055kir ra-feb-2015pdf acessed December 2015
TRESBP 2015b Waves httpwwwtweedsandbypassnswgovauenvironmental-monitoringcoastal-conditionswaves updated 30 September 2015 accessed December 2015
Umar MJMLJ amp Price IR 1998 Effects of sediment deposition on the seaweed Sargassum on a fringing coral reef Coral Reefs 17 169-177
Underwood AJ amp Kennelly SJ 1990 Ecology of marine algae on rocky shores and subtidal reefs in temperate Australia Hydrobiologia 192 3-20
Walker S Schlacher T amp Schlacher-Hoenlinger M 2007 Spatial heterogeneity of epibenthos on artificial reefs fouling communities in the early stages of colonization on an East Australian shipwreck Marine Ecology 28 435-445
Walker SJ Degnan BM Hooper JNA amp Skilleter GA 2008 Will increased storm intensity from climate change affect biodiversity in non-scleractinian sessile fauna on coral reefs Global Change Biology 14 2755-2770
Warwick RM amp Clarke KR 1993 Increased variability as a symptom of stress in marine communtities Journal of Experimental Marine Biology and Ecology 172 215-216
Thenumberofsitessurveyedhasvariedover timeasaresultof the fluctuating levelof sandcoveringKirraReef
Prior to May 2003 three sites were assessed along the eastern and northern edge of KirraReef(KirraReefOutersites1to3)andthreesiteswereexaminedalongtheinshore marginof the reef (KirraReef Inner sites1 to 3)(MapA1) ReefRedge (ieKirraOuter) siteswerechosentoprovideearlywarningofimpactsfromoffshoreplacementofdredged sandwhilst inshoresites(ieKirraInner)werechosentoindicatewhetherimpactsfrom inshore beach profile development were affecting the reef platform In May 2003 the threeeasternsitesatKirraReef (ieKRO1KRO2andKRI1)werecompletelycovered with bare mobile sand Consequently only the three western sites at Kirra Reef (ie KRO3KRI2andKRI3)supportedbenthicfloraandfaunaInMarch2004theextentof the remainingwesternoutcropof KirraReef had been further reduced so that all inner reefsiteswerecompletelycoveredwithmobilesandConsequentlyonlyasingleoriginal reefsite(ieKRO3)couldbesurveyed(Figure23)Thereforetoprovideanindicationof the condition of the remaining reef two new sites were established (ie KRN1 and KRN2)(Figure23)andsurveyedinMarch2004Theextentofthewesternreefhadbeen further reduced by February 2005 and a third new site (ie KRN3) was established (Figure23)Consequentlyfoursites(KRO3KRN1KRN2andKRN3)weresurveyedin February2005
InFebruary2010fourKirraReefsites(ieKRO3KRO1KRN1andKRN2)wereclearof thesurroundingsandandsupportedbenthic floraand fauna Inaddition several rocks protruded from the sand in the vicinity of site KRI2H these were assessed to provide a quantitativeindicationofbroadRscaletemporalchangestotheinshorereefcommunities
SOURCEScopy Copyright Commonwealth of Australia (Geoscience Australia) 2001 2004 2006copy The State of Queensland (Department of Natural Resources and Mines) 2015copy Nearmap 2014 2015
DATE2015-09-09
DRAWN BYCF
VERSION02
PROJECTIONCoordinate System GDA 1994 MGA Zone 56Projection Transverse MercatorDatum GDA 1994
plusmn SCALE
0 50 100
Metres
Scale 12500 A3
frc environmental
Appendix$B$ Introduction$to$Data$Analysis$Used$
Multivariate$Analyses$
Multivariate statistical techniques are widely used in ecology to assess the similarities relationshipsbetweenassemblagesWhereasunivariateanalysescanonlycompareone variable at a time (eg an index of community structure such as a diversity index or a singleindicatorspecies)multivariateanalysescancomparesamplesbasedontheextent thatassemblagesshareparticulartaxaandabundances(ClarkeampWarwick2001)
Thefirststepofmultivariateanalysisusuallyinvolvesthecreationofamatrixofsimilarity coefficients computed between every pair of samples The coefficient is usually a measureofhowclose theabundance is foreachspecies (definedso that100= total similarity and 0=complete dissimilarity) The Bray Curtis similarity measure is commonlythemostappropriateforbiologicaldata(ClarkeampWarwick2001)
MultidimensionalScaling
NonRmetricmultiRdimensionalscalingordinations(nMDS)attempttoplacesamplesintwo dimensionalspacesothattherankorderofthedistancesbetweensamplesmatchesthe rankorderofthematchingsimilaritiesfromthesimilaritymatrix(ClarkeampWarwick2001) Thisprovidesavisualrepresentationofthesimilaritiesbetweenassemblageswithineach sampleEachoftheaxesisnotrelatedtoanyparticularvalueHinfactaxescanberotated toprovide thebestvisual representationof thedata Ordinationsareparticularlyuseful tools for analysing and visually presenting differences between assemblages Ordinationsareessentiallymapsofsamples inwhich theplacementofsampleson the mapreflectsthesimilarlyofthecommunitytothecommunitiesinothersamples(Clarkeamp Warwick 2001) Distances between samples on an ordination attempt to match the similarities inassemblagestructurenearbypoints representassemblageswithvery few attributes(speciesorabundanceofspecies)Hpoints faraparthavevery fewattributes in common(ClarkeampWarwick2001)
A stress coefficient is calculated to reflect the extent to which the multiRdimensional scalingordinationandthesimilaritymatrixagree(ClarkeampWarwick2001)(iehowwell the multiRdimensional scaling ordination accurately reflects the relationship between samples)Stressvaluesoflt015aregenerallyacceptable
In Figure A1 each freshwater macroinvertebrate sample is represented on the multiRdimensionalscalingordination By lookingat thedistancesbetweeneachsample
ANOSIMisanalogoustoANOVAinunivariatestatistics(Smith2003)AglobalRstatistic iscalculatedtodeterminewhetherthereisasignificantdifferencebetweenallsamplesIf there are differences then pairwise comparisons are conducted to test for differences betweenpairsofsamples(analogoustopostRhoctestsinANOVA)
The R value lies between R1 and +1 (all similarities within groups are less than any similarity between groups) with a value of zero representing the null hypothesis (no differenceamongasetofsamples)(ClarkeampWarwick2001)ComparisonofpairwiseR values can give an indication of how different assemblages are R values close to 0 indicatelittledifferencevaluesaround05indicatesomeoverlapandvaluescloseto1to indicate many or substantial differences In many instances however researches are primarily interestedinwhethertheRvalueisstatisticallydifferentfromzero(usuallyata confidence level of 005) (Clarke amp Warwick 2001) (ie whether they can reject the null hypothesis)
ANOSIM can provide information on whether the (visual) differences between assemblages in the multiRdimensional scaling ordination are significantH it is an independenttestfromthemultiRdimensionalscalingordinationItisbasedontestingthe
TRESBPKirraReefMarineBiotaMonitoring2015 B2
frc environmental
differences between the rank similarities in the similarity matrix not on the distances betweensamplesinthemultiRdimensionalscalingordination(ClarkeampWarwick2001)
PermutationalMultivariateAnalysisofVariance
PERMANOVAisusedtotestsimultaneousresponsesofoneormorevariablestooneor more factors in an a0 priori0 structured design using random permutation of the data to assess significance (Anderson 2004) PERMANOVA generates a pseudo FRstatistic similar to traditional ANOVA but pRvalues are calculated with permutations which does notassumenormaldatadistribution PERMANOVAcanprovide informationonwhether the (visual) differences between assemblages in a multiRdimensional scaling ordination are significantH however it is an independent test from the multiRdimensional scaling ordination
Thelevelofmultivariatedispersionamongsampleswithineachofthetestgroupscanbe examined using the permutational analysis of multivariate dispersions (PERMDISP) routine(Anderson2004)Intraditionalimpactassessmentachangeinthedispersionof datacanalsoindicateanimpact
SimilarityPercentagendashSpeciesContributions
SIMPER analysis provides information on how dissimilar assemblages from various groups are (eg how similar all of the macroinvertebrate samples taken for a particular habitatwithinastreamreachare)andhowsimilareachgroup(egreach)istoanyother group SIMPER analysis also identifies the species taxa that are contributing to the dissimilarity between two assemblages in rank order (ie it identifies which species is contributingthemosttothedifferences)SIMPERanalysismayhelptoidentifypotential lsquoindicatorrsquospeciesForexampleifaparticularspeciesconsistentlycontributesgreatlyto the differences between impacted and unimpacted assemblages it may be a useful indicator Theabundanceofthis indicatorspeciescanthenbecomparedbetweensites usingunivariatetechniquessuchasANOVA
Data is available on request from tresbpprojectofficecrownlandnswgov
TRESBPKirraReefMarineBiotaMonitoring2015 C1
frc environmental
Appendix(D( Pairwise( PERMANOVA( Results
Data is available on request from tresbpprojectofficecrownlandnswgov
TRESBPKirraReefMarineBiotaMonitoring2015 D1
frc environmental
Appendix(E( Relative(Abundance(of(Fish(found(at(Kirra(( ( and(Palm(Beach(Reefs(in(Each(Survey((Data is available on request from tresbpprojectofficecrownlandnswgovau
TRESBPKirraReefMarineBiotaMonitoring2015 E1
Structure Bookmarks
0 50 100 Metres Scale 12500 A3
0 50 100 200 Metres Scale 15000 A3
Kirra Reef
Kirra Reef
Kirra Reef
Kirra Reef
Kirra Reef
Kirra Reef
Map A1Location of Kirra Reef monitoring sites
Table D8 Pairwise comparison of macroalgae cover between sites in each year
Table D15 Pairwise comparison of turf algae cover between sites in each year
Table D29 Pairwise comparison of ascidian cover between sites in each year
Table D43 Pairwise comparison of soft coral cover between sites in each year
frc environmental
6$ References$
Albert S Udy J amp Tibbetts I 2008 Responses of algal communities to gradients in herbivorebiomassandwaterqualityinMarovoLagoonSolomonIslandsCoral0 Reefs2773R82
Anderson MJ 2001 A new method for nonRparametric multivariate analysis of varianceAustral0Ecology2632R46
Anderson MJ 2004 PERMDISP0 a0 FORTRAN0 computer0 program0 for0 permutatinoal0 analysis0 of0 multivariate0 dispersions0 (for0 any0 twoSfactor0 ANOVA0 design)0 using0 permutational0 tests Department of Statistics University of Auckland New Zealand
Cannon LR Goeden GB amp Campbell P 1987 Community patterns revealed by trawling in the interRreef regions of the Great Barrier Reef Memoirs0 of0 the0 Queensland0Museum2545R70
Chapman MG Underwood AJ amp Skilleter GA 1995 Variability at different spatial scalesbetweenasubtidalassemblageexposedtothedischargeofsewageand two control assemblages Journal0 of0 Experimental0 Biology0 and0 Ecology 189 103R122
Cheshire AC Miller DJ amp Stewart R (1999) Effect0 of0 dispersed0 sediment0 plumes0 from0beach0sand0replenishment0dredging0on0recruitment0of0phaeophycean0algae0 to0rocky0reefs0in0Gulf0St0Vincent0South0Australia0The0Impact0of0Sand0Dredging0 on0 Benthic0 Community0 Structure0 at0 the0 Port0 Stanvac0 Dredge0 Site0 20 1S39 UniversityofAdelaideAdelaide
ConnellJHHughesTPampWallaceCC1997A30Ryearstudyofcoralabundance recruitment and disturbance at several scales in space and time Ecological0 Monographs67461R488
Diaz MC amp Rutzler K 2001 Sponges an essential component of Caribbean coral reefsBulletin0of0Marine0Science69535R546
DodgeREampVaisnysJR1977Coralpopulationsandgrowthpatternsresponsesto sedimentation and turbidity associated with dredging Journal0 of0 Marine0 Research35715R730
Done TJ 1982 Patterns in the distribution of coral communities across the central GreatBarrierReefCoral0Reefs195R107
Edwards RA amp Smith DA 2005 Subtidal assemblages associated with a geotextile reef insouthReastQueenslandAustraliaMarine0and0Freshwater0Research56 133R142
FisheriesResearchConsultants1991Survey0of0the0Intertidal0and0Subtidal0Rocky0Reefs0 of0 the0 Sunshine0 Coast report prepared for Queensland National Parks and WildlifeService
HarrisonPHarriotVBanksSampHolmesN1998ThecoralcommunitiesofFlinders Reef andMyora Reef in theMoretonBay MarineParkQueensland Australia In Moreton0 Bay0 and0 Catchment Tibbits I Hall N amp Dennison W (Eds) SchoolofMarineScienceUniversityofQueenslandStLuciapp525R536
Hatcher B Johannes R amp Robertson A 1989 Review of research relevant to the conservationofshallowtropicalmarineecosystemsOceanography0and0Marine0 Biology0an0Annual0Review27337R414
Hoey A amp Bellwood D 2008 CrossRshelf variation in the role of parrotfishes on the GreatBarrierReefCoral0Reefs37R47
TRESBPKirraReefMarineBiotaMonitoring2015 56
frc environmental
Hollingsworth P 1975 Environmental Investigation Report Crown Reserve R R68 Currumbin Creek City of the Gold Coast Land Administration Commission unpublishedreport
Hughes TP 1994 Catastrophes phase shifts and large scale degradation of a CaribbeancoralreefScience2651547R1551
Hughes TP Rodrigues MJ Bellwood DR Ceccarelli D HoeghRGuldberg O McCook L Moltschaniwskvi N Pratchett MS Steneck RS amp Willis B 2007Phaseshiftsherbivoryandtheresilienceofcoralreefstoclimatechange Current0Biology17360R365
Hutchinson A Rempel C Taveras V Loder J amp Salmond J 2013 Reef0 Check0 Australia0 South0 East0 Queensland0 Summary0 Report0 2013 report prepared for ReefCheckFoundationLimited
Hyder Consulting 1997 Tweed0 River0 Entrance0 Sand0 Bypassing0 Project0 Permanent0 Bypassing0 System0 0 Environmental0 Impact0 Statement0 0 Impact0 Assessment0 Study report prepared for New South Wales Department of Land and Water Conservation
Jompa J amp McCook LJ 2002 Effects of competition and herbivory on interactions betweenahardcoralandabrownalgaJournal0of0Experimental0Marine0Biology0 and0Ecology27125R39
KayAMampKeoughMJ1981Occupationofpatchesintheepifaunalcommunitieson pier pilings and the bivalve Pinna bicolor at Edithburgh South Australia Oecologia48123R130
KennellyS1987aInhibitionofkelprecruitmentbyturfingalgaeandconsequencesfor an Australian kelp community Journal0 of0 Experimental0 Marine0 Biology0 and0 Ecology11249R60
Kennelly S 1987b Physical disturbances in an Australian kelp community I temporal effectsMarine0Ecology0Progress0Series40145R153
TRESBPKirraReefMarineBiotaMonitoring2015 57
frc environmental
Kennelly S 1989 Effects of kelp canopies on understory species due to shade and scourMarine0Ecology0Progress0Series50215R224
Lassig BR 1983 The effects of a cyclonic storm on coral reef fish assemblages Environmental0Biology0of0Fishes955R63
Lawson S McMahon J amp Boswood P 2001 Environmental management of the construction and operation of a sand bypassing system at the Tweed River EntranceInThe15thAustralasianCoastalandOceanEngineeringConference the 8th Australasian Port and Harbour Conference 25 R 28 September 2001 QueenslandAustralia
Lesser MP 2006 BenthicRpelagic coupling on coral reefs feeding and growth of Caribbean sponges Journal0 of0 Experimental0 Marine0 Biology0 amp0 Ecology 328 277R288
LopezRVictoriaM ZeaSampWei E2006 Competition for spacebetweenencrusting excavatingCaribbeanspongesandothercoral reeforganismsMarine0Ecology0 Progress0Series312113R121
MalcolmHASmithSDAampJordanA2009Usingpatternsofreeffishassemblages to refine a Habitat Classification System for marine parks in NSW Australia Aquatic0Conservation0Marine0and0Freshwater0Ecosystems2083R92
Massel SR amp Done TJ 1993 Effects of cyclone waves on massive coral assemblages on the Great Barrier Reef meteorology hydrodynamics and demographyCoral0Reefs12153R166
Mumby PJ amp Steneck RS 2008 Coral reef management and conservation in light of rapidly evolving ecological paradigms Trends in Ecology amp Evoution 23 555 -563
Murphy HM amp Jenkins GP 2010 Observational methods used in marine spatial monitoring of fishes and associated habitats a review Marine and Freshwater Research 61 236-252
Noriega R 2007 An Overview of Available Information on Sandy Beach Ecology Coastal Sand Dunes Rocky Reefs and Associated Biota on the Gold Coast Griffith Centre for Coastal Management Research Report No 85 report prepared for Griffith University
Parker P (1995) Structure to Reef Fish Assemblages at Julian Rocks Northern New South Wales Masters Thesis Griffith University
Parker PG 1999 Fish assemblages at Julian Rocks and the adjacent waters of northern New South Wales Australia Australian Zoologist 31 134 - 160
Pawlik JR Steindler L Henkel TP Beer S amp Ilan M 2007 Chemical warfare on coral reefs sponge metabolites differentially affect coral symbiosis in situ Limnology and Oceanography 52 907-911
Reef Check 2010 httpwwwreefcheckaustraliaorgdatahtml accessed December 2015
Robinson KI amp Pollard DA 1982 Marine and estuarine reserves in Australia with particular reference to New South Wales Wetlands 2 17 - 26
Rogers CS 1990 Responses of coral reefs and reef organisms to sedimentation Marine Ecology Progress Series 62 185-202
Russ GR 2003 Grazer biomass correlates more strongly with production than with biomass of algal turfs on a coral reef Coral Reefs 22 63-67
Rutzler K 2002 Impact of crustose clionid sponges on Caribbean reef corals Acta Geologica Hispanica 37 61-72
Scheffers SR Nieuwland G Bak RPM amp van Duyl FC 2004 Removal of bacteria and nutrient dynamics within the coral reef framework of Curacao (Netherlands Antilles) Coral Reefs 23 413-422
TRESBP Kirra Reef Marine Biota Monitoring 2015 59
frc environmental
Schlacher-Hoenlinger M Walker S Johnson J Schlacher T amp Hooper J 2009 Biological Monitoring of the Ex-HMAS Brisbane Artificial Reef Phase II - Habitat Values report prepared for Environmental Protection Agency (EPA)
Smith KA 2003 A simple multivariate technique to improve the design of a sampling strategy for age-based fishery monitoring Fisheries Research 64 79-85
Smith S Edwards R Dalton S amp Harrison M 2005 Biological assessment of fish and benthic communities at Palm Beach Bait Reef Gold Coast Queensland report prepared for University of New England
TRESBP 2014 Autum 2009 storms httpwwwtweedsandbypassnswgovauarticles-and-studiesinteresting-itemsautumn-2009-storm updated 4 May 2014 accessed December 2015
TRESBP 2015a Tweed Sand Bypassing Restoring Coastal Sand Drift Improving Boating Access ndash Techinical information httpwwwtweedsandbypassnswgovau__dataassetspdf_file0004552055kir ra-feb-2015pdf acessed December 2015
TRESBP 2015b Waves httpwwwtweedsandbypassnswgovauenvironmental-monitoringcoastal-conditionswaves updated 30 September 2015 accessed December 2015
Umar MJMLJ amp Price IR 1998 Effects of sediment deposition on the seaweed Sargassum on a fringing coral reef Coral Reefs 17 169-177
Underwood AJ amp Kennelly SJ 1990 Ecology of marine algae on rocky shores and subtidal reefs in temperate Australia Hydrobiologia 192 3-20
Walker S Schlacher T amp Schlacher-Hoenlinger M 2007 Spatial heterogeneity of epibenthos on artificial reefs fouling communities in the early stages of colonization on an East Australian shipwreck Marine Ecology 28 435-445
Walker SJ Degnan BM Hooper JNA amp Skilleter GA 2008 Will increased storm intensity from climate change affect biodiversity in non-scleractinian sessile fauna on coral reefs Global Change Biology 14 2755-2770
Warwick RM amp Clarke KR 1993 Increased variability as a symptom of stress in marine communtities Journal of Experimental Marine Biology and Ecology 172 215-216
Thenumberofsitessurveyedhasvariedover timeasaresultof the fluctuating levelof sandcoveringKirraReef
Prior to May 2003 three sites were assessed along the eastern and northern edge of KirraReef(KirraReefOutersites1to3)andthreesiteswereexaminedalongtheinshore marginof the reef (KirraReef Inner sites1 to 3)(MapA1) ReefRedge (ieKirraOuter) siteswerechosentoprovideearlywarningofimpactsfromoffshoreplacementofdredged sandwhilst inshoresites(ieKirraInner)werechosentoindicatewhetherimpactsfrom inshore beach profile development were affecting the reef platform In May 2003 the threeeasternsitesatKirraReef (ieKRO1KRO2andKRI1)werecompletelycovered with bare mobile sand Consequently only the three western sites at Kirra Reef (ie KRO3KRI2andKRI3)supportedbenthicfloraandfaunaInMarch2004theextentof the remainingwesternoutcropof KirraReef had been further reduced so that all inner reefsiteswerecompletelycoveredwithmobilesandConsequentlyonlyasingleoriginal reefsite(ieKRO3)couldbesurveyed(Figure23)Thereforetoprovideanindicationof the condition of the remaining reef two new sites were established (ie KRN1 and KRN2)(Figure23)andsurveyedinMarch2004Theextentofthewesternreefhadbeen further reduced by February 2005 and a third new site (ie KRN3) was established (Figure23)Consequentlyfoursites(KRO3KRN1KRN2andKRN3)weresurveyedin February2005
InFebruary2010fourKirraReefsites(ieKRO3KRO1KRN1andKRN2)wereclearof thesurroundingsandandsupportedbenthic floraand fauna Inaddition several rocks protruded from the sand in the vicinity of site KRI2H these were assessed to provide a quantitativeindicationofbroadRscaletemporalchangestotheinshorereefcommunities
SOURCEScopy Copyright Commonwealth of Australia (Geoscience Australia) 2001 2004 2006copy The State of Queensland (Department of Natural Resources and Mines) 2015copy Nearmap 2014 2015
DATE2015-09-09
DRAWN BYCF
VERSION02
PROJECTIONCoordinate System GDA 1994 MGA Zone 56Projection Transverse MercatorDatum GDA 1994
plusmn SCALE
0 50 100
Metres
Scale 12500 A3
frc environmental
Appendix$B$ Introduction$to$Data$Analysis$Used$
Multivariate$Analyses$
Multivariate statistical techniques are widely used in ecology to assess the similarities relationshipsbetweenassemblagesWhereasunivariateanalysescanonlycompareone variable at a time (eg an index of community structure such as a diversity index or a singleindicatorspecies)multivariateanalysescancomparesamplesbasedontheextent thatassemblagesshareparticulartaxaandabundances(ClarkeampWarwick2001)
Thefirststepofmultivariateanalysisusuallyinvolvesthecreationofamatrixofsimilarity coefficients computed between every pair of samples The coefficient is usually a measureofhowclose theabundance is foreachspecies (definedso that100= total similarity and 0=complete dissimilarity) The Bray Curtis similarity measure is commonlythemostappropriateforbiologicaldata(ClarkeampWarwick2001)
MultidimensionalScaling
NonRmetricmultiRdimensionalscalingordinations(nMDS)attempttoplacesamplesintwo dimensionalspacesothattherankorderofthedistancesbetweensamplesmatchesthe rankorderofthematchingsimilaritiesfromthesimilaritymatrix(ClarkeampWarwick2001) Thisprovidesavisualrepresentationofthesimilaritiesbetweenassemblageswithineach sampleEachoftheaxesisnotrelatedtoanyparticularvalueHinfactaxescanberotated toprovide thebestvisual representationof thedata Ordinationsareparticularlyuseful tools for analysing and visually presenting differences between assemblages Ordinationsareessentiallymapsofsamples inwhich theplacementofsampleson the mapreflectsthesimilarlyofthecommunitytothecommunitiesinothersamples(Clarkeamp Warwick 2001) Distances between samples on an ordination attempt to match the similarities inassemblagestructurenearbypoints representassemblageswithvery few attributes(speciesorabundanceofspecies)Hpoints faraparthavevery fewattributes in common(ClarkeampWarwick2001)
A stress coefficient is calculated to reflect the extent to which the multiRdimensional scalingordinationandthesimilaritymatrixagree(ClarkeampWarwick2001)(iehowwell the multiRdimensional scaling ordination accurately reflects the relationship between samples)Stressvaluesoflt015aregenerallyacceptable
In Figure A1 each freshwater macroinvertebrate sample is represented on the multiRdimensionalscalingordination By lookingat thedistancesbetweeneachsample
ANOSIMisanalogoustoANOVAinunivariatestatistics(Smith2003)AglobalRstatistic iscalculatedtodeterminewhetherthereisasignificantdifferencebetweenallsamplesIf there are differences then pairwise comparisons are conducted to test for differences betweenpairsofsamples(analogoustopostRhoctestsinANOVA)
The R value lies between R1 and +1 (all similarities within groups are less than any similarity between groups) with a value of zero representing the null hypothesis (no differenceamongasetofsamples)(ClarkeampWarwick2001)ComparisonofpairwiseR values can give an indication of how different assemblages are R values close to 0 indicatelittledifferencevaluesaround05indicatesomeoverlapandvaluescloseto1to indicate many or substantial differences In many instances however researches are primarily interestedinwhethertheRvalueisstatisticallydifferentfromzero(usuallyata confidence level of 005) (Clarke amp Warwick 2001) (ie whether they can reject the null hypothesis)
ANOSIM can provide information on whether the (visual) differences between assemblages in the multiRdimensional scaling ordination are significantH it is an independenttestfromthemultiRdimensionalscalingordinationItisbasedontestingthe
TRESBPKirraReefMarineBiotaMonitoring2015 B2
frc environmental
differences between the rank similarities in the similarity matrix not on the distances betweensamplesinthemultiRdimensionalscalingordination(ClarkeampWarwick2001)
PermutationalMultivariateAnalysisofVariance
PERMANOVAisusedtotestsimultaneousresponsesofoneormorevariablestooneor more factors in an a0 priori0 structured design using random permutation of the data to assess significance (Anderson 2004) PERMANOVA generates a pseudo FRstatistic similar to traditional ANOVA but pRvalues are calculated with permutations which does notassumenormaldatadistribution PERMANOVAcanprovide informationonwhether the (visual) differences between assemblages in a multiRdimensional scaling ordination are significantH however it is an independent test from the multiRdimensional scaling ordination
Thelevelofmultivariatedispersionamongsampleswithineachofthetestgroupscanbe examined using the permutational analysis of multivariate dispersions (PERMDISP) routine(Anderson2004)Intraditionalimpactassessmentachangeinthedispersionof datacanalsoindicateanimpact
SimilarityPercentagendashSpeciesContributions
SIMPER analysis provides information on how dissimilar assemblages from various groups are (eg how similar all of the macroinvertebrate samples taken for a particular habitatwithinastreamreachare)andhowsimilareachgroup(egreach)istoanyother group SIMPER analysis also identifies the species taxa that are contributing to the dissimilarity between two assemblages in rank order (ie it identifies which species is contributingthemosttothedifferences)SIMPERanalysismayhelptoidentifypotential lsquoindicatorrsquospeciesForexampleifaparticularspeciesconsistentlycontributesgreatlyto the differences between impacted and unimpacted assemblages it may be a useful indicator Theabundanceofthis indicatorspeciescanthenbecomparedbetweensites usingunivariatetechniquessuchasANOVA
Data is available on request from tresbpprojectofficecrownlandnswgov
TRESBPKirraReefMarineBiotaMonitoring2015 C1
frc environmental
Appendix(D( Pairwise( PERMANOVA( Results
Data is available on request from tresbpprojectofficecrownlandnswgov
TRESBPKirraReefMarineBiotaMonitoring2015 D1
frc environmental
Appendix(E( Relative(Abundance(of(Fish(found(at(Kirra(( ( and(Palm(Beach(Reefs(in(Each(Survey((Data is available on request from tresbpprojectofficecrownlandnswgovau
TRESBPKirraReefMarineBiotaMonitoring2015 E1
Structure Bookmarks
0 50 100 Metres Scale 12500 A3
0 50 100 200 Metres Scale 15000 A3
Kirra Reef
Kirra Reef
Kirra Reef
Kirra Reef
Kirra Reef
Kirra Reef
Map A1Location of Kirra Reef monitoring sites
Table D8 Pairwise comparison of macroalgae cover between sites in each year
Table D15 Pairwise comparison of turf algae cover between sites in each year
Table D29 Pairwise comparison of ascidian cover between sites in each year
Table D43 Pairwise comparison of soft coral cover between sites in each year
frc environmental
Schlacher-Hoenlinger M Walker S Johnson J Schlacher T amp Hooper J 2009 Biological Monitoring of the Ex-HMAS Brisbane Artificial Reef Phase II - Habitat Values report prepared for Environmental Protection Agency (EPA)
Smith KA 2003 A simple multivariate technique to improve the design of a sampling strategy for age-based fishery monitoring Fisheries Research 64 79-85
Smith S Edwards R Dalton S amp Harrison M 2005 Biological assessment of fish and benthic communities at Palm Beach Bait Reef Gold Coast Queensland report prepared for University of New England
TRESBP 2014 Autum 2009 storms httpwwwtweedsandbypassnswgovauarticles-and-studiesinteresting-itemsautumn-2009-storm updated 4 May 2014 accessed December 2015
TRESBP 2015a Tweed Sand Bypassing Restoring Coastal Sand Drift Improving Boating Access ndash Techinical information httpwwwtweedsandbypassnswgovau__dataassetspdf_file0004552055kir ra-feb-2015pdf acessed December 2015
TRESBP 2015b Waves httpwwwtweedsandbypassnswgovauenvironmental-monitoringcoastal-conditionswaves updated 30 September 2015 accessed December 2015
Umar MJMLJ amp Price IR 1998 Effects of sediment deposition on the seaweed Sargassum on a fringing coral reef Coral Reefs 17 169-177
Underwood AJ amp Kennelly SJ 1990 Ecology of marine algae on rocky shores and subtidal reefs in temperate Australia Hydrobiologia 192 3-20
Walker S Schlacher T amp Schlacher-Hoenlinger M 2007 Spatial heterogeneity of epibenthos on artificial reefs fouling communities in the early stages of colonization on an East Australian shipwreck Marine Ecology 28 435-445
Walker SJ Degnan BM Hooper JNA amp Skilleter GA 2008 Will increased storm intensity from climate change affect biodiversity in non-scleractinian sessile fauna on coral reefs Global Change Biology 14 2755-2770
Warwick RM amp Clarke KR 1993 Increased variability as a symptom of stress in marine communtities Journal of Experimental Marine Biology and Ecology 172 215-216
Thenumberofsitessurveyedhasvariedover timeasaresultof the fluctuating levelof sandcoveringKirraReef
Prior to May 2003 three sites were assessed along the eastern and northern edge of KirraReef(KirraReefOutersites1to3)andthreesiteswereexaminedalongtheinshore marginof the reef (KirraReef Inner sites1 to 3)(MapA1) ReefRedge (ieKirraOuter) siteswerechosentoprovideearlywarningofimpactsfromoffshoreplacementofdredged sandwhilst inshoresites(ieKirraInner)werechosentoindicatewhetherimpactsfrom inshore beach profile development were affecting the reef platform In May 2003 the threeeasternsitesatKirraReef (ieKRO1KRO2andKRI1)werecompletelycovered with bare mobile sand Consequently only the three western sites at Kirra Reef (ie KRO3KRI2andKRI3)supportedbenthicfloraandfaunaInMarch2004theextentof the remainingwesternoutcropof KirraReef had been further reduced so that all inner reefsiteswerecompletelycoveredwithmobilesandConsequentlyonlyasingleoriginal reefsite(ieKRO3)couldbesurveyed(Figure23)Thereforetoprovideanindicationof the condition of the remaining reef two new sites were established (ie KRN1 and KRN2)(Figure23)andsurveyedinMarch2004Theextentofthewesternreefhadbeen further reduced by February 2005 and a third new site (ie KRN3) was established (Figure23)Consequentlyfoursites(KRO3KRN1KRN2andKRN3)weresurveyedin February2005
InFebruary2010fourKirraReefsites(ieKRO3KRO1KRN1andKRN2)wereclearof thesurroundingsandandsupportedbenthic floraand fauna Inaddition several rocks protruded from the sand in the vicinity of site KRI2H these were assessed to provide a quantitativeindicationofbroadRscaletemporalchangestotheinshorereefcommunities
SOURCEScopy Copyright Commonwealth of Australia (Geoscience Australia) 2001 2004 2006copy The State of Queensland (Department of Natural Resources and Mines) 2015copy Nearmap 2014 2015
DATE2015-09-09
DRAWN BYCF
VERSION02
PROJECTIONCoordinate System GDA 1994 MGA Zone 56Projection Transverse MercatorDatum GDA 1994
plusmn SCALE
0 50 100
Metres
Scale 12500 A3
frc environmental
Appendix$B$ Introduction$to$Data$Analysis$Used$
Multivariate$Analyses$
Multivariate statistical techniques are widely used in ecology to assess the similarities relationshipsbetweenassemblagesWhereasunivariateanalysescanonlycompareone variable at a time (eg an index of community structure such as a diversity index or a singleindicatorspecies)multivariateanalysescancomparesamplesbasedontheextent thatassemblagesshareparticulartaxaandabundances(ClarkeampWarwick2001)
Thefirststepofmultivariateanalysisusuallyinvolvesthecreationofamatrixofsimilarity coefficients computed between every pair of samples The coefficient is usually a measureofhowclose theabundance is foreachspecies (definedso that100= total similarity and 0=complete dissimilarity) The Bray Curtis similarity measure is commonlythemostappropriateforbiologicaldata(ClarkeampWarwick2001)
MultidimensionalScaling
NonRmetricmultiRdimensionalscalingordinations(nMDS)attempttoplacesamplesintwo dimensionalspacesothattherankorderofthedistancesbetweensamplesmatchesthe rankorderofthematchingsimilaritiesfromthesimilaritymatrix(ClarkeampWarwick2001) Thisprovidesavisualrepresentationofthesimilaritiesbetweenassemblageswithineach sampleEachoftheaxesisnotrelatedtoanyparticularvalueHinfactaxescanberotated toprovide thebestvisual representationof thedata Ordinationsareparticularlyuseful tools for analysing and visually presenting differences between assemblages Ordinationsareessentiallymapsofsamples inwhich theplacementofsampleson the mapreflectsthesimilarlyofthecommunitytothecommunitiesinothersamples(Clarkeamp Warwick 2001) Distances between samples on an ordination attempt to match the similarities inassemblagestructurenearbypoints representassemblageswithvery few attributes(speciesorabundanceofspecies)Hpoints faraparthavevery fewattributes in common(ClarkeampWarwick2001)
A stress coefficient is calculated to reflect the extent to which the multiRdimensional scalingordinationandthesimilaritymatrixagree(ClarkeampWarwick2001)(iehowwell the multiRdimensional scaling ordination accurately reflects the relationship between samples)Stressvaluesoflt015aregenerallyacceptable
In Figure A1 each freshwater macroinvertebrate sample is represented on the multiRdimensionalscalingordination By lookingat thedistancesbetweeneachsample
ANOSIMisanalogoustoANOVAinunivariatestatistics(Smith2003)AglobalRstatistic iscalculatedtodeterminewhetherthereisasignificantdifferencebetweenallsamplesIf there are differences then pairwise comparisons are conducted to test for differences betweenpairsofsamples(analogoustopostRhoctestsinANOVA)
The R value lies between R1 and +1 (all similarities within groups are less than any similarity between groups) with a value of zero representing the null hypothesis (no differenceamongasetofsamples)(ClarkeampWarwick2001)ComparisonofpairwiseR values can give an indication of how different assemblages are R values close to 0 indicatelittledifferencevaluesaround05indicatesomeoverlapandvaluescloseto1to indicate many or substantial differences In many instances however researches are primarily interestedinwhethertheRvalueisstatisticallydifferentfromzero(usuallyata confidence level of 005) (Clarke amp Warwick 2001) (ie whether they can reject the null hypothesis)
ANOSIM can provide information on whether the (visual) differences between assemblages in the multiRdimensional scaling ordination are significantH it is an independenttestfromthemultiRdimensionalscalingordinationItisbasedontestingthe
TRESBPKirraReefMarineBiotaMonitoring2015 B2
frc environmental
differences between the rank similarities in the similarity matrix not on the distances betweensamplesinthemultiRdimensionalscalingordination(ClarkeampWarwick2001)
PermutationalMultivariateAnalysisofVariance
PERMANOVAisusedtotestsimultaneousresponsesofoneormorevariablestooneor more factors in an a0 priori0 structured design using random permutation of the data to assess significance (Anderson 2004) PERMANOVA generates a pseudo FRstatistic similar to traditional ANOVA but pRvalues are calculated with permutations which does notassumenormaldatadistribution PERMANOVAcanprovide informationonwhether the (visual) differences between assemblages in a multiRdimensional scaling ordination are significantH however it is an independent test from the multiRdimensional scaling ordination
Thelevelofmultivariatedispersionamongsampleswithineachofthetestgroupscanbe examined using the permutational analysis of multivariate dispersions (PERMDISP) routine(Anderson2004)Intraditionalimpactassessmentachangeinthedispersionof datacanalsoindicateanimpact
SimilarityPercentagendashSpeciesContributions
SIMPER analysis provides information on how dissimilar assemblages from various groups are (eg how similar all of the macroinvertebrate samples taken for a particular habitatwithinastreamreachare)andhowsimilareachgroup(egreach)istoanyother group SIMPER analysis also identifies the species taxa that are contributing to the dissimilarity between two assemblages in rank order (ie it identifies which species is contributingthemosttothedifferences)SIMPERanalysismayhelptoidentifypotential lsquoindicatorrsquospeciesForexampleifaparticularspeciesconsistentlycontributesgreatlyto the differences between impacted and unimpacted assemblages it may be a useful indicator Theabundanceofthis indicatorspeciescanthenbecomparedbetweensites usingunivariatetechniquessuchasANOVA
Data is available on request from tresbpprojectofficecrownlandnswgov
TRESBPKirraReefMarineBiotaMonitoring2015 C1
frc environmental
Appendix(D( Pairwise( PERMANOVA( Results
Data is available on request from tresbpprojectofficecrownlandnswgov
TRESBPKirraReefMarineBiotaMonitoring2015 D1
frc environmental
Appendix(E( Relative(Abundance(of(Fish(found(at(Kirra(( ( and(Palm(Beach(Reefs(in(Each(Survey((Data is available on request from tresbpprojectofficecrownlandnswgovau
TRESBPKirraReefMarineBiotaMonitoring2015 E1
Structure Bookmarks
0 50 100 Metres Scale 12500 A3
0 50 100 200 Metres Scale 15000 A3
Kirra Reef
Kirra Reef
Kirra Reef
Kirra Reef
Kirra Reef
Kirra Reef
Map A1Location of Kirra Reef monitoring sites
Table D8 Pairwise comparison of macroalgae cover between sites in each year
Table D15 Pairwise comparison of turf algae cover between sites in each year
Table D29 Pairwise comparison of ascidian cover between sites in each year
Table D43 Pairwise comparison of soft coral cover between sites in each year
frc environmental
Appendix$B$ Introduction$to$Data$Analysis$Used$
Multivariate$Analyses$
Multivariate statistical techniques are widely used in ecology to assess the similarities relationshipsbetweenassemblagesWhereasunivariateanalysescanonlycompareone variable at a time (eg an index of community structure such as a diversity index or a singleindicatorspecies)multivariateanalysescancomparesamplesbasedontheextent thatassemblagesshareparticulartaxaandabundances(ClarkeampWarwick2001)
Thefirststepofmultivariateanalysisusuallyinvolvesthecreationofamatrixofsimilarity coefficients computed between every pair of samples The coefficient is usually a measureofhowclose theabundance is foreachspecies (definedso that100= total similarity and 0=complete dissimilarity) The Bray Curtis similarity measure is commonlythemostappropriateforbiologicaldata(ClarkeampWarwick2001)
MultidimensionalScaling
NonRmetricmultiRdimensionalscalingordinations(nMDS)attempttoplacesamplesintwo dimensionalspacesothattherankorderofthedistancesbetweensamplesmatchesthe rankorderofthematchingsimilaritiesfromthesimilaritymatrix(ClarkeampWarwick2001) Thisprovidesavisualrepresentationofthesimilaritiesbetweenassemblageswithineach sampleEachoftheaxesisnotrelatedtoanyparticularvalueHinfactaxescanberotated toprovide thebestvisual representationof thedata Ordinationsareparticularlyuseful tools for analysing and visually presenting differences between assemblages Ordinationsareessentiallymapsofsamples inwhich theplacementofsampleson the mapreflectsthesimilarlyofthecommunitytothecommunitiesinothersamples(Clarkeamp Warwick 2001) Distances between samples on an ordination attempt to match the similarities inassemblagestructurenearbypoints representassemblageswithvery few attributes(speciesorabundanceofspecies)Hpoints faraparthavevery fewattributes in common(ClarkeampWarwick2001)
A stress coefficient is calculated to reflect the extent to which the multiRdimensional scalingordinationandthesimilaritymatrixagree(ClarkeampWarwick2001)(iehowwell the multiRdimensional scaling ordination accurately reflects the relationship between samples)Stressvaluesoflt015aregenerallyacceptable
In Figure A1 each freshwater macroinvertebrate sample is represented on the multiRdimensionalscalingordination By lookingat thedistancesbetweeneachsample
ANOSIMisanalogoustoANOVAinunivariatestatistics(Smith2003)AglobalRstatistic iscalculatedtodeterminewhetherthereisasignificantdifferencebetweenallsamplesIf there are differences then pairwise comparisons are conducted to test for differences betweenpairsofsamples(analogoustopostRhoctestsinANOVA)
The R value lies between R1 and +1 (all similarities within groups are less than any similarity between groups) with a value of zero representing the null hypothesis (no differenceamongasetofsamples)(ClarkeampWarwick2001)ComparisonofpairwiseR values can give an indication of how different assemblages are R values close to 0 indicatelittledifferencevaluesaround05indicatesomeoverlapandvaluescloseto1to indicate many or substantial differences In many instances however researches are primarily interestedinwhethertheRvalueisstatisticallydifferentfromzero(usuallyata confidence level of 005) (Clarke amp Warwick 2001) (ie whether they can reject the null hypothesis)
ANOSIM can provide information on whether the (visual) differences between assemblages in the multiRdimensional scaling ordination are significantH it is an independenttestfromthemultiRdimensionalscalingordinationItisbasedontestingthe
TRESBPKirraReefMarineBiotaMonitoring2015 B2
frc environmental
differences between the rank similarities in the similarity matrix not on the distances betweensamplesinthemultiRdimensionalscalingordination(ClarkeampWarwick2001)
PermutationalMultivariateAnalysisofVariance
PERMANOVAisusedtotestsimultaneousresponsesofoneormorevariablestooneor more factors in an a0 priori0 structured design using random permutation of the data to assess significance (Anderson 2004) PERMANOVA generates a pseudo FRstatistic similar to traditional ANOVA but pRvalues are calculated with permutations which does notassumenormaldatadistribution PERMANOVAcanprovide informationonwhether the (visual) differences between assemblages in a multiRdimensional scaling ordination are significantH however it is an independent test from the multiRdimensional scaling ordination
Thelevelofmultivariatedispersionamongsampleswithineachofthetestgroupscanbe examined using the permutational analysis of multivariate dispersions (PERMDISP) routine(Anderson2004)Intraditionalimpactassessmentachangeinthedispersionof datacanalsoindicateanimpact
SimilarityPercentagendashSpeciesContributions
SIMPER analysis provides information on how dissimilar assemblages from various groups are (eg how similar all of the macroinvertebrate samples taken for a particular habitatwithinastreamreachare)andhowsimilareachgroup(egreach)istoanyother group SIMPER analysis also identifies the species taxa that are contributing to the dissimilarity between two assemblages in rank order (ie it identifies which species is contributingthemosttothedifferences)SIMPERanalysismayhelptoidentifypotential lsquoindicatorrsquospeciesForexampleifaparticularspeciesconsistentlycontributesgreatlyto the differences between impacted and unimpacted assemblages it may be a useful indicator Theabundanceofthis indicatorspeciescanthenbecomparedbetweensites usingunivariatetechniquessuchasANOVA
Data is available on request from tresbpprojectofficecrownlandnswgov
TRESBPKirraReefMarineBiotaMonitoring2015 C1
frc environmental
Appendix(D( Pairwise( PERMANOVA( Results
Data is available on request from tresbpprojectofficecrownlandnswgov
TRESBPKirraReefMarineBiotaMonitoring2015 D1
frc environmental
Appendix(E( Relative(Abundance(of(Fish(found(at(Kirra(( ( and(Palm(Beach(Reefs(in(Each(Survey((Data is available on request from tresbpprojectofficecrownlandnswgovau
TRESBPKirraReefMarineBiotaMonitoring2015 E1
Structure Bookmarks
0 50 100 Metres Scale 12500 A3
0 50 100 200 Metres Scale 15000 A3
Kirra Reef
Kirra Reef
Kirra Reef
Kirra Reef
Kirra Reef
Kirra Reef
Map A1Location of Kirra Reef monitoring sites
Table D8 Pairwise comparison of macroalgae cover between sites in each year
Table D15 Pairwise comparison of turf algae cover between sites in each year
Table D29 Pairwise comparison of ascidian cover between sites in each year
Table D43 Pairwise comparison of soft coral cover between sites in each year
frc environmental
differences between the rank similarities in the similarity matrix not on the distances betweensamplesinthemultiRdimensionalscalingordination(ClarkeampWarwick2001)
PermutationalMultivariateAnalysisofVariance
PERMANOVAisusedtotestsimultaneousresponsesofoneormorevariablestooneor more factors in an a0 priori0 structured design using random permutation of the data to assess significance (Anderson 2004) PERMANOVA generates a pseudo FRstatistic similar to traditional ANOVA but pRvalues are calculated with permutations which does notassumenormaldatadistribution PERMANOVAcanprovide informationonwhether the (visual) differences between assemblages in a multiRdimensional scaling ordination are significantH however it is an independent test from the multiRdimensional scaling ordination
Thelevelofmultivariatedispersionamongsampleswithineachofthetestgroupscanbe examined using the permutational analysis of multivariate dispersions (PERMDISP) routine(Anderson2004)Intraditionalimpactassessmentachangeinthedispersionof datacanalsoindicateanimpact
SimilarityPercentagendashSpeciesContributions
SIMPER analysis provides information on how dissimilar assemblages from various groups are (eg how similar all of the macroinvertebrate samples taken for a particular habitatwithinastreamreachare)andhowsimilareachgroup(egreach)istoanyother group SIMPER analysis also identifies the species taxa that are contributing to the dissimilarity between two assemblages in rank order (ie it identifies which species is contributingthemosttothedifferences)SIMPERanalysismayhelptoidentifypotential lsquoindicatorrsquospeciesForexampleifaparticularspeciesconsistentlycontributesgreatlyto the differences between impacted and unimpacted assemblages it may be a useful indicator Theabundanceofthis indicatorspeciescanthenbecomparedbetweensites usingunivariatetechniquessuchasANOVA
Data is available on request from tresbpprojectofficecrownlandnswgov
TRESBPKirraReefMarineBiotaMonitoring2015 C1
frc environmental
Appendix(D( Pairwise( PERMANOVA( Results
Data is available on request from tresbpprojectofficecrownlandnswgov
TRESBPKirraReefMarineBiotaMonitoring2015 D1
frc environmental
Appendix(E( Relative(Abundance(of(Fish(found(at(Kirra(( ( and(Palm(Beach(Reefs(in(Each(Survey((Data is available on request from tresbpprojectofficecrownlandnswgovau
TRESBPKirraReefMarineBiotaMonitoring2015 E1
Structure Bookmarks
0 50 100 Metres Scale 12500 A3
0 50 100 200 Metres Scale 15000 A3
Kirra Reef
Kirra Reef
Kirra Reef
Kirra Reef
Kirra Reef
Kirra Reef
Map A1Location of Kirra Reef monitoring sites
Table D8 Pairwise comparison of macroalgae cover between sites in each year
Table D15 Pairwise comparison of turf algae cover between sites in each year
Table D29 Pairwise comparison of ascidian cover between sites in each year
Table D43 Pairwise comparison of soft coral cover between sites in each year
Data is available on request from tresbpprojectofficecrownlandnswgov
TRESBPKirraReefMarineBiotaMonitoring2015 C1
frc environmental
Appendix(D( Pairwise( PERMANOVA( Results
Data is available on request from tresbpprojectofficecrownlandnswgov
TRESBPKirraReefMarineBiotaMonitoring2015 D1
frc environmental
Appendix(E( Relative(Abundance(of(Fish(found(at(Kirra(( ( and(Palm(Beach(Reefs(in(Each(Survey((Data is available on request from tresbpprojectofficecrownlandnswgovau
TRESBPKirraReefMarineBiotaMonitoring2015 E1
Structure Bookmarks
0 50 100 Metres Scale 12500 A3
0 50 100 200 Metres Scale 15000 A3
Kirra Reef
Kirra Reef
Kirra Reef
Kirra Reef
Kirra Reef
Kirra Reef
Map A1Location of Kirra Reef monitoring sites
Table D8 Pairwise comparison of macroalgae cover between sites in each year
Table D15 Pairwise comparison of turf algae cover between sites in each year
Table D29 Pairwise comparison of ascidian cover between sites in each year
Table D43 Pairwise comparison of soft coral cover between sites in each year
frc environmental
Appendix(E( Relative(Abundance(of(Fish(found(at(Kirra(( ( and(Palm(Beach(Reefs(in(Each(Survey((Data is available on request from tresbpprojectofficecrownlandnswgovau
TRESBPKirraReefMarineBiotaMonitoring2015 E1
Structure Bookmarks
0 50 100 Metres Scale 12500 A3
0 50 100 200 Metres Scale 15000 A3
Kirra Reef
Kirra Reef
Kirra Reef
Kirra Reef
Kirra Reef
Kirra Reef
Map A1Location of Kirra Reef monitoring sites
Table D8 Pairwise comparison of macroalgae cover between sites in each year
Table D15 Pairwise comparison of turf algae cover between sites in each year
Table D29 Pairwise comparison of ascidian cover between sites in each year
Table D43 Pairwise comparison of soft coral cover between sites in each year