Page 1
i
SDP Collaborative Research Report
A Participatory Rapid Appraisal (PRA) of
Farming Systems in Western Kenya
Michael Waithaka, Angela Wokabi, Julius Nyangaga, Emily Ouma, Tineke de Wolff, Joseph
Biwott, Steven Staal, Meshak Ojowi, Richard Ogidi, Ismael Njarro and Patrick Mudavadi
Report of a PRA of Dairy and Crop Activities in Western Kenya
September 2000
Smallholder Dairy (R&D) Project PO Box 30028 Nairobi, Kenya
Ministry of Agriculture and Rural Development Kenya Agricultural Research Institute
International Livestock Research Institute Department for International Development-UK (DFID)
This Collaborative Research Report is circulated prior to full peer review to stimulate discussion and comment. Based on that process, its content may be revised
Page 2
ii
Acknowledgements Gratitude is expressed to all farmers who participated and contributed to this study. Thanks go the Ministry of Agriculture and Rural Development, KARI and ILRI staff who participated or assisted in carrying out this study. We will always remember Dr. Richard Ogidi (RRC Kisii) who passed away two months after the studies were carried out. He was a considerate, sensitive and dedicated team player. May God rest his soul in peace. This publication is an output from a research project funded by the United Kingdom Department for International Development (DFID) for the benefit of developing countries. The views expressed here are not necessarily those of DFID.
Page 3
i
Table of contents
TABLE OF CONTENTS ........................................................................................................ I
LIST OF FIGURES ................................................................................................................ II
LIST OF TABLES .................................................................................................................. II
LIST OF ACRONYMS ........................................................................................................ III
EXECUTIVE SUMMARY ..................................................................................................... I
1 INTRODUCTION............................................................................................................ 1
1.1 OBJECTIVES ................................................................................................................ 2
1.2 METHODOLOGY .......................................................................................................... 2
1.2.1 Site selection ...................................................................................................... 2
1.2.2 The participants ................................................................................................. 5
1.2.3 Factors appraised .............................................................................................. 6
1.2.4 Tools ................................................................................................................... 6
2 PRODUCTION SYSTEMS ............................................................................................ 8
2.1 CURRENT PRODUCTION SYSTEMS .............................................................................. 10
2.2 CROP PRODUCTION ................................................................................................... 11
2.3 LIVESTOCK PRODUCTION .......................................................................................... 13
2.3.1 Livestock feeding calendar .............................................................................. 14
2.3.2 Livestock breeding ........................................................................................... 14
2.3.3 Livestock diseases ............................................................................................ 14
2.4 LABOUR PROFILE ...................................................................................................... 15
2.5 FARM AND COMMUNITY RESOURCE MAPS ................................................................. 15
2.6 CONSTRAINTS TO CROP AND LIVESTOCK PRODUCTION .............................................. 16
3 MILK MARKETING .................................................................................................... 21
3.1 FORMAL MILK MARKETING ....................................................................................... 21
3.2 INFORMAL MILK MARKETING .................................................................................... 21
3.2.1 Milk bars .......................................................................................................... 22
3.2.2 Mobile milk traders “Hawkers” ...................................................................... 22
3.2.3 Milk wholesalers/distributors .......................................................................... 23
3.3 KENYA DAIRY BOARD .............................................................................................. 25
4 SERVICE PROVISION ................................................................................................ 26
4.1 VETERINARIANS, ANIMAL HEALTH ASSISTANTS AND STOCKISTS ............................ 26
4.2 AI SERVICES .............................................................................................................. 26
5 CONCLUSIONS ............................................................................................................ 27
6 REFERENCES ............................................................................................................... 29
ANNEX 1: MAPPING OF SPATIAL VARIATION IN WESTERN KENYA ................ 30
1. Cattle densities in Western and Nyanza....................................................................... 30
2. Tick borne disease distribution .................................................................................... 30
Page 4
ii
3. Spatial distribution of ethnic groups............................................................................ 30
ANNEX 2 FARM AND COMMUNITY LEVEL RESOURCE MAPS ............................ 35
ANNEX 3 MILK FLOWS TO TOWNS .............................................................................. 43
ANNEX 4. TYPICAL FARM LAYOUTS - CURRENT AND PAST ............................... 44
List of Figures
Figure 1 Clustering of similar sub-locations in western and Nyanza provinces........................ 5
Figure 2 Purchase and sales prices (KSh per litre) by site ....................................................... 24
Figure 3 Grade and total cattle densities .................................................................................. 31
Figure 4 Distribution of ticks and reported tick-borne disease cases ...................................... 32
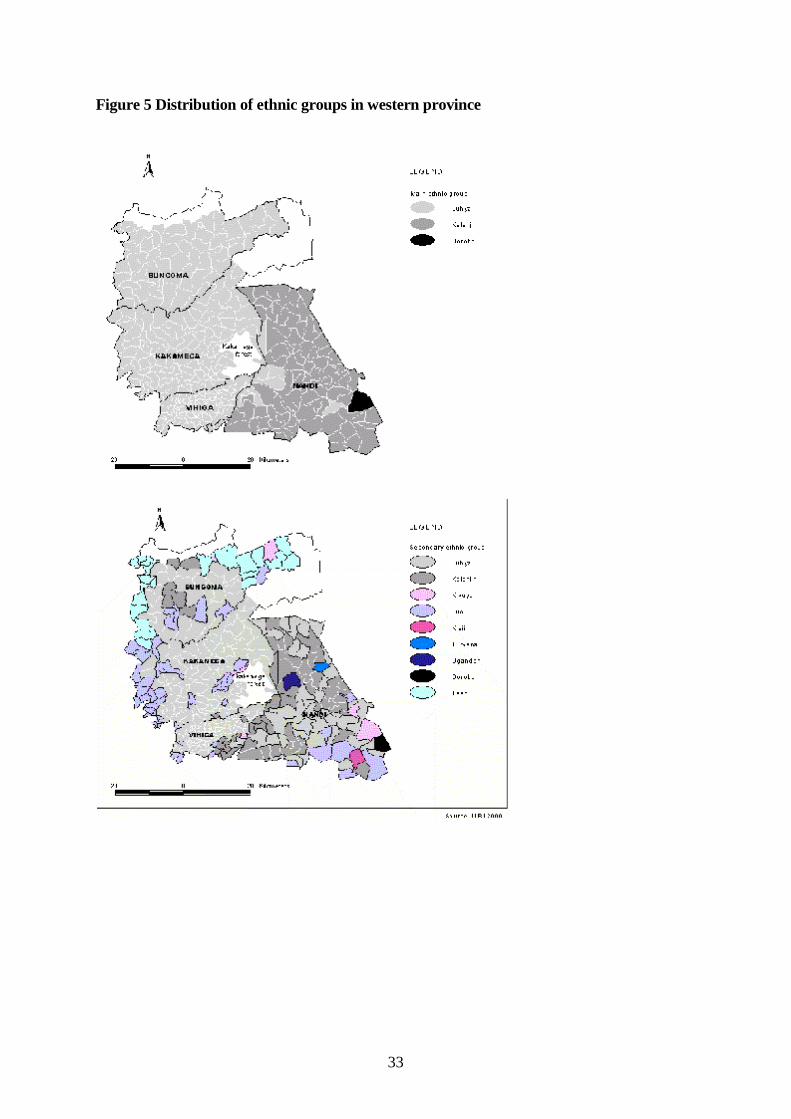
Figure 5 Distribution of ethnic groups in western province .................................................... 33
Figure 6 Distribution of ethnic groups in Nyanza province .................................................... 34
Figure 7 Farm and community resource maps for Kakelo Dudi, Rachuonyo district ............. 35
Figure 8 Farm and community resource maps for Kojwang‟/Katunde, Rachuonyo district ... 36
Figure 9 Farm and community resource maps for Bokiamburi, Nyamira district ................... 37
Figure 10 Farm and community resource maps for Ekerenyo, Nyamira district ..................... 38
Figure 11 Farm and community resource maps for Marani, Kisii district ............................... 39
Figure 12 Farm and community resource maps for Suneka, Kisii district .............................. 40
Figure 13 Community resource map for Mbihi, Vihiga District ............................................. 41
Figure 14 Community resource map for Kilibwoni, Nandi District ........................................ 42
Figure 15 Milk flow and prices to Nyamira town and Oyugis town ....................................... 43
Figure 16 Milk flow and prices in Bungoma district ............................................................... 44
Figure 17 Typical current farm layout in Suneka, Kisii district .............................................. 45
Figure 18 Typical farm layout in 1980s in Suneka, Kisii district ............................................ 45
Figure 19 Typical current farm layout in Bokiamburi, Nyamira district ................................. 45
Figure 20 Typical farm layout in 1980s in Bokiamburi, Nyamira district .............................. 46
Figure 21 Typical current farm layout in Kojwang/ Katunde, Rachuonyo district ................. 46
Figure 22 Typical farm layout in 1980s in Kojwang/Katunde, Rachuonyo district ................ 46
List of Tables
Table 1 Cluster means ................................................................................................................ 4
Table 2 Cluster description ........................................................................................................ 4
Table 3 Historical profile of the livestock systems .................................................................... 9
Table 4 Historical profile of crop farming ............................................................................... 10
Table 5 Characteristics of the production system for a typical household .............................. 12
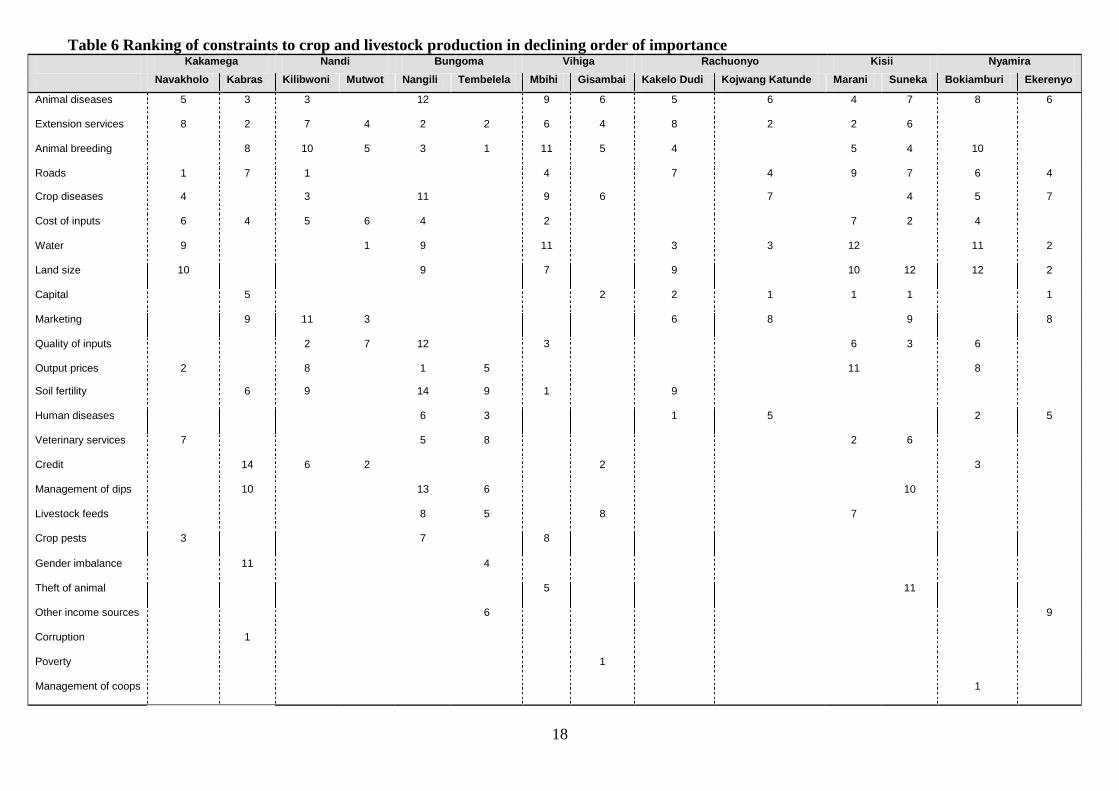
Table 6 Ranking of constraints to crop and livestock production in declining order of
importance........................................................................................................................ 18
Table 7 Cooperatives, year of establishment and current milk intake ..................................... 21
Table 8 Ranking of constraints cited by milk traders/farmers ................................................. 24
Table 9 Prices of livestock inputs ............................................................................................ 26
Page 5
iii
List of Acronyms
ABS American Breeders Service
ADC Agricultural development Corporation
AFC Agricultural Finance Corporation
CAIS Central artificial insemination Station
DFCS dairy farmers cooperative societies
ECF East Coast Fever
FMD foot and mouth disease
GIS Geographical Information Systems
GMR Guaranteed Minimum Returns
HPI Heifer Project International
ICRAF International Centre for Research in Agroforestry
ILRI International Livestock Research Institute
JSC juice (chewing) sugar cane
KARI Kenya Agricultural Research Institute
KCC Kenya Co-operative Creameries
KDB Kenya Dairy Board
LDP Livestock development Project
MOARD Ministry of Agriculture and Rural Development
NDDP National Dairy Development Programme
PPE precipitation over potential evapo-transpiration
PRA Participatory Rural Appraisal
SDP Smallholder Dairy Research and Development Project
SSC sugar, sugar cane
TBD tick-borne diseases
Page 6
i
Executive summary
Introduction
In the second phase of the Smallholder Dairy Research and Development Project (SDP), as
well as continuing work in central Kenya, attention will be given to Western Kenya where
lessons learnt from the Central and Coast regions of Kenya will be applied. Western Kenya
shares a number of features that present an opportunity for smallholder dairy research and
development. The climate is favourable for dairy production and average farm sizes are
declining rapidly due to increasing population pressure.
This study follows a sequential process Geographic Information Systems (GIS) analysis to
identify potential sites, participatory rapid appraisals (PRAs) in the selected sites and
characterization surveys. Each step informs the design and analysis of next study, building each
time a better knowledge and understanding of smallholder agriculture and dairy systems and the
constraints and refining the recommendation domains for the pilot interventions to be selected
with farmers, market agents, regulators and policy makers.
Objectives
The PRAs were organised in the districts at the sub-location level by the project management
together with the farmers and various stakeholders to:
Appraise the history and development of agricultural production systems
Identify stakeholders and their interests
Learn various farming activities from spatial and temporal points of view
Identify local needs and constraints to the development of dairy farming
Identify milk market outlets, flow patterns and constraints faced in this area
Identify service providers and the constraints faced in their trade
Methodology
The PRA studies in Western Kenya were designed to gain information on broad agricultural
activities. PRA sites were selected based on features described by the spatial mapping of
factors crucial to dairy farming. The main factors were spread of people, cattle, towns and
roads. Factors that describe natural dairy potential: rainfall and humidity, altitude, soils and
disease risk were also used. To cover as much of the variation in a district, one sub-location
was picked from each of the two most dominant clusters.
The research team included staff from ILRI, KARI and the Ministry of Agriculture and Rural
Development. At each site the PRAs were held with groups of farmers of different ages and
gender. Farmer turnout ranged from 20 to 130 (on average 50). A variety of PRA tools were
Page 7
ii
used in a flexible and sequential manner, cross-checking at each stage and improving on
reliability and participation of the farmers.
Evolution of production systems
The earliest and most distinctive development was adjudication and demarcation of land from
communal ownership to individual holdings in the 1960s and 70s resulting in smaller land
sizes per household that could not allow the keeping of large numbers of Zebu cattle. With
title deeds, credit became accessible and was mostly used for the establishment of the new
high yielding maize hybrids, which were also encouraged by effective marketing through the
National Cereals Board. During this same period, government supported services were
strengthened through the provision of agricultural field extension workers, establishment of
veterinary clinics, and construction of communal dips.
Coffee was established as a cash crop in the 1940s, tea from the 1960s and 80s and sugar in
the late 70s and only to the Northern districts. Dairy cattle were introduced only in the early
70s through the national AI and purchase of cows from large dairy farms. In many places
Kenya Co-operative creameries (KCC) had established dairy co-operatives in the1960s and
milk was marketed through these societies well through the 70s.
The 1980s were the beginning of a period of poor fortunes for both crops and livestock. Poor
quality seeds, unreliable markets, high production costs and further decline in land sizes
reduced crop production. In the 90s the government withdrew support from essential services
and initiated their provision through private enterprise. Withdrawal of veterinary services
impacted negatively on the growth of grade cattle numbers.
Current production systems
Despite the conspicuous presence of Zebu cattle, crop husbandry dominates agricultural
activities in all areas studied except Nandi where grade cattle are more prominent. A typical
household has about three to five Zebu cattle and very few cross or grade cattle. The low
number of grade animals kept per household and their low productivity is a result of low feed
supply, and poor husbandry methods. The prevalence of the Zebus is associated with the
cultural practices (dowry payment and prestige) where the number of cattle per household is
more valuable than the quantity of milk produced.
Tick borne diseases, especially East Coast Fever, are endemic throughout the area.
Prevalence of foot and mouth disease (FMD) and lumpy skin disease is associated with
uncontrolled movement of livestock into and out of the districts and the presence of
Trypanosomosis to wildlife in the forests.
Page 8
iii
There are some indications of intensification in all areas with livestock playing an important
role as a source of food, income and manure. Most areas produce their own food with much
diversification. All areas indicate high market activities with sale of food and cash crops,
milk and also for sourcing inputs such as fertilizer and food.
Communities have close relationships between farmers with the ministry of agriculture,
churches, self-help groups, tea and coffee factories, and the veterinary department. The
communities did not have close relationships with stockists, KARI and the Agricultural
Finance Corporation.
Constraints to crop and livestock production
The constraints that were mentioned by most of the 14 farmers‟ groups are: animal diseases,
extension services, animal breeding, roads, crop diseases, cost of inputs, water, land size,
capital, marketing, quality of inputs, output prices, soil fertility, human diseases, veterinary
services, credit, management of dips and livestock feeds.
Milk marketing
Most marketing is through the informal sector to nearest urban centre. A few farmers‟ co-
operative societies are still operational though beset by management problems and competition
from milk hawkers. Constraints to milk marketing include seasonal fluctuations in supply, high
cost of capital items, lack of organised marketing, high transportation costs, lack of storage
facilities and knowledge on milk handling.
Conclusions
Over time, farmers have been responsive to incentives as shown by rapid increases (decrease) in
production of crops and milk when conditions are conducive (not conducive).
Most areas in the region have the potential for intensive livestock production due to favourable
climatic conditions. Intensification of dairy production would increase the household labour
demand and offer alternative sources of income.
Western and Nyanza are generally deficient in milk and flows tend towards the major towns.
There are opportunities for growth in milk marketing if there‟s improvement in the
organization of traders and encouragement by regulatory bodies to trade in larger volumes
under hygienic conditions.
For SDP, the issues that will have to be addressed will revolve around the huge milk deficit
while there is still potential to increase milk production. Immediate issues would be to
Page 9
iv
improve our understanding on why the production gap exists and why farmers do not adopt
technologies that would increase milk output.
Page 10
1
1 INTRODUCTION
In the second phase of the Smallholder Dairy Research and Development Project (SDP), as
well as continuing work in central Kenya, attention will be given to Western Kenya where
lessons learnt from the Central and Coast regions of Kenya will be applied. Western Kenya
shares a number of features that present an opportunity for smallholder dairy research and
development using results of studies that have been done in the other regions. The climate is
favourable for dairy production and average farm sizes are declining rapidly due to increasing
population pressure.
The sequential process to be followed is the national rapid appraisal with its broad description
and diagnosis of western Kenya. This will include subsequent sub-regional reviews for each of
the mandate areas under Regional Research Centers (RRC) of the Kenya Agricultural Research
Institute (KARI), Geographic Information Systems (GIS) analysis to identify potential sites,
participatory rapid appraisals (PRAs) in the selected sites and finally the characterization
surveys. Each step informs the design and analysis of next study, building each time a better
knowledge and understanding of smallholder agriculture and dairy systems and the constraints
to, and opportunities for, their improvement, and refining the recommendation domains for the
pilot interventions to be selected with our clients: the producers, the market agents, the
regulators and the policy makers.
These studies of a new area attempt to get a clear picture of the prevailing production systems
and in particular the dairy industry and how they have evolved over time. Milk marketing
structure is also appraised since it has been learnt from the previous studies that the
development of commercial small-scale dairy industry is a function of milk demand and the
product delivery systems. Moreover, the very recent but fast changes in milk marketing as a
consequence of a liberalised economy have created opportunities for growth in dairy
production and milk outlets that have not been adequately studied in these parts of the
country.
The initial diagnostic surveys of Western Kenya are expected to provide an avenue through
which the current status of the dairy industry can be observed and provide a guide for project
entry and implementation. These surveys include spatial analysis of secondary data to target
site selection, rapid appraisals and farm characterisation studies that will form a major part of
the first months of the project's second phase.
Page 11
2
1.1 Objectives
The PRAs were organised in the districts at the sub-locational level by the project
management together with the farmers and various stakeholders to:
Appraise the history and development of agricultural production systems (and in
particularly the dairy industry) to the state in which they are today
Identify stakeholders and their interests
Learn various farming activities from spatial and temporal points of view
Identify local needs and constraints to the development of dairy farming
Identify the various milk market outlets and flow patterns while studying constraints
faced in providing this essential link between producers and consumers
Identify various other service providers and learn the constraints faced in their product
delivery
1.2 Methodology The PRA studies in Western Kenya were designed to gain information on broad agricultural
activities and dairy farming set-up. A team of researchers and extension workers met with
farmers to discuss the evolution of agricultural production systems, movement of resources,
services and general constraints. PRA sites were selected based on features described by the
spatial mapping of factors crucial to dairy farming. Gaining preliminary insight into both
Western and Nyanza Provinces was initiated by secondary data analysis, which served two
goals. In the first place, mapping the spread of people, cattle, towns and roads (Annex 1)
provides a very general overview of the kind of areas the study will be dealing with. It also
provides an initial attempt at targeting research areas with certain characteristics. To identify
specific and promising cattle or dairy areas, the relationship between cattle and spatial
indicators were used to map differentiation in dairy potential to focus site selection.
1.2.1 Site selection
Earlier studies show that a number of factors strongly influence the production and marketing
of milk by smallholders. Apart from the individual household characteristics these are human
population growth and densities, climate and rainfall and access to urban centers and services
(Kiambu Pilot Survey 1997).
Population growth and densities retain a dual relationship with dairy, presenting a market and
price incentive for intensified production when numbers are high. At the same time, however,
pressure on land and resources may leave farmers with little other choice but to intensify, if
they have the means. Closely related to population density is dairy market access. Both the
Kiambu study and the Other District Survey (1998) show that more intensified systems are
Page 12
3
mainly found in highly populated areas and close to urban centers, which provide market
outlets and good milk prices that act as an incentive to produce. Since the timing of milk
delivery and collection is critical, particularly in a smallholder African setting where cooling
systems are rarely available, distance to markets and available infrastructure are of prime
importance to smallholder farmers. Of course, infrastructure and distances do not only
influence market access, they also affect the availability of veterinary and artificial and
insemination services. Hence, general accessibility is an important factor where dairy is
concerned.
Apart from factors related to market access and infrastructure, factors that describe natural
dairy potential are rainfall and humidity, altitude, soils and disease risk. Given the use of
crossbred animals and associated susceptibility of imported breeds, disease challenge plays
an important role in farmer choice of production systems. Tick-borne diseases present a
serious threat to the whole dairy system as a number of them cause heavy mortality losses
(Staal et.al. 1999).
However, due to data limitations, only those factors for which GIS coverages could be made
available within a reasonable time span were used in the initial stratification procedure. These
turned out to be mean household density and climatic potential per sub location and mean
access to the nearest urban center:
o Population data were derived from the 1989 census. Since the survey will focus on
households and their practices, household densities have been given preference over
population densities as an input for patterns of spatial differentiation.
o Annual PPE (precipitation over potential evapo-transpiration) proved to be a useful
indicator for climate related factors. It combines elevation, rainfall and temperature
data into one measure of overall humidity. A PPE value of 1 indicates that the amount
of rain falling is similar to the amount lost through evapo-transpiration (crop
production can only be carried out when PPE is greater than 0.5)
o The layer for access to urban centers was created by ICRAF and estimates the travel
time to the nearest urban center (with population density greater than 2,500 persons
per square kilometre) in hours.
A major setback was that this layer for access to urban centers proved to be insignificant in
almost all analyses tried. The layer is quite crude and does not take into account that different
areas are serviced by different road types (and thus show tremendous variations in travel
Page 13
4
time). However it proved to be quite useful for a general insight into distance to markets and
spatial spread of densely populated areas.
Mapping spatial differentiation
To facilitate sampling in the seven selected districts (Bungoma, Kakamega, Vihiga, Nandi,
Rachuonyo, Kisii and Nyamira) the challenge was to come up with groups of sub-locations
that ranked similarly on combinations of these dairy related factors. According to Carter
1996, there are two ways in which to create these spatial stratifications. In the first, unique
combinations of specific characteristics or value ranges are identified by mapping each factor
involved and physically overlaying each map. In the second, statistical models of the
relations between variables are constructed which might involve simple correlations,
principle component analysis and cluster analysis (Carter 1996). For this characterisation
effort we chose cluster analysis. With only three significant data layers available it seemed
the most logical thing to do, since both principle component analysis and simple correlations
seek to reduce the initial number of variables to serve as input for clustering.
SAS software generated six clusters which portray quite some difference between the various
sub-locations. The clusters all range somewhere between the highly urbanized and the remote
and sparsely populated (Table 1 and Table 2) Based on these clusters it is possible to voice
expectations on the presence and level of dairying, e.g., in sub-locations with high market
access, high population densities and resulting low land holdings and a high PPE, chances are
considerable that dairy will be present: farmers will be either lured or forced into
intensification under these circumstances.
Table 1 Cluster means
Cluster
number.
Mean household density Mean access Mean PPE
1 (x1) 0 (low) 5 hrs (poor) 1.07 (high)
2 (x15) 497 (high) 0.2 hrs (high) 0.91 (reasonable)
3 (x155) 53 (low) 2 hrs (poor) 0.95 (reasonable)
4 (x106) 174 (medium) 0.6 hrs (good) 1.07 (high)
5 (x238) 61 (low) 0.8 hrs (reasonable) 0.85 (lower)
6 (x154) 75 (low) 1 hr (reasonable) 1.15 (high)
Table 2 Cluster description Cluster Description
1 Mt Elgon
2 Highly urbanised sub-locations (municipalities)
3 Remote, sparsely populated areas
4 High potential areas (not too many households, good access and climatic potential)
5 Lower density areas with good access but lower climatic potential
6 Similar to 5 but with very high climatic potential
Page 14
5
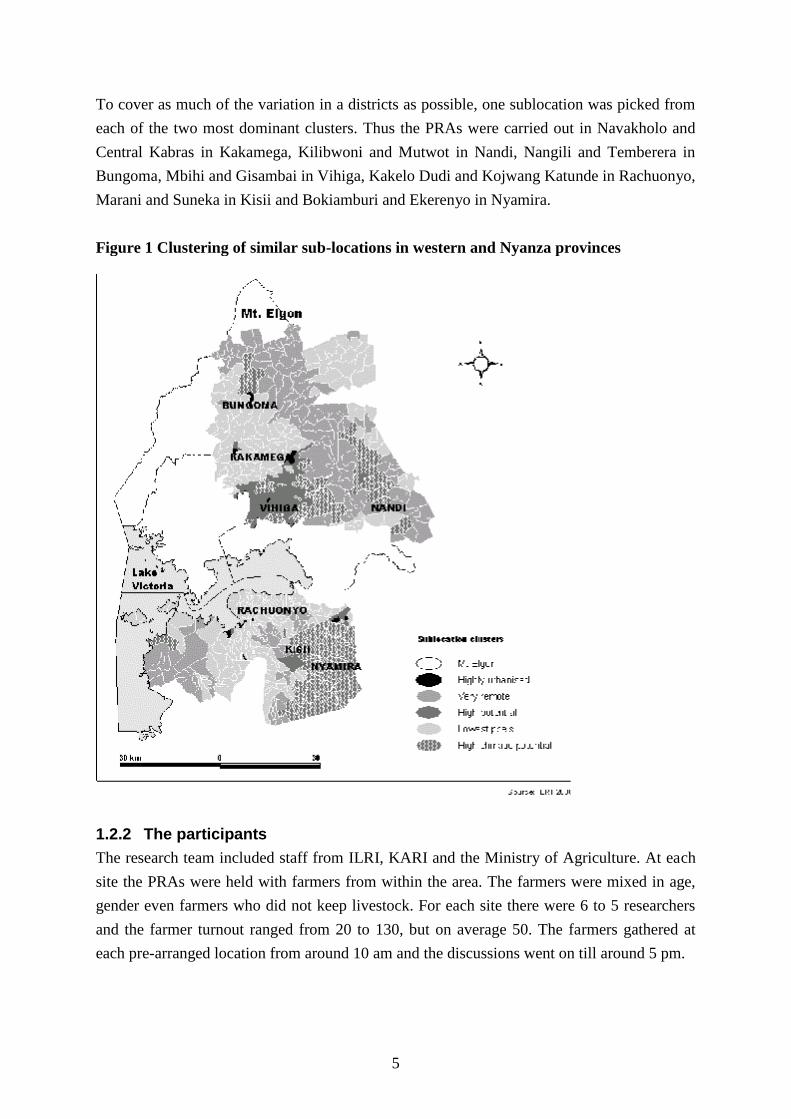
To cover as much of the variation in a districts as possible, one sublocation was picked from
each of the two most dominant clusters. Thus the PRAs were carried out in Navakholo and
Central Kabras in Kakamega, Kilibwoni and Mutwot in Nandi, Nangili and Temberera in
Bungoma, Mbihi and Gisambai in Vihiga, Kakelo Dudi and Kojwang Katunde in Rachuonyo,
Marani and Suneka in Kisii and Bokiamburi and Ekerenyo in Nyamira.
Figure 1 Clustering of similar sub-locations in western and Nyanza provinces
1.2.2 The participants
The research team included staff from ILRI, KARI and the Ministry of Agriculture. At each
site the PRAs were held with farmers from within the area. The farmers were mixed in age,
gender even farmers who did not keep livestock. For each site there were 6 to 5 researchers
and the farmer turnout ranged from 20 to 130, but on average 50. The farmers gathered at
each pre-arranged location from around 10 am and the discussions went on till around 5 pm.
Page 15
6
The market PRAs were conducted alongside the farmer PRA. In many places it was not very
possible to have the milk marketers gather as a group for an effective PRA and the research
team conducted semi-structured interviews. This method was also used for the service
providers (veterinary, feed stockists, extension personnel from the Ministry, AI service
providers both private and Government employees).
Although the objectives of the study were covered as arranged it was felt that the time
allocated was not adequate for an in-depth PRA using all the appropriate tools.
1.2.3 Factors appraised
Diverse PRA tools were to use to gain more insight in:
1. Production systems
2. Condition and circumstances
3. Prioritisation of constraints and opportunities from activities 1 and 2
4. Milk marketing
5. Service provision
For a start, the research team split into two groups and carried out trial PRAs in the two sites
in Kakamega districts and compared notes on the outcomes. Later, one group handled Vihiga,
Bungoma and Nandi districts and the other Kisii, Nyamira and Rachuonyo districts. The two
groups met at the end of each week to review progress and prepare a report on information
gathered.
1.2.4 Tools
The PRAs sought to actively involve farmers in appraisal, analysis and prioritisation of local
issues. This was done through listening, capturing local knowledge and encouraging
partnership. The interviews with farmers were conducted in groups.
A variety of different PRA tools were used in a flexible and sequential manner cross-
checking with different methods at each stage to improve on reliability and to involve more
people in the planning process.
The actual sequence of methods used in each PRA site broadly followed a similar pattern in
each site:
Time line and trend analysis, to visualise the historical changes in the area: farmers drew
on a manila sheet the typical farm in their areas in the 1970s, 80s, 90s and currently.
Emphasis was placed in identifying land size, crops grown and their relative areas as well
as livestock types and their numbers (Annex 4, Table 3 and Table 4).
Resource and social map, to identify resources, occupations and means of livelihood: here
farmers depicted on manila sheets the flow of inputs into the farm and outputs from the
Page 16
7
farm. They would also show movement within the farm between crops and livestock
(Annex 2).
Seasonal analysis, focussing on temporal information pertaining to cropping, land and
labour use: using manila paper, farmers would draw the months of a year at the bottom
and then indicate with lines or symbols the frequency of occurrence of events for a given
crop, e.g., planting, weeding to harvesting. After all crops and livestock were covered a
labour profile was drawn depicting monthly requirements through the year (Table 5 and
Annex 3).
Scoring and ranking of constraints and opportunities: based on a list of say constraints
that the farmers would give, they were asked to compare two at a time and state which
was more severe compared to the other. The number of times a constraint would be
repeated formed the scored and these were ranked to show order of importance (Table 6
and Table 8).
Visualisation was used to encourage active participation of farmers in the group interviews.
Page 17
8
2 Production Systems
The farmers gave an account of various events that have shaped the current scenarios in the
areas (Table 3 and Table 4). The earliest most notable event that has impacted greatly on
agricultural systems in this area is the adjudication and demarcation of land from communal
ownership to individual holdings with title. This took place in the 60s in most places though
it was reported as early as 1957 in Mutwot and as late as 1970 in Kilibwoni, both in Nandi
district. This resulted in smaller land sizes per household that could not allow the keeping of
large numbers of the local Zebu cattle reported as high as 100 per household in the 60s in
Kakamega (west Bunyala), though the average appears to have been 30 to 40, especially for
the Southern districts. During this same period, government supported services were
strengthened through the provision of agricultural field extension workers, establishment of
Veterinary clinics, and construction of communal dips. Credit facilities such as guaranteed
minimum returns (GMR) loans were made available through Agricultural Finance
Corporation (AFC). These were made possible by the use of land title deeds as collateral. It
seems that the credit was mostly used in the establishment of crops, especially the newly
introduced high yielding maize hybrids which was encouraged by effective marketing
through the National Cereals Board. The high grain yield, taste preference and ease with
which maize could be produced and processed resulted in diminishing attention in the
production of indigenous sorghum and finger millet especially in the 70s and 80s. However,
in Rachuonyo, better hybrids of sorghum (Serena and Seredo) were introduced in 1982 and
their production has been on the increase.
Although coffee as a cash crop appears to have been established much earlier than 1960 (in
Marani, farmers mention the existence of their co-operative society in 1940), tea was only
introduced in Nandi (Kilibwoni) in 1961 and in Rachuonyo as late as 1980. Sugar, sugarcane
(SSC) only came in the late 1970s and only to the Northern districts of Kakamega and
Bungoma. These crops competed for land other crops and with livestock putting pressure on
large local zebu cattle sheep and goat populations and indirectly encouraging the build up of
grade cows. Dairy cattle were introduced only in the early 70s through the national AI and
purchase of cows from larger Agricultural development Corporation (ADC) dairy farms in
Kitale. Farmers in Kakamega (west Bunyala) and Rachuonyo obtained Napier grass from
Kakamega research station at about the same time. The availability of the Government
supported services for livestock helped sustain a relatively high grade cattle population
during the 1970s (an average three to four per household then as compared to one to two
now). However, grade cattle population in Kakamega and Rachuonyo, suddenly dwindled
due to what farmers described as diseases outbreaks and inability to feed them. In a few
places Kenya Cooperative creameries (KCC) had established dairy co-operatives in the1960s
Page 18
9
and milk was marketed through these societies well through the 70s. However, administrative
problems associated with non-payment of loans saw their collapse at the end of this period.
The 1980s were the beginning of a period of poor fortunes for both crops and livestock. In
Nandi, armyworm infestations and maize smut seriously affected crop yields. Growing
ineffectiveness of government services resulted in dairy cattle populations dropping to almost
nil in Rachuonyo. Maize production was also affected by poor quality seeds, unreliable
market (cereals board was not purchasing farmers' produce), high production costs and
further decline in land sizes. In the 90s the government withdrew support from essential
services and initiated their provision through private enterprise. Dips were left to farmer
committees, Veterinary and AI services were left in the hands of private providers. The
floundering efficiency of this new approach has negatively affected agricultural production
and farmers have not yet readjusted to these developments. These changes and the continuing
subdivision of farmland have impacted negatively on agricultural.
Table 3 Historical profile of the livestock systems
PERIOD Event; activity
1960s Land adjudication: Nandi (Mutwot,Kilibwoni), Bungoma, Kakamega (west Bunyala, central Kabras)
Sahiwals and crosses introduced: Nandi (Kilibwoni)
Grade cattle introduced and increased in number till the 80s: Nandi (Kilibwoni)
AI started: Kakamega (central Kabras)
GMR loans provided for dairy production: Kakamega (central Kabras)
Government supported services availed: meat inspection, hides and skins bandas introduced. Dips started: Vihiga (Gisambai)
Kakamega and Malava dairy Coops started: Kakamega (central Kabras)
Zero-grazing started: Kakamega (central Kabras)
1970s Friesian cattle obtained from Kitale ADC: Kakamega (west Bunyala)
Napier grass from Kakamega KARI: Kakamega (west Bunyala)
Co-operatives increase: Vihiga (Gisambai)
AI started: Nandi (Kilibwoni)
Grade cattle introduced but many died from TBDs: Rachuonyo (west Karachuonyo)
Dairy production started to drop to the lowest level it is today: Rachuonyo (west Karachuonyo)
Kakamega and Malava dairy co-operatives collapsed from unpaid loans
Grade cattle introduced in Kakamega (central Kabras) and Bungoma
Introduction of Ayrshire bulls after construction of cattle dips: Nandi (Kilibwoni)
GMR loans stopped: Nandi (Mutwot)
1980s Grade cattle introduced but many died from diseases. Number of grade cattle increased due to availability of government supported AI services and organised milk marketing through KCC: Nyamira (Nyamira)
Tea introduced: Rachuonyo (W/Karachuonyo)
ECF outbreak affects cattle populations: Kakamega (west Bunyala)
Dairy production encouraged through Finland supported Rural Dairy Project: Rachuonyo (west Karachuonyo)
AI started: Bungoma
Seasonal credit introduced: Nandi (Mutwot)
Page 19
10
Populations of local cattle declined because of their low milk production, low milk prices and small land sizes: Kakamega (central Kabras)
Government AI and veterinary services declined: Rachuonyo (west Karachuonyo)
1990s Dips handed over to farmer management committees: Kakamega (west Bunyala) Government withdraws from provision of veterinary, AI and extension services. Dips cease to operate: Kakamega (central Kabras)
Table 4 Historical profile of crop farming
PERIOD Event; activity
1960s Land adjudication: Nandi (Mutwot), Bungoma, Kakamega (west Bunyala, central Kabras)
Tea planting started: Nandi (Kilibwoni)
Coffee 'forced' on farmers, production increases: Rachuonyo (west Karachuonyo)
Sorghum varieties grown: local brown ('Andino) and red (Ochuti); production high: Rachuonyo (west Karachuonyo)
Credit facilities availed: Nandi (Kilibwoni)
Agricultural extension established, readily available: Nandi (Mutwot)
Maize production increased with introduction of better hybrids: Nandi (Kilibwoni)
Co-operatives increased: Vihiga (Gisambai)
1970s Land adjudication: Nandi (Kilibwoni), Rachuonyo (west Karachuonyo)
Improved sugarcane (SSC) introduced: Kakamega (west Bunyala)
Tea introduced: Kakamega (central Kabras)
GMR loans availed, boosted maize production: Kakamega (central Kabras), Nandi (Mutwot)
GMR loans stopped in 1978: Nandi (Mutwot)
Sugarcane planting, overproduction and marketing problems: Kakamega (central Kabras)
1980s West Sugar Company starts buying cane: Kakamega (central Kabras)
Seasonal credit introduced: Nandi (Mutwot)
Army worm infestation and maize smut: Kakamega (west Bunyala)
Sorghum hybrid varieties introduced: Rachuonyo (west Karachuonyo)
Number of co-operatives decreased: Vihiga (Gisambai)
Slump in coffee prices, crop uprooted and replaced by maize and bananas: Rachuonyo (west Karachuonyo)
1990s Cassava and maize diseases increase: Kakamega (west Bunyala)
2.1 Current production systems
Despite the obvious presence of indigenous livestock, crop husbandry dominates agricultural
activities in all areas studied except Nandi district where dairy is relatively more prominent.
Table 5 shows the basic comparisons across the districts studied. Land size per household is
low ranging from one to four acres in Kisii, Nyamira, Vihiga and Kakamega. Households in
Bungoma, Rachuonyo and Nandi have larger acreage (over 10 acres). Leasing of land is
common, especially in Kakamega where it is rented at Kshs 1,000 per acre per year. Typical
farms practice mixed farming, combining cash and food crops with livestock production. The
main cash crops are coffee, tea, sugar cane for sugar production (SSC) and juice sugar cane
for chewing (JSC), and pineapples. The main food crops are maize, beans and sweet potatoes.
Others food crops include bananas, cassava, finger - millet, sorghum, groundnuts, vegetables
and arrowroots. Surplus food crops are also sold for cash.
Page 20
11
The main livestock types are cattle (pure breeds or grade, local Zebu and crosses), poultry
(exotic and local chicken), sheep, goats and donkeys. The livestock are fed on natural
pastures, Napier grass, banana stems, sweet potato vines, vegetable waste, sugar cane leaves
and tops, maize stover and shrubs. Cattle are mainly grazed though there is increasing
confinement by tethering, zero-grazing or semi-grazing systems. Use of concentrates was not
high and was said to be common in the dry season when pastures and fodders are in short
supply.
2.2 Crop production
In Kakamega, Bungoma, Vihiga and Rachuonyo, maize, beans, bananas, and sorghum are the
main food crops while sugar sugar cane (SSC) and coffee are the main cash crops. Others are
cassava, bambara nuts, ground nuts, simsim, though their production has been on the decline
over the years. In Kisii and Nyamira and Vihiga maize, beans, bananas, millet and sorghum
are the main food crops while coffee and tea are the main cash crops. In all the places beans
are intercropped in maize. On a very low scale in the regions there are sweet potatoes,
pumpkin, indigenous vegetables and arrowroots. Juice sugar cane (JSC) is grown in Kisii and
Nyamira as a food and as a cash crop. Wheat was mentioned in Nyamira, but on small plots.
However, it appears to be a very recent addition in the farms and is gaining popularity.
Sorghum and finger millet in the region is gradually being replaced by maize which is less
laborious to grow, process and is preferred increasing for consumption.
Most farming activities in the region follow the rainfall pattern that is bimodal with the long
rains occurring from April to June and the short from August to October. The dry season
spreads from November to February. Since the short rains are not heavy and not much
happens in this season in many parts. Kakamega has one long rainy season from mid March
to August while in Kisii and Nyamira, there is rainfall every month of the year, the least
being in January and July, the highest in April and May. In those areas and Vihiga a second
crop of maize and beans is grown during the short rains.
Page 21
12
Table 5 Characteristics of the production system for a typical household Sites and Districts
Kakamega Nandi Bungoma Vihiga Rachuonyo Kisii Nyamira
Navakholo C. Kabras Kilibwoni Mutwot Nangili Tembelela Mbihi Gisambi Kakelo
Dudi
Kojwang
Katunde
Marani Suneka Bokia-
mburi
Ekerenyo
Average land size (acres)
3 4 15 30 4-5 0.5 – 0.9 2 5 2 1 2 1
Livestock
Zebu cattle < 10 6 0 1 5 5 10 2 5 2 1
Crosses 3 5 3 3 3 1 0 0 2 5
Grade cattle 1 5 3 2 5 0 2 2 1 1
Indigenous poultry
10 50 10 50 10 50 10 20 5 10
Exotic poultry 10 3 10 0 0 20 10 100
Shoats <5 5 8 20 3 5 3 4
Crops
Cassava Beans Ground
nuts Arrow roots
Maize Sugar cane
Sugar cane
Maize Sweet
potatoes Beans
Bananas Millet
Sorghum Ground
nuts Vegetables
Maize Beans Sweet
potatoes
Maize Beans Sweet
potatoes Vegetab
les Banana
s
Sugar cane
Coffee Maize
Banana Sweet Potato Beans
Sorghum Millet
Sugar cane
Maize Beans
Bananas
Maize Beans Fruits Coffee
Tea Millet
Sorghum Napier
Maize Beans Cotton
Sorghum Cassava Sweet potato
Ground- nuts
Napier
Maize Beans Sugar cane
Cotton Ground
nuts Napier Finger-millet
Sorghum Sweet
potatoes Cassava
Maize Beans Coffee
Tea Bananas Napier
Vegetables
Maize Coffee
Tea Banana
Sugar cane Finger millet
Napier Vegetables Groundnuts
Sweet potatoes
Maize Coffee
Tea Banana Finger millet
Napier Vegetables
Maize Coffee
Tea Bananas Napier
Vegetables Pineapple
Sweet potatoes
Page 22
13
The early part of the year before the long rains is dominated by land preparation and planting
the main maize/beans crop. Weeding follows just as the rains set in April and May. Beans are
harvested between May and August, while maize is harvested between September and
November. In Kisii, Nyamira and Vihiga the second crop of maize and beans planted during
the harvesting of the first crop is harvested early the following year. In Kakamega the short
rains are used for planting beans, sweet potatoes vegetables and groundnuts. Most of the
biannual food crops (bananas, vegetables, etc.) are established during the long rains. Coffee
and tea are perennial but have peak-harvesting periods from September to November and
April to October respectively. There is no distinct periodical activity for sugarcane. Once
sugar cane (SSC) has been planted weeding takes place six times in a 22 months cropping
season. It is then harvested and all the stumps burned down to give way to a new crop. Often
the buyer company does the planting and cutting.
2.3 Livestock production
All livestock types are kept in all the areas although in Nandi, dairy production is the
predominant agricultural enterprise with tea as the main cash crop. In Kakamega, Kisii,
Rachuonyo, and Nyamira most of the farm holds have about three to five Zebu cattle per
farm producing one litre of milk per cow per day kept by grazing mainly on unimproved and
some improved pastures as well as at the roadsides. The few farmers with grade cattle keep
on average about two cows producing an average of seven litres of milk per cow per day
(ditto) or three crosses producing an average of five litres per cow per day per under zero or
semi zero grazing in most areas. The low number of grade animals kept per household and
their low productivity is a result of low feed supply, particularly during the dry season, and
poor husbandry methods and their interactions that result in deaths of these types of cattle.
The prevalence of the Zebus in Kakamega is associated with the cultural practices (dowry
payment and prestige) where the number of cattle per household is more valuable than the
quantity and quality of their produce (milk). Some farmers reported problems with grass and
fodder legume seed acquisition, e.g., Rhodes, Desmodium, Lucerne, fodder trees for
supplementation forcing them to rely on Napier grass and natural pastures. The main planted
forages are Napier grass, sweet potatoes and crop residues are used routinely.
There are on average 10 to 50 chickens and three to five heads of goats and sheep per farm,
all of them indigenous and kept for egg and meat consumption as well as a form of capital.
Donkeys are used for traction and means of transport. Ducks are not popular among the
farmers and the market outlet is minimal. Pigs are not popular because they feed a lot, they
are destructive and are at sometimes associated with witchcraft.
Page 23
14
There is high milk production during the peak rainfall period and demand and prices tend to
be low. Towards December the demand increases and prices may improve as supply declines.
The sale of cattle is high from January to March when animals are culled as a result of
inadequate forage and to raise school fees. Sales are lowest in June increasing up to October
before declining since there is then a low supply of the animals.
2.3.1 Livestock feeding calendar
The quantities of Napier and natural pasture grass follow the rainfall patterns while banana
pseudo-stems, sweet potato vines and sugar cane tops are available uniformly throughout the
year though the latter are rarely used. Utilisation of Napier grass and by-products stover and
bean hauls is highest in the dry season between December and February, and concentrate use
increases when Napier grass is not readily available. Concentrates used in livestock feeding
include bran, dairy meal, local brewers waste, molasses and spoilt maize. In most parts dry
maize stover and bean haulms are available for use after harvesting the grain. In some areas,
Napier grass is left to overgrow and the canes are used to make baskets.
2.3.2 Livestock breeding
The main breeding system is by natural service either using improved bulls introduced by
previous development projects or the local zebus. At the moment AI services are provided by
the government at the district veterinary offices and some very few private providers. In the
Kakamega and Rachuounyo attempts to set up private AI services have not fared well
because the farmers' demand cannot sustain them. The farmers, moreover, find all the
services expensive at the range of KSh 300.00 to 2000.00 depending on the quality and
source of the semen and transport charges. Natural service dominates using locally owned
bulls and bull schemes set up by Livestock development Project (LDP), Heifer Project
International (HPI) and a few other NGO projects. Their impact at improving the dairy
genotype is, however, so far very low. In Rachuonyo there are only 3,000 grade cows to the
150,000 zebus despite more than ten years of LDP and National Dairy Development
Programme (NDDP) activity.
2.3.3 Livestock diseases
Tick borne diseases (TBDs), especially East Coast Fever (ECF), are endemic throughout the
area. There are very few communal and privately owned dips and these are only occasionally
functional. Most farmers control ticks by spraying occasionally their animals at home or dip
where dips are functional. The incidence of TBDs and worm infestation are high during the
rainy season from April to November, while Foot and mouth, lumpy skin and Newcastle
Page 24
15
disease mostly appear in the dry season. In Kisii and Rachuonyo the prevalence of notifiable
diseases especially foot and mouth disease (FMD) and lumpy Skin was associated with
uncontrolled movement of livestock into and out of the districts while in Kakamega the
presence of Trypanosomosis was blamed on tsetse infestation and proximity to forests.
2.4 Labour profile
Women are busy throughout the year as they perform more duties on the farm from
cultivation and harvesting to household chores. Men are more busy in the planting season
when demand for labour is high. January to May is the peak labour period due to the many
farming activities (land preparation, planting and weeding the year's main crop) while July to
October have the least labour demands. Tea picking is less in the months of January to March
then increases steady to peak in October.
The cost of hired labour in the whole of western Kenya was uniform at KSh 50 (and a meal)
per working day (7 am to mid-day) regardless of gender. Permanently employed labour,
however varied from KSh 700 to 1500 per month including food and accommodation but
depending on the farmer's resource capability and /or length of employment. There is no child
labour, i.e. no use of school-age children, except when the farmers kids were on holiday from
school. Malaria cases in humans increase just after the rains between July and August.
2.5 Farm and community resource maps
Farm resource maps indicated some degree of intensification in all areas with livestock
playing an important role as a source of food, income and manure (Annex 2). Most areas
were predominantly producing own food and show much diversification in production. There
was widespread use of crop by-products (bananas and sugar cane tops) to feed livestock. Al
areas indicate high market activities with sale of food and cash crops, milk and also for
sourcing inputs such as fertilizer and at times food. Many areas indicated communal use of
labour on a rotational basis to help out with farm activities. In Kisii, there is sale of trees for
firewood and charcoal as well as sale and purchase of manure. Issues arising include
increasing intensification, concern with market access and policies on inputs and output
prices and marketing.
Community maps (Annex 2) show close relationships between communities and the ministry
of agriculture, churches, schools, self help groups, markets, provincial administration, health
centres, tea and coffee factories and the veterinary department. The communities did not have
close relationships with many service providers including; KARI, water development
agencies, electricity providers, stockists, Agricultural Finance Corporation (AFC) for credit.
Page 25
16
Issues arising include weak core support services and identification of probable dissemination
avenues namely provincial administration, ministry of agriculture, schools and churches.
There is a need to strengthen weak linkages between farmers and KARI, AFC and stockists.
2.6 Constraints to crop and livestock production
The constraints to farming in general and livestock in particular were discussed with the
farmers in the various sites. There were 25 constraints mentioned between the 14 farmers‟
groups in declining order of how many times they were mentioned (Table 6). Out of the 25
constraints, three (animal diseases, extension services and animal breeding) were mentioned
by more than 11 groups, eight (roads, crop diseases, cost of inputs, water, land size, capital,
marketing and quality of inputs) by between seven to ten groups, seven (output prices, soil
fertility, human diseases, veterinary services, credit, management of dips and livestock feeds)
by between four and six groups and seven (crop pests, gender imbalance, theft of animals,
other sources of income, corruption, poverty and management of cooperatives) by fewer than
three groups. The constraints are discussed in order of declining importance as defined by the
number of times they were mentioned by the groups.
Animal diseases came up as farmers argued that the presence of diseases has clearly
contributed to the low presence of dairy animals in most of Western Kenya. They said that
local indigenous animals are easier to keep and their dominant numbers could be attributed to
their ability to withstand the prevalent diseases. Diseases are linked to poor disease
prevention measures such as low number of dips, poor management of the few dips
available, poor home spraying methods. Some service providers felt that farmers may be
finding the cost of acaricides to be too high and using low strength washes or spraying their
animals irregularly. This was also linked to doubtful quality of inputs. Linked to this were
lack of veterinary services and the high costs of the ones available. Many farmers have yet
to get over the former heavily subsidised government services.
Lack of farmer training and extension services was a common constraint and mainly
referred to inadequacy in training farmer on how to keep and maintain dairy animals. It was
described in various ways in different places but mostly pointed out to inadequate extension
staff. During a discussion with the field staff themselves, they pointed out the very low
worker to farmer ratio, though no figures were given. Then there is the issue of inaccessibility
linked to either the terrain that cannot be covered fast enough by whatever transport means
available (on foot or by bicycle) or the lack of such transport. The increase in number of
dairy animals in the early 70s after introduction through AI services or the dairy projects that
existed then was not maintained. Many of the animals died because the farmers could not
keep up with the nutritional and health management demands the animals required. This can
Page 26
17
be directly linked to the lack of education. There was very little evidence of farmers using
available technology to sufficiently utilise the available feed resources. For example, even if
some farmers kept poultry there was no one utilising the birds' dropping as a feed
supplement.
Inadequate breeding services was reported variously as lack of good dairy animals, lack
of breeding bulls, ineffective AI services, and expensive AI services from those who
provided them. Just like clinical veterinary services the privatisation of AI provision has
resulted in total lack of private providers in some places (Kakamega), and a very high cost for
the ones existing. Though this is the constraint projects such as HPI and LDP have chosen to
facilitate their impact in increasing the number of cattle of having dairy genotypes has not
been very obvious. Farmers expressed an interest in the establishment of more bull schemes
and many farmer groups have been set up primarily for this purpose but they were not
successful. Again there was a possibility of farmers pointing out this constraint hoping to be
supported by the project but the very low numbers of grade cattle in these areas makes this an
important starting point to the development of the region's dairy industry.
Infrastructure (roads) as reflected in the rundown condition of main and access roads that
have affected all sector including agriculture. Services and markets have become inaccessible
in some places and the cost of transport has risen as providers charge the higher vehicle costs
to users. Thus, the cost of veterinary clinical and AI services have become correspondingly
higher. In Kisii, Nyamira and Rachuonyo where farmers sell their own milk (i.e. with no
middlemen or small traders) this has meant higher costs for each litre that finally reaches the
consumer. There is also the element of time spent as farmers walk or cycle long and difficult
distances to deliver milk leaving little time for attention to management of their cows.
Crop diseases show the prominence of crop production in the region and the dependence
the farmers have on these crops for food and income this constraint was inevitable and was
mentioned in almost every site visited. Both cash crops (tea, sugarcane) and food crops
(maize, pineapples, and sorghum) were reported to be under some recent attack by diseases
or pests that the farmers have not yet overcome.
Lack of water was mostly referred to inaccessibility to clean water or to mains supply which
meant reliance on rain catchment and rivers. It was a common constraint, but did not feature
high in ranking.
Page 27
18
Table 6 Ranking of constraints to crop and livestock production in declining order of importance Kakamega Nandi Bungoma Vihiga Rachuonyo Kisii Nyamira
Navakholo Kabras Kilibwoni Mutwot Nangili Tembelela Mbihi Gisambai Kakelo Dudi Kojwang Katunde Marani Suneka Bokiamburi Ekerenyo
Animal diseases 5 3 3 12 9 6 5 6 4 7 8 6
Extension services 8 2 7 4 2 2 6 4 8 2 2 6
Animal breeding 8 10 5 3 1 11 5 4 5 4 10
Roads 1 7 1 4 7 4 9 7 6 4
Crop diseases 4 3 11 9 6 7 4 5 7
Cost of inputs 6 4 5 6 4 2 7 2 4
Water 9 1 9 11 3 3 12 11 2
Land size 10 9 7 9 10 12 12 2
Capital 5 2 2 1 1 1 1
Marketing 9 11 3 6 8 9 8
Quality of inputs 2 7 12 3 6 3 6
Output prices 2 8 1 5 11 8
Soil fertility 6 9 14 9 1 9
Human diseases 6 3 1 5 2 5
Veterinary services 7 5 8 2 6
Credit 14 6 2 2 3
Management of dips 10 13 6 10
Livestock feeds 8 5 8 7
Crop pests 3 7 8
Gender imbalance 11 4
Theft of animal 5 11
Other income sources 6 9
Corruption 1
Poverty 1
Management of coops 1
Page 28
19
Declining land sizes was a constraint in the entire region given the high population increases
and continuous sub-division of land among children to units that could barely support
sustainable agricultural enterprises. This meant that farmers have to adopt intensification
technologies that are again hindered by their lack of capital and education/knowledge on
what can be done.
Lack of capital was also a common constraint, and in areas where farmers identified it as
such it featured as the top most hindrance. It was also reported as 'high cost of inputs' and in
one place (Nandi) as 'the high cost of transporting produce to market' relative to the price of
milk. There was a possibility of the farmers pointing out this constraint in the hope that the
project was set to provide material support and in some areas this could have been the reason
why it was stated. Previous projects in the area have had a strong feature of material
provision but this approach has not had any sustainable impact because the achievements
made by these projects were not obvious. In Kakamega and Bungoma lack of capital could be
addressed by the incomes the farmers got from sugarcane. However, but this has not been the
case because they said the cane took too long to be harvested due to crop type or there were
delays in harvesting the cane (a management problem). The prices of the cane delivered were
also reported to be low.
This was pointed out in few places but is related to the above constraint. There were very few
institutions offering some credit arrangement to smallholder dairy farmers. In Nyamira it was
the stringent loan terms that were mentioned while in another it was the very high interest
rates. All in all very few farmers were ready to go for credit because they were afraid of not
being able to repay, especially from dairy production and milk sales. The only credit
facilities mentioned were those associated with the cash crops where farmers obtained
material inputs (seeds, fertilisers, implements, etc.) payments were deducted from the
produce delivered. As a result these facilities were only available for use in the cash crops but
not to dairy. This was closely related to low output prices which were mentioned too.
Poor marketing systems were mentioned for all farm products but more so for milk. This
was exacerbated by lack of co-operatives and poor management and organization where they
exist. This leaves farmers to market their small outputs on their own and covering long
distances.
Soil fertility could have contributed to the feeding constraint. It was mentioned everywhere
as having compounded the problem of small land sizes. The farmers felt that their soils were
not as good as they used to be previously when they could plant crops with very little or no
fertilisers. As a result the production of, not just the foods but forage for the animals, had
Page 29
20
declined over the years. In Kakamega, Rachuonyo and Nandi poor soil quality was also
associated with soil erosion in the long rains.
Human diseases were mentioned especially malaria in Kisii and Nyamira, and AIDS/HIV in
Rachuonyo. This was as a result of declining health care services in public hospitals.
Lack of feeds was mentioned in only five of the seventeen sites this constraint has
contributed to other problems mentioned by the farmers. This refers to the low milk yield
and, as a consequence, low incomes from dairy farming. The main feed resources for cattle
are the rain-dependent grass pastures and fodders. Though the area is well endowed with
rainfall, especially Vihiga, Nandi, Kisii and Nyamira the land sizes are too small to provide
adequate amounts for the stocks kept and especially for grade cows. The farmers also
complained of not being able to conserve feeds when there was plenty particularly during
the rainy season due to lack of know how. The extensive use of land for food crops and cash
crops implies that the utilisation of residues and by-products can be used to boost feed supply
and this was not evident. For example sugarcane tops were not being used and in some places
the farmers said tops actually reduced milk yield.
Gender imbalance was mentioned where women talked of being left to do all the work. One
of the reasons why breed development projects, e.g., LDP and HPI have not done well in
Kakamega was felt (by the extension workers) as being the use of women groups without
consulting or involving the men.
Corruption was mentioned in Kakamega and associated with general poor governance and
administration. This can be associated with mismanagement of co-operatives mentioned in
Kisii and quite highly ranked there.
Page 30
21
3 MILK MARKETING
Milk marketing in Western Kenya is mainly informal with liberalisation of milk marketing in
1992 and the lifting of urban milk market monopoly previously enjoyed by the Kenya Co-
operative Creameries (KCC). There are a few dairy farmers co-operative societies that came
up to market members milk, after most collapsed or are on the verge of collapse. By
December 1999, there were 16 active milk intake societies in Nyanza and seven in western.
Other milk market outlets available for farmers in some areas include private processors such
as Kitinda, Nasyanda and Magharibi dairies in Bungoma district. They source milk from
farmers for processing. KCC is still operational in certain areas like in Nandi where there are
two cooling plants in Kapsabet and Lessos.
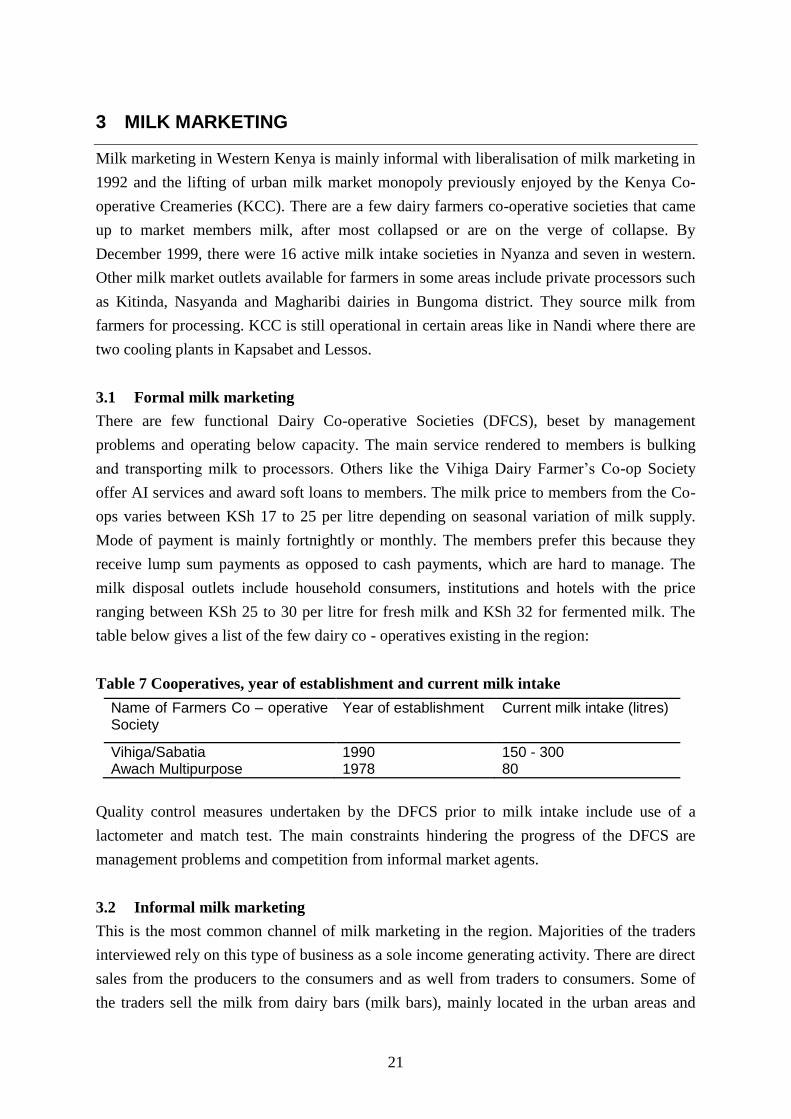
3.1 Formal milk marketing
There are few functional Dairy Co-operative Societies (DFCS), beset by management
problems and operating below capacity. The main service rendered to members is bulking
and transporting milk to processors. Others like the Vihiga Dairy Farmer‟s Co-op Society
offer AI services and award soft loans to members. The milk price to members from the Co-
ops varies between KSh 17 to 25 per litre depending on seasonal variation of milk supply.
Mode of payment is mainly fortnightly or monthly. The members prefer this because they
receive lump sum payments as opposed to cash payments, which are hard to manage. The
milk disposal outlets include household consumers, institutions and hotels with the price
ranging between KSh 25 to 30 per litre for fresh milk and KSh 32 for fermented milk. The
table below gives a list of the few dairy co - operatives existing in the region:
Table 7 Cooperatives, year of establishment and current milk intake
Name of Farmers Co – operative Society
Year of establishment Current milk intake (litres)
Vihiga/Sabatia 1990 150 - 300 Awach Multipurpose 1978 80
Quality control measures undertaken by the DFCS prior to milk intake include use of a
lactometer and match test. The main constraints hindering the progress of the DFCS are
management problems and competition from informal market agents.
3.2 Informal milk marketing
This is the most common channel of milk marketing in the region. Majorities of the traders
interviewed rely on this type of business as a sole income generating activity. There are direct
sales from the producers to the consumers and as well from traders to consumers. Some of
the traders sell the milk from dairy bars (milk bars), mainly located in the urban areas and
Page 31
22
retailing raw, boiled or fermented milk. Other traders are not stationed anywhere and move
around, hawking milk. There are also milk distributors/wholesalers who source milk from
farmers and sell to traders who in turn sell to the consumers.
3.2.1 Milk bars
Most milk bars have licenses from the Kenya Dairy Board (KDB) and the Municipal
Councils. As long as the licenses are up to date, they face no harassment from the KDB or the
Council. The amounts paid comprise KSh 2,000 per year to KDB, cess KSh 0.20 per litre,
Municipal Council annual fees of KSh 200, annual food and hygiene license at KSh 300, and
public health annual license of KSh 200.
Amounts handled by these traders are as low as 40 litres and as high as 200 litres. The milk
deficit areas are Kakamega, Vihiga and Rachuonyo, where milk has to be sourced from very
far to meet local demand, which has a bearing on the high sales price (Case 1 and 2).
The main mode of transporting milk is by public means (matatus), bicycles („boda-boda‟) and a
few of the traders use private vehicles. Milk purchase price ranges from KSh 13 to 16 per litre
after the rainy season (May to October) and peaks to KSh 17 during the dry season (January to
March). The sales price range from KSh 20 to 28 per litre for fresh milk and KSh 32 to 40 for
Lala (fermented). The main market outlets include households, hotels and institutions. Payment
is commonly cash on daily basis for households and monthly or weekly for hotels and
institutions. Occurrence of milk spoilage is not high, as almost all milk is disposed off the same
day. In addition some of the traders have freezers to cool the milk.
3.2.2 Mobile milk traders “Hawkers”
The KDB officials, council officers and the public health officials restrict hawking on the
grounds of non-payment of licenses and concern for hygiene. The KDB offices in Kakamega
indicate that they had licensed 10 hawkers in the district. On the other hand, in areas like
Nyamira and Oyugis, the traders have never experienced or heard about the activities of the
Case 1: Everlyne Vugutsa’s milk bar is situated in Vihiga town. She sources milk from Danger forest market in Nandi (about 70 km) (40 to 60 litres) at KSh 16 to 17 per litre. She pays a further KSh 100 for her own transport and KSh 30 per 20 litre jerrican. The final milk sale price is KSh 20 per 750ml treetop bottle. The quality control measure she undertakes prior to milk purchase includes pouring a little milk on the ground and observes the flow. The faster the flow, the higher the adulteration levels with water. Case 2: Emmah Adolwa runs two milk bars in Kakamega. She sources milk from two suppliers Malanga dairies and Turbo (75 km away). She handles about 200 litres per day and sells at KSh 28 per litre. She tests for milk quality using a lactometer and wants to start undertaking the acidity test. She has a freezer for preserving milk.
Page 32
23
KDB. There is still no proper regulation of the informal milk markets, because there are many
traders still not paying the required licenses, while others have to pay both at the point of
collection and sale (Case 3).
In Nandi, traders source milk as early as 4 a.m. as they have to travel long distances (Annex 3).
They handle small amounts about 40 to 60 litres per day as required by milk bars, using plastic
containers (jerricans) which are less costly and easier to transport using “matatus” and bicycles.
The source of milk is mainly directly from individual farmers, organised collection centres as in
Case 3, or purchases from other traders. Sales are made in the morning, and by 9 a.m. the sales
are completed. The main market outlet are the individual households, with the purchase price
ranging from KSh 13 to 22 per litre and the sales price KSh 22 to 25 per litre for fresh milk.
Payment is made on daily basis.
3.2.3 Milk wholesalers/distributors
There exist a few milk distributors in the region. One interviewed in Kakamega indicated that he
sources milk from Turbo where he has employed five milk agents (three full time and two part
time), collecting milk from collection points. The suppliers are 31 farmers all within a radius of
five kilometers. Milk is brought at a central point and dispatched on matatus for Kakamega, the
sales area. He pays a transport charge of KSh 50 per can and a further KSh 30 per can per milk
agent. He sells to private traders, mainly the hawkers at KSh 25 per litre.
Sales prices are higher in milk deficit areas because of the associated transaction costs as the
milk source is far. The highest milk sale price recorded was in Oyugis (KSh 30 per Litre.
fresh milk and KSh 32 per litre. fermented) (Figure 2). In some areas like Suneka (Kisii) and
Ekerenyo (Nyamira), farmers sell their own milk, as there are few traders.
The quality control measures used prior to milk intake is the use of a lactometer, matchstick
and organoleptic tests such as odour, smell and milk flow, (Case 1 and 2). Left over milk is
soured and sold to consumers the next day at a price of about KSh 32 per litre. There are few
occurrences of milk spoilage as they have informal contractual arrangements whereby the
suppliers replace spoilt milk.
Case 3: Milk Hawkers at Danger in Nandi
The traders source their milk from two organised collection centres at Danger in Nandi. While at the purchase point, they pay the County Council levy. In addition at the point of sale, such as in Kakamega or Kisumu they pay the Municipal County charges.
Page 33
24
Ranking of marketing constraints was carried out in Suneka (Kisii), Ekerenyo (Nyamira),
Kojwang‟ Katunde (Rachuonyo), Kilibwoni (Nandi) and Nangili (Bungoma) (Table 8).
Traders‟ suggestions on opportunities for overcoming constraints
Figure 2 Purchase and sales prices (KSh per litre) by site
1. Organised milk marketing, with clear cut rules and regulatory authorities to ensure fair
play on all sides
2. Improvement of milk quality (unadulterated milk) and consumer awareness
3. Government /NGOs should create a credit scheme to provide farmers and traders with
soft loans to purchase capital equipment
Table 8 Ranking of constraints cited by milk traders/farmers Kakamega Vihiga Kisii Nyamira Rachuonyo Nandi Bungoma
Harassment by the KDB 2 1 1
Fluctuations in supply/prices (season)
4 2 2 2 3
High transportation costs 1 1 4
Lack of knowledge on milk handling
7
Lack of storage facilities 3 8
Competition from other traders 2
Adulteration of milk by suppliers 5 2 5
High cost of capital items 1 5 1 5 6
High default rates 4
Lack of AI services/Bull schemes 4 3
Lack of organised marketing 3 1 4 6
Transportation problems (foot) 3 2 3 4
0
5
10
15
20
25
30
35
Kakamega Vihiga Nandi Ekerenyo Oyugis Suneka Bungoma
Purchase Sale
Page 34
25
3.3 Kenya Dairy Board
The Kenya Dairy Board (KDB) has provincial offices in each province. The Western province
office is situated in Kakamega. One of the objectives of liberalisation of milk marketing was to
allow for more processors. However, according to KDB in Kakamega, it opened markets for
milk vendors (hawkers) which pose potential public health hazards. It also caused the collapse of
the Kakamega Dairy Farmers Co-operative Society and has led to the few cases of Tuberculosis
and Brucellosis reported in district hospital. In Kakamega, they have licensed 50 farmers, 20
milk bars, 1 mini dairy (Kitinda) and 10 hawkers. They have also licensed KCC, Premier and
Ilara processors. The requirements for a license are that one should have a premise, use
aluminum milk cans, knowledge on milk handling and eventually have a cooler. KDB's role in
the liberalised market is to carry out quality control checks but they are constrained by lack of
testing kits. The way forward according to the KDB is to educate farmers and milk market
agents on milk handling hygiene practices and to encourage more processing of milk.
Page 35
26
4 Service Provision
4.1 Veterinarians, Animal Health Assistants and Stockists
Incidences of cattle diseases are high in the region as a result of poor animal management, poor
spraying methods and feeding practices. The main diseases include tick - borne diseases (East
Coast Fever, Heartwater and Anaplasmosis) Brucellosis, scours in calves, mastitis, nutritional
disorders and foot and mouth disease. The drugs are unaffordable to many farmers who
therefore settle for cheap, ineffective drugs or herb–using quacks. The drugs stocked are from
Coopers, Cosmos and Bayer. There are very few stockists serving vast areas. The items
stocked include animal feeds, acaricides and minerals (Table 9).
Table 9 Prices of livestock inputs
Item (KSh per 100ml) Livestock feeds (KSh per bag)
Dewormer Wormicid 70 Dairy Meal 750 - 870 per 70Kg bag Nilzan plus 180 Mineral Lick 160 per 2Kg bag Stock spray Triatix 240 Almatix 180 Stelladon 170
The sources of livestock feeds include; Unga Feeds, UniFeeds and Milling Corporation of
Kenya.
Constraints cited by the service providers include;
1. Lack of means of transport
2. No record keeping by farmers
3. Reliance on quacks by farmers until animal condition is critical
4. Unfair competition from quacks
5. High default rates by farmers
4.2 AI services
Procurement of semen is from CAIS and ABS. Government services through the veterinary
department do not serve well because of lack of transportation in most areas. In Rachuonyo
district, AI is currently provided by the Government–run Oyugis scheme. The charges are
KSh 300 per series of four services. Private AI providers such as the Amani Centre (Oyugis)
and PUSU Women‟s group have collapsed. The Amani centre started providing services to
farmers benefiting from the Heifer Project International (HPI), but was extended to other
farmers. The scheme collapsed due to high charges caused by high cost of liquid Nitrogen
from CAIS. Currently, there are bull schemes set up by HPI and private farmers.
The constraints cited include transport, low conception rates due to poor heat detection and
deterioration of semen quality due to poor storage and handling facilities.
Page 36
27
5 Conclusions
The conclusions being presented here are derived from interactions and deliberations with the 14
farmers‟ groups within the seven districts. They are not precise and they were not intended to be,
but are general and indicative. They present an initial attempt to understand the region and set
the scene for further interventions by research and development organizations such as SDP.
Most regions except Rachuonyo have the potential for intensive livestock production due to
favourable climatic conditions. Extensive dairying is restricted to Nandi, Bungoma and
Kakamega where land sizes are relatively larger. Intensive dairying is to be found in Vihiga,
Kisii and Nyamira. Rachuonyo has both extensive and semi-intensive dairying.
In the region farmers also have a relatively long experience with farming crops and livestock.
From the historical development farmers have been responsive to incentives as shown by rapid
increases in production of crops and milk when conditions are conducive and then quickly
reducing production when conditions change.
In Bungoma and Kakamega, there exists a bias on crops enterprises especially sugar cane. Zebu
are preferred to grade cattle for traditional cultural reasons. These cultural factors may be the
greatest constraint to dairy development along side lack of forage, technical know how and
diseases. The few grade animals cannot sustain a private AI scheme. Intensification of dairy
would increase the household labour demand and offer alternative sources of income.
Rachuonyo is unique from the other areas in that most parts are drier and not densely
populated. However, the potential for intensification exists in a few areas such as Oyugis
In Vihiga, there is potential for increased intensified dairy production. The farmers have
some experience in livestock production, though they still have a strong leaning towards crop
enterprises. The milk market is good whilst the limiting factors are unavailability of breeding
stock and cost of animal health services.
In Kisii and Nyamira there is still heavy reliance on cash and food crops whose prices are
attractive, and the majority of the farmers have local cows. Main problems are animal
diseases, availability of grade animals, feeds and input prices. As with Rachuonyo, human
diseases especially malaria are of major concern. There are concerns with management of
societies.
Western and Nyanza are generally deficient in milk and all flows tend towards the major
towns. A few Dairy Farmers‟ Co-operative Societies are still operational though beset by
management problems and competition from milk hawkers. Trade in milk is mainly informal
Page 37
28
in the region, with participants involved in transportation and distribution. The informal
traders serve both farmers and consumers more efficiently, a situation that is unlikely to
change until milk production rises significantly to the point where farmers have difficulties
selling milk. The role of regulatory bodies is unclear, in that where they exist, they are seen
to be too restrictive and where they have no offices, they are ineffective. There are
opportunities for growth in milk marketing if there‟s improvement in the organization of
traders and encouragement from regulatory bodies to trade in larger volumes under hygienic
conditions.
For SDP, the issues that will have to be addressed will revolve around the huge milk deficit
while there is still potential to increase milk production. Immediate issues would be to
improve our understanding on why the production gap exists and why farmers do not adopt
technologies that would increase milk output.
Page 38
29
6 References
Environmental Systems Research Institute (ESRI). 1999. Arcview Version 3.1, 380 New
York Street, Redlands, CA, USA.
Jaetzold, R. and Schmidt, H. 1983. Natural conditions and farm management information. In:
Farm Management Handbook of Kenya, Volume II, Ministry of Agriculture, Nairobi, Kenya.
Owango, M., S. Staal, M. Kenyanjui, B. Lukuyu, D. Njubi and W. Thorpe. 1998. Dairy Co-
operatives and Policy Reform in Kenya: Effects of Livestock Service and Milk Market
Liberalisation. Food Policy, 23(2), April 1998, pp. 173-185.
Smallholder Dairy Project 2000. Phase 1 achievements seminar. Proceedings of the seminar
held at KARI headquarters, Nairobi, March 9, 2000.
Staal, S. J., L. Chege, M. Kenyanjui, A. Kimari, B. Lukuyu, D. Njubi, M. Owango, J. Tanner,
W. Thorpe and M. Wambugu. 1997. Characterisation of dairy systems supplying the Nairobi
Milk market: A pilot survey in Kiambu district for the identification of target groups of
producers. MoA/KARI/ILRI Collaborative Research Report, Smallholder Dairy (R&D)
Project, Nairobi, Kenya.
Staal, S. J., M. Owango, H. Muriuki, B. Lukuyu, F. Musembi, O. Bwana, K. Muriuki, G.
Gichungu, A. Omore, M. Kenyanjui, D. Njubi, I. Baltenweck And W. Thorpe. 1998. Dairy
systems characterisation of the Nairobi milk shed: Application of spatial and household
analysis. MoA/KARI/ILRI Collaborative Research Report, Smallholder Dairy (R&D)
Project, Nairobi, Kenya.
Page 39
30
Annex 1: Mapping of spatial variation in Western Kenya
1. Cattle densities in Western and Nyanza
Just released by the ILRI-GIS section is a dataset on cattle numbers and densities for each
division in Kenya. Data for this coverage were obtained from the Livestock Production
Department which provided the latest district level report on livestock numbers (1992-1998).
Since the western regions of Kenya tend to be high potential livestock regions in terms of
agro-climatic conditions, total cattle densities were mapped as opposed to the densities of
grade cows in the area. Although cattle rearing in general is widely prevalent, only a few
areas tend to show intensive numbers of dairy animals.
2. Tick borne disease distribution
Data on tick borne diseases were provided by the ILRI-GIS section and supplemented by
household data on the occurrence of tick related illnesses from the Other District Survey. The
available layers cover brown ear tick distribution data and expert opinions on the spread of ECF
and other tick borne diseases. To check the consistency of all these very different tick and
disease data, an overlay was made of the distribution layers and point data. The resulting overlay
of all presents a consistent pattern of expected and reported distribution of tick borne diseases:
the whole of Western Kenya is affected. However, several important parameters were not
available when assembling data, such as different breeds and management practices, which
affect infestation. Hence, the forthcoming characterization study in Western might contribute to
a more sensitive layer on actual tick related risks.
3. Spatial distribution of ethnic groups
The obvious but indistinct relationship between ethnicity and dairy practices was reason to add
basic data on the spread of ethnic groups throughout the districts under study. The Kenya
Central Bureau of Statistics provided data the presence of different ethnic groups for all districts
at sub-location level. For sub-locations with one predominant ethnic group (being >95% of the
total inhabitants) no secondary ethnic group was recorded. Most areas proved to be quite
consistent especially Kisii and Nyamira. In all other areas, secondary ethnic groups were
recorded, with Nandi harboring the largest number of other ethnic groups apart from the
predominant Kalenjin.
Page 40
31
Figure 3 Grade and total cattle densities
Page 41
32
Figure 4 Distribution of ticks and reported tick-borne disease cases
Page 42
33
Figure 5 Distribution of ethnic groups in western province
Page 43
34
Figure 6 Distribution of ethnic groups in Nyanza province
Page 44
35
Annex 2 Farm and Community level Resource maps
Figure 7 Farm and community resource maps for Kakelo Dudi, Rachuonyo district
Homestead
Napier grass
Bananas
maize
Cassava
Sugar cane
groundnuts
Beans
Trees
manure
OUTPUTS
cows
Market
INPUTS
Neighbour
Awach DFCS
Milk
labour
Sugar cane tops
Kakelo Dudi communitySchools
Church
NGOs,(CARE,
RED CROSS)
Ministry of
Agriculture
Sowako Support
GroupHealth
dispensary
AI
Water
Department
Electricity
Page 45
36
Figure 8 Farm and community resource maps for Kojwang’/Katunde, Rachuonyo
district
Homestead
trees
fruits
maize
finger millet
sweet potatoes
groundnuts
Beans
vegetables
manure
OUTPUTS
cows
cowshed
Market
Firewood
Ksh 5 per bundle
Ksh 5 per piece
Milk (Ksh 15 per Treetop)
Ksh 25 per gorogoro
Ksh 50 per gorogoro
INPUTS
Education
Provincial
Administration
Church
Health
Agriculture CARE
Telecommunications
Veterinary
services
Homa Hills
Page 46
37
Figure 9 Farm and community resource maps for Bokiamburi, Nyamira district
Homestead
Cows
Coffee
Napier grass
Maize
Tea
Trees
Nyangoko coffee
factory
Sanganyi Tea
factory
Fertiliser/agro - chemials
Neighbours
fertiliser, cash
Local Mkt.
LabourNeighbours
Firewood
Timber
Milk (Ksh 20 per Lt)
Manure
INPUTS
OUTPUTS
Bokiamburi
Agricultural
Extension
Provincial
Administration
Veterinary
Department
Schools
Dispensary
KTDA
Nyambomisi Farmers
Cooperative Society
Miruka Market
Water Dept.
NGOs
(HPI)
AI
Stockist
KARI
Page 47
38
Figure 10 Farm and community resource maps for Ekerenyo, Nyamira district
Homestead
Cows
Coffee
Maize
Sugar cane
Tea
Bisembe FCS
Sanganyi Tea
factory
Fertiliser/agro - chemicals
Neighbours
fertiliser
Local Mkt.
INPUTSOUTPUTS
Pasture
Napier grass
Trees
Fertiliser/seeds
Napier (Ksh 50 per headload)
Hotels
Milk
Ksh 12 per treetop
Maize stover
Timber
Manure
Tombe IkongeAgricultural
Extension
Provincial
Administrati
on.
Veterinary
Department
Schools
Churches
KTDA
Coffee factory
Local markets
KARINGOs
Fisheries
AI (Nyamira)
Water
Department
Dispensary
Forestry
(Ekerenyo)
Page 48
39
Figure 11 Farm and community resource maps for Marani, Kisii district
Homestead
Cows
Coffee
Bananas
Beans
Tea
Coffee factory
Tea factory
Neighbours
Agro chemicals
Local Mkt.
INPUTSOUTPUTS
Vegetables
Maize
Napier
KISII Townfertiliser
Manure
Marani
Bull (Local)
Bull LDP
Local healer
Neighbour
MANGA
Marani
AI Services
Agricultural and
Veterinary
Department
Page 49
40
Figure 12 Farm and community resource maps for Suneka, Kisii district
Homestead
cow
coffee
napier
maize
Finger millet
Sugar cane
vegetables
sorghum
groundnuts
trees
Local market
Iyabe coffee
factory
manureVet drugs,
dairy feeds
manure
Seeds and
fertiliser
INPUTS OUTPUTS
Ksh 10/Kg
Ksh 20-35/gorogoro
Ksh 60-70/gorogoro
Ksh 5-7/cane
Ksh 25-40/gorogoro
Ksh 80-150/charcoal
Milk
COMMUNITY
Markets
Provincial
Administration
Roads
Schools
Health services
Cattle dips
WaterVeterinary
Services
Extension
services
KARI
Dairy cows
Page 50
41
Figure 13 Community resource map for Mbihi, Vihiga District
MBIHI
Markets
Church
Ministry of
Agriculture
Education
Provincial
Administration
Health
Veterinary
Department
AFC
Page 51
42
Figure 14 Community resource map for Kilibwoni, Nandi District
Kosirai
Veterinary
services
Communi
cation
(Roads)
Provincial
Administra
tion
School
Health
services
Extension
services
Credit Services
Electricity Water
supply
Page 52
43
Annex 3 Milk flows to towns
Figure 15 Milk flow and prices to Nyamira town and Oyugis town
Nyamira Town
(Ksh 20/Lt)
Gesure
(Ksh 20/Lt)
Nyangoso Kioge
Nyachogo-
chogo
(Ksh 13/Lt)
Tinga
(Ksh 13/Lt)
Marindi
Mabundu
(Ksh 20/Lt)
Etono
(Ksh
20/Lt)
Nyabite
(Ksh 20/Lt)
Nyameru
(Ksh
20/Lt)
1 Km
Foot
3 Km (foot)
3 Km
5 Km
10 Km
Bike
3 Km
1 Km 4 Km
0.5 Km
Foot
Kakelo Dudi
subloc.
Awach
Dairy society
East Kamagak
location
Kamuma
sub-location
Oyugis
town
KisiiKisumu
Kakelo Kamroth
sub-location
Mawego Market
Kojwach
sub-location
Kokwanyo
location
Ringa Market
Kadongo
Centre
Ksh 30-32/Lt
8Km
Matatu/Bike
2 Km(Foot/Bike)
5-6 Lts
Matatu/Bike
Ksh 30/Lt
4 Km 35 Lts
3Km
(15Lts)
Foot
7Km
(14-16Lts)
Ksh 30-32/Lttraders
Milk Purchase, sales areas and quantity flows in Kamuma sub-location, Rachuonyo district
7Km
(7-10Lts)
20-30Lt
Page 53
44
Figure 16 Milk flow and prices in Bungoma district
TURBO Ksh.18 300 lts
BUNGOMA
TOWN
SOI KSh. 17 150 lts
9.30 a.m.
KITALE Cherangani Ksh.17 1200lts
5.30 a.m.
KANDUYI
KSh. 24
120lts
7.30 a.m.
SIRISIA
KSh. 20
9.00 a.m.
110 Km
2.00 p.m.
Fresh KSh. 28
Mala Ksh. 30
30 Km
Fresh KSh. 26
Mala KSh. 40
100lts
150 Km
11.30 a.m.
Fresh KSh. 32
Mala KSh. 26
60 Km
12 p.m.
Fresh KSh 26
Fresh KSh 30
Page 54
45
Annex 4. Typical farm layouts - current and past
Figure 17 Typical current farm layout in Suneka, Kisii district
Figure 18 Typical farm layout in 1980s in Suneka, Kisii district
Figure 19 Typical current farm layout in Bokiamburi, Nyamira district
Homestead (1/2 acre)
Trees (1/8 acres)
Tea
(1/4 acre)
Maize/Beans
(1 acre)
Bananas
(1/4 acre)
Ground nuts
(1/4 acre)
Grazing
ground
(1/4 acre)
Cattle shed
(1/8 acre) Sugar cane
(1/2 acre)
Tomatoes
(1/8 acre)
Sugar
cane
(1/2 acre) Napier
(1/4 acre)
Sweet
potatoes/cassa
va
(1/8 acre)
Vegetables
(1/4 acre)
Homestead (2 acre)
Coffee
(1.5 acre)
Maize/Beans
(4 acre)
Sorghum
(0.2 Acre)
Grazing
ground
(2 acre)
Thatch
grass (2
acres) Ground
nuts
(1 acre)
Finger millet
(0.5 acre)
Sugar
Cane
(4.5
acres)
Napier
(3 acre)
Sweet potatoes
(1 acre)
Bananas
(2 acre)
Homestead (1/4 acre)
Tea (1/2
acre)
Maize/Beans
(1 acre)
Trees
(1/8 acre)
Bananas (1/2 acre)
Grazing
ground
(1/8 acre)
Ground
nuts
(1/8 acre)
Finger
millet
(1/4 acre)
Coffee
(1/4 acre)
Sugar
cane
(1/16
acre) Napier
(1/4 acre)
Sweet
potatoes
(1/8 acre)
Vegetables
(1/16 acre)
Page 55
46
Figure 20 Typical farm layout in 1980s in Bokiamburi, Nyamira district
Figure 21 Typical current farm layout in Kojwang/ Katunde, Rachuonyo district
Figure 22 Typical farm layout in 1980s in Kojwang/Katunde, Rachuonyo district
Homestead (3/4 acre)
Trees (1/8 acre)
Bananas
(1/4 acre)
Maize/Beans
(1 acre)
Sweet potatoes (1/4 acre)
Irish potatoes (1/4 acre)
Grazing
ground
(1/2 acre)
Pyrethrum
(1/2 acre) Ground
nuts
(1/2 acre)
Finger millet
(1/2 acre)
Coffee
(1/2 acre)
Tea (1
acre)
Napier
(1/4 acre)
Sugar cane-
(1/4 acre)
Vegetables
(1/2 acre)
Homestead (1/2 acre)
(inclusive of fruits/trees)
Cotton
(1 acre)
Maize/Beans
(1 acre)
Tobacco
(1/2 acre)
Sorghum
(Var:
Seredo/Serina/Gopari/Ochuti
)
(1 Acre)
Grazing
ground
(1/2 acre)
Ground
nuts
(1/2 acre)
Finger
millet
(1/8 acre)
Fallow
Sugar
cane
Napier
(1/4 acre)
Sweet
potatoes/cassa
va
(1/8 acre)
Vegetables
(1/4 acre)
Homestead (1/2 acre)
(inclusive of fruits/trees)
Cotton
(2 acre)
Maize/Beans
(1 acre)
Sorghum
(Seredo/Serina/Gopari/Och
uti) (1 Acre)
Grazing
ground
(1/2 acre)
Groundnuts
(1/2 acre)
Finger millet
(1/4 acre)
Fallow
Napier
(1/4 acre)
Sweet potatoes
(1/4 acre)
Vegetables
(1/2 acre)