75
1 KISORO DISTRICT THE STATE OF ENVIRONMENT REPORT FOR KISORO DISTRICT 2007/2008 KISORO DISTRICT LOCAL GOVERNMENT
| Date post: | 07-Apr-2018 |
| Category: |
Documents |
| Upload: | raymond-katabazi |
| View: | 224 times |
| Download: | 0 times |

8/3/2019 Kisoro District The State of Environment Report
http://slidepdf.com/reader/full/kisoro-district-the-state-of-environment-report 1/75
1
KISORO DISTRICTTHE STATE OF ENVIRONMENT REPORT FOR
KISORO DISTRICT 2007/2008
KISORO DISTRICT LOCAL GOVERNMENT

8/3/2019 Kisoro District The State of Environment Report
http://slidepdf.com/reader/full/kisoro-district-the-state-of-environment-report 2/75
2
EXECUTIVE SUMMARY
IntroductionKisoro district states of environment report series are produced to meet the need for up to date andtimely information of the district environment for sustainable development planning .This is the third time the State Of Environment Report for Kisoro District has been produced. NEMA
produced the first report in 1998and the second in2005 under NEMA funding by the Ag. DistrictEnvironment OfficerThis time round the district has produced it using its own resources and this emphasizes the need forthe Local Government to own it as a district document and annually support its production as per theNational Environment Act [Cap 153]
ContentThis report has moved from looking at the environment in isolation and has tried to look at it in a multi-sectoral manner. The report takes into account the environment and its relation to economic and socialissues It particularly analyses the link between environment, enterprise and poverty. The pressure- state
response framework was used for the compiling of information and writing of this report.
The report is divided into four chapters;Chapter one looks at the linkages between the environment and development; poverty and relationshipwith the environment.
Chapter two discusses the traditional environmental issues that are specific to Kisoro.These include land, biodiversity, forests, wetlands, fisheries resources, urbanization, the atmosphere,social, gender issues and the environment and environmental disasters and epidemics (drought, floods,HIV/AIDS)
Chapter three mainly takes into consideration the policy on environment over the years and its effect onmanagement of natural resources as a response. This section also includes the laws, institutions andeconomic instruments, actions at community levels, public participation, environment education andinformation.
Chapter four looks at our present actions and responses . It also identifies the achievements so far inmanagement of our environment at district level and the recommendations for future actions in order toabate the negative effects on our environment. It also states the challenges faced in the state of environment reporting process
ENVIRONMENT AND DEVELOPMENT
People are increasingly getting concerned about how the interaction between environment and growthaffects the human development. There is now a clear empirical link between poverty, environment andsustainable development The relation ship between poverty and environment is a two way withincomes not only affecting but also being affected by natural resources The stress on natural resourcesin Kisoro is manifested by loss of agricultural productivity, loss of forest cover ,water scarcity, diseaseprevalence, encroachment on wildlife and wetland areas and increasing land degradation. According tothe Uganda Human Development Report of 2005,Kisoro has a human development index [HDI] of 0.451 as per the original 56 districts 22 nd with Kotido ranked lowest with HDI of 0.231 and Kampalawith HDI of 0.615 the highest. This human development index is a measure of deprivation in three

8/3/2019 Kisoro District The State of Environment Report
http://slidepdf.com/reader/full/kisoro-district-the-state-of-environment-report 3/75
3
basic areas namely; a long and healthy life, adult literacy rate, decent standard of living. The problem iscompounded by gender imbalances resulting from economic and social prejudices against women andother marginalized, groups such as the Batwa ,and street children This hampers participation inplanning and implementation of for equal opportunities.

8/3/2019 Kisoro District The State of Environment Report
http://slidepdf.com/reader/full/kisoro-district-the-state-of-environment-report 4/75
4
LIST OF ACRONYMSA2N Africa 2000 Network ARCOS Albertine Rift Conservation SocietyAWF African Wildlife FoundationBINP Bwindi Impenetrable National Park
BMCT Bwindi Mgahinga Conservation TrustCBO Community Based OrganisationDHS Directorate of Health ServicesDDP District Development PlanDEAP District Environment Action PlanDEC District Environment CommitteeDept DepartmentDEO District Environment OfficerDFGF Diane Fossey Gorilla FundDoW department of WaterDSOER District State Of Environment Report
DTPC District Technical Planning CommitteeEIA Environment Impact AssessmentFIRRI Fisheries Research InstituteGO Gorrilla OrganisationGoU Government of UgandaGTA Gisorora Twubake AssociationHDI Human Development IndexHSD Health Sub DistrictIBAS Important Bird AreasIGCP International Gorilla Conservation ProgramIPCEFRI Integrated Project for the Conservation of Echuya Forrest
ITFC Institute of Tropical Forest ConservationIUCN The World Conservation UnionKDDP Kisoro District Development PlanKDTP Kisoro district Tourism PlanKDLG Kisoro District Local GovernmentKm KilometerLC Local CouncilLECs Local Environment CommitteesLGA Local Governments ActLGDP Local Government Development ProgrammeMBIFCT Mgahinga Bwindi Impenetrable Forest Conservation Trust
MoFPED Ministry of Finance Planning and Economic DevelopmentMGCF Mountain Gorilla Conservation FundMGNP Mgahinga Gorilla National Park mm MillimetersMTTI Ministry of Trade Tourism and IndustryNEMA National Environment Management AuthorityNEMP National Environment Management PolicyNES National Environment StatuteNFA National Forestry Authority

8/3/2019 Kisoro District The State of Environment Report
http://slidepdf.com/reader/full/kisoro-district-the-state-of-environment-report 5/75
5
NGO Non Governmental Organization
NPHC National Population and Housing censusNSOER National State Of Environment ReportPAF Poverty Action Fund
PEAP Poverty Eradication Action ProgramPRIME WEST Productive Resources for Managing the Environment in Western UgandaPTC Primary Teachers CollegeSida Swedish International development agencySOER State of Environment ReportUBOS Uganda Bureau of StatisticsUNHCR United Nations High Commission for RefugeesUPPAP Uganda Participatory Poverty Assessment ProgramUPE Universal Primary EducationUWA Uganda Wildlife AuthorityWID Wetlands Inspection Division
8/3/2019 Kisoro District The State of Environment Report
http://slidepdf.com/reader/full/kisoro-district-the-state-of-environment-report 6/75
6
District at a glance
Kisoro district is located in the southwestern part of the country. It coves a total area of 729.2Km 2
(66.2km2 open land the rest being open water and swamps) and is approximately 510Km from thecapital Kampala and lies longitude 29 0 35east and 29 0 35 degrees east and latitude 1 0 14 and 1 0 23south.
It borders the democratic republic of Congo to the west, the republic of Rwanda to the south, Kabaleand Kanungu district to the east and north respectively.The district mainly experiences two rainy seasons one from September to December and another fromMarch to May. It experiences a minimum and maximum temperatures of 10 0C and 26 0C respectivelyand a relative humidity of 80 percent.Kisoro district lies 1991 meters above sea level and is divided into two major topographic regions; thesouthern lowlands and northern highlandsThere are four main soil types; ferraltic mainly found in the north, Eutrophic found in the east andsouth, non-hydromorphic mainly found at the foothills of the mountains and papyrus peat soils foundmainly in wetlands.There are three-vegetation zones; forests; Echuya, Mgahinga and Bwindi; wetlands; and grasslands.
Kisoro district was formed in 1991 from the former Kigezi that consists of Rukungiri, Kabale,Kanungu that was commonly known as the Switzerland of Africa because of its plush scenery, cooltemperatures through out the year and mountainous terrain. This follows the environmental diversity of Uganda that earned it the name the Pearl of Africa by Churchhill.The district has one county and three constituencies with 13 Lower local governments called subcounties namely; Nyarusiza, Muramba, Chahi, Nyakinama, Nyarubuye, Busanza, Kirundo,Nyabwishenya, Bukimbiri, Nyundo, Nyakabande, Murora and Kanaba and one Town Council. It has atotal of 389 villages, 36 parishes and two Town Wards.According to the 2002 Uganda population and housing census, Kisoro District Report the totalpopulation was 220,312 , with 95% of the people being rural dwellers. The so called urban dwellers
that constitute 5% are those that live in Kisoro Town council. The results indicate an increase in thepopulation densities from 275 to 324 persons per square kilometer in 1991 to 2002 respectively
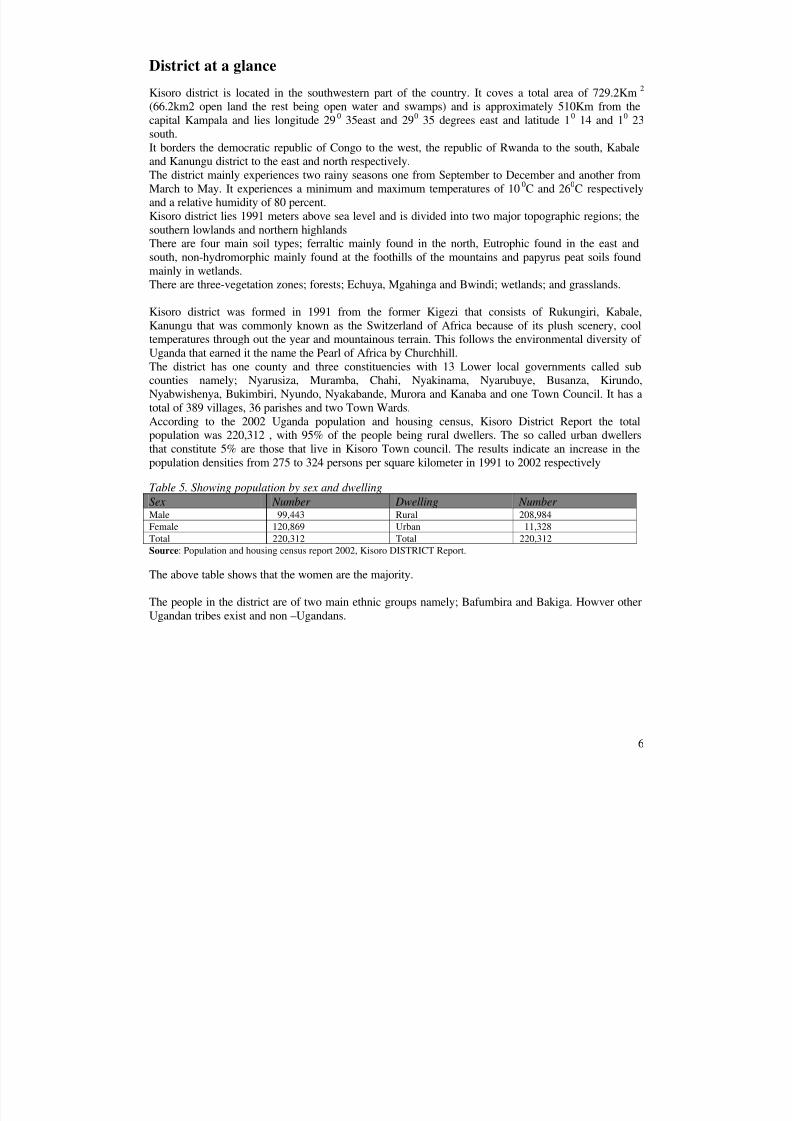
Table 5. Showing population by sex and dwellingSex Number Dwelling Number Male 99,443 Rural 208,984Female 120,869 Urban 11,328Total 220,312 Total 220,312Source : Population and housing census report 2002, Kisoro DISTRICT Report.
The above table shows that the women are the majority.
The people in the district are of two main ethnic groups namely; Bafumbira and Bakiga. Howver otherUgandan tribes exist and non –Ugandans.
8/3/2019 Kisoro District The State of Environment Report
http://slidepdf.com/reader/full/kisoro-district-the-state-of-environment-report 7/75
7
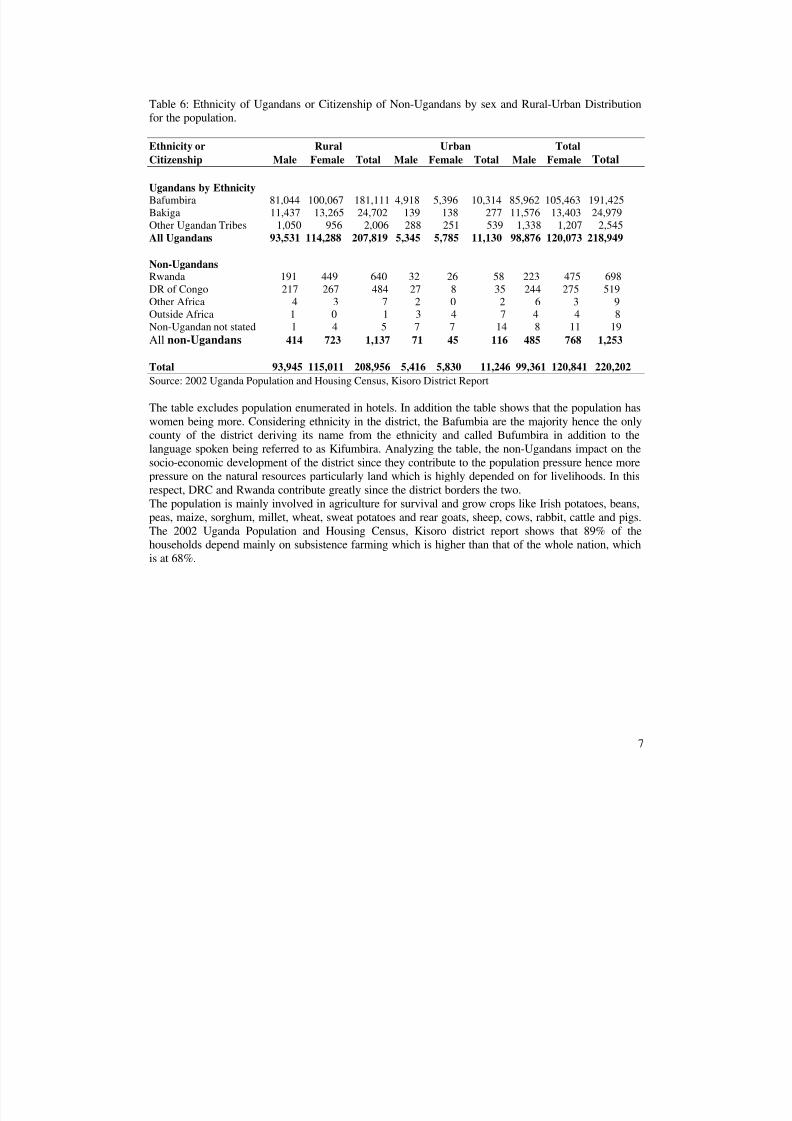
Table 6: Ethnicity of Ugandans or Citizenship of Non-Ugandans by sex and Rural-Urban Distributionfor the population.
Ethnicity or Rural Urban TotalCitizenship Male Female Total Male Female Total Male Female Total
Ugandans by EthnicityBafumbira 81,044 100,067 181,111 4,918 5,396 10,314 85,962 105,463 191,425Bakiga 11,437 13,265 24,702 139 138 277 11,576 13,403 24,979Other Ugandan Tribes 1,050 956 2,006 288 251 539 1,338 1,207 2,545All Ugandans 93,531 114,288 207,819 5,345 5,785 11,130 98,876 120,073 218,949
Non-UgandansRwanda 191 449 640 32 26 58 223 475 698DR of Congo 217 267 484 27 8 35 244 275 519
Other Africa 4 3 7 2 0 2 6 3 9Outside Africa 1 0 1 3 4 7 4 4 8Non-Ugandan not stated 1 4 5 7 7 14 8 11 19All non-Ugandans 414 723 1,137 71 45 116 485 768 1,253
Total 93,945 115,011 208,956 5,416 5,830 11,246 99,361 120,841 220,202Source: 2002 Uganda Population and Housing Census, Kisoro District Report
The table excludes population enumerated in hotels. In addition the table shows that the population haswomen being more. Considering ethnicity in the district, the Bafumbia are the majority hence the onlycounty of the district deriving its name from the ethnicity and called Bufumbira in addition to the
language spoken being referred to as Kifumbira. Analyzing the table, the non-Ugandans impact on thesocio-economic development of the district since they contribute to the population pressure hence morepressure on the natural resources particularly land which is highly depended on for livelihoods. In thisrespect, DRC and Rwanda contribute greatly since the district borders the two.The population is mainly involved in agriculture for survival and grow crops like Irish potatoes, beans,peas, maize, sorghum, millet, wheat, sweat potatoes and rear goats, sheep, cows, rabbit, cattle and pigs.The 2002 Uganda Population and Housing Census, Kisoro district report shows that 89% of thehouseholds depend mainly on subsistence farming which is higher than that of the whole nation, whichis at 68%.
8/3/2019 Kisoro District The State of Environment Report
http://slidepdf.com/reader/full/kisoro-district-the-state-of-environment-report 8/75
8
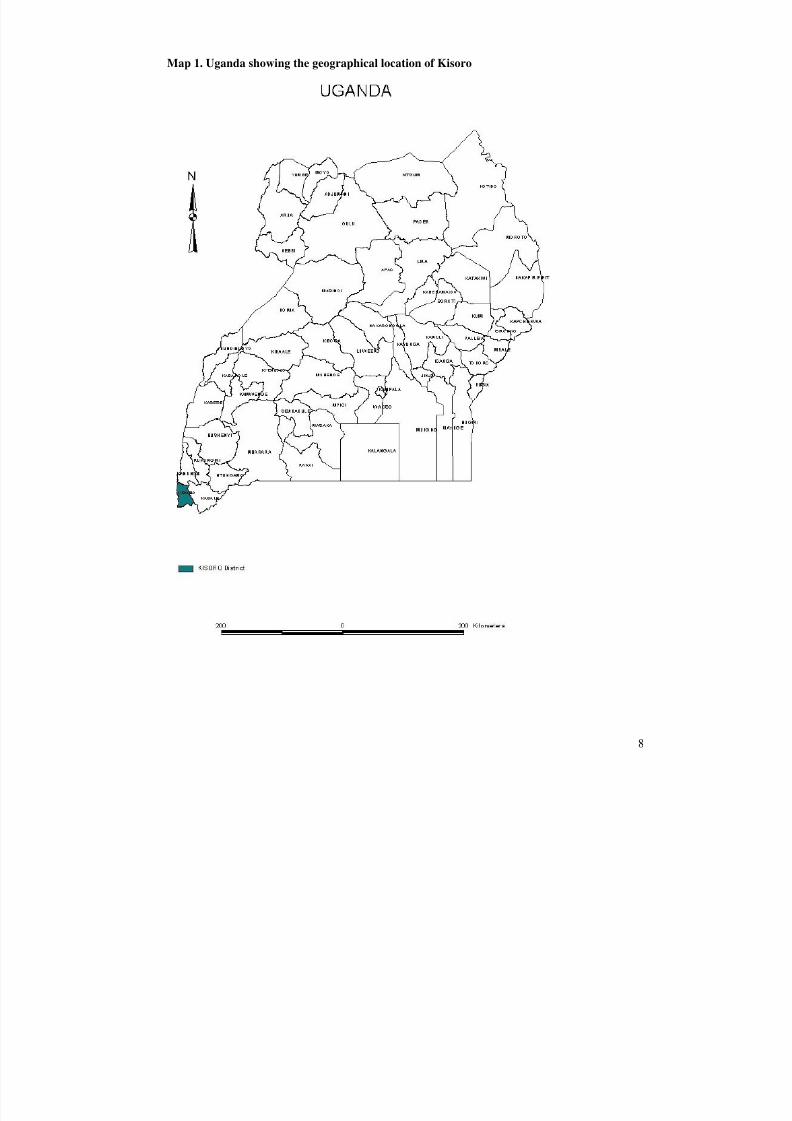
Map 1. Uganda showing the geographical location of Kisoro
8/3/2019 Kisoro District The State of Environment Report
http://slidepdf.com/reader/full/kisoro-district-the-state-of-environment-report 9/75
9
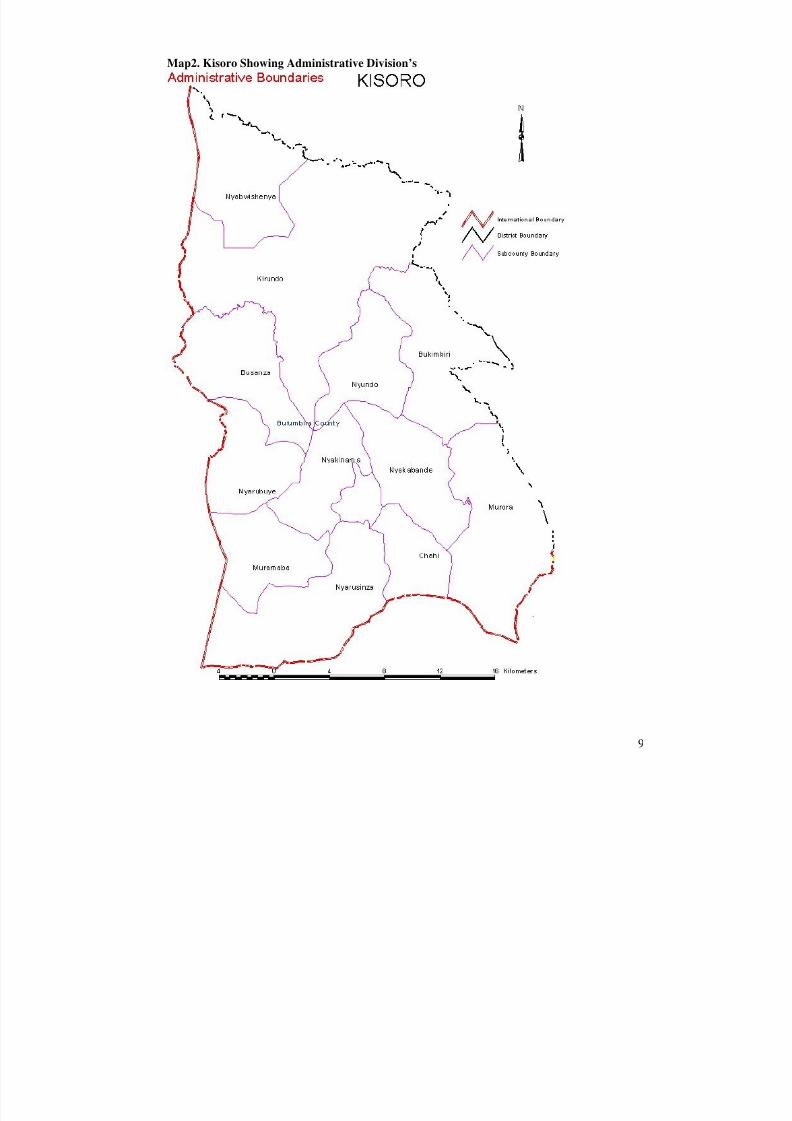
Map2. Kisoro Showing Administrative Division’s
8/3/2019 Kisoro District The State of Environment Report
http://slidepdf.com/reader/full/kisoro-district-the-state-of-environment-report 10/75
10
CHAPTER ONE: ENVIRONMENT AND DEVELOPMENT
1.0 INTRODUCTIONDevelopment in simple terms can be defined as improvement of people’s livelihood and standard of living. It is a multi dimensional concept that encompasses economic, social and environment relatedaspects hence sustainable development.Sustainable development looks at improving and maintaining the well being of people and theenvironment. It is an evolving process that improves the economy, environment and society withoutcompromising the benefit of future generations.The relationship between environment and development is complex because it addresses manydimensions, which include social aspects of activities in a given area; population, use of naturalresources and management of the environment which interact in different ways, places and times. Therate of development, its content, location and distribution to a large extent are determinants of the stateof environment. (Guidelines SOER 2004)All the above definitions look at the relationship between the environment and development, a conceptthat has not sunk in the minds of our people that always look at the two in isolation.
1.1 ECONOMIC GROWTH AND DEVELOPMENT IN KISORO DISTRICTKisoro district is located in the extreme southwestern Uganda bordering the Republic of Rwanda; theDemocratic Republic of Congo; Kabale and Kanungu districts.It was formed in 1991 from the former Kigezi District that consisted of Kabale, Rukungiri, Kanunguand Kisoro district. Following its formation the district has registered tremendous developmentwhereby it has grown in terms of infrastructure, trade, agriculture and access to social services.However, the districts economy is still poor with the major economic activity being subsistenceagriculture.According to the 2002 Uganda Population and Housing census 89 percent of the households werereported to be engaged in subsistence farming. This shows that it is the main source of livelihood of thepeople of Kisoro. However, the distant location of 510 km from the capital city and the rough hillyterrain affects the marketability of the agricultural products due to lack of technologies and facilities foragro processing and value addition hence incomes low from agriculture. The table below shows themain source of livelihood of households by sex of Head and Urban-Rural Distribution.
Table 6:. Main Source of Livelihoods by sex of Head and Urban-Rural Distribution.Male Headed Female Headed Total
Source of Livelihood Rural Urban Total Rural Urban Total Rural Urban Total Subsistence Farming 32,690 957 33,647 9,348 411 9,759 42,038 1,368 43,406Employment income 1,554 515 2,069 156 80 236 1,710 595 2,305
Business Enterprise 414 231 645 40 69 109 454 300 754Cottage Industry 18 17 35 3 1 4 21 18 39Property income 50 14 64 26 7 33 76 21 97Family Support 743 113 856 702 106 808 1,445 219 1,664Other 147 40 187 71 14 85 218 54 272Total 35,616 1,887 37,503 10,346 688 11,034 45,962 2,575 48,537Source . 2002 Uganda Population and Housing Census, Kisoro District Report
The above table explains the cause for the alarming environmental degradation levels since as mentioned earlier89% depend on the natural resources particularly land. The crops grown are majorly of food crops for home
8/3/2019 Kisoro District The State of Environment Report
http://slidepdf.com/reader/full/kisoro-district-the-state-of-environment-report 11/75
11
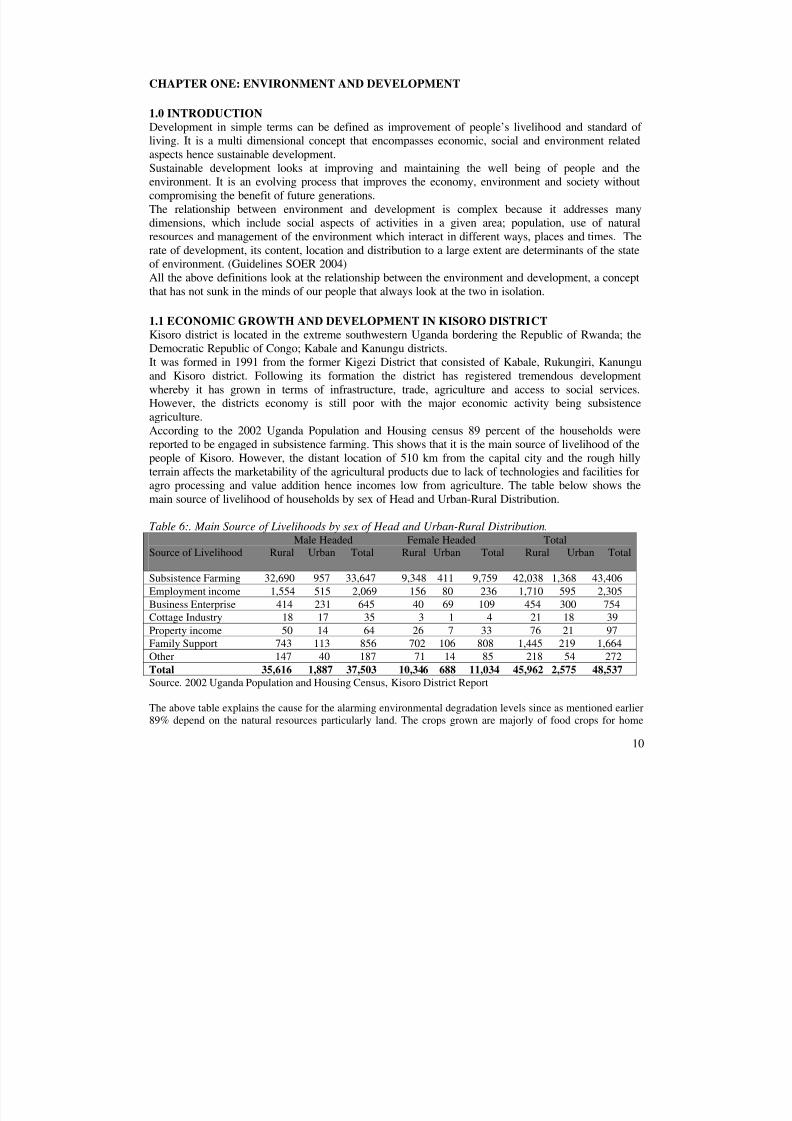
consumption hence despite the use of the natural resources for socio economic developed the poverty levelscontinue to increase. This is also contributed by the family size in relation to the land holding per householdwhich explains the continued degradation of fragile ecosystems like wetlands.
Picture1: showing clearing of Chotsa Bay Wetland for agriculture in Nyakinama Sub County amajor source of livelihood to the people in the area
The revenue base of the district is very merger and the major sources are Central government transfersand donor funds which contribute over 98% of the budget while locally raised revenue that is marketdues, licenses, permits; contributes only than 2%. This indicates a big challenge in realizing locallyraised revenue.Kisoro district also benefits from the activities of tourism from Bwindi Impenetrable National Park (BINP) and Mgahinga Gorilla National Park (MGNP) through 20% revenue sharing that spent bycommunities neighboring the National parks through activities or projects like classroom or health unitconstruction and roads maintenance.
The low revenue base and limited options in agriculture, has geared the district identified Tourism as afuture major cash economic activity, from which the district can benefit and cause economic growth.This has been cemented by the making of a Tourism Development Plan in conjunction with Ministry of Trade Tourism and Industry (MTTTI) and International Gorilla conservation Program (IGCP). Furthermore the district has recruited a District Tourism Development Officer to ensure enhanced tourismdevelopment in the district. This plan aligns with the PEAP especially in addressing issues likeparticipation of the poor in planning, development and operation .
1.2 LINKAGE BETWEEN ENVIRONMENT AND ECONOMIC GROWTHThe environment and natural resources, which include land, fisheries, forestry, climate, wetlands,physical environment, water, energy minerals and wildlife are usually looked at in isolation fromdevelopment. With the District overall mission that is to provide quality services to the people of Kisoro so as to improve the quality of life using the most cost-effective intervention, it would bedangerous to look at environment and development in isolation especially with agriculture being the

8/3/2019 Kisoro District The State of Environment Report
http://slidepdf.com/reader/full/kisoro-district-the-state-of-environment-report 12/75
12
major land use in Kisoro and a major economic activity that employs 93:4 percent of the population.This interaction though complex cannot be ignored. Looking at the average land size that is 0.8 ha perhousehold (NPHC1991) a condition that has its root cause on the high population density andtraditional inheritance practices that have led to highly fragmented pieces of land.
Also the population in Kisoro district depends on the environment for food, shelter, water, and fuel
wood and energy, the basic necessities of life.Due to high population growth the natural resources are being destroyed leading to land degradationand deforestation that has negatively impacted on productivity of soils in the whole district (DEAP2002) hence food shortages and famine are now a common phenomena. This has further caused urbanmigration and cultivation in fragile areas like steep hillsides in Busanza, Nyabwishenya and wetlandsin Nyakabande, Nyundo and Murora sub counties.It is important for us to see the role played by natural resources and environment in development just asstated in the definition of sustainable development; that it improves quality of life of our people whiletaking into consideration the use of our resources for future and present generations.The quest for development and economic empowerment by the district local government throughimproving and availing services to people like roads, schools, hospitals has led to unchecked extractionand use of resources like aggregates and sand. Scenarios in the picture below are common throughoutthe district.
It remains a challenge to the district to check and reverse or stabilize the already degraded environmentand also improve livelihood, cause economic growth of the people and avert adverse effects on futuregenerations.
1.3 POVERTY AND THE ENVIRONMENTThe quality of environment and natural resources impacts on poverty through the support that isrendered to key productive sectors such as agriculture, health and industry and overall house holdwelfare.
Importance of Natural resources to the poor In Kisoro the poor both in rural and urban areas largely depend on the natural resource base where theyderive their basic needs for survival.They engage in environmentally based economic activities namely firewood collection, brick making,charcoal production, crafts making, stone quarrying, sand mining and agriculture.These activities are useful safety nets for the poor that enable them cope with poverty and livelihoodrisks.
Poor environment conditions in a home and workplace impact negatively on the poor with implicationson their ability to pursue their livelihoods due to heavy reliance on environmental resources. Poorpeople become vulnerable to sudden shocks and changes in their immediate environment, such is thecase in Kisoro (Enviro conserve bulletin 2004).

8/3/2019 Kisoro District The State of Environment Report
http://slidepdf.com/reader/full/kisoro-district-the-state-of-environment-report 13/75
13
Pictur2- Batwa house hold in Rugeshi Kanaba sub county depicting utmost poverty
According to UPPAP, Kisoro Report 2000, community members defined poverty in general as lack of basic necessities and land. Poverty was seen to be at individual household and Community level.In that report food shortage was an area of concern and is called “ubukyene” in the local language.Thus indicating the direct dependence on environment and natural resources as a means of survival forwater, food and firewood. With a large percentage of the land being exploited including wetlands andsteep hillsides. Many people have turned to selling labor within and outside the district as analternative source of income. This has also induced migration to other areas to look for resources forexample Mubende, Mbarara, Rukungiri, Masindi and Kabarole.
The above case study reemphasizes the importance of Natural resources to people’s livelihoods and thecoping mechanisms of communities to reduce poverty and suffering by encroaching on wetlands andforests for survival.
The districts overall goal, which is to reduce poverty levels through an integrated approach whereenvironment issues are catered for has set to; promote market-oriented agriculture;
-Promote tourism as a major economic activity from which community will benefit; Promoteparticipatory approaches in planning and implementation by the poor while taking into considerationgender, women youth and minority groups and Involvement of others stake holders like NonGovernmental Organizations (NGOs) and Community Based Organizations (CBOs)
-This has been possible because of the enabling environment set by the central government in theirpoverty eradication strategy (PEAP) 2000, where three conditions are set; Structural transformation
(agricultural modernization, industrialization, institutional reforms and capacity development);Participation by the poor in economic growth by expending small holder agriculture, employment bythe service sector and rural non-farm enterprises and Sustainable economic growth with judiciousmanagement of land, forests, wetlands, range lands, lakes and the environment .

8/3/2019 Kisoro District The State of Environment Report
http://slidepdf.com/reader/full/kisoro-district-the-state-of-environment-report 14/75
14
CHAPTER TWO: THE STATE OF ENVIRONMENT
2.1 WETLAND RESOURCESKisoro district is characterized by hilly terrain with distinct valleys separating the hills that are of volcanic origin. The wetlands mainly occur in the valleys located in the centre of the district and in thesouthwest and east of Lake Mutanda, the rest being sharp valleys that do not allow formation of wetlands. In the district, wetlands lie at altitudes varying between 5900– 7500 feet above sea level andoccupy 33.4 km 2 of which 64 percent is basically permanent and 36 percent seasonal.
Table 2.1.1. Status of wetlands in KisoroCategory Name and status Sub countyCLASS 1Vital and critical
shores of L. Mutanda incl. Chotsa bayRuhezamyenda(permanent), river associatedGitundwe river and lake associatedMucha – Gitundwe (permanent), river andlake associatedChahafi- Kayumbu, lake associated
Nyakinama
Nyundo and Kirundo
Nyakinama, NyundoNyakabande and Busanza
Murora
CLASS 11Vital and valuable
Kabande (permanent) Nyarubuye
CLASS111Critical and valuable
- Nyagafunjo (permanent)- Kagezi( permanent)Kandibahera/Mukigera/ Kabaya(permanent)- Chanjegye(permanent and
seasonal)- Chibumba (permanent)
rwabara-Nyumba- Kanyamatekeassoc. with river Kaku
KanabaKanabaBukimbiri
KanabaMuroraBusanza/ Nyarubuye
Source: DEAP 2002
According to Ramsar Convention, a wetland is an area of marsh, fen, peatland or water whether naturalor artificial, permanent or temporary with water that is static or flowing, fresh, blackish or saltyincluding areas of marine water depth of which at low tide and does not exceed six metres deep. In theUgandan context wetlands are areas or swamps that stay wet long enough to make species survive.
Based on vegetation cover, there are different types of wetlands including fresh water emergent reedswamps dominated by single reed species; seasonally flooded herbaceous wetlands with variable
species composition; fresh water montane wetlands (bogs) dominated by sedges and grasses and fresh
water palustine forests (permanent swamps forest dominated by mitragyna spp and Syzigium spp (Wetlands Inspection Division 1999).
Table 2.1.2. Wetland types
Class Area Km 2 Proportion (%)

8/3/2019 Kisoro District The State of Environment Report
http://slidepdf.com/reader/full/kisoro-district-the-state-of-environment-report 15/75
15
Permanent wetland dominated by grasses 1.98 7.9Seasonal wetland dominated by grasses 0.76 3.0Permanent wetland dominated by papyrus/ and orother sedges
8.08 32.1
Permanent wetland modified into farmland 12.05 47.9Seasonal wetland modified into farmland 2.28 9.1
SOURCE: Kisoro district wetland inventory report
The district has a network of wetland systems namely; Lake Edward wetland system drains into LakeMutanda and Mulehe .A small part of Kigeyo – Ruhuhuma that drains into Lake Bunyonyi is also partof the wetland drainage system in the district.Murugyege, Kyajenge (Chajengi) and Karwa wetlands drains into Lake Mulehe. Ruhezamyenda(Ruhezaminda), Gitundwe, Mulindi, Ndibagera and Nyarutovu wetlands drain into Lake Mutanda.Nyakisozi and Kabande located in Nyarubuye Sub County are the only wetland-closed systems in thedistrict.
2.1.1 WETLAND USES
Wetlands are very productive ecosystems and perform various functions;Hydrological: Because of water crisis in almost every part of the district, mentioning water meanstalking about wetlands.In rural areas where the gravity flow schemes and purified water cannot be accessed, wetlands arelooked at as the main source of ‘sufficient’ and clean water. This indicates that wetlands play a vitalrole in providing water to the communities that cannot access safe water. Considering the earlierdiscussed systems, wetlands are the backbone of those drainage systems.
Picture 3– water collection from a wetland in Murora Sub County, wetlands are a great source of water
When it rains, rainwater in form of runoff ends up in the wetlands located in the valley bottoms. Their
dense and varied vegetation trap the water and store it temporarily thereby protecting the down streamareas by filtering the silt.
The sponge like nature of the wetlands stores and holds water back for future use releasing little at atime when the rains have long stopped. This therefore helps the people in rural areas to readily accesswater throughout the year especially those with no access to gravity flow schemes and piped water.

8/3/2019 Kisoro District The State of Environment Report
http://slidepdf.com/reader/full/kisoro-district-the-state-of-environment-report 16/75
16
The wetlands’ function of holding and storing water for long and making it available even in dryseasons to many people is in itself a significant contribution to the health of people in the district.
Wetlands purify and clean water by trapping silt, pollutants and sediments that would otherwisecontaminate the sources. This therefore implies that destruction of these wetlands leads to problemsrelated to drinking dirty water and spread of water borne diseases.
Kabiranyuma, a swamp that lies between Muhabura and Mgahinga volcanoes at an altitude of 10,000feet provides water through gravity. The scheme serves the sub counties of Nyarusiza, Muramba andChahi. Nyakagezi swamp between Mgahinga and Sabyinyo Mountains supplies water to thousands of people in the parish of Gisozi in Muramba Sub County. Both the above schemes are not functional atthe moment but have potential for rehabilitation.
Wetlands also distribute nutrients through import and export processes. When it rains organic matterfrom different sources of plants and animal origin is received and accumulated. When the wetlandfloods the accumulated nutrients are then transported together with water to other areas henceredistributed.Ecologically, wetlands support different varieties of species of both animals and plants therebyproviding them with a home. Many cold-blooded vertebrates and Invertebrates are commonly found inthe wetlands.In addition, wetlands act as breeding and nursery grounds for fish and other organisms hence fishyields in the wetlands and lakes highly depend on the status of wetlands for food and cover. Due todestruction of wetlands in most parts of the district, fish yields have drastically reduced.
Resources with direct economic value derived from the wetlands include fish, papyrus and other sedgesthat provide building materials, fuel and medicine. Dry papyrus for making crafts, used as fuelwoodand thatching material is sold in Kisoro on market days especially on Mondays and Thursdays. Clayfrom Kabande Wetlands has been used for pot and stoves, which are common in bi weekly markets.
If the rate of wetland destruction remains high, they will be completely destroyed and the variedservices they provide free of charge will be paid for with money.
2.1.2 WETLAND DEGRADATIONAlthough most of the intact wetlands in Kisoro are found in the protected areas of the Mgahinga gorillaNational park, Bwindi Impenetrable National park and Echuya forest reserve, others outside these areasfor instance Nyabarongo and Murongo, which are found in the Northern end of the district, are heavilydegraded.
Drainage for crop production, which is reported to have started in the 1940’s, has greatly threatenedwetlands of Gitundwe, Murugyege and Nyarutovu.Cultivation up to the lakeshores that leads to silting considerably reduces the breeding ground (nurseryground) for fish threatening fisheries in the lakes of Mutanda and Mulehe. This results into erosionrelated problems such as silting because of the destruction of the wetland vegetation that would otherwise trap the silt and sediments. Crops grown in the converted wetlands include sweet potatoes, Irishpotatoes, beans, cabbages and sorghum.
Over harvesting of the swamp products especially papyrus and clay has also contributed tremendouslyto the degradation of wetlands. For instance Muchuya swamp surrounded by Echuya forest reserve hasalways not been given priority in conservation.
8/3/2019 Kisoro District The State of Environment Report
http://slidepdf.com/reader/full/kisoro-district-the-state-of-environment-report 17/75
17
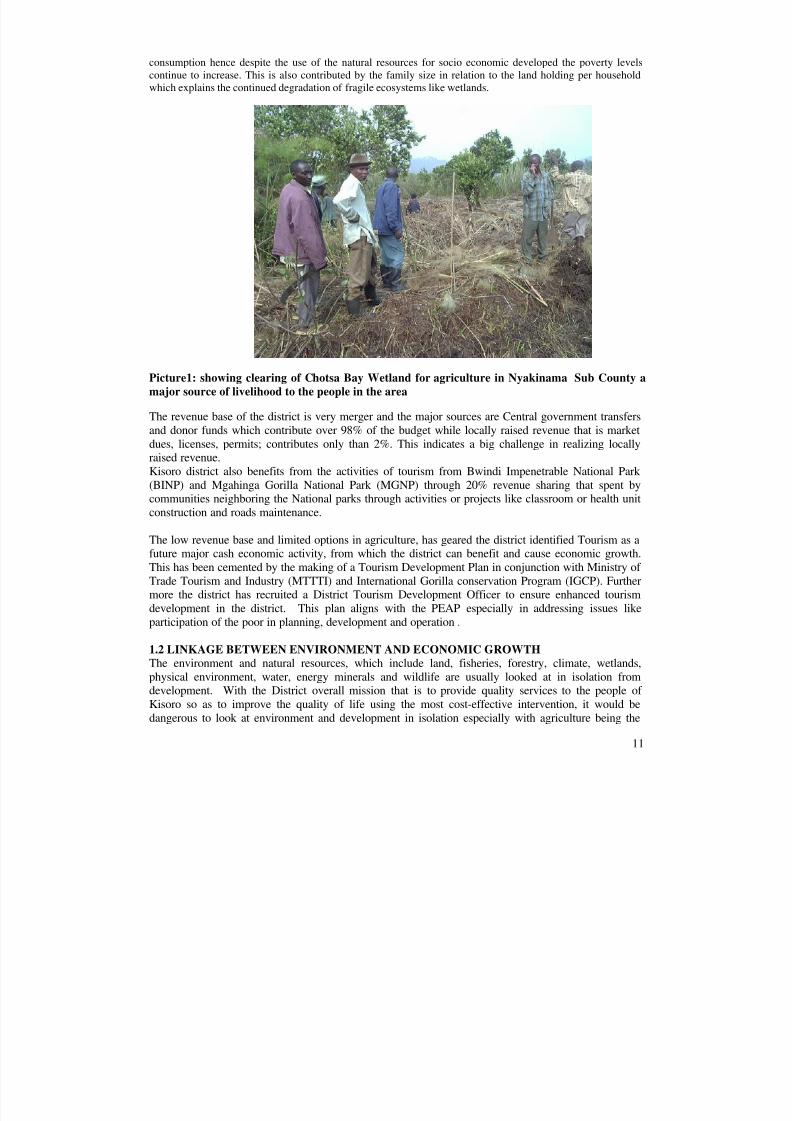
Picture – heavily converted Gitundwe wetland in Nyundo and Nyakabande sub counties
A drainage system has been created right along the valley to drain the swamp to create more land forcattle farming (Byaruhanga 2001). Also the Batwa have traditionally lived in the forest and continue toearn a living from various forms of resources extraction.
Before conversion and encroachment on the wetlands the dominant vegetation was papyrus, sedges andswamp forest. After depletion secondary vegetation mainly cyperus subscript developed and nowdominates most of the wetlands, which has also affected the wildlife habitat. However, some of theoriginal wetland vegetation can be identified in some wetlands such as Chotsa bay and scattered areasaround Lake Mutanda.Massive conversion of wetlands has intensified the scarcity of papyrus, which was in the pastcommonly used for thatching houses and making mats used as bedding. This is a concern especially forrural people who cannot afford buying mattresses, iron sheets and tiles.
Assumed ownership of most wetlands by individuals has denied free access to wetland resources andhence reduced the benefits to the majority. This has compromised efforts and made it almostimpossible to conserve such wetlands.
2.2 WATER RESOURCESWater is life hence a prerequisite for human survival. It is a basic resource that should be accessible toall human beings because it forms a vital part of social infrastructure. Kisoro District is not greatlyendowed with water resources. Long distances are walked before safe water points are accessed. Waterand sanitation in the district is planned, implemented, sustained and managed with the involvement of community beneficiaries and private sector under the coordination of the District Water Office.
2.2.1 ACCESS Water is said to be life but not 100% of the population access safe water but only 53.7% ( 46.9%Ruraland 87.6% urban)hence still a major problem in the district. The rest of the population is dependentupon unprotected sources, the result being high prevalence of water and sanitation related diseases suchas dysentery. However, the above indicates that the accessibility of clean water to the community hasgreatly improved from 43.9% in 2004 to 53.7% in 2007. (refer to table 2.2.1). Nonetheless, some Sub

8/3/2019 Kisoro District The State of Environment Report
http://slidepdf.com/reader/full/kisoro-district-the-state-of-environment-report 18/75
18
counties namely Muramba, Nyarusiza and Chahi are far below the district average water coverage,which ranges between 10% - 23.6%(Kisoro District Water department annual report for the financialyear 2006/2007).
Picture 4 – poorly managed water collection point
The District Water Office Annual report indicates that natural water sources are limited. A big part of the district especially in the sub counties of Nyakabande, Muramba; Chahi, Nyakinama and Nyarusizaare most affected.However, though areas in the North and East constituencies have the natural water sources, due to thehilly terrain people staying on hilltops do not easily access water. This therefore calls for rainwaterharvesting which is also not a permanent solution as reservoirs dry up during the dry season.

8/3/2019 Kisoro District The State of Environment Report
http://slidepdf.com/reader/full/kisoro-district-the-state-of-environment-report 19/75
19
Table 2.2.1 Safe water coverage by Sub County as at June 2007 Sub county LCs Popn 2002 % coverage Water points Pop servedNyakinama 36 15,071 43.5 84 7556Chahi 21 14,457 23.6 53 4660Nyarusiza 40 22,350 12.5 127 5905Kisoro T.C 22 11,328 87.6Muramba 47 28,189 10 131 12635Nyabwishenya 17 11,128 53.7 23 15040Busanza 36 14,525 108.9 88 8876Kirundo 29 15,647 98.6 45 8834Nyarubuye 16 15,441 29.5 60 12748Nyakabande 35 21,495 37.8 11 5093Kanaba 22 12,895 42 27 8985Bukimbiri 18 11,604 45 19 6927Nyundo 17 10,705 74.1 25 12064Murora 32 15,477 30.7 28 6241Safe water coverage 390 220,312 53.7 721 115,564Source: Kisoro District water Department 2007
2.2.2 SUPPLY AND DEMAND
Lakes and rivers The district has four lakes of Mutanda, Mulehe, Kayumbu and Chahafi. These are open fresh waterlakes covering 33.7 km 2 that is 27.4 percent of the districts total area. Lake Mutanda is joined to LakeMulehe by approximately 2km long, river Mucha at an altitude of 5900 feet above sea level. RiverRuhezamyenda flows from Lake Bunyonyi to Lake Mutanda while river Mkarara expands to LakeEdward and streams Muhanga Virunga, Rugege, Kukuja flows into Lake Mulehe. Lakes Chahafi andKayumbu are located in Murora Sub County and are close to each other at an altitude of 6200 feet
above sea level near the border with the Republic of Rwanda. Streams Mukirumbi, Nyakagezi andBukangamo flow into Lake Kayumbu and stream Nyakamba empties its waters into lake Chahafi.Murungu and Nyabarongo rivers are the main rivers supplying water in the northern part of the districtwhereby the former traverses Nyundo and Nyakinama sub counties. Nyabarongo moves along theborder of the Democratic Republic of Congo and in the sub counties of Nyabwishenya, Kirundo andBusanza in UgandaThe lands survey Entebbe estimates the area covered by the lakes as indicated below;Chahafi 1.0km2; Kayumbu 2.2 km 2; Mulehe 4.1 km 2 and Mutanda 26.4 km 2.
2.2.3 DEGRADATIONThe shortage of land in the area has led the local communities neighboring the lakes to cultivate up to
the shores of the lakes and banks of other water sources. This has resulted into siltation of the lakesleading to poor fish catches as a result of destruction of fish breeding sites.
Part of Lake Kayumbu catchment area has a hilly terrain with steep slopes which are cultivated rightup to the lake. Crops that are cultivated include bananas, sweet potatoes beans, sorghum and maize.Also cattle, goats, sheep and pigs are grazed along the lake. Human settlements are traced right near thelake.On Lake Chahafi, cultivation is done right up to the lakeshore. The catchments for the lake is relativelyflat and therefore encourages crop farming and cattle keeping which in the long run has led to the

8/3/2019 Kisoro District The State of Environment Report
http://slidepdf.com/reader/full/kisoro-district-the-state-of-environment-report 20/75
20
depletion of the lakeshore. This has led to siltation causing reduction in fish stocks due to thedestruction of fish breeding sites.Communities have responded positively through being involved in planning for management of theirresources.Lake Mulehe has registered success in conservation and development. The success has been due to theNGOs support on lakeshore management. In particular, Primewetlands/IUCN supported the community
in management, which has resulted in increased fish catches and subsequent designation of the Lake asa protected area.
Spring protectionThere are 279 protected springs of which 4 are non-functional and 57 unprotected springs in the wholedistrict. A vast number of springs are located in the Northern and eastern parts of the district.Spring protection involves intake construction, outlets, pipe installation and fencing. It also involvessanitation promotion. Water user committees are involved in the source identification, planning,implementation and Operation and maintenance.
Rain water harvestingRainwater harvesting is being encouraged in areas with out other water sources especially incommunities having limited water sources. With support from the central government under PAFprogramme, the district has so far constructed 73 communal tanks (69 functional and 4 non functional)and installed 37, 10m 3 tanks in primary schools.
Generally communal rainwater tanks are limited in the district. The District Water Department hascontinued to construct the communal tanks and in the financial year 2006/2007 the sub counties of Nyakabande, Kanaba, Nyundo, Bukimbiri, Nyakinama, and Muramba benefited seven communalrainwater tanks each of 30m 3. Other stakeholders that have rendered a hand in the construction of rainwater harvesting tanks and jars include Diocese of Muhabura under Compassion International,Africare and BMCT
Gravity Flow SchemesThe district has six operational gravity flow schemes and surveys and designs continue to be done onthe gravity flow schemes to extend to other places. This has been done on the schemes of Kabiranyumaand Gitebe in the sub counties of Murora, Kanaba and Nyarusiza. Gravity flow schemes constructioninvolves digging of trenches; pipe laying; storage sedimentation and break presume tank construction;tap stand installation and sanitation promotion.
Picture 5- Mwihe B gravity flow scheme in Nyakinama sub county
8/3/2019 Kisoro District The State of Environment Report
http://slidepdf.com/reader/full/kisoro-district-the-state-of-environment-report 21/75
21
Pumped water The district has only 2 pumped water schemes sourced from Chuho and supplies almost all parts of Kisoro Town Council, Nyakabande, and Institutions like Mutolere hospital, St Gertrude SeniorSecondary School and Mutolere Secondary School.The southern part of Kisoro district is characterized by lack of exploitable surface water and has a very
deep ground water table.The district is to access a grant from the Austrian Government to extend Chuho piped water areasneighbouring Kisoro Town Council one of them being Gisorora Parish since the first phase of theextension of the water to parishes surrounding Kisoro Town Council including Karambi, Mabungo,Rwingwe and Gasiza was finalized.
BoreholesThe district has 13 Boreholes out of which only two are functional. The functional ones are in the Subcounties of Nyakinama and Murora. Most Boreholes have broken down because of operation andmaintenance problems.
2.2.4: WATERSHED MANAGEMENTWater sources are gradually becoming extinct hence the need to protect the water catchment areas. InKisoro district most fragile ecosystems are the water catchment areas hence need for a holisticapproach in the management of the Environment.
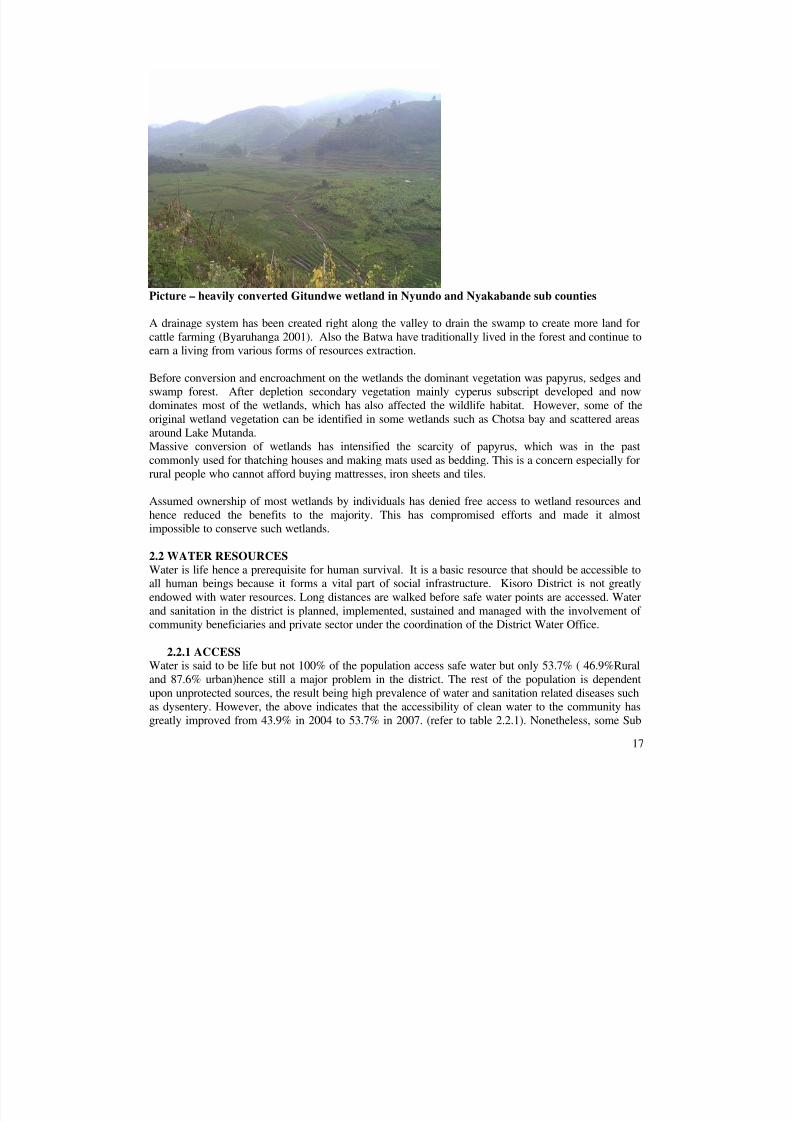
Picture showing River Nyamunyuka that drains in Lake Mulehe via Rugyegye Wetland

8/3/2019 Kisoro District The State of Environment Report
http://slidepdf.com/reader/full/kisoro-district-the-state-of-environment-report 22/75
22
2.3 BIODIVERSITYBiodiversity is a term that describes the enormous variety of species living on our planet and thevariation between the individuals within each species. It also includes the variety of habitats andecosystems in which these species live including humans.A focus on biodiversity recognizes the interrelation of all parts of the biological world and the impactthat people have on living systems.
According to Kisoro DEAP (2002), most of the vegetation cover was probably dominated by theforests in the past. However, these have been cleared as a result of the high population pressure.Remnants of these are found only in the protected areas of Bwindi Impenetrable National Park (BINP),Mgahinga Gorilla National park (MGNP) and Echuya forest reserve.The district has three characteristic vegetation zones;High altitude forest (moist montane): This is where we find the volcanic soils of Mgahinga: GorillaNational Park. The forest is not pure stand but rather interspersed with Bamboo ( Arundinaria alpina )shoots of which form 60 percent of the food for the gorillas.The bamboo zone of Echuya forest reserve is found at exceptionally low altitudes where it represents acolonizing community.Forest / Savanna Mosaic: This is found at altitudes of 2100-3000m above sea level. These aremainly remnants of previous moist montane forest with gradual links to savanna and woody shrubpatches at lower levels towards the central plains. This vegetation has suffered a lot of encroachmentas a result of human activities. Grass species abundant in this Mosaic are pennisetum purpereum ,
Hyperhenia sp and Themeda triandra.Swamp forest and wetlands : Swamp forests are of two types namely the permanent swamp forestwhere water does not dry up even in the dry seasons and the seasonal swamps that dry up at certaintimes. Forrest swamps are dominant in the Nyakinama, Nyabwishenya, and Murora, Kirundo, Busanzaand Nyakabande sub counties.
Kisoro district has is in the Albertine rift Valley and with a diversity of habitats is among thebiodiversity hotspots with the endangered Mountain Gorilla endemic to the region as the flagshipspecies. Both Bwindi Impenetrable and Mgahinga National Park are habitats of the endangeredMountain Gorilla.Bwindi National parkThe National Park has 90 mammal species, including 11 primates, of which the black and whitecolobus, with its lovely flowing white tail, is prominent. The forest birding ranks with the best inUganda, with 23 highly localized Albertine Rift endemics present(UWA 2003). Bwindi National park is home to roughly half of the world’s mountain Under UWA’s strategic program on monitoring, thewildlife census particularly the mountain gorilla that was conducted in Bwindi by UWA and otherpartners from April to June 2006 showed that the gorilla population had increased to 340 from 320 in2002 representing a 6% increase. Overall the gorilla population has been increasing at an approximateannual growth rate(UWA 2006). The table below shows the results from three censuses that werecarried out in 1997, 2002 and 2006.
Table 2.3; Gorilla population, size and structure across censuses inParameter 1997 2002 2006Total population estimate 300 320 340Number of groups 28 27 30Number of solitary males 7 10 11Number of habituated groups 3 5 5Individuals in habituated groups 52 72 76

8/3/2019 Kisoro District The State of Environment Report
http://slidepdf.com/reader/full/kisoro-district-the-state-of-environment-report 23/75
23
Proportion of population habituated 17.30% 22.50% 22.40%UWA Annual report 2005-2006With the increase in habituated groups as shown above, there is high tourism hence increased benefitsto the local surrounding communities.
Mgahinga Gorilla National Park
The small national parks with a size of 38.6km2
protects the Ugandan portion of the Virungas, a chainof 6 extinct and three sporadically active volcanoes which follows the borders with Rwanda andDemocratic Republic of Congo. It provides sanctuary to the rare mountain gorilla, some 300 of whichlive in the virungas, and gorilla tracking remains the most popular activity though it is dependent onseasonal movement of habituated groups. Mgahinga supports a diverse forest and moorland fauna,notably the localized golden monkey ( cercophithecus mitis kanditi ) and at least 12 bird speciesendemic to the albertine rift, but also small populations of elephants( loxodonta africana ), leopard,buffalo ( Syncerus cafter )and black and white colobus monkey.There fore, the larger mammals in the national parks among others include, mountain gorillas ( Gorillaberingei ) buffalo ( Syncerus cafter )and elephant ( loxodonta africana ). There is also the rare goldenmonkey ( cercophithecus mitis kanditi ) known only to exist in the Virunga and the other forests in
central Africa. Hence these species are listed in the IUCN Red list of the threatened animals andtherefore of high conservation importance.
.
The endangered mountain gorilla
Bwindi has been placed on the world’s heritage list due to the presence of the endangered mountain
gorilla and it’s rich afro montane vegetation.Both MGNP and BINP harbor afro montane forests covering the smallest areas as vegetation type onthe continent (UWA 2001).
Of the 65 forests investigated for biodiversity, Echuya forest reserve ranks eighth in overall importance(IBA, 2001). It supports ten species, which do not occur anywhere else in Uganda. Of these five aretrees, four butterflies and one bird specie.

8/3/2019 Kisoro District The State of Environment Report
http://slidepdf.com/reader/full/kisoro-district-the-state-of-environment-report 24/75
24
2.3.1 BIODIVERSITY LOSSThe district is characterized by one of the highest population densities in the country, over 300 personsper km 2 in some areas. The high population combined with customary inheritance of land has led tosub divisions of the land holdings to sizes that hardly support families (UWA 2001). As such, theNational parks and other protected areas like Echuya forest reserve are considered as the sole source of livelihood for the surrounding communities.
The major problem facing conservation of the parks is the increasing rate of habitat loss ormodification due to human population growth, IBAS (2001). The open woodland, which was, once afavored gorilla habitat, was completely settled and cultivated prior to the gazettement, although it isnow regenerating.
Some illegal activities including poaching especially with wire snares, bamboo shoot collectionespecially young shoots for making baskets, Bamboo poles for building, bee keeping and honeyhunting, livestock grazing (cattle, goats and sheep), firewood and water collection and encroachmentfor agricultural.
The problem of widening of gullies is a threat especially in Mgahinga National Park, which restricts themovement of animals in one area causing biodiversity degradation due to over grazing.
There is also degradation forest biodiversity through uncontrolled fires, which has increasingly becomean annual occurrence. Long periods of droughts have led to susceptibility of these fragile ecosystemsto fire making it a threat to conservation of resources. This is progressively becoming a prime factor inshaping the vegetation composition.
Because the district is located in the Albertine ecological zone which is recognized as an importantEco-region, the global community, as oriented, has come up to support its conservation.
2.3.2 INTRODUCTION OF EXOTIC SPECIESAgricultural activities have been largely responsible for most exotic species found in the protectedareas. This is because human settlement used to occupy larger parts of the parks before theirgazettement in 1991.
Timber extraction and gold mining has contributed towards introduction of exotic species. Pit sawyersand gold miners would camp in the forests and thereby introduce exotic species. However, forestrydepartment planted other species for instance; black wattle, eucalyptus and pinus patula when the parkswere still forest reserves.
A study carried out in Mgahinga Gorilla National park in 1999 for Instance revealed that 0.6 percent of the park’s area is covered by exotic woodlots of black wattle ( Acacia mearnsii ) eucalyptus, cupressusand pinus. Furthermore the extent of black wattle and eucalyptus species seems to be increasing.
Low establishment of indigenous tree species where exotic ones occur due to negative effects of exotics on the soil nutrient levels resulting into fewer nutrients for the indigenous species is a concern.
Predation of the fish continues to affect water biodiversity in all the four lakes of Chahafi, Mutanda,Kayumbu and Mulehe, which have been invaded by the large numbers of otters. These feed on thestocked fish and those caught in the nets. However, under the Wild Life Act, an otter is a protectedanimal.

8/3/2019 Kisoro District The State of Environment Report
http://slidepdf.com/reader/full/kisoro-district-the-state-of-environment-report 25/75
25

8/3/2019 Kisoro District The State of Environment Report
http://slidepdf.com/reader/full/kisoro-district-the-state-of-environment-report 26/75
26
2.4 FORESTSKisoro is a district that is greatly endowed with forest resources, which offer a wide range of habitatsfor plants and animals. They are majorly tropical natural forests that occur at an altitude of 1300m a.s.l.with vegetation communities, which include moist montane, moist dry montane and bamboo.There are three major forests in the district; Bwindi Impenetrable National Park (BINP), MgahingaGorilla National Park (MGNP) and Echuya Central Forest Reserve.
BINP is located between latitude 0 053 to 1 08 south and longitude 29 035 to 29 050. It covers an area of 321 km 2 in the edge of the western rift valley and the three districts of Kisoro, Kabale and Kanungushare it. The southern part that lies in Kisoro covers an area of 33.67km 2 in the three parishes of Nteko,Rubuguri, and Remera.
MGNP is situated 10km south of Kisoro town and is shared by the three countries of the Republic of Rwanda, Democratic Republic of Congo and Uganda. The part that lies in Uganda covers an area of 33.7km 2 as compared to 240km 2 in Rwanda and 160km 2 in Congo. The park has three volcanoes of MtMuhabura (4,127m), Mt Mgahinga (3,474m) from which the park derives its name and Mt. Sabyinyo(3,645m). It lies in the sub counties of Nyarusiza and Muramba in the adjacent parishes of Gisozi,Rukongi and Gitenderi.
Echuya Central Forest Reserve is shared by the districts of Kabale and Kisoro in Uganda and theRepublic of Rwanda to the south. It covers an area of 35km 2 within the Albertine rift. Adjacent to it arethe sub counties of Murora and Kanaba in Kisoro. The forest contains about 127 tree species and is acenter of endemism that contains a number of species confined to the area. It is mainly dominated bymoist montane forest and bamboo while herbaceous plants cover the area where bamboo and woodyforest are less dense. It has been observed that herbaceous plants through succession process are slowlyreplacing bamboo. Muchuya swamp is found in the middle of the forest and comprises of mainlysedges.
2.4.1 FOREST USESForests because of their rich biodiversity usually have multiple uses to the communities that surroundthem. This is also for the forests in Kisoro. The district benefits from revenue that is collected frombamboo sales, and baskets made from bamboo collected from MGNP and Echuya Central ForestReserve that are sold in the bi-weekly market in Kisoro town.Forests support the livelihood of the indigenous Batwa as well as other local communities for firewood,bamboo for construction purposes, timber poles, water, medicinal plants and honey. The communitytourism potential of the three forests is increasingly being exploited. For MGNP and BINP game meatis one of the major resources that is illegally accessed.

8/3/2019 Kisoro District The State of Environment Report
http://slidepdf.com/reader/full/kisoro-district-the-state-of-environment-report 27/75
27
Picture 7- Bamboo a major resource from Echuya and Mgahinga
BINP is also a major water catchment area and source of many rivers that drain into Lake Edward andLake Mutanda. This is critical for hydrological balance as is for Mgahinga Gorilla National Park,which plays a similar role due to its protective cover. There is a crater lake at the top of Mt. Muhabura,which together with Mgahinga, Nyakagezi and Kabiranyuma swamps are major sources of the south
flowing water.
2.4.2 FOREST DEGRADATION.Population increase in the Kigezi region has greatly transformed the landscape over the years since theearly 1940s. The population of former Kigezi including Kabale, Rukungiri and Kisoro districtsincreased by 90 percent between 1948 and 1980, and by 1980 the region was cited as one of the mostcrowded areas in Africa (Butynski, 1984). The 1991 and 2002 population and housing census indicateddensities at 301 and 353.9 persons per km 2 in Kisoro. The density is higher for some areas adjacent tothe MGNP, for example 639 people per km 2 and 330 people per km 2 in Gisozi and Rukongi parishesrespectivelyThe high population and a land ownership system that promotes fragmentation of land, poor harvesting
methods, use of wasteful cooking methods that increase fuel energy demands, the need for moreagricultural land and pit sawing are the major pressures on the forest resources.The population surrounding the park has increased as seen by the population densities of sub countiesclose to the forests and as the pressures on forest resources continue to grow this may lead to possibleincrease in conflict with forest managers
Table 2.4.1. Showing population growth at the park in areas surrounding the parksBINP Population 2002 Population Growth in 1991Nyabwishenya 11,128 8,293Kirundo 15,647 14,039MGNPMuramba 28,189 24,182Nyarusiza 22,350 18,581Echuya forestKanaba 12,895 11,524Murora 15,477 14,111
Source: UBOS 2002/ District Population officeElsewhere in rural Uganda, fuel wood is the major source of energy for cooking. (Cunningham 1992).This is true for areas around Mgahinga and Echuya Central Forest Reserve, with consumption in thearea estimated at 140,000m 3 per year (Kanongo 1990). In areas surrounding Mgahinga National Park

8/3/2019 Kisoro District The State of Environment Report
http://slidepdf.com/reader/full/kisoro-district-the-state-of-environment-report 28/75
28
on farm fuel wood is not a common phenomena thereby creating a need in the community to accessfuel wood from the forest.For Echuya Central Forest Reserve, a small island surrounded by a large population, management wasunder the Forest Department that used an approach that did not involve communities. This led to rapiddegradation through illegal harvesting of forest products. On the Kisoro side almost all the area isregeneration exotics, with minimal bamboo. This was due to the increasing need for bamboo products
and conflict arising from lack of community awareness and involvement in management of the forest.Human -wildlife conflicts are another pertinent issue for those communities surrounding the park. It iscommon occurrence for wildlife like buffalos, elephants and gorillas that do not know the park boundaries to leave the parks in search for food thereby destroying crops therefore, increasing the foodinsecurity problem in the communities. These are referred to as problem animals and communitiestherefore can do nothing to protect their produce since the law does not allow them to harm theseanimals. It is different for the baboons, bush pigs that are referred to as vermin and are theresponsibility of the local government and therefore community can kill them in defense of theirproperty.
Although the above is true, Central Government through creating a policy on environment has gazettedthese areas that are being managed by UWA and NFA.Several initiatives to ensure conservation have been made like under the wildlife policy and subpolicies that promote community participation in management, for example the Community protectedAreas Institution policy and Community Conservation policy and Revenue Sharing policy, are in place.As a response to the heavy pressure on the massive degradation of MGNP over 2400 people wereevicted from the park area in 2002.
Other responses have been in the area of improving community park relations by reducing conflictthrough construction of a buffalo wall and purchase of land in MGNP and BINP to act as buffer zones.Also the NFA that manages Echuya forest has a management plan that spells out the role of communities in managing and accessing the forest and its resources in a sustainable manner.Furthermore the coming into force of the National Forestry and Tree Planting Act (2003) createsopportunity for the district to increase private, on farm and public woodlots while the new forestrypolicies puts in place District Forestry Services charged with managing all local forest reserves that hadbeen greatly mismanaged due to over and uncontrolled harvesting and conversion of forests toagricultural land. Kisoro does not have any local forest reserves but has a potential to turn public landinto forested area as shown in the table below.
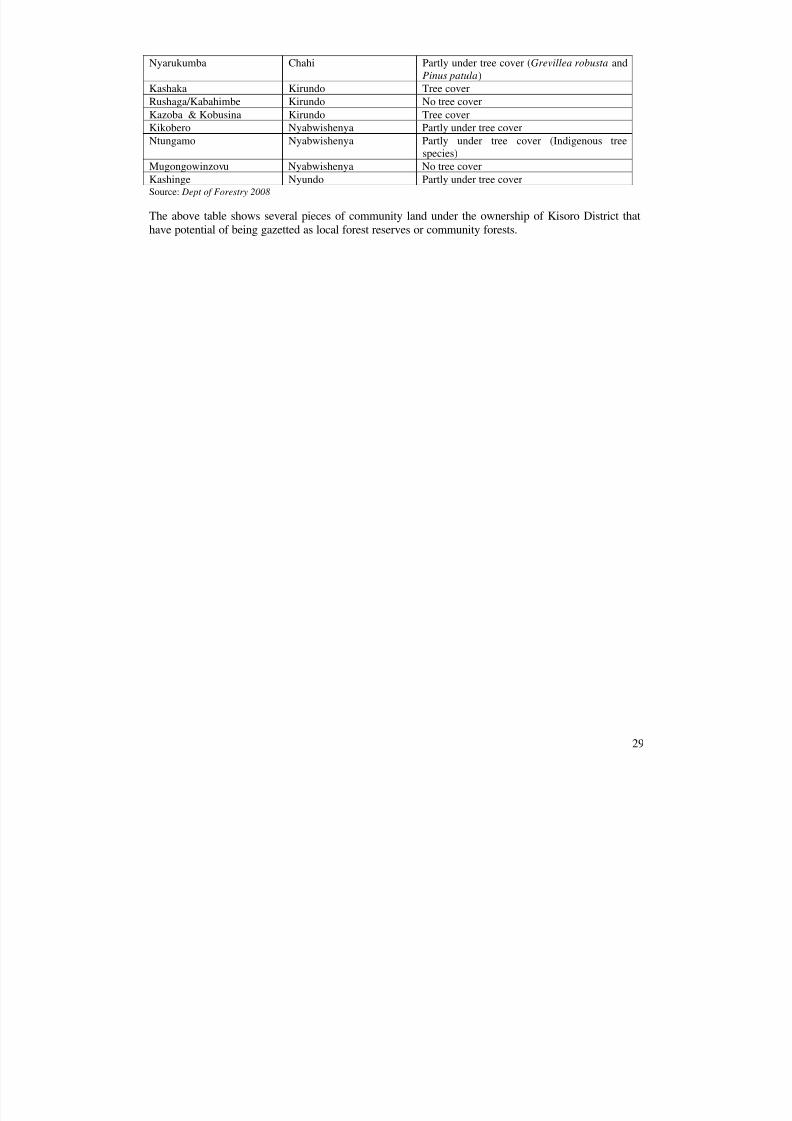
Table 2.4.2: State of public landsForest Location State
Rwankima Busanza Tree cover (Eucalyptus spp)Mugumira Busanza Tree cover (Eucalyptus spp)Jinya Muramba No tree coverRugina Nyarusiza No tree coverRwabara Nyakinama No tree coverNkanka - Kibaya Nyarubuye/ Muramba Partly under tree cover (Eucalyptus spp.)Rwivovo Nyakabande No tree coverKafuga Kirundo Partly under tree cover (Indigenous species
and Pinus patula )Kinjiina Nyabwishenya Tree cover
8/3/2019 Kisoro District The State of Environment Report
http://slidepdf.com/reader/full/kisoro-district-the-state-of-environment-report 29/75
29
Nyarukumba Chahi Partly under tree cover ( Grevillea robusta andPinus patula )
Kashaka Kirundo Tree coverRushaga/Kabahimbe Kirundo No tree coverKazoba & Kobusina Kirundo Tree coverKikobero Nyabwishenya Partly under tree coverNtungamo Nyabwishenya Partly under tree cover (Indigenous tree
species)Mugongowinzovu Nyabwishenya No tree coverKashinge Nyundo Partly under tree coverSource: Dept of Forestry 2008
The above table shows several pieces of community land under the ownership of Kisoro District thathave potential of being gazetted as local forest reserves or community forests.

8/3/2019 Kisoro District The State of Environment Report
http://slidepdf.com/reader/full/kisoro-district-the-state-of-environment-report 30/75
Table 2.4.3: Forest Reserves in Kisoro District Name of Community ForestReserve
Approx.area (Ha) Subcounty Parish Remarks
Mugumira Forest Reserve
2 Busanza Gitovu
Public land under District Lplantation, boundaries not clear,
Rwankima Forest Reserve
4.5 Busanza Gitovu
Public land under District Lplantation, boundaries not clear,
Kurichoka Forest Reserve8 Busanza Gitovu
Public land under District Lplantation, boundaries not clear,
Nyumba Forest Reserve
6 Busanza Buhumbu
Public land under District LandEucalyptus plantation but all dclear, requires surveying and rep
Nyabwishenya Farm ForestReserve
6
Nyabwishenya Nteko
Partly under Eucalyptus and Tropical Forest with high ecPrimates and adjacent to Bwind
Park), land formerly used as Crcentre by Min istry of Agric ultthe District Land Board. Land w
Kafuga Forest Reserve
300Kirundo Rubuguri
Public land stretching on morenatural Tropical Forest that is pais used as grazing land. Some fethe Sub -county in one valleyrequired. The bare hills can be pl
Source: Kisoro District Dept of Forestry 2008

8/3/2019 Kisoro District The State of Environment Report
http://slidepdf.com/reader/full/kisoro-district-the-state-of-environment-report 31/75
2.4.3 REVEGETATION OF DEGRADED AREASSeveral organizations and government agencies in collaboration with Kisoro District LocalGovernment have undertaken to promote agro forestry, on farm bamboo growing and woodlots toaugment the loss of trees that were cleared as a result of high demand for agriculture, fuel wood,building materials and charcoal. These organizations include; Africa 2000 Network, African WildlifeFoundation, The Gorilla Organisation and Nature Uganda.
The Ministry of Water and Environment through the District Forestry Department is implementing theFarm Income Enhancement and Forest Conservation (FIEFOC) project in three sub-counties of Kanaba, Kirundo and Nyakinama. One of the major activities for the project is to support communitiesto plant at least 1,000 hectares of trees in selected critically degraded watersheds of Kanaba, Kirundoand Nyakinama sub-counties. The project has established three sub-county nurseries and threecommunity nurseries to produce the required planting materials for the communities to establishplantations and woodlots
2.5 ATMOSPHEREThe atmosphere protect life on Earth from the sun’s fierce rays and the frozen emptiness of space.Atmosphere can be defined as the mixture of gasses surrounding the earth surface. Atmosphericconditions are critical to livelihoods of Kisoro people who largely depend on agriculture. Atmosphericconditions like the weather and climate determine the viability of agriculture and human health, whichgreatly affect their activities. Today there is increased climatic conditions a term known as globalwarming. Issues of concern include change in climate and climate variability.
2.5.1 RAINFALLRain fall determines the planting periods, therefore with two rainy seasons in Kisoro district, there aretwo planting seasons.Table below shows the Monthly rainfall totals for the period 2000-2007
Table 2.5.1. Kabale station -Monthly rainfall Totals in Millimeters from 2000 to May 2007 Month 2000 2001 2002 2003 2004 2005 2006 2007 MeanJanuary 50.9 86.3 120.2 66.9 69.4 25.7 85.5 55.2 64February 83.5 51.2 89.7 80.6 93.8 121.8 133.5 102.5 78March 118.9 83.9 63.1 74.7 84.5 170.1 127.7 80.3 113April 120 135.7 74.9 139.1 183.2 123.2 112.7 103.6 145May 55.7 77.8 115.7 - 84.6 121.1 207.8 87.9 97June 8.1 22.4 0 29 0 40.5 2.9 30July 5.9 46.7 4.4 22.8 1.1 0 30.1 18August 69.6 65.7 48.4 25.5 31.9 29 79.5 56Sept 69.9 231.1 49.5 82.6 148.8 84 74.2 97October 179.8 201.9 187.6 86.5 76.9 107.6 70.7 108November 146.8 139.5 91.5 94 114.2 66.1 158.2 115December 83.8 63.9 91 57.3 124.9 41 61.9 91TOTAL 992.9 1,206.1 936 759 1,013.3 930.1 1,144.7 429.5
SOURCE : meteorological centre
The above table shows rainfall distribution in Kisoro for the last 7 years that is the period from 2000 to2007. Analyzing the data shows that two rainy seasons are experienced between January and May firstrainy season and second rainy season between August and December.Total rainfall of between 350 mm and 650mm was registered during the first rains of January to Junefor the six years while second rains that occur in August to October recorded between 330mm and

8/3/2019 Kisoro District The State of Environment Report
http://slidepdf.com/reader/full/kisoro-district-the-state-of-environment-report 32/75
32
500mm for the years 2003 to 2006. The data shows that the district has experienced extremeweather conditions usually termed La Nina and El nino phenomena The impact of this being cropfailure and fluctuations in levels of surface and ground water
2.5.2 TEMPERATURE AND RELATIVE HUMIDITYKisoro district is at high altitude, hence having relatively low temperatures.
Table 2.5.2. MEAN MONTHLY TEMPERATURES (MAXIMUM AND MINIMUM) IN º C DEGREESCETIGRADE
MONTHSJan Feb Mar Apr May Jun Jul Aug Sep Oct
Year
Max Min Max Min Max Min Max Min Max Min Max Min Max Min max Min max Min Max Min
2000 24.6 10.6 24.7 10.1 23.8 11.1 23.9 11.9 24.1 11.8 23.6 9.9 24.9 9.3 25.0 10.9 25.4 11.6 24.3 11.9
2001 23.3 11.3 24.5 11.0 26.5 11.4 23.9 12.8 23.0 12.8 23.1 10.2 23.8 10.4 23.9 10.9 23.9 11.4 23.5 12.7
2002 23.9 12.8 24.5 11.0 24.4 11.7 23.5 12.4 23.6 13.2 25.0 9.9 25.9 9.6 25.3 11.2 25.4 11.1 23.9 11.7
2003 25.3 11.3 25.3 11.0 25.5 11.6 24.1 12.6 23.3 13.3 23.8 9.6 23.8 9.6 25.3 11.1 24.8 11.3 24.2 12.6
2004 24.5 12.2 25.3 12.1 25.0 13.1 22.8 12.5 23.9 12.0 23.8 9.1 25.6 8.6 25.4 11.8 24.5 11.4 23.1 12.0
2005 25.1 11.9 26.0 12.0 24.7 12.7 24.7 12.8 23.4 12.7 23.8 11.4 24.5 9.1 24.7 12.0 24.9 12.2 24.9 12.2
2006 24.7 11.0 25.3 12.4 23.9 11.5 23.6 12.6 23.4 13.3 23.8 24.1 11.4 24.4 11.5 24.9 11.3 24.8 12.5
2007 24.3 12.9 24.7 12.8 24.7 11.5 24.3 12.6 23.3 13.0 23.1 12.2
Mean 24.5 11.7 25.0 11.6 24.8 12.0 23.8 12.6 23. 12.8 23.7 10.3 24.7 9.7 24.9 11.3 24.8 11.5 24.1 12.2
The mean maximum temperature of 23 0C – 25 oC in the dry season and mean minimum temperature9.7-12.6 oC and relative humidity between 80% and 90% that falls to about 40% in the dry season.
2.5.3 CLIMATE CHANGE.It refers to long-term change of one or more elements of climate (temperature and rainfall).Climate variability is as a result of change in patterns of climate that either cause high temperatures,low temperature, high rainfall, and low rainfall causing a change in seasons (NSOER 2001).
The major pressures on changes in temperature are due to human activities like deforestation andwetland degradation leading to increased humidity levels. This has caused change in the seasons thuscausing uncertainties in our communities in estimating production and hence food insecurity
Although the above is true, gazzetting of Bwindi and Mgahinga national parks and Echuya forestreserve has reduced encroachment therefore play a role in stabilizing the microclimate of the district.This is because BINP and MGNP get relatively high rainfall over 2000metres with temperatures that goto 7 0C.
Furthermore strong winds that experienced especially during the dry season due to the lack of windbreaks.The district still lacks a full-fledged centre for monitoring changes in climate. It still relies on datacollected from Kabale. This in itself is a challenge that needs to be addressed if changes in the climateare to be monitored closely for purposes of understanding the trends of climate in our district.

8/3/2019 Kisoro District The State of Environment Report
http://slidepdf.com/reader/full/kisoro-district-the-state-of-environment-report 33/75
33
8/3/2019 Kisoro District The State of Environment Report
http://slidepdf.com/reader/full/kisoro-district-the-state-of-environment-report 34/75
34
2.6 ENVIRONMENTAL DISASTERSEnvironmental disasters and epidemics are said to affect the poverty level and household incomes in anegative manner.An environmental disaster is a sudden occurrence or major misfortune that disrupts the basic fabric andnormal functioning of society.It is described as a series of events which give rise to causalities, damage or loss of property,infrastructure, essential services or loss of means of livelihood on a scale beyond the normal capacityof community to cope unaided (NSOER 2002).Epidemics like HIV/AIDS are said to have a similar impact as disasters..
2.6.1 DROUGHTS/ FAMINE/ HAILSTORMS/LAND SLIDES/ FLOODSThese are as a result of changes in the weather patterns. Weather is defined as condition of theatmosphere at a certain place and time with reference to temperature, rainfall and sunshine. Changes inthe weather patterns in Kisoro are mainly due to human activities like deforestation and conversion of wetlands into agricultural land.This has led to a decrease in agricultural productivity leading to food insecurity and famine in manyhouseholds.This trend has been going on for a couple of years. Disaster preparedness reports by the district indicateover 300tonnes of relief food were distributed between 1991 to 2002 to communities.Most affected is Murora Sub County, which is usually affected by floods due to heavy wetland and lakeshore degradation.(DEAP 2002)In some areas like Kanaba, Nyundo, Nyabwishenya and Bukimbiri landslides are a commonoccurrence in the rainy season as very steep hillsides have been cultivated.Hailstorms are a common occurrence in the sub counties of Nyarusiza, Nyakinama, Muramba,Nyakabande and Busanza.
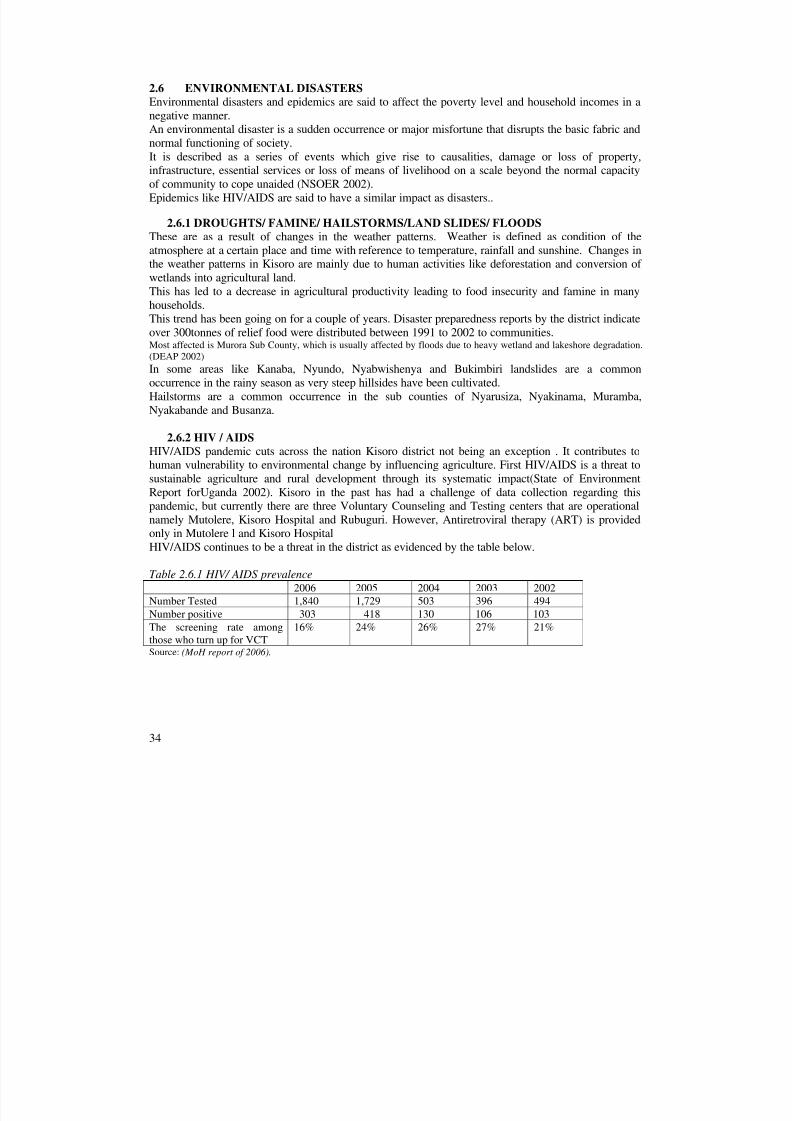
2.6.2 HIV / AIDS
HIV/AIDS pandemic cuts across the nation Kisoro district not being an exception . It contributes tohuman vulnerability to environmental change by influencing agriculture. First HIV/AIDS is a threat tosustainable agriculture and rural development through its systematic impact(State of EnvironmentReport forUganda 2002). Kisoro in the past has had a challenge of data collection regarding thispandemic, but currently there are three Voluntary Counseling and Testing centers that are operationalnamely Mutolere, Kisoro Hospital and Rubuguri. However, Antiretroviral therapy (ART) is providedonly in Mutolere l and Kisoro Hospital HIV/AIDS continues to be a threat in the district as evidenced by the table below.
Table 2.6.1 HIV/ AIDS prevalence2006 2005 2004 2003 2002
Number Tested 1,840 1,729 503 396 494Number positive 303 418 130 106 103The screening rate amongthose who turn up for VCT
16% 24% 26% 27% 21%
Source: (MoH report of 2006).
8/3/2019 Kisoro District The State of Environment Report
http://slidepdf.com/reader/full/kisoro-district-the-state-of-environment-report 35/75
35
2.7 STATE OF URBANIZATIONKisoro Town Council is the only outstanding urban area in Kisoro District and has an area of 10.02km 2. The urban center lies on the foothills of Muhabura volcanic mountains.To be categorized as an urban area is because of the following characteristics similar to other urbanareas. These are;-
o High density of population living in a relatively small area of land.o High concentration of buildings ranging from commercial to residential which are low density
and high density houses.o Administrative functions not found in the villages/trading centre. Town council houses the
Administrative Headquarters of Kisoro district.o Low residential population.o Multi-storey developments.o Concentration of departmental stores, variety goods and retail outletso Vertical zoning
PHYSICAL PLANNNIG;The Town council has a physical planning section responsible for fostering the adherence of the townplanning in the town council. It also deals with provision of technical advice on land acquisition andland disputes resolutions.The Town council is divided into two zones, that is zone A and zone B both enshrined in 22 villages of the two wards each that is Northward (11 cells) and Southward (11cells).
Zone A of the town council comprises demarcated/surveyed plots while those in zone B are notproperly demarcated although some are surveyed by individual land owners.Some cells namely Kisoro Hill part of Bigina, Kamonyi, Kabaya and Gatovu have got a lay out plandrawn to scale 1:2500,drawn in 2001 by the commissioner Physical Planning. Ministry of Lands, Waterand Environment.Kisoro Town Council is in the process of drawing detailed plans (layouts) for the remaining cellsthough funds are still lacking. Recently, town council was supported by Ministry of Local Governmentin assisting to have the plans for all the cells.ACTIVITIES CARRIED OUT IN THE SECTION INCLUDE THE FOLLOWING;
- Protection of illegal structures in town,- Protection of existing public ways,- Fostering surveys of town plots- Sensitization of the community as regards planning,- Provision of technical advice on land acquisition rules- Compensation of crops affected by piped water and road networks- Drawing up of layouts for council.On going programs;- Promoting accessibility of the town by assisting the town planner in sorting out land wrangles- Detection of illegal structures in town council- Handle rents collectionsChallenges in Physical planning section;-There is a big number of town dwellers that usually put up illegal structures.Strategies;-Train and indict land agencies on town plans for the improved performance

8/3/2019 Kisoro District The State of Environment Report
http://slidepdf.com/reader/full/kisoro-district-the-state-of-environment-report 36/75
36
Conduct seminars and other educative arrangements to residentsIntegrate technical wing to political wing for better implementation of National and local policies.
According to the Kisoro District Report, 2002 Uganda Population and Housing Census, Kisoro TownCouncil has an estimated total population of 11,328, (5,474 males and 5,854 females). The councilconsists of 22 villages in two wards, that is, North and South wards. The town council has 2,575.
Apart from Kisoro town Council there are other 20 rural growth centers Commonly referred to astrading centers that have never been surveyed to allow planned development.
Table 2.7.1. Kisoro town Council populationSex North ward South ward TotalMale 3,095 2,379 5,474Female 3,284 2,570 5,854Total 6,379 4,949 11,328Source: Kisoro District Report, 2002 Uganda Population and Housing Census .
2.7.1 EMERGENCE AND GROWTH OF URBAN AREASIn the past, Kisoro Town Council was known as the headquarters’ of Bufumbira County, Kisoro Subdistrict and present day Kisoro district.These changes have seen Kisoro grow from a village, to town board and then town council status(Kisoro Town Council – 3 Years Development Plan 2003-2006).The establishment of an administrative unit by the British protectorate influenced the extension of theroad from Kabale (80km) through Kisoro to Rwanda and the Democratic Republic of Congo.This led to the establishment of the Market that attracted business from the DRC, Rwanda and the localcommunities.HOUSING TYPES AND QUALITYKisoro town council is mainly in the lowlands. This has influenced the housing types and quality sinceit is accessible by the road network.
The status of dwelling units are; permanent, semi-permanent and temporary while the types of housingunits are detached, semi-detached/flat, tenement (muzigo) and others( Kisoro District Report, 2002 UgandaPopulation and Housing Census). Permanent structures are mainly located in the Central Business District (CBD) in Kisoro town council
2.7.2 POVERTYThe urban areas in Kisoro town council in particular experience poor access to quality social servicesand infrastructure that are easily noticeable in the communities.Poverty in the town council can be described at three levels of Individual, household and communityIndividual level poverty is defined as lack of basic needs and other material and non material thingsincluding lack of enough food, illiterate, helpless, constantly in ill health and dresses in tattered clothes.At house hold level a poor house hold is the one characterized by lack of enough land for growing
food, dilapidated house unit for human shelter, lacks the basic house hold necessities for instanceblankets and does not own livestock.Community poverty was described and characterized by lack of adequate food, social services, lack of cooperation, employment opportunities, access roads and many dependants in one family. Thereforewith the average household size of 4.3 in Kisoro Town council it is grouped among the poverty hitplaces in the district.The main source of livelihood is subsistence farming which is a clear indication that most of the peoplein their respective communities in the town council lack income-generating activities.

8/3/2019 Kisoro District The State of Environment Report
http://slidepdf.com/reader/full/kisoro-district-the-state-of-environment-report 37/75
37
According to the 1991 population and Housing Census 69.6 percent of urban households derivetheir livelihood from subsistence farming. The main crops grown being sorghum, beans sweatpotatoes, Irish potatoes, maize and cabbages.
2.7.3 ENERGYKisoro town council is supplied with three mega watts of electricity imported from the Republic of
Rwanda. Power is used in households and small scale processing plants with the potential of moreconsumption. There are four three functional fuel service stations in the automobiles in the district towncouncil.
2.7.4 WATER SUPPLY AND SANITATIONKisoro town water and sanitation office is responsible for provision of adequate safe water to the towncommunity and assisting in improvement of sanitation. Water supply in the town dates as far back as1995 with one stand post. According to the DSOER the water coverage in Kisoro Town council was 30percent in 1998 but it has now increased to over 100 percentChuho spring located 3.5 km North of the town with 180m 3 reservoir tank at Kamonyi Hill supplieswater to Kisoro Town.The increase in water supply has been done through Southwestern Town’s Water And Sanitationproject though a grant from the Austrian Government Implemented since 1996.The water supply is managed through Kisoro Town water supply and Sewerage Board on behalf of Kisoro town Council.
Table 2.7.2 Piped water status in Kisoro town councilS/N Area of extension Pipeline length (M)
1. Minor extension along Bazanyamaso and Gasasira up toKisoro PTC
1,600M
2. Mizerero and Church roads 1,000M3. Minor extensions to Kisoro hospital & dispensary 500M
4. Extension and Construction of Gasiza stand post 200M
Source : Kisoro Town Council.
Table 2.7.3. Water connections in Kisoro town councilGeneral system serverConnection Number Connection numberDomestic and commercial 158 Commercial 12Institutional 18 Institutional 1Public 20Total 196 Total 13
The town council has 196 total connections on the water supply system as indicated in the above table.
2.7.5 WASTE WATER TREATMENTThere is a wastewater treatment plant at Seseme with a pre treatment (Screening), anaerobic tank withone-day retention time, aerobic tank, one-day retention and vertical filter with intermittent loadingdevice with 4 cells (Kisoro town council 3-year development plan 2003-2006).But a challenge still lies in the fact that this plant is still under utilized with a connection of only 10premises, which might reduce its operation life.
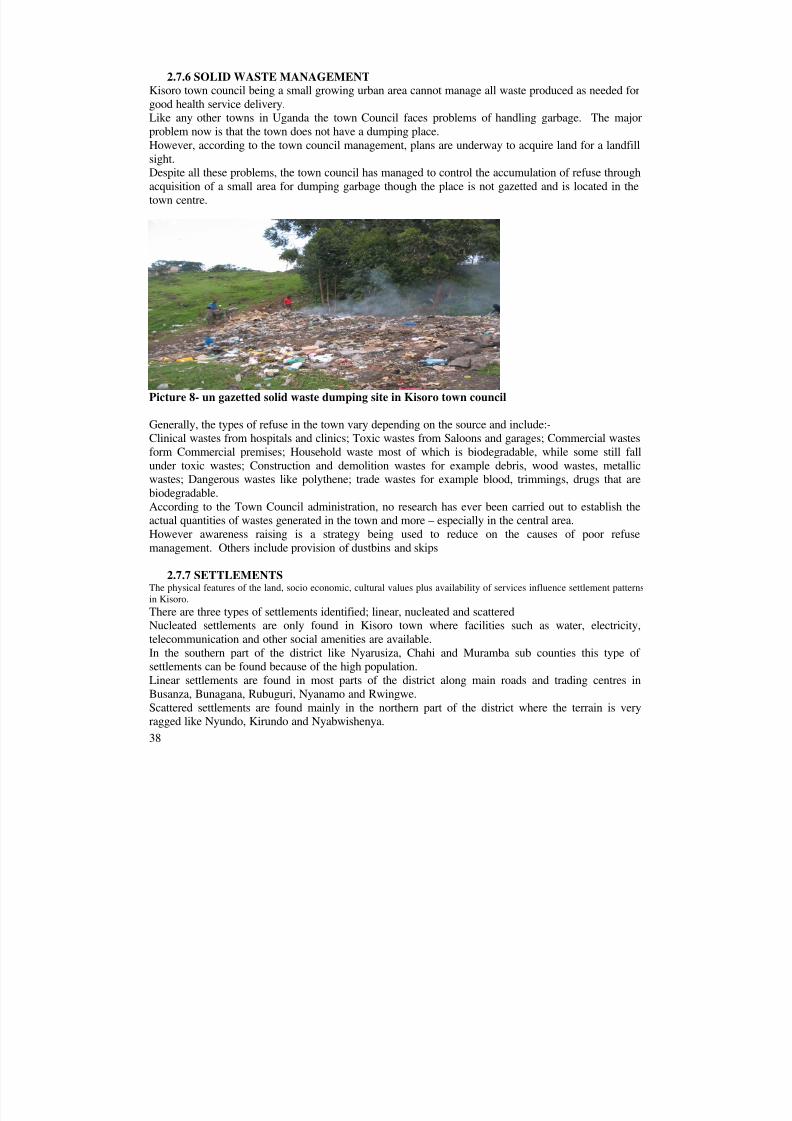
8/3/2019 Kisoro District The State of Environment Report
http://slidepdf.com/reader/full/kisoro-district-the-state-of-environment-report 38/75
38
2.7.6 SOLID WASTE MANAGEMENT Kisoro town council being a small growing urban area cannot manage all waste produced as needed forgood health service delivery.Like any other towns in Uganda the town Council faces problems of handling garbage. The majorproblem now is that the town does not have a dumping place.
However, according to the town council management, plans are underway to acquire land for a landfillsight.Despite all these problems, the town council has managed to control the accumulation of refuse throughacquisition of a small area for dumping garbage though the place is not gazetted and is located in thetown centre.
Picture 8- un gazetted solid waste dumping site in Kisoro town council
Generally, the types of refuse in the town vary depending on the source and include:-Clinical wastes from hospitals and clinics; Toxic wastes from Saloons and garages; Commercial wastes
form Commercial premises; Household waste most of which is biodegradable, while some still fallunder toxic wastes; Construction and demolition wastes for example debris, wood wastes, metallicwastes; Dangerous wastes like polythene; trade wastes for example blood, trimmings, drugs that arebiodegradable.According to the Town Council administration, no research has ever been carried out to establish theactual quantities of wastes generated in the town and more – especially in the central area.However awareness raising is a strategy being used to reduce on the causes of poor refusemanagement. Others include provision of dustbins and skips
2.7.7 SETTLEMENTSThe physical features of the land, socio economic, cultural values plus availability of services influence settlement patternsin Kisoro.There are three types of settlements identified; linear, nucleated and scatteredNucleated settlements are only found in Kisoro town where facilities such as water, electricity,telecommunication and other social amenities are available.In the southern part of the district like Nyarusiza, Chahi and Muramba sub counties this type of settlements can be found because of the high population.Linear settlements are found in most parts of the district along main roads and trading centres inBusanza, Bunagana, Rubuguri, Nyanamo and Rwingwe.Scattered settlements are found mainly in the northern part of the district where the terrain is veryragged like Nyundo, Kirundo and Nyabwishenya.

8/3/2019 Kisoro District The State of Environment Report
http://slidepdf.com/reader/full/kisoro-district-the-state-of-environment-report 39/75
39

8/3/2019 Kisoro District The State of Environment Report
http://slidepdf.com/reader/full/kisoro-district-the-state-of-environment-report 40/75
40
2.7.8 HOUSINGDue to an increase in economic activity, the districts housing sector has greatly improved withpermanent housing on the increase.There are four types of houses in the district; the traditional non upgradable found mainly in the ruralareas which are constructed using mud, wattle and grass thatched that are almost non existent,
upgradable traditional houses, commonly made form sun dried murram bricks with poles and ironsheets common in rural growth centres; semi permanent houses made from sun dried bricks, walls withrough cast and iron sheets, usually found in urban centres; permanent houses with brick wall orvolcanic stones are on the increase and are common in trading centres and Kisoro town council.
Though the housing sector is growing at a first rate there is still a challenge of dependence on localmaterials for building, which can be, environmentally destructive and has adverse effects oncommunity well being. This is seen especially from the brick, sand and aggregates small-scale openextraction where big holes are left gaping. This can create breeding sites for mosquitoes when watercollects, landslides and also be accident-prone sites.
2.7.9 INFRASTRUCTUREKisoro district has a wide spread road network that is fairly well distributed; feeder and communityroad, a major highway all the way from Kabale to the Congo and Rwanda is also of great importance. Italso has an airstrip at Nyakabande for small aircraft’s that is still under utilized.

8/3/2019 Kisoro District The State of Environment Report
http://slidepdf.com/reader/full/kisoro-district-the-state-of-environment-report 41/75
41
Map 3. Showing roads

8/3/2019 Kisoro District The State of Environment Report
http://slidepdf.com/reader/full/kisoro-district-the-state-of-environment-report 42/75
42
2.8 FISHERIES RESOURCESThe main fisheries activities in the district include; fish farming, Lake Fisheries and fish marketing.The are four lakes in the district namely; Chahafi, Kayumbu, Mutanda and Mulehe. Fish speciescommonly known in the area include Oreochromice niloticus , Tilapia zilli , Mirror carp, Clariasgri pines and Haplocromines.Records from Districts fisheries department show that, lakes were very productive in the 1960s,Mulehe producing 66.2 tonnes and Mutanda 17.6 tonnes. However, reports indicate that the catchesstarted declining in early 1970s up to date. In the period between 1996-2000 Fisheries ResearchInstitute (FIRRI) carried out research to find out the causes of decline in fish catches.In 2000, Lake Chahafi was restocked with 18,000 Nile tilapia, and was closed to fishing for one year,on re-opening the fish catches increased but were not sustainable. Monitoring the lake of Chahafi wascarried out but the communities complained of cray fish and haplocromines introduction in the lakeduring restocking which has led to tremendous decline in the indigenous fish which are mirror carp andNile tilapia.In addition, Department of Fisheries Resources did restocking of Lake Mulehe in February 2002 understrategic intervention with 100,000 African catfish, on reopening of the lake the fish catches hadincreased.Tabulated below are the estimated fish catches for the four crater lakes in Kisoro. Compared to the areaper lake there is almost no catches this is because there is almost no management for the lakes.Table 2.8.1 Estimated catches for 2006 Lakes Harvest (Kgs) COMMENTMutanda Nil No managementMulehe 11262Chahafi Nil No managementKayumbu Nil No managementTotal 11262
Table2.8.2. Fish catches for period 2005-2006 for Lake MuleheCatches/ year(Kgs)
Month
2005 2006January 1,456 1,950February 1,066 2,083March 172 596April 144 263May 535 444June 903 -
July 2,193 1,332August 2,431 2,132Sept. 2,951 3,192Oct. 2,223 1,954November 1,784 -December 1,846 -Total 17,704 11,262Source : Fisheries Dept. Kisoro. The above data shows that between March and July the fish catch is usually low and the cause for thisis the changes in climatic conditions whereby during that period it is dry and water becomes cold while
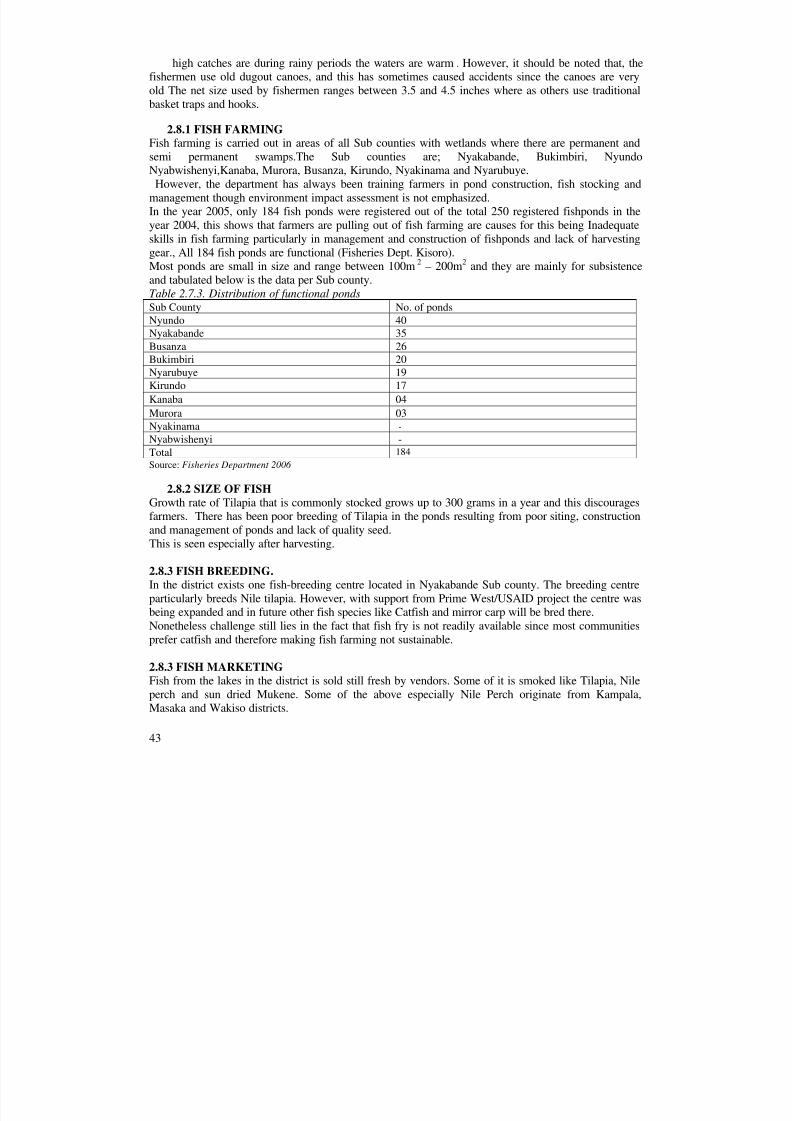
8/3/2019 Kisoro District The State of Environment Report
http://slidepdf.com/reader/full/kisoro-district-the-state-of-environment-report 43/75
43
high catches are during rainy periods the waters are warm . However, it should be noted that, thefishermen use old dugout canoes, and this has sometimes caused accidents since the canoes are veryold The net size used by fishermen ranges between 3.5 and 4.5 inches where as others use traditionalbasket traps and hooks.
2.8.1 FISH FARMINGFish farming is carried out in areas of all Sub counties with wetlands where there are permanent andsemi permanent swamps.The Sub counties are; Nyakabande, Bukimbiri, NyundoNyabwishenyi,Kanaba, Murora, Busanza, Kirundo, Nyakinama and Nyarubuye.
However, the department has always been training farmers in pond construction, fish stocking andmanagement though environment impact assessment is not emphasized.In the year 2005, only 184 fish ponds were registered out of the total 250 registered fishponds in theyear 2004, this shows that farmers are pulling out of fish farming are causes for this being Inadequateskills in fish farming particularly in management and construction of fishponds and lack of harvestinggear., All 184 fish ponds are functional (Fisheries Dept. Kisoro).Most ponds are small in size and range between 100m 2 – 200m 2 and they are mainly for subsistenceand tabulated below is the data per Sub county.Table 2.7.3. Distribution of functional pondsSub County No. of pondsNyundo 40Nyakabande 35Busanza 26Bukimbiri 20Nyarubuye 19Kirundo 17Kanaba 04Murora 03Nyakinama -Nyabwishenyi -
Total 184Source: Fisheries Department 2006
2.8.2 SIZE OF FISHGrowth rate of Tilapia that is commonly stocked grows up to 300 grams in a year and this discouragesfarmers. There has been poor breeding of Tilapia in the ponds resulting from poor siting, constructionand management of ponds and lack of quality seed.This is seen especially after harvesting.
2.8.3 FISH BREEDING.In the district exists one fish-breeding centre located in Nyakabande Sub county. The breeding centreparticularly breeds Nile tilapia. However, with support from Prime West/USAID project the centre wasbeing expanded and in future other fish species like Catfish and mirror carp will be bred there.Nonetheless challenge still lies in the fact that fish fry is not readily available since most communitiesprefer catfish and therefore making fish farming not sustainable.
2.8.3 FISH MARKETINGFish from the lakes in the district is sold still fresh by vendors. Some of it is smoked like Tilapia, Nileperch and sun dried Mukene. Some of the above especially Nile Perch originate from Kampala,Masaka and Wakiso districts.
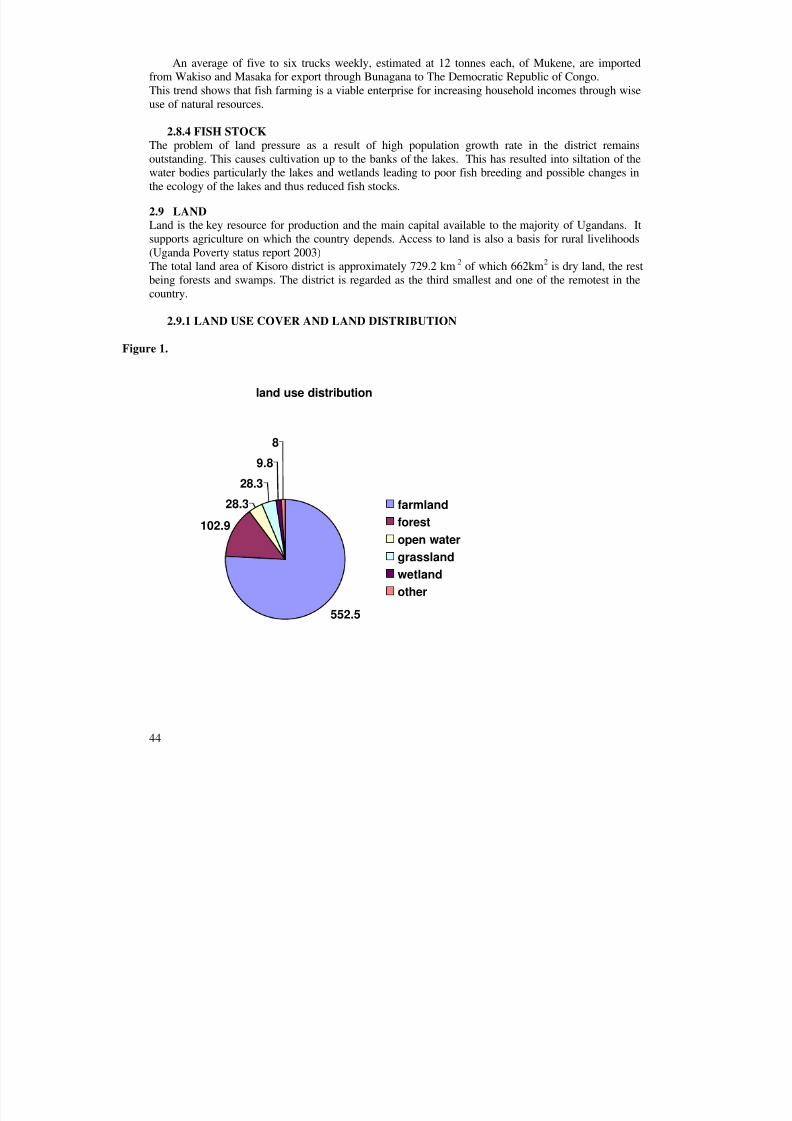
8/3/2019 Kisoro District The State of Environment Report
http://slidepdf.com/reader/full/kisoro-district-the-state-of-environment-report 44/75
44
An average of five to six trucks weekly, estimated at 12 tonnes each, of Mukene, are importedfrom Wakiso and Masaka for export through Bunagana to The Democratic Republic of Congo.This trend shows that fish farming is a viable enterprise for increasing household incomes through wiseuse of natural resources.
2.8.4 FISH STOCK
The problem of land pressure as a result of high population growth rate in the district remainsoutstanding. This causes cultivation up to the banks of the lakes. This has resulted into siltation of thewater bodies particularly the lakes and wetlands leading to poor fish breeding and possible changes inthe ecology of the lakes and thus reduced fish stocks.
2.9 LANDLand is the key resource for production and the main capital available to the majority of Ugandans. Itsupports agriculture on which the country depends. Access to land is also a basis for rural livelihoods(Uganda Poverty status report 2003)The total land area of Kisoro district is approximately 729.2 km 2 of which 662km 2 is dry land, the restbeing forests and swamps. The district is regarded as the third smallest and one of the remotest in thecountry.
2.9.1 LAND USE COVER AND LAND DISTRIBUTION
Figure 1.
land use distribution
102.9
28.3
28.3
9.8
8
552.5
farmlandforestopen watergrasslandwetlandother

8/3/2019 Kisoro District The State of Environment Report
http://slidepdf.com/reader/full/kisoro-district-the-state-of-environment-report 45/75
45
Source. National biomass study report 1997
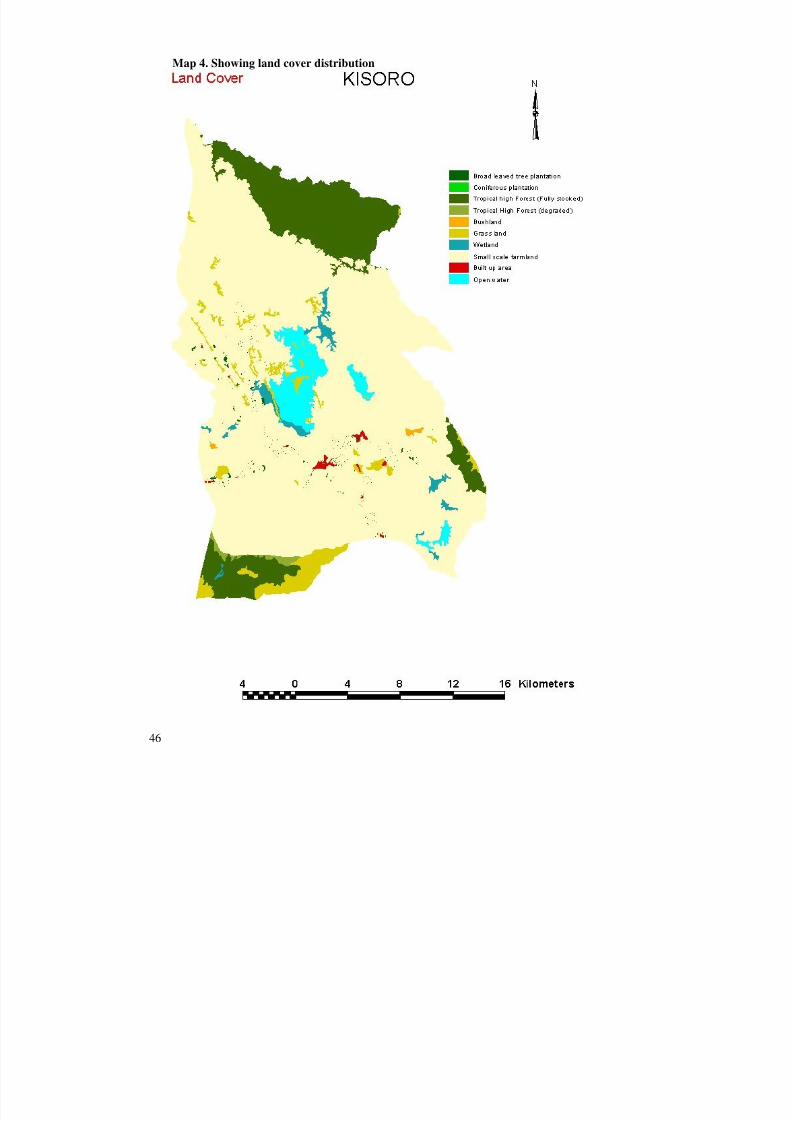
8/3/2019 Kisoro District The State of Environment Report
http://slidepdf.com/reader/full/kisoro-district-the-state-of-environment-report 46/75
46
Map 4. Showing land cover distribution

8/3/2019 Kisoro District The State of Environment Report
http://slidepdf.com/reader/full/kisoro-district-the-state-of-environment-report 47/75
47
2.9.2 SOILS Four main soil types characterize the district including ferraltic, eutrophic, non-hydromorphic andpapyrus peat soils. The soils are fertile. They can support and sustain high populations if soil fertilitymanagement and soil and water conservation practices are employed.Ferraltic soils: these are deep soils very old with poor fertility, as they also have a weak soil structure
and are generally found on hill slopes of Nyabwishenya, Busanza, Bukimbiri, Kirundo and some partsof Nyarubuye.Eutrophic soils; these are soils of volcanic origin and have a high potential for agricultural productionwhen they are not exhausted. Their natural fertility is high because of the nutrients foundin the parent material. This type is commonly found in the southern part of the district including Chahi,Nyakabande, Muramba, Murora, Nyarusiza, Nyakinama, and Nyarubuye sub counties.Non-hydromorphic soils . These are very productive with high humus content when properlymanaged. They have a high water holding capacity but are easily affected by drought. These arepredominantly found around Mount Sabyinyo.Papyrus peat soils; these are wetland soils containing peat derived from humified residues of swampplants, mainly papyrus mixed with fairly high proportions of clay sediments derived from the steep hillslopes bordering the valleys. Papyrus peat soils are mainly found in Bukimbiri, Busanza, Murora,Kirundo, Nyundo, part of Nyarubuye, Nyakinama and Nyakabande sub counties.The major challenge lies in the fact that most data on soils in the district dates back to research of the1950s.
2.9.3 LAND TENURE SYSTEMS :There are mainly three types of land tenure systems namely; Customary, Freehold and Leasehold.Customary Tenure: This is a system of land tenure that is regulated by customary rules, which arelimited in their operation to a particular description or class of persons. It is governed by rules generallyaccepted as binding and authoritative by class of persons to which it applies.It is also applicable to any persons acquiring land in that area in accordance with those rules. It alsoprovides for communal ownership and use of land in which parcels of land may be recognized as subdivisions belonging to a person , a family or a traditional institution; and which is owned in perpetuity.This constitutes about 94% of land ownership in Kisoro District.Freehold Tenure: This a form of tenure deriving its legality from the constitution and its incidentsfrom the written law which involves holding a registered land in perpetuity or for a period not less thanperpetuity which may be fixed by a condition.It enables the holder to exercise subject to the law, full powers of ownership of land, including but notnecessarily limited to;
- Using and developing the land for any lawful purpose;- Taking and using any and all produce from the land- Entering into any transaction in connection with the land, including but not limited ton selling,
leasing, mortgaging or pledging, subdividing creating rights and interests for other people in theland and creating trusts of land
- Disposing of the land to any person by will.This constitutes about 4% of land ownership in Kisoro District.
LeaseholdTenure: This is a form of tenure – Created either by contract operation of the law; The terms and conditions of which may be regulated by the law to the exclusion of
contractual agreement reached between the parties;
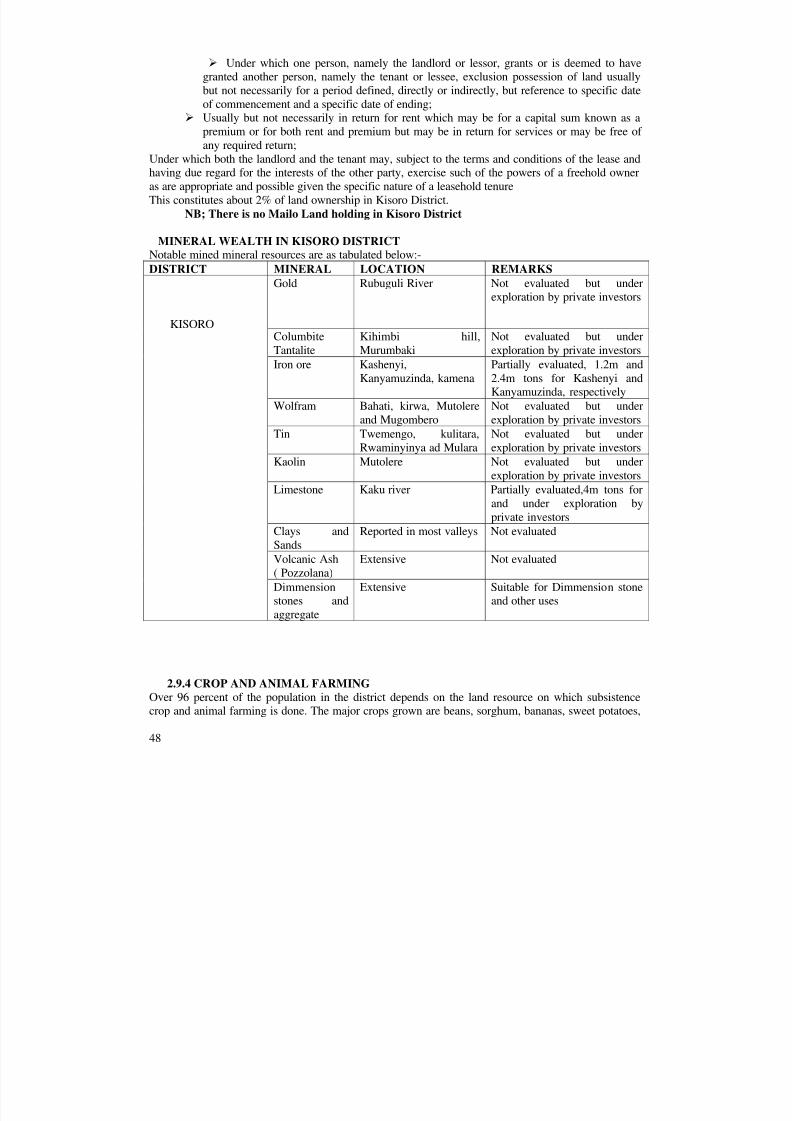
8/3/2019 Kisoro District The State of Environment Report
http://slidepdf.com/reader/full/kisoro-district-the-state-of-environment-report 48/75
48
Under which one person, namely the landlord or lessor, grants or is deemed to havegranted another person, namely the tenant or lessee, exclusion possession of land usuallybut not necessarily for a period defined, directly or indirectly, but reference to specific dateof commencement and a specific date of ending;
Usually but not necessarily in return for rent which may be for a capital sum known as apremium or for both rent and premium but may be in return for services or may be free of
any required return;Under which both the landlord and the tenant may, subject to the terms and conditions of the lease andhaving due regard for the interests of the other party, exercise such of the powers of a freehold owneras are appropriate and possible given the specific nature of a leasehold tenureThis constitutes about 2% of land ownership in Kisoro District.
NB; There is no Mailo Land holding in Kisoro District
MINERAL WEALTH IN KISORO DISTRICTNotable mined mineral resources are as tabulated below:- DISTRICT MINERAL LOCATION REMARKS
Gold Rubuguli River Not evaluated but under
exploration by private investors
ColumbiteTantalite
Kihimbi hill,Murumbaki
Not evaluated but underexploration by private investors
Iron ore Kashenyi,Kanyamuzinda, kamena
Partially evaluated, 1.2m and2.4m tons for Kashenyi andKanyamuzinda, respectively
Wolfram Bahati, kirwa, Mutolereand Mugombero
Not evaluated but underexploration by private investors
Tin Twemengo, kulitara,Rwaminyinya ad Mulara
Not evaluated but underexploration by private investors
Kaolin Mutolere Not evaluated but underexploration by private investors
Limestone Kaku river Partially evaluated,4m tons forand under exploration byprivate investors
Clays andSands
Reported in most valleys Not evaluated
Volcanic Ash( Pozzolana)
Extensive Not evaluated
KISORO
Dimmension
stones andaggregate
Extensive Suitable for Dimmension stone
and other uses
2.9.4 CROP AND ANIMAL FARMINGOver 96 percent of the population in the district depends on the land resource on which subsistencecrop and animal farming is done. The major crops grown are beans, sorghum, bananas, sweet potatoes,

8/3/2019 Kisoro District The State of Environment Report
http://slidepdf.com/reader/full/kisoro-district-the-state-of-environment-report 49/75
49
Irish potatoes, maize and cabbages. Other crops grown are field peas, finger millet, wheat,tomatoes, onions, bitter tomatoes, passion fruits, avocados, sugarcane, bananas and yams.
The traditional cash crops grown include; Arabica coffee and tobacco. There are attempts to introducecrops like upland rice, apples and peachesMajor challenge lies in the fact that not much data is available on the trends of yields.Major animals reared in Kisoro District and their numbers.
Table 2.9.1. Animal statisticsType NumberIndigenous cattle 28,750Improved cattle breeds 3,800Indigenous goats 47,850Diary goats 37rabbits 3,900sheep 27,500Poultry 52,500donkeys 21
Pigs 7,500Beehives 3,589Source: District veterinary reports 2003
2.9.5 LAND SHORTAGELand in Kisoro is highly fragmented due to traditional inheritance practices and high populationdensities. According to the housing and population census of 2002 the population density has almosttripled from 186 in 1981 to 275 in 1991 and to 323 persons per square kilometer in 2002 illustratinghow land is a scarce resource in the district.Land shortage is one of the biggest challenges in the district. It is a problem faced by almosteverybody. Some households have no access to land and for those who have, the majority is highlyfragmented and is less than an acre. Over utilization of these small pieces has led to depletion of thesoils. Traditionally, the people of Kisoro did not practice soil conservation methods like terracing, themethods used then were appropriate because there was still plenty of land, such that land could be leftunder fallow for long periods hence protection from degradation (UPPAP 2000). In the district terracesare poorly managed and soils are always washed down into the valleys after a heavy down pour.
2.9.6 FOOD INSECURITYRelated to land scarcity, the district is faced with a problem of food insecurity, resulting into hunger.Most of the households eat once a day, which is a result of poor crop yields exacerbated by soildegradation and poor food storage practices, pests and diseases and use of poor technologies. Theproblem of food shortage is experienced especially before harvesting during the months of March toApril and October to November.
Table 2.9.2. Common diseases affecting crops in the district Crop Diseases and pestsIrish potatoes Late blight, early blight, bacterial wilt, millipedesMaize Maize borer, maize streak Sorghum smutsBeans Bean root rot, leaf rust, anthracanoseCoffee Coffee leaf rust, coffee berry disease

8/3/2019 Kisoro District The State of Environment Report
http://slidepdf.com/reader/full/kisoro-district-the-state-of-environment-report 50/75
50
Sweet potatoes aphidsSource: District Production Office
Table 2.9.3.Common diseases that affect livestock in the district are shown in the table belowCategory DiseaseCattle Tick borne disease mainly east coast fever, Anaplasmosis and
trypanosomiasis.Cattle worm infectionsBacterial and viral infections like black quarter, anthrax, foot and mouthdiseaseBrucellosis
Goats MangePink eyeWorm infections
Poultry New castle disease that is an epidemic and claims 60 percent of the localpoultryCoccidiosisFowl typhoid
Pigs Worm infectionAfrican swine fever
Source : District Development Plan 2007- 2010
2.9.7 LAND DEGRADATIONLand degradation is the most serious environmental problem facing the district. Scanty vegetation andloose soils that are as a result of volcanicity characterize the southern part of the district. The nature of the soils and the terrain are major catalysts for high soil erosion.
According to reports from the production department, major causes of soil erosion are wind, rainwater
and steepness of hill, movement of animals and poor cultivation practices such as shifting cultivation.
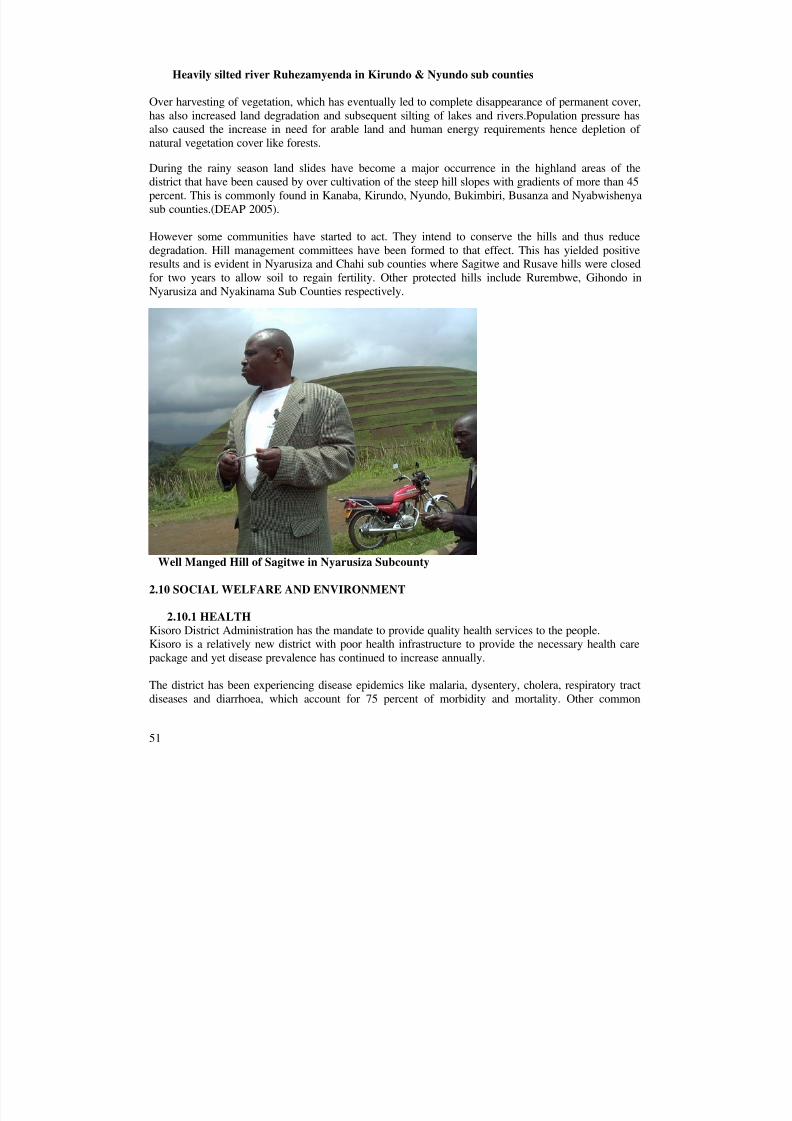
8/3/2019 Kisoro District The State of Environment Report
http://slidepdf.com/reader/full/kisoro-district-the-state-of-environment-report 51/75
51
Heavily silted river Ruhezamyenda in Kirundo & Nyundo sub counties
Over harvesting of vegetation, which has eventually led to complete disappearance of permanent cover,has also increased land degradation and subsequent silting of lakes and rivers.Population pressure hasalso caused the increase in need for arable land and human energy requirements hence depletion of natural vegetation cover like forests.
During the rainy season land slides have become a major occurrence in the highland areas of thedistrict that have been caused by over cultivation of the steep hill slopes with gradients of more than 45percent. This is commonly found in Kanaba, Kirundo, Nyundo, Bukimbiri, Busanza and Nyabwishenyasub counties.(DEAP 2005).
However some communities have started to act. They intend to conserve the hills and thus reducedegradation. Hill management committees have been formed to that effect. This has yielded positiveresults and is evident in Nyarusiza and Chahi sub counties where Sagitwe and Rusave hills were closedfor two years to allow soil to regain fertility. Other protected hills include Rurembwe, Gihondo inNyarusiza and Nyakinama Sub Counties respectively.
Well Manged Hill of Sagitwe in Nyarusiza Subcounty
2.10 SOCIAL WELFARE AND ENVIRONMENT
2.10.1 HEALTHKisoro District Administration has the mandate to provide quality health services to the people.Kisoro is a relatively new district with poor health infrastructure to provide the necessary health carepackage and yet disease prevalence has continued to increase annually.
The district has been experiencing disease epidemics like malaria, dysentery, cholera, respiratory tractdiseases and diarrhoea, which account for 75 percent of morbidity and mortality. Other common
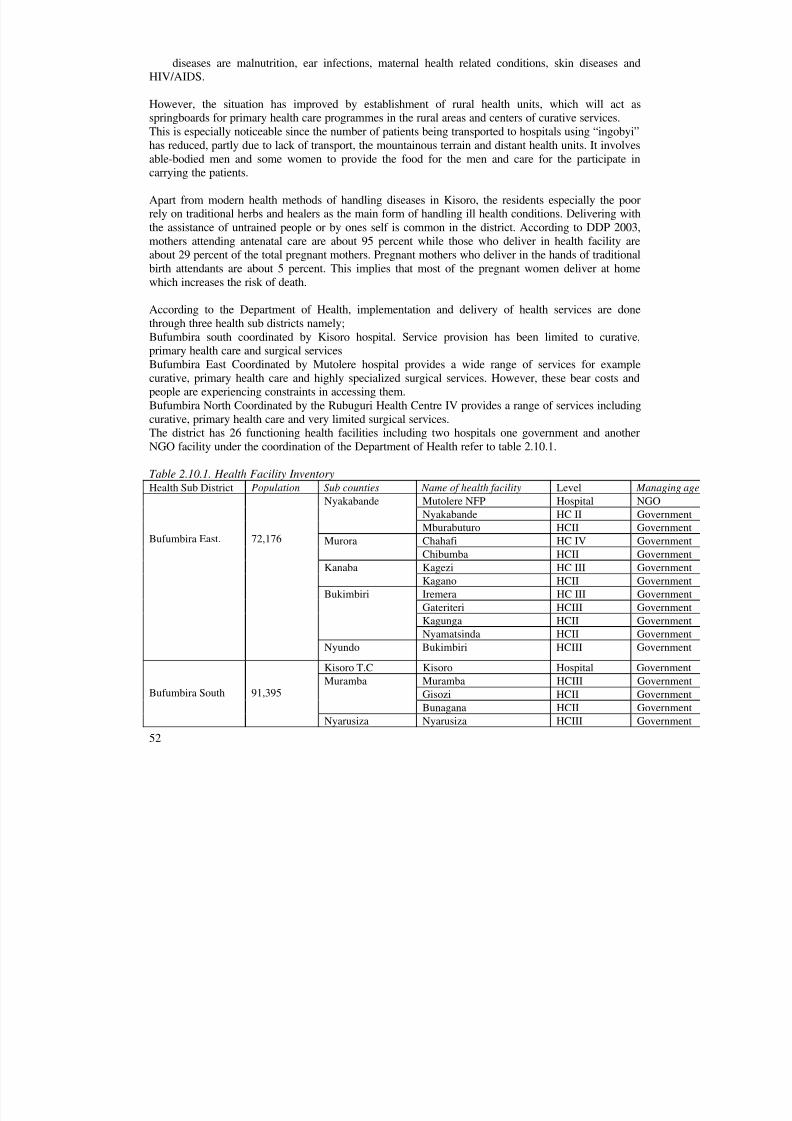
8/3/2019 Kisoro District The State of Environment Report
http://slidepdf.com/reader/full/kisoro-district-the-state-of-environment-report 52/75
52
diseases are malnutrition, ear infections, maternal health related conditions, skin diseases andHIV/AIDS.
However, the situation has improved by establishment of rural health units, which will act asspringboards for primary health care programmes in the rural areas and centers of curative services.This is especially noticeable since the number of patients being transported to hospitals using “ingobyi”
has reduced, partly due to lack of transport, the mountainous terrain and distant health units. It involvesable-bodied men and some women to provide the food for the men and care for the participate incarrying the patients.
Apart from modern health methods of handling diseases in Kisoro, the residents especially the poorrely on traditional herbs and healers as the main form of handling ill health conditions. Delivering withthe assistance of untrained people or by ones self is common in the district. According to DDP 2003,mothers attending antenatal care are about 95 percent while those who deliver in health facility areabout 29 percent of the total pregnant mothers. Pregnant mothers who deliver in the hands of traditionalbirth attendants are about 5 percent. This implies that most of the pregnant women deliver at homewhich increases the risk of death.
According to the Department of Health, implementation and delivery of health services are donethrough three health sub districts namely;Bufumbira south coordinated by Kisoro hospital. Service provision has been limited to curative,primary health care and surgical servicesBufumbira East Coordinated by Mutolere hospital provides a wide range of services for examplecurative, primary health care and highly specialized surgical services. However, these bear costs andpeople are experiencing constraints in accessing them.Bufumbira North Coordinated by the Rubuguri Health Centre IV provides a range of services includingcurative, primary health care and very limited surgical services.The district has 26 functioning health facilities including two hospitals one government and anotherNGO facility under the coordination of the Department of Health refer to table 2.10.1.
Table 2.10.1. Health Facility InventoryHealth Sub District Population Sub counties Name of health facility Level Manag
Mutolere NFP Hospital NGONyakabande HC II Governm
Nyakabande
Mburabuturo HCII GovernmChahafi HC IV GovernmMuroraChibumba HCII GovernmKagezi HC III GovernmKanabaKagano HCII GovernmIremera HC III Governm
Gateriteri HCIII GovernmKagunga HCII Governm
Bukimbiri
Nyamatsinda HCII Governm
Bufumbira East. 72,176
Nyundo Bukimbiri HCIII Governm
Kisoro T.C Kisoro Hospital GovernmMuramba HCIII GovernmGisozi HCII Govern
Muramba
Bunagana HCII GovernmBufumbira South 91,395
Nyarusiza Nyarusiza HCIII Governm

8/3/2019 Kisoro District The State of Environment Report
http://slidepdf.com/reader/full/kisoro-district-the-state-of-environment-report 53/75
53
Nyakinama HCIII GovernmNyakinamaChihe HCII GovernNyabihuniko HCIII GovernmChahiClare Nsenga HCII NGORubuguri HC IV GovernmRutaka HCIII NGO
Kirundo
Kalehe HCII GovernKinanira HCIII NGOBuhozi HCIII Governm
Busanza
Busanza HC IV GovernmBusengo HCII GovernmNyarubuye HCIII Governm
Nyarubuye
Gapfurizo HCII GovernmNteko HCIII Govern
Bufumbira North 56,741
NyabwishenyiGasovu HCIII Governm
Source: DHS annual report 2006 The table above shows that there are 32 health facilities in the district. However, their distributions was
dictated by parameters like populations, disease burden, nature of the terrain since some places are hardto reach and assertiveness of the community. The distance to the nearest health facility isapproximately 3 km
IMMUNIZATIONTable 2.10.2. Immunization(%)Year Antigen Drop out rate
BCG Polio3 DPT3 Measles BCG-Measles DPT1-DPT32006 99.7 92.5 91 88 12 6.5
2005 103 91 91 83 20 32004 91 93 94 82 32003 91 80 75 68 23 92002 101 86 79.3 77 24 23.22001 83 64 64 53 30 11Source: Annual health report 2006
The above table shows that Immunization antigen percentage has increased. The factors underlying thisare social mobilization during the child days that have been conducted twice every year since 2002. Inaddition, massive measles campaign conducted in 2006 greatly contributed to the success.Below is the graphic presentation of the immunization coverage in the district for seven consecutiveyears
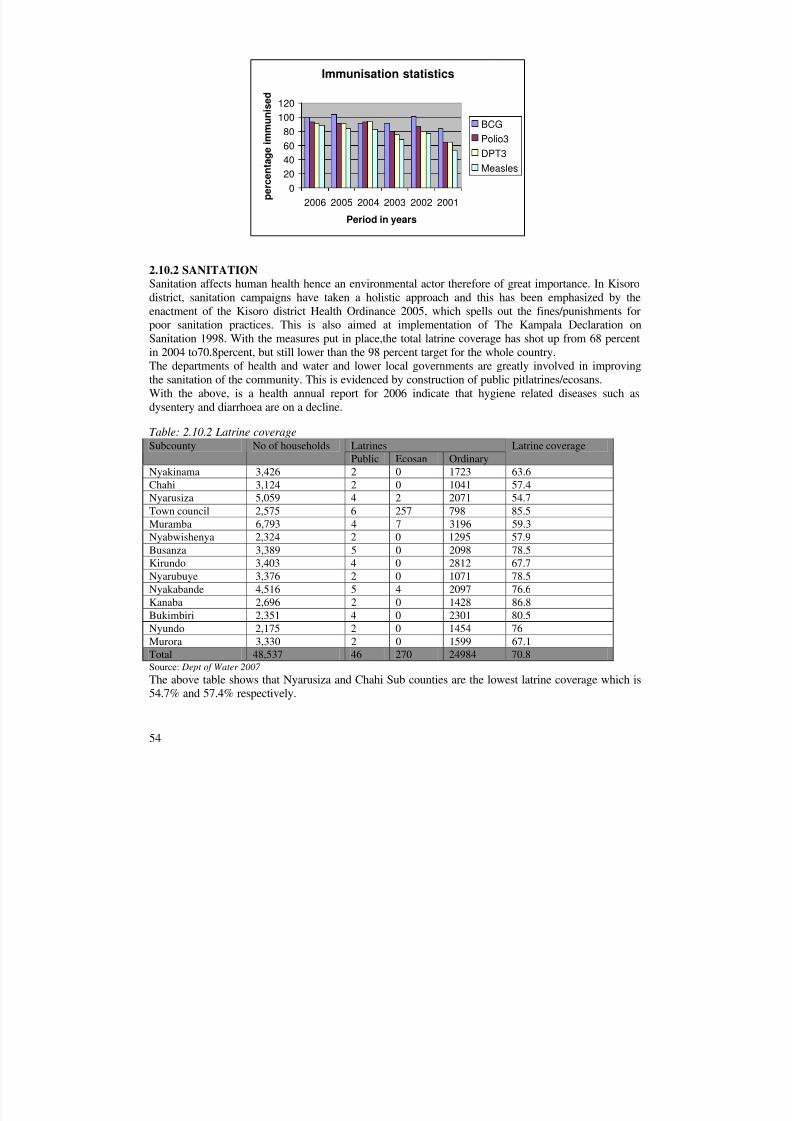
8/3/2019 Kisoro District The State of Environment Report
http://slidepdf.com/reader/full/kisoro-district-the-state-of-environment-report 54/75
54
2.10.2 SANITATIONSanitation affects human health hence an environmental actor therefore of great importance. In Kisoro
district, sanitation campaigns have taken a holistic approach and this has been emphasized by theenactment of the Kisoro district Health Ordinance 2005, which spells out the fines/punishments forpoor sanitation practices. This is also aimed at implementation of The Kampala Declaration onSanitation 1998. With the measures put in place,the total latrine coverage has shot up from 68 percentin 2004 to70.8percent, but still lower than the 98 percent target for the whole country.The departments of health and water and lower local governments are greatly involved in improvingthe sanitation of the community. This is evidenced by construction of public pitlatrines/ecosans.With the above, is a health annual report for 2006 indicate that hygiene related diseases such asdysentery and diarrhoea are on a decline.
Table: 2.10.2 Latrine coverageLatrinesSubcounty No of householdsPublic Ecosan Ordinary
Latrine coverage
Nyakinama 3,426 2 0 1723 63.6Chahi 3,124 2 0 1041 57.4Nyarusiza 5,059 4 2 2071 54.7Town council 2,575 6 257 798 85.5Muramba 6,793 4 7 3196 59.3Nyabwishenya 2,324 2 0 1295 57.9Busanza 3,389 5 0 2098 78.5Kirundo 3,403 4 0 2812 67.7Nyarubuye 3,376 2 0 1071 78.5Nyakabande 4,516 5 4 2097 76.6
Kanaba 2,696 2 0 1428 86.8Bukimbiri 2,351 4 0 2301 80.5Nyundo 2,175 2 0 1454 76Murora 3,330 2 0 1599 67.1Total 48,537 46 270 24984 70.8Source: Dept of Water 2007 The above table shows that Nyarusiza and Chahi Sub counties are the lowest latrine coverage which is54.7% and 57.4% respectively.
Immunisation statistics
020406080
100120
2006 2005 2004 2003 2002 2001
Period in years
p e r c e n
t a g e
i m m u n
i s e
d
BCGPolio3
DPT3Measles

8/3/2019 Kisoro District The State of Environment Report
http://slidepdf.com/reader/full/kisoro-district-the-state-of-environment-report 55/75
55
2.10.3 EDUCATIONEducation is a constitutional right therefore Kisoro district attaches great importance to it. With thegovernment policy on UPE, there has been considerable increase in enrolment.In the district there are three categories of education institutions namely; Primary, Secondary andTertiary. Among the primary schools are both those government aided and private one which total up to135 of which 125 are government aided. In addition to the Government aided primary schools are 20
COPE centers..By 2004 enrolment had tripled that for 1997 when UPE policy implementation started when it was at23,233. However, it has been fluctuating due to increased school drop out rate. The table below showsthe current trend.Table 2.10.4. Enrollment in primary schools by sex. Year Boys Girls Total2004 33,217 32,155 65,3722005 31,837 31,147 62,9842006 32,138 32,236 64,3742007 30,890 31,377 62,267Source: Dept of education
Currently there are 797 permanent classrooms in the district. Given the recommended classroom pupilratio of 1 to 55, 1132 classrooms are required to accommodate the pupils. This implies the shortfall of 335permanent classrooms. The teacher pupil’s ratio of 1 to 48 is hence improvement to providingquality education.Despite the increase in enrollment a drop out rate of 2.9 percent in addition to 5,065 school going agechildren who are out of school is considered to be high. Some of the reasons for being out of schoolare; child labour, poor attitude of parents towards education, long walking distances to schools, aboveage, disability, orphan hood, being destitute and neglected.
The district has 1351 primary school teachers (868 males, 483 females) of these 933 are trained and418 untrained.There are high inadequacies of primary school facilities; currently textbook pupil ratio is 1 to3, whichis the recommended standard ratio. Latrine stance to pupils ratio is 1 to 95 compared to therecommended 1 to 25 ratio for females and 1 to 40 ration for males. Considering safe wateraccessibility, 72 primary schools out of the total have access to safe water.
Primary Schools' Enrolment
020,00040,00060,00080,000
2004 2005 2006 2007
Period in years
N u m
b e r o
f p u p
i l s
BoysGirlsTotal

8/3/2019 Kisoro District The State of Environment Report
http://slidepdf.com/reader/full/kisoro-district-the-state-of-environment-report 56/75
56
2.10.3.1 Secondary educationThe district has 26 secondary schools of which 10 are government aided and 16 are private. Only threeof these have the advanced level. The enrollment in secondary schools is 3500 and the average walkingdistance to school is 8km instead of standard 3km. However, there has been great improvement inreducing the distance to the secondary schools since 10 Sub Counties have them.Secondary school education is constrained by; inadequate number of trained teachers, poor classroom
conditions, lack of facilities such as libraries and laboratories and in accessibility of safe water. Onlyseven out of the 14 secondary schools have access to safe water most schools have poor sanitaryconditions.
2.10.3.2 Tertiary educationThe district has five tertiary institutions namely Kisoro Primary Teachers College, Kisoro TechnicalInstitute, Seseme Vocational Training Centre, Mutolere Nursing School and St Gertrude DomesticScience Centre. Of these, two are government aided and 3 are NGO Institutions. These institutions areconstrained by lack of tutors, water, electricity, incomplete buildings, poor accommodation andsanitary conditions.
Table 2.10.5. Hygiene and sanitation in schoolsEnrollment Latrine
stancesLatrine stance ratioSubcounty
Boys Girls Boys Girls
Hand washingfacilities
Boys Girls
Health clubs
Murora 2536 2346 60 43 7 42.3 54.6 5Busanza 2111 2252 42 40 9 50.3 56.3 5Muramba 3901 3434 48 53 8 81.3 64.8 8Nyakinama 2441 2244 36 25 6 67.8 89.8 6Nyabwishenya 1546 2355 21 21 5 73.6 64.5 3Nyarubuye 2207 2035 30 35 6 73.6 58.1 4Kirundo 3194 3148 52 70 11 61.4 45.0 11Kanaba 1306 1052 18 20 4 72.6 52.6 3
Nyakabande 3359 3088 41 49 7 81.9 63.0 7Nyarusiza 2423 2269 41 45 5 59.1 50.4 6Town council 1761 1708 51 50 6 34.5 34.2 3Bukimbiri 1584 1521 26 37 6 60.9 41.1 4Nyundo 1658 1469 16 19 5 103.6 77.3 3Chahi 1497 1193 22 23 5 68.0 51.9 5Source: Department of water 2006
The above challenge is being dealt with through the training of teachers in sanitation matters andencouragement in forming health clubs in order to improve sanitation. Some schools are benefitingfrom other NGOs like FAWE
2.10.4 FOOD AND NUTRITIONThe provision of food for a growing population entirely lies on the expense of the environment, as aresult, more pressure has been put on the already unproductive fragmented pieces of land. Thechallenge at hand is to improve the production methods on these plots of land through soil conservationto stabilize and regenerate the degraded soils.
Good nutrition is a precondition for good health and sustainable human economic development.Hunger and malnutrition particularly among the vulnerable groups such as women and children causesstunted growth and abnormalities.
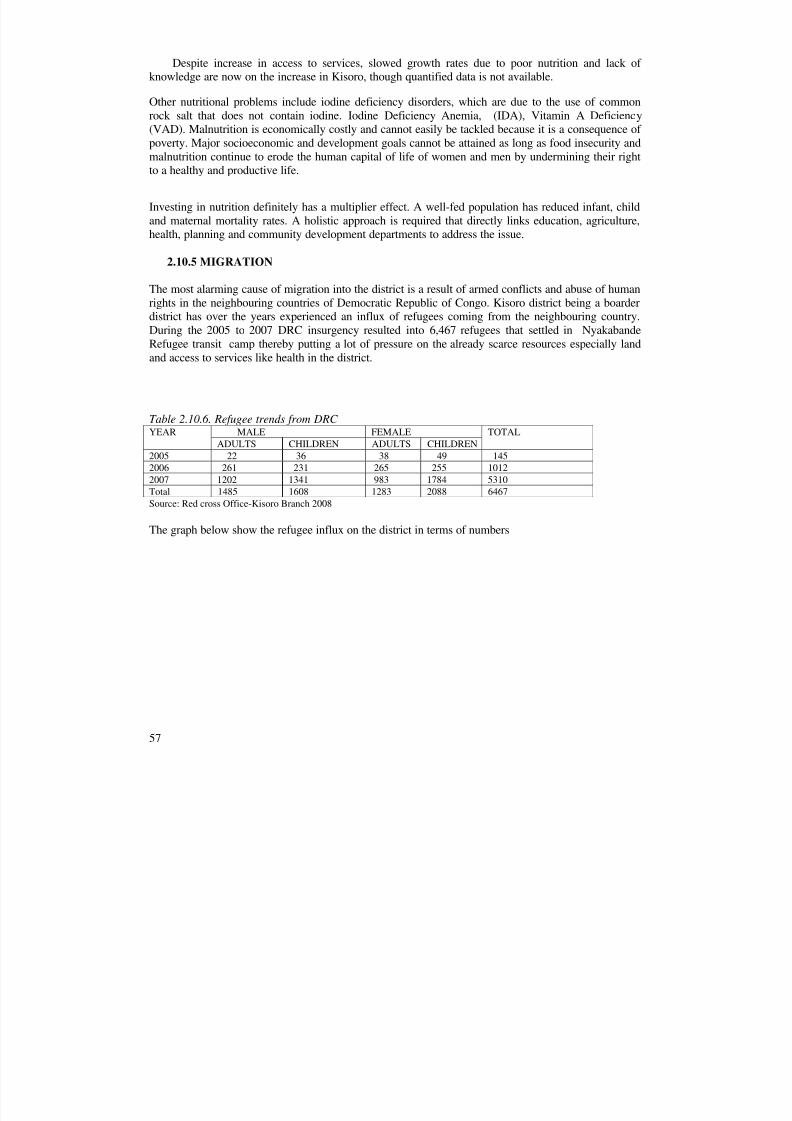
8/3/2019 Kisoro District The State of Environment Report
http://slidepdf.com/reader/full/kisoro-district-the-state-of-environment-report 57/75
57
Despite increase in access to services, slowed growth rates due to poor nutrition and lack of knowledge are now on the increase in Kisoro, though quantified data is not available.
Other nutritional problems include iodine deficiency disorders, which are due to the use of commonrock salt that does not contain iodine. Iodine Deficiency Anemia, (IDA), Vitamin A Deficiency(VAD). Malnutrition is economically costly and cannot easily be tackled because it is a consequence of poverty. Major socioeconomic and development goals cannot be attained as long as food insecurity andmalnutrition continue to erode the human capital of life of women and men by undermining their rightto a healthy and productive life.
Investing in nutrition definitely has a multiplier effect. A well-fed population has reduced infant, childand maternal mortality rates. A holistic approach is required that directly links education, agriculture,health, planning and community development departments to address the issue.
2.10.5 MIGRATION
The most alarming cause of migration into the district is a result of armed conflicts and abuse of human
rights in the neighbouring countries of Democratic Republic of Congo. Kisoro district being a boarderdistrict has over the years experienced an influx of refugees coming from the neighbouring country.During the 2005 to 2007 DRC insurgency resulted into 6,467 refugees that settled in NyakabandeRefugee transit camp thereby putting a lot of pressure on the already scarce resources especially landand access to services like health in the district.
Table 2.10.6. Refugee trends from DRC MALE FEMALEYEAR
ADULTS CHILDREN ADULTS CHILDRENTOTAL
2005 22 36 38 49 1452006 261 231 265 255 10122007 1202 1341 983 1784 5310Total 1485 1608 1283 2088 6467Source: Red cross Office-Kisoro Branch 2008
The graph below show the refugee influx on the district in terms of numbers

8/3/2019 Kisoro District The State of Environment Report
http://slidepdf.com/reader/full/kisoro-district-the-state-of-environment-report 58/75
58
It is important to note that the vast majority of refugees are of rural origin in most cases coming fromvery poor and marginalized war affected areas. But even the little they may have possessed usually islost during the flight. Refugee population statistics show that the majority of the refugees are women,children and the elderly, a substantial number are physically and mentally handicapped due to theeffects of trauma of war, which indicates the vulnerability of the groups. Consequently the majority of refugees belong to the poorest of the poor who have settled in the rural areas that are poverty strickenas well. The refugee situation is a key concern in poverty reduction due to the high numbers and theimpact they have on the host population in terms of economic and social development. The presence of such large numbers of people in a given region can cause serious ecological consequences, if sustainable settlement strategies are not implemented early enough to reduce environmental damage. Insome settlements there is a problem of deforestation and fuel wood has become a problem to thecommunity. Depletion or degradation of the resources has also become common for example water hasbecome scarse. In addition, over congestion in the camps leads to worrying environmental healthconditions especially sanitation. There is also a strain on social amenities in the district such as healthservices which are overstretched in the refugee inhabitated areas. Furthermore the insurgency in theCongo region has left the boarder towns of Bunagana and Kumupaka in Muramba and Busanza SubCounties respectively vulnerable to security threats and migrations.Other cases of migrations from within or out of the district are caused by push pull factors associatedwith the search for labor, better services like education, health services, social cultural settings likemarriage especially for the female folk. Kisoro is one of the districts that have large numbers of peoplemigrating in search of land and better opportunities. Areas where large numbers of Bafumbira areknown to have settled include; Masaka- Kyazanga, Mubende, Hoima, Kabarole, Rukungiri, Mbarara,Kyenjojo and Kibale.
Refugees hosted in Kisoro District
0
500
1000
15002000
2500
3000
2005 2006 2007
Period in years
N u m
b e r o
f r e
f u g e e s
malefemale
8/3/2019 Kisoro District The State of Environment Report
http://slidepdf.com/reader/full/kisoro-district-the-state-of-environment-report 59/75
59
CHAPTER THREE: RESPONSES TO ENVIRONMENTAL CHANGE
3.1 NATIONAL POLICIES, LAWS AND INSTITUTIONS
POLICIESThe National Environmental Management Policy (NEMP, 1994) was formed after the realization of thepressure and degradation of our natural resource base for example in 1889 there were 100,000 m 2 of forest land of which 45% were tropical forests but by 2000 forest land has dwindled to 36,000m 2.The NEMP 1994 recognizes the need to mainstream environment, address biodiversity, put focus onwetlands and provide for enactment of enabling laws and put in place institutional framework forenvironment management.In addition it provides for sector-based policies such as;The Policy for the conservation and mangement of wetland resources 1995,The Uganda Wildlife Policy 1995,
The fisheries policy 2000The National Water Policy 1995, and
The Uganda Forestry Policy 2000.
Key highlights of NEMP that apply to Environment management at District level ;
It decentralized environment management paving way for the creation of an environment department atdistrict levelIt also gave way to the formulation of the legal framework for environment management; the NationalEnvironment Statute of 1995 and also other sector based policies like;
It also created a need for capacity building in planning, information generation and dissemination.It allows use of tools to manage the environment like Environment Impact Assessment, standards andregulations
ENVIRONMENT POLICY AT DISTRICT LEVELAs a district, the challenge is to formulate a policy for environment management.But the district has gone ahead to own NEMP strategies to enable it achieve its vision in managing theenvironment “ to create healthy communities with improved standards of living, well conserved and managed environment for sustainable development (DEAP 2002).MAJOR ENVIRONMENT LEGISLATION
- The Constitution of the Republic of Uganda 1995 under Article 39 it provides the inherent rightto a clean and healthy environment and involvement of the people in the formulation andimplementation of development programs. In addition it also focuses on biodiversity.
- National Environment Act Cap153o Establishes tools like EIA and Environment monitoringo Establishes institutions like NEMA as the lead agency in Environment managemento Mandates the preparation of NSOER and DSOER once in two years and annually for the Nation
and District respectively.- Other are the Water Act, The local Government Act 1997, The Land Act 1998, The Wildlife Act
1996 and the National Forestry and Tree Planting Act 2003.There are subsidiary legislation through which implementation of the policies is done. They include
the following; EIA regulations 1998

8/3/2019 Kisoro District The State of Environment Report
http://slidepdf.com/reader/full/kisoro-district-the-state-of-environment-report 60/75
60
National Environment (Standard for discharge of effluent in water or land) Regulation,1999
The national Environment (Waste Management) Regulations 1999 The National Environment (Hilly and mountainous) Regulations, 2000 The National Environment (Wetlands, Riverbanks and lakeshore) Regulations 2000 The National Environment (Minimum standards in management of soil quality) Regulation
2001 The Environment (Ozone depleting substances and products) Regulations 2001 The National Environment (Noise standards and control) regulations 2003 The National Environment (Conduct and certification of Environment practioners) Regulation
2003 KCC (Solid waste management) Ordinance 2000
STATUTORY OBLIGATIONThe NES, 1995 calls for establishment of a District Environment Committee (DEC)Formation of Local Environment Committees (LECs)Appointing of a District Environment Officer (DEO). These are stated in sections 15,16 &17It also mandates the DEC to;Prepare District State of Environment Report (DSOER) every year.Co-ordinate activities of LECs in managing the environment.Prepare a District Environment Action Plan (DEAP) every three years or other such lesser period as theauthority may require.Assist in developing byelaws relating to environment management.Ensure the District Council integrates environment concerns in all plans and projects.
The Local Government Act 1997 also allows the District Executive Committee to make and formulatepolicies for approval by the District Council and oversee the implementation of Government of Ugandapolicies.
The NES 1995 cements the use of tools like Environment Impact Assessment (EIA) for environmentmanagement.
INSTITUTIONAL STRUCTURES AND REFORMSThe Local Government Act gives rights, responsibilities and authority to local governments at districtand sub county levels. It decentralizes the management of services for development purposes includingmanagement of the environment.Section 36 (a) states that the District Council shall prepare comprehensive and integrated DistrictDevelopment Plan thus clearly reflecting the spirit of the NES 1995.It further mandates the district in schedule (2) (3) to carry out land surveys, agricultural extension,wetland management, lakeshores, streams, and camping, grazing land and water services.
Before 1986 management of environment was done at Central Government level in the Ministry of Environment Protection. After 1986 environmental legislation come into place but were scattered forexample the fish and crocodile Act. It was after 1995 that the laws were harmonized.The realization by the Central Government that the available structures for environment managementwere not averting the situation of environment degradation at grass root level led to restructuring, henceformation of a structure that created agencies like UWA, NEMA and the decentralized management of environment which are echoed in the NEMP 1994. The district restructuring program is still going on

8/3/2019 Kisoro District The State of Environment Report
http://slidepdf.com/reader/full/kisoro-district-the-state-of-environment-report 61/75
61
and currently provides for appointment of an Environment Officer and a wetlands officer inaddition to a senior environment officer.
The National Environment Management Authority (NEMA) which is the principal agency in Ugandafor management of environment with the over all mandate to co-ordinate, monitor, supervise allactivities in the field of environment, was formed in 1995.
NEMA as a regulatory organization links with the local government structure through a statutoryobligation stated in The LGA 1997 that removes power from centre and gives it to the districts andlower local governments.
The District Council, which is the highest governing organ at district level, has its direct link with theDistrict Support Coordination Unit of NEMA and therefore its link to the District EnvironmentCommittee and other sectoral committees.This structure also allows for the formation of environment committees at lower levels that is, SubCounty, parish and village, creating opportunity for participation by all stakeholders in the managementof natural resources and the environment.In Kisoro district, the DEC is in place and operational, all sub counties have environment committeesbut they lack capacity to carry out their roles successfully. The department of environment has beenoperational since 1997 and currently has a full-fledged department with the following Staff; Naturalresources Officer, District Environment Officer, 1 forestry Officer (with two forest guard and oneforest ranger), 1Tourism Officer and 1 Assistant records officer.
LEGAL REFORMS FOR ENVIRONMENT MANAGEMENTThe National Environment Statute 1995 that derives it origin from the NEMP 1994, which is themother law for environment management in the country gave rise to other regulation, Some of theenactment of enabling laws and institution framework include Enforcement of the above regulationshas been slow due to lack of awareness of enforcement officers on environmental law. But there havebeen some areas of encouragement where management of hills has been community oriented.
Sagitwe hill in Nyarusiza sub county managed using the farrow system
Committees are formed to help in management of hills and enforcement of byelaws made bycommunities especially in soil conservation as indicated in table below. Techniques like alternatecropping, fallow cultivation, contours and tree planting are used. The major challenge is for the districtto document these community efforts in enforcement to come up with an ordinance for soilconservation.

8/3/2019 Kisoro District The State of Environment Report
http://slidepdf.com/reader/full/kisoro-district-the-state-of-environment-report 62/75
62
Table3.1 Community initiatives in enforcement and restoration. Hill Action LocationSagitwe hillNyarurembwe hill
Hill management committeesHinga raza system
Nyarusiza sub county
Gisorora hill Contour system Nyakabande sub countyKigoma Hill Fallow system Nyakabande sub countyMuganza hill Fallow Chahi sub countyLake Chahafi andKayumbu
Buffer zone demarcation of 3.5m Murora sub county
Lake Mulehe Buffer zone demarcation of 20 m in flatland and 10 m in the hill sides
Nyakabande sub county
River Mucha 5metres buffer zone demarcated Nyakabande sub countySOURCE: sub county production reports
ORDINANCESThe district of Kisoro in consultation with communities and other stakeholders is in the process of finalizing a district wetland ordinance to help in the protection and conservation of wetlands, which areexperiencing a lot of pressure due to human activities.It is at bill level, and awaits discussion by the District Technical Planning Committee, Attorney generaland approval by the District Council.
3.2 ENVIRONMENTAL PLANNING.DEAPThe National Environment Act, section 19, provides for every district Environment Committee inconsultation with NEMA, to prepare a District Environment Action Plan (DEAP) to be revised everythree-year or such other lesser periods as may be considered necessary by the Authority. The Actmandates the district plan to be in conformity with the National Environment Action Plan and bindingon all the district agencies, local committees and persons within the districts (GoU 1995). The DEAPfor Kisoro District was prepared in 2002 with the support of COBS (Conserve Biodiversity forsustainable development Support project). However, Kisoro district PEAP is in the final stage of review.
Mainstreaming of the Environment.Environment is categorized among the cross cutting issues. Environment mainstreaming involves the
following processes;_- identifying environment and natural resources issues- identifying potential adverse impacts and mitigation measures and positive impacts and
enhancing measures for development interventions- monitoring the implementation of environmental management interventions including
mitigation activities to reduce potential negative impacts or enhance positive ones of development programmes.
Environment mainstreaming is one of the parameters considered in LGDP assessment.
3.3 GRANTS FOR ENVIRONMENT MANAGEMENT/ ECONOMIC INSTRUMENTSThe department of environment receives a budgetary allocation worth 0.08% of the total budget. Forthe financial year 2007/2008, the department has a budget of 27,020,069/= (Twenty seven milliontwenty thousand sixty nine shillings).

8/3/2019 Kisoro District The State of Environment Report
http://slidepdf.com/reader/full/kisoro-district-the-state-of-environment-report 63/75
63
Source of Funds AmountBudgeted
ActualReceived
Comments/Remarks
PrimeWetlands/IUCN
- 15,000,000 For restoration and management of lake Mulehe. Thiswas aimed at implementation of the CommunityWetland Management Plan for lake Mulehe.
Activities included provision of longthorth beehivesand provision of agroforestry tree seedlings tofarmers.
PAF 9,419,000 3,935,625 Wetland management activitiesLGDP 10,607,000 14,607,000 Funds’ activities were mainly Environment
mainstreaming and Environment Audit workshopsheld at District level for Sub county technical andpolitical leaders
Equalization Grant 7,900,000 8,300,000 Activities implemented were School environmentEducation, DSOER preparation and Study tour for theDEC and Environment Committee
Local Revenue 1,352,000 1,352,000 Office operational costs and allowances
UWA - 9,000,000 3 Sub Counties of Kilundo, Bukimbiri andNyabwishenya bordering BINP benefited fromrevenue sharing of gate fees each getting 3,000,000
3.4 LOCAL INITIATIVESThe District is a hard to reach area but home to half of the endangered mountain gorillas in the world.In view of this most local initiatives have developed targeting the gorilla as the main product henceoptimistic of high numbers of tourists. Most initiatives are in ecotourism and the most popular is NCDF(Nkuringo Conservation Development Foundation) that currently in partnership with Uganda SafarisLimted is operating an ecolodge in Nteko- Nyabwishenya Subcounty.
3.5 PUBLIC PARTICIPATIONOne of the NEMP major objectives involves ensuring individual and community participation onenvironmental improvement activities, emphasizing the need for public participation.This is so because participation promotes ownership and confidence and leads to development of realistic plans that target the needs of stakeholders. It also helps in ensuring implementation andsustainability.

8/3/2019 Kisoro District The State of Environment Report
http://slidepdf.com/reader/full/kisoro-district-the-state-of-environment-report 64/75
64
Community participation in demarcating 200metre protection zone on lake Mutandafollowing the heavy degradation of Chotsa bay.
Kisoro District greatly encourages public participation in all sectors at all levels. This is alwaysreflected in the annual work plans in which community meetings on environment management areplanned and subsequently implemented.
3.6 ENVIRONMENT INFORMATION AND EDUCATIONRecognizing the environmental and economic benefits of natural resources means acknowledging howpeople destroy the earth’s biological richness.People usually make decisions and take action based on information, perception and alternatives.Effective use of information and education can help conservation managers apply their art and science.People are easily persuaded, when they understand their own long-term interest and they can adopt. Tomost people, social systems, cultures, economic, gender roles and daily concerns are more significantthan the rest of the natural world.The NES 1995 allows any community member to have access to information about the environment. Italso mandates the production of a DSOER by the DEC, production of DEAP every three years throughconsultation of all stakeholders.
Districts are also mandated to produce monthly briefs, quarterly reports, and annual reports onenvironment activities to the principal agency, NEMA for purposes of feeding into the nationalenvironment information database.

8/3/2019 Kisoro District The State of Environment Report
http://slidepdf.com/reader/full/kisoro-district-the-state-of-environment-report 65/75
65
Through support from NEMA the District Environment Department staff has received training inInformation education and communication packaging but this has not benefited the communities due tolack of resources to produce the materials. In addition under the Sida program at Makerere Universityon Environment Journalism and Communication, the District Environment Officer attended a twoweeks training in Environment Communication but the skills remain unimparted due to lack of resources.
3.7 ENVIRONMENT EDUCATION AND PUBLIC AWARENESSEnvironment education in the district includes formal and non- formal that is, in or out of school.Non formal environment education has been conducted through use of the media; celebration of publicfunctions, workshops, community meetings and seminars.Kisoro district has trained 14 Sub Counties on tree planting, celebrations to mark world environmentday have been marked 6times since the inception of the department of environment in the district. Thecelebrations are rotated in different sub counties to ensure wide coverage on environment awareness.
Radio talk shows on environment management have been aired on Local radio station in the region inbid to increase awareness.
Further more on Environment Education, Kisoro district has registered tremendous achievements since2006 with support from Wildlife Clubs of Uganda (WCU) which has so far registered 75 clubs in thedistrict with 2750 pupils (1362 males and 1388 females), 183 teachers. The club memberships are in 16secondary schools, 55 primary schools, 4 adult clubs and 4 associate membersThe gorilla organization in partnership with WCU has done a commendable job through support to theclubs such as excursions to the National parks, workshops, film shows, drawing and essaycompetitions, music dance and drama and environment conservation talks.
UWA through its department of community conservation is also involved in formal and non-formalenvironment education activities especially in those parishes surrounding the park.
3.8 TRANS BOUNDARY ENVIRONMENT MANAGEMENTKisoro district being located at the boarder with Rwanda and Congo shares resources with the twocountries – Mgahinga Gorilla National Park. It also shares Bwindi National Park with Kanungu andKabale district and Echuya forest reserve with Kabale district. But the challenge is that naturalresources and wildlife know no boundaries.Also for purposes of conservation they cannot be separated according to administrative andinternational boundaries because they face the same threats especially from human populationactivities.Kisoro District being in the Albertine rift valley and being a home to several endemic species most
spectacular being the Mountain gorilla has attracted the international Community
Table 3.4 Efforts in Trans boundary management Effort Purpose Collaborator
Heartland site conservation Looks at management of BINP, Virunga,Echuya region totality
IGCP/ AWF
Great apes action plan Management of all great apes in Uganda IGCPBINP AND MGNP management plan Day to day management of the parks UWAEchuya forest management plan NFAEcological Monitoring and research, Socio economic and scientific reports, data ITFC

8/3/2019 Kisoro District The State of Environment Report
http://slidepdf.com/reader/full/kisoro-district-the-state-of-environment-report 66/75
66
biodiversity assessment and inventories collectionStrategic frame work Coordination of all organizations working
in the regionARCOS
Community Based Natural ResourcesManagement
Integrated NRM AWF
Community Based Tourism Increased tourism benefits for communities AWF
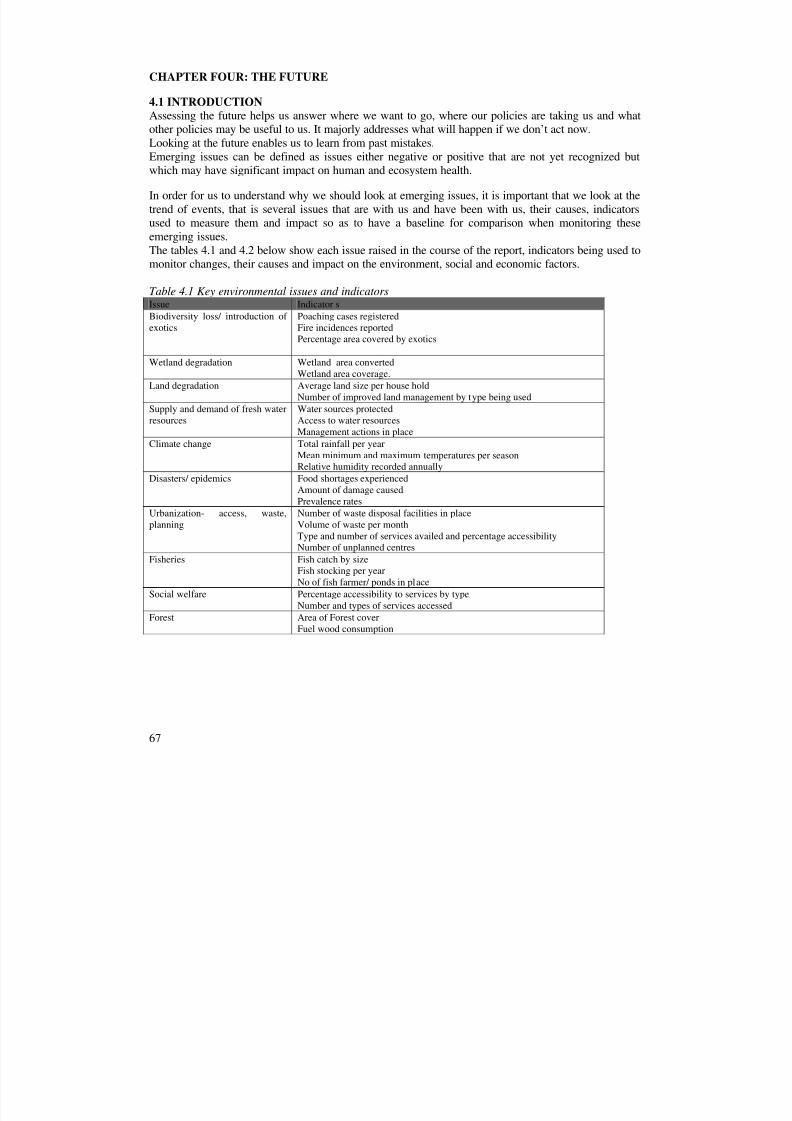
8/3/2019 Kisoro District The State of Environment Report
http://slidepdf.com/reader/full/kisoro-district-the-state-of-environment-report 67/75
67
CHAPTER FOUR: THE FUTURE
4.1 INTRODUCTIONAssessing the future helps us answer where we want to go, where our policies are taking us and whatother policies may be useful to us. It majorly addresses what will happen if we don’t act now.Looking at the future enables us to learn from past mistakes.Emerging issues can be defined as issues either negative or positive that are not yet recognized butwhich may have significant impact on human and ecosystem health.
In order for us to understand why we should look at emerging issues, it is important that we look at thetrend of events, that is several issues that are with us and have been with us, their causes, indicatorsused to measure them and impact so as to have a baseline for comparison when monitoring theseemerging issues.The tables 4.1 and 4.2 below show each issue raised in the course of the report, indicators being used tomonitor changes, their causes and impact on the environment, social and economic factors.
Table 4.1 Key environmental issues and indicators
Issue Indicator sBiodiversity loss/ introduction of exotics
Poaching cases registeredFire incidences reportedPercentage area covered by exotics
Wetland degradation Wetland area convertedWetland area coverage.
Land degradation Average land size per house holdNumber of improved land management by type being used
Supply and demand of fresh waterresources
Water sources protectedAccess to water resourcesManagement actions in place
Climate change Total rainfall per year
Mean minimum and maximum temperatures per seasonRelative humidity recorded annually
Disasters/ epidemics Food shortages experiencedAmount of damage causedPrevalence rates
Urbanization- access, waste,planning
Number of waste disposal facilities in placeVolume of waste per monthType and number of services availed and percentage accessibilityNumber of unplanned centres
Fisheries Fish catch by sizeFish stocking per yearNo of fish farmer/ ponds in place
Social welfare Percentage accessibility to services by type
Number and types of services accessedForest Area of Forest cover
Fuel wood consumption

8/3/2019 Kisoro District The State of Environment Report
http://slidepdf.com/reader/full/kisoro-district-the-state-of-environment-report 68/75
68
T able. 4.2. Causes and impacts of environmental issuesIssue Cause Impact and ResponsesBiodiversity loss/ introduction of exotics
Population pressure, land foragriculture, over utilization of resources in one area., uncontrolledfires. Agricultural activities, timber
extraction, mining Predation by otters
National protection and considerationIncreased awarenessIncreased sharing of benefits from resourcesControlled extraction
Wetland degradation Search for more agricultural landFailure to enforce wetland policy, lawsand regulations
Community initiatives through managementplanningIncreased awareness campaigns andenforcement of laws and regulations
Land degradation Bush burning, increased population,land fragmentation, over cultivation.
Increased NGOs/ CBOs activity
Supply and demand of fresh water resources
Unprotected water sources, waterpollution and contamination, silting of water sources, poor water harvestingtechniques
Increase funding for waterIncreased access to clean waterReduced incidences of water borne diseases
Disasters/ epidemics Change in seasons- reduced rainfall ,human activitiesSexual behavior, culture , lack of awareness
Reduced vulnerability to disasterReduction in man made disasters
Urbanization- access,waste, planning
Poverty low employment opportunities,lack of proper planning
Increased / proper management of wasteIncreased population leaving in urban
entersIncreased access to proper sanitation andwater
Fisheries Wetland degradation, silting, weather,uncontrolled fishing, poor fishinggear/facilities, irregular restocking andunder stocking., predators
Fish farming.Regular restockingBetter/ sustainable management that isparticipatory
Social welfare High population pressureHigh Poverty levelsTerrain
Increased disease incidenceHigh drop out ratesHigh illiteracy levels
Forest High demand for timber and fuel wood,bush burning,, increased population,land fragmentation, agriculture,reduced soil fertility, unconducivepolicy environment
Climate changePrivate wood lots/ on farm provision of resources.

8/3/2019 Kisoro District The State of Environment Report
http://slidepdf.com/reader/full/kisoro-district-the-state-of-environment-report 69/75
69
4.2 EMERGING ISSUES AND PRACTICESAn emerging issue is defined as an issue positive or negative that is not yet generally recognized butwhich may have significant impact on human and ecosystem health (SOER Guidelines 2003).In Kisoro district several issues have been identified as emerging. The driving forces that cause theseissues need to be closely monitored so as to cause timely responses to avert the likely negative impacts.
These include;Contamination of under ground water sources due to increased use of chemical fertilizer. This ispossible because of the promotion of commercial agriculture in the district. It is evident that fertilizer
use is on the increase especially in the growing, Irish potato industry in the district. Several farmers inthe areas of Nyarusiza and Muramba, Nyakabande sub counties are surviving on the Irish potatoenterprise, this has been so because of the insatiable market in Kampala city therefore in order to meetthe demands of the market, Irish potatoes are grown all year round, with inorganic fertilizers to increaseproduction on unfallowed soils. More so some of these sub counties lie at the edge of the MgahingaNational Park thought to be a source for the Chuho under ground water springs, which serves towncouncil and its surrounding parishes. Also the massive growing of Irish potato cultivation and othercrops in the Gitundwe swamp, a major permanent swamp of lake Mutanda, is likely to affect theecology of the lake and other connected water bodies in the long term thus affecting biodiversity in theregion.Further more in the process of gathering information for the District State of Environment Report, itwas noticed that information documentation in the district is not in order. Almost all departments hadscanty documented information especially statistics. Also district policy to guide development islacking; it is necessary that information be documented for purposes of seeing the impact our deliberateactions are having the desired effect. Without information it is difficult to have a base line forcomparison and therefore complicates monitoring of emerging issues.The very high demand for firewood has caused an increase in private eucalyptus wood lots. This is aserious issue that needs to be looked into especially with our soils being heavily degraded, do notrequire a tree specie that does not improve on the soils characteristics but rather one which benefits thesoil through improving fertility and structure plus added benefits to community’s through soil erosioncontrol, firewood, poles and timber. Eucalyptus is known to change greatly the soil composition andnot improve its state. Especially with the steep terrain in Kisoro.Lastly it has also been noted that to steer community initiatives and have community participation, it isbecoming evident that there is a culture where community participants demand payment in order tocause positive change. This culture has dug deep even amongst the leaders and yet, environment hasbeen identified as the major source of people’s livelihoods and if not looked at together withdevelopment, poverty levels are likely to remain high. This culture is likely to have a negative effect onthe different programs brought to communities for purposes of empowerment and this is clearly statedin the three conditions of the PEAP, where communityparticipation for development is a prerequisite.
As time passes by and nothing is done, while the population increases and the share of resources usedfor survival decreases, conflicts will arise and the situation will get worse. This is evident withrate of land degradation caused by soil erosion, that has reduced the fertility of our soils and hencereduced production, yet replacing topsoil takes centuries. This has been worsened by the cultivation infragile areas to try to increase production because of land unavailability.

8/3/2019 Kisoro District The State of Environment Report
http://slidepdf.com/reader/full/kisoro-district-the-state-of-environment-report 70/75
70
The lack of tree resources is also very evident in Kisoro, with the only remaining resources being thosein the protected areas. The majority of the community cannot afford to have private wood lots due tothe land scarcity problem hence they seek to partake in the use of resources from protected areas.Further more the district is endowed with four lakes, but all are unproductive. Extensive wetlanddegradation that has likely caused a change in the ecology of the lakes is the cause of the very low
productivity. This has also magnified the problem of under nourishment that has led to majority of ourpeople being stunted due to lack of a protein source that is cheap and readily available.The certainty of climatic conditions is a thing of the past. This is greatly affecting the livelihoods of ourpeople who depend on agriculture. Where are we heading?
Despite the current environmental problems and other emerging issues, there have been successesincluding;
Increasing awareness by the populace on environmental concerns, Increased participation in environmental issues- several CBOs are involved in environment
management activities, environment action planning that uses bottom up approach. Increased external participation and help for environment management. That is NGO
participation in environment management. Well-established and functional department of environment at district level. Increased funding to department for activities on environment management. Increased accessibility to clean water by the populace Improved sanitation and access to health services. Environment integration at sector level is beginning to take shape .
4.3 RECOMMENDATIONS FOR ACTION
It is important that the district identifies areas in the national policy that applies greatly to our situation.This will help in the gathering of information for purposes of formulating a district specific policy to
guide sustainable development.An information system should be set up for;Collecting and processing sector specific information for purposes of quantified reporting andmonitoring of trends. For example monitoring the trends in the water quality and composition over timeof our resources to avoid unwanted genetic modification in plants and animals that may lead to reducedbiodiversity and negative trends in agricultural production.
Increase awareness of the populace by availing environment information at the grass roots that is easilyunderstood specifically making popular versions and translating into local languages and pictorialversions for the illiterate.
Formation of a database for environmental information is very critical for purposes of having base lineinformation for which emerging issues can be compared.
A campaign to change attitudes of the people on the values of agroforestry trees as compared tomultipurpose trees should be put in place.

8/3/2019 Kisoro District The State of Environment Report
http://slidepdf.com/reader/full/kisoro-district-the-state-of-environment-report 71/75
71
APPENDIX
DEFINITION OF WETLAND CLASSES
Class oneWetlands of such importance that require immediate and effective management and protection fromongoing development and degradation.These provide at least one essential good or service or other attributes for which there is either noalternative source or supply; or the alternative is not practical or economically viable.
Class twoThese have the same characteristics as class one but are not currently under development ordegradation but still require a high level of protection to avert future problems.
Class threeThese provide the same resources as one and two but resources are available economically fromalternative sources, though these maybe less economically and of poorer quality.They are defined as critical because they are subject to ongoing degradation, which jeopardizes thecontinuation of their attributes or existence.

8/3/2019 Kisoro District The State of Environment Report
http://slidepdf.com/reader/full/kisoro-district-the-state-of-environment-report 72/75
72
Table 5.1. Other actors NGOs involved in environment management Name Project area Project ActivitiesIGCP– AWF Muramba
NyarusizaKirundoNyabwishenya
Trans boundary management of National parks Regional conservation of thegorilla parks
Livelihood activitiesMGCF Muramba
NyarusizaKirundoNyabwishenya
Formal environment educationGorilla hygiene health
BMCT Nyabwishenya,Muramba,Nyarusiza,Kirundo
InfrastructureFuel saving techniques
Agroforestry Environment education
Africa 2000 network KanabaMurora
Sustainable management forthe conservation of Echuyaforest reserve
Agro forestryOn farm woodlots
Income generating activitiesNature Uganda Kanaba Murora Enhancing livelihoods of
local communitiesdependant on Echuya forest
Environment education and public awareness Income generating activities-tourismOn farm forestry/ agro forestry
The GorillaOrganisation
MurambaNyarusiza
Enhancing livelihoods of local communitiessurrounding MgahingaGorilla National Park
Environment education and public awareness Energy saving techniquesTree planting
Source : Office records 2007
8/3/2019 Kisoro District The State of Environment Report
http://slidepdf.com/reader/full/kisoro-district-the-state-of-environment-report 73/75
73
REFERENCES ARD- COBS 2000. Training report for environment education and public awareness 2000. Kisoro,Uganda.
Babaasa D. Bitariho R And Kasangaki A 1999. Fire Incidences In Bwindi Impenetrable National Park,
SW Uganda, June –August 1999. Unpublished Report, Institute Of Forestry Conservation- EcologicalMonitoring Program.
Byaruhanga A. Kasoma P And Pomeroy 2001 Important Birds Areas In Uganda. East Africa NaturalHistory Society, Kampala, Uganda.
Byaruhanga A. Kasoma P. Pomeroy 2001, Important Bird Areas In Uganda, East Africa NationalHistory Society, Kampala Uganda.
Bygot., D., and Hanby, j.,1998. A guide book to MGNP and BINP. UWA.
Department Of Water. Quarterly Reports. Kisoro District Local Government. Kisoro Uganda.
Department Of Environment. Sector Specific Reports 2003. Kisoro District Local Government. Kisoro,Uganda.
Department Of Production. Sub County Quarterly Reports. Kisoro District Local Government. Kisoro,Uganda.
Directorate Of Health And Environment. Health Sector Annual Reports 2003. Kisoro District LocalGovernment.
Directorate Of Production. Quarterly Reports. Kisoro District Local Government.
Enviro Conserve Bulletin June 2004.
Forest Department 1996. Forest Nature Conservation Master Plan, Kampala Uganda.
Forestry Inspection Division 2004. National Biomass Study 1997. Ministry Of Natural Resources.
Fisheries Department. Annual Report. 2006 Kisoro District Local Government. Kisoro, Uganda.
Forest Department 1996. Echuya and Mafuga Forest Reserves Biodiversity Report Kampala, Uganda.
Kanongo, M., 1990. Draft report for baseline data, report for CARE- development throughconservation DTC project. Phase 1 Dec 1989- Feb. 1990. DTC project ikumba, Rukungiri, Uganda.
Kisoro Town Water And Sanitation. Reports. Kisoro District Local Government. Kisoro, Uganda

8/3/2019 Kisoro District The State of Environment Report
http://slidepdf.com/reader/full/kisoro-district-the-state-of-environment-report 74/75
74
Kisoro Town Council - Three-Year Development Plan 2007-2010
Kisoro District Local Government. Tourism Development Plan 2004. Kisoro, Uganda.
Kisoro District Local Government. District Environment Action Plan 2002. Kisoro, Uganda
MGNP and BINP General Management Plan 2003. Uganda Wildlife Authority. Kampala, Uganda.
Ministry Of Finance, Planning And Economic Development 2000, Uganda Participatory PovertyAssessment Process, Kisoro District Report.
Ministry Of National Resources 1995 The National Environment Action Plan Kampala, Uganda.
Namara A. Markye G., and McNeilage A., 2000 people and Bwindi forest. A historical account givenby local community members. Mbarara Uganda.
National Environment Management Authority, Guidelines for Production of DSOER. 2001. Kampala,Uganda.
National Environment Management Authority. 1995 b. National Environment Management Policy1995. Kampala Uganda.
National Environment Management Authority. 1997. Environment Impact Assessment guidelines1997. Kampala, Uganda.
National Environment Management Authority. 2003. Manual for CBOs and NGOs In Uganda.Kampala, Uganda.
National Environment Action Plan Secretariat 1994. Guidelines For Environment Management AtLocal Government Level: Decentralizing Natural Resource Management In Uganda. Ministry Of Natural Resources Kampala, Uganda.
National Environment Plan Secretariat. 1995b. National Environment Action Plan. Ministry of NaturalResources Kampala, Uganda.
NEMA. 2007. State Of Environment Report For Uganda 2006/2007
NEMA 1997. District State Of Environment Report Kisoro Uganda.
National Wetlands Programme 1999. District Wetlands Inventory Report Kisoro Uganda.
MOFPED 2004/2005. Poverty Eradication Action Plan 2004/2005PMA Secretariat. Poverty Eradication Action Plan 2000. Ministry of Finance Economic Planning andDevelopment.

8/3/2019 Kisoro District The State of Environment Report
http://slidepdf.com/reader/full/kisoro-district-the-state-of-environment-report 75/75
Purseglove, J.W 1946. Land use in the over populated areas of Kabale, Kigezi district, Uganda.East African journal, July 1946.
Wetlands Inspection Division 2001, Wetland Sector Strategic Plan 2001 – 2010, Kampala, Uganda.
Uganda Bureau of Statistics web site www.ubos.org 2007
Uganda National Bureau of Statistics 2002, Population and Housing census. Ministry of FinanceEconomic Planning and Development. 2002, Kampala Uganda
Uganda Participatory Poverty Assessment Report for Kisoro 2000. Ministry of Finance Planning andEconomic Development. Kampala, Uganda
UWA 2006 Uganda Wildlife Authority Annual Report 2005-2006.
UWA 2001, Bwindi Impenetrable National Park/Mgahinga Gorilla National Park, GeneralManagement Plan July 2001 – June 20 11


