+ All Categories
Home > Documents > Kissimmee Visitor Profile Dashboard · our assignment or by the undersigned) ... random sample 506...

Kissimmee Visitor Profile Dashboard · our assignment or by the undersigned) ... random sample 506...

Date post: 12-Jun-2018
Category:
Upload: hahanh
View: 214 times
Download: 0 times
Share this document with a friend
16
RESEARCH DATA SERVICES, INC. 777 SOUTH HARBOUR ISLAND BOULEVARD SUITE 260 TAMPA, FLORIDA 33602 TEL (813) 254-2975 FAX (813) 223-2986 Kissimmee Visitor Profile Dashboard August 2017 Prepared for: Experience Kissimmee Prepared by: Research Data Services, Inc. www.ResearchDataLLC.com October 2017
Transcript

RESEARCH DATA SERVICES, INC. 777 SOUTH HARBOUR ISLAND BOULEVARD • SUITE 260

TAMPA, FLORIDA 33602 TEL (813) 254-2975 • FAX (813) 223-2986

Kissimmee Visitor Profile Dashboard August 2017

Prepared for: Experience Kissimmee

Prepared by: Research Data Services, Inc. www.ResearchDataLLC.com

October 2017

Experience Kissimmee Visitor Profile August 2017

i © Copyright 2017. | PCD-1 – 10.18.17

Certification and General Limiting Conditions

The following report has been prepared for Experience Kissimmee at the request of Mr. DT Minich, President/CEO. Research Data Services, Inc., hereby certifies that, except as otherwise noted in the report:

1. We have no present or contemplated future interest in the project that is the subject of this study.

2. We have no personal interest or bias with respect to the subject matter of

this report or the parties involved.

3. This report is based on estimates, assumptions, and other information

developed from our research of the market, our knowledge of the industry, and our discussions with you and your representatives, during which we were provided with certain information. The sources of information and the bases of estimates and assumptions are stated herein. To the best of our knowledge and belief, the statements of fact contained in this report, upon which analyses, opinions, and conclusions expressed herein are based, are true and correct.

4. This report sets forth all of the limiting conditions (imposed by the terms of

our assignment or by the undersigned) affecting the analyses, opinions, and conclusions contained in this report.

5. Because circumstances may change and unanticipated events may occur

subsequent to the date of this report, the reader must evaluate the assumptions and rationale of this report in light of the circumstances then prevailing. The terms of this engagement are such that we have no obligation to revise this report or the included projections to reflect events or conditions which occur subsequent to the completion of our fieldwork.

October 18, 2017 Walter J. Klages, Ph.D.

President Date

Experience Kissimmee Visitor Profile August 2017

ii © Copyright 2017. | PCD-1 – 10.18.17

Executive Summary: August 2017

1. Methodology: Experience Kissimmee’s August 2017 visitor profile was developed from a random sample of 506 surveys, completed with Osceola County commercial lodging visitors.

2. This month, some 532,700 visitors stayed in Kissimmee’s commercial lodgings, yielding an estimated $404,110,100 of economic impact to the County. Key industry metrics are as follows:

August 2016 2017 % ∆ Occupancy 68.5% 71.5% +4.4% ADR $96.31 $97.61 +1.3% RevPAR $65.97 $69.79 +5.8%

3. In August, six out of every ten lodging managers (61.8%) report their property’s three month forward reservation levels as “up” when compared to this time last year (2016: 40.6%):

% of Properties (August) Reporting Reservations: 2016 2017 Up 40.6% 61.8% Same 31.4 20.1 Down 22.2 18.1

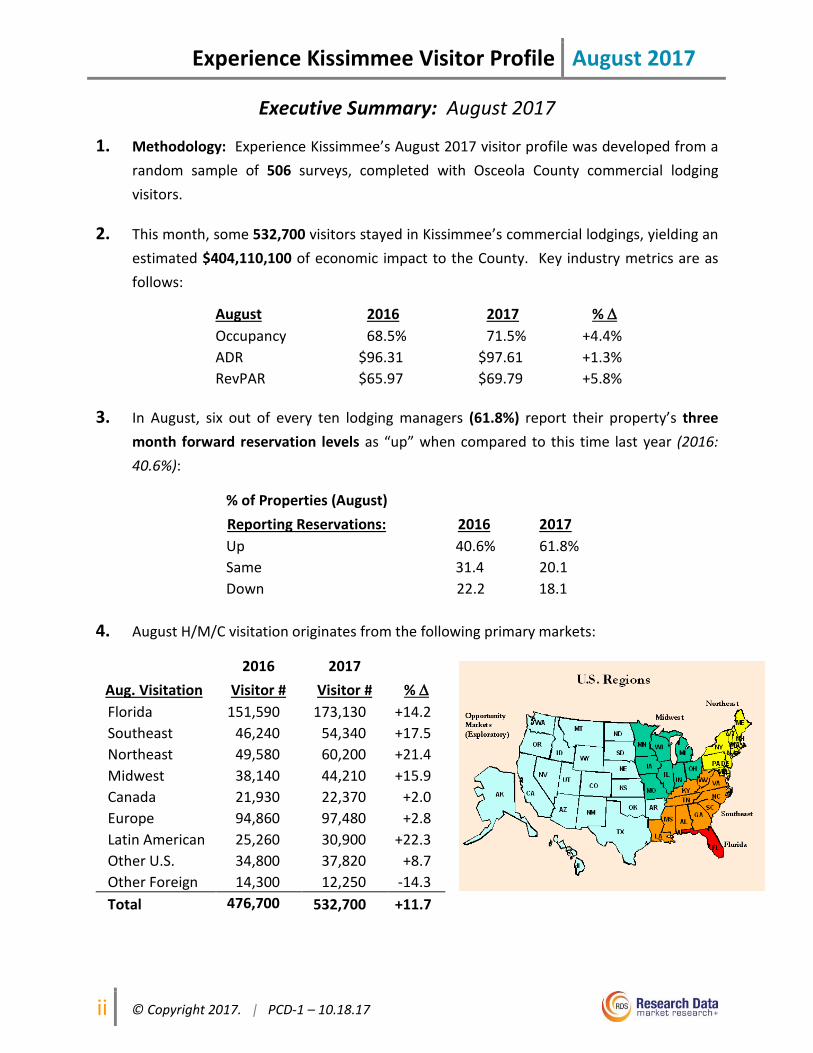
4. August H/M/C visitation originates from the following primary markets:

2016 2017 Aug. Visitation Visitor # Visitor # % ∆ Florida 151,590 173,130 +14.2 Southeast 46,240 54,340 +17.5 Northeast 49,580 60,200 +21.4 Midwest 38,140 44,210 +15.9 Canada 21,930 22,370 +2.0 Europe 94,860 97,480 +2.8 Latin American 25,260 30,900 +22.3 Other U.S. 34,800 37,820 +8.7 Other Foreign 14,300 12,250 -14.3 Total 476,700 532,700 +11.7

Experience Kissimmee Visitor Profile August 2017

iii © Copyright 2017. | PCD-1 – 10.18.17

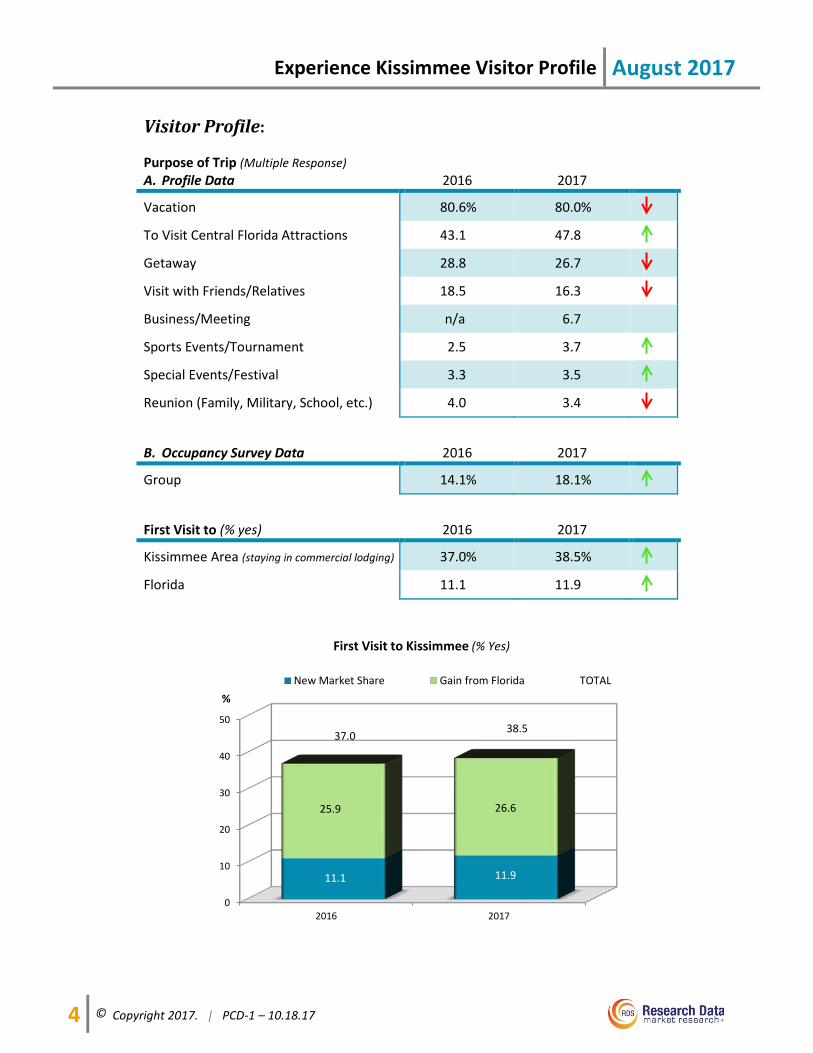
5. Two in five of Kissimmee’s August commercial lodging visitors (38.5%) are staying in Osceola County for the first time. Nearly two thirds of these visitors (62.3%) report having previously stayed elsewhere in the greater Orlando area. Reasons cited for choosing Kissimmee for this trip include its convenient, central location, superior value for the money, non-traditional lodging options, variety of entertainment, and quieter, more relaxing atmosphere. Recommendations, business/meetings, special/sporting events, travel agents, and the chance to explore a new area are also mentioned as reasons for choosing to stay in the Kissimmee area on this trip.

% Staying First Time in Kissimmee Feeder Market (Base: Total Visitors from Market) Florida 23.2% U.S. Out-of-State 41.2 Europe 43.5 Latin America 62.1 6. One of every three of Kissimmee’s first time overnight visitors (30.9%) are also in Florida

for the first time. First time visitor origins are as follows:

% First Time in Florida Feeder Market (Base: Total Visitors from Market) U.S. Out-of-State 7.4% Europe 21.7 Latin America 43.3

7. August repeat visitors report an average of 4.7 visits:

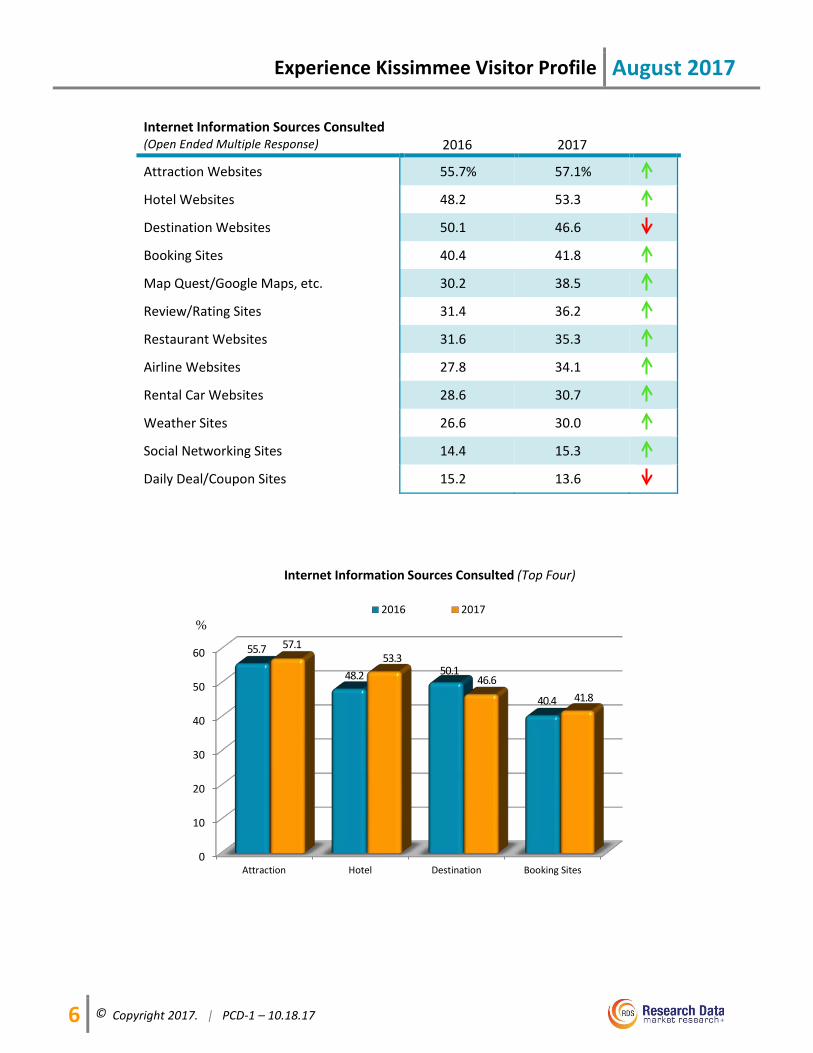
Number of Repeat Feeder Market Visits to Kissimmee Florida 5.7 U.S. Out-of-State 4.2 Europe 4.1 Latin America 2.5 8. August visitors primarily use attraction (57.1%), hotel (53.3%), destination (46.6%), and

booking websites (41.8%) to get information and plan their Kissimmee trip.

Experience Kissimmee Visitor Profile August 2017

iv © Copyright 2017. | PCD-1 – 10.18.17

9. In August 2017, some 50.6% of visitors lodged in vacation homes/condos, while 49.0% selected hotels/motels.

10. This August, the majority of visitors (92.4%) make advance reservations for their lodging. 11. Nearly half of Kissimmee’s August 2017 overnight lodging visitors (49.1%) fly to reach the

destination. Some 45.5% drive a personal car/RV.

12. Visitors stay an average of 6.1 nights in the Kissimmee area.

Visitors’ length of stay by origin are as follows:

Feeder Market August 2017 LOS Florida 3.5 nights Southeast 5.4 nights Northeast 6.1 nights Midwest 5.6 nights Canada 7.7 nights Europe 9.9 nights Latin America 7.9 nights Other U.S. 5.4 nights 13. August visitors primarily enjoy attractions/theme parks (80.0%), dining out (74.5%),

shopping (59.2%), and relaxing (57.0%). 14. Two thirds of August visitors frequent the Disney parks (64.4%), with 46.6% visiting

Universal and 24.3% going to SeaWorld. Visitors also enjoy Disney Springs (44.3%), City Walk (25.7%), and Fun Spot/Old Town (22.7%).

25.1

34.128.0

12.7

Length of Stay in Kissimmee

1 - 3 nights

4 - 6 nights

7 - 9 nights

10+ nights

Experience Kissimmee Visitor Profile August 2017

v © Copyright 2017. | PCD-1 – 10.18.17

15. When describing their experiences in Kissimmee, August visitors focus on the wide variety

of fun activities, convenience, great accommodations, and friendly service.

16. Nine out of ten visitors (89.1%) plan a return visit to the Kissimmee area.

17. The average age of August 2017 visitors is 46.2 years. These visitors command a median household income of $111,440.

Experience Kissimmee Visitor Profile August 2017

* © Copyright 2017. | PCD-1 – 10.18.17

Experience Kissimmee: August 2017 Visitor Profile

Experience Kissimmee Visitor Profile August 2017

1 © Copyright 2017. | PCD-1 – 10.18.17

Calendar Year to Date (January – August) August Estimated Overnight Visitor Statistics

2016

2017

% Δ

’16/’17

2016

2017 % Δ

’16/’17

H/M/C* Visitors(#) 4,352,000 4,547,900 +4.5 476,700 532,700 +11.7 Visitors in Unpaid Lodgings 1,264,700 1,304,000 +3.1 126,100 132,100 +4.8 Total Overnight Visitors 5,616,700 5,851,900 +4.2 602,800 664,800 +10.3 Direct Exp. ($) of H/M/C* Visitors $2,333,935,200 $2,508,580,800 +7.5 $241,195,900 $275,805,400 +14.3

Direct Exp. ($) of Visitors in Unpaid Lodgings $495,093,400 $524,679,600 +6.0 $51,260,800 $54,762,100 +6.8

Total Overnight Visitor Direct Exp. ($) $2,829,028,600 $3,033,260,400 +7.2 $292,456,700 $330,567,500 +13.0

Eco. Impact. ($) of H/M/C* Visitors $3,419,681,800 $3,675,572,700 +7.5 $353,400,200 $404,110,100 +14.3

Eco. Impact ($) of Visitors in Unpaid Lodgings $725,410,900 $768,760,500 +6.0 $75,107,300 $80,237,400 +6.8

Total Overnight Visitor Eco. Impact ($)** $4,145,092,700 $4,444,333,200 +7.2 $428,507,500 $484,347,500 +13.0

H/M/C* Room Nights 5,489,000 5,708,500 +4.0 607,700 645,700 +6.3 * Visitors staying in commercial lodging subject to the resort tax (hotel/motel/condo, etc.) ** U.S. Bureau of Economic Analysis, RIMS II Multiplier (k: 1.4652)

Calendar Year to Date (January – August) August

Note: 2016-17 Osceola Inventory Growth -- 2016: 44,868; 2017: 45,772 (+2.0%) Source: Florida Department of Business & Professional Regulation (DBPR)

Lodging Statistics

2016

2017

% Δ ’16/’17

2016

2017

% Δ ’16/’17

Occupancy 76.3% 77.5% +1.6 68.5% 71.5% +4.4

Room Rates $104.60 $107.25 +2.5 $96.31 $97.61 +1.3

RevPAR $80.38 $83.69 +4.1 $65.97 $69.79 +5.8

$100,000,000

$150,000,000

$200,000,000

$250,000,000

$300,000,000

$350,000,000

$400,000,000

$450,000,000

$500,000,000

August '16 August '17

292,456,700 330,567,500

136,050,800153,780,000

$428,507,500

$484,347,500

August 2017 Overnight (Paid & Unpaid) Visitor Economic Impact

Direct Exp. Indirect/Induced Total Eco. Impact

Experience Kissimmee Visitor Profile August 2017

2 © Copyright 2017. | PCD-1 – 10.18.17

August 2017 Visitor Origin Markets

Calendar Year to Date (January – August) August

Visitor Origins (H/M/C) 2016 2017

% Δ ’16/’17

2016 Share of Mkt (%)

2016 # of

Visitors

2017 Share of Mkt (%)

2017 # of

Visitors

% Δ ’16/’17

Florida 1,260,330 1,366,060 +8.4 31.8% 151,590 32.5% 173,130 +14.2

Southeast 461,410 491,450 +6.5 9.7 46,240 10.2 54,340 +17.5

Northeast 573,500 630,580 +10.0 10.4 49,580 11.3 60,200 +21.4

Midwest 512,440 515,530 +0.6 8.0 38,140 8.3 44,210 +15.9

Canada 283,420 290,360 +2.4 4.6 21,930 4.2 22,370 +2.0

Europe 614,600 590,310 -4.0 19.9 94,860 18.3 97,480 +2.8

Latin American 222,300 241,890 +8.8 5.3 25,260 5.8 30,900 +22.3

Other US 327,540 332,380 +1.5 7.3 34,800 7.1 37,820 +8.7

Other Foreign 96,460 89,340 -7.4 3.0 14,300 2.3 12,250 -14.3

Total 4,352,000 4,547,900 +4.5 100.0 476,700 100.0 532,700 +11.7

173,130

54,340

60,20044,210

22,370

97,480

30,90037,820

12,250

August 2017 Visitor Origins

Florida

Southeast

Northeast

Midwest

Canada

Europe

Latin American

Other US

Other Foreign

Experience Kissimmee Visitor Profile August 2017

3 © Copyright 2017. | PCD-1 – 10.18.17

Visitor Profile Metrics:

Length of Stay (Nights) 2016 2017

Away from Home 8.6 8.2 In the Kissimmee Area 6.1 6.1

Party Size 2016 2017

Number of People 4.2 4.4

Party Composition 2016 2017

% of Parties Traveling with Children 48.5% 53.1% % of Parties Traveling with Seniors 27.0 25.4

Kissimmee Area Base Budget 2016 2017

Per Person/Stay $505.97 $517.75 Per Person/Night 82.95 84.88 Total Party/Trip $2,125.06 $2,278.09

Transportation (Multiple Response) (Percentaged to the Base of All Respondents)

2016

2017

Plane 47.6% 49.1% Personal Car 46.0 45.5 Rental Car 26.5 28.8

Airport Deplaned (Base: Flew) 2016 2017

Orlando International 84.2% 86.9% Miami International 5.9 5.5 Sanford 4.8 3.2 Tampa International 2.3 1.8

Experience Kissimmee Visitor Profile August 2017

4 © Copyright 2017. | PCD-1 – 10.18.17

Visitor Profile:

Purpose of Trip (Multiple Response) A. Profile Data

2016

2017

Vacation 80.6% 80.0% To Visit Central Florida Attractions 43.1 47.8 Getaway 28.8 26.7 Visit with Friends/Relatives 18.5 16.3 Business/Meeting n/a 6.7

Sports Events/Tournament 2.5 3.7 Special Events/Festival 3.3 3.5 Reunion (Family, Military, School, etc.) 4.0 3.4

B. Occupancy Survey Data 2016 2017

Group 14.1% 18.1%

First Visit to (% yes) 2016 2017

Kissimmee Area (staying in commercial lodging) 37.0% 38.5% Florida 11.1 11.9

0

10

20

30

40

50

2016 2017

11.1 11.9

25.9 26.6

37.0 38.5

%

First Visit to Kissimmee (% Yes)

New Market Share Gain from Florida TOTAL

Experience Kissimmee Visitor Profile August 2017

5 © Copyright 2017. | PCD-1 – 10.18.17

Information Most Helpful to Visit (Open Ended Multiple Response)

2016

2017

Internet 87.1% 88.4% Maps/GPS 64.2 63.0 Hotel/Accommodations 25.0 30.1 Previous Visit 25.1 29.6 Mobile App 22.4 24.8 Print Media 22.4 21.6 Recommendation 19.1 21.0 Experience Kissimmee 19.2 19.5 Travel Professional 15.0 15.6 Family 13.3 11.2 AAA 10.6 10.8

0

10

20

30

40

50

60

70

80

90

100

Internet Maps/GPS Hotel Accomodations Previous Visit

87.1

64.2

25.0 25.1

88.4

63.0

30.1 29.6

Information Most Helpful To Visit (Top Four)

2016 2017

%

Experience Kissimmee Visitor Profile August 2017

6 © Copyright 2017. | PCD-1 – 10.18.17

Internet Information Sources Consulted (Open Ended Multiple Response)

2016

2017

Attraction Websites 55.7% 57.1% Hotel Websites 48.2 53.3 Destination Websites 50.1 46.6 Booking Sites 40.4 41.8 Map Quest/Google Maps, etc. 30.2 38.5 Review/Rating Sites 31.4 36.2 Restaurant Websites 31.6 35.3 Airline Websites 27.8 34.1 Rental Car Websites 28.6 30.7 Weather Sites 26.6 30.0 Social Networking Sites 14.4 15.3 Daily Deal/Coupon Sites 15.2 13.6

0

10

20

30

40

50

60

Attraction Hotel Destination Booking Sites

55.7

48.2 50.1

40.4

57.153.3

46.641.8

Internet Information Sources Consulted (Top Four)

2016 2017%

Experience Kissimmee Visitor Profile August 2017

7 © Copyright 2017. | PCD-1 – 10.18.17

Made Lodging Reservations 2016 2017

Yes 92.1% 92.4% No 7.9 7.6

Activities Enjoyed (Open Ended Multiple Response)

2016

2017

Attractions/Theme Parks 76.5% 80.0% Dining Out 73.7 74.5 Shopping 58.2 59.2 Relaxing 54.3 57.0 Pool 56.1 55.2

Theme Parks Visited (Open Ended Multiple Response)

2016

2017

Disney World 61.8% 64.4% Universal 45.6 46.6 SeaWorld 21.9 24.3

0

20

40

60

80

100

Attractions Dining Out Shopping

76.5 73.7

58.2

80.0 74.5

59.2

%

Activities Enjoyed (Top Three)

2016 2017

Experience Kissimmee Visitor Profile August 2017

8 © Copyright 2017. | PCD-1 – 10.18.17

Non-Theme Park Attractions Visited 2016 2017

Disney Springs 39.8% 44.3% City Walk 25.4 25.7 Fun Spot/Old Town 21.4 22.7

Satisfaction with Kissimmee 2016 2017

Satisfied (Combined) 93.2% 94.0%

Plan to Return (% Yes) 2016 2017

To Local Area 91.5% 89.1%

Demographics 2016 2017

Average Age Head of Household 46.8 46.2 Median Annual Household Income $109,210 $111,440

Book Reservations for Trip Online 2016 2017

% Yes 79.6% 82.3%

0

10

20

30

40

50

60

70

Disney Universal SeaWorld

61.8

45.6

21.9

64.4

46.6

24.3

%

Theme Parks Visited (Top Three)

2016 2017

Experience Kissimmee Visitor Profile August 2017

9 © Copyright 2017. | PCD-1 – 10.18.17

Occupancy Survey Data 2017

Compared to the same time in 2016, OVER THE NEXT THREE MONTHS, properties report reservations:

2016

2017

Up 40.6% 61.8% Same 31.4 20.1 Down 22.2 18.1

0

10

20

30

40

50

60

70

Up Same Down

40.6

31.422.2

61.8

20.1 18.1

%

Forward Reservations (Next Three Months)

2016 2017


Recommended