28
KiwiSaver Annual Report 2021 B30A

KiwiSaver Annual Report 2021
B30A

Purpose of this report
The main objective of the Financial Markets Authority (FMA) is to promote and facilitate the development of fair, efficient and transparent financial markets.
Our aim across all our activities is to raise the standard of conduct, and increase investor and market confidence to support economic growth in New Zealand.
We are one of several government agencies with a role in regulating KiwiSaver, which amounts to a substantial part of New Zealand’s collective wealth.
For many New Zealanders, KiwiSaver may be their first investment and may be a large part of their retirement savings and ultimate financial security.
We are required to report each year on our main KiwiSaver activities. This year’s report covers the period from 1 July 2020 to 30 June 2021, and contains a summary of the statistical returns that must be lodged by KiwiSaver schemes as at 31 March 2021.
Presented to the House of Representatives pursuant to Section 159 of the KiwiSaver Act 2006.
Facts at a glance 2
Executive summary 3
Money in, Money out 6
Key activities 8
Focus area: Fund switching 12
Focus area: Default providers 14
Sir Michael Cullen 16
Appendices 18
Contents
FMA KiwiSaver Annual Report 2021
p. 1

Facts at a glance*
Facts at a glance
Member withdrawals**
$3.05Bup 7.0%
Combined fees revenue†
$650.3M
up 20.7%
Total membership
3,090,631up 2.1%
Average (mean) balance
$26,410up 29%
Investment returns
$13.2Bup 1708.4%
Total funds under management
$81.6Bup 31.7%
* All figures at 31 March 2021 and year-on-year ** First home, mortgage diversion, end payment, death, serious illness, life-shortening conditions, emigration, Australian transfers, other enactments† Management fees, administration fees
FMA KiwiSaver Annual Report 2021
Facts at a glance p. 2

Executive summaryKiwiSaver held up under pressure this year, as global markets
bounced back from the initial shock of COVID-19, despite further lockdowns here and cases surging overseas.
By the time the 12 months covered by this report began on 1 July 2020, global equities markets had largely returned to pre-COVID levels; and by October had exceeded them. This was fuelled by there being few alternatives to equities for investors seeking returns – with low returns from term deposit and fixed income assets – and a rapid uptake of online investing during lockdown.
Despite the pandemic’s ongoing impact, KiwiSaver has endured its toughest test to date, and continues to offer millions of New Zealanders an easy way to save for their future goals.
Funds under management
As markets recovered from the pandemic’s initial impact, then went on to reach new heights, the value of KiwiSaver funds under management (FUM) recovered and grew correspondingly.
As at 31 March 2021, total FUM stood at $81.6 billion, up 31.7% from $62 billion a year earlier, and up from $57 billion at 31 March 2019.
Collectively, funds enjoyed positive investment returns of $13.2 billion, a major turnaround from a year earlier, when they suffered a loss of $820 million, and up from $3.8 billion two years earlier.
It must be noted that such growth and returns for a 12 month period are not typical and can be attributed to the very specific circumstances of the recovery underway by 1 April 2020.
In fact, when it became obvious how extraordinary some growth fund returns had been in the year to 31 March 2021, the FMA asked fund managers not to promote returns for that period in isolation, so as not to mislead investors. The FMA was concerned investors may form an inaccurate and unrealistic view, based on the 12 month returns, of what they should expect from investing in general; or of the skill of specific managers.
Fees
The higher returns many members enjoyed in 2020-21 also meant provider fees had less impact on balances this year.
Combined fees revenue (management and administration and fees) increased 20.7% to $650.3 million, reflecting higher aggregate FUM (up 31.7%) and extraordinary returns and associated fees. By comparison, combined fees revenue in the more ‘normal’ 2018-19 year was $479.8 million
It was encouraging to see income from administration fees decrease 4.8% to almost $80.8 million, as a number of KiwiSaver schemes reduced or changed the structure of administration fees. That compares with $91.8 million in the 2018-19 year. We have previously said that as scale and member balances increase, we see little justification for schemes to charge both a fixed membership fee and a base management fee, so it is pleasing to see a number of providers act on this.
In April 2021, the FMA published guidance outlining providers’ responsibility to annually review their fees with their supervisor and check that these are not unreasonable and represent value for money. We detail this further on page 8.
Since the end of the reporting period, Westpac has announced it will remove its $12 administration fee and reduce fund charges by up to 0.26% from September 2021, while AMP has introduced a flat fund charge of 0.79%.
Withdrawals
While markets recovered swiftly in mid-2020, the period covered by this report included a rise in unemployment. These conditions prompted a big increase in members asking about hardship withdrawals, and providers reporting difficulties with the application process during lockdowns.
The FMA assisted by allowing alternative steps to verify applicants’ identities and financial circumstances, and working with providers to ensure members were aware of government support packages, and being reminded that hardship withdrawals should be a last resort.
In the year to 31 March 2021, significant financial hardship withdrawals rose 42.8% to $159.3 million, up from $111.5 million a year earlier, and $107.9 million in 2019. There were 21,000 hardship withdrawals worth an average of $7,584 – up from 17,534 withdrawals worth an average of $6,359 the year before.
Executive summary
FMA KiwiSaver Annual Report 2021
Executive summary p. 3

That’s still a low proportion of all withdrawals. Over-65s withdrew $1.22 billion, down 8.3% year-on-year, but up from $1.04 billion in 2019. The number of over-65 members continued to increase, by 15% to 147,331. Fewer over-65s fully exited KiwiSaver during the year, down 14% to 19,512. Since 1 July 2019, over-65s have been allowed to join KiwiSaver and it is clear that more are continuing to leave money within the scheme beyond retirement age.
At the same time, the amount withdrawn for first homes rose 18.8% to $1.4 billion, continuing a steady trend upward, from $1.2 billion last year and $953 million in 2019.
It was also the first year people with congenital life-shortening conditions were allowed early access to KiwiSaver. From 26 March 2021, those with Down syndrome, cerebral palsy, Huntington’s disease and fetal alcohol spectrum disorder were automatically entitled to apply to make such withdrawals, while those with rarer conditions can do so with medical verification. Three schemes have since paid $259,998 in respect of 14 withdrawal applications.
Fund switching
This year there were 377,895 switches between funds of different risk types but with the same provider. This is down 9.3% on the previous year, which included a very high level of switching associated with the market volatility of February to March 2020, but it is still well above the 240,378 fund switches seen in the 2018-19 year.
In total, almost $6.7 billion moved between funds with different risk profiles, including $2.6 billion into growth funds.
When COVID-19 hit, the FMA commissioned research into switching to better understand how investors behave when markets are volatile, and the drivers of that behaviour. See more on page 12.
Transfers
The total number of transfers between different KiwiSaver schemes was 157,679 – down 12.6% on the prior year.
Excluding the 45,336 default members who made an active choice to stay with the same scheme, the number of transfers was 112,343, down 18.2% year-on-year.
KiwiSaver members now have more choice, too, with the addition of four new schemes during the year – from Aurora, InvestNow, KiwiWrap and Select – taking the total number of schemes to 37.
Default funds
Around one in nine KiwiSaver members remain in a default scheme after being automatically enrolled when they started a new job. The number of members in default schemes who have not made an active choice was 356,021 at 31 March 2021, down 6.6% annually. This continues a steady downward trend in the proportion of default members who have not yet made an active decision about their fund.
In March 2021, the Government announced new settings for default members including a move from conservative to balanced funds.
Other changes from December 2021 include a reduction in default fund fees, the exclusion of fossil fuels and illegal weapons from equity holdings, and a requirement that providers engage with members at key life-stages, to help them make informed decisions about their savings.
We discuss default funds further in our Focus Area on page 14.
The amount withdrawn for first homes rose 18.8% to $1.4 billion, continuing a steady trend upward, from $1.2 billion last year and $953 million in 2019.
FMA KiwiSaver Annual Report 2021
Executive summary p. 4

FMA KiwiSaver Annual Report 2021
Executive summary p. 5

Money in*
Year to 31 March 2021
$2.7Bfrom employers
up 19.5%
$1.85Bin lump sum contributions
up 14.5%
1,883,118members contributed
to their accounts
up 3.9%
$4.8Bthrough salaries & wages
up 16.3%
Money in, Money out
Together they contributed:
Other contributions included:
$891Mfrom the Crown
up 6.1%
* All figures at 31 March 2021 and year-on-year
FMA KiwiSaver Annual Report 2021
Money in, Money out p. 6
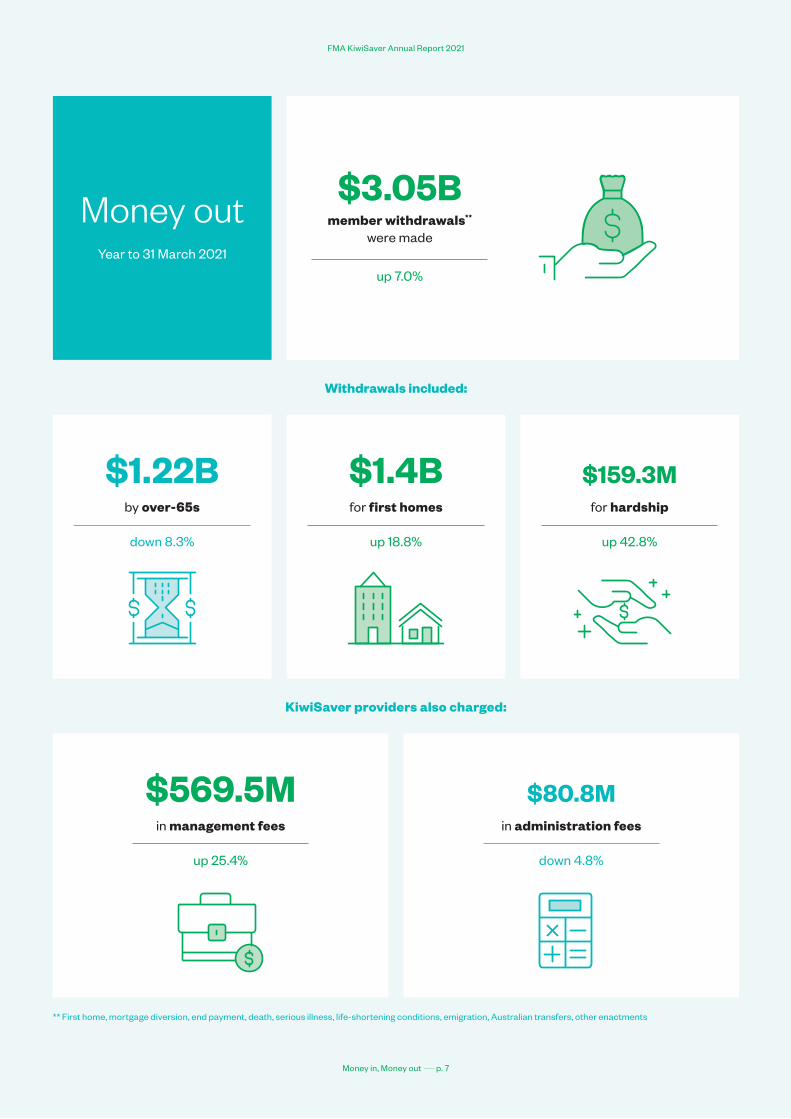
Money outYear to 31 March 2021
$569.5M in management fees
up 25.4%
$3.05Bmember withdrawals**
were made
up 7.0%
$1.22B by over-65s
down 8.3%
$1.4B for first homes
up 18.8%
$159.3Mfor hardship
up 42.8%
Withdrawals included:
KiwiSaver providers also charged:
$80.8Min administration fees
down 4.8%
** First home, mortgage diversion, end payment, death, serious illness, life-shortening conditions, emigration, Australian transfers, other enactments
FMA KiwiSaver Annual Report 2021
Money in, Money out p. 7

Key activities
FMA guidance on reasonable fees and value for money
In April 2021, the FMA published its Managed fund fees and value for money guidance, to help fund managers and supervisors demonstrate how they are meeting their obligations, statutory duties and conduct expectations in respect of fees and value for money.
The FMA published the guidance after research into the KiwiSaver market found:
Our guidance said managers are expected to annually review their fees with their supervisors, and to take concrete steps if they find their fees are unreasonable and don’t represent value for money – by increasing their services, reducing fees, or both.
Managers were told they must prove such reviews are happening, and our message that failure to do so could trigger a regulatory response was conveyed widely by significant media coverage.
Key aspects of the guidance included:
• There is little justification for membership fees to be charged by investment managers who have achieved scale. So KiwiSaver schemes should move toward eliminating membership fees from their fee structures.
• Where fees are charged for advice, the investment manager must demonstrate the advice is received, not just ‘offered’; is ongoing, not just at onboarding; that the fee charged is reasonable; and that the fee, and to whom it is paid, is disclosed to members.
• Where fees are charged for services other than advice (for example, a robust investment process), the manager must demonstrate how the service adds value to the member’s account – by adding return, reducing risk, or ideally, both.
• where scale exists in the industry, its benefits
typically aren’t being passed on to investors
• no systematic relationship between fees and
returns, or the degree of active management
• active managers typically don’t outperform
their index over meaningful periods,
after fees
• passive managers typically don’t closely
replicate their index’s performance, after fees
Key activities
FMA KiwiSaver Annual Report 2021
Key activities p. 8

2016
2017
2018
2019
2020
2021
444,786
446,534
431,779
398,289
381,034
356,021
$30,330,423
$32,358,553
$32,469,497
$31,114,573
$29,576,781
$25,739,432
Year Default members
Total fees*
MEMBER FEES – ACTIVE & DEFAULT
2016
2017
2018
2019
2020
2021
2,163,597
2,275,613
2,405,877
2,535,979
2,645,030
2,734,610
$295,582,958
$350,291,390
$415,246,077
$475,840,973
$542,374,889
$657,404,966
Year Active members
Total fees*
Average fees per member
Average fees per member
$137 $154 $173 $240$188 $205
$68 $72 $75 $72$78 $78
* Management fees, administration fees, supervisor and trustee fees, other scheme expenses
FMA KiwiSaver Annual Report 2021
Key activities p. 9

Integrated financial products
In December 2020, the FMA issued guidance to the market on integrated financial products, the two main types being ‘responsible’ or ‘ethical’ KiwiSaver funds, and ‘green’ bonds.
The Disclosure framework for integrated financial products outlines expectations around fair dealing, the type of disclosure expected from issuers, and the FMA’s enforcement options.
The guidance supports New Zealand’s transition to an ‘integrated financial system’, which takes into account non-financial factors such as natural, social and human impacts, not just financial returns.
Misleading marketing, poor product design and other types of ‘green-washing’ all have the potential to undermine investor confidence in integrated financial products. This is complicated by providers not clearly explaining what they mean when they use terms such as ‘responsible’, or not substantiating those claims.
For example, while only some funds are explicitly labelled as responsible or ethical, FMA research has shown that 31 of 37 schemes state in their PDS that they consider aspects of responsible, ethical or ESG investment in their decision-making.
So while the data shows 22,119 members were in funds labelled as ‘socially responsible’ at 31 March 2021, which is up 56% year-on-year, and 151.5% over five years (with total holdings of $554 million, a leap of over 700% since 2016), that likely understates the number of members who have chosen a fund based on green, ethical or other values-based criteria.
Misleading marketing, poor product design and other types of ‘green-washing’ all have the potential to undermine investor confidence in integrated financial products.
FMA KiwiSaver Annual Report 2021
Key activities p. 10

Looksee fund choice campaign
In May 2021, the FMA undertook its annual campaign to encourage KiwiSaver members to engage with their KiwiSaver statements, and to take action to improve their settings, if applicable.
Our “Looksee” campaign again encouraged members to “take a looksee” at their statements, with a call this year to “check you’re in the right fund for you”, aimed at younger members in particular.
This year’s focus on younger members followed data indicating over 12,000 members aged 26-35 were still in lower risk funds after switching from higher growth funds when COVID-19 first hit.
We also found that some young people are unsure how different types of KiwiSaver funds worked.
During the campaign, members were urged to ask themselves:
• Am I in the right KiwiSaver fund?
• Can I afford to contribute more?
• Am I getting good value from my KiwiSaver provider – do their fees seem reasonable?
• Am I happy with the amount of money I’ll have in my KiwiSaver at 65?
FMA KiwiSaver Annual Report 2021
Key activities p. 11

Focus area: Fund switching
While changing fund risk types is encouraged when appropriate to a member’s needs and goals, panic switching at times of volatility is not recommended due to the risk of crystallising losses and missing out on returns over the long-term.
In the year to 31 March 2021, there were 377,895 fund switches, worth almost $6.7 billion.
The number of switches is down 9.3% on the year before, which included the most volatile period of February to March 2020, but still 57.2% higher than the more ‘normal’ year ended March 2019.
Almost 39% of those who switched did so into a higher-risk growth fund – a figure that is similar to those who did the same in 2019 (34.6%) and 2018 (40.7%).
The FMA commissioned PwC to analyse and better understand the switching behaviour during the most volatile market period. The report used data from seven providers with 1.5 million members, capturing switching behaviour from February to April 2020 compared with the same period in 2019.
The report found 3.9% of the sample had made 88,112 switches during that three-month period, some making multiple switches. Of them, 70.5% had moved to lower risk funds during that volatile February to March 2020 period, and 18.5% into higher risk funds.
Younger people and members of bank-run schemes drove the higher level of switching. Those aged 26 to 35 made five times the number of switches, year-on-year, from 5,195 to 26,507, as did those in bank-run schemes, from 14,703 to 73,330.
The chart opposite from the PwC report shows the abnormally high level of switching in March 2020. As it ends in August 2020, it does not show the full extent of switching back to higher risk funds, as noted above.
Concerningly, less than 10% of those who went lower risk during February to April 2020 had gone back to a higher growth fund by August (the end period of data available for the PwC report), meaning 90% effectively locked in their losses. The fact the full year switching behaviour is only back to pre-COVID levels suggests the majority of those investors may still be in conservative funds.
Future considerations for providers included improvements to customer communications, such as highlighting the risks of switching, and prompts to have members pause before completing a switch.
Case study: Anna, 24
When Anna saw her KiwiSaver balance drop by $2000 in March 2020, she promptly changed her fund type from growth to conservative.
“I got scared because I didn’t understand how KiwiSaver really works, so I thought I had lost a whole bunch of money and I would never get it back, so then I switched immediately to conservative to keep the money that I had and hopefully not lose any more.”
Anna says she found the switching process straightforward but admits she didn’t properly read her provider’s questionnaire on the impact of switching funds.
“I was so in the moment that I just switched it without reading.”
She then discussed her move with her mother, an accountant, who advised her to switch back to growth because it aligned with the timeline of her financial goals.
“She explained what [KiwiSaver] actually was to me [and said] if I don’t want to use the money in the next, like, six years then I should keep it in growth.”
Anna wants more communications from providers to explain how KiwiSaver works and the impact of market volatility on different types of investments.
Focus area: Fund switching
FMA KiwiSaver Annual Report 2021
Focus area: Fund switching p. 12

FUND SWITCHING DIRECTION BY MONTH Jan 2019 - Aug 2020
Reporting period differs from FMA KiwiSaver Annual Report
Jan
2019
Feb
2019
Mar
20
19
Apr
20
19
May
20
19
Jun
2019
Jul 2
019
Aug
20
19
Sep
20
19
Oct
20
19
Nov
20
19
Dec
20
19
Jan
2020
Feb
2020
Mar
20
20
Apr
20
20
May
20
20
Jun
2020
Jul 2
020
Aug
20
20
Lower risk Neutral Higher risk
0
10,000
20,000
30,000
40,000
50,000
Source: ‘Lockdown: A review of KiwiSaver member behaviour in response to COVID-19’, PwC, 2021
Case study: Sarah, 45
Sarah got a fright when she saw her KiwiSaver balance drop by $8,000 in late March 2020. She immediately decided to switch her fund from balanced to conservative.
“When my balance dropped it was horror, really. I just thought, ‘Oh this is going to put me further behind with getting on the [property] ladder.’ I said I didn’t want to lose more than I already had.”
Sarah says she did receive some advice from her provider but it didn’t influence her choice – the most important thing was that her balance didn’t drop any further.
“I talked to one friend about it, she said, ‘Nah, leave it where it is’, but she is in a much better financial position than me. I just felt this was a better move for me.”
She remembers social media debate about the merits of switching, but admits she is risk averse.
“It might be true that I shouldn’t have switched, but there weren’t guarantees at the time and I couldn’t afford that or afford to take the risk, so I switched.”
Sarah wants more education on KiwiSaver put out by providers, to improve the knowledge of those who are disengaged, so they understand how an investment fund works.
“The more information the better, the more explanations, it would really help.”
*Anna and Sarah are not real names. Both were interviewed in April 2021 as part of the FMA’s research into fund switching.
FMA KiwiSaver Annual Report 2021
Focus area: Fund switching p. 13

Focus area: Default providers
Up to this year, default funds have been a particular focus of the government and providers, with significant resources put into encouraging members to
make an active choice by considering if their allotted fund was right for them.
What were meant to be ‘parking space’ funds where members would sit temporarily, with a lower-growth, less risky conservative setting, became permanent homes for the funds of those members lacking the information or inclination to move.
As at 31 March 2021, the number of people in default funds fell 6.6% year-on-year, to 356,021. That equates to 11.5% of all members, and continues a steady downward trend, from 17.1% in March 2016. Total FUM of all those default members fell slightly to $3.96 billion.
The proportion of default members who were contributing at the end of the year was 47.2% versus 62.7% of active members.
New KiwiSaver members allocated to a default scheme during the year decreased 16.8% to 51,113.
Meanwhile, the number of default members who made an active choice increased 5.1% to 45,336.
Focus area: Default providers
In March 2021, the Government announced new default arrangements, most notably that all current and future default members would be put into balanced funds.
Because of this change in risk settings, our future focus will be on whether any moves by default members out of their allotted default funds is in those members’ interests. We will also be reviewing how many active members join the default funds, attracted by the lower fees and balanced risk setting. Providers must ensure their default funds are open to all members.
The Government also wanted to lower default fees and make them more simple and transparent, and MBIE managed a competitive procurement process that put downward pressure on fees, including asking providers how they will benefit members with low balances.
Providers were also restricted to charging one percentage-based fee and/or one fixed fee. All providers have ultimately opted for charging only a percentage-based fee.
FMA KiwiSaver Annual Report 2021
Focus area: Default providers p. 14

Newly selected
D Simplicity
D Smartshares (NZX)
Retained
D BNZ
D BT Funds (Westpac)
D Booster
D Kiwi Wealth (Kiwibank)
Not retained
U AMP
U ANZ
U ASB
U Fisher Funds
U Mercer
KIWISAVER DEFAULT FUND PROVIDERS
Changes announced May 2021
DEFAULT MEMBERS MAKING ACTIVE CHOICES, BY PROVIDER
Number of members and annual difference
Provider 2020 2021 Difference
AMP 5,525 7,673 39%
ANZ 4,823 3,701 23%
ASB 12,024 9,858 18%
BNZ* 1,951 838 57%
Booster* 3,347 3,715 11%
BT Funds (Westpac)* 4,026 2,853 29%
Fisher Funds 3,448 5,016 46%
Kiwi Wealth (Kiwibank)* 2,546 6,204 144%
Mercer 5,433 5,478 1%
Total 43,123 45,336 5%
*Retained 2021 – 2028
Importantly, they must now engage with members at key milestones, such as when they first join, and 10 years and one year before they turn 65; after a first home withdrawal; when annual statements are sent out; during significant market volatility; and after 18 months of someone not contributing.
Six default providers were ultimately appointed, down from the previous nine. Four were retained as providers, while another five were not, as shown in the table below. None of the original six default providers from 2007 were among those reappointed.
The new default arrangements commence on 1 December 2021. At 30 June, there were 263,000 members of the five schemes that were not reappointed who will be transferred to one of the six appointed schemes. Members of reappointed schemes will be moved to a balanced fund with their current provider.
Non-continuing providers are expected to stop all proactive efforts to engage default members from 30 September 2021, excluding those in that month’s final allocation of default members.
The FMA will monitor the transition and providers’ progress against the engagement standards and all service standards under the Instrument of Appointment. Default providers will need to report to us every six months.
It’s hoped positive outcomes from this year’s changes, including default members earning better returns, will begin to show in the next 12 months.
FMA KiwiSaver Annual Report 2021
Focus area: Default providers p. 15

Sir Michael Cullen (1945–2021)
The Board and Chief Executive of the Financial Markets Authority note with sadness the passing of the architect of KiwiSaver, Sir Michael Cullen.
Sir Michael was Deputy Prime Minister and Minister of Finance when the KiwiSaver Act was passed in 2006 and the scheme began on 1 July 2007.
Sir Michael Cullen
“KiwiSaver is a landmark in our social and economic history. It will help New Zealanders build up more financial assets more quickly. It will help more New Zealanders feel wealthier and more secure.”
“Greater saving, coupled with increasing investment in innovation and productivity, will help make the economy much more resilient so we can better deal with the long term game.”
Sir Michael Cullen, June 2007
FMA KiwiSaver Annual Report 2021
Sir Michael Cullen p. 16

FMA KiwiSaver Annual Report 2021
Sir Michael Cullen p. 17
Appendices

Appendix 1Income and expenditure summaryKiwiSaver schemes as at 31 March 2021
Default Active Total
Opening balance of scheme assets at start of annual return year $4,062,137,074 $57,891,908,947 $61,954,046,021
Categories of income for annual return year
Member contributions at section 64 contribution rate $380,768,005 $4,458,524,581 $4,839,292,586
Employer contributions $240,980,777 $2,457,987,988 $2,698,968,765
Crown contributions (section 226) and fee subsidies $75,576,060 $815,375,787 $890,951,847
Transfers of members’ accumulations into scheme from other KiwiSaver schemes $7,222,195 $3,469,253,777 $3,476,475,972
Transfers of members’ accumulations into scheme from other retirement schemes $309,079 $47,840,092 $48,149,171
Transfers of members’ accumulations into scheme from Australian superannuation schemes $5,151,699 $144,743,456 $149,895,155
Lump sum contributions $19,328,461 $1,828,219,380 $1,847,547,841
Other voluntary contributions over section 64 contribution rate $3,189,648 $251,480,606 $254,670,254
Income from investment of scheme assets $328,368,006 $12,868,509,102 $13,196,877,108
Other income $349,205 $12,317,628 $12,666,833
Total income from annual return year $1,061,243,135 $26,354,252,397 $27,415,495,532
Categories of expenditure for annual return year
First home purchase withdrawals $48,614,121 $1,367,425,641 $1,416,039,762
Mortgage diversion withdrawals $0 $45,857 $45,857
KiwiSaver end payment date withdrawals $45,389,837 $1,175,608,471 $1,220,998,308
Withdrawals on death $5,402,343 $84,484,891 $89,887,234
Serious illness withdrawals $3,575,110 $55,143,200 $58,718,310
Life-shortening congenital condition withdrawals $0 $259,998 $259,998
Withdrawals or transfers on permanent emigration $3,443,912 $42,540,746 $45,984,658
Significant financial hardship withdrawals $8,485,011 $150,789,196 $159,274,207
Transfers of members’ accumulations out of scheme into other KiwiSaver schemes $986,560,080 $2,537,115,222 $3,523,675,302
Transfers of members’ accumulations out of scheme into Australian superannuation schemes $3,302,741 $42,536,345 $45,839,086
Amounts required to be paid under other enactments $647,520 $13,957,742 $14,605,262
Invalid enrolment withdrawals $5,931,211 $5,258,369 $11,189,580
Administration fees $8,355,217 $72,408,538 $80,763,755
Investment management fees $16,863,572 $552,702,777 $569,566,349
Supervisor fees and (in the case of a restricted scheme) Trustee fees $313,852 $7,624,509 $7,938,361
Insurance premiums $0 $0 $0
Taxation $22,056,235 $452,614,672 $474,670,907
Other scheme expenses $206,791 $24,669,142 $24,875,933
Total expenditure for annual return year $1,159,147,553 $6,585,185,316 $7,744,332,869
Closing balance of scheme assets at end of annual return year $3,964,232,656 $77,660,976,028 $81,625,208,684
Note: The statistical returns are unaudited and may not include all transactions. Some providers are not able to differentiate between different types of transfers. This means there are sometimes discrepancies between transfers to and from KiwiSaver schemes. Opening balances do not agree with last year’s reported closing balances.
FMA KiwiSaver Annual Report 2021
Appendices p. 18

Appendix 2Membership summaryKiwiSaver schemes as at 31 March 2021
Default Active Total
Number of contributing members at start of annual return year 184,783 1,627,508 1,812,291
Categories of entries of members for annual return year
New members (other than transfers from other schemes) 48,486 53,074 101,560
Members restarting contributions at end of section 104 contribution holidays 4,432 28,520 32,952
Members restarting contributions after stopping contributions for any other reason 32,035 164,673 196,708
Members transferring into scheme from other KiwiSaver schemes 23 161,635 161,658
Members transferring into scheme from Australian superannuation schemes 27 1,402 1,429
Members transferring into scheme from other retirement schemes 5 443 448
Total entries for annual return year 85,008 409,747 494,755
Categories of membership exits for annual return year
KiwiSaver end payment date exits 1,867 17,645 19,512
Deaths 381 2,852 3,233
Permanent emigration exits 212 1,656 1,868
Transfers out of scheme into other KiwiSaver schemes 59,437 98,242 157,679
Transfers out of scheme into Australian superannuation schemes 216 1,828 2,044
Other permanent exits 6,663 2,642 9,305
Invalid enrolment withdrawals 4,778 2,057 6,835
Members starting section 104 contribution holidays 2,643 36,269 38,912
Member stopping contributions for other reasons 25,413 159,127 184,540
Total temporary and permanent exits for annual return year 101,610 322,318 423,928
Number of contributing members at end of annual return year 168,181 1,714,937 1,883,118
Categories of non-contributing members on section 104 contribution holidays
Number of members on section 104 contribution holidays at start of annual return year 19,752 109,155 128,907
Members starting section 104 contribution holidays 2,643 36,269 38,912
Members ending section 104 contribution holidays and restarting contributions 4,432 28,520 32,952
Members ending section 104 contribution holidays but not restarting contributions for any reason 3,812 18,047 21,859
Number of members on section 104 contribution holidays at end of annual return year 14,151 98,857 113,008
Categories of other non-contributing members (not on section 104 contribution holidays)
Number of other non-contributing members (not on section 104 contribution holidays) at start of annual return year 176,499 908,368 1,084,867
Members stopping contributions without section 104 contribution holidays 29,225 177,121 206,346
Members restarting contributions after having stopped contributions without section 104 contribution holidays 32,035 164,673 196,708
Number of other non-contributing members (not on section 104 contribution holidays) at end of annual return year 173,689 920,816 1,094,505
Total number of members at end of annual return year 356,021 2,734,610 3,090,631
Note: Some providers currently have an inability to differentiate between different types of transfers, therefore there are discrepancies in transfers to and transfers from KiwiSaver schemes. There are also timing differences.
FMA KiwiSaver Annual Report 2021
Appendices p. 19

Appendix 3Age and gender profile of membersKiwiSaver schemes as at 31 March 2021
Default members
Age at end of annual return year Female Male Gender unknown Total
17 and under 3,116 2,888 12 6,016
18-25 31,639 35,929 772 68,340
26-30 19,209 22,127 346 41,682
31-35 23,662 24,528 295 48,485
36-40 19,625 20,730 243 40,598
41-45 16,174 16,874 185 33,233
46-50 16,079 16,252 174 32,505
51-55 14,108 14,472 148 28,728
56-60 12,736 12,653 95 25,484
61-65 9,159 9,451 90 18,700
66-70 3,989 4,103 33 8,125
71-75 1,578 1,563 8 3,149
76-80 242 283 2 527
81-85 5 7 0 12
86 and over 17 21 0 38
Unknown age 171 222 6 399
Totals 171,509 182,103 2,409 356,021
Active members
Age at end of annual return year Female Male Gender unknown Total
17 and under 123,902 130,469 1,224 255,595
18-25 185,646 190,699 2,582 378,927
26-30 150,172 152,721 1,953 304,846
31-35 146,138 145,528 2,354 294,020
36-40 129,066 124,229 2,182 255,477
41-45 117,634 108,455 1,794 227,883
46-50 126,743 111,903 1,520 240,166
51-55 123,063 107,458 1,227 231,748
56-60 119,464 104,549 1,060 225,073
61-65 98,844 85,733 722 185,299
66-70 46,389 41,147 257 87,793
71-75 20,226 18,514 93 38,833
76-80 4,180 4,073 36 8,289
81-85 188 182 5 375
86 and over 97 92 1 190
Unknown age 32 59 5 96
Totals 1,391,784 1,325,811 17,015 2,734,610
FMA KiwiSaver Annual Report 2021
Appendices p. 20

Total members
Age at end of annual return year Female Male Gender unknown Total
17 and under 127,018 133,357 1,236 261,611
18-25 217,285 226,628 3,354 447,267
26-30 169,381 174,848 2,299 346,528
31-35 169,800 170,056 2,649 342,505
36-40 148,691 144,959 2,425 296,075
41-45 133,808 125,329 1,979 261,116
46-50 142,822 128,155 1,694 272,671
51-55 137,171 121,930 1,375 260,476
56-60 132,200 117,202 1,155 250,557
61-65 108,003 95,184 812 203,999
66-70 50,378 45,250 290 95,918
71-75 21,804 20,077 101 41,982
76-80 4,422 4,356 38 8,816
81-85 193 189 5 387
86 and over 114 113 1 228
Unknown age 203 281 11 495
Totals 1,563,293 1,507,914 19,424 3,090,631
Appendix 4Profile of new default and other membersKiwiSaver schemes as at 31 March 2021
Number of members
Scheme assets held for those
members ($)
Default members allocated to scheme by Commissioner under section 51 in annual return year 51,113 80,339,345
Other new members entering scheme in annual return year (including transfers from other schemes and active choice members) 90,406 1,466,540,852
Note: Some providers have included members who have since opted out, while others have not.
FMA KiwiSaver Annual Report 2021
Appendices p. 21

Appendix 5Summary of non-contributing members (not section 104 contribution holidays) KiwiSaver schemes as at 31 March 2021
Number of default members
Scheme assets held for default
members ($)Number of active
members
Scheme assets held for active
members ($)
Number of non-contributing members (not on section 104 contribution holidays) at start of annual return year 176,499 1,019,553,418 908,368 10,480,304,664
Number of non-contributing members (not on section 104 contribution holidays) at end of annual return year 173,689 994,923,456 920,816 13,817,631,997
Note: ‘Non-contributing member’ means: • a member for whom no contributions have been received in the previous two months, or• where the member does not contribute via the IRD, the member has failed to meet their contracted contribution frequency.
Appendix 6Investment fund summaryKiwiSaver schemes as at 31 March 2021
Number of members in each investment fund
Amount in each investment fund ($)
Default investment product under instrument of appointment in respect of default members 356,021 3,964,232,656
Totals 356,021 3,964,232,656
Multi Sector
Active Default 304,881 6,319,441,883
Conservative 544,198 10,984,714,562
Balanced 756,256 21,822,455,867
Growth 1,328,805 32,716,699,662
Single Sector
Cash 408,718 3,159,088,025
Fixed Interest 50,351 433,175,600
Shares 79,271 1,165,513,860
Property 7,414 88,089,585
Socially Responsible 22,119 554,323,908
Other 10,855 417,473,076
Totals 3,512,868 77,660,976,028
Note: The statistical returns are unaudited and may not include all transactions. Some members will be invested in more than one investment fund. “Other” refers, in the main, to life stages products.
FMA KiwiSaver Annual Report 2021
Appendices p. 22

Appendix 7ASwitches out of default investment products into other investment fundsKiwiSaver schemes as at 31 March 2021
Number of members out of
default investment product
Number of members into
other funds
Amount ($) out of default investment
productAmount ($) into
other funds
Switches out of default investment product under instrument of appointment 45,336 776,466,995
Switches into other investment funds
Multi Sector
Active Default 23,098 410,449,939
Conservative 1,520 26,107,108
Balanced 8,755 159,989,139
Growth 11,910 152,887,213
Single Sector
Cash 804 11,008,219
Fixed Interest 85 888,396
Shares 1,241 10,410,056
Property 26 130,563
Socially Responsible 632 4,596,362
Total switches into other investment funds 45,336 48,071 776,466,995 776,466,995
Note: Switches out includes members making an active choice to switch out of the provider’s default fund into another of the provider’s funds, and members who make an active choice to remain in the default fund. Note that some providers are currently unable to report both, so the total shown is likely to be understated.
Appendix 7BSwitches between investment fundsKiwiSaver schemes as at 31 March 2021
Number of switches into
investment fundAmount ($) into
investment fund
Number of switches out of
investment fundAmount ($) out of
investment fundNet change in
amounts ($)
Multi Sector
Active Default 10,750 322,739,649 31,081 751,222,197 -428,482,548
Conservative 79,663 1,067,099,545 75,262 1,389,983,457 -322,883,912
Balanced 64,806 1,678,123,874 68,458 1,680,347,610 -2,223,736
Growth 148,885 2,602,502,147 111,279 1,553,455,657 1,049,046,490
Single Sector
Cash 28,543 716,151,583 43,774 1,057,860,755 -341,709,172
Fixed Interest 8,165 59,414,632 8,441 76,026,853 -16,612,221
Shares 32,745 147,065,420 33,319 133,660,396 13,405,024
Property 3,615 14,390,463 4,435 16,265,109 -1,874,646
Socially Responsible 4,168 75,967,707 1,753 22,780,647 53,187,060
Other 68 3,061,986 93 4,914,325 -1,852,339
Total of switches between funds 381,408 6,686,517,006 377,895 6,686,517,006 0
FMA KiwiSaver Annual Report 2021
Appendices p. 23

Appendix 8Profile of switches between investment fundsKiwiSaver schemes as at 31 March 2021
Number of switches between investment funds made in annual return year Default Active
1 switch 38,128 198,078
2 switches 0 26,334
3 switches 0 5,670
4 switches 0 2,579
5 switches or more 0 2,797
Appendix 9Analysis according to size of scheme assetsKiwiSaver schemes as at 31 March 2021
Number of schemes Total assets $M Total membership
Under $10m 2 3 52
$10m to under $100m 8 288 9,331
$100m to under $500m 7 2,316 65,041
$500m to under $1,000m 2 1,380 34,753
$1,000m to under $5,000m 12 30,035 1,036,555
$5,000m and over 5 47,604 1,944,899
Total 36 81,625 3,090,631
Note: The data has been obtained from statistical returns made by KiwiSaver providers. Some totals may not be exact, due to rounding.
Appendix 10Analysis by nature of schemeKiwiSaver schemes as at 31 March 2021
Nature of schemeNumber of
schemes Total assets ($M) Total membership
Default schemes 9 3,964 356,021
Retail (active choice) 31 76,168 2,707,752
Restricted schemes 5 1,493 26,858
Total 36 81,625 3,090,631
Note: Default scheme statistics are only in respect of members and assets in the default investment fund options. Retail (active choice) total assets and total membership figures include that portion of the default schemes where members have actively chosen to participate.
The data has been obtained from statistical returns made by the KiwiSaver providers to the members and beneficiaries of those schemes.
Some totals may not be exact due to rounding.
FMA KiwiSaver Annual Report 2021
Appendices p. 24

Appendix 11AAnalysis according to nature of scheme and size of scheme assetsKiwiSaver schemes as at 31 March 2021
Number of schemes
Assets grouping Retail schemesRestricted
schemes Total schemes
Under $10m 2 2
$10m to under $100m 5 3 8
$100m to under $500m 6 1 7
$500m to under $1,000m 2 2
$1,000m to under $5,000m 11 1 12
$5,000m and over 5 5
Total (all groups) 31 5 36
Note: The above table does not take into account the default component of the schemes.
Total assets ($ millions)
Assets grouping Default assets Retail assets Restricted assets Total assets
Under $10m 3 3
$10m to under $100m 190 98 288
$100m to under $500m 484 1,935 380 2,799
$500m to under $1,000m 3,481 1,380 4,861
$1,000m to under $5,000m 26,907 1,015 27,922
$5,000m and over 45,752 45,752
Total (all groups) 3,964 76,168 1,493 81,625
Total membership
Assets grouping Default Retail Restricted Total members
Under $10m 52 52
$10m to under $100m 6,372 2,959 9,331
$100m to under $500m 79,590 56,001 9,040 144,631
$500m to under $1,000m 276,431 34,753 311,184
$1,000m to under $5,000m 834,847 14,859 849,706
$5,000m and over 1,775,727 1,775,727
Total (all groups) 356,021 2,707,752 26,858 3,090,631
FMA KiwiSaver Annual Report 2021
Appendices p. 25

Auckland
Level 5, Ernst & Young Building 2 Takutai Square, Britomart PO Box 106 672, Auckland 1143 Phone +64 9 300 0400
Wellington
Level 2, 1 Grey Street PO Box 1179, Wellington 6140 Phone +64 4 472 9830
ISSN No. 2324-5522 (Print) ISSN No. 2324-5530 (Electronic)


