16
2010 KLÖVERN INTERIM REPORT JANUARY – MARCH

2010KLÖVERNINTER IM REPORTJANUARY – MARCH
KLÖVERN – INTERIM REPORT JANUARY–MARCH 2010 / 2 (16)
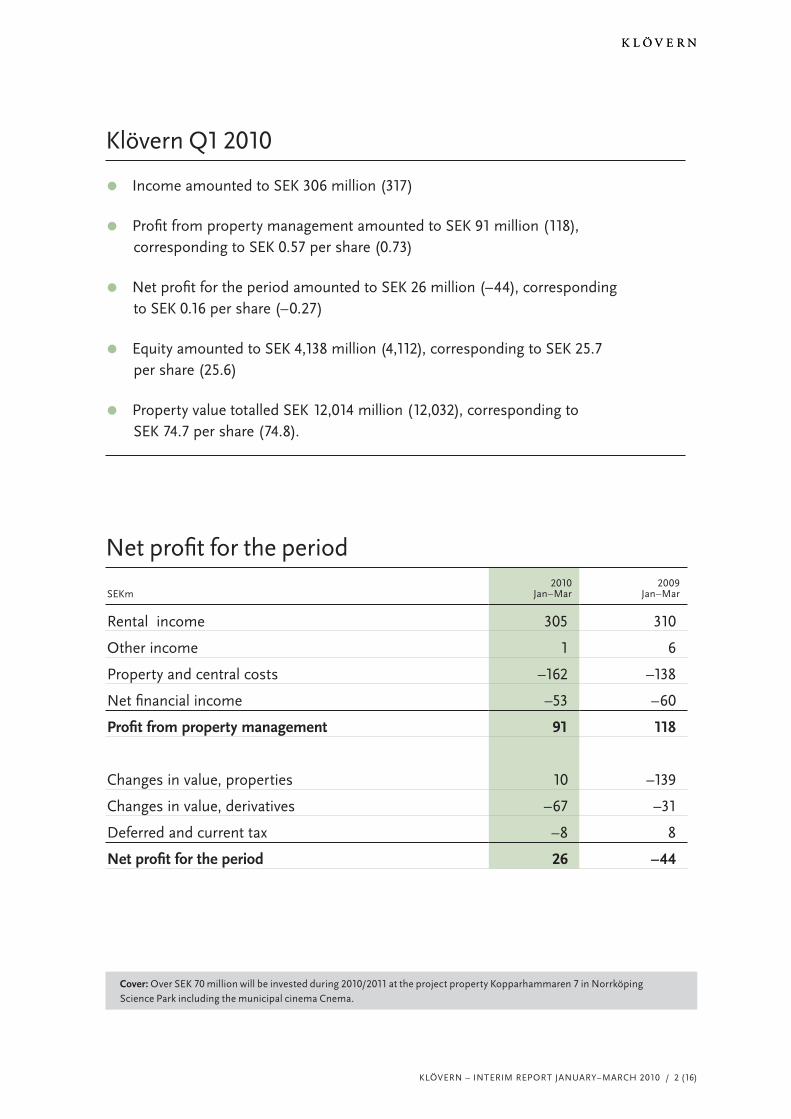
Income amounted to SEK 306 million (317)•Profit from property management amounted to SEK 91 million (118),•corresponding to SEK 0.57 per share (0.73)
Net profit for the period amounted to SEK 26 million (–44), corresponding•to SEK 0.16 per share (–0.27)
Equity amounted to SEK 4,138 million (4,112), corresponding to SEK 25.7•per share (25.6)
Property value totalled SEK 12,014 million (12,032), corresponding to•SEK 74.7 per share (74.8).
Net profit for the period
SEKm2010
Jan–Mar2009
Jan–Mar
Rental income 305 310
Other income 1 6
Property and central costs –162 –138
Net financial income –53 –60
Profit from property management 91 118
Changes in value, properties 10 –139
Changes in value, derivatives –67 –31
Deferred and current tax –8 8
Net profit for the period 26 –44
Klövern Q1 2010
Cover:Over SEK 70million will be invested during 2010/2011 at the project property Kopparhammaren 7 in NorrköpingScience Park including the municipal cinema Cnema.

KLÖVERN – INTERIM REPORT JANUARY–MARCH 2010 / 3 (16)
After the winter comes the spring...
Klövern is reporting stable rental income for the first quar-ter of 2010, which is a strong result, bearing in mind thestill weak state of the economy. Customer losses have todate been lower than for the corresponding period last year."e payment capacity of tenants remains good. Delayedrent payments are not greater today than they were beforethe financial crisis.
Klövern has succeeded in entering into a number of largenew lease contracts during the first quarter of 2010. Amongthe larger leases is a fifteen-year lease with the Municipal-ity of Norrköping’s cinema Cnema at the property Koppar-hammaren 7 in Norrköping Science Park. It feels fantasticto participate in raising the former industrial landscape inNorrköping to a new dimension.
Rental levels in most of our cities are stable. Some businessunits have even managed to raise rental levels comparedwith the previous quarter and with a year ago. Offices arecoping generally better than retail outlets at the moment.In Kista, increased competition has had some impact onrents. Ericsson’s decision to concentrate its operations inthe Stockholm area at Kista is, however, having a positiveimpact, both on demand for premises and on rental levels.
Property costs for the first quarter were unusually high sincefor once there was a real winter in Central Sweden. Com-mited work with snow and ice clearance on and around theproperties, high electricity prices and the fact that we have alot of square metres in relation to the property value contrib-uted to property costs being SEK 20 million higher than in anormal year. At the same time, it was self-evident to use thenecessary resources to the greatest possible extent to enableaccess to the properties and ensure safety.
"e required yield remained unchanged during the quarterand the increase in value noted for comparable propertiesderived from investments. "e negative development ofproperty values seems to have ended.
During the quarter, Klövern won the case on a tax sur-charge of almost a half billion kronor at the AdministrativeCourt of Appeal as well. "e Tax Agency has appealed tothe Supreme Administrative Court. "e probability of ourlosing, if an appeal is heard at the Supreme AdministrativeCourt, is considered as being minimal. We are now focusingon the issue of whether we are entitled to an additional fivebillion kronor in loss carryforwards, which is being consid-ered in a case at the Administrative Court of Appeal duringthe year. It would mean a lot for the future if the Adminis-trative Court of Appeal were to decide in our favour.
Gustaf Hermelin
VD:s kommentarStatement by the CEO

KLÖVERN – INTERIM REPORT JANUARY–MARCH 2010 / 4 (16)
Klövern is a real estate company committed to working closelywith customers to meet their needs of premises and services inSwedish growth regions. Klövern has business units in tencities: Borås, Karlstad, Kista, Linköping, Norrköping,Nyköping, Täby, Uppsala, Västerås and Örebro. As at 31March, the value of the properties was SEK 12 billion andthe rental value SEK 1.4 billion.%e Klövern share is listedon Nasdaq OMXNordic Exchange in Stockholm formedium-sized companies.Income statement items are for the period January toMarchand compared with the corresponding period last year.Balance-sheet items refer to the position at the end of theperiod and are compared with the most recent year-end.
ProfitProfit from property management, i.e. profit excludingchanges in value and tax, amounted to SEK 91 million(118). Profit for the period amounted to SEK 26 million(–44). "is result includes positive changes in value ofproperties at SEK 10 million (–139) and negative changesin value of derivatives at SEK –67 million (–31). Equityincreased to SEK 4,138 million (4,112) and the equityratio at the end of the period was 33 per cent (33).
PROFIT FOR A COMPARABLE PORTFOLIO*
31.03.2010 31.03.2009
Area, 000 sq.m. 1,377 1,376Fair value, SEKm 11,969 11,750Required yield, % 7.2 7.2Economic occupancy rate, % 88 90
Net profit for the period, SEKm2010
Jan–Mar2009
Jan–Mar
Rental income 300 304Other income 1 6Property costs –143 –117Operating surplus 158 193
* Refers to the properties owned from 01.01.2009 to 31.03.2010.
Income and occupancy rateIncome during the period amounted to SEK 306 million(316), of which rental income accounted for SEK 305million (310). "e major part of this decrease is attribut-able to index reduction of rental income due to the reducedCPI in 2009. Net moving-in amounted to SEK –8 mil-lion (0). Other income, which consists of income fromrental guarantees and lease redemption paymentsamounted to SEK 1 million (6). "e average remainingcontract term was 3.0 years (3.0) and the economic occu-pancy rate was 88 per cent (89) at the end of the period.
0
50
100
150
200
250
300
0
50
100
150
200
250
300
2010 2011 2012 2013 2014 2015–
Lease contract structureSEKm (bars) 0000 sq.m. (line)
Costs and operating marginProperty costs amounted to SEK 146 million (120)during the period. "e property costs include customerlosses of SEK 1 million (2). Higher costs for snow andice clearance and power consumption have been chargedto income for the first quarter of 2010 than in a normalyear. "e additional cost, net, amounted to SEK 20 mil-lion. "e operating surplus was SEK 160 million (197),which entails an operating margin of 52 per cent (62).
SEK 1 million (1) has been charged to central admin-istration costs for the costs of pursuing Klövern’s taxcases.
Cash flow"e cash flow from current operations before change inworking capital amounted to SEK 93 million (120).Income tax paid amounts to SEK 0 million (0). Invest-ment operations have affected the cash flow by SEK 27(–189) net, mainly due to the sale of three properties inLinköping, Nyköping and Västerås. "e cash flow fromfinancing operations has had an effect of SEK –35 million(171), mainly due to lower interest-bearing liabilities. Over-all, cash flow for the period totals SEK 62 million (70).

KLÖVERN – INTERIM REPORT JANUARY–MARCH 2010 / 5 (16)
FinancingAt the end of the period, interest-bearing liabilitiesamounted to SEK 7,610 million (7,646). "e averagefinancial interest rate for the whole of the financial port-folio amounted to 2.7 per cent (2.7). Excluding deriva-tives and the cost of credit agreements and the overdraftfacility, the interest rate amounted to 1.2 per cent (1.2)on 31 March. "e average fixed interest term was 3.1years (3.2). Credit volumes with swap agreements aretreated as having fixed interest. "e average period oftied-up capital was 1.6 years (1.8). Not utilized creditvolumes, including not utilized overdraft facilities ofSEK 200 million (200), totalled SEK 1,364 million(813) as at 31 March.
SEK 200 million of SEK 2.7 billion of credit agree-ments that mature during 2010 is an overdraft facility.Around SEK 700 million of the remaining SEK 2.5 bil-lion has been renegotiated at the beginning of the secondquarter. Negotiations are in process concerning the refi-nancing terms for the remaining amount of just underSEK 1.8 billion, which matures in November 2010.
At the end of the period, Klövern had interest ratecaps of SEK 3,200 million (3,599), of which SEK 700million mature during 2010, SEK 1,000 million in2011, SEK 500 million in 2012, SEK 500 million in2013 and SEK 500 million in 2014. "e interest ratecaps have a redemption rate of 4.0–4.5 per cent.
On 31 March, swap agreements totalled SEK 3,800million, of which SEK 1.4 billion matures in 2015,SEK 1.4 billion in 2016 and SEK 1 billion in 2017.
FIXED INTEREST AND TIED-UP CAPITAL
Fixed interest Tied-up capital
Maturity year Loan volume, SEKm Interest rate, %Contract volume,
SEKmUtilized,SEKm
Not utilized,SEKm
Variable 3,709 1.4 — — —
2010 32 3.8 2,718 2,345 372
2011 69 6.0 3,250 2,334 917
2012 — — 1,323 1,248 75
2013 — — 1,676 1,676 —
2014 — — 7 7 —
2015 1,400 3.6 — — —
2016 1,400 4.5 — — —
2017 1,000 3.9 — — —
Total 7,610 2.7 8,974 7,610 1,364
Klövern’s interest rate swap agreements and interest capseffectively limit Klövern’s interest rate risk. An increasein the short market rates of one percentage point wouldonly increase Klövern’s average borrowing rate by lessthan a half percentage point. If the market rate increasedby five percentage points, Klövern’s borrowing rate wouldonly increase by 2.1 percentage points from 2.7 per centto 4.8 per cent.
0
1
2
3
4
5
Change of market rate by X percentage points
0 1 2 3 4 5
Sensitivity analysis – the borrowing rate%
Current borrowing rate
Derivatives shall be valued at market value in theincome statement in accordance with IFRS. "e fallingmarket interest rates during 2010 have meant fallingvalues of Klövern’s derivatives. "e changes in value ofderivatives amounted to SEK –67 million (–31) duringthe period and the value was SEK –100 million (–95) on31 March. "e change in value does not affect the cashflow. On maturity, the value of the derivative is alwayszero.

KLÖVERN – INTERIM REPORT JANUARY–MARCH 2010 / 6 (16)
Property acquisitionsNo properties (2) have been acquired in the period Janu-ary to March 2010.
Property salesDuring the period January to March, Klövern has soldone property, where possession has been transferredduring the period. In addition to this property, posses-sion of a further two properties (0) has been transferredduring the period where the sale was agreed during2009. "e sales for the period totalling SEK 91 million(0) have entailed realised positive changes in value ofSEK 3 million (0). During the period, agreement hasalso been reached on sale of a property, where possessionhas been transferred at the beginning of April.
Knut 26 in Västerås: In February 2010, Knut 26 was sold to a localproperty owner in Västerås.
Investments and projectsKlövern’s aim is for the property portfolio to have a netgrowth of at least SEK 1 billion per year. "is increasetakes place both through refurbishment and extensionof existing properties and through acquisitions. Inrecent years, Klövern has also increasingly focused onbuilding rights in local plans or future building rights.
Klövern currently has building rights totalling633,000 sq.m, of which 200,000 sq.m. are in Kista."e major part of the building rights consist of offices.204,000 sq.m. of the total building rights are coveredby local plans. "e value of the building rights amountsto SEK 395 million.
Investment in existing properties often takes place inconnection with new leases with the aim of customizingand modernizing the premises and thus increasing therental value. During the first quarter of 2010, SEK 63million (72) was invested. Investments totalling SEK 14million (54) were made in the projects completed duringthe period, and in certain cases started in previous years.
In addition to the projects completed to date during2010, a large number of major and smaller investmentsare still in progress. In all, 142 projects (112) are in pro-cess for an estimated expenditure totalling SEK 674million (786). A total of SEK 229 million (170) remainsto be invested in these projects.
"e five largest projects in process would entail anincrease in rental value of SEK 21 million after completion.
Lidarände 1 in Kista: A total of SEK 29million is being invested inKista in parking areas adjacent to the conference and exhibitionfacility, Kistamässan.
Properties and changes in valueAs at 31 March 2010, Klövern’s property portfolio con-sisted of 215 properties (217). "e rental value totalledSEK 1,366 million (1,385) and the fair value of theproperties amounted to SEK 12,014 million (12,032)."e total lettable area amounted to 1,389,000 sq.m.(1,392,000).
KLÖVERN’S FIVE LARGEST PROJECTS IN PROCESS
City Property Project typeLettable area
property, sq.m.Project-
area, sq.m.
Occupancyrate propertyafter project,
%
Estimatedinvestment,
SEKm
Remaininginvestment,
SEKm
Increase inrental value
due to project,SEKm
Rental valueafter
project*,SEKm
Expectedcomple-tion, year
Kista Isafjord 1 Office 57,122 36,200 100 233 38 0 91 2011
Norrköping Koppar-hammaren 7
Office/cinema
4,480 4,480 100 74 73 8 8 2011
Norrköping Stjärnan 15 & 16 Office 11,415 4,405 83 58 9 7 14 2010
Kista Lidarände 1 Parking area — — — 29 1 4 29 2010
Uppsala Fyrislund 6:6 Office/lab 58,319 2,050 66 28 27 2 99 2011
Total 131,336 47,135 422 148 21 241
* According to external valuation.

KLÖVERN – INTERIM REPORT JANUARY–MARCH 2010 / 7 (16)
During the period, the change in value of propertiestotalled SEK10 million (–139). "e changes in valueinclude realized changes in value of SEK 3 million (0)and unrealized changes in value of SEK 7 million(–139). "e unrealized changes in value do not affect thecash flow. On average, Klövern’s property portfolio hasbeen valued as at 31 March with a required yield of7.2 per cent (7.2).
Klövern values 100 per cent of its property portfolioevery quarter. 20–30 per cent of the valuations are car-ried out by DTZ Sweden and the remainder by Klövern.Accordingly, every property in the portfolio is valuedexternally during a rolling 12-month period. DTZ hasalso served as advisor when the required yields have beendetermined in the internal valuations. See Klövern’sannual report for 2009 for a detailed description of valu-ation principles.
FAIR VALUE, SEKm 2010 2009
Fair value as at 1 January 12,032 11,895
Acquisitions — 117
Investments 63 72
Sales –91 —
Changes in value 10 –139
Fair value as at 31 March 12,014 11,945
Profit and key ratios per business unitProfit per business unit shows current operations, whichinclude properties acquired and investments made dur-ing the period. "e key ratios per business unit refers tothe situation at the respective year-end, however, andthe figures in the two tables are accordingly not whollycomparable.
PROFIT PER BUSINESS UNIT
Income, SEKm Costs, SEKm Operating surplus, SEKm Operating margin, %Booked investments,
SEKm
2010Jan–Mar
2009Jan–Mar
2010Jan–Mar
2009Jan–Mar
2010Jan–Mar
2009Jan–Mar
2010Jan–Mar
2009Jan–Mar
2010Jan–Mar
2009Jan–Mar
Borås 11 11 –6 –5 5 6 45 55 0 1Karlstad 44 45 –20 –17 24 28 55 62 12 3Kista 84 87 –30 –26 54 61 64 70 16 43Linköping 35 37 –14 –13 21 24 60 65 4 4Norrköping 22 22 –14 –12 8 10 36 50 4 7Nyköping 26 25 –13 –8 13 17 50 64 8 -4Täby 15 16 –7 –6 8 10 53 63 0 0Uppsala 18 15 –14 –10 4 5 22 33 9 5Västerås 34 35 –21 –16 13 19 38 54 9 9Örebro 16 18 –8 –6 8 12 50 67 1 4Övrigt* 1 6 1 –1 2 5 — — — —Total 306 317 –146 –120 160 197 52 62 63 72
* Income consists of rent guarantees and lease redemption payments.Costs consist of items that are not directly attributable to normal real estate operations.
KEY RATIOS PER BUSINESS UNITS
Fair value, SEKm Required yield, % Area, 000 sq.m. Rental value, SEKm Econ. occupancy rate, %31.03.2010 31.03.2009 31.03.2010 31.03.2009 31.03.2010 31.03.2009 31.03.2010 31.03.2009 31.03.2010 31.03.2009
Borås 393 397 7.9 7.8 80 80 51 51 88 88Karlstad 1,528 1,499 7.4 7.4 203 207 191 192 94 94Kista 4,196 4,035 6.6 6.5 253 252 363 362 93 95Linköping 1,345 1,468 7.3 7.2 165 175 157 171 89 90Norrköping 844 863 7.4 7.3 143 145 105 109 83 82Nyköping 866 875 7.9 7.9 131 124 108 104 91 95Täby 535 523 7.6 7.5 68 67 69 69 93 94Uppsala 589 514 8.5 8.7 67 66 101 98 67 63Västerås 1,185 1,229 7.5 7.4 217 217 157 159 82 87Örebro 533 542 7.0 7.0 62 62 64 67 91 95Total 12,014 11,945 7.2 7.2 1,389 1,395 1,366 1,382 88 90

KLÖVERN – INTERIM REPORT JANUARY–MARCH 2010 / 8 (16)
The share and the shareholders"e Klövern share is listed on Nasdaq OMX NordicExchange in Stockholm list for medium-sized compa-nies. On 31 March, the share price was SEK 26.00 pershare (22.90), which corresponds to a total capitalizationof SEK 4.2 billion (3.7). As at 31 March, the numberof registered shares in Klövern was 166,544,326. "enumber of shareholders was 29,427 (29,943), of which84 per cent (86) were Swedish.
"e board of directors of Klövern has been authorizedsince 2007 to repurchase Klövern shares up to a maximumof 10 per cent of the total number of registered shares.
In accordance with the decisions previously made,Klövern has repurchased 5,741,463 shares, correspond-ing to 3.4 per cent of the total number of registeredshares. "ese shares were acquired at an average priceof SEK 22.15 per share. No new repurchases have beenmade during the period.
SHAREHOLDERS
31 March 2010No. of shares,thousands
Share of votesand equity, %
Change 2010,%-points
Corem Property Group 17,376 10.8 –1.7Federation of Swedish Farmers* 17,117 10.6 0.0
Arvid Svensson Invest 17,017 10.6 0.0Investment AB Öresund 15,404 9.6 0.0Brinova Inter 6,856 4.3 0.0Länsförsäkringar fonder* 6,265 3.9 0.6Swedbank Robur fonder* 4,755 3.0 –0.1Länsförsäkringar Södermanland 4,345 2.7 0.2HQ fonder* 4,295 2.7 0.0Government of Norway 2,158 1.3 0.0Total major shareholders 95,588 59.5 –1.0Other shareholders 65,215 40.5Total outstanding shares 160,803 100.0Repurchased own shares 5,741Total registered shares 166,544*Owner group.
5,000
10,000
15,000
20,000
2003 2004 2005 2006 2007 2008 2009 201010
15
20
25
30
35
40
No. of sharestraded, 000sKlövern OMX Stockholm_PI SX4040 Real Estate_PI
The Klövern share
© NASDAQ OMX
SEK
Number ofshares, 000s

KLÖVERN – INTERIM REPORT JANUARY–MARCH 2010 / 9 (16)
Tax situationOutcome of tax casesIn February 2010, the Administrative Court of Appealdecided in favour of Klövern in the matter of a tax sur-charge of SEK 493 million. According to the Adminis-trative Court of Appeal, and also previously the CountyAdministrative Court, a tax surcharge cannot beimposed since Klövern had withdrawn its request for anadditional deduction at the time the surcharge wasimposed. After the end of the period, the Tax Agencyhas appealed the case to the Supreme AdministrativeCourt. "e Supreme Administrative Court has not yetnotified whether leave to appeal will be granted or not.
Tax for the periodDeferred tax of SEK –8 million (–19) has been chargedto profit for the period, excluding changes in value, i.e.the profit of current real estate operations. Profit for theperiod also includes unrealized changes in value forproperties and financial instruments at SEK –60 million(–170). Depreciation for tax purposes has been made atSEK 60 million. "e basis for deferred tax is unchangedsince 1 January and thus does not affect the result for theperiod. In all, a cost of SEK –8 million (8) for deferredtax and current tax of SEK 0 million (0) have beenincluded in profit for the period.
Possible new tax loss carryforwardsBesides Klövern’s established deficits, the companymade a loss of around SEK 5,000 million in 2002 in itsprevious business as an IT company. At the end of 2003,Klövern requested that tax assessment for the same yearshould be reconsidered with a view to having consideredwhether Klövern was also entitled to this tax loss carry-forward. In the spring of 2006, Klövern withdrew itsrequest for reconsideration. In 2006, Klövern submitteda new request for a loss carryforward. "e renewedrequest was rejected by the County AdministrativeCourt in February 2009 and Klövern has appealed tothe Administrative Court of Appeal. A judgment isexpected during 2010.
PersonnelKlövern’s business concept entails closeness to the cus-tomer by having our own staff at all business units. Allemployees work in accordance with the motto “makingthe customer’s day easier every day”. At the end of theperiod, the number of employees in Klövern was 126(123). "e average age was 44 (44) and the proportionof women is 41 per cent (39).
Important risks and uncertainty factorsKlövern’s substantial risks and uncertainty factors aredescribed on pages 26–29 of the 2009 annual report.No substantial risks have arisen subsequently.
Emma in Nyköping.
Accounting policies"is interim report has been prepared in accordancewith the Annual Accounts Act and IAS 34 InterimFinancial Reporting and, in the case of the parent com-pany, the Annual Accounts Act. "e accounting policiesapplied in this interim report are those described inKlövern’s annual report for 2009, note 1.
The Board’s recommended dividend"e Board is recommending a dividend of SEK 1.25 pershare (1.00) for the 2009 financial year, correspondingto a total of SEK 201 million (161). "e proposed recorddate is 23 April 2010 and dividend is expected to be paidon 28 April 2010.
Events after the end of the periodAfter the end of the period, the Tax Agency hasappealed in the matter of a tax surcharge of SEK 493million to the Supreme Administrative Court, whichhas not yet notified whether leave to appeal will begranted or not.
Possession of one property has been transferred afterthe end of the period without any realized change invalue.
A five-year lease contract has been entered into withSigma at the property Forskarbyn 2, Netcity. "e annualrent amounts to over SEK 2.3 million.
Nyköping, 20 April 2010
Klövern AB"e Board of Directors
"is interim report has not been subject to scrutiny byKlövern’s auditors.

KLÖVERN – INTERIM REPORT JANUARY–MARCH 2010 / 10 (16)
Consolidated Statement of Income
SEK million
20103 monthsJan–Mar
20093 monthsJan–Mar
200912 monthsJan–Dec
Rolling12 monthsApr–Mar
Rental income 305 311 1,231 1,225Other income 1) 1 6 23 19Total income 306 317 1,254 1,244
Property costs –146 –120 –474 –500Operating surplus 160 197 780 744
Central administration –16 –18 –66 –65Net financial income –53 –61 –221 –213Profit from property management 91 118 493 466
Changes in value, properties 10 –139 –231 –82Changes in value, derivatives –67 –31 34 –2Profit before tax 34 –52 296 382
Current tax 0 0 –9 –9Deferred tax –8 8 –50 –66Net profit for the period 26 –44 237 307
Other comprehensive income — — — —Comprehensive income for the period 26 –44 237 307
Earnings per share, SEK 0.16 –0.27 1.48 1.91
No. of shares at end of period, million 161 161 161 161
Average no. of shares, million 161 161 161 161
There are no outstanding warrants or convertibles.
1) Income from rental guarantees and lease redemption payments.

KLÖVERN – INTERIM REPORT JANUARY–MARCH 2010 / 11 (16)
Consolidated balance sheetSEK million 31.03.2010 31.03.2009 31.12.2009
AssetsInvestment properties 12,014 11,945 12,032Machinery and equipment 9 11 10Deferred tax asset 409 388 418Accounts receivable 112 117 83Liquid funds 86 137 24Total assets 12,630 12,598 12,567
Shareholders’ equity and liabilitiesEquity 4,138 3,991 4,112Deferred tax liability 370 282 370Interest-bearing liabilities 7,610 7,816 7,646Derivatives 100 95 31Accounts payable 63 54 104Other liabilities 13 21 15Accrued expenses and prepaid income 336 339 289Total shareholders’ equity and liabilities 12,630 12,598 12,567
Change in Group Shareholder’s EquitySEK million
Equity, 1 January 2009 4,035
Dividend –161Net profit for the period 237
Equity, 31 December 2009 4,112
Net profit for the period 26
Equity, 31 March 2010 4,138
KLÖVERN – INTERIM REPORT JANUARY–MARCH 2010 / 12 (16)
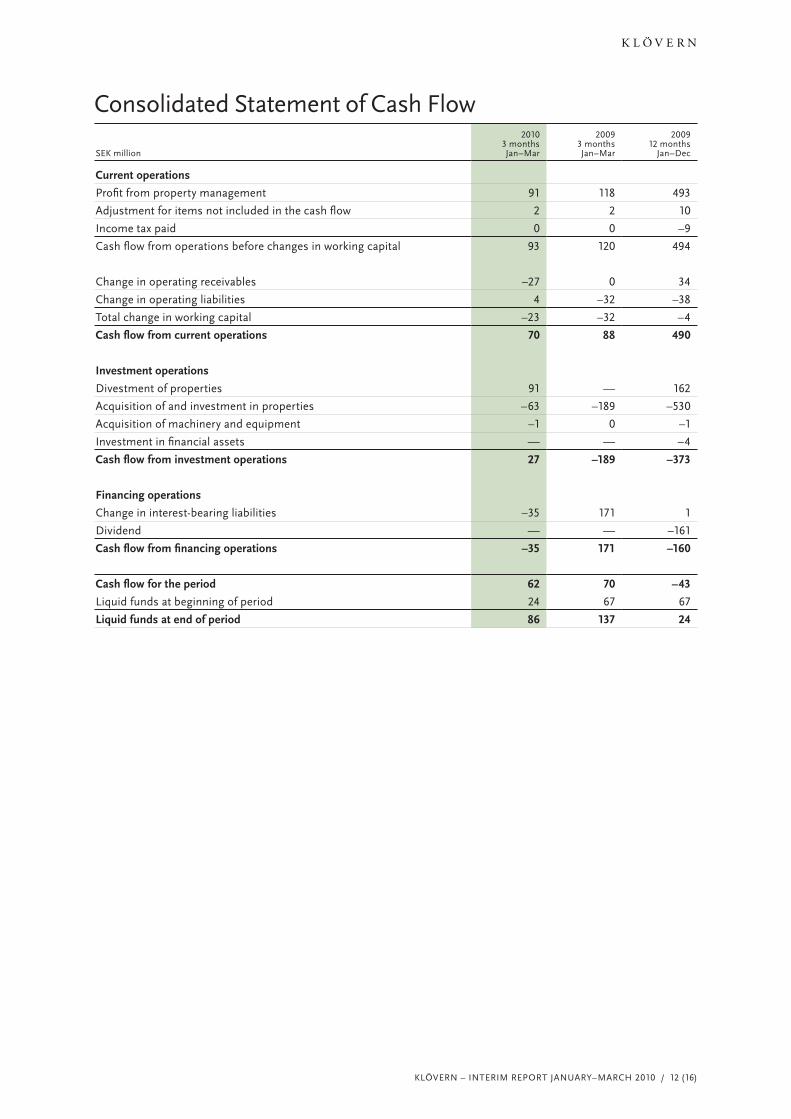
Consolidated Statement of Cash Flow
SEK million
20103 monthsJan–Mar
20093 monthsJan–Mar
200912 monthsJan–Dec
Current operationsProfit from property management 91 118 493Adjustment for items not included in the cash flow 2 2 10Income tax paid 0 0 –9Cash flow from operations before changes in working capital 93 120 494
Change in operating receivables –27 0 34Change in operating liabilities 4 –32 –38Total change in working capital –23 –32 –4Cash flow from current operations 70 88 490
Investment operationsDivestment of properties 91 — 162Acquisition of and investment in properties –63 –189 –530Acquisition of machinery and equipment –1 0 –1Investment in financial assets — — –4Cash flow from investment operations 27 –189 –373
Financing operationsChange in interest-bearing liabilities –35 171 1Dividend — — –161Cash flow from financing operations –35 171 –160
Cash flow for the period 62 70 –43Liquid funds at beginning of period 24 67 67Liquid funds at end of period 86 137 24

KLÖVERN – INTERIM REPORT JANUARY–MARCH 2010 / 13 (16)
Parent Company Statement of Income
SEK million
20103 monthsJan–Mar
20093 monthsJan–Mar
200912 monthsJan–Dec
Net sales 25 23 98Cost of services sold –19 –17 –72Gross profit 6 6 26
Central administration –16 –18 –67Operating profit –10 –12 –41
Result from other securities 26 — —Interest income 0 0 0Interest expense 0 0 –2Profit after financial items 16 –12 –43
Current tax — — –9Tax attributable to group contribution — — 30Deferred tax –9 –19 11Net profit 7 –31 –11
Parent Company Balance SheetSEK million 31.03.2010 31.03.2009 31.12.2009
AssetsMachinery and equipment 2 3 2Participation rights in group companies 320 320 320Receivables from group companies 3,274 3,230 3,297Deferred tax asset 409 388 418Accounts receivable 7 3 10Liquid funds 58 105 8Total assets 4,070 4,049 4,055
Shareholders’ equity and liabilitiesEquity 3,003 3,055 2,996Liabilities to group companies 1,015 948 1,031Accounts payable 3 3 9Other liabilities 14 10 7Accrued expenses and prepaid income 35 33 12Total shareholders’ equity and liabilities 4,070 4,049 4,055

KLÖVERN – INTERIM REPORT JANUARY–MARCH 2010 / 14 (16)
Key ratios31.03.20103 months
31.03.20093 months
31.03.201012 months 2009 2008 2007 2006 2005
Property-related
No. of properties 215 219 215 217 217 220 205 162Lettable area, 000 sq.m. 1,389 1,395 1,389 1,392 1,382 1,394 1,436 1,042Rental value, SEKm 1,366 1,382 1,366 1,385 1,360 1,309 1,276 798Book value properties, SEKm 12,014 11,945 12,014 12,032 11,895 12,154 10,701 5,968Direct yield requirement valuation, % 7.2 7.2 7.2 7.2 7.1 6.6 6.9 8.0Operating margin, % 52 62 60 62 62 63 60 61Economic occupancy rate, % 88 90 88 89 90 88 84 87Average lease term, years 3.0 3.1 3.0 3.0 3.1 2.9 2.6 2.8
Financial-related
Return on equity, % 0.6 –1.1 7.5 5.8 –10.7 28.1 20.6 19.1Equity ratio, % 32.8 31.7 32.8 32.7 32.3 37.4 33.7 34.8Leverage, % 63 65 63 64 64 58 64 67Interest coverage ratio, multiples 2.7 2.9 3.2 3.2 2.0 2.2 2.6 2.0Average interest, % 2.7 3.0 2.7 2.7 4.2 4.6 4.1 3.5Average fixed interest period, years 3.1 3.5 3.1 3.2 1.1 1.4 1.8 1.0Average period of tied-up capital,years
1.6 2.4 1.6 1.8 2.6 3.7 4.3 4.6
Interest-bearing liabilities, SEKm 7,610 7,815 7,610 7,646 7,645 7,007 6,878 3,987
Share-related
Profit from property managementper share, SEK
0.57 0.73 2.90 3.07 2.17 2.32 2.25 1.49
Equity per share, SEK 25.7 24.8 25.7 25.6 25.1 29.4 23.2 18.8Share price at end of period, SEK 26.0 15.8 26.0 22.9 18.2 25.5 30.0 24.5No. of shares registered at end ofperiod, million
166.5 166.5 166.5 166.5 166.5 166.5 166.5 120.4
Outstanding shares at end of period,million
160.8 160.8 160.8 160.8 160.8 165.8 166.5 120.4
Dividend, SEK — — — 1.25* 1.00 1.50 1.25 1.00
* Proposed dividend.

KLÖVERN – INTERIM REPORT JANUARY–MARCH 2010 / 15 (16)
DefinitionsProperty-relatedDirect yield requirement valuationThe required yield of property valuations on the residual value.
Economic occupancy rateRental income in relation to rental value at the end of the period.
Operating marginOperating surplus as a percentage of total income.
Operating surplusTotal income less rent losses, operating andmaintenance costs,site leasehold charges and property tax.
Other incomeIncome from rental guarantees and redemption of leases.
Profit from property managementProfit before changes in value and tax.
Realised change in value, propertiesProperty sales during the period after deduction of the proper-ties’ most recent reported fair value and selling expenses.
Rental valueContract value plus assessedmarket rent for space not rented atthe end of the period.
Unrealised change in value, propertiesChange in fair value of the property portfolio after deduction ofinvestments made at the end of each period.
Finance-relatedEquity ratioReported equity in relation to reported total assets at the end ofthe period.
Interest coverage ratioProfit from property management plus financial costs in relationto financial costs.
LeverageInterest-bearing liabilities relating to properties in relation to thevalue of the properties at the end of the period.
Return on equityNet profit in relation to average equity.
Share-relatedEarnings per shareProfit for the period in relation to the average number of out-standing shares.
Equity per shareReported equity in relation to the number of outstanding sharesat the end of the period.
Profit from property management per shareProfit from property management in relation to the averagenumber of outstanding shares.

Contact personsGustaf Hermelin, CEO+46 155-44 33 10, +46 70-560 00 00, [email protected]
Caesar Åfors, CFO and vice-President+46 155-44 33 02, +46 70-662 48 48, [email protected]
Britt-Marie Einar, Finance and Information Manager+46 155-44 33 12, +46 70-224 29 35, [email protected]
Klövern AB (publ), Box 1024, SE-611 29 Nyköping, Sweden • Tel +46 155-44 33 00 • Fax +46 155-44 33 22
Reg.no 556482-5833 • Registered office: Nyköping • Webbsite: www.klovern.se
CalendarInterim report Jan–Jun 2010 8 July 2010
Interim report Jan–Sep 2010 21 October 2010
Year-end report 2010 17 February 2011
Annual report for 2010 March 2011
Annual General Meeting 2011 13 April 2011


