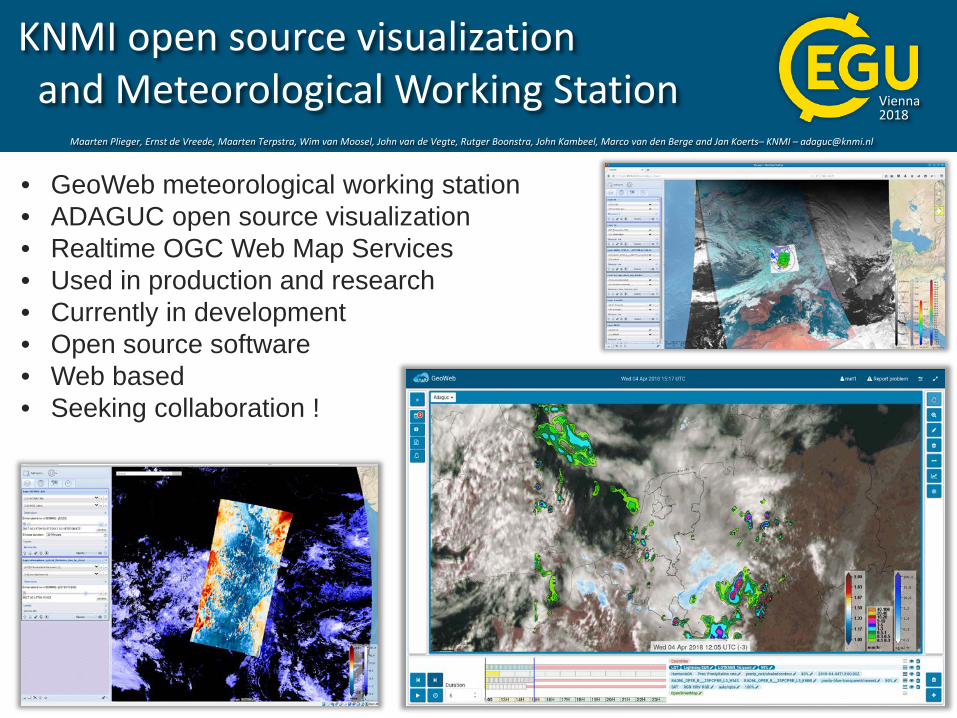
Maarten Plieger, Ernst de Vreede, Maarten Terpstra, Wim van Moosel, John van de Vegte, Rutger Boonstra, John Kambeel, Marco van den Berge and Jan Koerts– KNMI – [email protected]KNMI open source visualization and Meteorological Working Station • GeoWeb meteorological working station • ADAGUC open source visualization • Realtime OGC Web Map Services • Used in production and research • Currently in development • Open source software • Web based • Seeking collaboration ! Vienna 2018
Transcript
Maarten Plieger, Ernst de Vreede, Maarten Terpstra, Wim van Moosel, John van de Vegte, Rutger Boonstra, John Kambeel, Marco van den Berge and Jan Koerts– KNMI – [email protected]
KNMI open source visualization and Meteorological Working Station • GeoWeb meteorological working station • ADAGUC open source visualization • Realtime OGC Web Map Services • Used in production and research • Currently in development • Open source software • Web based • Seeking collaboration !
Vienna 2018
Maarten Plieger, Ernst de Vreede, Maarten Terpstra, Wim van Moosel, John van de Vegte, Rutger Boonstra, John Kambeel, Marco van den Berge and Jan Koerts– KNMI – [email protected]
ADAGUC open source visualization utilized in the KNMI GeoWeb project
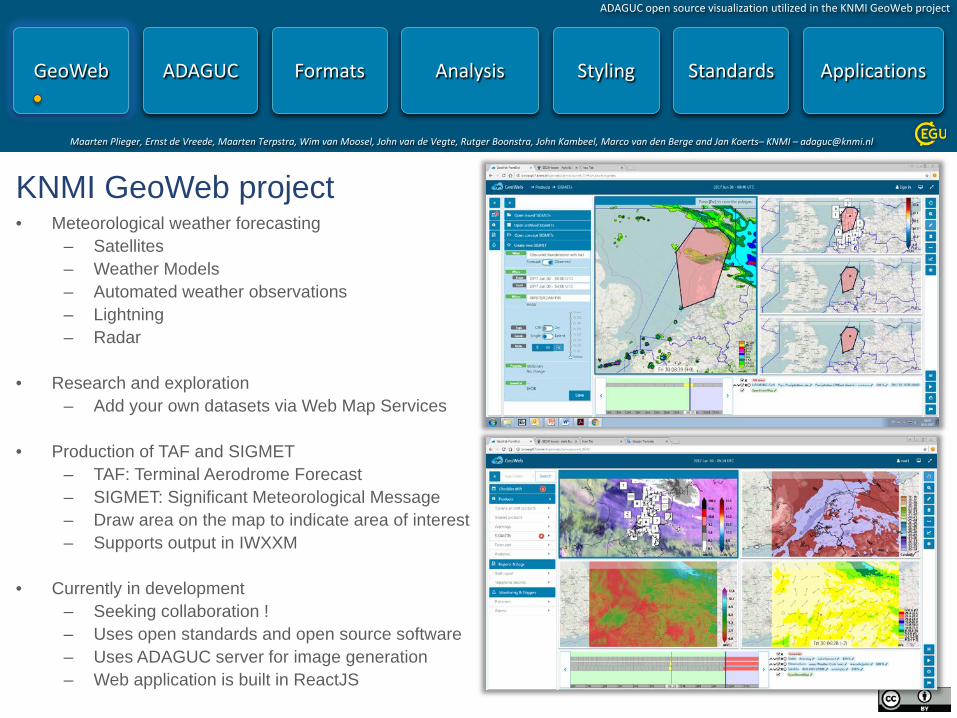
• Production of TAF and SIGMET – TAF: Terminal Aerodrome Forecast – SIGMET: Significant Meteorological Message – Draw area on the map to indicate area of interest – Supports output in IWXXM
• Currently in development
– Seeking collaboration ! – Uses open standards and open source software – Uses ADAGUC server for image generation – Web application is built in ReactJS
ADAGUC open source visualization utilized in the KNMI GeoWeb project
Maarten Plieger, Ernst de Vreede, Maarten Terpstra, Wim van Moosel, John van de Vegte, Rutger Boonstra, John Kambeel, Marco van den Berge and Jan Koerts– KNMI – [email protected]
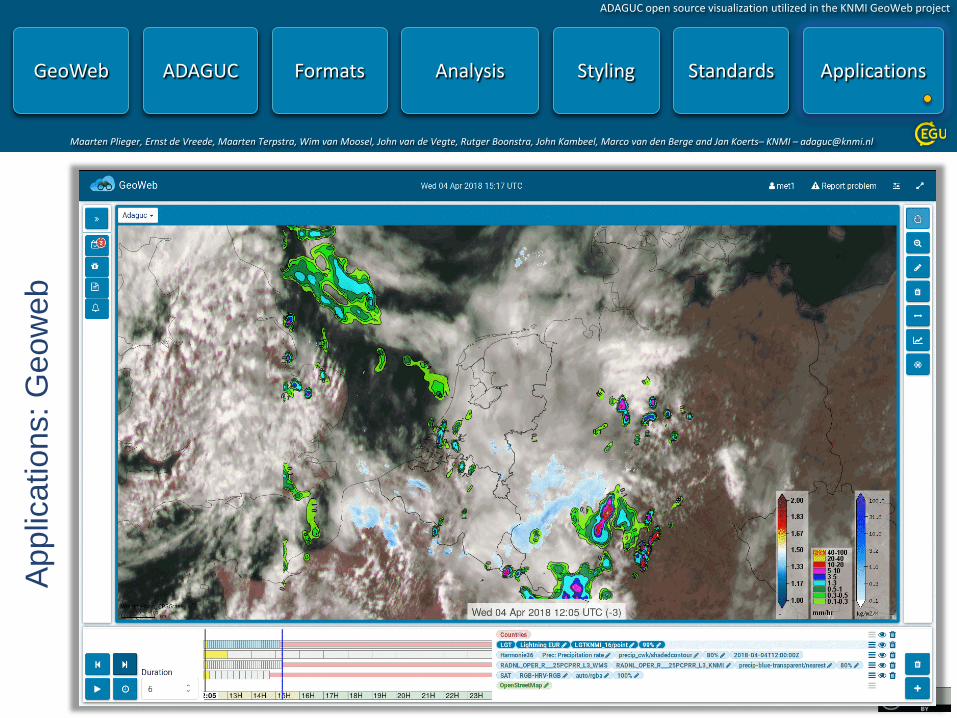
GeoWeb
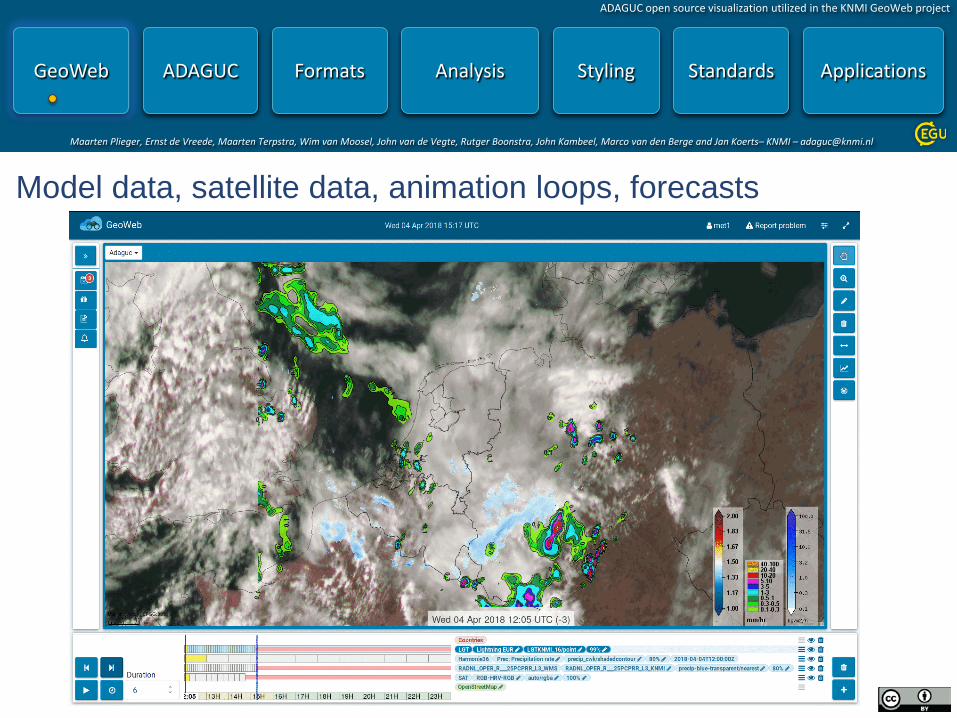
Model data, satellite data, animation loops, forecasts
ADAGUC open source visualization utilized in the KNMI GeoWeb project
Maarten Plieger, Ernst de Vreede, Maarten Terpstra, Wim van Moosel, John van de Vegte, Rutger Boonstra, John Kambeel, Marco van den Berge and Jan Koerts– KNMI – [email protected]
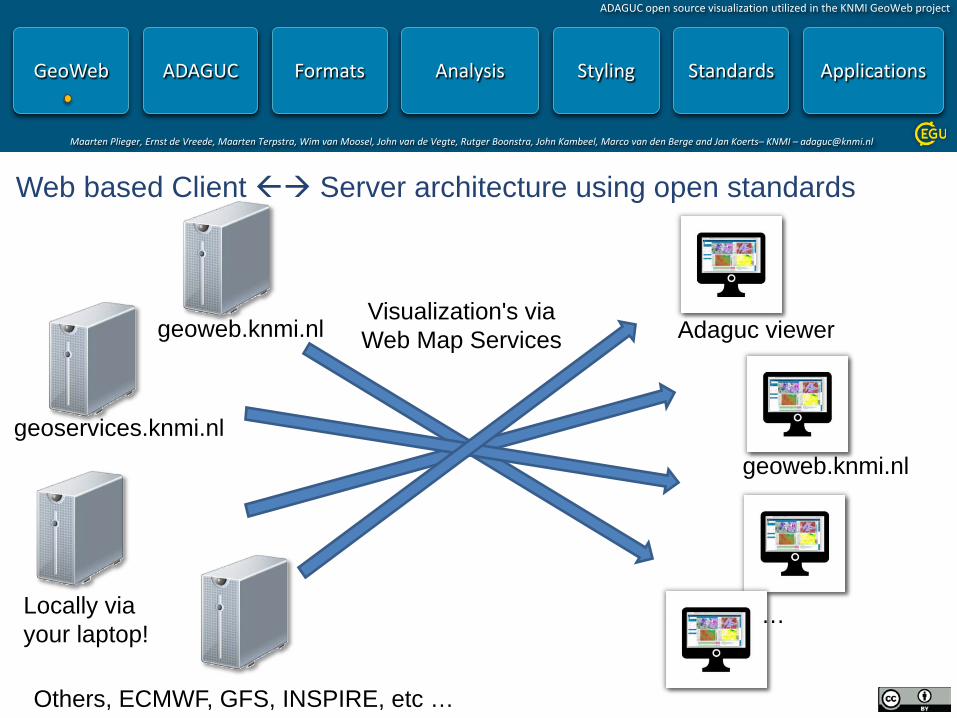
Web based Client Server architecture using open standards
geoservices.knmi.nl
geoweb.knmi.nl
Others, ECMWF, GFS, INSPIRE, etc …
geoweb.knmi.nl
Adaguc viewer
Locally via your laptop!
…
Visualization's via Web Map Services
Maarten Plieger, Ernst de Vreede, Maarten Terpstra, Wim van Moosel, John van de Vegte, Rutger Boonstra, John Kambeel, Marco van den Berge and Jan Koerts– KNMI – [email protected]
ADAGUC open source visualization utilized in the KNMI GeoWeb project
GeoWeb Technical fundamentals Currently supported (desktop)browsers: Google Chrome Mozilla Firefox Testing: Unit testing of components Automated integrated tests using Selenium Usage tests (Make users use the product) Performance tests
GeoWeb Back-End: Written in Java with Spring Boot Application server: Apache Tomcat Deployed using Docker image GeoWeb Front-End: Written in Javacript Components/plugins used:
- React (JavaScript library for building user interfaces) - Redux (predictable state container for JavaScript apps) - Bootstrap (toolkit for developing with HTML, CSS and JS) - ADAGUC WebMapJS viewer (viewer for displaying Geo-Referenced data)
Deployed using Docker image ADAGUC WMS-server Packaged using Docker as ADAGUC Services Currently supported formats: KNMI-HDF5, NetCDF and GeoJson Data from KDC Data from other WMS-servers
ADAGUC open source visualization utilized in the KNMI GeoWeb project
Maarten Plieger, Ernst de Vreede, Maarten Terpstra, Wim van Moosel, John van de Vegte, Rutger Boonstra, John Kambeel, Marco van den Berge and Jan Koerts– KNMI – [email protected]
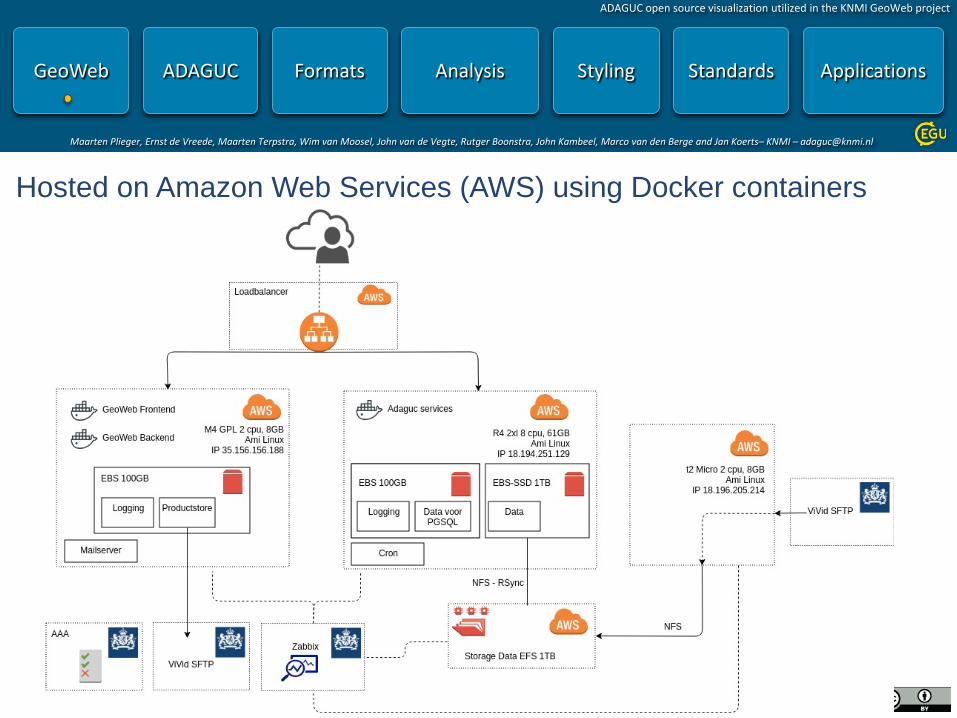
Hosted on Amazon Web Services (AWS) using Docker containers
ADAGUC open source visualization utilized in the KNMI GeoWeb project
Maarten Plieger, Ernst de Vreede, Maarten Terpstra, Wim van Moosel, John van de Vegte, Rutger Boonstra, John Kambeel, Marco van den Berge and Jan Koerts– KNMI – [email protected]
ADAGUC open source visualization utilized in the KNMI GeoWeb project
Maarten Plieger, Ernst de Vreede, Maarten Terpstra, Wim van Moosel, John van de Vegte, Rutger Boonstra, John Kambeel, Marco van den Berge and Jan Koerts– KNMI – [email protected]
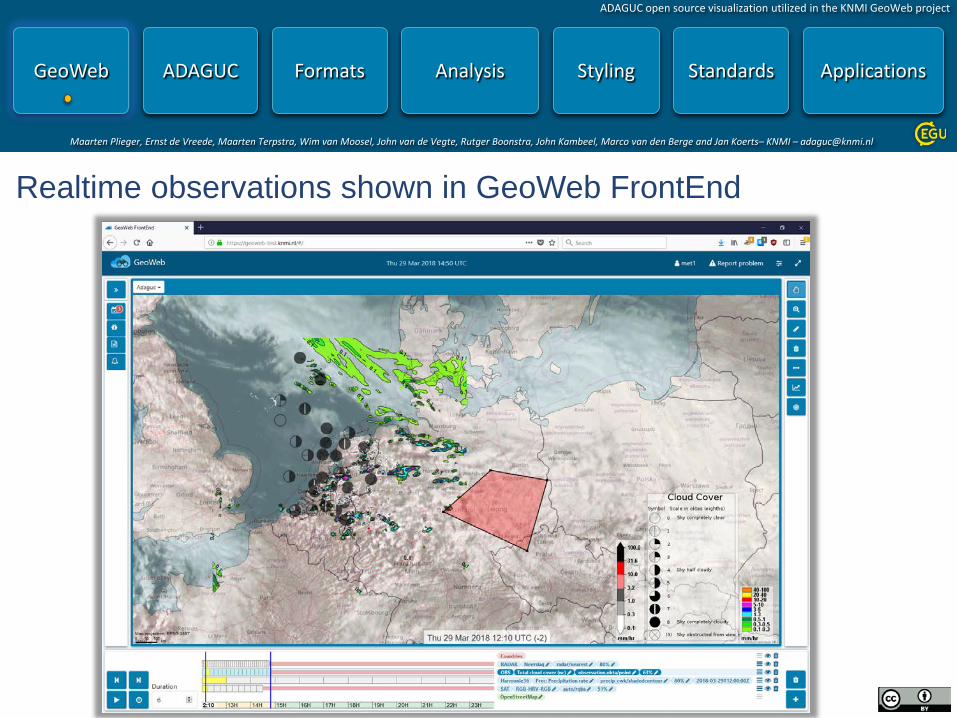
GeoWeb
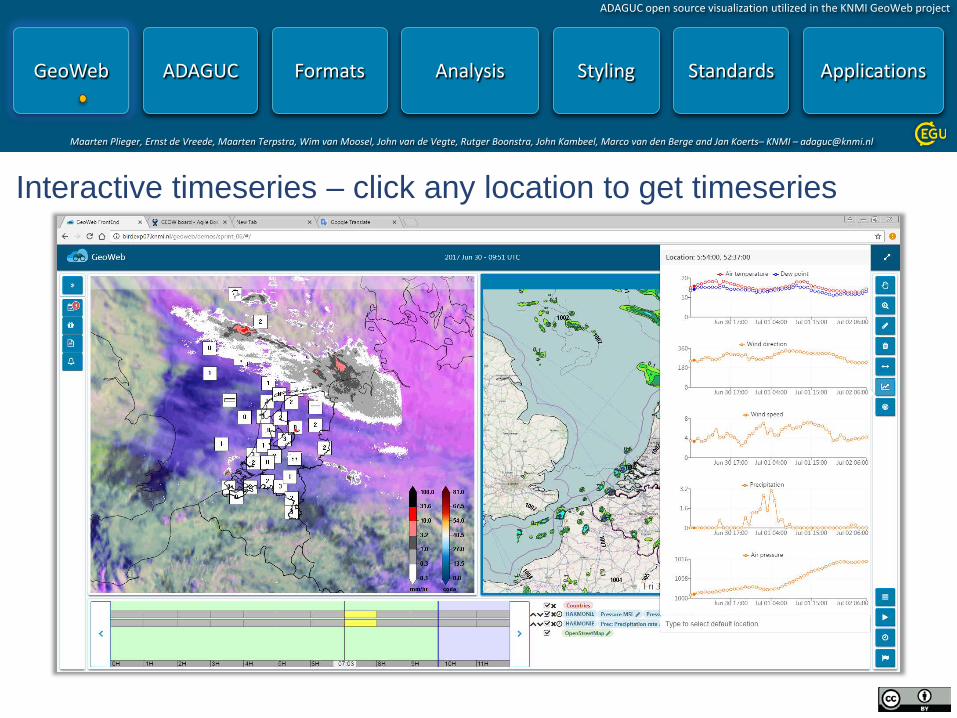
Interactive timeseries – click any location to get timeseries
ADAGUC open source visualization utilized in the KNMI GeoWeb project
Maarten Plieger, Ernst de Vreede, Maarten Terpstra, Wim van Moosel, John van de Vegte, Rutger Boonstra, John Kambeel, Marco van den Berge and Jan Koerts– KNMI – [email protected]
GeoWeb
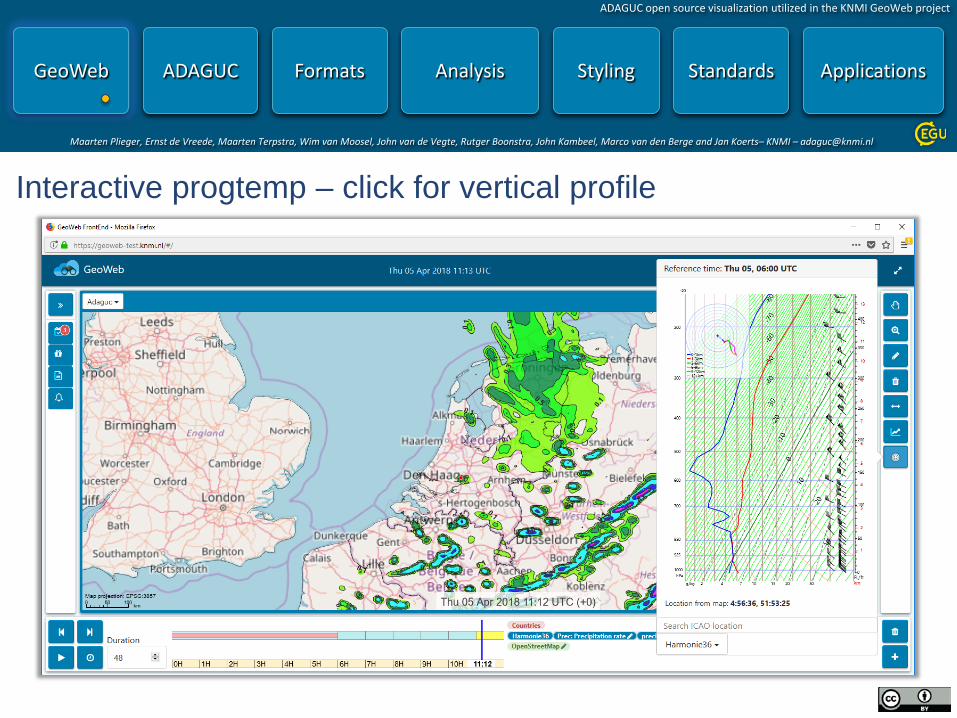
Interactive progtemp – click for vertical profile
ADAGUC open source visualization utilized in the KNMI GeoWeb project
Maarten Plieger, Ernst de Vreede, Maarten Terpstra, Wim van Moosel, John van de Vegte, Rutger Boonstra, John Kambeel, Marco van den Berge and Jan Koerts– KNMI – [email protected]
ADAGUC – Visualization and data server • ADAGUC – Atmospheric Data Access for the Geospatial User Community
– Serves OPeNDAP, WMS,WCS
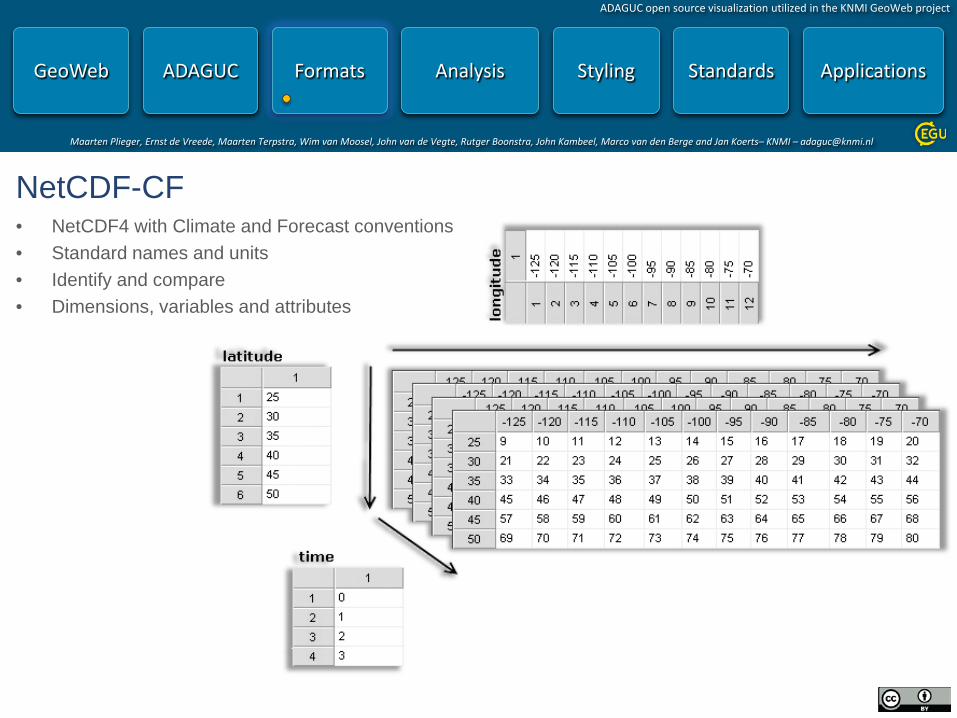
– Reads NetCDF with Climate and Forecast Conventions
– Reads HDF5, PNG, GeoJSON, WMS and OPeNDAP
– Supports multiple dimensions
• TIME / ELEVATION / ensemble / threshold / member / etc ...
– Realtime and live update of new data and aggregations
• Concatenate huge amounts of NetCDF files to a single dataset
• Precipitation radar is publicly available as WMS, data since 2009, new data each 5 minutes, ~900.000 timesteps accessible
– Automatic visualization and exploration of new data. Can be opendap services, NetCDF files, THREDDS catalogs, etc ...
– Server is written in C++, high performance, realtime reprojections
– Docker container is available
• Allows to quickstart with ADAGUC
• Used in production environment
– Supports tiling of high res imagery for interactive viewing
– Adaguc workshop on June 6,7 and 8. Interested?: mail to [email protected]
ADAGUC open source visualization utilized in the KNMI GeoWeb project
Maarten Plieger, Ernst de Vreede, Maarten Terpstra, Wim van Moosel, John van de Vegte, Rutger Boonstra, John Kambeel, Marco van den Berge and Jan Koerts– KNMI – [email protected]
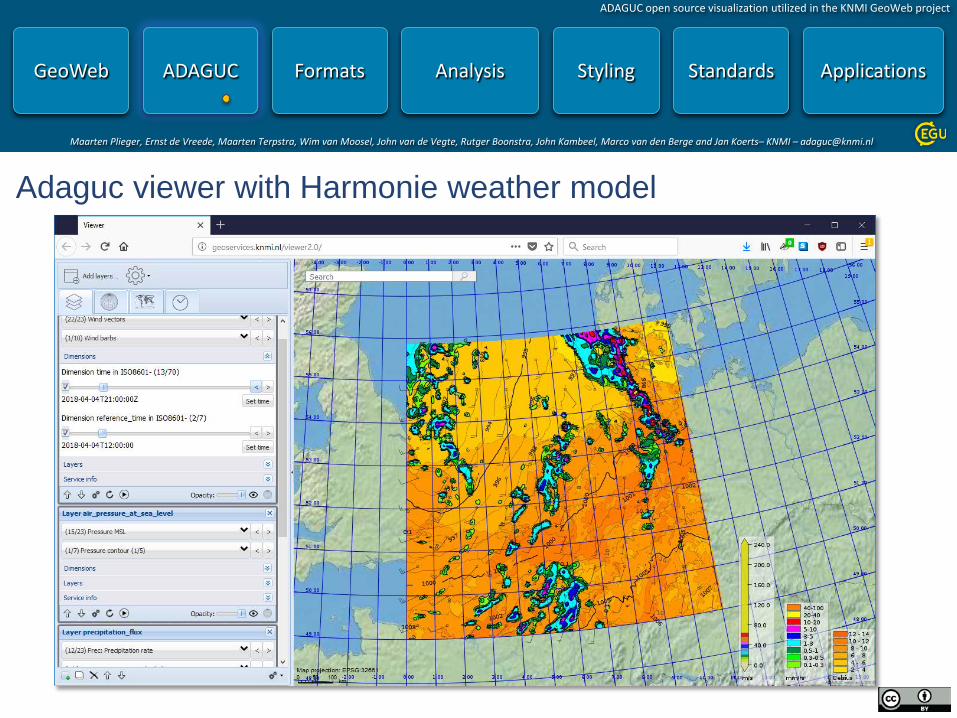
ADAGUC
Observations Every 10 minutes Precipitation Active radar Harmonie Weather model Suomi NPP Polar Satellite Meteosat Geostationary satellite
ADAGUC viewer for combining datasets
ADAGUC open source visualization utilized in the KNMI GeoWeb project
Maarten Plieger, Ernst de Vreede, Maarten Terpstra, Wim van Moosel, John van de Vegte, Rutger Boonstra, John Kambeel, Marco van den Berge and Jan Koerts– KNMI – [email protected]
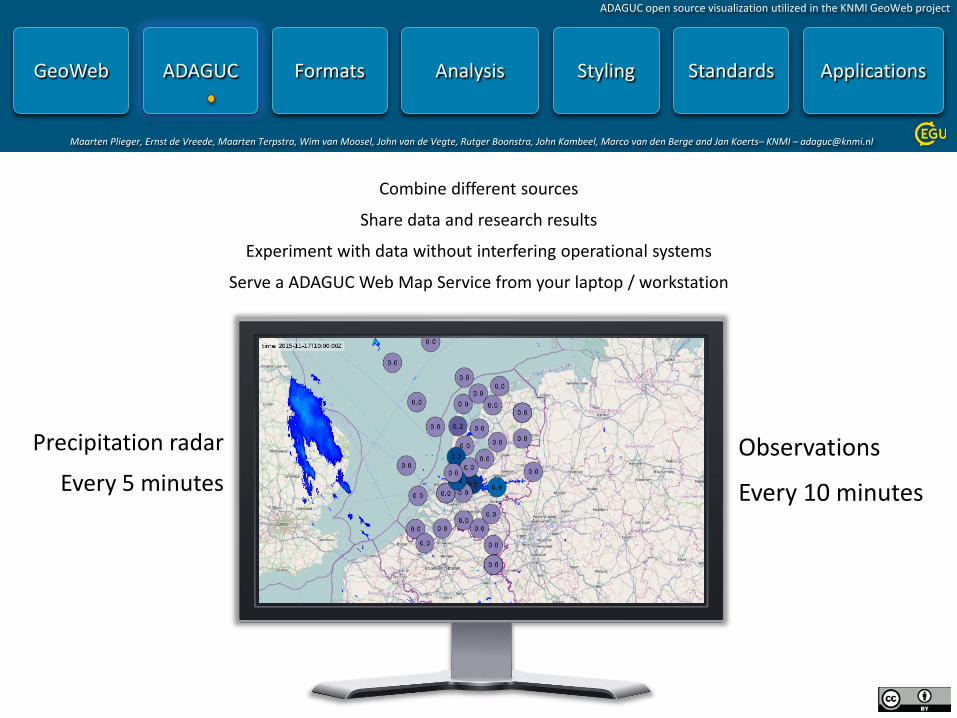
ADAGUC
Combine different sources
Share data and research results
Experiment with data without interfering operational systems
Serve a ADAGUC Web Map Service from your laptop / workstation
ADAGUC open source visualization utilized in the KNMI GeoWeb project
Maarten Plieger, Ernst de Vreede, Maarten Terpstra, Wim van Moosel, John van de Vegte, Rutger Boonstra, John Kambeel, Marco van den Berge and Jan Koerts– KNMI – [email protected]
ADAGUC open source visualization utilized in the KNMI GeoWeb project
Maarten Plieger, Ernst de Vreede, Maarten Terpstra, Wim van Moosel, John van de Vegte, Rutger Boonstra, John Kambeel, Marco van den Berge and Jan Koerts– KNMI – [email protected]
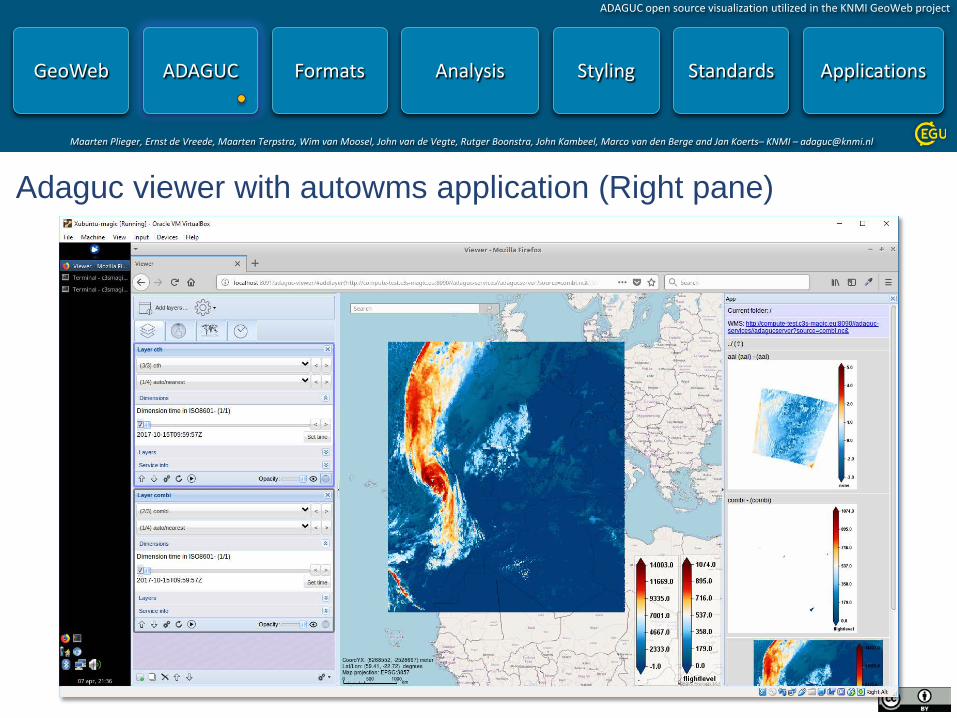
ADAGUC
Adaguc viewer with autowms application (Right pane)
Maarten Plieger, Ernst de Vreede, Maarten Terpstra, Wim van Moosel, John van de Vegte, Rutger Boonstra, John Kambeel, Marco van den Berge and Jan Koerts– KNMI – [email protected]
ADAGUC open source visualization utilized in the KNMI GeoWeb project
ADAGUC open source visualization utilized in the KNMI GeoWeb project
Maarten Plieger, Ernst de Vreede, Maarten Terpstra, Wim van Moosel, John van de Vegte, Rutger Boonstra, John Kambeel, Marco van den Berge and Jan Koerts– KNMI – [email protected]
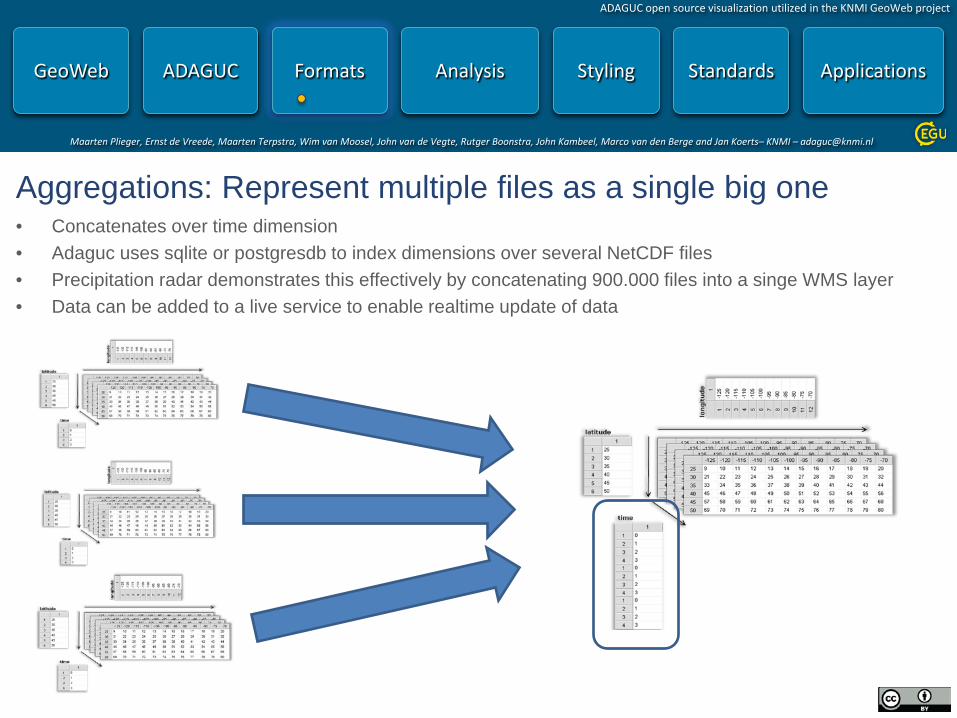
Aggregations: Represent multiple files as a single big one • Concatenates over time dimension • Adaguc uses sqlite or postgresdb to index dimensions over several NetCDF files • Precipitation radar demonstrates this effectively by concatenating 900.000 files into a singe WMS layer • Data can be added to a live service to enable realtime update of data
ADAGUC open source visualization utilized in the KNMI GeoWeb project
Maarten Plieger, Ernst de Vreede, Maarten Terpstra, Wim van Moosel, John van de Vegte, Rutger Boonstra, John Kambeel, Marco van den Berge and Jan Koerts– KNMI – [email protected]
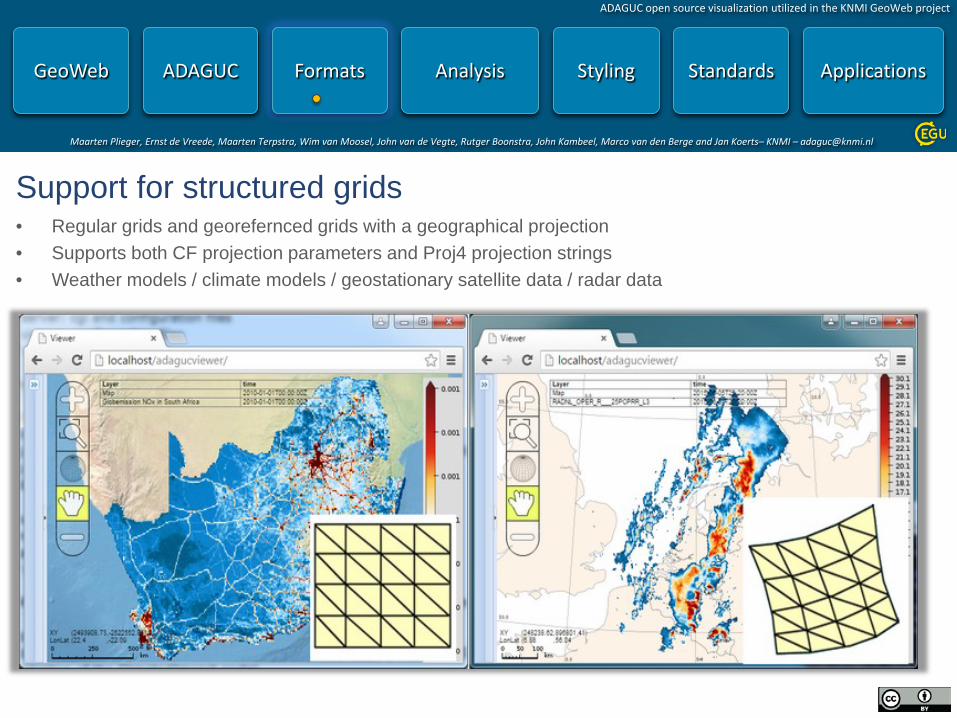
Support for structured grids • Regular grids and georefernced grids with a geographical projection • Supports both CF projection parameters and Proj4 projection strings • Weather models / climate models / geostationary satellite data / radar data
ADAGUC open source visualization utilized in the KNMI GeoWeb project
Maarten Plieger, Ernst de Vreede, Maarten Terpstra, Wim van Moosel, John van de Vegte, Rutger Boonstra, John Kambeel, Marco van den Berge and Jan Koerts– KNMI – [email protected]
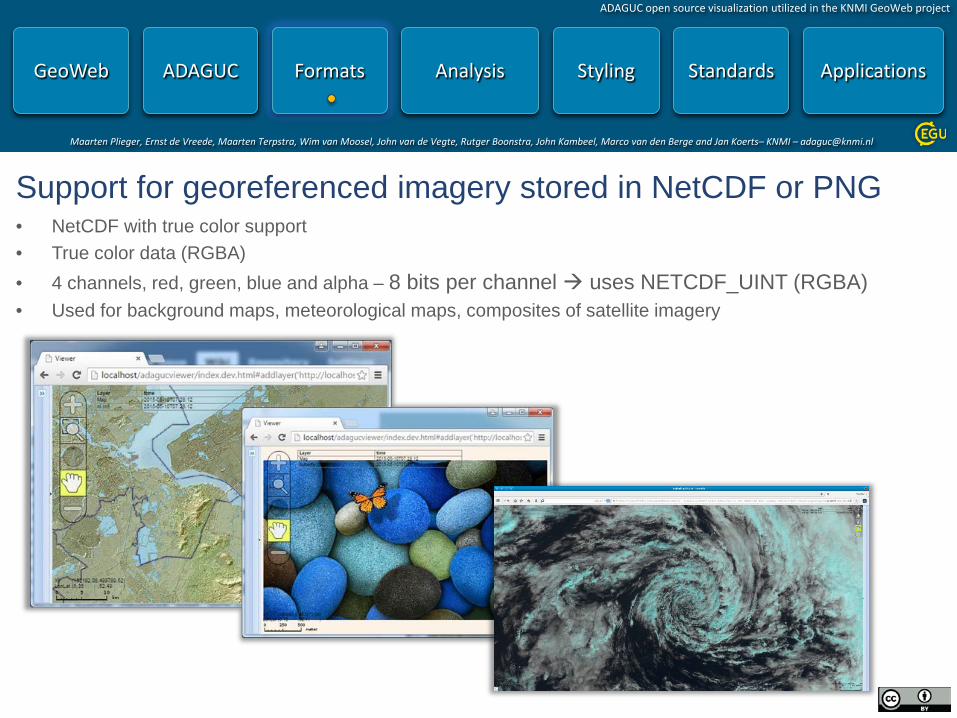
Support for georeferenced imagery stored in NetCDF or PNG • NetCDF with true color support • True color data (RGBA) • 4 channels, red, green, blue and alpha – 8 bits per channel uses NETCDF_UINT (RGBA) • Used for background maps, meteorological maps, composites of satellite imagery
ADAGUC open source visualization utilized in the KNMI GeoWeb project
Maarten Plieger, Ernst de Vreede, Maarten Terpstra, Wim van Moosel, John van de Vegte, Rutger Boonstra, John Kambeel, Marco van den Berge and Jan Koerts– KNMI – [email protected]
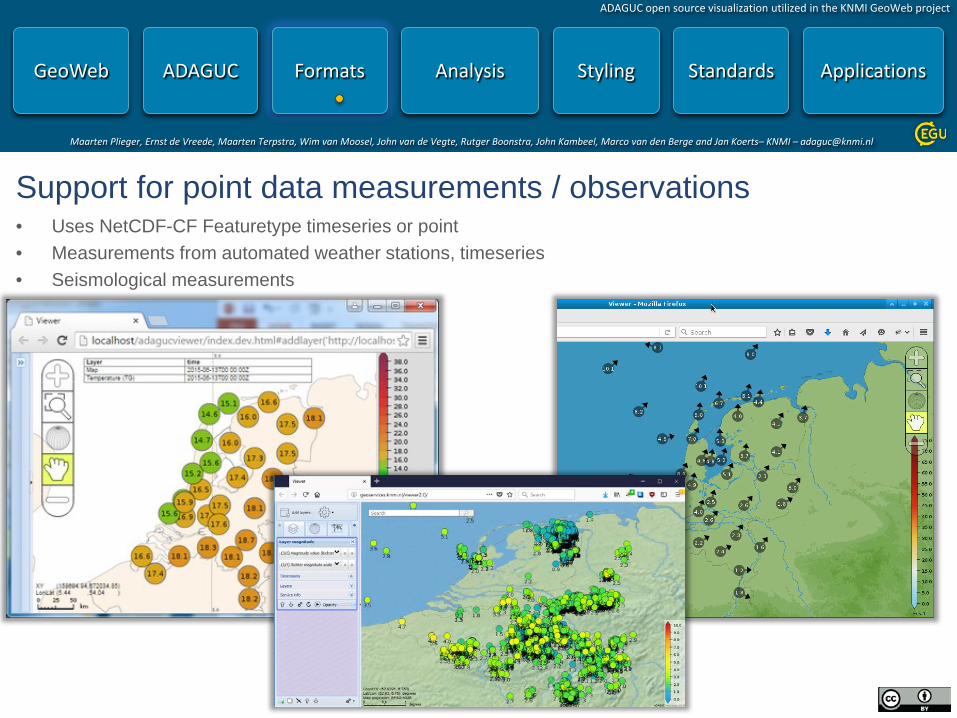
Support for point data measurements / observations • Uses NetCDF-CF Featuretype timeseries or point • Measurements from automated weather stations, timeseries • Seismological measurements
ADAGUC open source visualization utilized in the KNMI GeoWeb project
Maarten Plieger, Ernst de Vreede, Maarten Terpstra, Wim van Moosel, John van de Vegte, Rutger Boonstra, John Kambeel, Marco van den Berge and Jan Koerts– KNMI – [email protected]
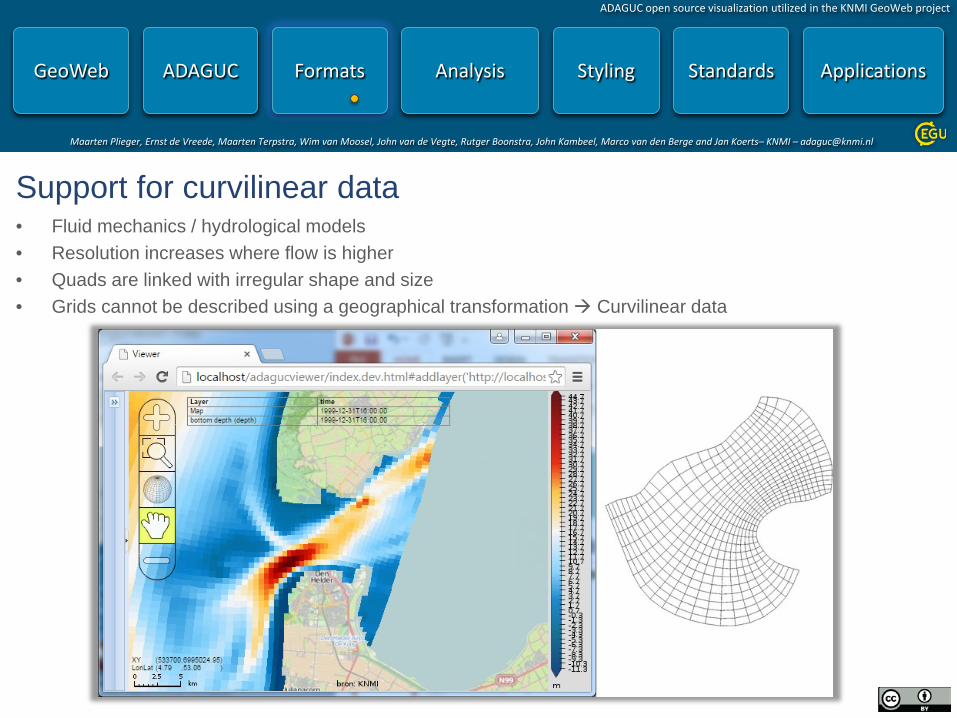
Support for curvilinear data • Fluid mechanics / hydrological models • Resolution increases where flow is higher • Quads are linked with irregular shape and size • Grids cannot be described using a geographical transformation Curvilinear data
ADAGUC open source visualization utilized in the KNMI GeoWeb project
Maarten Plieger, Ernst de Vreede, Maarten Terpstra, Wim van Moosel, John van de Vegte, Rutger Boonstra, John Kambeel, Marco van den Berge and Jan Koerts– KNMI – [email protected]
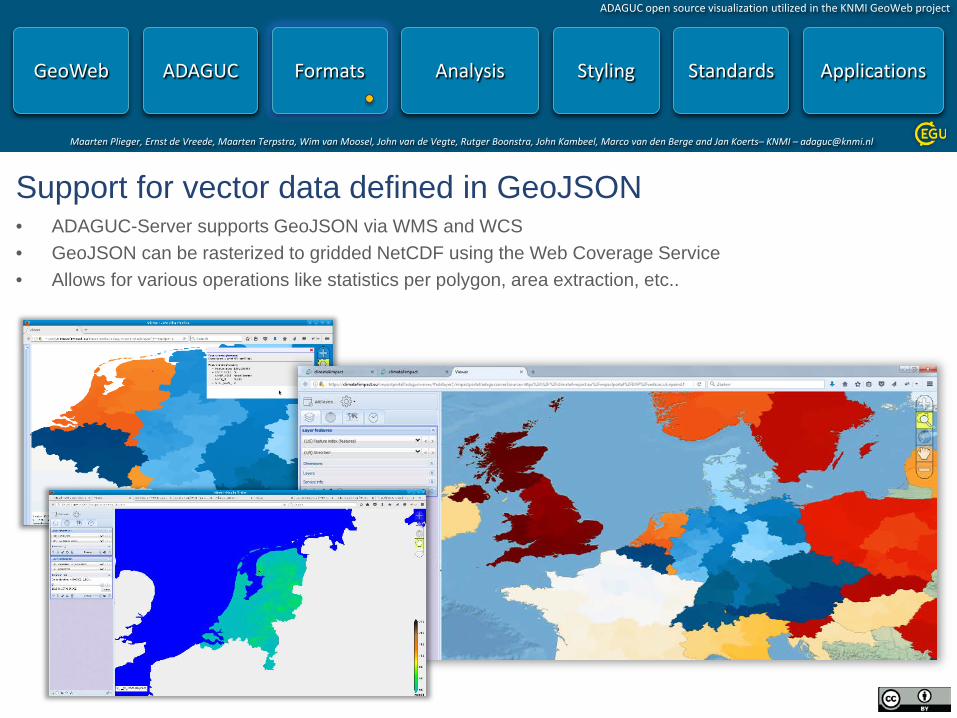
Support for vector data defined in GeoJSON • ADAGUC-Server supports GeoJSON via WMS and WCS • GeoJSON can be rasterized to gridded NetCDF using the Web Coverage Service • Allows for various operations like statistics per polygon, area extraction, etc..
ADAGUC open source visualization utilized in the KNMI GeoWeb project
Maarten Plieger, Ernst de Vreede, Maarten Terpstra, Wim van Moosel, John van de Vegte, Rutger Boonstra, John Kambeel, Marco van den Berge and Jan Koerts– KNMI – [email protected]
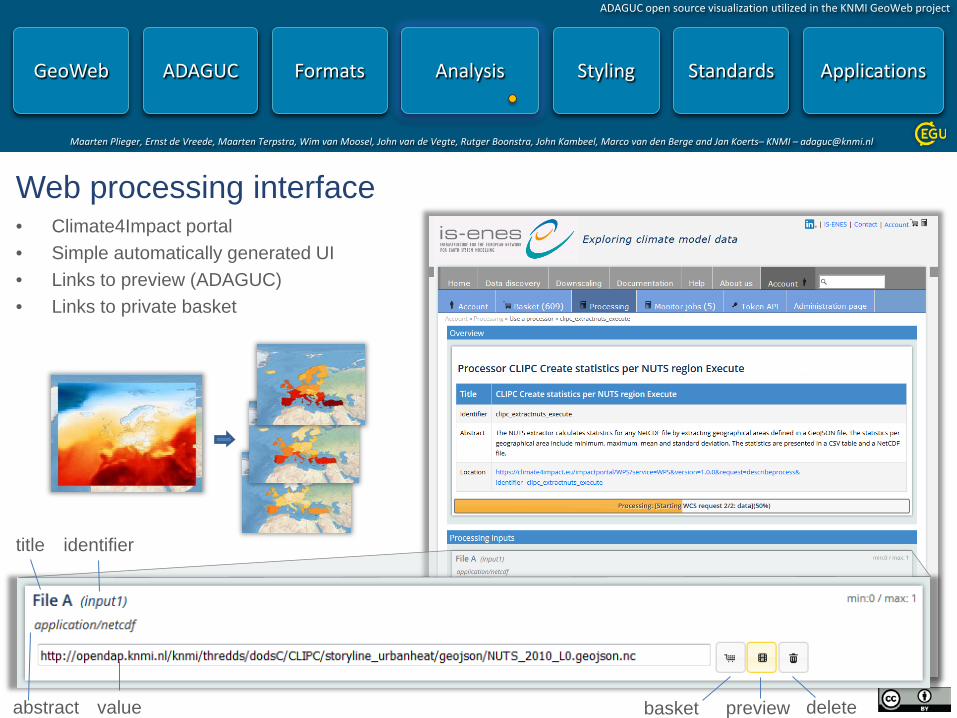
Analysis with adaguc-services, adaguc-server and PyWPS • ADAGUC-Services is a Java Spring application controlling ADAGUC-Server and PyWPS • Adaguc-Server is utilized for visualization and geographical processing (WMS / WCS) • PyWPS is utilized for generic web processing (WPS), climate indicator calculation, combining data • This framework is in development and used in CLIPC / C3S-Magic / IS-ENES Climate4Impact • Adaguc services supports x509 client certificate authentication and OAuth2 authentication (ESGF) • Processed results are stored in a personal basket with private OpenDAP support • Processed results can be re-used in new calculations and can be visualized using ADAGUC-Server
ADAGUC open source visualization utilized in the KNMI GeoWeb project
Maarten Plieger, Ernst de Vreede, Maarten Terpstra, Wim van Moosel, John van de Vegte, Rutger Boonstra, John Kambeel, Marco van den Berge and Jan Koerts– KNMI – [email protected]
• Calculates statistics per region from grids • Uses Adaguc-services framework • Mean, min, max, etc ... • Uses GeoJSON for region definition (E.g. NUTS regions) • Outputs NetCDF and CSV
Analysis: extract statistics per country Maximum per region
ADAGUC open source visualization utilized in the KNMI GeoWeb project
Maarten Plieger, Ernst de Vreede, Maarten Terpstra, Wim van Moosel, John van de Vegte, Rutger Boonstra, John Kambeel, Marco van den Berge and Jan Koerts– KNMI – [email protected]
• Climate4Impact portal • Simple automatically generated UI • Links to preview (ADAGUC) • Links to private basket
ADAGUC open source visualization utilized in the KNMI GeoWeb project
Maarten Plieger, Ernst de Vreede, Maarten Terpstra, Wim van Moosel, John van de Vegte, Rutger Boonstra, John Kambeel, Marco van den Berge and Jan Koerts– KNMI – [email protected]
ADAGUC open source visualization utilized in the KNMI GeoWeb project
Maarten Plieger, Ernst de Vreede, Maarten Terpstra, Wim van Moosel, John van de Vegte, Rutger Boonstra, John Kambeel, Marco van den Berge and Jan Koerts– KNMI – [email protected]
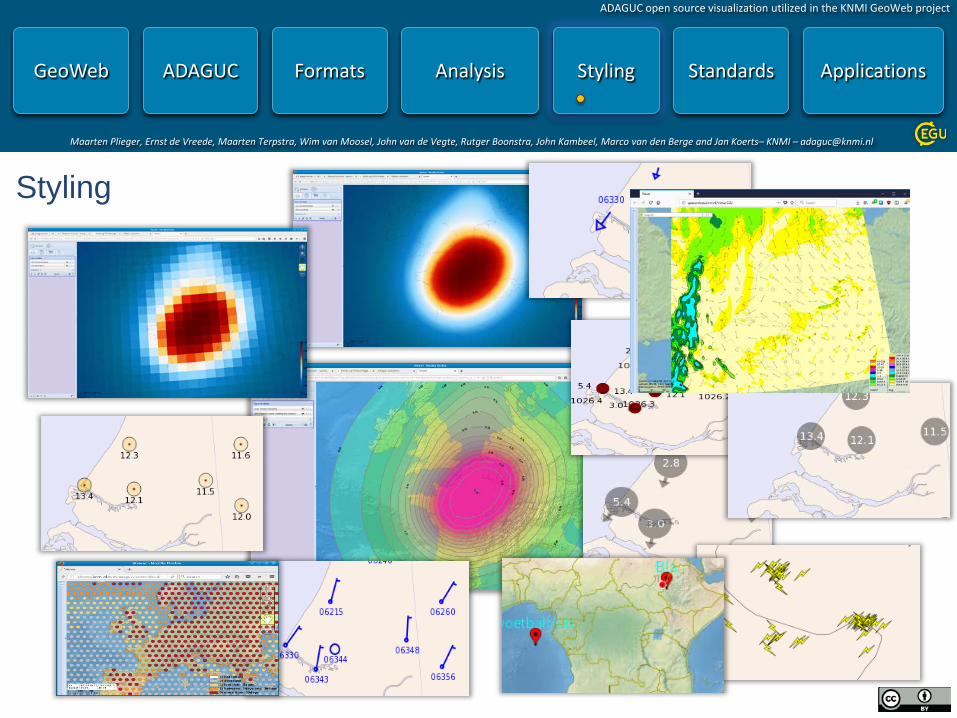
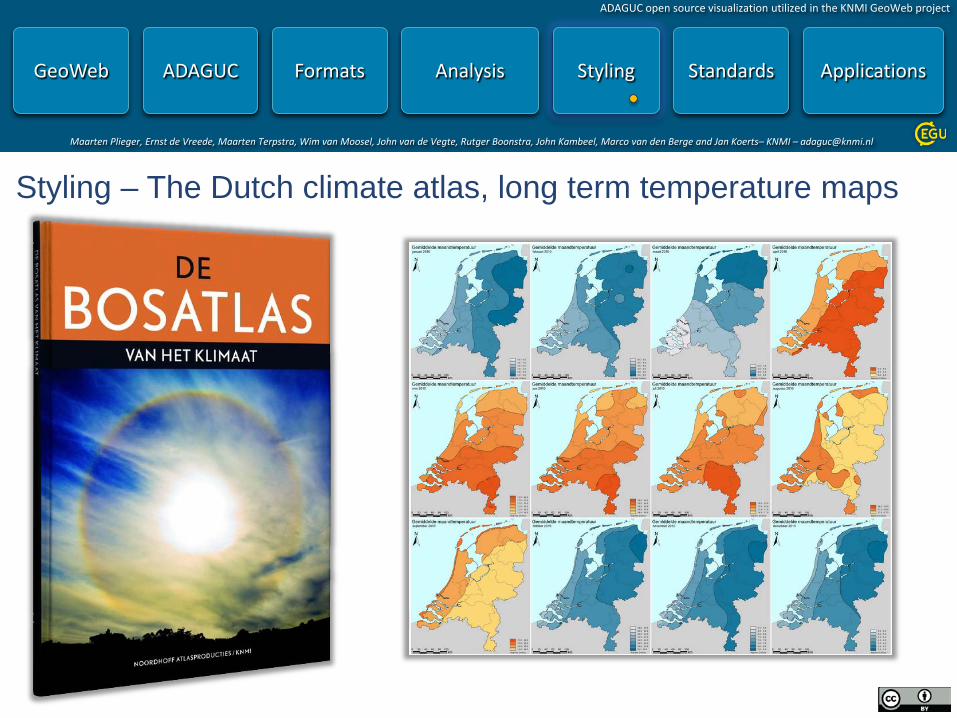
Styling – The Dutch climate atlas, long term temperature maps
ADAGUC open source visualization utilized in the KNMI GeoWeb project
Maarten Plieger, Ernst de Vreede, Maarten Terpstra, Wim van Moosel, John van de Vegte, Rutger Boonstra, John Kambeel, Marco van den Berge and Jan Koerts– KNMI – [email protected]
ADAGUC open source visualization utilized in the KNMI GeoWeb project
Maarten Plieger, Ernst de Vreede, Maarten Terpstra, Wim van Moosel, John van de Vegte, Rutger Boonstra, John Kambeel, Marco van den Berge and Jan Koerts– KNMI – [email protected]
ADAGUC Web Map Services Interactively view huge datasets
ADAGUC open source visualization utilized in the KNMI GeoWeb project
Maarten Plieger, Ernst de Vreede, Maarten Terpstra, Wim van Moosel, John van de Vegte, Rutger Boonstra, John Kambeel, Marco van den Berge and Jan Koerts– KNMI – [email protected]
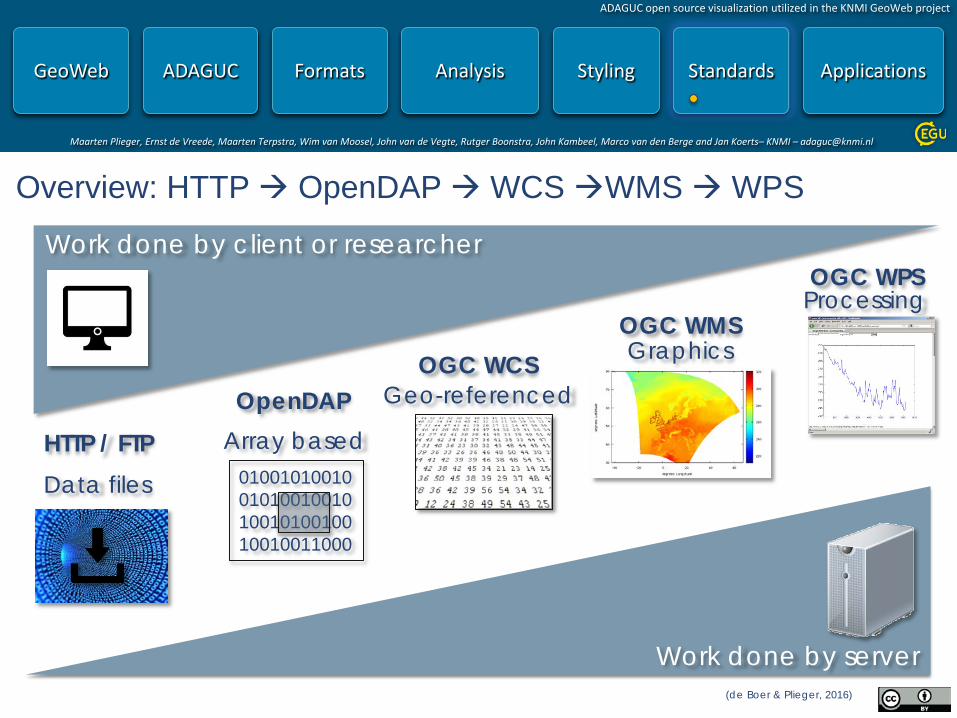
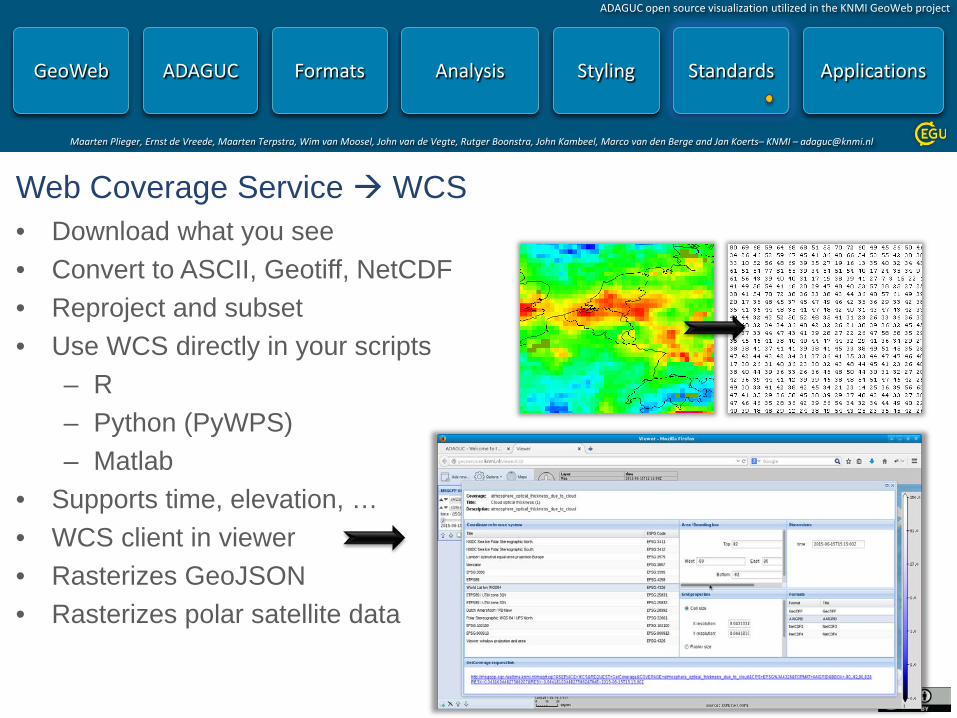
Web Coverage Service WCS • Download what you see • Convert to ASCII, Geotiff, NetCDF • Reproject and subset • Use WCS directly in your scripts
– R – Python (PyWPS) – Matlab
• Supports time, elevation, … • WCS client in viewer • Rasterizes GeoJSON • Rasterizes polar satellite data
ADAGUC open source visualization utilized in the KNMI GeoWeb project
Maarten Plieger, Ernst de Vreede, Maarten Terpstra, Wim van Moosel, John van de Vegte, Rutger Boonstra, John Kambeel, Marco van den Berge and Jan Koerts– KNMI – [email protected]
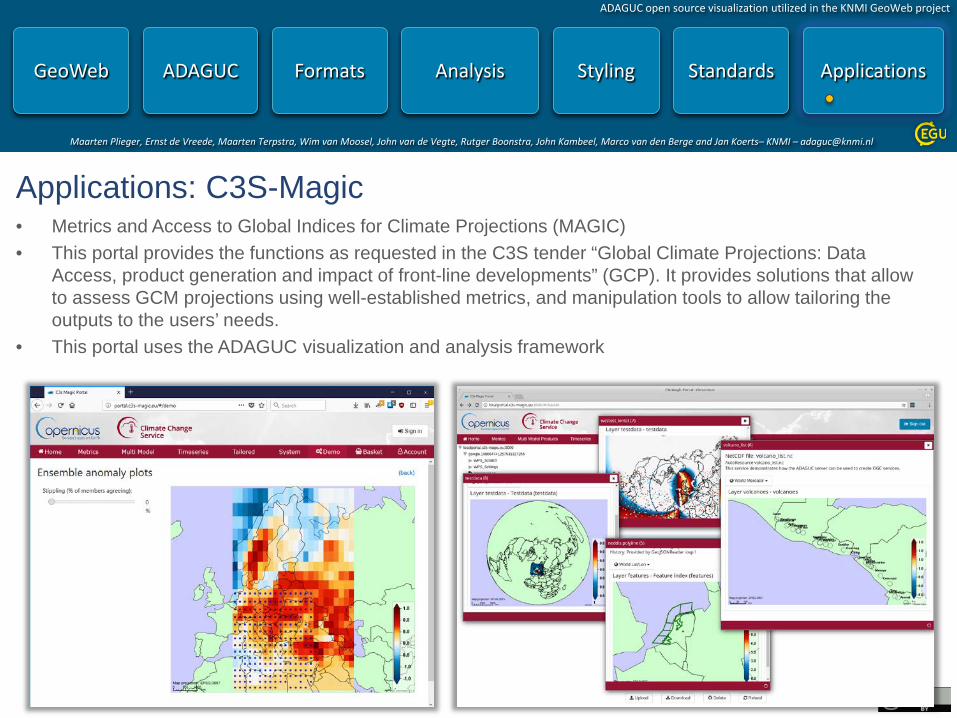
Applications: C3S-Magic • Metrics and Access to Global Indices for Climate Projections (MAGIC) • This portal provides the functions as requested in the C3S tender “Global Climate Projections: Data
Access, product generation and impact of front-line developments” (GCP). It provides solutions that allow to assess GCM projections using well-established metrics, and manipulation tools to allow tailoring the outputs to the users’ needs.
• This portal uses the ADAGUC visualization and analysis framework
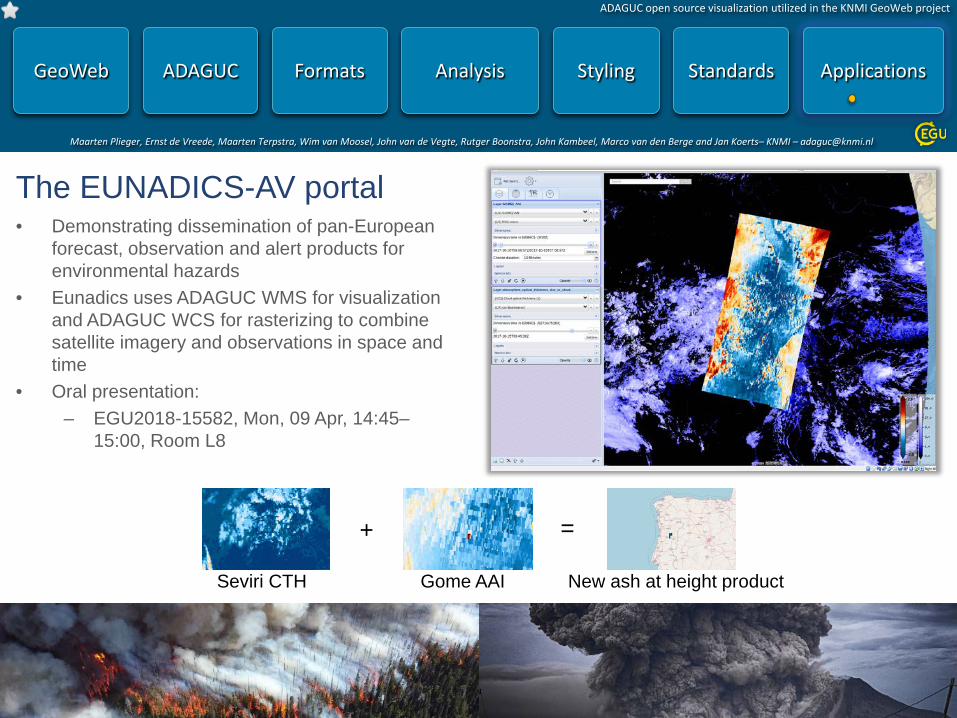
Applications
Maarten Plieger, Ernst de Vreede, Maarten Terpstra, Wim van Moosel, John van de Vegte, Rutger Boonstra, John Kambeel, Marco van den Berge and Jan Koerts– KNMI – [email protected]
ADAGUC open source visualization utilized in the KNMI GeoWeb project
ADAGUC open source visualization utilized in the KNMI GeoWeb project
Maarten Plieger, Ernst de Vreede, Maarten Terpstra, Wim van Moosel, John van de Vegte, Rutger Boonstra, John Kambeel, Marco van den Berge and Jan Koerts– KNMI – [email protected]
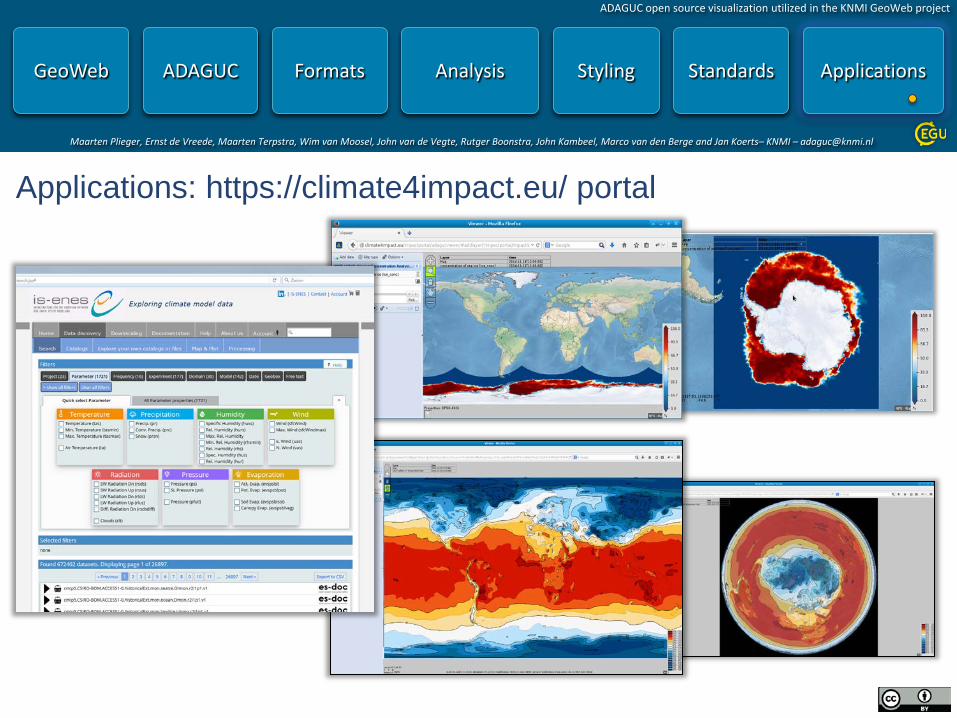
Applications: https://climate4impact.eu/ portal
Applications
Maarten Plieger, Ernst de Vreede, Maarten Terpstra, Wim van Moosel, John van de Vegte, Rutger Boonstra, John Kambeel, Marco van den Berge and Jan Koerts– KNMI – [email protected]
ADAGUC open source visualization utilized in the KNMI GeoWeb project
ADAGUC GeoWeb Formats Analysis Styling Standards Applications A