13
KNOWING WHICH TYPE OF GRAPH TO USE IN RESEARCH A foolproof guide to selecting the right image to convey your important message!
| Date post: | 14-Dec-2015 |
| Category: |
Documents |
| Upload: | loren-thane |
| View: | 215 times |
| Download: | 0 times |

KNOWING WHICH TYPE OF GRAPH TO USE IN
RESEARCHA foolproof guide to selecting the right image to convey
your important message!

Overview of the Problem:A graph tells a story…
Scatter Plots
Histograms and Bar Graphs
Line Graphs
Box-and-Whisker Plots
Networks
Normality Plots
Residual Plots
Pie Graphs
Stem-and-Leaf Plots
Map Charts
Radar Charts
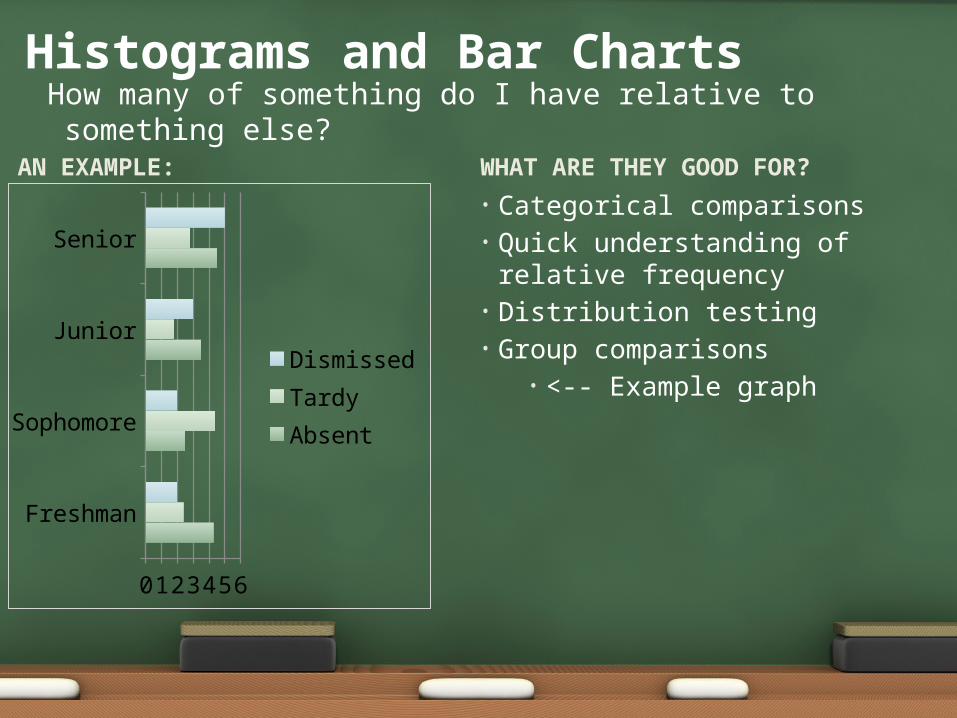
AN EXAMPLE:
Freshman
Sophomore
Junior
Senior
0 1 2 3 4 5 6
DismissedTardyAbsent
• Categorical comparisons• Quick understanding of
relative frequency• Distribution testing• Group comparisons
• <-- Example graph
WHAT ARE THEY GOOD FOR?
Histograms and Bar ChartsHow many of something do I have relative to something else?
AN EXAMPLE:
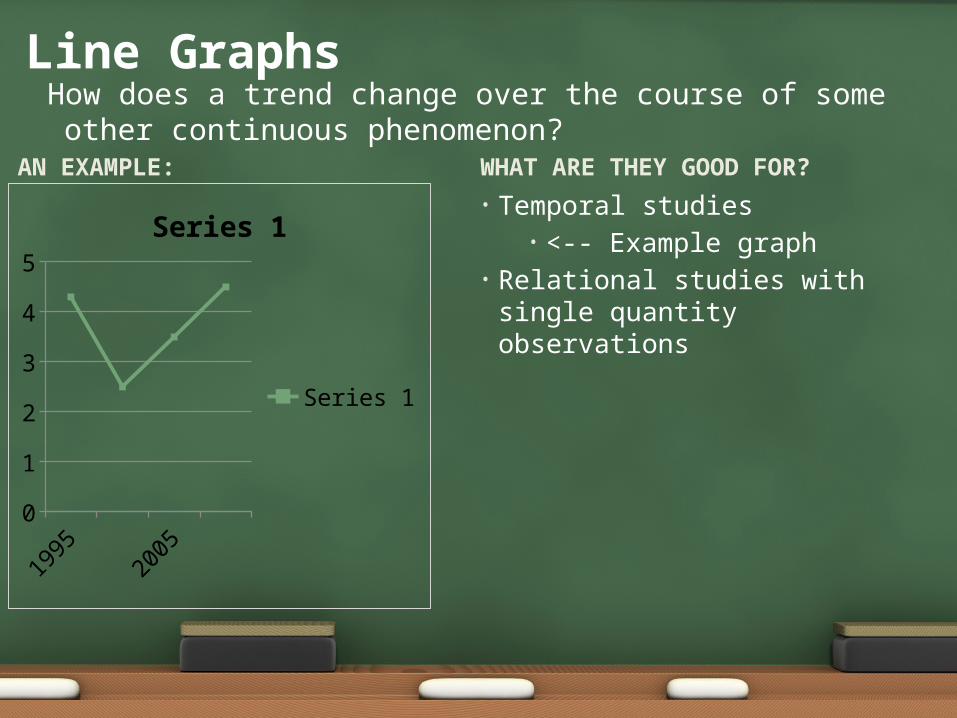
• Temporal studies• <-- Example graph
• Relational studies with single quantity observations
WHAT ARE THEY GOOD FOR?
Line GraphsHow does a trend change over the course of some other continuous phenomenon?
1995 2000 2005 20100
0.51
1.52
2.53
3.54
4.55
Series 1
Series 1
AN EXAMPLE:
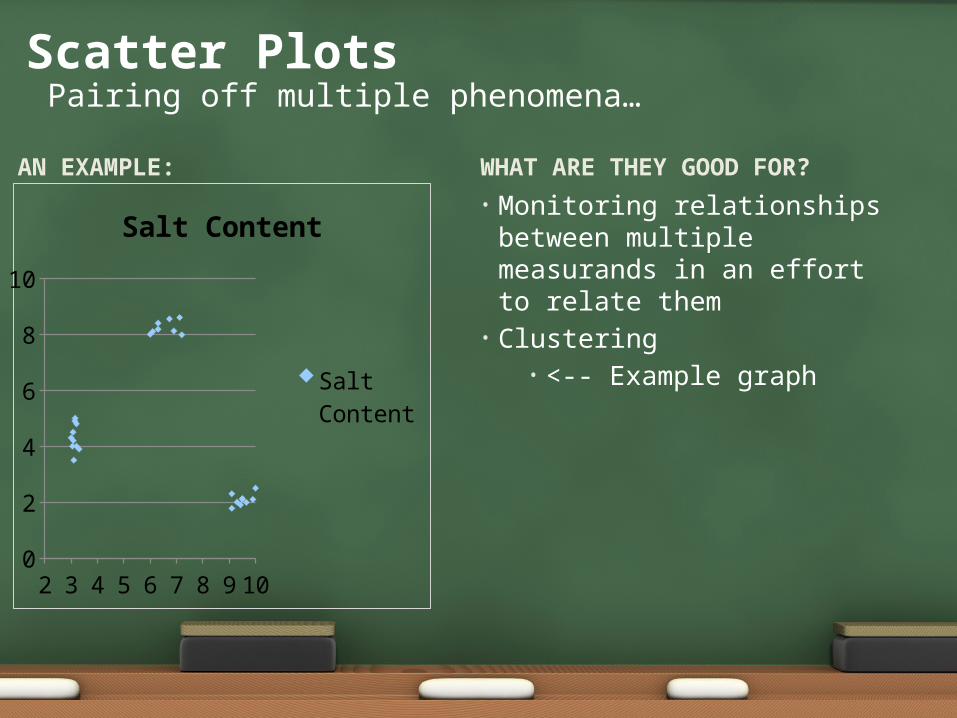
• Monitoring relationships between multiple measurands in an effort to relate them
• Clustering• <-- Example graph
WHAT ARE THEY GOOD FOR?
Scatter PlotsPairing off multiple phenomena…
2 3 4 5 6 7 8 9 100123456789
10
Salt Content
Salt Content

AN EXAMPLE:
• Finding percentile spreads• Identifying outliers
WHAT ARE THEY GOOD FOR?
Box-and-Whisker PlotPercentile trends and outlying observations

AN EXAMPLE:
• Identifying connections between concepts
• <-- Example graph• Flow charts• Algorithms• Path identification
WHAT ARE THEY GOOD FOR?
NetworksWhat is related to what?

AN EXAMPLE:
• Distribution of a population• Percentages
WHAT ARE THEY GOOD FOR?
Pie graphProportionality of a population
Putouts in No-Hitter
StrikeoutsGround OutsFly OutsOther
AN EXAMPLE:
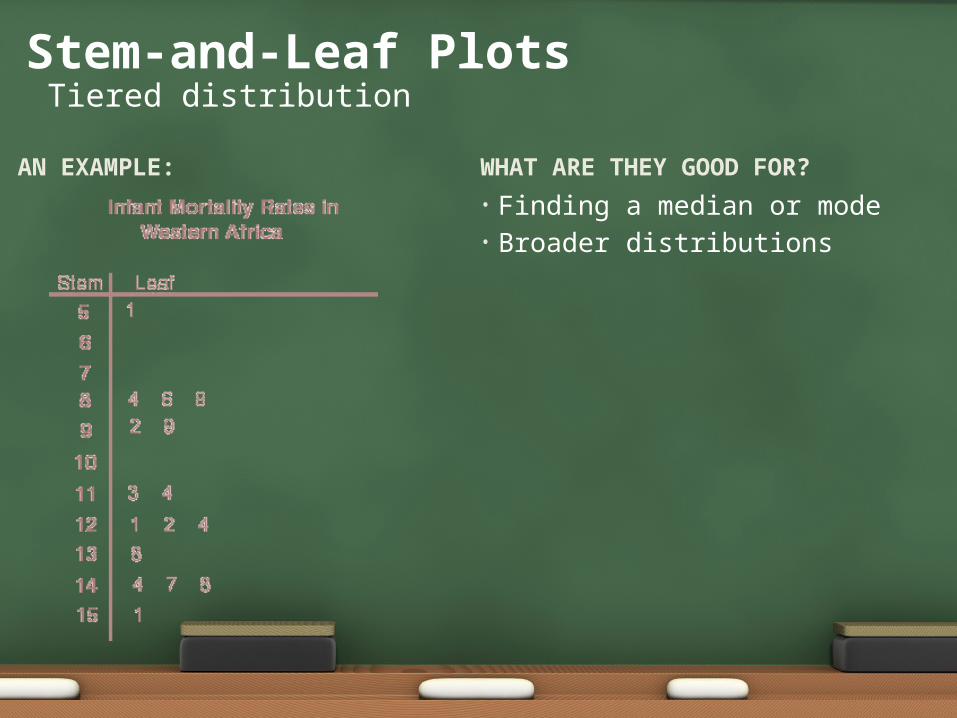
• Finding a median or mode• Broader distributions
WHAT ARE THEY GOOD FOR?
Stem-and-Leaf PlotsTiered distribution

AN EXAMPLE:
• Multiple comparisons over shared properties
WHAT ARE THEY GOOD FOR?
Radar ChartsWhen you care about too many things…
Carbon Dioxide
Nitrogen
ArgonOxygen
Water Vapor
0
50
100
VenusEarthMars

AN EXAMPLE:
• Similarities/differences based on administrative units
• Regional concerns
WHAT ARE THEY GOOD FOR?
Map ChartsWhere place matters…

AN EXAMPLE:
• Determining the voracity of a model based on distribution of residual values (randomized)
WHAT ARE THEY GOOD FOR?
Residual PlotDo I have the right model type?

AN EXAMPLE:
• Does experimental data conform to the normal distribution
• Note: you can do this for any distribution, but most common for normal distribution
WHAT ARE THEY GOOD FOR?
Normality PlotsDo I have normal data?


