j ourna l homepage: www.e lsev ie r.com/ locate /dss
Knowledge management adoption and assessment for SMEs by a novelMCDM approach
Ying-Hsun Hung a,b,⁎, Seng-Cho T. Chou a, Gwo-Hshiung Tzeng c
a Department of Information Management, National Taiwan University, Taipei 106, Taiwanb Department of Information Management, Hwa-Shia Institute of Technology, Taipei 235, Taiwanc Institute of Management of Management, National Chiao Tung University, Hsinchu 300, Taiwan
Keywords:Knowledge Management (KM)Small and Medium Enterprises (SME)Multiple Criteria Decision Making (MCDM)Knowledge management adoptionKnowledge management assessment
This paper aims to clarify the misunderstanding of high expenditure on knowledge management systemsadoption, and provides a novel approach for the most emergent knowledge management components tocatch up to the pace of their rivals for the late adopters of knowledge management systems. This paper adoptsMCDM (Multiple Criteria Decision Making) approaches to solve this KM adoption problem, and ranks thegaps of the KM aspects in control items to achieve the aspired level of performance. The findings demonstratethat the knowledge management gaps within the service industry are higher than the gaps within the IC(Integrated Circuit) and banking industries. After normalization and computation, the knowledge manage-ment gap of the service industry is 0.4399(1), the knowledge management gap of the IC (Integrated Circuit)industry is 0.3651(2), and the knowledge management gap of the banking industry is 0.2820(3). The findingsalso show that the criteria for weighting in different industry sectors are quite different; and the adoptionstrategies for different industry sectors should be considered separately according to the SME industrysectors.
titute of Technology, 111 Gong598; fax: +886 2 29415730.
Most SMEs (Small and Medium sized Enterprises) are sufferingbecause of low profits caused by hyper competition and OEM(Original Equipment Manufacturer) dead-end. Moreover, since themiddle of 2008, the financial tsunami has caused serious damage tothe global economy. Since 80% of the enterprises fall into the categoryof "Small and Medium Enterprises", they lack the financial andsystematic basis to introduce knowledge management practices andmake innovations. Several researchers have explored the gaps in theknowledge management activities of enterprises. Their studies revealthat corporate performance is significantly influenced by those gaps.The researchers have stressed the need for further investigation ofknowledge management gaps. To this end, we use Grounded Theoryto study the gaps in knowledge management activities in enterprises.From our pilot survey, we have discovered that gaps indeed existbetween the theory and practice of Knowledge Management; thus,further development and testing of models are necessary.
Our research aims to clarify the misunderstanding of high expendi-ture on knowledge management systems adoption, and provides anovel approach for the most emergent knowledge management
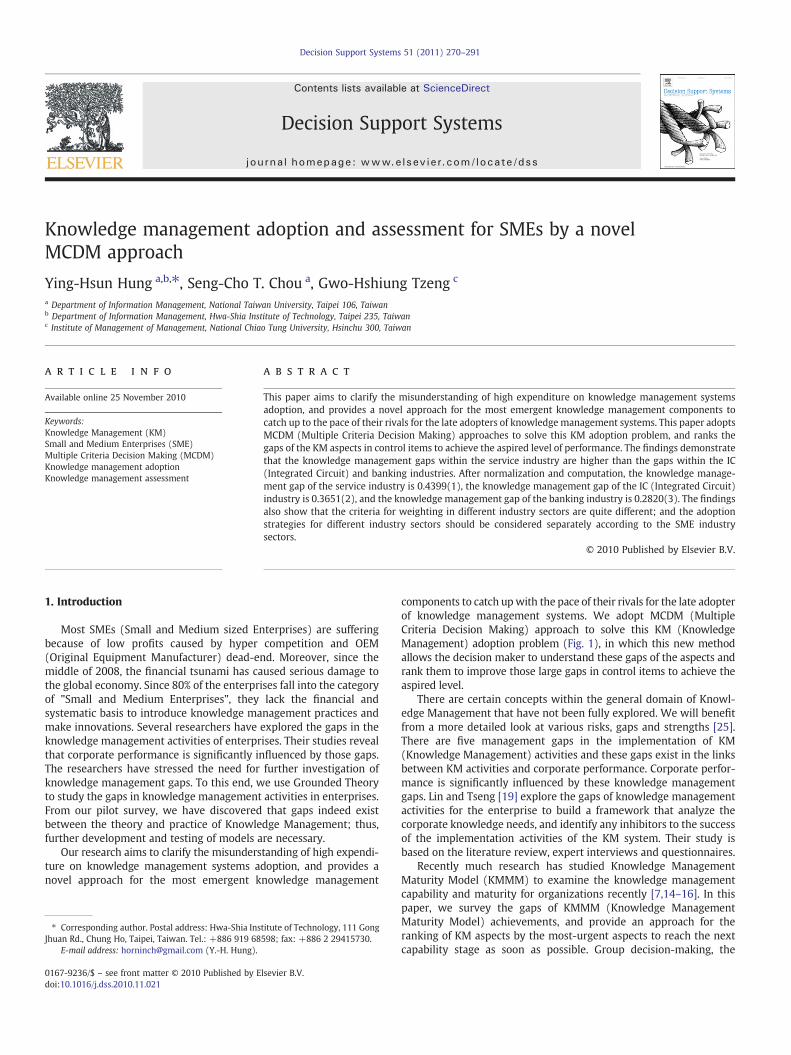
components to catch upwith the pace of their rivals for the late adopterof knowledge management systems. We adopt MCDM (MultipleCriteria Decision Making) approach to solve this KM (KnowledgeManagement) adoption problem (Fig. 1), in which this new methodallows the decision maker to understand these gaps of the aspects andrank them to improve those large gaps in control items to achieve theaspired level.
There are certain concepts within the general domain of Knowl-edge Management that have not been fully explored. We will benefitfrom a more detailed look at various risks, gaps and strengths [25].There are five management gaps in the implementation of KM(Knowledge Management) activities and these gaps exist in the linksbetween KM activities and corporate performance. Corporate perfor-mance is significantly influenced by these knowledge managementgaps. Lin and Tseng [19] explore the gaps of knowledge managementactivities for the enterprise to build a framework that analyze thecorporate knowledge needs, and identify any inhibitors to the successof the implementation activities of the KM system. Their study isbased on the literature review, expert interviews and questionnaires.
Recently much research has studied Knowledge ManagementMaturity Model (KMMM) to examine the knowledge managementcapability and maturity for organizations recently [7,14–16]. In thispaper, we survey the gaps of KMMM (Knowledge ManagementMaturity Model) achievements, and provide an approach for theranking of KM aspects by the most-urgent aspects to reach the nextcapability stage as soon as possible. Group decision-making, the
Fig. 1. The hybrid procedures of MCDM (Multiple Criteria Decision Making) for KM adoption [26].
271Y.-H. Hung et al. / Decision Support Systems 51 (2011) 270–291
essence of KM, lets us consider multi-dimensional problems for thedecision-maker, sets priorities for each decision factor, and assessesrankings for all alternatives.
The remainder of this paper is organized as follows. Section 2describes the related works to knowledge management capabilitiesand Knowledge Management Maturity Model. Section 3 describesthe Multiple Criteria Decision Making approaches. Section 4 describesthe research methods used in this study. Section 5 proposes a novelMCDMapproach for SME (Small andMedium sized Enterprises) knowl-edge management adoption, and Section 6 presents data collected andrepresented in this study. Finally, in Section 7, we present our con-clusions and suggest some directions for future research.
2. Related works
In this knowledge-based economy, knowledge has become animportant asset to an organization and, consequently, KnowledgeManagement has emerged as an issue managers have to deal with.Numerousworks on knowledgemanagement capabilities are reportedin literature [1,3,8,17,18,33]. In this section, wewill discuss the relatedworks in knowledge management capability, Knowledge Manage-ment Maturity Model, and knowledge management gaps.
2.1. Knowledge management capability
Knowledge management capability (KMC) is the source fororganizations to gain a sustainable competitive advantage. KMCevaluation is a requiredworkwith strategic significance [8,18]. PreviousKM research has developed integrated management frameworks forbuilding organizational capabilities of Knowledge Management. Basedon these frameworks, they propose stage models of organizationalknowledge management encompassing the KM process stages [17].
Gold et al. [10] examine the issue of effective Knowledge Man-agement from the perspective of organizational capabilities. Theysuggest that a knowledge infrastructure consisting of technology,structure, and culture along with knowledge processes architectureof acquisition, conversion, application, and protection is essential forthe organizational capabilities of effective Knowledge Management.
2.2. Knowledge Management Maturity Model
Knowledge Management Maturity Modeling (KMMM) has been amajor topic of research in recent years [7,14–16]. In practice, a fewKMM models [16] have been proposed by consulting firms as well.However, a common KMM model that both academics and practi-tioners agree on has yet to materialize andmoreover, details are oftenmissing from models in practice.
Most KMM models inherit the spirit of the Capability MaturityModel (CMM) [5] of SEI with its five levels of maturity — initial,repeated, defined, managed, and optimizing. Capability, anotherimportant attribute of CMM, can be translated into the enablingfactors or infrastructure of KM. While most KMM models treat KM asa holistic activity, we view it as a process and divide it into four KMsub-processes, namely knowledge creation, knowledge storage,knowledge sharing, and knowledge application. The added dimensionallows us to gain better insight into how KM practices are supportedat each maturity level and reflects our emphasis on the need forcontinuous process improvement.
2.3. Knowledge management gaps
Several researchers have explored the gaps in knowledgemanagement activities of enterprises and identified the links betweenthese activities and corporate performance. Their results reveal thatcorporate performance is significantly influenced by these manage-ment gaps.
Previous research has demonstrated that making a more detailedobservation of risks, gaps and strengths is beneficial [25]. Accordingto the findings of Lin and Tseng [19], there are five management gapsin implementation of KM activities and these gaps exist in the linksbetween KM activities and corporate performance [19]. Their studyexplores the gaps of knowledge management activities for the enter-prise to build a framework that analyzes the corporate knowledgeneeds, and identifies any inhibitors to the success of the implemen-tation activities of the KM system. It shows that corporate perfor-mance is significantly influenced by these knowledge managementgaps.
272 Y.-H. Hung et al. / Decision Support Systems 51 (2011) 270–291
3. Some basic concepts for MCDM (Multiple Criteria DecisionMaking) methods
The decision-making process involves identifying problems,constructing preferences, evaluating alternatives, and determiningthe best alternative [20,23,24,35,39]. However, when decision-makersevaluate the alternatives with multiple criteria, many problems, suchas the weights of the criteria, preference dependence, and conflictsamong criteria, seem to complicate the decision-making process andshould be resolved by more sophisticated methods.
Decision-making is extremely intuitive when considering singlecriterion problems, sinceweonlyneed to choose the alternativewith thehighest preference rating. However, adoptinga knowledgemanagementsystem is not just a single criterion problem. Decision-makers need toevaluate the alternatives based on multiple criteria. Many problems,such as the weights of criteria, preference dependence, and conflictsamong criteria, seem to complicate the decision-making process andshould be resolved by more sophisticated methods.
3.1. The MCDM (Multiple Criteria Decision Making) methodologyprocesses
Dealing with Multiple Criteria Decision Making (MCDM) problemsinvolves 5 key steps.
(1) Identification of the problem/issue: decision-makers need toidentify the nature of the research problem. They must deter-mine specifically which criteria should be considered, andwhich decision-making strategies should be adopted.
(2) Problem structuring: practitioners/decision-makers need toidentify the goals, values, constraints, external environment,key issues, uncertainties, and stakeholders of this enterprise.In this step, we need to collect the appropriate data or infor-mation so that the preferences of decision-makers can becorrectly identified and considered.
(3) Model building: decision-makers then specify the alternatives,define all criteria, and elicit values for model building. Thisprocess allows them to compile a set of possible alternatives orstrategies in order to guarantee that the goal will be achieved.
(4) Using the model to inform and challenge established thinking:especially decision-makers collect and synthesize information,challenge people's intuition, suggest other new alternatives,and analyze the robustness and sensitivity of the model.
(5) Developing an action plan: in the final step, an action plan isconstructed as a solution. In other words, we can select theappropriatemethod to help us to evaluate and rank the possiblealternatives or strategies (i.e., determine the best alternative).
3.2. Analytic Network Process (ANP)
The Analytic Network Process (ANP) is an extension of AnalyticHierarchy Process (AHP) by Saaty [30] to overcome the problem ofinterdependence and feedback among criteria or alternatives [30–32].Although the AHP and the ANP derive ratio scale priorities by makingpair-wise comparisons of elements (such as dimensions or criteria),there are differences between them. The first is that the AHP is aspecial version of the ANP; the ANP handles dependence within acluster (inner dependence) and among different clusters (outerdependence). Secondly, the ANP is a nonlinear structure, while theAHP is hierarchical and linear, with the goal at the top and thealternatives in the lower levels [31] based on the dynamic concept ofthe Markov chain [32].
The initial step of the ANP is to compare the criteria in the entiresystem to form a super-matrix through pair-wise comparisons byasking "How much importance does one criterion have compared toanother criterion, with respect to our interests or preferences?" The
relative importance is determined using a scale of 1–9 representingequal importance to extreme importance [11].
3.3. The DEMATEL (Decision MAking Trial and Evaluation Laboratory)technique
The DEMATEL (Decision MAking Trial and Evaluation Laboratory)method gathers collective knowledge to capture the causal relation-ships between strategic criteria. This paper applies the DEMATELtechnique in the strategic planning of Knowledge Management tohelp managers address the above situations and related questions.
Because evaluation of knowledge management capabilities cannotaccurately estimate each considered criterion in terms of numericalvalues for the alternatives, fuzziness is an appropriate approach. TheDEMATEL technique is an emerging method that gathers groupknowledge to capture the causal relationships between criteria. It isespecially practical and useful for visualizing the structure of compli-cated causal relationships with matrices or digraphs, which portray thecontextual relations between the elements of a system,where a numeralrepresents the strength of influence [34]. Therefore, the DEMATELtechnique can convert the relationship between the causes and effects ofcriteria into an intelligible structural model of the system.
The DEMATEL technique is utilized to investigate the interrelationsamong criteria to build a Network Relationship Map (NRM). Thistechnique has been successfully applied in many situations, such asthe development of strategies, management systems, e-learningevaluations, and Knowledge Management [20,34,37]. The methodcan be arranged as follows:
Step 1: Obtain the direct-influence matrix by scores. Respondents arerequired to point out the degree of direct influence amongeach criterion. We suppose that the comparison scales, 0, 1, 2,3 and 4, stand for the levels from "no influence" to "very highinfluence". Then, the graph which can describe the inter-relationships between the criteria of the system is shownin the figure below. For instance, an arrow from w to ysymbolizes that w impacts on y, and the score of influence is 1.The direct-influence matrix, A, can be derived by indicatedone criterion i impact on another criterion j as aij.
w
x
z
12
3
34
y
=A
11 1 1
1
1
j n
i ij in
n nj nn
a a a
a a a
a a a
⎡ ⎤⎢ ⎥⎢ ⎥⎢ ⎥⎢ ⎥⎢ ⎥⎢ ⎥⎣ ⎦
... ...
......
......
......
......
......
Step 2: Calculate the normalized direct-influence matrix X. X can becalculated by normalizing A through Eqs. (1) and (2).
X = m ⋅A ð1Þ
m = min1
maxi ∑n
j=1jaij j
;1
maxj ∑n
i=1jaij j
264
375 ð2Þ
Step 3: Derive the total direct-influence matrix T. T of NRM (NetworkRelationship Map) can be derived by using a formula (3),where I denotes the identity matrix; i.e., a continuousdecrease of the indirect effects of problems along the powersof X, e.g., X2, X3,…, Xq and lim
273Y.-H. Hung et al. / Decision Support Systems 51 (2011) 270–291
0≤xij≤1, 0b∑ j=1n xij≤1 and 0b∑ i=1
n xij≤1. If at leastone row or column of summation is equal to 1, but not all,then lim q→∞X
q=[0]n×n. The total-influence matrix is listedas follows.
T = X + X2 + ⋯ + Xq
= X I + X + X2 + ⋯ + Xq−1� �
I−Xð Þ I−Xð Þ−1
= X I−Xq� �I−Xð Þ−1
when q→∞, Xq=[0]n×n, then
T = X I−Xð Þ−1 ð3Þ
where T=[tij]n×n, i, j=1,2,…,n.Step 4: Construct the NRM based on the vectors r and s. The vectors r
and s of matrix T represent the sums of rows and columnsrespectively, which are shown as Eqs. (4) and (5).
r = ri½ �n×1 = ∑n
j=1tij
" #n×1
ð4Þ
s = sjh i
n×1= ∑
n
i=1tij
� �′
1×nð5Þ
where ri denotes the sum of the i-th row of matrix T and displaysthe sum of direct and indirect effects of criterion i on anothercriteria. Also, sj denotes the sumof the j-th columnofmatrix T andrepresents the sumof direct and indirect effects that criterion jhasreceived from another criteria. Moreover, when i= j (ri+si), itpresents the index of the degree of influences given and received;i.e., (ri+si) reveals the strength of the central role that factor iplays in the problem. If (ri−si) is positive representing that otherfactors are impacted by factor i. On the contrary, if (ri−si) isnegative, other factors have influences on factor i and thus theNRM can be constructed [22,34]. Therefore, a causal graph can beachieved by mapping the dataset of (ri+si, ri−si), providinga valuable approach for decision-making. The vector r and vectors express the sum of the rows and the sum of the columns fromthe total-influence matrix T=[tij]n×n, respectively, and thesuperscript denotes the transpose [2]. Now we call the total-influence matrix TC=[tij]n×n obtained by criteria and TD=[tijD]m×m obtained by dimensions (clusters) from experts' opi-nions. Then we normalize the ANP weights of dimensions(clusters) by using influence matrix TD.
3.4. VIKOR (the Serbian name, VlseKriterijumska Optimizacija IKompromisno Resenje)
Opricovic [28] and Opricovic and Tzeng (2002) developed VIKOR(the Serbian name, VlseKriterijumska Optimizacija I KompromisnoResenje, means Multi-criteria Optimization and Compromise Solution)[27–29]. The basic concept of VIKOR lies in defining the positive andnegative ideal solutions first. The positive ideal solution indicates thealternative with the highest value (score of 100), while the negativeideal solution indicates the alternative with the lowest value (score of0). In our study, the highest performance value of SMEs (Small andMedium sized Enterprises) is 5, and the lowest performance value is 0.They are used to help DMs (Decision Makers) by representing thepresent status of KM components for KM assessment and adoption.
The VIKORmethod is developed as a multi-criteria decision-makingmethod to solve a discrete decision problemwith non-commensurableand conflicting criteria [27,29]. The method ranks a set of alternatives,
and selects the alternative with the highest score. It then suggestscompromise solutions to a problem with conflicting criteria in order tohelp practitioners reach a final decision. Here, the compromise solutionis the feasible solution that is the closest to the ideal, and a compromisemeans an agreement reached on the basis of mutual concessions. TheTOPSIS (Technique for Order Preference by Similarity to Ideal Solution)method, which is also a distance-based approach, derives a solutionwith the shortest distance from the positive ideal solution and thefarthest distance from the negative-ideal solution, but it does not con-sider the relative importance of the distances. A detailed comparison ofTOPSIS and VIKOR is presented in Opricovic and Tzeng [29].
Multi-criteria ranking and compromise solutions
Criteria
Weights Alternatives maxk(or aspired value)
mink
(or the worst value)
a1 … ak … am
c1
w1 x11 … xk1 … xm1 x1⁎ x1−
⋮
⋮ ⋮ ⋮ ⋮ ⋮ ⋮ ⋮ ⋮ ci wi xi1 … xik … xim xi⁎ x1
−
⋮
⋮ ⋮ ⋮ ⋮ ⋮ ⋮ ⋮ ⋮ cn wn xn1 … xnk … xnm xn⁎ xn
−
(Data matrix: larger is better)
dpk = ∑n
i=1wi
x⁎i −xikx⁎i −x−i
!" #p( )1=p
when dp=1k = Sk = ∑
n
i=1wi
x⁎i −xikx⁎i −x−i
!for average degree of regret
(average gap) dp=∞k = Qk = maxi
x⁎i − xikx⁎i − x−i
!j i = 1;2; :::;n
( )for
maximal degree of regret (priority improvement).Ranking (small is better for distance Sk and Qk)
Rk = v Sk−S⁎� �
= S−−S⁎� ��
+ 1−vð Þ Qk−Q⁎ð Þ= Q−−Q⁎ð Þ½ �;
Let v=0.5 be themajority criteria, where, S = mink Sk (or S⁎=0, i.e.,achieving aspired level, gap equals zero), S− = maxk Sk (or S−=1denotes that the index is the worst value) and Q = mink Qk (Q⁎=0),Q− = maxk Q k (or Q−=1).
3.5. Simple Additive Weighting method (SAW)
Churchman and Ackoff [4] firstly utilized the SAW method to copewith portfolio selection problem [4]. SAWmethod is probably the best-known and widely used method for MCDM (Multiple Criteria DecisionMaking). Because of the simplicity, the SAW is themost popularmethodin theMCDM(Multiple CriteriaDecisionMaking) problems and the bestalternative can be derived by the following equation:
A⁎ = uk xð Þ j maxk
uk xð Þ �
ð6Þ
and
uk xð Þ = ∑n
i=1wirik xð Þ ð7Þ
where uk(x) denotes the utility of the k-th alternative, wi denotes theweights of the i-th criterion, and rik(x) is the normalized preferredratings of the k-th alternative with respect to the i-th criterion. Inaddition, the normalized preferred ratings (rik(x)) of the i-th alter-native with respect to the j-th criterion can be defined by:
For benefit criteria, rik xð Þ = xikx⁎i, where x⁎i = maxk xik, and it is clear
level (the best value) as xi* and the worst value as xi−, then rik =xik−x−ix�i −x−i
.
274 Y.-H. Hung et al. / Decision Support Systems 51 (2011) 270–291
where xik is the normalized preferred ratings of the k-th alternative
with respect to the i-th criterion.
4. The research architectures and methods forKnowledge Management
Knowledge management adoption is also an MCDM (MultipleCriteria Decision Making) problem. The first step involves identifyinghow many attributes or criteria are involved in the adoption of aknowledge management system. Next, the appropriate data orinformation must be collected so that the preferences of differentstakeholders can be correctly identified and considered (i.e., con-structing the preferences). Our goal is to establish objective andmeasurable patterns to define the anticipated achievements ofKnowledge Management by conducting group-decision analysis.Group decision-making as previously mentioned, the essence of KM,allows decision-makers to consider multi-dimensional problems, setspriorities for each decision factor, and assesses the rankings of allalternatives.
The procedures of MCDM (Multiple Criteria Decision Making) forKM adoption in this study:
1. More than sixty KM experts were invited and academic focusgroups were constructed in KMAP2004 (International Conferenceof Knowledge Management in Asia Pacific), ECKM2005 (EuropeanConference of Knowledge Management 2005), workshop ofNSC2006 (National Science Council in Taiwan) to address theresearch issues of knowledge management gaps between practicalactivities and theoretical findings of enterprises to identify thelinks between these activities and corporate performance.
2. In 2007, we joined Knowledge Management Project of Small andMedium sized Enterprises (SMEKM) of the Taiwan Ministry ofEconomic Affairs. The Delphi method was used to clarify theguidelines and bottlenecks of Small and Medium sized Enterprises.More than forty five KMdomain experts/consultants were involvedin this KMMM (Knowledge Management Maturity Model) surveys.After the SMEKM forum and pilot survey, we discovered that agap indeed existed between the theory and practice of KnowledgeManagement; thus, Grounded Theory was used for further de-velopment and testing of our model to investigate the unknownreasons behind the SMEKM report.
3. Between the years of 2008 and 2009, we clarified the KM gapswhich existed in KM practices of SMEs and proposed a hybridMCDM (Multiple Criteria Decision Making) approach combiningDEMATEL, SAW, VIKOR and ANP forweighting to rank the gaps thathad not been reduced or improved (the unimproved gaps) for thealternatives/projects or aspects of a project to get the most benefitand reach the aspired KMMM (Knowledge Management MaturityModel) level.
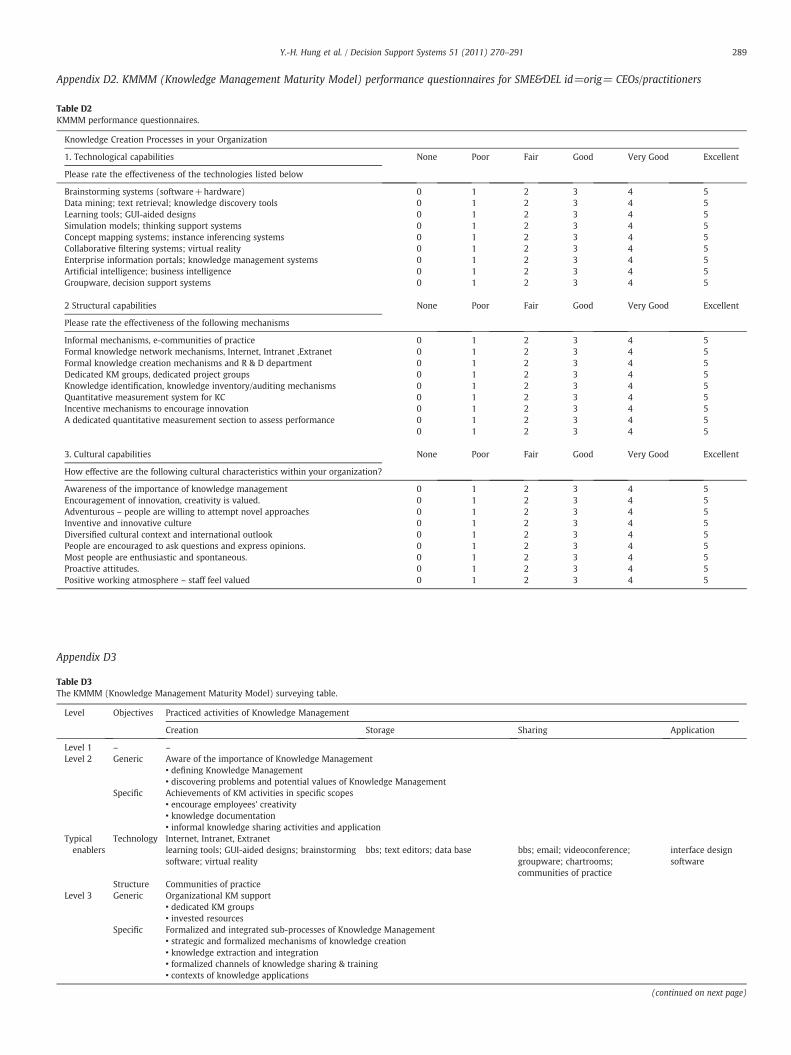
4. From the years of 2006 to 2009, we collected empirical data by usingthe KMMM (Knowledge Management Maturity Model) capabilityquestionnaires to investigate KM maturity performance from CEOs(Chief Executive Officers)/practitioners of three different industries,namely the Integrated Circuits industry, banking industry, andservices industry. Performance values of KM aspects of SMEs weremultiplied with the weighting values used to rank the KM gaps andKM alternatives for knowledge management adoption.
4.1. Grounded Theory
From our pilot survey, we discovered that a gap indeed existsbetween the theory and practice of Knowledge Management; thus,further development and testing of models is necessary.
After we studied the results of interviews with senior managersfrom Taiwanese banking organizations, we discovered something
interesting needed to be discussed. Then we adopt Grounded Theory(GT), which has become popular for conducting managementresearch because it can be used to identify emerging issues frominterviews. This forms the first phase of this doctoral study. Our goal isto develop a knowledge management model for these organizations.
Grounded Theory (GT), which is most often associatedwith the socialsciences, such as psychology, was developed by the sociologists BarneyGlaser (1930–Present) and Anselm Strauss (1916–1996). Their collabo-rative research on terminally ill hospital patients led them to write thebookAwareness of Dying. As a result of their research, they developed theconstant comparative method, subsequently known as Grounded Theory[9], which was developed as a systematic methodology [9]. Its nameunderscores the generation of theories from data. By following theprinciples of Grounded Theory, researchers can formulate a theory,either substantive (setting specific goals) or formal, about thephenomena they are studying and evaluating, e.g., gaps in KnowledgeManagement.
4.2. Delphi method
The Delphi method originated in a series of studies conducted bythe RAND Corporation in the 1950s [13]. The objective was to developa technique to obtain the most reliable consensus from a group ofexperts [6]. While researchers have developed variations of themethod since its introduction, Linstone and Turoff [21] captured itscommon characteristics in the following description: Delphi may becharacterized as a method for structuring a group communicationprocess; so the process is effective in allowing a group of individuals,as a whole, to deal with a complex problem [21]. To accomplish this‘structured communication,’ certain aspects should be provided: somefeedback of individual contributions of information and knowledge;some assessment of the group judgment or viewpoint; some op-portunity for individuals to revise their views; and some degree ofanonymity for individual responses [21].
The Delphi technique enables a large group of experts to be surveyedcheaply, usually by mail using a self-administered questionnaire(although computer communications also have been used), with fewgeographical limitations on the sample. Specific situations have includeda round inwhich the participantsmeet to discuss the process and resolveanyuncertainties or ambiguities in thewordingof thequestionnaire [13].
5. Building a novel MCDM (Multiple Criteria Decision Making)model with ANP, DEMATEL, and VIKOR for SMEKM adoption
Because practitioners often manage several KM alternatives withconflicting, and wonder what are the differences of KM practices withother competitors? What is the next step? How can we assess andmeasure the practiced activities of knowledge management process?These questions should be answered. Wewish to consider several non-commensurable criteria to reduce the gaps to achieve the aspiredKMMM (Knowledge Management Maturity Model) stage by rankingthe gaps that have not been reduced or improved (the unimprovedgaps) for the alternatives/projects or aspects of a project to get themostbenefit and reach the aspired KMMM (Knowledge ManagementMaturity Model) level.
As anycriterionmay impact eachother, this studyused theDEMATEL(DecisionMAking Trial and Evaluation Laboratory) technique to acquirethe structure of the MCDM (Multiple Criteria Decision Making)problems. The weights of each criterion from the structure are obtainedby utilizing the ANP (Analytic Network Process). The VIKOR techniquewill be leveraged for calculating compromise ranking and gaps of thealternatives. In short, the framework of evaluation contains three mainphases: (1) constructing the Network Relationship Map (NRM) amongcriteria by the DEMATEL technique, (2) calculating the weights of eachcriterionby theANPbasedon theNRM, and (3) rankingor improving thepriorities of alternatives of portfolios through the VIKOR.
275Y.-H. Hung et al. / Decision Support Systems 51 (2011) 270–291
5.1. The ANP (Analytic Network Process) for calculating weights ofcriteria based on the NRM
The AHP (Analytic Hierarchy Process) supposes independenceamong criteria, which is not reasonable in the real world. Saaty [30]thus extended AHP to ANP (Analytic Network Process) to resolveproblems with dependence or feedback between criteria, whichprimarily divides problems into numerous different clusters andevery cluster includes multiple criteria [30–32]. Moreover, there isouter dependence among clusters and inner dependence within thecriteria of clusters. In addition, we figured the relative weights ofcriteria of respectivematrices by pair-wise comparison andmodifyingtheweights as eigenvectors. Thenwe integratedmultiplematrices intoa super matrix, because the capacity to examine the inner and outerdependence of clusters is the largest benefit of a super matrix as inEq. (8).
There are three steps for the decision process of ANP. First, thedecision problem and the structure of problem were built to offeran evident depiction of the problem and separate it into a relationnetwork structure. Second, not only is the pair-wise comparisonmatrix established, but also eigenvalue and eigenvector were figured.
C1e11e12⋯ e1n1
C2e21e22⋯ e2n2
⋯⋯
Cnen1en2⋯ ennn
W =
C1
C2
⋮
Cn
e11e12⋮e1n1
e21e22⋮e2n2⋮en1en2⋮ennn
W11 ⋯ W12 ⋯ W1n
W21 ⋯ W22 ⋯ W2n
⋮ ⋮ ⋮
Wn1 ⋯ Wn2 ⋯ Wnn
2666666666666666666664
3777777777777777777775
ð8Þ
Pair-wise comparison is composed of clusters and criteria. Fur-thermore, the pair-wise comparison of clusters was separated intocomparison of criteria within and between clusters. We utilize ratioscale (1–9) to determine the level of importance of the comparison.In addition, the data deriving from the survey of ANP were combinedand transferred into pair-wise comparison matrix by geometric aver-age. After building the matrix, we received the eigenvector Wii
through an equation: Aw=λmaxw, where A is pair-wise comparisonmatrix, w=(w1,…,wi,…,wn)′ is the eigenvector, wi is the eigenvalue,then
λmax =1n∑n
i=1
Awð Þiwi
ð9Þ
where (Aw)i=∑ j=1n aijwj and n equals the number of comparative
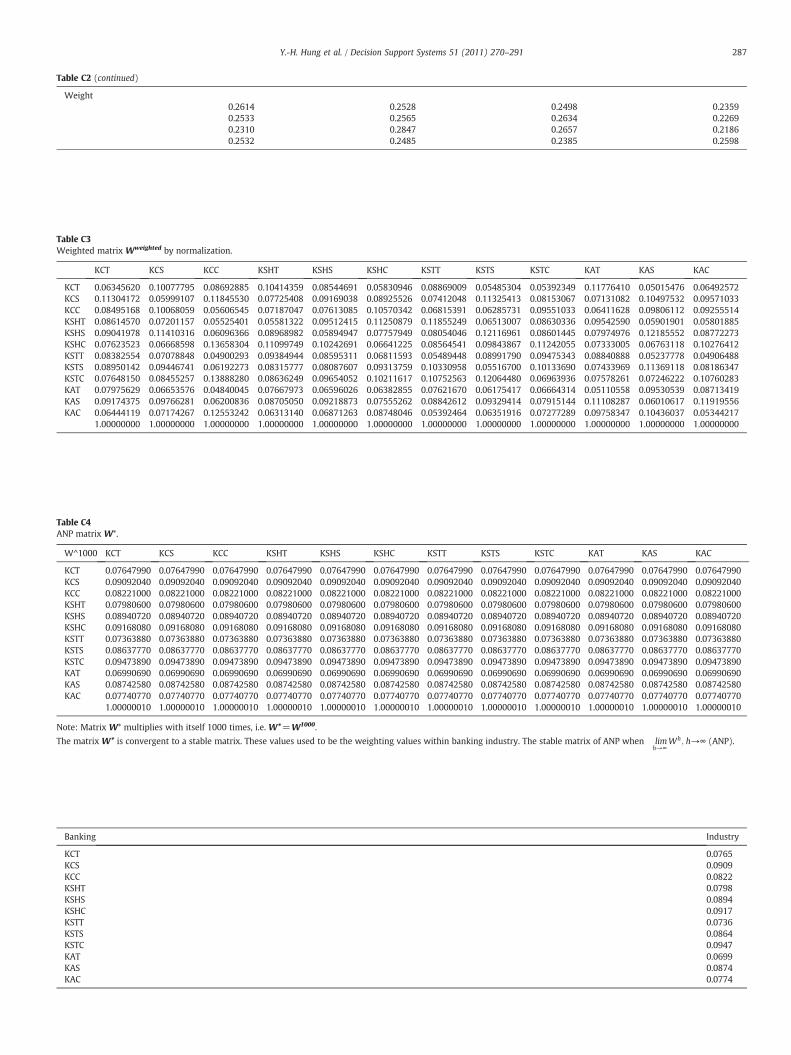
criteria. Third, the super-matrix, tagged W was formed. It wasconstructed by the dependence table obtained from the interrelationsamong criteria, and the eigenvectors received from the pair-wisecomparison matrix served as the weights of it. No inner dependenceamong criteria or clusters was shown by a blank or zero. By Wu andLee [38], the usage of power matrix by Wh (multiplication) andlimh→∞Wh is a fixed convergence value; therefore, we can acquireweights in every criterion [38].
5.2. The revised VIKOR for ranking and improving the alternatives
Opricovic [28] proposed the compromise ranking method (VIKOR)as one applicable technique to implement within MCDM (Multiple
Criteria Decision Making) [28,29]. Suppose the feasible alternativesare represented by A1, A2,…, Ak,…, Am. The performance score ofalternative Ak and the j-th criterion is denoted by fik; wi is the weight(relative importance) of the i-th criterion, where i=1, 2,…, n, and n isthe number of criteria. Development of the VIKORmethod began withthe following form of Lp-metric:
Lpk = ∑n
i=1wi f �i −fik�� ��� �
= f �i −f−ik�� ��� �� p �1=p
; ð10Þ
where 1≤p≤∞; alternative k=1,2,…,m; weight wi is derived fromthe ANP. To formulate the ranking and gap measure Lk
p=1 (as Sk) andLkp=∞ (as Qk) are used by VIKOR [28,29,34–37].
Sk = Lp=1k = ∑
n
j=1wi f �i −fik�� ��� �
= f �i −f−i�� ��� �� ð11Þ
Qk = Lp=∞k = max
if �i −fik�� ��� �
= f �i −f−i�� ��� �j i = 1;2; ⋯;n
�: ð12Þ
The compromise solution mink Lpk shows the synthesized gap to
be the minimum and will be selected for its value to be the closest to theaspired level. Besides, the group utility is emphasized when p is small(such as p=1); on the contrary, if p tends to become infinite, theindividual maximal regrets/gaps obtain more importance in priorimprovement in each dimension/criterion. Consequently, mink Sk stres-ses the maximum group utility; however, mink Qk accents on theselecting the minimum from the maximum individual regrets/gaps. Thecompromise ranking algorithm VIKOR has four steps according to theabove-mentioned ideas.
Step 1: Obtain an aspired or tolerable level. We calculate the bestfi* values (aspired level) and the worst fi− values (tolerablelevel) of all criterion functions, i=1,2,…,n. Suppose the i-thfunction denotes benefits: f �i = maxk fik (or setting theaspired level as fi*) and f−i = mink fik (or setting the worstvalue as fi
−) or these values can be set by decision makers,i.e., fj*=aspired level and fj
−=the worst value. Further, anoriginal rating matrix can be converted into a normalizedweight-rating matrix by using the equation:
rik = f �i −fik�� ��� �
= f �i −f−i�� ��� �
: ð13Þ
Step 2: Calculate mean of group utility and maximal regret. The
values can be computed respectively by Sk = ∑n
i=1wirik (the
synthesized (average) gap for all criteria) and Q k = maxi{rik|i=1,2,...,n} (the maximal gap for prior improvement).
Step 3: Calculate the index value. The value can be counted by
Rk = v Sk−S�� �
= S−−S�� �
+ 1−vð Þ Qk−Q �� �= Q−−Q�� �
;ð14Þ
where k=1,2,…,m.S�= min
iSi or setting S⁎=0 and S−= max
iSi or setting S−=
1;Q � = mini
Qi or settingQ⁎=0andQ− = maxi Qi or setting
Q−=1; and v is presented as the weight of the strategy ofthe maximum group utility.
Step 4: Rank or improve the alternatives for a compromise solution.Order them decreasingly by the value of Sk, Qk and Rk. Proposeas a compromise solution the alternative (A(1)) which isarranged by the measure min{Rk|k=1,2,...,m} when the twoconditions are satisfied:C1. Acceptable advantage: R(A(2))−R(A(1))≥1/(m−1), where
A(2) is the second position in the alternatives ranked by R.C2. Acceptable stability in decision making: Alternative A(1)
must also be the best ranked by Sk or/and Qk. When oneof the conditions is not satisfied, a set of compromise
Table 1The initial influence matrix A for criteria (banking industry).
Criteria KCT KCS KCC KSHT KSHS KSHC KST KSS KSC KAT KAS KAC
276 Y.-H. Hung et al. / Decision Support Systems 51 (2011) 270–291
solutions is selected. The compromise solutions are com-posed of: (1) Alternatives A(1) and A(2) if only conditionC2 is not satisfied or (2) Alternatives A(1), A(2),…,A(M)
if condition C1 is not satisfied. A(M) is calculated by therelation R(A(M))−R(A(1))b1/(m−1) for maximum M(the positions of these alternatives are close).
The compromise-ranking method (VIKOR) is applied to determinethe compromise solution and the solution is adoptable for decision-makers in that it offers a maximum group utility of the majority(shown by min S), and a maximal regret of minimum individuals ofthe opponent (shown by min Q). This model utilizes the DEMATELand ANP processes to get the weights of criteria with dependence andfeedback and employs the VIKOR method to acquire the compromisesolution.
5.3. Assessing the KM maturity of the IC (Integrated Circuit) design,banking, and services industries
In this section, we present an empirical study for applying theproposed model to assess the knowledge management gaps in theindustries mentioned above. First, we use the same weightedpreferences for knowledge management components to assess the
KnowledgeCreation
KnowledgeSharing
KC TechnologyKC StructureKC Culture
Assessment the KM
Adoption Strategy forIC design industries
KSh. TechnologyKSh. StructureKSh. Culture
AssessmenAdoption Str
Banking in
Fig. 2. The KM adoption strategy
three industries, and then compile a profile of the knowledge man-agement gaps and the best adoption strategies for the industries.Second, based on the weighted preferences of knowledge manage-ment components provided by different domain experts, we discussthe results of using those preferences to assess the three industriesand determine the best KM adoption strategy for each one.
The knowledge management gaps between the theoretical knowl-edge management practices and practical knowledge managementactivities of enterprises have significantly influenced corporate perfor-mance. Therefore, propermeasurement and decision-making processesare critical for knowledge management adoption and success. In thecontext of strategic goals and transformation, using different KM alter-natives will influence resource allocation and overall achievementof success. Group decision-making is a process where experts makedecisions and consolidate an optimal strategy.
6. Data collection and representation
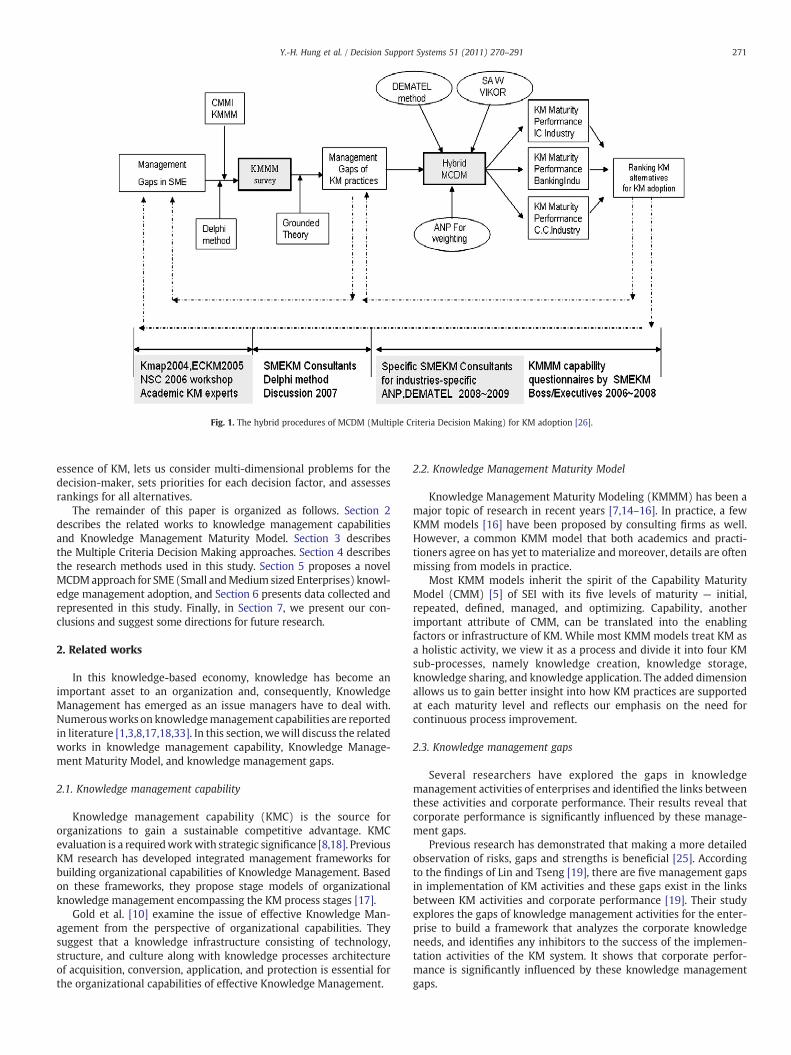
6.1. Constructing the NRM by DEMATEL
To analyze the interrelationships between the twelve determi-nants summarized through literatures, the DEMATEL method intro-duced in Section 3.3 will be utilized in the decision problem structure.
KnowledgeApplication
KnowledgeStorage
KSt. StructureKSt. Culture
KSt. Technology
KA TechnologyKA StructureKA Culture
t the KM
ategy fordustries
Assessment the KM
Adoption Strategy forServices industries
for three different industries.
er-m
atrixba
sedon
totalinfl
uenc
eno
rmalized
matrix(b
anking
indu
stry).
Kno
wledg
eCrea
tion
Tech
nology
Kno
wledg
eCrea
tion
Structure
Kno
wledg
eCrea
tion
Culture
Kno
wledg
eSH
aring
Tech
nology
Kno
wledg
eSH
aring
Structure.
Kno
wledg
eSH
aring
Culture.
Kno
wledg
eST
orag
eTe
chno
logy
Kno
wledg
eST
orag
eStructure
Kno
wledg
eST
orag
eCu
lture
Kno
wledg
eApp
lication
Tech
nology
.
Kno
wledg
eApp
lication
Structure
Kno
wledg
eApp
lication
Culture
logy
0.06
3456
200.10
0777
950.08
6928
850.10
4143
590.08
5446
910.05
8309
460.08
8690
090.05
4853
040.05
3923
490.11
7764
100.05
0154
760.06
4925
72re
0.11
3041
720.05
9991
070.11
8455
300.07
7254
080.09
1690
380.08
9255
260.07
4120
480.11
3254
130.08
1530
670.07
1310
820.10
4975
320.09
5710
330.08
4951
680.10
0680
590.05
6065
450.07
1870
470.07
6130
850.10
5703
420.06
8153
910.06
2857
310.09
5510
330.06
4116
280.09
8061
120.09
2555
14og
y0.08
6145
700.07
2011
570.05
5254
010.05
5813
220.09
5124
150.11
2508
790.11
8552
490.06
5130
070.08
6303
360.09
5425
900.05
9019
010.05
8018
85e
0.09
0419
780.11
4103
160.06
0963
660.08
9689
820.05
8949
470.07
7579
490.08
0540
460.12
1169
610.08
6014
450.07
9749
760.12
1855
520.08
7722
730.07
6235
230.06
6685
980.13
6583
040.11
0997
490.10
2426
910.06
6412
250.08
5645
410.09
8438
670.11
2420
550.07
3330
050.06
7631
180.10
2764
12og
y0.08
3825
540.07
0788
480.04
9002
930.09
3849
440.08
5953
110.06
8115
930.05
4894
480.08
9917
900.09
4753
430.08
8408
880.05
2377
780.04
9064
88e
0.08
9501
420.09
4467
410.06
1922
730.08
3157
770.08
0876
070.09
3137
590.10
3309
580.05
5167
000.10
1336
900.07
4339
690.11
3691
180.08
1863
470.07
6481
500.08
4552
570.13
8882
800.08
6362
490.09
6540
520.10
2116
170.10
7525
630.12
0644
800.06
9639
360.07
5782
610.07
2462
220.10
7602
83no
logy
0.07
9756
290.06
6535
760.04
8400
450.07
6679
730.06
5960
260.06
3828
550.07
6216
700.06
1754
170.06
6643
140.05
1105
580.09
5305
390.08
7134
19cture
0.09
1743
750.09
7662
810.06
2008
360.08
7050
500.09
2188
730.07
5552
620.08
8426
120.09
3294
140.07
9151
440.11
1082
870.06
0106
170.11
9195
56re
0.06
4441
190.07
1742
670.12
5532
420.06
3131
400.06
8712
630.08
7480
460.05
3924
640.06
3519
160.07
2772
890.09
7583
470.10
4360
370.05
3442
171.00
0000
001.00
0000
001.00
0000
001.00
0000
001.00
0000
001.00
0000
001.00
0000
001.00
0000
001.00
0000
001.00
0000
001.00
0000
001.00
0000
00
277Y.-H. Hung et al. / Decision Support Systems 51 (2011) 270–291
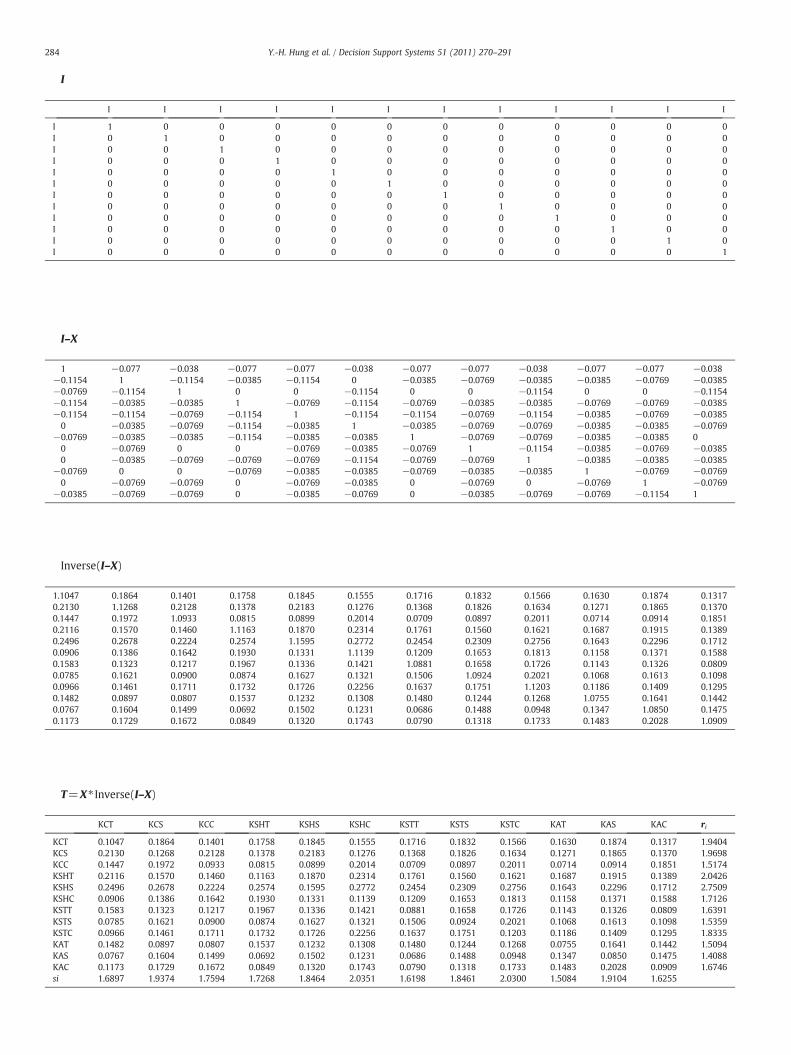
First, the direct influence matrix A for criteria was presented (seeTable 1). Then, the normalized direct-influence matrix S for criteriacan be calculated by Eq. (1). Third, the total direct influence matrixT for criteria/dimensions was derived based on Eq. (3). Finally, theNRM (Network Relationship Map) was constructed by the r and s(Eqs. (4) and (5)) in the total direct influence matrix T as shown inFig. 2.
6.2. Calculating weights of each criterion by ANP
Many experts were recruited including SME (Small and Mediumsized Enterprises) consultants, knowledge management domain scho-lars, and executive managers of SMEs in several stages. There aretwenty-five SME consultants recruited from SMEKM (KnowledgeManagement Plan for Small and Medium Enterprises) project of theSmall and Medium Enterprise Administration, Ministry of EconomicAffairs, Taiwan. Fifteen knowledge management domain scholars inECKM2005 (6th European Conference on Knowledge Management),seven knowledge management domain scholars in Kmap2004 (Inter-national Conference on Knowledge Management in Asia Pacific), andnine knowledgemanagement domain scholars in TaiwanNSC (NationalScience Council) doctoral students research workshop in 2007 werealso invited. Finally, KM performance questionnaire data from SMEexecutive managers in SMEKM project, EMBA (Executive Master ofBusiness Administration) program students of NTU (National TaiwanUniversity, Taiwan), NCCU (National Chengchi University, Taiwan),NTPU (National Taipei University, Taiwan), and NCTU (National ChiaoTung University, Taiwan) was collected. According to their expertiseof industry sectors, industry-specific SME consultants and knowledgemanagement domain scholars were invited to complete the ANP andDEMATEL questionnaires from different industry perspectives. Theexecutive managers of SMEs were invited to complete the matrixquestionnaire for the performance value of their organizational knowl-edge management capability.
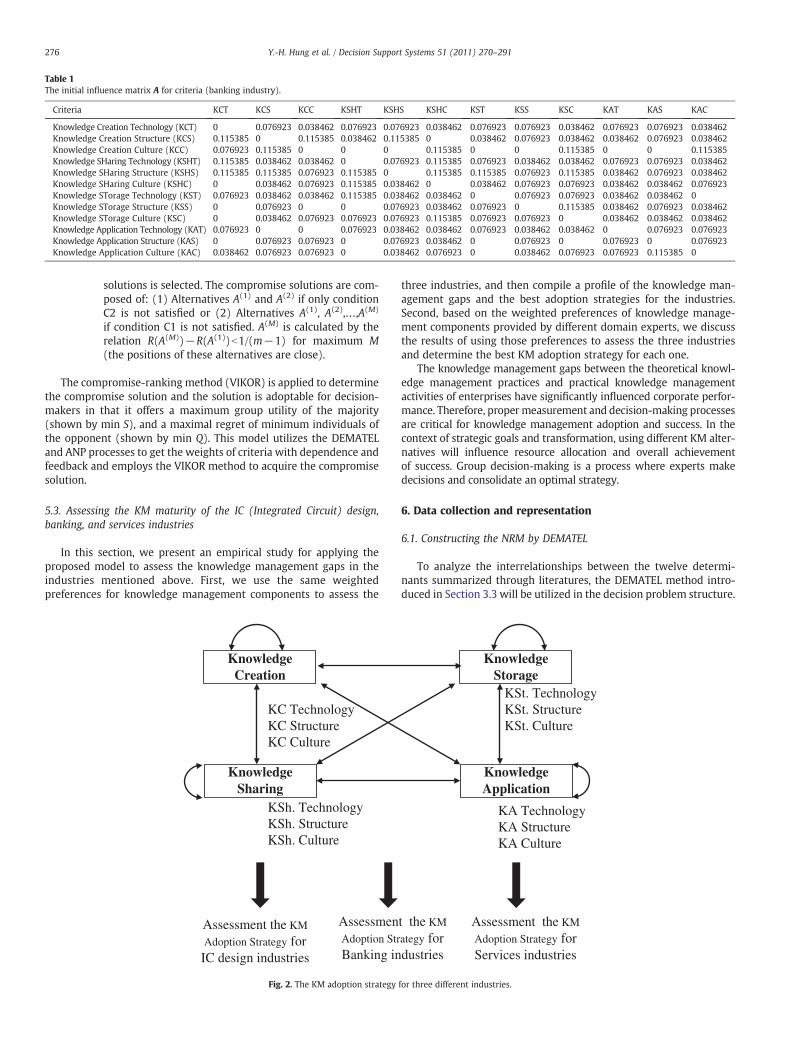
The level of importance (global weights) of 12 criteria can becalculated by ANP shown as Tables 1–4. Results showed that expertswere most concerned with Knowledge STorage Culture (rank 1) andKnowledge SHaring Culture (rank 2), and least concerned withKnowledge Application Technology (rank 12) and Knowledge STorageTechnology (rank 11).
6.3. Compromise ranking by VIKOR
The VIKOR technique was applied for compromise ranking afterthe weights of determinants were calculated by ANP in Table 4.Calculation results (Table 5) demonstrated that the total gaps werehighest in the services industry, followed by the IC (Integrated Circuit)industry and the banking industry. Therefore, both VIKOR and ANPcame to the same conclusions that the KM adoption strategiesprovided by this study indicated that services industry practitionersare suggested to focus their investment in KM gaps.
When considering the KMCs (knowledge management compo-nents), it seems to a serious mistake to apply the same weightingpreferences across industries (Table 6). The KMC weighting prefer-ence of the banking industry is quite different from both the KMCweighting preferences of the IC (Integrated Circuit) industry and theservice industry. Therefore, we should assess the KMC capability of
Table 2The sum of influences given and received on dimensions (banking industry).
278 Y.-H. Hung et al. / Decision Support Systems 51 (2011) 270–291
banking industry by the weighting preferences of domain experts inthe banking industry. This is true for the assessing of KMC capabilityfor the service industry and the IC (Integrated Circuit) industry.
7. The research findings and managerial implications
The empirical results were discussed as follows. In the first place,the most important criteria calculated by ANP when making adoptingKM components decisions were Knowledge STorage Culture (weight-ing 0.0947) for banking industry, Knowledge SHaring Culture(weighting 0.0956) for IC (Integrated Circuit) industry, and Knowl-edge SHaring Structure (weighting 0.0963) for service industry.
The Knowledge STorage Culture is most critical for knowledge man-agement adoption of banking industry. The more popular the joiningof Knowledge STorage Culture, the better the successful KnowledgeManagement is. But the preferences of emphasizing on knowledgemanagement components are different. Moreover, the performances ofknowledge management components (KMC) in these three industriesdiffer separately. The highest score of KMC in IC (Integrated Circuit)industry is in knowledge storage (3.3733), in addition, the KnowledgeSTorage Structure (3.5750) gets the highest score among 12 criteria. Thehighest score of KMC in the banking industry is in knowledge application(3.6086), and the Knowledge Application Structure (3.6719) gets thehighest score among 12 criteria. The highest score of KMC in servicesindustry is in knowledge creation (2.8476), and the Knowledge CreationCulture (3.0536) gets the highest score among 12 criteria.
Table 5The weights of criteria for assessing 3 industries maturity and Total Performance (SAW Me
Dimensions/criteria Local weight Global weight(by ANP)
Example:Calculating Total Performance by global weights: 0.0765⁎2.9136+0.0909⁎3.2639+0.0.0864⁎3.5750+0.0947⁎3.2346+0.0699⁎3.1389+0.0874⁎3.3472+0.0774⁎3.1605=3.Calculating Total Performance by local weights:0.2496⁎2.9673+0.2609⁎3.0702+0.2548⁎3.4271+0.2347⁎3.2236=3.1715.
7.1. Research findings
We discovered that the weighting preferences among expertsand raters in different industry sectors are quite different; therefore,we should invite the specific domain experts or SME consultants toprovide the respective industry weighting. Moreover, the perfor-mance of KMCs in industry should be rated/assessed by SME(Small and Medium sized Enterprises) executives because of theirexperience and understanding of their specific industry domainknowledge.
The findings showed the rankings of knowledgemanagement gapsand performance of knowledge management components in thesethree industries. The knowledgemanagement gaps of service industryare higher than the gaps of IC (Integrated Circuit) industry andbanking industry (Table 7). After normalization and computation,the knowledge management gap of service industry is 0.4399(1), theknowledge management gap of IC (Integrated Circuit) industry is0.3651(2), and the knowledge management gap of banking industryis 0.2820(3). After the completion of rating for performance ofknowledge management components, the knowledge managementperformance of service industry is 2.8006 (rank 3), the knowledgemanagement performance of IC (Integrated Circuit) industry is 3.1715(rank 2), and the knowledge management gap of banking industry is3.5899 (rank 1).
The compromise ranking by VIKOR showed that the bottleneckcomponents of Knowledge Management for banking industry areboth Knowledge Application Technology component (0.2969) and
thod) while using the same weighting preference from banking industry.
Table 6The weights of criteria for assessing 3 industries maturity and Total Performance (VIKOR method) while using the same weighting preference from banking industry.
Dimensions/criteria Local weight Global weight (by ANP) banking Gaps of IC industry (A1) Gaps of banking (A2) Gaps of services (A3)
Example:Calculating dimension gap by dimensions of local weights:
SD1= dp = 1
D1= ∑
3
i=1wD1
i
f �D1i −f D1
ik
f �D1j −f−D1
i
0@
1A= 0:3064 ×
5−2:91365−0
� �+ 0:3642 ×
5−3:26395−0
� �+ 0:3294 ×
5−2:68925−0
� �¼0:4065
Calculating total gap by criteria of global weights:
SA1= dp = 1
A1= ∑
8
i=1wi
f �i −fiA1
f �i −f−i
!= 0:0765 ×
5−2:91365−0
� �+ 0:0909 ×
5−3:26395−0
� �+ 0:0822 ×
5−2:68925−0
� �+ 0:0798 ×
5−3:18525−0
� �+ 0:0894 ×
5−3:12505−0
� �
+ 0:0917 ×5−2:9167
5−0
� �+ 0:0736 ×
5−3:50005−0
� �+ 0:0864 ×
5−3:57505−0
� �+ 0:0947 ×
5−3:23465−0
� �+ 0:0699 ×
5−3:13895−0
� �+ 0:0874 ×
5−3:34725−0
� �
+ 0:0774 ×5−3:1605
5−0
� �= 0:3657
QA1= dp = ∞
A1= max
f �i −fiA1
f �i −f−ij i = 1; :::; n
( )= 0:4622
279Y.-H. Hung et al. / Decision Support Systems 51 (2011) 270–291
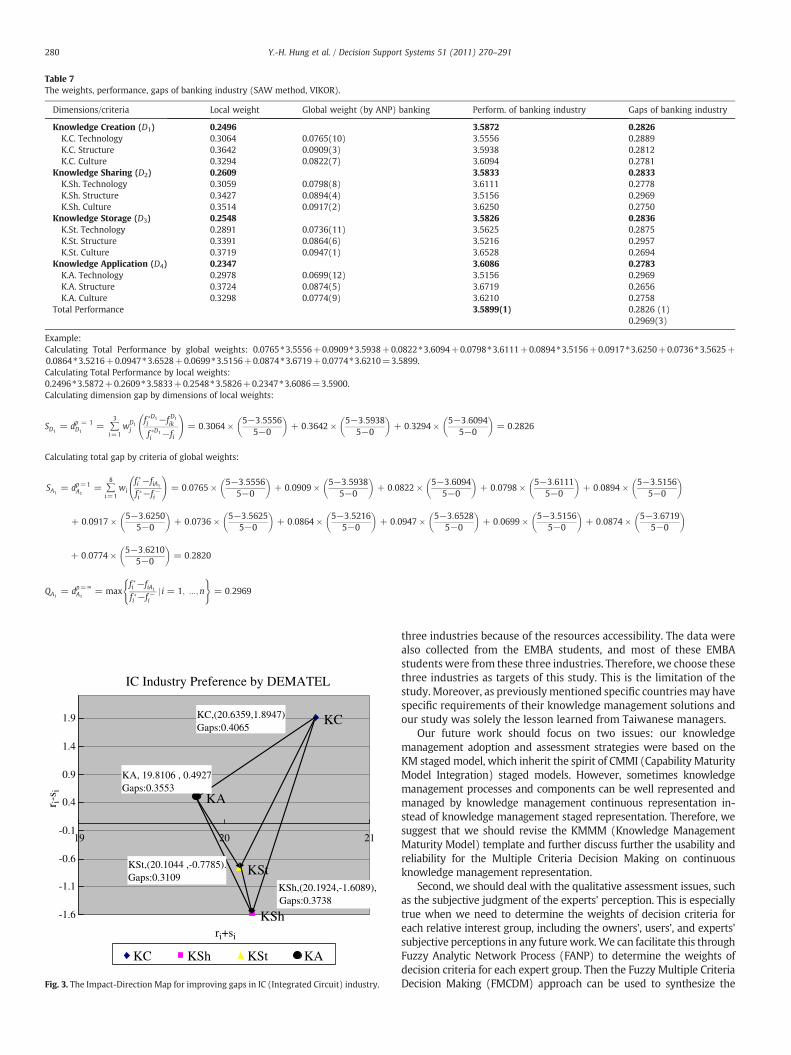
Knowledge SHaring Structure component (0.2969). The bottleneckcomponents of Knowledge Management for IC (Integrated Circuit)industry are Knowledge Creation Culture component (0.4622) andKnowledge Creation Technology component (0.4173). This demon-strates that the culture and technology of knowledge creationprocess are the critical bottleneck for IC (Integrated Circuit) industry.The bottleneck components of Knowledge Management for theservice industry are Knowledge Application Technology component(0.4815) and Knowledge STorage Technology component (0.4806).The compromise ranking by VIKOR showed that the best adoptionstrategy for these three industries are Knowledge ApplicationTechnology (order 1) and Knowledge STorage Technology compo-nent (order 2) for service industry, Knowledge Creation Culturecomponent (order 1) and Knowledge Creation Technology compo-nent (order 2) for IC (Integrated Circuit) industry, and KnowledgeApplication Technology component (order 1) and KnowledgeSHaring Structure component (order 2) for banking industry.
This is why we suggest that the adoption strategy for differentindustry sectors should be considered separately according to whichindustry they belonging to SME (Small andMedium sized Enterprises)industry sectors.
Although the adoption strategy and assessment model providedby this study can be used in most of the countries of the world, thereare some differences that practitioners should keep in mind whenapplying this model: the level of importance of the twelve criteriacould be varied according to the situations of the country so thatpractitioners can adopt the most critical knowledge managementcomponents that they want to invest in and compare them and thenmake the optimal investment decision even their small enterprisescaling and lack of capital among the most of SME.
7.2. Conclusion
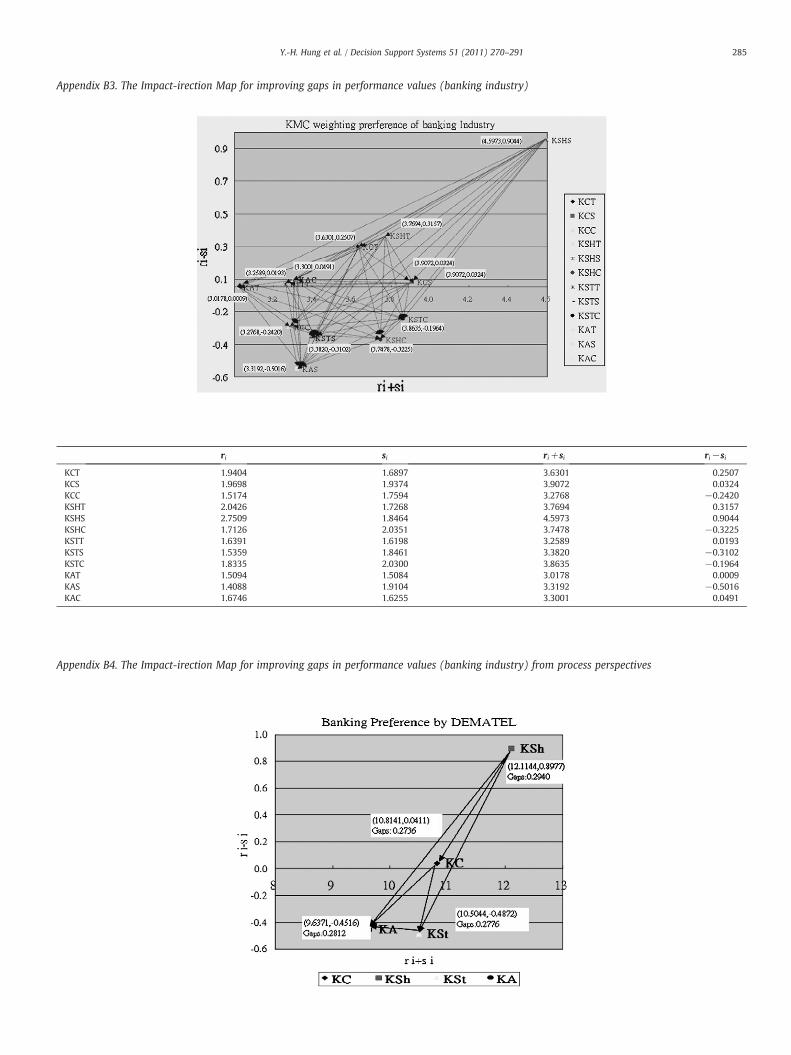
We have demonstrated that by using the Delphi method andGrounded Theory approach to consolidate the research issues byaggregating suggestion of experts/practitioners including SME con-sultants, knowledge management domain scholars, and executivemanagers of SMEs, and by implementing the DEMATEL technique toacquire the structure of Impact-Direction Map of knowledge man-agement components can indeed improve gaps in performance values(Figs. 3–6). The weights of each criterion from the structure wereobtained by utilizing the ANP, and the VIKOR techniquewas leveragedfor calculating compromise ranking gaps of the alternatives forimproving the priorities of alternatives of portfolios.
We have also found that the weighting preferences among expertsand raters differ between industry sectors. Therefore, specific domainexperts or SME consultants should be invited to provide that industryadoption weighting. Additionally, the performance of KMCs in eachindustry should be rated/assessed by SME (Small and Medium sizedEnterprises) executives based upon the experiences and understand-ing of their specific industry domain knowledge.
7.3. Limitations and future works
This study was based on the finding of knowledge managementgaps in SMEKM (Knowledge Management Plan for Small and MediumEnterprises) project of Small and Medium Enterprise Administration,Ministry of Economic Affairs, Taiwan. Since banking industry, servicesindustry, and Integrated Circuit industry are three major industries inTaiwan. Most of the data, SME consultants, knowledge managementdomain scholars, and executive managers of SMEs are all from these
Table 7The weights, performance, gaps of banking industry (SAW method, VIKOR).
Dimensions/criteria Local weight Global weight (by ANP) banking Perform. of banking industry Gaps of banking industry
Example:Calculating Total Performance by global weights: 0.0765⁎3.5556+0.0909⁎3.5938+0.0822⁎3.6094+0.0798⁎3.6111+0.0894⁎3.5156+0.0917⁎3.6250+0.0736⁎3.5625+0.0864⁎3.5216+0.0947⁎3.6528+0.0699⁎3.5156+0.0874⁎3.6719+0.0774⁎3.6210=3.5899.Calculating Total Performance by local weights:0.2496⁎3.5872+0.2609⁎3.5833+0.2548⁎3.5826+0.2347⁎3.6086=3.5900.Calculating dimension gap by dimensions of local weights:
SD1= dp = 1
D1= ∑
3
i=1wD1
j
f �D1i −f D1
ik
f �D1i −fi
!= 0:3064 ×
5−3:55565−0
� �+ 0:3642 ×
5−3:59385−0
� �+ 0:3294 ×
5−3:60945−0
� �= 0:2826
Calculating total gap by criteria of global weights:
SA1= dp=1
A1= ∑
8
i=1wi
f �i −fiA1
f �i −f−i
!= 0:0765 ×
5−3:55565−0
� �+ 0:0909 ×
5−3:59385−0
� �+ 0:0822 ×
5−3:60945−0
� �+ 0:0798 ×
5−3:61115−0
� �+ 0:0894 ×
5−3:51565−0
� �
+ 0:0917 ×5−3:6250
5−0
� �+ 0:0736 ×
5−3:56255−0
� �+ 0:0864 ×
5−3:52165−0
� �+ 0:0947 ×
5−3:65285−0
� �+ 0:0699 ×
5−3:51565−0
� �+ 0:0874 ×
5−3:67195−0
� �
+ 0:0774 ×5−3:6210
5−0
� �= 0:2820
QA1= dp=∞
A1= max
f �i −fiA1
f �i −f−ij i = 1; :::; n
( )= 0:2969
IC Industry Preference by DEMATEL
KC
KSh
KSt
KA
-1.6
-1.1
-0.6
-0.1
0.4
0.9
1.4
1.9
19
r i-s i
ri+si
KA, 19.8106 , 0.4927Gaps:0.3553
KSt,(20.1044 ,-0.7785).Gaps:0.3109
KSh,(20.1924,-1.6089),Gaps:0.3738
KC,(20.6359,1.8947)Gaps:0.4065
20 21
KC KSh KSt KA
Fig. 3. The Impact-Direction Map for improving gaps in IC (Integrated Circuit) industry.
280 Y.-H. Hung et al. / Decision Support Systems 51 (2011) 270–291
three industries because of the resources accessibility. The data werealso collected from the EMBA students, and most of these EMBAstudents were from these three industries. Therefore, we choose thesethree industries as targets of this study. This is the limitation of thestudy. Moreover, as previouslymentioned specific countriesmay havespecific requirements of their knowledge management solutions andour study was solely the lesson learned from Taiwanese managers.
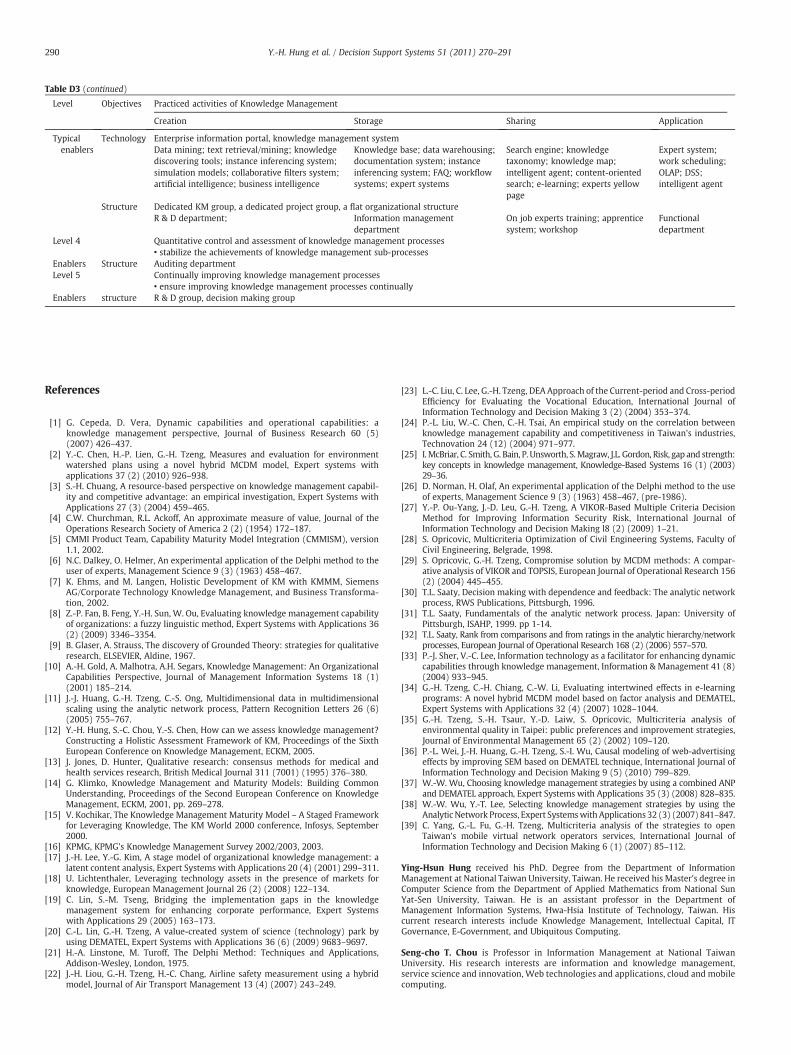
Our future work should focus on two issues: our knowledgemanagement adoption and assessment strategies were based on theKM staged model, which inherit the spirit of CMMI (Capability MaturityModel Integration) staged models. However, sometimes knowledgemanagement processes and components can be well represented andmanaged by knowledge management continuous representation in-stead of knowledge management staged representation. Therefore, wesuggest that we should revise the KMMM (Knowledge ManagementMaturity Model) template and further discuss further the usability andreliability for the Multiple Criteria Decision Making on continuousknowledge management representation.
Second, we should deal with the qualitative assessment issues, suchas the subjective judgment of the experts' perception. This is especiallytrue when we need to determine the weights of decision criteria foreach relative interest group, including the owners', users', and experts'subjective perceptions in any futurework.We can facilitate this throughFuzzy Analytic Network Process (FANP) to determine the weights ofdecision criteria for each expert group. Then the Fuzzy Multiple CriteriaDecision Making (FMCDM) approach can be used to synthesize the
KMC weighting preference of IC Industry
KCT, 7.1441 , 0.7958
KSHS, 6.6262 , -0.3425
KSHC, 6 .4391 , - 1 . 428 3
KAT , 6 .81 9 1 , 1 . 05 61
KCS, 7 .2760 , 1 . 1 9 4 9
KCC, 6 .2158 , - 0 . 0960
KSHT , 7 . 127 1 , 0 . 161 9
KST T , 6 . 7 2 4 5 , 0 . 7607
KST S, 7 .0299 , - 0 . 6118
KST C, 6 .3 5 0 0 , - 0 . 9 2 7 4
KAS, 6 .6887 , - 0 . 8 4 9 1
KAC, 6 .3028 , 0 . 2 8 5 7
-1.5
-1.0
-0.5
0.0
0.5
1.0
6.2 6.4 6.6 6.8 7.0 7.2
ri+si
r i-s i
KCT
KCS
KCC
KSHT
KSHS
KSHC
KSTT
KSTS
KSTC
KAT
KAS
KAC
Fig. 4. The Impact-Direction Map of KMCs for improving gaps (Integrated Circuit industry).
Banking Preference by DEMATEL
KC
KSh
KStKA-0.6
-0.4
-0.2
0.0
0.2
0.4
0.6
0.8
1.0
8 9 10 11 12 13
ri+si
KC KSh KSt KA
(12.1144,0.8977)Gaps:0.2940
(10.8141,0.0411)Gaps: 0.2736
(9.6371,-0.4516)Gaps:0.2812
(10.5044,-0.4872)Gaps:0.2776
r i-s i
Fig. 5. The Impact-Direction Map for improving gaps in performance values (bankingindustry).
KMC weighting preference of banking Industry
KCT
KCS
KCC
KSHT
KSHS
KSHC
KSTT
KSTS
KSTC
KAT
KAS
KAC
-0.6
-0.4
-0.2
0.1
0.3
0.5
0.7
0.9
3.0 3.2 3.4 3.6 3.8 4.0 4.2 4.4 4.6
ri+si
KCT
KCS
KCC
KSHT
KSHS
KSHC
KSTT
KSTS
KSTC
KAT
KAS
KAC
(4.5973,0.9044)
(3.3192,-0.5016)
(3.7478,-0.3225)
(3.8635,-0.1964)
(3.9072,0.0324)
(3.0178,0.0009)
(3.7694,0.3157)
(3.6301,0.2507)
(3.2768,-0.2420)
(3.3820,-0.3102)
(3.3001,0.0491)(3.2589,0.0193)
r i-s i
281Y.-H. Hung et al. / Decision Support Systems 51 (2011) 270–291
Fig. 6. The Impact-Direction Map for improving ga
group decision. This process might enable decision makers to formalizeand effectively solve the complicated, multi-criteria, and fuzzy/vagueperceptionproblems formost of the appropriate strategies in knowledgemanagement alternative adoption. Fromthecriteriaweights of industry-specific domain expert groups by Fuzzy ANP and the average fuzzyperformance values of each criterion from SME (Small and Mediumsized Enterprises) practitioners for each alternative, then the final fuzzysynthetic decision can then be processed.
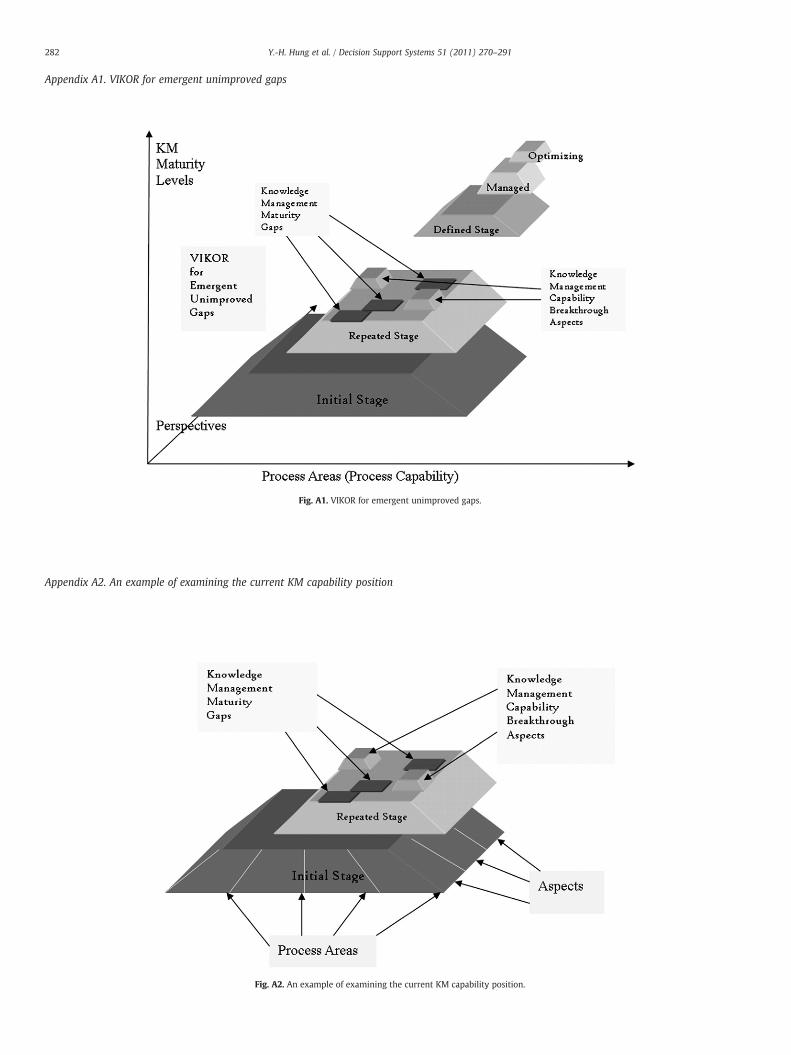
Appendix A. VIKOR for emergent unimproved gaps
In this example, the organization fulfills all the requirements of thefirst stage of KMM (i.e., the initial stage), but some KM activities donot reach the minimum required threshold of the second KMMM(Knowledge Management Maturity Model) stage. Hence, to progressto the next stage, the organization should focus on these critical KMactivities and refine them to meet the threshold criteria. In the figurethe gaps highlighted in orange are deemed the most urgent. Thebreakthrough activities (ivory color) should be maintained, but someof the resources should be used to strengthen and support the urgentKM activities that do not meet the minimum thresholds.
ps in performance values (banking industry).
282 Y.-H. Hung et al. / Decision Support Systems 51 (2011) 270–291
Appendix A1. VIKOR for emergent unimproved gaps
Fig. A1. VIKOR for emergent unimproved gaps.
Appendix A2. An example of examining the current KM capability position
Fig. A2. An example of examining the current KM capability position.
283Y.-H. Hung et al. / Decision Support Systems 51 (2011) 270–291
Appendix A3. Complete the weighting by consultants and KMC performance by SME CEO/Rater
Fig. A3. Complete the weighting by consultants and KMC performance by SME CEO/Rater.
Appendix B. Demonstrations of the procedures of DEMATEL in banking industry
Appendix B1. The pair-wise influence matrix for KM components was rated by focus group of KM experts
KCT
KCS KCC KSHT KSHS KSHC KSTT KSTS KSTC KAT KAS KAC Row sum Original In short
The degree of influence from KCT to KCT, KCS, KCC, KSHT, KSHS, KSHC, KSTT, KSTS, KSTC, KAT, KAS, and KAC are 0, 2, 1, 2, 2, 1, 2, 2, 1, 2, 2, and 1, respectively.
Appendix B2. After the normalization of pair-wise influence matrix X (Divided by the maximum value of sum of rows/sum of columns.) matrix X
Note: Matrix W* multiplies with itself 1000 times, i.e. W*=W1000.
The matrix W* is convergent to a stable matrix. These values used to be the weighting values within banking industry. The stable matrix of ANP when limh→∞
Level Objectives Practiced activities of Knowledge Management
Creation Storage
Level 1 – –
Level 2 Generic Aware of the importance of Knowledge Management• defining Knowledge Management• discovering problems and potential values of Knowledge Man
Specific Achievements of KM activities in specific scopes• encourage employees' creativity• knowledge documentation• informal knowledge sharing activities and application
Structure Communities of practiceLevel 3 Generic Organizational KM support
• dedicated KM groups• invested resources
Specific Formalized and integrated sub-processes of Knowledge Manag• strategic and formalized mechanisms of knowledge creation• knowledge extraction and integration• formalized channels of knowledge sharing & training• contexts of knowledge applications
Sharing Application
agement
itors; data base bbs; email; videoconference;groupware; chartrooms;communities of practice
interface designsoftware
ement
(continued on next page)
Table D3 (continued)
Level Objectives Practiced activities of Knowledge Management
Creation Storage Sharing Application
Typicalenablers
Technology Enterprise information portal, knowledge management systemData mining; text retrieval/mining; knowledgediscovering tools; instance inferencing system;simulation models; collaborative filters system;artificial intelligence; business intelligence
Knowledge base; data warehousing;documentation system; instanceinferencing system; FAQ; workflowsystems; expert systems
• ensure improving knowledge management processes continuallyEnablers structure R & D group, decision making group
290 Y.-H. Hung et al. / Decision Support Systems 51 (2011) 270–291
References
[1] G. Cepeda, D. Vera, Dynamic capabilities and operational capabilities: aknowledge management perspective, Journal of Business Research 60 (5)(2007) 426–437.
[2] Y.-C. Chen, H.-P. Lien, G.-H. Tzeng, Measures and evaluation for environmentwatershed plans using a novel hybrid MCDM model, Expert systems withapplications 37 (2) (2010) 926–938.
[3] S.-H. Chuang, A resource-based perspective on knowledge management capabil-ity and competitive advantage: an empirical investigation, Expert Systems withApplications 27 (3) (2004) 459–465.
[4] C.W. Churchman, R.L. Ackoff, An approximate measure of value, Journal of theOperations Research Society of America 2 (2) (1954) 172–187.
[6] N.C. Dalkey, O. Helmer, An experimental application of the Delphi method to theuser of experts, Management Science 9 (3) (1963) 458–467.
[7] K. Ehms, and M. Langen, Holistic Development of KM with KMMM, SiemensAG/Corporate Technology Knowledge Management, and Business Transforma-tion, 2002.
[8] Z.-P. Fan, B. Feng, Y.-H. Sun, W. Ou, Evaluating knowledge management capabilityof organizations: a fuzzy linguistic method, Expert Systems with Applications 36(2) (2009) 3346–3354.
[9] B. Glaser, A. Strauss, The discovery of Grounded Theory: strategies for qualitativeresearch8 ELSEVIER, Aldine, 1967.
[10] A.-H. Gold, A. Malhotra, A.H. Segars, Knowledge Management: An OrganizationalCapabilities Perspective, Journal of Management Information Systems 18 (1)(2001) 185–214.
[11] J.-J. Huang, G.-H. Tzeng, C.-S. Ong, Multidimensional data in multidimensionalscaling using the analytic network process, Pattern Recognition Letters 26 (6)(2005) 755–767.
[12] Y.-H. Hung, S.-C. Chou, Y.-S. Chen, How can we assess knowledge management?Constructing a Holistic Assessment Framework of KM, Proceedings of the SixthEuropean Conference on Knowledge Management, ECKM, 2005.
[13] J. Jones, D. Hunter, Qualitative research: consensus methods for medical andhealth services research, British Medical Journal 311 (7001) (1995) 376–380.
[14] G. Klimko, Knowledge Management and Maturity Models: Building CommonUnderstanding, Proceedings of the Second European Conference on KnowledgeManagement, ECKM, 2001, pp. 269–278.
[15] V. Kochikar, The Knowledge Management Maturity Model – A Staged Frameworkfor Leveraging Knowledge, The KM World 2000 conference, Infosys, September2000.
[16] KPMG, KPMG's Knowledge Management Survey 2002/2003, 2003.[17] J.-H. Lee, Y.-G. Kim, A stage model of organizational knowledge management: a
latent content analysis, Expert Systems with Applications 20 (4) (2001) 299–311.[18] U. Lichtenthaler, Leveraging technology assets in the presence of markets for
knowledge, European Management Journal 26 (2) (2008) 122–134.[19] C. Lin, S.-M. Tseng, Bridging the implementation gaps in the knowledge
management system for enhancing corporate performance, Expert Systemswith Applications 29 (2005) 163–173.
[20] C.-L. Lin, G.-H. Tzeng, A value-created system of science (technology) park byusing DEMATEL, Expert Systems with Applications 36 (6) (2009) 9683–9697.
[21] H.-A. Linstone, M. Turoff, The Delphi Method: Techniques and Applications,Addison-Wesley, London, 1975.
[22] J.-H. Liou, G.-H. Tzeng, H.-C. Chang, Airline safety measurement using a hybridmodel, Journal of Air Transport Management 13 (4) (2007) 243–249.
[23] L.-C. Liu, C. Lee, G.-H. Tzeng, DEA Approach of the Current-period and Cross-periodEfficiency for Evaluating the Vocational Education, International Journal ofInformation Technology and Decision Making 3 (2) (2004) 353–374.
[24] P.-L. Liu, W.-C. Chen, C.-H. Tsai, An empirical study on the correlation betweenknowledge management capability and competitiveness in Taiwan's industries,Technovation 24 (12) (2004) 971–977.
[25] I.McBriar, C. Smith, G. Bain, P. Unsworth, S.Magraw, J.L. Gordon, Risk, gap and strength:key concepts in knowledge management, Knowledge-Based Systems 16 (1) (2003)29–36.
[26] D. Norman, H. Olaf, An experimental application of the Delphi method to the useof experts, Management Science 9 (3) (1963) 458–4678 (pre-1986).
[27] Y.-P. Ou-Yang, J.-D. Leu, G.-H. Tzeng, A VIKOR-Based Multiple Criteria DecisionMethod for Improving Information Security Risk, International Journal ofInformation Technology and Decision Making l8 (2) (2009) 1–21.
[28] S. Opricovic, Multicriteria Optimization of Civil Engineering Systems, Faculty ofCivil Engineering, Belgrade, 1998.
[29] S. Opricovic, G.-H. Tzeng, Compromise solution by MCDM methods: A compar-ative analysis of VIKOR and TOPSIS, European Journal of Operational Research 156(2) (2004) 445–455.
[30] T.L. Saaty, Decision making with dependence and feedback: The analytic networkprocess, RWS Publications, Pittsburgh, 1996.
[31] T.L. Saaty, Fundamentals of the analytic network process. Japan: University ofPittsburgh, ISAHP, 1999. pp 1-14.
[32] T.L. Saaty, Rank from comparisons and from ratings in the analytic hierarchy/networkprocesses, European Journal of Operational Research 168 (2) (2006) 557–570.
[33] P.-J. Sher, V.-C. Lee, Information technology as a facilitator for enhancing dynamiccapabilities through knowledge management, Information & Management 41 (8)(2004) 933–945.
[34] G.-H. Tzeng, C.-H. Chiang, C.-W. Li, Evaluating intertwined effects in e-learningprograms: A novel hybrid MCDM model based on factor analysis and DEMATEL,Expert Systems with Applications 32 (4) (2007) 1028–1044.
[35] G.-H. Tzeng, S.-H. Tsaur, Y.-D. Laiw, S. Opricovic, Multicriteria analysis ofenvironmental quality in Taipei: public preferences and improvement strategies,Journal of Environmental Management 65 (2) (2002) 109–120.
[36] P.-L. Wei, J.-H. Huang, G.-H. Tzeng, S.-I. Wu, Causal modeling of web-advertisingeffects by improving SEM based on DEMATEL technique, International Journal ofInformation Technology and Decision Making 9 (5) (2010) 799–829.
[37] W.-W. Wu, Choosing knowledge management strategies by using a combined ANPand DEMATEL approach, Expert Systems with Applications 35 (3) (2008) 828–835.
[39] C. Yang, G.-L. Fu, G.-H. Tzeng, Multicriteria analysis of the strategies to openTaiwan's mobile virtual network operators services, International Journal ofInformation Technology and Decision Making 6 (1) (2007) 85–112.
Ying-Hsun Hung received his PhD. Degree from the Department of InformationManagement at National Taiwan University, Taiwan. He received his Master's degree inComputer Science from the Department of Applied Mathematics from National SunYat-Sen University, Taiwan. He is an assistant professor in the Department ofManagement Information Systems, Hwa-Hsia Institute of Technology, Taiwan. Hiscurrent research interests include Knowledge Management, Intellectual Capital, ITGovernance, E-Government, and Ubiquitous Computing.
Seng-cho T. Chou is Professor in Information Management at National TaiwanUniversity. His research interests are information and knowledge management,service science and innovation, Web technologies and applications, cloud and mobilecomputing.
291Y.-H. Hung et al. / Decision Support Systems 51 (2011) 270–291
Gwo-Hshiung Tzeng received the PhD. Degree course in management science fromOsaka University, Osaka, Japan. He is right now National Distinguished Chair Professorof Chiao Tung University, Taiwan (Highest Honor offered by the Ministry of EducationAffairs, Taiwan) and got the Distinguished Research Fellow (Highest Honor Offered byNSC, Taiwan) from 2000. His current research interests include statistics, multivariateanalysis, network, routing and scheduling, Multiple Criteria Decision Making, fuzzytheory, hierarchical structure analysis for applying to technology management, energy,environment, transportation systems, transportation investment, logistics, location,urban planning, tourism, technology management, electronic commerce, global supplychain, etc. He got Highly Cited Paper (March 13, 2009) ESI "Compromise solution byMCDM methods: A comparative analysis of VIKOR and TOPSIS" as published in the"EUROPEAN JOURNAL OF OPERATIONAL RESEARCH" on July 16th, 156(2), 445-455,2004 has been recently identified by Thomson Reuters' Essential Science IndicatorsSM
to be one of the most cited papers in the field of Economics.He has got the MCDMEdgeworth-Pareto Award by International Society on Multiple Criteria DecisionMaking (June 2009), had got the Pinnacle of Achievement Award 2005 of the world,and had got the national distinguished chair professor and award (highest honoroffered) of the Ministry of Education Affairs of Taiwan (2000–2003) and three times ofdistinguished research award and two times of distinguished research fellow(highest honor offered) of National Science Council of Taiwan. Fellow IEEE Member(From September 30, 2002).