Page 1
DEEP LEARNING-BASED SIGN LANGUAGE
TRANSLATION SYSTEM
A THESIS SUBMITTED TO THE
GRADUATE SCHOOL OF APPLIED SCIENCES
OF
NEAR EAST UNIVERSITY
By
JOHN BUSH IDOKO
In Partial Fulfillment of the Requirements for
the Degree of Doctor of Philosophy
in
Computer Engineering
NICOSIA, 2020
JO
HN
BU
SH
IDO
KO
D
EE
P L
EA
RN
ING
-BA
SE
D S
IGN
LA
NG
UA
GE
N
EU
TR
AN
SL
AT
ION
SY
ST
EM
2020
Page 2
DEEP LEARNING-BASED SIGN LANGUAGE
TRANSLATION SYSTEM
A THESIS SUBMITTED TO THE
GRADUATE SCHOOL OF APPLIED SCIENCES
OF
NEAR EAST UNIVERSITY
By
JOHN BUSH IDOKO
In Partial Fulfillment of the Requirements for the
Degree of Doctor of Philosophy
in
Computer Engineering
NICOSIA, 2020
Page 3
John Bush Idoko: Deep Learning-Based Sign Language Translation System
Approval of Director of Graduate School of
Applied Sciences
Prof. Dr.Nadire CAVUS
We certify this thesis is satisfactory for the award of the degree of Doctor of Philosophy in
Biomedical Engineering
Examining Committee in Charge:
Assoc. Prof. Dr. Kamil Dimililer Committee Chairman, Department of
Automotive Engieering, NEU
Asst. Prof Dr. Boran Şekeroğlu Department of Information System
Engineering, NEU
Asst. Prof Dr. Mary Agoyi Department of Information
Technology, CIU
Asst. Prof Dr. Kamil Yurtkan Department of Computer
Engineering, CIU
Prof Dr. Rahib Abiyev Supervisor, Department of Computer
Engineering, NEU
Page 4
I hereby declare that all information contained in this document has been collected and presented
in compliance with academic legislation and ethical standards. I also declare that, as provided by
these Rules and Conduct, all materials and findings that are not original to this work have been
thoroughly cited and referenced.
Name, Surname: John Bush Idoko
Signature:
Date: 18/09/2020
Page 5
i
ACKNOWLEDGMENT
I would like to sincerely thank my supervisor Prof. Dr. Rahib Abiyev for his understanding,
patience, and guidance throughout my graduate studies at Near East University. His supervision
was paramount in providing a well-rounded experience in projecting my long-term career goals.
He encouraged me to be confident in everything I do. I graciously thank you for all you have
done for me Prof. Dr. Rahib Abiyev.
I would also like to thank all the lecturers in Computer Engineering Department and the Faculty
of Engineering at large for their immense attention and guidance.
Furthermore, I would like to thank my family for their patience, consistent prayers and love even
when I am away. Conclusively, I extend a big thank you to my very good friends; Murat Arslan
and Samuel Nii Tackie for their prompt responses to my calls.
Page 6
ii
ABSTRACT
In this thesis, we propose sign language translation system which utilizes deep learning based
convolutional neural network. Sign Language refers to language that enables dumb and hearing-
impaired individuals to facilitate communication. It is a non-verbal, natural and visually oriented
channel of communication among individuals that communicate via bodily/facial expressions,
postures, and some setting gestures. Such language is essentially used for non-verbal exchange
with deaf/dumb people. Recognition/translation of Sign Language happen to be an essential field
of study due to its potential to advance the interplay between the individuals deaf/dumb.
Nevertheless, the existing methods have several limitations. Some of which requires special
hardware tools such as specific cameras or sensor-based/multi-colored gloves. The other classical
approach uses special methodologies for solving extraction of features and classification problems. In this
thesis, classification and extraction of features stages were combined within the body of the sign language
translator (SLT). The presented approach simplifies the execution of SLT capable of solving object
detection and identification problems. In the thesis, we incorporated Multibox, Fixed Priors,
Multiscale Feature Maps, Hard Negative Mining and Non-Maximum Suppression deep learning
attributes for improving performance of the designed system. Incorporation of these learning
features makes localization easy and accurate, and simplifies feature extraction leading to a
seamless and faster model for sign language translation.
This implemented sign language translator comprises three major modules. In the first module,
hand region segmentation is applied using deep learning based on Single Short Detector (SSD).
SSD is an object detection approach that utilizes regional partitioning in a looped algorithm. In
the second module, feature vector extraction is performed using deep learning structure based on
inception v3 learning technique. Feature vectors are selected amongst low-level features
including center of mass coordinates, bounding box and bounding ellipse, because of their
robustness to segmentation errors resulting from images with low resolution. After feature vector
extraction, the extracted vector is supplied to the classifier. We performed transfer learning on
the first two deep learning models (SSD and Inception v3) which are in turn concatenated to the
SVM model forming a compact deep learning structure named Sign Language Translator (SLT).
With the aid of the employed deep learning structures, SLT can constructively translate the
Page 7
iii
detected hand gestures into text. To measure SLT success rate, validation tests were conducted
on two phases; American Sign Language Fingerspelling Datasets where the system obtained
99.90% accuracy, and in real time it obtained 99.30% accuracy. Results of the proposed
translator and comparative analysis exhibit the effectiveness of the usage of SLT in translation of
sign language.
Keywords: CNNs; DCNNs; Single short multibox detector; inceptions v3; support vector
machine; sign language
Page 8
iv
ÖZET
Bu tezde, derin öğrenme tabanı evrişimli sinir ağını kullanan işaret dili çeviri sistemini
öneriyoruz. İşaret Dili, dilsiz ve işitme engelli bireylerin iletişimi kolaylaştırmasını sağlayan dili
ifade eder. Bedensel / yüz ifadeleri, duruşlar ve bazı ayar hareketleriyle iletişim kuran bireyler
arasında sözsüz, doğal ve görsel olarak yönlendirilmiş bir iletişim kanalıdır. Bu dil esasen sağır /
dilsiz insanlarla sözsüz değişim için kullanılır. İşaret dilinin çevirisi / tanınması, sağır / dilsiz
bireyler arasındaki etkileşimi ilerletme potansiyeli nedeniyle önemli bir araştırma alanıdır.
Bununla birlikte, mevcut yöntemlerin bazı sınırlamaları vardır. Bazıları belirli kameralar veya
sensör tabanlı / çok renkli eldivenler gibi özel donanım araçları gerektirir. Diğer klasik yaklaşım,
özelliklerin çıkarılmasını ve sınıflandırma problemlerini çözmek için özel yöntemler kullanır. Bu
tezde, işaret dili çevirmeni (SLT) bünyesinde özelliklerin sınıflandırılması ve çıkarılması
aşamaları birleştirilmiştir. Sunulan yaklaşım, nesne algılama ve tanımlama sorunlarını çözebilen
SLT'nin yürütülmesini basitleştirir. Tezde, tasarlanan sistemin performansını artırmak için Çoklu
Kutu, Sabit Öncelikler, Çok Ölçekli Özellik Haritaları, Sert Negatif Madencilik ve Maksimum
Olmayan Bastırma derin öğrenme özellikleri eklenmiştir. Bu öğrenme özelliklerinin
birleştirilmesi yerelleştirmeyi kolay ve doğru hale getirir ve işaret dili çevirisi için kesintisiz ve
daha hızlı bir modele yol açan özellik çıkarmayı basitleştirir.
Bu uygulanan işaret dili çevirmeni üç ana modül içermektedir. İlk modülde, el bölgesi
segmentasyonu, Tek Kısa Dedektör (SSD) tabanlı derin öğrenme kullanılarak uygulanır. SSD,
döngüsel bir algoritmada bölgesel bölümlemeyi kullanan bir nesne algılama yaklaşımıdır. İkinci
modülde, özellik vektörü çıkarma, derin öğrenme yapısı temel başlangıç v3 öğrenme tekniği
kullanılarak gerçekleştirilir. Özellik vektörleri, düşük çözünürlüklü görüntülerden kaynaklanan
bölümleme hatalarına karşı sağlamlıklarından dolayı kütle koordinatları merkezi, sınırlayıcı kutu
ve sınırlayıcı elips dahil olmak üzere düşük seviyeli özellikler arasından seçilir. Özellik vektörü
ekstraksiyonundan sonra, ekstrakte edilen vektör sınıflandırıcıya verilir. İlk iki derin öğrenme
modelinde (SSD ve Inception v3) transfer öğrenimi gerçekleştirdik, bu da İşaret Dili Çevirmeni
(SLT) adında kompakt bir derin öğrenme yapısı oluşturan SVM temel modeliyle birleştirilmiştir.
Kullanılan derin öğrenme yapılarının yardımıyla, SLT tespit edilen el hareketlerini yapısal olarak
metne dönüştürebilir. SLT başarı oranını ölçmek için validasyon testleri iki aşamada
Page 9
v
gerçekleştirilmiştir; Sistemin% 99,90 doğruluğu ve gerçek zamanlı olarak% 99,30 doğruluğu
elde ettiği Amerikan İşaret Dili Parmakla Yazma Veri Kümeleri. Önerilen tercümanın sonuçları
ve karşılaştırmalı analiz, işaret dili çevirisinde SLT kullanımının etkinliğini göstermektedir.
Anahtar Kelimeler: CNN'ler; DCNN'ler; Tek kısa multiboks dedektör; inceptions v3; destek
vektör makinesi; işaret dili
Page 10
vi
TABLE OF CONTENTS
ACKNOWLEDGMENT ............................................................................................................... i
ABSTRACT ................................................................................................................................... ii
ÖZET ............................................................................................................................................ iv
TABLE OF CONTENTS ............................................................................................................ vi
LIST OF FIGURES ..................................................................................................................... ix
LIST OF TABLES ....................................................................................................................... xi
CHAPTER 1: INTRODUCTION ................................................................................................ 1
1.1 Motivation for the proposed model ....................................................................................... 3
1.2 Thesis Outline………………………………………………………………………………6
CHAPTER 2: STATE OF THE ART OF SIGN LANGUAGE TRANSLATION USING DEEP
LEARNING…………………………………….............................................................................7
2.1 Sign Languages and Hand Gestures ...................................................................................... 7
2.2 Hand Pose Estimation ........................................................................................................... 8
2.2.1 Estimation of hand pose in RGB images ........................................................................ 8
2.2.2 Hand pose estimation from depth images....................................................................... 9
2.3 Sign Language Translation State of the Art ........................................................................ 12
2.3.1 Acquisition of gesture data ........................................................................................... 13
2.3.2 Spatiotemporal gesture recognition .............................................................................. 20
2.3.3 Non-manual signals…………………………………………………………………...24
2.3.4 Important issues to recognition of spatiotemporal gesture……………………………25
2.4. Review of Sign Language Translation System…………………………………………..27
CHAPTER 3: DEEP LEARNING BASED ON CONVOLUTIONAL NEURAL NETWORK 32
3.1 Evolution of Deep Learning Structures ............................................................................... 32
3.1.1 Similarities between biological neurons………………………………………………32
Page 11
vii
3.1.2 Multilayer perceptron…………………………………………………………………35
3.1.3 Feedforward neural network training…………………………………………………37
3.2 Deep Learning Elements ..................................................................................................... 39
3.2.1 Softmax function……………………………………………………………………...39
3.2.2 Cost function of cross entropy………………………………………………………...40
3.3 CNNs Base Deep Learning……………………………………………………………….41
3.3.1 Transfer learning and overfitting problem……………………………………………46
CHAPTER 4: CNN BASED SIGN LANGUAGE TRANSLATION SYSTEM ........................ 49
4.1 Structure of the System ....................................................................................................... 49
4.2 Dataset Analysis .................................................................................................................. 51
4.3 Single Shot Multibox Detector……………………………………………………………53
4.4 Inception V3………………………………………………………………………………54
4.5 Support Vector Machine………………………………………………………………….56
CHAPTER 5: SIMULATION AND RESULTS OF SIGN LANGUAGE TRANSLATION
SYSTEM ....................................................................................................................................... 59
5.1 Overview ............................................................................................................................. 59
5.2 Simulation and Result ......................................................................................................... 59
5.3 Other Tested Models ........................................................................................................... 62
5.3.1 CNN simulation……………………………………………………………………….62
5.3.2 Simulation using HOG plus NN………………………………………………………64
5.3.3 Simulation using HOG plus SVM…………………………………………………….65
5.4 Comparative Results of Different Models .......................................................................... 67
CHAPTER 6: CONCLUSION................................................................................................... 70
Page 12
viii
REFERENCES ............................................................................................................................ 72
APPENDICES ............................................................................................................................. 84
APPENDIX 1: Source Codes…………………………………………………………….84
APPENDIX 2: Curriculum Vitea………………………………………………………...89
APPENDIX 3: Ethical Approval Report………………………………………………...93
APPENDIX 4: Similarity Report………………………………………………………...94
Page 13
ix
LIST OF FIGURES
Figure 2.1: Pipeline illustration…………………………………………………………………..9
Figure 2.2: Searching process for one finger joint………………………………………………10
Figure 2.3: Low dimensional embedding layer…………………………………………………11
Figure 2.4: Fusion of heatmap for 3D hand joint locations estimation ………………………...12
Figure 2.5: Recognition framework of bio-channel……………………………………………..13
Figure 2.6: 3-D motion tracker………………………………………………………………….14
Figure 2.7: Caption of acceleglove……………………………………………………………...15
Figure 2.8: Accelerometer and camera…………………………………………………….........15
Figure 2.9: Data collection system by glove……………………………………………….........16
Figure 2.10: Samples of results of hand segmentation………………………………………….17
Figure 2.11: Samples of results of hand segmentation…………………………………….........17
Figure 2.12: Samples of results of hand segmentation……….....................................................17
Figure 2.13: Samples of results of hand segmentation………………………………………….18
Figure 2.14: Samples of results of hand segmentation……………………………………….....18
Figure 2.15: Samples of results of hand segmentation……………………………………….....19
Figure 2.16: Samples of results of hand segmentation……………………………………….....19
Figure 2.17: Samples of signs with similar hand pose………………………………………….31
Figure 2.18: Samples of signs including articulation of similar location……………………….31
Figure 3.1: Biological and artificial neuron representations…………………………………….33
Figure 3.2: Four depth multilayer perceptrons………………………………………………….35
Figure 3.3: Activation functions………………………………………………………………...36
Figure 3.4: Cross-entropy cost function L(W) values…………………………………………..41
Figure 3.5: LeNet-5 architecture………………………………………………………………...43
Figure 3.6: Two-dimensional convolution………………………………………………………44
Figure 3.7: 2x2 max pooling layer………………………………………………………………45
Figure 3.8: A stacked convolutional layers……………………………………………………..45
Figure 3.9: Correlation between error measures and capacity of a model……………………...46
Figure 4.1: Structure of the proposed system…………………………………………………...49
Figure 4.2: Fragment of ASL fingerspelling dataset………………………………………........52
Page 14
x
Figure 4.3: Conversion of sign to text using SLT……………………………………………….52
Figure 4.4: SSD network structure……………………………………………………………...53
Figure 4.5: SSD structure generating box overlapping…………………………….....................54
Figure 4.6: Two 3x3 convolutions replacing one 5x5 convolution……………………………..55
Figure 4.7: One 3x3 convolution replaced by one 3x1 convolution…………………………….56
Figure 4.8: SVM boundaries…………………………………………………………………….57
Figure 5.1: Classification report of the proposed model………………………………………..60
Figure 5.2: Confusion matrix of the proposed model…………………………………………...61
Figure 5.3: CNN simulation results for loss function and accuracy…………………………….63
Figure 5.4: HOG plus NN simulation results for loss function, accuracy and RMSE………….65
Figure 5.5: Classification report for HOG plus SVM…………………………………………...66
Figure 5.6: Classification matrix for HOG plus SVM…………………………………………..66
Page 15
xi
LIST OF TABLES
Table 5.1: Simulation results of the proposed model……………………………………………62
Table 5.2: CNN structure…………………………………………………………......................62
Table 5.3: CNN simulation results………………………………………………………………63
Table 5.4: HOG plus NN structure……………………………………………………………...64
Table 5.5: HOG plus NN simulation results…………………………………………………….65
Table 5.6: Different models comparative results…………………………………………..........67
Table 5.7: Results of other tested deep structure models………………………………………..68
Page 16
1
CHAPTER 1
INTRODUCTION
Sign language is a medium of communication that utilizes movements of the body/facial,
postures, with some setting motions in human to human communicuation as well as through
television and social media. Huge number of hearing impaired individuals use Sign Language as
the first language, and individuals who have different speech difficulties. According to the
British deaf association investigation, it is estimated that around 151,000 individuals use Sign
Language to communicate (Jala et al., 2018). There is no universal sign language and almost all
nations of the world have their own national non-verbal communication medium and
fingerspelling alphabet. The signers use both lips articulation, facial imitations and hand
gestures. There is a special grammar in Sign Languages that has basic variations in the spoken
languages based on voice. The American sign language ( ASL), having its own grammar and
rules, happens to be one of the most common sign languages in the world. There are also other
sign systems including the signed English; this borrows signs from the American sign language
but uses them in order of English Language (Parton, 2016). It is a two-way operation, since Sign
Language involves both rendering the signs (expressive skills) and reading the signs (receptive
skills). The translation and understanding of Sign Language is a very crucial field of study since
it brings individuals with hearing impairments into the community and offers equal opportunity.
The development of a human-machine interface that has the capability to enhance the common
correspondence amongst healthy and hearing impede individuals is a significantly important
problem, targeted at supplanting the third human factor (translator). The sign language
recognition problem is often limited to the translation of fingerspelled words to text, where sign
language alphabet recognition is the major task (Dong et al., 2015). Characterized by their own
rules and grammar, sign languages are comprised of dynamic configuration of a set of palm and
hand gestures positions, body movements, and finally, expression of the face
(http://www.nidcd.nih.gov/health/hearing/asl.asp Retrieved 17 April, 2020). For most if not all
known natural dialects/languages, there are different signs.
We have few number of hearing individuals who are capable of using sign language to
communicate. Gesture based communication mediators can be utilized to help correspondence
Page 17
2
among hard of hearing and hearing individuals however this is frequently troublesome because
of the restricted accessibility and significant expense of translators. These challenges in
correspondence among hearing and hard of hearing individuals can prompt issues in the
integration of hard of hearing individuals into society and clashes with a self-determined and
independent way of life. Hearing individuals learn and see composed languages as a visual
portrayal of verbal languages in which alphabets encode phonemes. And for hard of hearing
individuals, this mutual communication doesn't exist along these lines, alphabets are simply
observed as meaningless symbols (Dong et al., 2015). Hard of hearing individuals in this way
have incredible challenges in reading as well as writing since there is no immediate relation
between their written languages and natural languages (gesture based communication). To
enhance communication between hard of hearing and hearing individuals, research in automated
translation/recognition is highly required. Current developments in automatic sign language
recognition are apparently 30yrs behind automated recognition of speech (Dong et al., 2015).
Communication via gestures is passed on through various interfacing channels of information, in
this way the examination of gesture based communication is a more perplexing issue than that of
analyzing speech in 1D audio channel.
Because some individuals don't comprehend Sign Language, and some persons typically find it
pretty challenging to comprehend, developing a sign language translator based on vision has
become important. The design of such a system permits a substantial reduction of the contact
barrier between people. There are two key approaches for interpreting the Sign Language.
Vision-based method is the first approach and uses mounted camera in order to capture the target
image that is further supplied to the module for image processing (Abiyev, 2014), (Tao et al.,
2018), and (Aly et a., 2019). The second strategy is the glove-based method which implements
gloves and sensors. I this method, the glove is used to alleviate the limitations of the
conventional approaches based on vision. Although users/signers frequently find glove-base
methods to be burdensome and challenging, the findings are much reliable and consistent (Chuan
et al., 2014) and (Aly et al., 2019). These applications need special hardware tools such as the
utilization of specific camera or sensor-based/multi-colored. The other approaches Dong et al.
(2015) use special methodologies for solving the extraction of features and classification problems. In
this thesis, CNN that combines these two stages is proposed to implement SLT. The proposed method
simplifies the design of the Sign Language recognition framework that solves object detection and
Page 18
3
identification stages using single video camera for capturing complex hand movements for their
recognition.
1.1 Motivation for the Proposed Hybrid Model
The conventional methods for object detection are implemented on shallow trainable
architectures and handcrafted features. They have difficulties in constructing more complex
systems integrating high-level context with several low-level image features. One powerful
approach that is capable of learning high-level, semantic and deeper features is the
implementation of deep learning structures for detection of object. Recently, deep learning-based
methods for instance SSD, R-CNN, YOLO and Faster R-CNN algorithms Bao et al. (2015) and
Zhao et al. (2019) are applied for detection of object. R-CNN uses selective search to create
bounding boxes or region proposals (Uijlings et al., 2013). The selective search takes the image
of various sizes and for each size, it tries to group together adjacent pixels using intensity, color
or texture for object identification. And for every bounding boxes using CNN, classification of
image is performed. The algorithm has some disadvantages. Used selective search is fixed
algorithm that does not use learning and this may generate bad candidate region proposal. Also,
the algorithm takes a lot of time during training of network that classifies many regions of
proposals and because of this, the algorithm cannot be implemented in real-time. Later, a faster
version of the R-CNN algorithm that uses CNN instead of selective search is designed so as to
solve above-mentioned problems. But faster version requires many passes (systems) through a
single image so as to extract all possible objects. The performance of this system depends on
how the previous system is performed. The algorithm YOLO (You Only Look Once) Redmon et
al. (2016) actually looks at images one time, although in a clever way. The algorithm (YOLO)
splits the image into grid of SxS cells, each of which is responsible for forecasting m bounding
boxes that enclose some objects. And for each of these bounding boxes, a class prediction is
performed by the cell. The predicting of bounding boxes is performed by calculating the
confidence score. The architecture of YOLO is based on CNNs. An input image given to the
YOLO is processed a single pass by the convolutional layers, and at the end of the network, the
tensor characterizing the grid cells bounding boxes are derived. After determining the final
scores for the bounding boxes the outputs are determined. YOLO is a simple and fast algorithm.
Page 19
4
One of the limitations of YOLO is its inability to perform well with smaller objects within
images. As a result, there may be challenges in floc of birds‟ detection. And this is because of
algorithms spatial constraints. Later, a faster version of YOLO algorithm was developed, but it is
less accurate than the first version.
Single Short Detector Liu et al. (2016) is based on CNN which generates collection of fixed-size
of bounding box. In these boxes, by scoring object class instances detection, the final detection
of objects is implemented. The model is the object detector which classifies the detected objects.
The network uses Multibox, Fixed priors and Priors sub-components. In this model structure, a
set of new SSD layers and new faster R-CNN modules or some of their combination are used to
replace Convolution/Pooling layers. Using SSD a better balance between swiftness and precision
is achieved. By running a convolutional network only one time, SSD determines a feature map of
the input image. SSD also utilizes anchor boxes at a range of aspect ratios similar to Faster-
RCNN and learns the off-set to some degree than learning the box (Liu et al., 2016). After
multiple convolutional layers, SSD predicts the bounding boxes in order to hold the scale.
Objects of a mixture of scales are readily detected because every convolutional layer has the
capability of functioning at a diverse scale. In this study, we use SSD based on CNN. SSD is
faster than YOLO, and more accurate than Faster R-CNN. More detailed comparisons of object
detection methods are provided in the papers (Liu et al., 2016) and (Zhoa et al., 2019). From
these comparative results, it was clear that SSD approach recorded higher result as compared to
the other methodologies.
Recently, feature extraction methodologies including Principal Component Analysis (PCA),
local binary patterns, Gabor filters, Speeded Up Robust Features (SURF) semantic analysis,
Scale Invariant Feature Transform (SIFT), independent component analysis, histogram of
gradient are widely used for feature extraction (Di Ruberto et al., 2016) and (Wang et al., 2018).
The extracted features are used in classification. Conventional classification algorithms are based
on k-means, linear discriminant analysis, c-means, supervised clustering, fuzzy c-means, etc
(Wang et al., 2018). Some studies including (Liu et al., 2016) and (Zhoa et al., 2019) addressed
the limitations of the existing conventional tools. Some of the limitations include low speed and
accuracy. The latest version of Inception fixes these limitations by the introduction of
factorization method. Factorization of higher dimensions into smaller dimensions reduces
Page 20
5
execution time and increases accuracy. Nowadays machine learning techniques are extensively
used for feature extraction and classification purpose. These are neural networks, SVM, radial
based networks, neuro-fuzzy networks, different types of deep learning structures. The
integration of deep learning structures and SVM (Kundu and Ari (2020)) are becoming
extensively used for solving feature extraction and classification problems. In the paper Kundu
and Ari (2020), a 2D convolutional layer-based CNN architecture, Fisher ratio (F-ratio) based
feature selection and SVM classifier are used for P300 detection. Another novel deep structure
which utilizes support vector machines including class probability output systems is presented in
Kim et al. (2015) for the provision of higher generalization power for problems relating to
pattern classification. The paper Zareapoor et al. (2018) presents a combination of deep belief
structure as well as kernelized SVM for classification of multiclass dataset. Chen et al. (2018)
proposed a Deep Ranking Structural SVM with deep learning to tag image. In the paper Qi et al.
(2016) integration of deep learning and SVM is proposed for acquisition of deep features
afterwards, standard SVM is used for classification. The paper Li and Zhang (2017) proposes
deep neural mapping support vector machine which was trained utilizing Gradient Descent. In
Fernandes et al. (2019) combination of CNN and SVM is presented for Grapevine variety
identification, and theses integrated models yielded great performance in terms of accuracy and
speed.
At the phases of feature extraction as well as classification, the speed, sensitivity, occlusion and
accuracy of the system are very important. This thesis propose sign language translation system
based on a hybrid structure that uses SSD to detect hand gestures and then uses Inception v3 plus
SVM to obtain features for classification purposes. Here, the inception v3 module is a CNN
which transforms and extracts feature matrices from the detected hand gesture to smaller
dimensional spaces for further examination. After this, the incorporated SVM classifier performs
the sign classification. At the end of training and testing, the outcome of the presented hybrid
network has shown the efficiency of the system in the execution of the sign language translation
problem and many other human-machine interface related problems.
Some of the goals of this thesis are:
To develop deep learning model based on CNN that processes and classifies the different
sign language communication signs.
Page 21
6
To develop algorithms based on deep learning to detect and segment hand gestures in on-
line.
The thesis depicts the following contributions to the above mentioned goals:
Designing the structure of a vision-based sign language translator (SLT) based on Inception 3
algorithm without the use of external/extra hardware
Designing algorithms of CNN based deep learning for detection, identification of sign
languages.
Performing transfer learning at object detection phase by reusing SSD object detection
features. This would enable easy application of SLT to other nations' sign languages
Implementation of robust supervised training algorithm by using multiple instance learning
density matrices (incorporated in the second module).
1.2 Thesis Outline
Remaining part of the thesis is organized thus:
Chapter 2 presents the state-of-the-art sign language translation. The used signs, a discussion of
how particular signs are formed and distinguished from each other are given. The overview of
the sign language translation systems, their analysis is described. Furthermore, we demonstrate
the significant ideas in the state-of-the-art in gesture based communication recognition and
further discuss previous unsolved tasks.
Chapter 3 presents the deep learning based CNN. The structure and operating principles of CNN-
based deep learning is discussed. Implementation of CNN for detection of hand gestures and
classification is presented.
Chapter 4 presents modeling of sign language translation system. Hand gesture recognition using
CNN is given. Thorough discriminatory properties assessment and evaluation of sign language
translator features is discussed in this chapter.
Results, simulation and discussion of sign language translator are demonstrated in chapter 5.
In chapter 6, we summarize the fundamental contributions of SLT as well as details of future
thoughts.
Page 22
7
CHAPTER 2
THE STATE OF THE ART OF SIGN LANGUAGE TRANSLATION USING DEEP
LEARNING
2.1 Sign Languages and Hand Gestures
Sign to text conversion is afundamental application of Sign Language translation framework.
This requires total translation/interpretation of signed sentences to speech, or text, of a
communicated language. Such an interpretation framework isn't the main utilized methodology
for gesture based communication recognition frameworks. There are other visualized
applications for gesture based communication recognition frameworks; an instance is a
translation framework for explicit transactional domains, for example, banks, post offices and so
on. One other application of sign language recognition system is bandwidth conserving
framework which enables communication amongts signers where the recognized sign that is the
input of the communication framework at a terminal, could be converted into avatar-base
animation at another terminal. Another suggested application is a computerized sign language
teaching model. This application supports users experiencing hearing misfortune, hard of hearing
individuals with gesture based communication insufficiencies and hearing individuals wishing to
learn gesture based communication.
Other proposed applications are automated or semi-automated framework for annotating native
signing video databases. Etymological research on gesture based communication requires huge
scale annotated corpora as well as automated strategies for investigating sign language videos
would incredibly enhance annotation effectiveness. At long last, gesture based communication
recognition frameworks can be consolidated to application that allow interface of input for
augmentation of communication frameworks. Assistive innovation designed for human to human
correspondence by dumb individuals frequently needs joystick, keyboards and mouse inputs.
Frameworks that can fuse natural aspects of gesture based communication would improve the
availability of these frameworks. The techniques proposed in SLT are not constrained to Sign
Language translation. The techniques we proposed in this research can possibly be applied to
various tasks that emphasis on human gesture modeling and recognition, for example, control of
Page 23
8
gesture in Human Computer Interface (HCI) frameworks, analysis of human activity/action as
well as analysis of social interaction.
2.2 Hand Pose Estimation
Estimation of accurate hand pose is highly essential in many augmented reality or human-
computer interaction tasks, and has lately become very important in the field of computer vision.
2.2.1 Estimation of hand pose in RGB images
A lot of significant works that treated estimation of hand pose utilizing RGB images has been
proposed. Those methodologies can be split into two classes: appearance-based methodologies
and model-based methodologies (Rastgoo et al., 2020). Model based methodologies create
position of hand hypotheses and assess them using the input images. In (Rastgoo et al., 2018),
the authors presented a technique to fit a 3-D model of hand mesh with the hand surface by a
mesh built through principal component analysis from training data. The real time tracking is
accomplished through calculating the nearest potentially deformed system that matches the given
image. Henia et al. (2010) utilized two-step minimization technique for system based on tracking
of hand. The authors presented a novel a minimization procedure and dissimilarity function
which works in two stages: the first gives the global hand parameters, that is position and
direction of the palm, while the subsequent stage gives the local hand parameters, that is finger
joint points. Be that as it may, those approaches can't deal with the occlusion task.
Appearance based techniques utilize the exact information present in the images. They don't
utilize an express hand prior model but instead extricate the hand‟s region of interest (ROI).
Bretzner et al. (2002) recognize hand shapes using color features. Along these lines, the hand
could be depicted as a palm‟s huge blob feature, with fewer blob features indicating the fingers,
and this turned into a well-known strategy however has a few downsides, for example, detection
of skin color which is exceptionally delicate to lighting conditions. Garg et al. (2009) is
referenced for a review of estimation of hand pose based on RGB methodologies.
Page 24
9
2.2.2 Depth images hand pose estimation
Recently, estimation of pose of hand became a very popular research interest in computer vision.
The presentation of item profundity sensors and the huge number of potential applications
stimulates novel innovations. Be that as it may, it is as difficult to accomplish proficient and
powerful estimation execution in light of enormous potential varieties of pose of the hand,
extreme self-similarities with self-occlusions between fingers in the profundity image.
Distinctive estimation of hand pose approaches are described below:
a. Estimation of hand pose based on tracking
We centered our investigation on single frame techniques. Nonetheless, for culmination,
Oikonomidis et al. (2011) presented a tracking methodology and, thusly, require a ground-truth
introduction. The authors designed the difficult issue of 3-D tracking of articulations of hand as a
problem of optimization that limits contrasts between 3-D hypotheses of model of hand cases
and real visual perceptions. Optimization was carried out with a stochastic methodology known
as Particle Swarm Optimization (PSO) (Krishnaveni et al., 2016). Figure 2.1 demonstrates their
pipeline. Here, hand‟s ROI was first extracted from a profundity image and afterward fitted a 3-
D model of hand utilizing PSO. Considering images at step t the system is instated utilizing the
last one found from the image t - 1.
Figure 2.1: Oikonomidis et al. (2011) pipeline illustration; (a) Image current depth. (b) Firstly, extraction
of hand region of interest. (c) Secondly, presented technique was fitted to retrieve model of the hand from
previous image depth (d) Method applied to active depth image to recover pose of hand
Page 25
10
Manual introduction may give poor output however single frame techniques are very valuable,
and in many cases performed better than the tracking based methodologies. The major reason is,
the single frame techniques reinitialize themselves at every frame, but trackers can't recuperate
from constant errors.
b. Estimation of hand pose based on single frame
Numerous ongoing methodologies explored the tree hierarchy architecture of the model of the
hand. Tang et al. (2014) divides the hand into smaller bits along the topological tree of the hand
making new inert joints. Utilizing random decision forest technique, the authors carried out
localization of coarse to fine of the finger joints as delineated in Figure 2.2.
Figure 2.2: Searching process for just one finger joint (Tang et al., 2014)
Tang et al. (2015) broadened their thought utilizing energy function targeted at keeping just the
best partial poses via iterations of optimization. Sun et al. (2015) utilize progressive regression of
the pose of the hand from the palm to tip regions of the finger. Yang and Zhang (2015) presented
utilization of specific hand pose regressors by firstly, classifying the incoming image of depth
hand by using a vocabulary of finite hand pose to train separate posture regressors for all the
Page 26
11
categories. Every one of these methodologies require multiple estimations, one for every joints,
hand pose classes or finger and regularly numerous regressors for various stages of the
technique. In this way, regression systems number starting from 10 to in excess of 50 distinct
systems which must undergo training and assessed.
Deep neural networks brought great advancement in numerous computer vision problems. In
2015, Oberwerger et al. (2015) assessed many CNN models and estimated 3D joint regions of
hand depth map. Here the authors expressed that a compelled prior on 3D posture could be
initiated as a bottleneck layer after the convolutional neural network as demonstrated in Figure
2.3. This strategy greatly enhanced the dependability and accuracy of the prediction.
Figure 2.3: Evaluation of the usage of low dimensional embedding layer with less number neurons,
(Oberwerger et al., 2015)
Zhou et al. (2016) integrated real physical limitations into a convolutional neural network to add
extra layer which penalizes unnatural estimated postures. These limitations were manually
characterized. In addition, a few works incorporated the hierarchy of hand model into one
convolutional neural network architecture. Ye et al. (2016) presented the spatial attention-base
CNN which specialize on every joints and an extra optimization stage in order to affirm
kinematic limitations. Guo et al. (2017) trained a lot of systems for various spatial image region
Page 27
12
and Madadi et al. (2017) utilized a tree-shaped convolutional neural network structure in which
all the branches center around one finger. Neverova et al. (2017) integrated segmentation of hand
part based on convolutional neural network with a regression in order to predict locations of joint
but segmentation demonstrated high sensitivity to sensor noise.
A few portrayals of the input depth image have additionally been explored. Deng et al. (2017)
transformed image depth into 3D voxel volume and utilized a 3DCNN to forecast locations of
joint. Be that as it may, 3DCNN demonstrated a low computerize effect. Alongside, rather than
direct prediction of 3D joint regions, Ge et al. (2018) utilized many convolutional neural
networks in order to estimate heatmaps from various propagation of the depth image and train
particular convolutional neural networks for all the projections as portrayed in Figure 2.4. This
methodology required an intricate post-processing face so as to recreate a model of hand posture
from the heatmaps.
Figure 2.4: Fusion of heatmap for 3D hand joint locations estimation (Ge et al., 2018)
2.3 Sign Language Translation State of the Art
This section reviews state-of-the-art designs of gesture recognition and sign language, and
indicate some problems in the present literature which we solved in this thesis. To build a system
Page 28
13
for automatic learning and translation of sign language, it is significant that robust approaches
that models spatiotemporal gestures and hand pose be constructed.
Recently, significant advances have been made in this research area of Sign Language
translation. And this section reviews gesture translation systems that deal with temporal hand
poses and gestures. Ong and Ranganath (2005) is referenced for a thorough comprehension of
automated recognition of sign language.
2.3.1 Acquisition of gesture data
Focal point of the work described in the study is the construction of automated systems for the
automated learning and translation of signs in Sign Language. In order to capture gesture based
communication data, input date obtained utilizing direct measure gadgets or cameras. Here, we
demonstrate some methods of data acquisition utilizing cameras and direct measure gadgets
realized in this study.
a. Data acquisition based on wearable device computation
Application of methods of wearable device computation of Sign Language dataset collection
provides precise measures for data extraction on signer's hand shape as well as hand
development. Kim et al. (2008) presented a framework that integrated sensor data from EMG
and accelerometers, which was utilized to determine electrical activity generated via muscles of
the hand. It was indicated that the signal initiated by electromyogram incredibly improved the
performance of the system. Figure 2.5 depicts a representation of the sensor arrangement for a
single hand.
Figure 2.5: Recognition framework of bi-channel (Kim et al., 2008)
Page 29
14
Vogler and Metaxas (2004) hand movement data and recorded arm utilizing "ascension
technologies" recorded hand pose information and MotionStar 3D tracking framework utilizing
"virtual technologies" cybergloveTM
. Fang et al. (2003) and Gao et al. (2004) built up a huge
vocabulary sign recognition framework utilizing 3 pohelmus 3SPACE position trackers and 2
cyberglovesTM
. Two trackers are situated on the wrist of all the hands and the other situated on
signer's back and are utilized to gather position and orientation information. And these
cyberglovesTM
gathered 18D shape of the hand information for all hands. Additionally, Oz and
Leu (2007) used cybergloveTM
alongside flock of birds 3D gesture tracker for hand pose
attributes extraction. Figure 2.6 depicts the flock of birds 3D movement tracker and
cybergloveTM
.
Figure 2.6: From right: cyberglove, and from left: flock of birds 3D gesture tracker (Oz and Leu, 2007)
Also, McGuire et al. (2004) proposed another data glove base framework where a mobile gesture
based communication interpreter is actualized utilizing an acceleglove as shown in Figure 2.7.
Here, the acceleglove comprises of five small scale two-pivot accelerometers positioned on rings
reads finger flexion. The other two mounted at the back of the palm to calculate orientation.
There are other devices not displayed in Figure 2.6 and these are 2 potentiometers that calculates
Page 30
15
twist for the elbow as well as shoulder, and the other is 2 pivot accelerometer that quantifies the
upper arm points.
Figure 2.7: Caption of acceleglove (McGuire et al., 2004)
Another new method for data acquisition via sign language was demonstrated by Brashear et al.
(2003) here properties/features obtained from the accelerometer and camera placed on a hat
information are utilized for ssymbols/signs classification as shown in Figure 2.8. Wang et al.
(2007) presented viewpoint invariant information collection approach. The idea of the authors is
based on virtual stereo vision framework, utilizing gloves having a specific design for color
pattern and a camera to represent the five distinct fingers; back as well as palm.
Figure 2.8: Accelerometer and a camera mounted on the hat data collection framework (Brashear et al.,
2007)
Page 31
16
Figure 2.9 depicts the visualization of how the gloves are designed.
Figure 2.9: Data collection system by gloves (Wang et al., 2007)
b. Data acquisition via vision based
While wearable device computation methods for data collection could extract precise features
that represent the performed signs, few of these methodologies necessitate that the signers puts
on huge gadgets that could ruin the naturalness and ease of process. Another methodology is to
obtain signer's data via input image from a camera. In order to capture gestures from camera,
hands ought to be situated in the image sequence and this is regularly computed utilizing edge
information, color and motion Ong and Ranganath (2005). Many researchers have presented
approaches for hand segmentation from image sequence and some of these techniques will be
discussed in this section:
Yang et al. (2008) executed a motion-based segmentation and skin color strategy which
incorporated displacement prediction utilized when there is an overlap between the hands and the
face. One template hand which is stored on the last frame is utilized if the recognized hand
location is bigger than the region of the hand identified within the last frame else the hand
detection system fails to identify the hand area.
Holden et al. (2005) utilized principal component analysis (PCA) base skin color framework for
hand detection. The authors' strategy to crop occluded objects, utilizing an integration of snake
algorithm and motion cues, was utilized when there is an overlap between the face and the hands
as demonstrated in figure 2.10.
Page 32
17
Figure 2.10: Samples of results of segmentation of hand (Holden et al., 2005)
Cooper and Bowden (2007) designed a segmentation of hand approach utilizing a skin color
framework constructed from automation of face region detection. A background model is
constructed utilizing a standardized histogram as well as application of threshold to the
probability ratio of background to face for each of the pixels as depicted in figure 2.11.
Figure 2.11: Samples of results of segmentation of hand (Cooper and Bowden, 2007)
Askar et al. (2004) designed a skin color segmentation technique which adjusts automatically to
the brightening conditions. To represent skin segment, for example, overlapping hands and head,
a set of rules were implemented in order to track the hand when hand and face contact occur as
shown in Figure 2.12.
Figure 2.12: Samples of results of hand segmentation (Askar et al., 2004)
Page 33
18
Barhate et al. (2004) computed hand segmentation utilizing motion cues and skin in an on-line
prescient eigen-tracking system that which determined motion of the hand by a relative change.
The strategy of the authors was displayed to function admirably with under poor illumination and
occlusion as shown in figure 2.13.
Figure 2.13: Samples of results of segmentation of hand (Barhate et al., 2004)
Donoser and Bischof (2008) performed a hand segmentation method which integrated a
reconstructed version of the Maximally Stable Extremal Region (MSER) tracker with skin color
probability maps. The MSER tracker discovered illuminated connected segments in the skin
color maps that had thusly darker qualities along their limits as shown in Figure 2.14.
Figure 2.14: Samples of results of hand segmentation (Donoser and Bischof, 2008)
Buehler et al. (2009) executed a certain upper body framework for capturing signer's arms,
hands, head as well as torso. Graph slice technique was utilized to fragment the hand area
estimated by the tracker into background signer or hand as shown in Figure 2.15.
Page 34
19
Figure 2.15: Samples of results of segmentation of hand (Buehler et al., 2009)
Liwicki and Everingham (2009) presented a hand segmentation framework in which pixels are
categorized as non-hand or hand by combining three parts: a spatial coherence prior, a signer
explicit skin color model and a spatially-differing non-skin color model shown in figure 2.16.
Figure 2.16: Samples of results of hand segmentation (Liwicki and Everingham, 2009)
As earlier mentioned in this section, there are a wide range of strategies that have been
implemented for robust hand segmentation from image sequence. To accomplish the maximum
capacity these segmentation techniques have in the field of gesture based communication
recognition, we should create algorithms that could identify symbols from data of hand
segmentation. In our research, we describe the propose set of methods for automated learning
Page 35
20
and Sign Language recognition. Our strategies are constructed to use computer vision-base
segmentation of hand information. The proposed models are evaluated utilizing extraction of
data from image sequence, however the data extraction methods utilized are not the novel part of
the research.
2.3.2 Spatiotemporal gesture recognition
Investigation into sign recognition and spatiotemporal gesture has two fundamental classes:
constant recognition as well as isolation. For continuous/constant recognition, the signer
performs gestures consistently and the point is to spot and categories significant motion
fragments from within the persistent stream of communication via gestures. But isolated
recognition centers on characterization of the single motion of hand.
a. Continuous gesture recognition
Isolated recognition extension to continuous/consistent signing is a challenging problem. This
requires automated recognition of gestures such that the recognition algorithms could be applied
for signs segmentation. A suggested remedy to detect movement epenthesis is an unequivocal
segmentation framework where features subsets from motion information are utilized as signs for
legitimate hand motion start-and-end-point identification. Oz and Leu (2007) presented a
nonstop recognition system that detects "not signing" and "signing" regions utilizing velocity
network. This velocity network performs classification of signing region from when the hand
previously demonstrated an adjustment in velocity to the time when the velocity indicated low
velocity progression. Neural network base classifier is trained for recognition of 60 distinctive
one handed signs of the American sign language. Investigations performed on a sum of 360
words of ASL utilizing feature vectors histograms demonstrated 95% accuracy. Short coming of
this unequivocal segmentation framework emerges from the challenge in the creation of
generalized standards for boundary of sign identification which can to a wide range of non-
manual and manual motions (Ong and Ranganath, 2005). For instance, accurate signer carry out
sign language sentences in a characteristic way and sign boundaries frequently don't occur when
velocity of the hand change swiftly.
Page 36
21
Another method of tackling continuous recognition without unequivocal segmentation is to
utilize HMMs for certain segmentation of sentence. Bauer and Karl-Friedrich (2001) modeled
subunit or each word using HMM which they trained with data gathered from full sentences.
They performed investigations on a 40 signs vocabulary utilizing 478 sentences to train and test.
They achieved 96.8% word recognition rate. One of the disadvantages of these techniques is that
performance of complete sentence data training might bring about loss in substantial recognition
of sign precision when tried with sentences that are not utilized during training, and this is
because of the huge varieties of the presence of all conceivable motion epenthesis which can
happen between 2 symbols. Brashear et al. (2003) further improved the research of Starner et al.
(1998) by designing the recognition system for motion signs. The authors' sign recognition
framework based on HMM was executed to detect continuous sentences utilizing accelerometer
and camera data. Investigations performed on a 5 signs vocabulary demonstrated achieved 90.5%
recognition accuracy. It was likewise demonstrated that combination of vision and accelerometer
data increase the performance as contrasted with just accelerometer data (65.9%) and just vision
data (52.4%).
Some researches tackled movement epenthesis by expressly modeling gestures between signs.
Gao et al. (2004) presented transition movement models (TMM) in which HMMs transitions
were constructed to model transitions between every unique pairs of symbols. Sum of TMMs
were decreased by a procedure of progressively clustering parts of transitions. A looped
segmentation algorithm was executed to automate segmentation of continuous sentences. Trials
carried out on a set of 3000 sentence cases with 5113 signs of vocabulary from Chinese Sign
Language (CSL), indicated that the explored technique achieved 90.8% accuracy. Vogler and
Metaxas (2004) presented a framework to combine hand pose and hand motion data into just one
recognition system. One set of parallel HMMs were executed to detect symbols from 22 signs of
vocabulary. Other HMMs were executed in order to model epenthesis movement between every
unique starting and ending point of signs. Their investigations depict 87.88% detection rate when
tried on 99 sentences containing an aggregate of 312 signs.
In as much as these researches that explored express epenthesis models recorded great
performance movement epenthesis detection and sign language recognition, training of such
frameworks entails a lot of additional data gathering, labeling of data manually and training of
Page 37
22
model because of the additional number of HMMs needed to identify movement epenthesis.
Very few numbers of authors treated the issue of movement epenthesis without unequivocally
modeling the movements. Junker et al. (2008) presented a novel technique to deal with gesture
spotting where an integration of HMM classification of gesture and explicit movement
segmentation was performed. To detect relevant motion activities, the authors implemented a
pre-selection phase. Segments of candidate motion were classified in isolation utilizing HMMs.
Investigations performed to assess the motion spotting framework demonstrated that the
technique did great in terms of spotting motions in two distinctive event situations. The results
demonstrated an average recall of 0.93 as well as an absolute precision of 0.74 in the first
experiment. In the second scenario, a total recall of 0.79 and a total precision of 0.73 were
achieved. Another way to segment signs/symbols from nonstop streaming of information without
movement modeling epenthesis is the utilization of grammar-base data. Yang et al. (2007) and
Yang et al. (2009) presented ASL translation system-based trigram grammar model as well as an
improved level building algorithm. The authors' approach is based on automated method to spot
symbols without express movement epenthesis model. 83% rate of recognition was achieved
using 39 symbols/signs effective in 150 unique sentences. Research by the authors depends on
two-advance approach to perceive nonstop signs where the underlying advance recognized the
expected signs in the sentence and the ensuing stage applied punctuation model to the possible
signs. The authors uncovered only the results gained after the second step which applied trigram
punctuation structure to the signs. The reliance of the structure to the punctuation model was
portrayed in the preliminaries where the recognition rate of the system diminished from 83% to
68% when trigram structure was superseded by bigram system. Likewise, Holden et al. (2005)
implemented translation framework for Australian gesture based communication where each sign
is displayed using HMM structure. The translation system utilized language structure rules to
distinguish constant sentences, in view of 21 particular signs. Investigations indicated that their
system recorded 97% recognition rate on 163 test sign expressions, from 14 distinctive
sentences. The investigation acknowledge that the vocabulary sign utilized in tests comprised of
signs that were essentially recognizable from only motion. Yang et al. (2008) recommended an
exceptionally encouraging strategy, without the requirement for formal guidance in grammar or
epenthesis. In a CRF model, they establish threshold models that conducted threshold adapted to
differentiate between the symbols in the non-sign sequence as well as vocabulary. Studies
Page 38
23
indicated that their framework could recognize symbols from constant information with 87.0%
rate of recognition from a 48 sign vocabulary in which the framework was trained on 10 different
instances of every one of the 48 symbols. The framework was then tried on persistent sentences
containing in the sign jargon 480 examples of the signs.
b. Isolated gesture recognition
Yang et al. (2002) utilized a time delay NN to derive motion trajectories from American Sign
Language (ASL) images and graded signals. Experiments based on a 40-sign vocabulary showed
the average unseen test trajectory recognition rate was 93.4%. Fang et al., 2003) tackled the
question of the recognition of huge vocabulary signs by recommending the integration of self-
organizing feature maps, a hierarchical decision tree and HMMs for the recognition of isolated
signs, with low computational costs. Experiments were performed on a data collection of 5113
separate indications with 61365 isolated symbols. Results showed a 91.6% average recognition
rate. Juang and Ku (2005) suggested Recurrent Fuzzy Network for the processing of fuzzy
temporal sequences. The authors applied their approach to the task of recognition of gesture and
tests presented a 92 percent rate of recognition. In line with the combination of Maximum A
Posteriori Estimation and Maximum Likelihood Linear Regression, Ulrich et al. (2006)
suggested an independent sign recognition method. Their method for considering the details of
Sign Languages including One Handed Signs was developed. The authors have introduced some
chosen speech recognition adaptation methodologies to enhance efficiency of their program
while carrying out independent identification of users. Recognizing 153 isolated signs, a
recognition rate of 78.6% was recorded. Shanableh et al. (2007) suggested isolated temporal
gesture method for Arabic sign language translation. The authors suggested temporal
characteristics that were derived by backward, forward and bidirectional forecasts. These
prediction errors were thresholded and averaged into one picture which portrayed motion
sequence. Tests dependent on dataset of detached signs demonstrated that while characterizing
23 diverse sign gatherings, their framework accomplished a classification productivity extending
from 97% to 100%.
Wang et al. (2007) proposed a technique for the identification of invariant sign perspectives. The
recognition task was transformed into a verification task in their proposed method, in light of the
Page 39
24
mathematical limitation that the basic matrix related with two perspectives ought to be
indistinguishable when the indications of perception and model are gotten simultaneously under
virtual sound system vision and the other way around. Examinations performed on a 100-sign
vocabulary where five secluded examples of each sign were enlisted, indicated accuracy of 92%.
Cooper and Bowden (2007) used 1st order Markov Chains to introduce an independent sign
recognition method. The signs are split into visems (phonemes in speech) in their model, also
group of Markov Chains are utilized to identify visems as they are formed. Investigations
reported thea recognition precision of 72.6% base on five known samples of every 164 symbols
of the vocabulary. Kim et al. (2008) measured a 7-word-level sign recognition device based on
the accelerometer and EMG, and the performances depicted a total accuracy of 99.80 percent
when validated on 560 isolated symbols. Gunes and Piccardi (2008) implement an effect
detection system utilizing hand gestures as well as facial indications. Using an HMM-based
system, temporary segments of hand movements and facial expressions were identified.
Experiments showed that when tested on isolated images, their proposed method obtained 88.5%
accuracy. Ding and Martinez (2009) made a model for the acknowledgment of gesture based
communication that incorporated shape of hand, 3D location and motion into a solitary system.
The signs are identified utilizing a classifier of tree-base where for instance, in the event that two
signs had a comparative state of the hand, at that point the tree's root would assume the hand
shape and the branches would depict the various motion of the hand. For a vocabulary of 38
signs, a rate of recognition of 93.9% was accomplished. While these works offer promising
methods for recognition of gesture, the investigations depend on tests of detached motions. There
are nonstop characteristic developments which happen in communication via gestures.
Recognition of communication through signing along these lines includes recognizing the
motion from nonstop recordings (for example distinguishing the start and finishing points of a
specific example of signal).
2.3.3 Non-manual signals
Recognizing the communication of Sign Language involves simultaneous monitoring of non-
manual and manual signals and their precise integration and synchronization of signals. Thus
learning Sign Language includes work on the monitoring of identification of facial expressions,
Page 40
25
and study of body movement and identification of gestures. Recently a considerable amount of
research has been carried out studying the non-manual signals role in communication via gesture
and trying to determine their distinct relevance. Research like Van et al . ( 2006) concentrated on
the function of head position as well as head movements in Sign Language, finding the clear
connection to questions or statements between head tilts and forward motions. There has also
been growing interest in studying facial expressions for sign language interpretation (Grossman
and Kegl, 2006), and (Grossman and Kegl, 2007). Computer-based methods suggested for
modeling facial expression using Adaptive Appearance Models (AAM) (Von et al., 2008) and
(Von et al., 2008).
Grossman et al. performed a fascinating analysis on ASL, where movement of eyebrow and eye
aperture movement degree were shown to have a direct relation to emotions and questions
(Grossman and Kegl, 2006). They showed the rage, wh-questions (where, who, why, what, how)
and quizz questions showed squinted eyes and lowered brows, while yes/no and surprise
questions depicted raised brows and widened eyes. Developing a device that incorporates manual
and non-hand signals is a non-trivial problem (Ong and Ranganath, 2005). And this is proven
through small amount of effort involved in understanding multimodal communication networks
in communication via gesture. Ma et al. ( 2000) utilized HMMs to train knowledge about
multimodal Sign Language although the one non-manual signal utilized is movement of lips.
Their analysis is dependent on the premise that the knowledge conveyed by motion of the lip
correlated with hand signals. In as much as this is a rational mouthing concept, it can not be
applied to other signals that are non-manual since they also span several manual symbols and
ought be tried separately.
2.3.4 Important issues to recognition of spatiotemporal gesture
The complexity in interpreting spatiotemporal gestures is that the hand must move from the end
point of the preceding gesture to the beginning point of the next. These process intergesture
phases are called epenthesis of movement (Choudhury et al., 2017), and are not a part of any of
the symptoms. Thus the problem with the creation of continuous recognition systems is
designing algorithms that can distinguish between segments of true signs and epenthesis of
movement. As stated, much of the previous work involved clear modeling of each epenthesis, or
Page 41
26
unique grammar rules needed. Although these researches had great results in recognition of
gesture and detection of movement epenthesis, because extra HMMs number needed to
recognize epenthesis motion, training of specific epenthesis model included extra data collection,
labeling of data manually, training of model, as well as computation of recognition.
Another technique used is to use grammar rules to decrease the number of potential combination
of signs that appear in the signed sentences. And when sign vocabularies expand to represent
significant part of the signs utilized in Sign Language communication, grammar rules may
become a more critical feature of Sign Language recognition.
State of the art work on recognition of sign is now at a point where primary emphasis is on
model sign algorithms. The sign recognition models that enforce grammar rules on the
vocabulary of restricted signs are difficult to determine. One instance in a corpus of 30 signs
containing 8 nouns is when grammar rules have been used to determine the next symbol is likely
to emerge from the noun category, and then the number of possible symbols where the
recognition model will be chosen is diminished to 8. Given the fact the ultimate objective of
recognizing large cluster symbols, research should be conducted to test recognition models in
their ability to differentiate one sign as much as possible from other signs. It is unclear how these
models would perform if the grammar models were created from a larger real-world corpus, in
the works discussed in Section 2.3 which employ specific grammar rules.
In order to promote continuous identification, other studies concentrate on explicit segmentation
of the gestures. Particular gesture signals, such as changes in velocity of the hand, are utilized in
determining the starting as well as ending spots of the gesture. And while it has been shown that
these explicit segmentation methods function greatly recognition problems, developing specific
rules of segmentation for sign language recognition tasks is impractical because of the variation
in speed and gesture structure that exists in natural communication via gesture.
Without applying segmentation or grammar rules or specifically epenthesis modeling, few
researchers discussed the issue of epenthesis in motion. We propose a solution to this through the
development of spatiotemporal gesture system that solves the epenthesis detection task of
movement. We develop a training and recognition framework based on the HMM threshold
model for the classification of spatiotemporal gestures and the identification of epenthesis of
movement without explicit training on examples of epenthesis of movement.
Page 42
27
Regardless of any grammatical laws, our proposed models can effectively distinguish
movements from within sign sentences. Moreover, while non-manual signals are an important
feature of sign language recognition, only few studies have taken these non-manual signals into
consideration when designing hand gesture recognition systems. Also, we demonstrate that by
developing robust head movement and facial expression recognition models our paradigm of
spatiotemporal recognition is applicable to communication modes other than manual signs.
2.4 Review of Sign Language Translation Systems
Different methods to sign language understanding have been proposed. Sensor-base methods
with NNs as well as Bayesian networks are investigated in the early 2000s (Koch et al., 2002),
(Fels and Geo, 2002) and (Singh et al., 2006). To predict sign language, low-cost wearable
devices including wearable sensor gloves are used to obtain relative motion of fingers and hands
(Singh et al., 2006). The utilization of restricted colored gloves and grammars during training
and testing created low error rates (Starner, 1995). Using sensor instruments, isolated sign
language translation is implemented with a multimodal system (Kumar et al., 2017). For
classification purposes, the sensors are used to capture finger, palm locations, and then
Bidirectional Deep Short-Term Memory Neural Network (BLSTM-NN) and HMM. Extensive
Sign Language knowledge can contribute to acute awareness of the difficulty of classifying
gestures. Bheda et al . ( 2017) tackled the issue of classifying movements using DCNN for this
reason. The color and depth of the photos was used for reconnaissance purposes in other studies.
Here, Ameen et al. graded ASL using CNN having depth and color of the images and obtained
80 percent recall and 82 percent accuracy in their experiments (Ameen and Vadera, 2017).
Another widely explored classifier for gesture and posture is the linear classifier. The structure is
relatively simple as compared to Bayesian networks, and the frequently produce high accuracies
(Singha and Das, 2013). The paper Ibrahim et al. (2018) presents a sign language recognition
framework base segmentation, tracking, feature extraction and classification of gestures of the
hand. Euclidian distance is applied for the classification of features. In Yang et al. (2016), the
“likelihood of hidden Markov model” is presented for sign language translation. In addition to
HMM, the paper Kumar et al. (2018) used an independent Bayesian classification combination
for improving recognition accuracy. In Nguyen and Ranganath (2012), facial expressions are
Page 43
28
recognized and used in sign language communication. The probabilistic principal component
analysis model is combined with the schemes of recursive tracker for feature extraction. The
recognition of tracked results is performed using HMM and SVM. The paper uses texture
attributes and skin color with NNs to separate the hand from the background (Dahmani and
Larabi, 2014). KNN and SVM classifiers are applied for recognition purposes. The construction
of a mobile application using a speech-based system to translate text from Indian Sign Language
is described in (Amrutha et al., 2016). Here, the authors implemented the model using a pre-built
domain of locally stored images on a system then further triggered it at the time of execution.
The classical method used to recognize sign language is essentially focused on extraction and
classification of features. In the study, the two modules are integrated for the design of the Sign
Language recognition model in a convolutionary neural network (CNN). The method presented
simplifies the way the sign language recognition system is applied. CNN is also widely used to
solve multiple problems. These include the recognition of human behavior Uddin and Kim
(2017), the detection of vehicles in aerial photographs Shen et al . ( 2019), the detection of
smoke as a moving object Dung et al . ( 2018), the detection of Naseer and Saleem intrusion into
the network (2018), and the identification of tomato nutritional disorders (Zhang et al., 2019).
The proposed system (Sign Language Translator) comprise of three fundamental modules in this
work: detection of object, extraction of features as well as sign classification. The combination of
these three efficient models; SSD, Invention 3 and SVM is proposed for solving these problems.
These algorithms are applied to detect objects, to extract characteristics and to identify signals.
Robustness, precision, high speed were requirements proposed for device. There are designed set
of techniques for object detection. The more used techniques are Viola-Jones algorithm Benjdira
et al. (2019), histograms of oriented gradients (HOG) Tomasi (2012), recognition using regions
Gu et al. (2009), R-CNN Bao et al. (2015) and Chen et al. (1993), You Only Look Once (YOLO)
Redmon et al. (2016) and Redmon and Farhadi (2018), and SSD Liu et al. (2016) techniques.
Viola-Jones algorithm Benjdira (2019) is based on Haar feature selection used for different parts
of images. The algorithm use Adaboost training and cascade clustering architecture. The
algorithm has good feature selection properties. One of the disadvantages of the algorithm is that
it is sensitive to lighting conditions and possibly detects different degree of the exact object due
to subwindows overlapping. The algorithm is not effective in detecting titled or turned images.
Page 44
29
Next algorithm, HOG Tomasi (2012) significantly outperformed Viola-Jones algorithm in this
task. The algorithm uses handcoded features. For every pixel, the surrounding pixels are selected
and the direction (arrow) showing change of colour of darker region is determined. For each
pixel this process which is called gradient is repeated. The whole image is replaced with the
arrows (directions) which are characterized by histogram of gradient (HOG). Even after having
successful in several instances, it still employed hand-coded features that struggled in a more
generic environment with lots of background noise and obstacles.
The sign language is known to be the most formal of movements in all groups. Sign languages
begin as spoken languages, which develop naturally with hearing deficiency in cultures. Sign
languages grow wherever there's a population of hearing impairments. The sign language
develops irrespective of the language spoken in the field. Each sign language has its own
grammar and rules, with the common property both are visually interpreted.
There are several various sign languages in the world, as spoken language. For example, a signer
of an Irish Sign Language could not understand a signer of the ASL except they had learned the
language specifically. Although Sign Language is conveyed mainly through hand gestures
(manual signing), it also includes non-manual signals transmitted through facial expressions,
head movements, body postures and torso movements. The field of research on sign language
recognition is a multidisciplinary research area that includes the processing of natural language,
pattern recognition, computer vision, machine learning and linguistics, due to the difficulty and
multimodal nature of the Sign Language.
Signing via gesture has its own grammar and syntax. One misconception of communication via
gestures is; they are structured in line with the vocally generated languages of such nation,
additionally, the symbols are manually generated like the English words. The sign language has
its own phonology, grammar, morphology as well as syntax which are autonomous of verbal
languages. At a same time, the phenotypic structure of hand gestures is such that the different
morphemes of a word are superimposed on each other simultaneously rather than being strung
together, as is usually the case with those of the spoken languages. This is one of the big
differences between the signed languages and those spoken. For example, manual signals are
transmitted sequentially, where each sign comes in one at a time. However, in addition to being
sequentially transmitted, each manual sign occurs in combination with manual signs executed by
Page 45
30
the other hand, as well as actions like head and body gestures or facial expressions. The
linguistic features of sign languages therefore differ greatly from those of the spoken languages.
Research has shown that this morphological structure is not unique to any sign language and thus
shows that in their morphological structures there are significant cross-linguistic similarities
between different sign languages (Aronoff et al. 2005).
Many psycholinguistic studies have been performed on human movements, and in particular on
sign language. The Stokoe study (2005) is one of the most important studies in sign language
psycholinguistics. Stokoe identified three aspects in this work which are combined at the same
time in the creation of a particular manual sign: what acts, where it acts, and the act. These
aspects translate into building blocks that linguists describe as: a hand shape , position,
orientation and movement. These four manual sign components are sometimes considered as two
distinct sources of information in sign language recognition. The first channel is the channel for
hand positioning, which relates to the finger position and hand orientation. Spatiotemporal
channel is the second channel which refers to the direction of motion and where the hands
articulate in space.
For finger spelling, hand positions on their own may be used where various hand postures are
used to represent the letters and numbers in writing and numeral systems. Finger spelling can be
used to communicate words from a spoken language that do not have a corresponding sign, or to
demonstrate, describe, or teach or practice a sign language.
Communication via gesture is a dynamic language and a large amount of knowledge is
transmitted by the majority of signs through the combination of hand position and hand motion.
Only when all the information from the manual networks is available can we discern a large
number of signals.
Figure 2.17 shows an example where the signs 'play' and 'school' share the same postures of the
hand but have different movements. Likewise, the 'paper' and 'big' signs share the same
movement and can be distinguished only by hand posture. In Figure 2.18, only their hand form
could discern the signs „water', 'eat', 'sweets' and „warm'. Recognition of sign language
communication therefore involves simultaneous study of spatiotemporal movements and of the
networks of hand posture.
Page 46
31
Figure 2.17: Samples of signs with similar hand pose. Hand posture (a) and (b) defers from (c) and (d);
motion utilized to distinguish signs (Stokoe, 2005)
When spatiotemporal movements are carried out in a continuous sentence in sign language, the
hands must switch from the end position of one sign to the start position of the other. Such inter-
gesture transition interval is known as epenthesis of movement Liddell and Johnson (1989). And
is not part of any of the gestures. Therefore, study of the spatiotemporal gesture channel must
differentiate between the segments of appropriate sign and the epenthesis of motion.
Figure 2.18: Samples of signs including articulation of similar location. Hand poses utilized to
distinguish Signs (Liddell and Johnson, 1989)
Page 47
32
CHAPTER 3
DEEP LEARNING BASE CONVOLUTIONAL NEURAL NETWORK
3.1 Evolving of Deep Learning Structures
It is in record that Artificial Intelligence (AI) is one of the most computer science's popular
research subjects, and has series of experimental applications. We asked machines yesterday to
execute routine work. We are asking them today to understand videos, speech and images, or
even to help doctors perform diagnosis.
The big question in AI is: how to make a computer learn on its own. The typical way to do this,
as we saw in the previous segment, is to find an expert on the topic you want the machine to
know about. You can write a rules-based program with its problem-specific prior knowledge
which makes the machine helpful. What makes deep learning very fascinating is that in order to
learn a potential solution, experts do not need to have a deep interpretation on a particular
question. One thing to keep in mind is that we still need label data and human intuitions to find
an effective, objective function so far. Warren McCulloch and Walter Pitts had developed a
neural networking model as early as 1943. They recreated neurons based on threshold switches
and showed that any logic or arithmetic function can be determined even by simple networks of
this nature (McCulloch and Pitts, 1943). Frank Rosenblatt created the concept of an artificial
neuron named Perceptron Rosenblatt (1958) in the 1950s, following their statements and inspired
by the successfully working brain systems and its wonderful learning capacity.
3.1.1 Similarities between biological neurons
There's still a lot of unknown in biological neurons about how the brain trains itself. A neuron
collects electrical signals from many others within the human brain through fine structures called
dendrites. The nucleus gets the number of inputs. If a sufficiently high signal is received it will
give a spike in electrical activity. The latter is dispatched through the axon. At long last,
structures known as synapse transfer this conduct to the following associated neurons. The
learning takes place via modification of the effectiveness of the synapses, with the goal that
modification of one neuron affects the other. Figure 3.1 shows a simplified image of a biological
neuron.
Page 48
33
Perceptron is a mathematical model depicted in Figure 3.1 for a biological neuron. It takes a set
X of Boolean values as its input.
Figure 3.1: (a) Biological neuron representation. (b) Artificial neuron representation (Rosenblatt, 1958)
Weighted sum of inputs ∑ is used to model nucleus. And hyperbolic tangent is used to represent
synaptic potential thus,
∑ (3.1)
Furthermore, in order to binarize the output Y, the system utilizes heaviside step function thus,
{
(3.2)
Page 49
34
Recently, deep learning technologies have become popular, trusted, essential and powerful. Most
notable advancement is that nowadays we can provide the necessary tools for algorithms to
succeed: massive data sets with great hardware
.
a. Datasets size
During the last few years the scale of CV datasets has increased dramatically. This is possible via
societal acceptance of digitization of data. As human transactions increases on the internet, most
of human information and activities including photos and videos are recorded. Algorithm of deep
learning could exploit huge amounts of data and even surpass human efficiency. Recently, huge
data set Abu-El-Haija et al. (2016), consisting of 8,000,000 youtube-labeled videos in
accordance with 4700 visual entities vocabulary, has been made publicly accessible by the
organization. In addition, the ImageNet project Deng at al. (2009) constructed huge visual
dataset designed to be used for recognition of visual objects, containing over ten million labeled
images.
b. Models size
Deep neural network architectures are higher-depth, NNs. We do not have any widely accepted
depth threshold which divides depth learning from shallow learning. A lot of field surveyors
believe that there is more than one nonlinear layer in deep learning, and that it‟s known that more
than 10 have very deep learning. Schmidhuber (2015) proved that, initially, hardware
technologies had limited the number of neurons in artificial neural networks. Until quite recently,
the neural networks were fairly small.
Today, neurons number is largely a choice of design. A number of neural ANs Coates et al.
(2013) consists many connections per neuron as a cat ( 1013
). Explosion of model sizes for the
NN is as a result faster computers with huge memory. Huge network can gain greater precision
in complicated problems. NVIDIA DiGiTS DevBox is the latest hardware developed by
NVIDIA in 2017 and dedicated to learning the deep neural networks. The DevBox NVIDIA
DiGiTS comprises four strong graphic processing units for deep learning structures.
Page 50
35
3.1.2 Multilayer perceptron
A simple example of deep learning model is the multilayer perceptron (MLP) or neural
feedforward network. An MLP aims in determining arithmetic function f which links outputs to
some values of input. As described in section 4.1, f is the function in the CV recognition process
which maps input set x to a class variable y. Also, it attempts to learn parameters q of function f
(x, Ɵ) resulting in the best approximation function f : x → ŷ set of a particular problem of
classifications. Network is so-called since it contain series of numerous simpler vector-to-vector
functions known as layers that makes writing of function ŷ = f (x, Ɵ) in the form ŷ =
f4(f3(f2(f1(x, Ɵ1), Ɵ2), Ɵ3), Ɵ4) to be possible. The function f in this case is made up of four
distinctive layers shown in Figure 3.2. One can see each layer to be an arithmetic function that
provides new input representations. Such layers are intended for generalization of statistics.
Layers number determines model's depth. First layer is called input layer, second is known as
output layer while middle layers are known as the hidden layers because the data don't give their
values. Such network is known as feedforward since data progresses from input x to output y. For
recurrent network layer, there exist feedback connections in a layer. Section 3.6 illustrates these
networks.
Figure 3.2: 4 depth multilayer perceptrons (Coates et al., 2013)
Page 51
36
A layer of an MLP is made up of many units that act in parallel, called artificial neurons (ANs).
Defines its width by the AN number in a layer. Artificial network is the perceptron evolution
mentioned earlier and is a function of scalar-to-vector. The units are known as neurons since they
acknowledge inputs from numerous different past units and ascertain their value for initiation.
Artificial neuron yields weighted total of its activation function and input data follows:
∑ (3.3)
Where Z represents scalar output, W represents neuron weight, X is the input vector and the
operation ∑ determines linear input mapping. To add non-linearity to the transformation an
activation function is used here. There are many activation functions but the tangent-hyperbolic,
sigmoid, and rectified linear unit are the 3 well known in the state-of-the-art shown Figure 3.3.
One can define learning algorithms with fairly simple ingredients: a collection of cost, data,
optimization process, function and the system.
Figure 3.3: Sigmoid, tangent-hyperbolic and rectified linear unit activation functions (Coates et al.,
2013)
Page 52
37
3.1.3 Feedforward neural network training
Role of NN f is to use a collection of labeled data to reduce the differences between its output
and the y label of a given input x, such a cost function is often known as loss function and an
optimization process. We train the model in order to accomplish this task by updating the
parameters Ɵ of f to be the best approximation function ŷ = f (x, Ɵ). Backpropagation algorithm
is the common optimization process of training the model. Its name derives from the backward
error propagation process (Rumelhart et al., 1985). The algorithm functions in two steps:
a. Propagation
When At the point when input vector is introduced to the system it is proliferated forward, layers
by layers, via the model till it arrives at output layer. Network output will be contrasted with
target label, utilizing cost function, and error rate calculated. The error will be proliferated
backward, beginning from the output, till every neuron has a corresponding error rate which is its
commitment to the error.
b. Weight update
Backpropagation utilizes such error rate in order to estimate gradient of cost function. Such
gradients are supplied to optimization framework that utilizes it to modify weight so as to
decrease the cost function. Step of backpropagation is iterated till entire data is transformed
numerous intervals by the model. Complete shift over the whole data is known as epochs. By so
doing, the network would have been once presented to each instance in the training data before
the operation of the first epoch end. In the event that the NN performance for a particular
problem is profoundly subject to its structure, cautious selection of a few meta-parameters
training is assumed. In Algorithm 1, a typical iterative circle is designed to train an NN.
Algorithm 1: An iterative loop to train a NN
Inputs:
Training data: L = {(di, y
i)}i = 1...N such that d
i represent inputs while y
i represent the
output labels.
NN model: MƟ;
Page 53
38
Output:
Trained model: MƟ.
Parameters:
Epoch number=E
Learning rate=λ
Amount of data in batches=B
Cost function=C
Algorithm of stochastic gradient descent enhances gradient descent as well as reduces loss
function at training phase of the network as shown in algorithm 1; rows 9 and 10, this is called
stochastic since randomness is involved. Learning rate l is utilized to assign the current update a
weight. We also decrease learning rate while increasing the number of epochs to gradually reach
local minima. Parameter B determines training samples number at each iteration, which will be
propagated across the network. Utilization of batches in SGD enables gradient variance changes
(average gradient application in batch) to be minimized and the optimization of the model
accelerated.
The book deep learning, Goodfellow et al. (2016) is referenced in depth knowledge of deep
learning. It is composed by Aaron Courville, Ian Goodfellow as well as Yoshua Bengio,
uninhibitedly open at http:/www.deeplearningbook.org, for further information about current
Page 54
39
layers, techniques of optimization, implementations on deep and machine learning innovation by
and large. In summary, a model of deep learning is a sequence of less difficult function known as
layer. There are several distinct layers to deal with specific dataset, for example, vectors, images
and various difficulties like dealing with sequences and so on. The deep NNs are modeled by:
nature of data, output character, problem nature, and hardware context. Layers Likewise, layers
could be adjusted by their activation function and width. Such parameters are, amongst
numerous others, called hyper parameters or meta parameters, because they could not be directly
learned from the dataset.
3.2 Deep Learning Elements
Here, we include comprehensive examples of basic elements for a method of deep learning
recognition. For hand gesture recognition we present several important elements of deep
learning:
As we research classification problem, we implement softmax activation function that is
required to output the class-conditional vector of probability, which is important to represent
class variables, as well as the cost function of cross-entropy.
Computer vision usually uses images as input. Here, we demonstrate convolution layer that is
layer specialized in grid-shaped input processing.
Due to the time consuming in 3D data sets, hard to collect and use of deep learning
algorithms with limited size datasets leads to a poor generalization during the training
process known as overfitting. One means to solve such task is by using transfer learning
approach to extract features from another similar larger dataset.
3.2.1 Softmax function
The performance of a classification function (as opposed to quantitative variable) is a categorical
variable. A class variable has, by definition, fixed number of discrete values. An instance is
found in image-based platform, for animal recognition classes may include bird, fish, dog and
cat. Every instance is allocated to a finite class in the dataset. This is different from the
quantitative variable because, regardless of the number of categories, the distances from one
category to another are equal. We might utilize one single scalar to be the output but it would not
Page 55
40
be equal to the distances between each classes. The deep learning frameworks constructed for
categorization utilize single-hot encoding to depict their output in order to solve issue. It
comprises of feature in which its size is equivalent to the class number, filling the class cell in
which the input belong with 0 and a 1. We may also see this encoding scheme as a common
stochastic vector representing the probabilities that one input belong to each group, known as
vector of class conditional probability. A model requires two elements for output of a stochastic
vector. Firstly, the last layer of the model must have the maximum number of classes. Secondly,
the last layer uses the softmax activation function to compute a class conditional probability
matrix. Softmax function output represent class distribution of probability that indicate the
probability which an input belong to any one of the groups.
In the classification problem, let K denote classes and Z represent the weighted sum of the last
layer input as shown in Section 3.2.1. We define the softmax function thus,
∑
(3.4)
Here, j = 1 . . . K while the last layer output is z. The second aim of this method is to show the
biggest input and to remove every substantially smaller ones, using the exponential terms.
3.2.2 Cost function of cross entropy
The choice of cost function is a primary part of profound NN training. For neural networks, the
cost functions are more or less the same as with any trainable classifier. For cost function; cross-
entropy between model prediction and ground-truth was utilized.
Let L = {(βi, y
i)}i=1...N represent labeled data set. Also, let probability output of the class-
conditional of the DNN be ŷi = f (β
i, δ). Therefore, cross-entropy is calculated thus,
∑ [ ( ) ] (3.5)
Page 56
41
Where L(W) is the lowest, while approximation function quality f is the best. Figure 3.4 depicts
cross-entropy error values in accordance with y and values.
Figure 3.4: Cross-entropy cost function L(W) values (https:
//github.com/matplotlib/matplotlib/issues/6027 Retrieved 20 April, 2020)
3.3 CNNs Based Deep Learning
The performance of conventional machine learning algorithms, such as SVM Hearst at el.
(1998), random forest Breiman (2001) or HMM Rabiner and Juang (1986), depends heavily on
the representation of the selected data. Nevertheless, feature from handcraft usually suffers
information loss. Recently, algorithms of deep learning have yielded especially great
performances on several CV challenges but often experience some shortcomings. Such algorithm
requires huge data in order to function well, and this is a major challenge in a certain field in
which dataset are not freely generated. Also, network training and parameterization of deep NNs
require much of computational data and time for experiment. Are algorithms from handcraft
getting outdated? There is still a wide range of applications needing features from handcraft. Let
us look at two realistic examples to know where and when we can utilize one or another:
CNNs are a specific kind of NN that has a grid-like topology for processing data. This comprises
vector time-series, which when concatenated are grid-like data as well as 2D pixel grid images.
LeCun et al. (1999) in 1999 presented the first 7-level convolutional neural network known as
Page 57
42
the LeNet-5 for the classification of 32 x 32-digit images taken from checks in the bank. Given
that hand posture as input is usually 2-dimentional image, we implement CNN design
motivations:
a. Motivations
Every output interacts with each input in typical layers of NN including multilayer perceptron, as
described in section 3.2, where a NN model's number of parameters is proportional to input size.
Moreover, given that there are m input and n output, multiplication of the matrix implies
parameters of m x n, where such algorithm has runtime of O(m x n). The input may have
thousands or millions of values when processing an image and a traditional multilayer perceptron
would see the number of parameters burst and runtime. Such network architecture also takes no
account of the image's spatial structure. This doesn‟t enable the network benefit from strong
image spatial correlations that are essential elements in problem of recognition, by treating
images as a vector of pixels.
b. Version inspired by biological knowledge
The CNN's architecture was influenced by Neuroscience. The history of the CNN starts with
experiments involving neuroscience, before it produces the pioneer model. For many years, there
has been collaboration between neurophysiologists Torsten Wiesel and David Hubel in order to
find most fundamental details on functioning of the vision system of mammalian (Hubel and
Wiesel, 1968). The authors studied how cat brain neurons reacted to data that were displayed on
a computer at specific locations. They identified two essential types of visual cells. The common
cells within the older visual framework react to basic light patterns for instance directed bars, but
hardly react to patterns that are complex. Additionally, larger receptive fields and complexer
cells are invariant to little motions in feature locations.
c. Design
One of the pioneering structures of CNN is made of stacked of different layers to mimic the
visual cortex. Figure 3.5 provides this pioneering structure. Firstly, there's convolutional layer
Page 58
43
that's at the heart of a CNN. The parameters of the layer comprise of collection of learnable
filters that have a small size but are sliding over entire images. Filter is converted across Grid-
like input; height and width. This follows activation function that provides map of response in
two dimensions, one for each of the filters. For this reason, model learns filter which activate
when certain different features are identified at certain spatial regions of the data. One easy step
toward convolution is shown in Figure 3.6.
Figure 3.5: LeNet-5 architecture (Lecun et al., 1989)
From Figure 3.5,
C1 layer C1 represent a convolution layer with 28 x 28 filters 6 response maps.
S2 layer represent a subsampling layer with 14 x 14 filters 6 response maps.
C3 layer represent a convolution layer with 10 x 10 filters 16 response maps.
S4 layer represent a subsampling layer with 5 x 5 filters 16 response maps.
C5 layer represent a size 120 multilayer perceptron known as fully connected layer.
F6 layer represent a size 84 fully connected layer.
The convolution layer is denoted by C: Rhxwxc
→ Rhxwxn
function here, h, w and c represent
height(H), width(W) and input grid channels respectively, and n represent filters number learned
by the layer. Convolutional layers are constructed to mimic the characteristics of the above
mentioned cells that attempts to learn basic as well as input grid local features.
Page 59
44
Figure 3.6: Operation involving two-dimensional convolution (Lecun et al., 1989)
A subsample layer executed by non-linear process known as pooling is followed by the
convolutional layer. Where we have non-linear function for the execution of pooling, the most
common is max pooling. Input image is partitioned to several non-overlapping regions as well as
maximum outputs. Figure 3.7 provides structure of max pooling sheet. The intuition is that the
exact position of features in relation to other features is less important than their locations. The
pooling layer helps to slowly reduce representation size, number of parameters and computation
amount as the information flows through the network. This also provides for a kind of invariance
to translate. The complex cells inspires pooling layer since enables the system to be invariant to
little motions in location of element. The pooling layer is expressed as function P: Rhxwxc
→
Rh/p1xw/p2xc/p3
here, h, w and c represent height, width as well as input grid channels respectively,
while p1, p2, p3 are fixed pooling layers hyperparameters.
d. Summary
Basic methods of detecting the convolutional function accompanied by pooling are applied
several times as we step deeper into the network. This lets CNN learn from features that are
small to higher abstracts. The stacking of several layers result in non-linear local filters which are
becoming increasingly global. The idea is depicted in Figure 3.8.
Page 60
45
Figure 3.7: 2 x 2 max pooling layer (Lecun et al., 1989)
Figure 3.8: A stacked convolutional layers (LeCun and Ranzato, 2013)
In general, the output of stacked convolution layers is eventually flattened so that learned
features can be used as input of subsequent layers which require vector as input. This process is
referred to as architecture of the CNN that enables certain classification tasks to be carried out on
images. A significant benefit of this independence is from previous experience and human effort
in feature design. The network will learn filters which have been hand-engineered in
conventional algorithms. Furthermore, each filter is used over the whole image. In a given
convolutional layer, it implies that all neurons react to same input. The property known as
sharing of weight decreases number of parameters learned. Convolutional NN could measure one
dimensional temporal sequence, as well as images, depicted as stacked vectors. Concept of one
dimensional temporary sequence convolution is for parameters sharing over time. Output of
sequence convolution refers to sequence in which every output vector is a function of small
number of input vectors adjacent to it.
Page 61
46
3.3.1 Transfer learning and overfitting problem
The aim of a process of classification is presentation of classifiers that functions accurately on
unseen input that has not been seen before. The ability to manage stimuli that are not known is
referred to as generalization. Dataset is usually made up of two non-overlapping sets. First one,
known as the train set is made up of data from which network learns. The second, called test
collection is composed during the training process of data not used by the algorithm. By an
optimization process, the classifier must reduce error measure between ground-truth and output.
Error measurement is known as the error recorded at training phase when processed on training
data, and when executed on test data is called test error or generalization. What characterizes
learning algorithm's viability is its capacity to reduce training error and discrepancy between
training and test error, called generalization gap. Deep learning model's capacity is its capacity to
suit specific task. There are principal hyper-parameters that characterize model's ability; its width
and depth. Low capacity network might not be able to match train data. High-capacity network
will overfit by learning unique training set properties that don't serve for generalization. High-
capacity model could treat difficult task but it requires huge data in order to skip overfitting
problems. To sum up, the job is harder, the model's depth and width must be higher, and thus the
volume of data requires an increase. Figure 3.9 indicates the relationship between a model's
capability and the measure of error. Regrettably, there is no hope of discovering right
architecture of network which completely generalize training data as there are infinite numerous
solutions.
Figure 3.9: Correlation between error measures and capacity of a model (Goodfellow et al., 2016)
Page 62
47
As shown in the figure above, we may increase the capacity to find a better generalization of the
training set at the left of the optimum range. That state is known as underfitting. The model is too
big to the right of the optimal range, or the training set is too small, and the algorithm begins to
learn the specification of the training data. It results from a declining training error, an
unfortunate increase in the test error and a greater gap in generalization. Such condition is
referred to as overfitting (Goodfellow et al., 2016).
The CV group has access to very broad data sets for image classification or object detection
problems, such as the Open Images dataset Krasin et al. (2017) which consists of 10,000,000
labeled images. The datasets are composed of only thousands of sequences in the field of hand
gesture recognition. If the only way to avoid overfitting would be to generate more data, it's time
consuming and not always feasible. Nevertheless, methods and techniques exist to avoid
overfitting of the model:
Utilize smaller structural design
Utilize weight decay. Weight decay is a term for regularization applied to the cost function,
which penalizes big weights. When the weight decay coefficient is large, the penalty for large
weights is also large, if small weights can grow freely
Using technique for dropout. Dropout randomly "drop out" nodes in the neural network by
setting them to zero, which forces the network to focus on other functionalities. It leads to
more general representation of the dataset
Using augmentation of data. We may artificially generate additional training data because
deep networks need a large amount of training data to achieve good efficiency. An instance
is, new images can be generated to train a CNN architecture via random rotations, motions
and so on
Utilization of early stopping. Halting of training before the system begins learning of training
data specifications
Transfer learning usage
In transfer learning, Pan and Yang (2009) in their survey on transfer learning, gives definitions
of a task and domain. Domain D comprises two elements: a marginal probability distribution
P(X) where X = {x1, x2, . . . , xn} ϵ X and a feature space X. In view of the domain D = {X, P(X)},
the task consists of two components: an objective predictive function f (denoted by T = { ƴ, f })
Page 63
48
and D = {X, P(X)}, which is not observed but learned from the training data consisting of pairs
{xi, yi}, where xi ϵ X and yi ϵ ƴ respectively. For instance, X is the image depth space in the field
of hand pose estimation, xi is hand depth images, ƴ is R3*k
where k is the number of joints in the
hand model, yi are 3D joint positions for each sample in the dataset and, finally, f is the mapping
regression function described as f : X → ƴ learnt from the training set. We describe a DS source
domain, and a DT destination domain. In particular, we refer to DS = {(x1s, y1s), . . . , (xns , yns)},
where xis ϵ XS is a data sample, and the corresponding label is yis ϵ ƴS. Likewise, DT = {(x1T, y1T), .
. . , (xnT, ynT )}. Notice that, for the most part, 0 ≤ nT « nS. Instead of a DS source domain and a TS
learning task, a DT target domain and a TT learning task, transfer learning is aimed at helping to
learn the fT target predictive feature in DT utilizing DS and TS information where DS ≠ DT and TS
≠ TT but identical.
It is a complex task to learn features of the images. In addition, CNN architecture includes a lot
of parameters and so is typically not trained with random initialization from scratch. It is because
a target dataset of sufficient size is fairly difficult to train a network with a depth that is broad
enough to manage the difficulty of the task. Rather, it is normal to train a CNN on another larger
source dataset and then use the so-called pre-trained weights for the task as either a fixed feature
extractor or an initialization. Two key factors in transfer learning are: the size and similarity of
the source dataset to the original dataset.
Page 64
49
CHAPTER 4
CNN BASED SIGN LANGUAGE TRANSLATION SYSTEM
4.1 Structure of the System
This proposed translation model includes three distinctive structures - SSD, Inception v3 and
SVM that are integrated to form the hybrid model that constructively translates sign gestures
(Figure 4.1). In this thesis, for designing such a translation system, the American Sign Language
(ASL) fingerspelling dataset is utilized. In this hybrid model, SSD is utilized for hand detection,
Inception v3 is applied for feature extraction and the last module, SVM, is utilized for
classification purposes.
Figure 4.1: Structure of the proposed system
Inception v3 which is based on CNNs is a basic module of the translation system which is used
to extract features for future classification purpose. CNNs are forms of architecture of deep
learning that has one or more convolution, pooling, and feedforward layers. They are a
multilayer perceptron (MLP) variation of biological motivation. Each neuron in an MLP has a
weight vector of its own, but CNN neurons share weight vectors, and weight sharing decreases
the number of trainable weights. Neurons compute convolutions on the input dataset using
weight-sharing technique with the convolution filters. The output properties obtained from the
convolution layers are fed to the ReLU layer. After applying f(x)=max(0,x) as the activation
function to the obtained feature map, the obtained signals are entered into the pooling layer. The
Page 65
50
image size is decreased after multiple layers of convolution and pooling, and more complex
feature extraction is carried out. Afterwards, the contents are transferred into 1D vector with
small feature maps supplied to the classification module. And this module works out the CNN
performance. Convolutional neural networks have convolution layers characterized by input map
I, biases b, and a filter bank Abiyev and Ma‟aitah (2018) amd Abiyev and Arslan (2020). Lets
assume that l = 1 represent the first layer and l = L represent the last layer, and x is the H x W-
dimensional input that has i and j as iterator. As iterators, the kernel ω with k1 x k2 dimension has
m by n. is the weight matrix that connects the neurons of the layer l with the neurons of the
layers l-1. The bias variable at layer l is . The transformed input vector plus bias is represented
on layer l as:
∑ ∑
(4.1)
Convolutional and pooling layers output is computed thus:
(∑ ∑
) (4.2)
Flatten operation which concatenate acquired feature is performed after pooling
utilizing
. The computed feature vector is modified into outputs of the
model utilizing fully connected network . Once the signals of output are
obtained, the training of CNN's weight coefficients (unknown parameters) will begin. Let's
denote some of CNN's unknown parameters Ɵ.
To evaluate the accurate values of parameters Ɵ, an effective loss function is constructed. This is
done by minimizing the loss function by using input-output training
pairs ( ) [ ] . Here, is the i-th input data and is the corresponding
destination data for the output. If we denote CNN's current performance as , then CNN's loss
is calculated thus,
Page 66
51
∑
(4.3)
Training of CNN parameters is carried out through loss function minimization. During training,
the parameter values are calculated. Updating of the network parameters is carried out using an
Adam optimizer (adaptive moment estimation) (Kingma and Ba, 2014). During parameter
learning, the Adam optimizer uses loss function gradients of first order. The approach is a
Stochastic Optimization which utilizes first and second moments of gradients for computing
individual adaptive learning rates for several parameters (Kingma and Ba 2014). Effective Deep
CNN training requires large quantities of training data.
Data incrementation is used to solve this problem. Also, this approach mitigates the relative data
shortage to equal the number of CNN parameters. Data augmentation being explored here
modifies the existing dataset into new set without modifying their shape. In augmentation of
data, geometric changes including zooming, rotating, shearing, mirroring and shifting are
utilized. In this study, we used Inception v3 as a CNN model for feature extraction. The
descriptions of Inception v3 is given in section 4.4.
4.2 Dataset Analysis
We used the 'Kaggle' ASL fingerspelling data for evaluation of the proposed hybrid method. This
database consists of 24 symbol / sign or letter groups. All the English letters except Z and J are in
info. This is because there are no static postures at Z and J. Training and test sets consist of
27,455 items, and 7,172 objects. The data is given as a pixel to pixel intensity [0-255], in its raw
class-wise distributed XLS file format. Each of the images is transformed to a 28x28 grayscale
image to achieve high efficiency.
As shown in the discussion file on the data , at least 50 + types of image transformation were
performed. One example is; three degrees rotation, + /-15% contrast / brightness/, 5% random
pixelation, and so on. As a result of these changes, researchers face various difficulties when
investigating this area, which in turn alters the images' resolutions. Fragments of the data being
examined are shown in Figure 4.2.
Page 67
52
Figure 4.2: Fragment of ASL fingerspelling dataset
From the dataset above, letter Q is translated by the proposed hybrid model (SLT) thus;
SLT captures letter Q equivalent sign
Convert the sign to letter Q
Letter Q is displayed on the screen to the privileged
Now the privileged can understand the deaf person‟s demands
The reverse is applied for the deaf person to understand the feedback of the privileged.
Snippet of this procedure is demonstrated in Figure 4.3 below:
Figure 4.3: Conversion of sign to text using SLT
Page 68
53
4.3 Single Shot Multibox Detector
In this thesis, the single shot multibox detector (SSD) (Liu et al., 2016) is used to detect the hand.
And after this, detected hand is used as the input for the classification system. SSD has been
utilized by Szegedy et al. (2015) for detection of object problems and very high performance was
achieved. In this work, SSD structure is based on structure of VGG-16, as demonstrated in
Figure 4.4. In the classification system, a set of convolutional layers is added for feature
extraction and fully connected layers are removed.
Figure 4.4: SSD network structure (Szegedy et al., 2015)
Along these lines, the CNN extract important vector maps on different scales and dynamically
lessens the input size to every one of the ensuing layers. Multi Box is checked for the pre-
determined, consistent dimensional-restricting privileges that firmly fit the dissemination of the
first ground truth boxes. Furthermore such priorities are chosen so that the rate of intersection
over Union is higher than 0.5.
As shown in Figure 4.5, 0.5 IoU is not sufficient although the limit box gives Regression
Algorithm a reasonable starting point. Because of this, multi boxes begin as estimators and
attempt to move closer to the bounding boxes ground reality.
Page 69
54
Figure 4.5: SSD structure generating box overlapping (Szegedy et al., 2015)
Conclusively, SSD multibox assumes the top K prediction that minimize the confidence and
location loss.
4.4 Inception V3
In this research work, we explore the Inception v3 CNN model for feature extraction. As seen in
the convolutional layers of the traditional CNN structure, this model handles both data pre-
processing and feature extraction. The inception deep convolutional structure was introduced as
GoogLeNet Szegedy et al. (2015) and referred to as Inception v1. After this, the Inception v1
structure was reconstructed considering several factors. At first, batch normalization by Ioffe and
Szegedy (2015) is introduced after which the architecture was renamed as Inception v2.
Furthermore, in the third iteration, additional factorization ideas by Szegedy et al. (2015) were
introduced and the new architecture is called Inception v3. Thus, while Inception v2 is made of
batch normalization, Inception v3 is made of factorization ideas. The Inception v3 structure
comprises building blocks such as asymmetric and symmetric, including convolutions, average
pooling, max pooling, concats, dropouts, and fully connected layers. However, in this study, we
replace the fully connected layers with an SVM classifier. The Inception v3 architecture
incorporates factorization of initial convolutions into smaller convolutions and the inclusion of
batch normalization to the fully connected layer correspondingly. Inception model structure is
predominantly a 299x299x3 input, which represents a field of 299 pixels and 3 channels
representing the standard RGB image, converged with a set of convolutional layers, a series of
Page 70
55
max-pooling operations, and sequential inception modules stacks (set of different convolution
filters and max-pool filter) performing concatenation of filters. Ultimately, softmax layer is the
output. Usually, a 2048-dimensional vector is the input of the top layer of Inception v3 model
where the softmax layer is trained. For instance, a softmax layer with X labels learns X + 2048*X
parameters in line with the learned biases and weights.
In Inception v3, the goal of factorizing convolutions is to minimize parameters/connections
number without limiting efficiency of the network (Li and Zhang, 2017). For example, Figure
4.6 depicts two 3×3 convolutions replacing one 5×5 convolution. As demonstrated in the figure,
in utilizing 1 layer of 5×5 filter, parameters number = 5×5=25, and by utilizing 2 layers of 3×3
filters, parameters number = 3×3+3×3=18. This implies that further factorization of the filter of
the same layer decreases parameters number leading to an increase in learning speed and system
efficiency. With the factorization technique, the parameters number is decreased in the entire
model, and consequently, the network can go deeper.
Figure 4.6: Two 3×3 convolutions replacing one 5×5 convolution (Li and Zhang, 2017)
In the case of asymmetric convolutions factorization, let's consider one 3×1 convolution and one
1×3 convolution replacing one 3×3 convolution, as depicted in Figure 4.7. By using a 3×3 filter,
the number of parameters will be equal to 3×3=9, and by utilizing 3×1 and 1×3 filters,
parameters number becomes 3×1+1×3=6. It can be questioned why two 2×2 filters are not used
to replace one 3×3 filter. If two 2×2 filters are used, parameters number becomes 2×2×2=8.
Comparing the rate of reduction of the parameters between two 2×2 filters and one 3×1 and 1×3
Page 71
56
filters, it is evident that the latter produces a lower parameters number as compared to the
parameters number produced by the former.
Figure 4.7: One 3×3 convolution replaced by one 3×1 convolution with one 1×3 convolution (Li and
Zhang, 2017)
4.5 Support Vector Machines
SVMs uses a learning technique which computes a hyperplane. This hyperplane produces the
best separation using the largest distance to the nearest inpute data point of any of the classes
(Abiyev et al., 2017). In many experiments, the support vector machine has proven to be
successful, especially when dealing with a high-dimensional feature space, as demonstrated in
(Vapnik, 2013). Using a hyperplane, SVM in its simplest structure can classify data into two
classes (binary classification). The support vector machine maximises the margin between the
closest samples to the hyperplane (the support vector) utilizing an optimization strategy. SVM
can also support nonlinear classification problems. In several ways, SVM can support multi-class
classification including the one-versus-one Hsu and Lin (2002), one-versus-all Rifkin and
Klautau (2004) and directed acyclic graph (DAG) Platt et al. (2000). A support vector machine
library (LIBSVM) was utilized in Chang and Lin (2011) to support the multi-class nature of the
domain. Practically, the support vector machine performs classification between two classes by
drawing a border between the two classes in a plane. The drawn border separates the two classes
from each other, as illustrated in Figure 4.8. To this end, two parallel and two near border lines
are drawn across the two classes and these boundaries are drawn closer to each other to produce
a corresponding boundary demarcation.
Page 72
57
Figure 4.8: SVM boundaries (Chang and Lin, 2011)
As depicted in the figure above, two classes appeared on a 2D plane. This is conceivable to
perceive these dimensions and planes as attributes. The SVM operation can be viewed from the
feature extraction perspective. Here, extraction of feature is carried out on every input entering
the model in a simple sense, bringing about an alternate point demonstrating every input of the
2D plane. Classification of inputs is simply the classification of these points with respect to
extracted properties. In this plane, if we let xi Є Rp, i=1,..., n be the training vectors in the two
categories, and y Є {1, -1}n be a vector then the following primal task is solved by the support
vector classifier as follows:
∑
(4.4)
The dual of the support vector classifier becomes:
(4.5)
Page 73
58
Here, all ones vector is represented as e, upper bound is denoted as C > 0, Q is an nxn positive
semi-definite matrix, ( ) represent the
kernel. During training, training vectors are explicitly spread into higher dimensional space via
function . After this, the decision function is computed thus:
∑ (4.6)
The support vector classifier parameters are usually accessed using the members: , kernel
and the independent term .
Page 74
59
CHAPTER 5
SIMULATION AND RESULTS OF SIGN LANGUAGE TRANSLATION SYSTEM
5.1 Overview
The proposed model, provided in Figure 4.1, is constructed using finger-spelling data from ASL,
where each hand image of the data is an American sign language symbol. This proposed system
convert the given sign in real time into one of the 24 signs in the ASL. In relating convolutional
learning methodology, SLT was built utilizing SSD+Inception v3+SVM classifier. The feedback
for proposed system comes from camera photos placed on the signer 's hat. Here hand images of
the signer are fed through the SSD module unto SLT. Then the image of the cropped hand is
forwarded to Inception v3, where extraction of vector maps is performd. Hand gesture features
extracted from the user are used in the input of the vector machine classifier for shape support.
This built in support vector machine classifier uses the hand gesture features extracted from the
user to evaluate the signer 's hand status. In our experiments, this decided state communication
through gesture, which is ASL.
5.2 Simulation and Result
Considering of research, inception module is defined with four parameters, namely depth(D),
height(H), width(W), classes number (signs). H and W represent input size. Depth represents
input images channels. Input size is 299x299x3, where the W is 299, H is 299 finally, D is 3
corresponding to RGB standard. As previously mentioned, we subjected this high dimensional
input space to factorization operations, which drastically reduced the high input space to a lower
dimension. After this, the factorized low space is utilized as support vector machine classifier‟s
input. Modules of the proposed hybrid model have been sequentially described since we
sequentially add the layers as demonstrated in Figure 4.1.
The Figure 5.1 depicts a classification report and Figure 5.2 depicts a confusion matrix of the
proposed hybrid model used for translation of hand gestures into American Sign Language.
These results were obtained from an experiment conducted using a cross-validation method. As
Page 75
60
shown in both the table and the figure, miss-classification occurred once on the letters m, s and u
out of the total of 24 signs/letters (classes) in the explored dataset. From these results, it is clear
that the miss-classification rate is minimized and this depicts the efficiency of the hybrid model
(SLT).
Figure 5.1: Classification report of the proposed model
In this thesis, a LinearSVC estimator was utilized as the SVM class. LinearSVC has a
seamless/simplified learning structure, is significantly less tuneable and is basically just a linear
interpolation. It is integrated with the Inception v3 for classification purposes. The SVM
classifier is comprised of parameters including loss=‘Squared_Hinge’ representing hinge loss
square. Penalty=‘l2’ specifying penalization norm, C=5 representing the error term parameter C,
and finally, ‘ovr’=Multi_Class determining strategy of multiclass when y has above two classes.
Page 76
61
Labels: a b k l m n o p q r s t c u v w x y d e f g h i
[[137 0 0 0 0 0 0 0 0 0 0 0 0 0 0 0 0 0 0 0 0 0 0 0]
[ 0 152 0 0 0 0 0 0 0 0 0 0 0 0 0 0 0 0 0 0 0 0 0 0]
[ 0 0 145 0 0 0 0 0 0 0 0 0 0 0 0 0 0 0 0 0 0 0 0 0]
[ 0 0 0 137 0 0 0 0 0 0 0 0 0 0 0 0 0 0 0 0 0 0 0 0]
[ 0 0 0 0 166 0 0 0 0 0 1 0 0 0 0 0 0 0 0 0 0 0 0 0]
[ 0 0 0 0 1 145 0 0 0 0 0 0 0 0 0 0 0 0 0 0 0 0 0 0]
[ 0 0 0 0 0 0 146 0 0 0 0 0 0 0 0 0 0 0 0 0 0 0 0 0]
[ 0 0 0 0 0 0 0 165 0 0 0 0 0 0 0 0 0 0 0 0 0 0 0 0]
[ 0 0 0 0 0 0 0 0 153 0 0 0 0 0 0 0 0 0 0 0 0 0 0 0]
[ 0 0 0 0 0 0 0 0 0 146 0 0 0 1 0 0 0 0 0 0 0 0 0 0]
[ 0 0 0 0 0 0 0 0 0 0 147 0 0 0 0 0 0 0 0 0 0 0 0 0]
[ 0 0 0 0 0 0 0 0 0 0 0 146 0 0 0 0 0 0 0 0 0 0 0 0]
[ 0 0 0 0 0 0 0 0 0 0 0 0 141 0 0 0 0 0 0 0 0 0 0 0]
[ 0 0 0 0 0 0 0 0 0 0 0 0 0 151 0 0 0 0 0 0 0 0 0 0]
[ 0 0 0 0 0 0 0 0 0 0 0 0 0 0 158 0 0 0 0 0 0 0 0 0]
[ 0 0 0 0 0 0 0 0 0 0 0 0 0 0 0 155 0 0 0 0 0 0 0 0]
[ 0 0 0 0 0 0 0 0 0 0 0 0 0 0 0 0 140 0 0 0 0 0 0 0]
[ 0 0 0 0 0 0 0 0 0 0 0 0 0 0 0 0 0 155 0 0 0 0 0 0]
[ 0 0 0 0 0 0 0 0 0 0 0 0 0 0 0 0 0 0 174 0 0 0 0 0]
[ 0 0 0 0 0 0 0 0 0 0 0 0 0 0 0 0 0 0 0 143 0 0 0 0]
[ 0 0 0 0 0 0 0 0 0 0 0 0 0 0 0 0 0 0 0 0 137 0 0 0]
[ 0 0 0 0 0 0 0 0 0 0 0 0 0 0 0 0 0 0 0 0 0 152 0 0]
[ 0 0 0 0 0 0 0 0 0 0 0 0 0 0 0 0 0 0 0 0 0 0 177 0]
[ 0 0 0 0 0 0 0 0 0 0 0 0 0 0 0 0 0 0 0 0 0 0 0 155]]
Figure 5.2: SLT Confusion matrix
SLT design process was performed using cross-validation on the hybrid model introduced in the
first simulation. This experiment uses ten-fold cross-validation. The sample being examined here
is split into ten equal parts. Training phase utilizes nine of the ten portions, and rest portion is
used at test phase. Training procedure is repeated by flipping training and testing signals ten
times. LinearSVC learning algorithm is also applied for implementation of training using 150
training epochs. The demonstrated value of accuracy represents result of the average of ten
simulations. Accuracy rate average value at test phase 99.9% and the error is 0.0126.
In the second simulation, Monte Carlo-style estimation is explored on same database where our
hybrid framework halt at 500 epochs, at each epoch, randomly dividing dataset into 60% for
training and 40% for testing. Monte Carlo estimators are an expansive class of algorithms which
depend on the iteration of random sampling to produce numerical outcomes. Here, the main idea
is utilizing randomness for solving deterministic tasks. They are regularly utilized in
mathematical and physical tasks. It is also helpful when it‟s impossible/extremely difficult in
utilizing another methodology. Monte-Carlo estimator is majorly utilized for solving 3 classes of
problems: generating solutions using a probability distribution, numerical integration and
Page 77
62
optimization (Kroese et al., 2014). On a basic level, Monte Carlo estimators can be utilized for
solving any task with a probabilistic interpretation. As previously mentioned, Monte Carlo
experiments were carried out utilizing ASL fingerspelling database where our proposed model
obtained 0.023 error rate and the accuracy was 98.91%. The table 5.1 contains outcomes of
simulations of our hybrid network using both cross-validation and Monte Carlo approaches.
5.3 Other Tested Models
To deduce the best model for ASL fingerspelling dataset, we applied other machine learning
approaches such as CNN Bheda and Radpour (2017) and Rastgoo et al. (2018), a Histogram of
Oriented Gradient plus neural networks (NN) and finally, HOG plus SVM. After a set of
simulations, a comparative analysis is made in order to determine the best performing model.
5.3.1 CNN simulation
In the first stage, the fully connected network of the CNN structure is applied for performing
translation of ASL signs. Table 5.2 demonstrate the CNN structure used for ASL translation.
Structure of CNN includes 2 layers of convolution, Maxpooling and fully connected network.
Page 78
63
Explored dataset is split into two sections for CNN training: 80 percent and 20 percent. Using 80
percent for preparation and 20 percent for testing. 60 percent of the data reserved for testing is
used for testing, while 40 percent is used for validation. To evaluate the CNN output signals, we
used equations (4.1–4.3). Normalization method (Z-score) is utilized during simulation for
scaling every input signal and the mentioned method improved the generalization of the model.
The training of the model is based on an RMSprop learning algorithm. In addition, we used 150
epochs to train the CNN model. CNN consists of two convolutional layers. Model inpute size is
4096, and kernel size 3. The completely integrated network is thus extended for the purpose of
classifying the American Sign Language. CNN was trained using 150 epochs as mentioned
earlier. 60 per cent was used to practice at each iteration of each epoch, and 40 per cent was used
to validate. Figure 5.3 shows the performances obtained from loss function as well as precision,
and table 5.3 shows performances of CNN simulation. The achieved loss function value during
training is 1.5676e-08. For validation data collected, the value of the loss function is 0.0054
while test data achieved 0.0054. 92.21 percent is the accuracy value for test data and the error is
as low as 0.0234.
Figure 5.3: Loss function and accuracy of CNN
Page 79
64
5.3.2 Simulation using HOG plus NN
In the next simulation, the ASL finger-spelling database was utilized to construct the translation
system, using histogram of oriented gradient (HOG) plus neural networks (NN) structure. Here,
every image of the hand in the domain donote a sign in ASL. As mentioned, this model is
capable of translating real-time hand gestures into one of the 24 signs in the ASL. The design of
this model is in line with that of the proposed hybrid model. Here, we use the HOG module for
data pre-processing and feature extraction, while the NN module classifies the extracted features
into American Sign Language. Table 5.4 depicts the structure of the HOG plus NN utilized for
the classification.
The data are split into two parts during training: 80 percent and 20 percent. During training 80
percent of the total dataset was utilized, while the remaining 20 percent of the data collection is
used for research. 60 percent of the 80 percent data collection reserved for testing is used for
testing, while 40 percent is used for validation. Z-score normalization was used for signal scaling
during simulation, and the Gauussian activation function was used for testing.
We trained the framework with 150 epochs as well. Figure 5.4 demonstrates the performances
obtained for accuracy and loss function, and table 5.5 demonstrates model simulation results.
Loss function value obtained during training was 0.0568. Loss function value is 0.1541 for the
validation data collected, and 0.12037 for test dataset. And the accuracy value of test dataset is
96.30 percent.
Page 80
65
Figure 5.4: HOG plus NN simulation results obtained for loss function, accuracy and RMSE
5.3.3 Simulation using HOG plus SVM
In this simulation, by combining the HOG module plus SVM module, a hybrid model is formed
for the design of the translation system. But here, the HOG module is utilized for data pre-
processing and feature extraction, while the SVM module is used to classify the extracted
features into ASL. Table 5.5 and Figure 5.6 depict a classification report and confusion matrix,
respectively.
As seen in the results, miss-classification is low leading to high accuracy. The performances in
this section were obtained utilizing cross-validation approach as described at simulation phase of
the hybrid system. LinearSVC learning algorithm is also utilized in the design of the model.
Training of the model is performed using 150 epochs. At test phase, obtained accuracy rate is
99.28% and the error is 0.5981.
Page 81
66
Figure 5.5: Classification report for HOG plus SVM
Labels: a b k l m n o p q r s t c u v w x y d e f g h i
[[168 0 0 0 0 0 0 0 0 0 0 0 0 0 0 0 0 0 0 0 0 0 0 0]
[ 0 166 0 0 0 0 0 0 0 0 0 0 0 0 0 0 0 0 0 0 0 0 0 0]
[ 0 0 163 0 0 0 0 0 0 0 0 0 0 0 0 0 0 0 0 0 0 0 0 0]
[ 0 0 0 155 0 0 0 0 0 0 0 0 0 0 0 0 0 0 0 0 0 0 0 0]
[ 0 0 0 0 166 3 0 0 0 0 0 1 0 0 0 0 0 0 1 0 0 0 0 1]
[ 0 0 0 0 0 142 0 0 0 0 1 0 0 1 0 0 0 0 0 1 0 0 0 2]
[ 0 0 0 0 0 0 134 0 0 0 0 0 0 0 0 0 0 0 0 0 0 0 0 0]
[ 0 0 0 0 0 0 0 133 0 0 0 0 0 0 0 0 0 0 0 0 0 0 0 0]
[ 0 0 0 0 0 0 0 0 157 0 0 0 0 0 0 0 0 0 0 0 0 0 0 0]
[ 0 0 0 0 0 0 0 0 0 129 0 0 0 0 0 0 0 0 1 0 0 0 0 0]
[ 0 0 0 0 0 0 0 0 0 0 161 0 0 0 0 0 0 0 0 0 0 0 0 0]
[ 0 0 0 0 0 0 0 0 0 0 0 147 0 0 0 0 0 0 0 0 0 0 0 0]
[ 0 0 0 0 0 0 0 0 0 0 0 0 148 0 0 0 0 0 0 0 0 0 0 0]
[ 0 1 1 0 0 0 0 0 0 0 0 0 0 152 0 0 0 0 1 0 0 0 0 0]
[ 0 0 0 0 1 1 0 0 0 0 0 0 0 0 141 4 0 0 0 0 0 0 0 0]
[ 0 0 0 0 0 0 0 0 0 0 0 0 0 0 1 153 0 0 0 0 0 0 0 0]
[ 0 0 0 0 0 0 0 0 0 0 0 0 0 0 0 0 134 0 1 0 0 0 0 0]
[ 0 0 0 0 0 0 0 0 0 0 0 0 0 0 0 0 0 136 0 0 0 0 0 0]
[ 0 0 0 0 0 0 0 0 0 0 0 0 0 0 0 0 0 0 146 0 0 0 0 0]
[ 0 0 0 0 0 0 0 0 0 0 0 0 0 0 0 0 0 0 0 182 0 0 0 0]
[ 0 0 0 0 0 0 0 0 0 0 0 0 0 0 0 0 0 0 0 0 135 0 0 0]
[ 0 0 0 0 0 0 0 0 0 0 0 0 0 0 0 0 0 0 0 0 0 139 0 0]
[ 0 0 0 0 0 0 0 0 0 0 0 0 0 0 0 0 0 0 0 0 0 0 177 0]
[ 0 0 0 0 0 0 0 0 0 0 0 0 0 0 0 0 0 0 0 0 0 0 0 139]]
Figure 5.6: Confusion matrix for HOG plus SVM
Page 82
67
5.4 Comparative Results of Different Models
Results of performances of some of the highly competitive frameworks used for sign language
translation are listed in Table 5.6. Research works that depicted accuracy rate were considered.
Simulations were carried out utilizing different dataset selected by the respective researchers.
Majority of the researches utilize ASL data, some of them Indian Sign Language data, some-
Indonesian Sign Language data. The literature review of these researches is demonstrated in
section 1 (introduction).
Table 5.6: Different models comparative results
Authors (year) Methods and Dataset Accuracy (%)
Jalal et al. (2018)
Capsule-Based Deep Neural
Network (Kaggle ASL Letter)
99.74
Rastgoo et al. (2018)
Restricted Boltzmann
Machine (Massey University
Gesture Dataset 2012, etc)
98.13
Lahamy and Lichti (2012) Real-Time and Rotation-
Invariant (Self-generated
Dataset)
93.88
Vaitkevičius et al. (2019)
Hidden Markov classification
(Self-generated Dataset Using
Leap Motion Device)
86.10
Atwood et al. (2012) Neural network and principal
component analysis (Self-
generated Dataset Using
Matlab Sofware)
96.10
Bheda & Radpour (2017) deep CNN (Self-generated
Dataset)
82.50
Dong et al. (2015)
Microsoft Kinect (Self-
generated Dataset)
90.00
Kacper and Urszula (2018)
Snapshot learning (Surrey
University and Massey
University ASL Dataset)
93.30
Current research
HOG + SVM (Kaggle ASL
Fingerspelling)
99.28
Current research
HOG + NN (Kaggle ASL
Fingerspelling)
96.30
Page 83
68
Current research
CNN (Kaggle ASL
Fingerspelling)
92.21
Propose hybrid model SSD + incept v3 + SVM
(Kaggle ASL Fingerspelling)
99.90
In the course of SLT design, we tested the learning technique of several deep structures so as to
choose the best model for the task (sign language translation). Some of the tested deep structures
include: YOLO, SSD, Inception v3, Faster R-CNN, AlexNet, GoogleNet, ResNet-50,
SSD+ResNet-50+SVM, SSD+AlexNet+SVM, SDD+YOLO+SVM and SSD+Inception
v3+SVM. The performances of these deep structures are depicted in Table 5.7.
Table 5.7: Other tested deep structures
Methods Accuracy (%)
YOLO 92.83
SDD 95.97
Inception v3 93.68
Faster R-CNN 90.10
AlexNet 86.25
GoogleNet 88.50
ResNet-50 89.36
SSD+Inception v3+SVM 99.90
SSD+YOLO+SVM 94.62
SDD+AlexNet+SVM 90.89
SSD+ResNet-50+SVM 93.19
Extensive comparison of object detection methods is provided in (Liu et al., 2016) as well as
(Zhao et al., 2019). From these papers, SSD model achieve higher accuracy as compared to the
rest methods. In our investigation, utilizing extraction of feature and classification methods, we
designe different models for comparative purposes. These models are based on HOG-SVM,
HOG-NN, CNN-fully connected network (FCM), inception V3-SVM. Tables 5.6 and 5.7 include
the performances of the models used for translation of ASL. In the proposed SLT, we carry out
transfer learning here, we reuse pre-trained SSD with Inception V3 frameworks, and
concatenated them to SVM network in order carry out translation on our original data. As shown,
SLT (SSD + Inception v3 + SVM) achieve the best result as depicted in Tables 5.6 and 5.7.
Page 84
69
Inclusion of SSD for hand detection in the first module makes extraction of the features simpler
and faster for the inception v3. The presented model is examined practically and is very effective
in translating real-time hand gestures into one of the 24 signs in the American Sign Language.
The fragments of experiments about real-time implementation of the propose model are provided
in the web pages Https://www.youtube.com/watch?v=FRUvbRRfZMw with
Https://www.youtube.com/watch?v=TzwfcW3Ufts. Real-time experiments of SLT are repeated
ten times. In each case, the recognition system is run to recognize all the 24 signs presented on-
line. The accuracy rate of SLT in real-time experiment was obtained as 96%. As shown in real-
time, we got accuracy rate less than the accuracy rate obtained with ASL data set as depicted in
Tabls 5.6 and 5.7. This low accuracy is due to inaccurate representation of some signs by the
user‟s hand. This can be corrected by changing hand orientation and clearer representation of
signs, after this correction, we got the same result (99.90%) as shown in Tables 5.6 and 5.7. The
result obtained depicts high convergence in learning as well as performance. Surely, the
comparative results show the effectiveness of SLT over the other systems intended to perform
the same task.
Page 85
70
CHAPTER 6
CONCLUSION
Analysis of existing research studies on sign language translation based on image processing
techniques has shown that these research works are basically using object detection, feature
extraction and classification modules. For each module, different algorithms were implemented
for solving the stated problems. However, the systems based on these methods have
disadvantages related to computation accuracy and speed of the system. In the thesis, sign
language translation-based deep structure is proposed.
The proposed system allows the increase of speed and precision of the designed system. The
structure of a Sign Language Translation System based on CNNs was proposed. This system
uses SSD for object detection, Inception 3 module for extraction of feature, and Support Vector
Machine for classification of image. Using integration of SSD, inception V3 and SVM, vision-
base American SLT is implemented.
Construction of the model includes training and on-line stages. The hybrid system training is
performed utilizing the cross-validation technique and validated using a Monte Carlo estimator.
The results obtained from these two experiments show the effectiveness of the cross-validation
approach over the Monte Carlo method. The design of the proposed hybrid system is
implemented using the ASL fingerspelling dataset. For simulations, using a cross-validation
approach, the recorded rate of accuracy is 99.9%, and RMSE is 0.0126.
The major advantage of the model is its simplified structure that seamlessly integrates detection
of object, extraction of features as well as classification modules in the body of SLT structure
without ambiguities. This designed system could automatically detect hands from camera images
and classify the detected object into one of the 24 American Sign Language symbols/sign. This
designed model can improve information communication between people, particularly between
deaf individuals and people who have some speaking difficulties. The great results of SLT shows
the robustness of the three learning techniques combined to form the compact model. But more
specifically, in our automated training process, these modules are combined to robustly learn the
Page 86
71
features in the given images. Using these modules which were automatically trained, the hybrid
SLT was able to detect the associated symbols in the new dataset.
Future directions intended to be implemented includes the training of the hybrid model on real-
world sign language literature (text and sentences translations) for deaf TV broadcasts. This can
be accomplished by introducing algorithms that track face and hand for computer vision so as to
remove vectors from signer's news recordings. Finally, the proposed framework will be built as a
mobile app to be used by the affected population.
Page 87
72
REFERENCES
Abiyev, R.H. (2014). Facial feature extraction techniques for face recognition. Journal of
Computer Science, 10(12), 2360.
Abiyev, R. H., & Arslan, M. (2020). Head mouse control system for people with disabilities.
Expert Systems, 37(1), e12398.
Abiyev, R.H., Arslan, M., Gunsel, I., & Cagman, A. (2017). Robot pathfinding using vision
based obstacle detection. In 3rd IEEE International Conference on Cybernetics (CYBCONF)
(pp. 1-6). IEEE.
Abiyev, R.H., & Ma‟aitah, M.K.S. (2018). Deep convolutional neural networks for chest
diseases detection. Journal of healthcare engineering.
Abu-El-Haija, S., Kothari, N., Lee, J., Natsev, P., Toderici, G., Varadarajan, B., &
Vijayanarasimhan, S. (2016). Youtube-8m: A large-scale video classification benchmark.
arXiv preprint arXiv:1609.08675.
Aly, W., Aly, S., & Almotairi, S. (2019). User-independent American sign language alphabet
recognition based on depth image and PCANet features. IEEE Access, 7, 123138-123150.
Ameen, S., & Vadera, S. (2017). A convolutional neural network to classify American Sign
Language fingerspelling from depth and colour images. Expert Systems, 34(3), e12197.
American Sign Language. (2015). National Institute on Deafness and Other Communication
Disorders. Retrieved April 17, 2020 from http://www.nidcd.nih.gov/health/hearing/asl.asp
Amrutha, C. U., Davis, N., Samrutha, K. S., Shilpa, N. S., & Chunkath, J. (2016). Improving
language acquisition in sensory deficit individuals with mobile application. Procedia
Technology, 24, 1068-1073.
Aronoff, M., Meir, I., & Sandler, W. (2005). The paradox of sign language morphology.
Language, 81(2), 301.
Askar, S., Kondratyuk, Y., Elazouzi, K., Kauff, P., & Schreer, O. (2004, March). Vision-based
skin-colour segmentation of moving hands for real-time applications. In Proc. of 1st
European Conf. on Visual Media Production (CVMP) (pp. 524-529).
Page 88
73
Atwood, J., Eicholtz, M., and Farrell, J. “American Sign Language Recognition System,”
Artificial Intelligence and Machine Learning for Engineering Design. Dept. of Mechanical
Engineering, Carnegie Mellon University, 2012.
Bao, C., Ji, H., Quan, Y., & Shen, Z. (2015). Dictionary learning for sparse coding: Algorithms
and convergence analysis. IEEE transactions on pattern analysis and machine intelligence,
38(7), 1356-1369.
Barhate, K. A., Patwardhan, K. S., Roy, S. D., Chaudhuri, S., & Chaudhury, S. (2004). Robust
shape based two hand tracker. (2004). In Proceeding of the International Conference on
Image Processing, 2004. ICIP'04. (Vol. 2, pp. 1017-1020). IEEE.
Bauer, B., & Karl-Friedrich, K. (2001, April). Towards an automatic sign language recognition
system using subunits. In International Gesture Workshop (pp. 64-75). Springer, Berlin,
Heidelberg.
Benjdira, B., Khursheed, T., Koubaa, A., Ammar, A., & Ouni, K. (2019, February). Car
detection using unmanned aerial vehicles: Comparison between faster r-cnn and yolov3.
(2019). In Proceeding of the 1st International Conference on Unmanned Vehicle Systems-
Oman (UVS) (pp. 1-6). IEEE.
Bheda, V., & Radpour, D. (2017). Using deep convolutional networks for gesture recognition in
American sign language. arXiv preprint arXiv:1710.06836.
Brashear, H., Starner, T., Lukowicz, P., & Junker, H. (2003). Using multiple sensors for mobile
sign language recognition. Georgia Institute of Technology.
Breiman, L. (2001). Random forests. Machine learning, 45(1), 5-32.
Bretzner, L., Laptev, I., & Lindeberg, T. (2002). Hand gesture recognition using multi-scale
colour features, hierarchical models and particle filtering. In Proceedings of fifth IEEE
international conference on automatic face gesture recognition (pp. 423-428). IEEE.
Buehler, P., Zisserman, A., & Everingham, M. (2009). Learning sign language by watching TV
(using weakly aligned subtitles). In Proceeding of the IEEE Conference on Computer Vision
and Pattern Recognition (pp. 2961-2968). IEEE.
Chang, C. C., & Lin, C. J. (2011). LIBSVM: A library for support vector machines. ACM
transactions on intelligent systems and technology (TIST), 2(3), 1-27.
Chen, G., Xu, R., & Yang, Z. (2018). Deep ranking structural support vector machine for image
tagging. Pattern Recognition Letters, 105, 30-38.
Page 89
74
Choudhury, A., Talukdar, A. K., Bhuyan, M. K., & Sarma, K. K. (2017). Movement epenthesis
detection for continuous sign language recognition. Journal of Intelligent Systems, 26(3),
471-481.
Chuan, C. H., Regina, E., & Guardino, C. (2014, December). American sign language
recognition using leap motion sensor. In 2014 13th International Conference on Machine
Learning and Applications (pp. 541-544). IEEE.
Coates, A., Huval, B., Wang, T., Wu, D., Catanzaro, B., & Andrew, N. (2013, February). Deep
learning with COTS HPC systems. In Proceeding of the International Conference on
Machine Learning (pp. 1337-1345).
Cooper, H., & Bowden, R. (2007, October). Large lexicon detection of sign language. In
International Workshop on Human-Computer Interaction (pp. 88-97). Springer, Berlin,
Heidelberg.
Dahmani, D., & Larabi, S. (2014). User-independent system for sign language finger spelling
recognition. Journal of Visual Communication and Image Representation, 25(5), 1240-1250.
Deng, J., Dong, W., Socher, R., Li, L. J., Li, K., & Fei-Fei, L. (2009). Imagenet: A large-scale
hierarchical image database. In Proceeding of the IEEE conference on computer vision and
pattern recognition (pp. 248-255). Ieee.
Deng, X., Yang, S., Zhang, Y., Tan, P., Chang, L., & Wang, H. (2017). Hand3d: Hand pose
estimation using 3d neural network. arXiv preprint arXiv:1704.02224.
Ding, L., & Martinez, A. M. (2009). Modelling and recognition of the linguistic components in
american sign language. Image and vision computing, 27(12), 1826-1844.
Di Ruberto, C., Putzu, L., Arabnia, H. R., & Quoc-Nam, T. (2016). A feature learning
framework for histology images classification. In Emerging trends in applications and
infrastructures for computational biology, bioinformatics, and systems biology: systems and
applications (pp. 37-48). Elsevier Press.
Dong, C., Leu, M. C., & Yin, Z. (2015). American sign language alphabet recognition using
microsoft kinect. In Proceedings of the IEEE conference on computer vision and pattern
recognition workshops (pp. 44-52).
Donoser, M., & Bischof, H. (2008). Real time appearance based hand tracking. In Proceeding of
the 19th International Conference on Pattern Recognition (pp. 1-4). IEEE.
Page 90
75
Dung, N. M., Kim, D., & Ro, S. (2018). A Video Smoke Detection Algorithm Based on Cascade
Classification and Deep Learning. KSII Transactions on Internet & Information Systems,
12(12).
Fang, G., Gao, W., & Zhao, D. (2003). Large vocabulary sign language recognition based on
hierarchical decision trees. In Proceedings of the 5th international conference on Multimodal
interfaces (pp. 125-131).
Fels, S. S. & Geo, E. H. (2002). Glove-talk: A neural network interface between a data-glove and
a speech synthesizer. IEEE Transactions on Neural Networks.
Fernandes, A. M., Utkin, A. B., Eiras-Dias, J., Cunha, J., Silvestre, J., & Melo-Pinto, P. (2019).
Grapevine variety identification using “Big Data” collected with miniaturized spectrometer
combined with support vector machines and convolutional neural networks. Computers and
Electronics in Agriculture, 163, 104855.
Gao, W., Fang, G., Zhao, D., & Chen, Y. (2004). Transition movement models for large
vocabulary continuous sign language recognition. In Proceeding of the Sixth IEEE
International Conference on Automatic Face and Gesture Recognition. (pp. 553-558). IEEE.
Garg, P., Aggarwal, N., & Sofat, S. (2009). Vision based hand gesture recognition. World
Academy of Science, Engineering and Technology, 49(1), 972-977.
Ge, L., Liang, H., Yuan, J., & Thalmann, D. (2018). Robust 3D hand pose estimation from single
depth images using multi-view CNNs. IEEE Transactions on Image Processing, 27(9), 4422-
4436.
Goodfellow, I., Bengio, Y., & Courville, A. (2016). Artificial neural network.
Grossman, R. B., & Kegl, J. (2006). To capture a face: A novel technique for the analysis and
quantification of facial expressions in American Sign Language. Sign Language Studies,
6(3), 273-305.
Grossman, R. B., & Kegl, J. (2007). Moving faces: Categorization of dynamic facial expressions
in american sign language by deaf and hearing participants. Journal of Nonverbal Behavior,
31(1), 23-38.
Gu, C., Lim, J. J., Arbeláez, P., & Malik, J. (2009). Recognition using regions. In Proceeding of
the IEEE Conference on Computer Vision and Pattern Recognition (pp. 1030-1037). IEEE.
Page 91
76
Gunes, H., & Piccardi, M. (2008). Automatic temporal segment detection and affect recognition
from face and body display. IEEE Transactions on Systems, Man, and Cybernetics, Part B
(Cybernetics), 39(1), 64-84.
Guo, H., Wang, G., Chen, X., Zhang, C., Qiao, F., & Yang, H. (2017). Region ensemble
network: Improving convolutional network for hand pose estimation. In Proceeding of the
IEEE International Conference on Image Processing (ICIP) (pp. 4512-4516). IEEE.
Hearst, M. A., Dumais, S. T., Osuna, E., Platt, J., & Scholkopf, B. (1998). Support vector
machines. IEEE Intelligent Systems and their applications, 13(4), 18-28.
Henia, O. B., Hariti, M., & Bouakaz, S. (2010). A two-step minimization algorithm for model-
based hand tracking.
Holden, E. J., Lee, G., & Owens, R. (2005). Australian sign language recognition. Machine
Vision and Applications, 16(5), 312.
Holden, E. J., Lee, G., & Owens, R. (2005). Automatic recognition of colloquial Australian sign
language. In the Seventh IEEE Workshops on Applications of Computer Vision
(WACV/MOTION'05) (Vol. 2, pp. 183-188). IEEE.
Hsu, C. W., & Lin, C. J. (2002). A comparison of methods for multiclass support vector
machines. IEEE transactions on Neural Networks, 13(2), 415-425.
Hubel, D. H., & Wiesel, T. N. (1968). Receptive fields and functional architecture of monkey
striate cortex. The Journal of physiology, 195(1), 215-243.
Ibrahim, N. B., Selim, M. M., & Zayed, H. H. (2018). An automatic arabic sign language
recognition system (ArSLRS). Journal of King Saud University-Computer and Information
Sciences, 30(4), 470-477.
Ioffe, S., & Szegedy, C. (2015). Batch normalization: Accelerating deep network training by
reducing internal covariate shift. arXiv preprint arXiv:1502.03167.
Jalal, M. A., Chen, R., Moore, R. K., & Mihaylova, L. (2018). American sign language posture
understanding with deep neural networks. In Proceeding of the 21st International Conference
on Information Fusion (FUSION) (pp. 573-579). IEEE.
Juang, C. F., & Ku, K. C. (2005). A recurrent fuzzy network for fuzzy temporal sequence
processing and gesture recognition. IEEE Transactions on Systems, Man, and Cybernetics,
Part B (Cybernetics), 35(4), 646-658.
Page 92
77
Junker, H., Amft, O., Lukowicz, P., & Tröster, G. (2008). Gesture spotting with body-worn
inertial sensors to detect user activities. Pattern Recognition, 41(6), 2010-2024.
Kacper, K., and Urszula M., “American Sign Language Fingerspelling Recognition Using Wide
Residual Networks,” Artificial Intelligence and Soft Computing, pp. 97-107, 2018.
Kim, J., Wagner, J., Rehm, M., & André, E. (2008). Bi-channel sensor fusion for automatic sign
language recognition. In Proceeding of the 8th IEEE International Conference on Automatic
Face & Gesture Recognition (pp. 1-6). IEEE.
Kim, S., Yu, Z., Kil, R. M., & Lee, M. (2015). Deep learning of support vector machines with
class probability output networks. Neural Networks, 64, 19-28.
Kingma, D. P., & Ba, J. (2014). Adam: A method for stochastic optimization. arXiv preprint
arXiv:1412.6980.
Koch, T. E., Zell, A., Huhse, J., Villmann, T., Merz, P., Zell, A., ... & Mehdi, S. A. (2002).
Memetic Algorithms for Combinatorial Optimization Problems. In Proceeding of the Genetic
and Evolutionary Computation Conference (GECCO-2002) (Vol. 5, No. 1679, pp. 2056-
2057). Morgan Kaufmann Publishers Inc. San Francisco, CA, USA.
Krasin, I., Duerig, T., Alldrin, N., Ferrari, V., Abu-El-Haija, S., Kuznetsova, A., ... & Belongie,
S. (2017). Openimages: A public dataset for large-scale multi-label and multi-class image
classification. Dataset available from https://github. com/openimages, 2(3), 18.
Krishnaveni, M., Subashini, P., & Dhivyaprabha, T. T. (2016). Improved Canny Edges Using
Cellular Based Particle Swarm Optimization Technique for Tamil Sign Digital Images.
International Journal of Electrical & Computer Engineering (2088-8708), 6(5).
Kroese, D. P., Brereton, T., Taimre, T., & Botev, Z. I. (2014). Why the Monte Carlo method is
so important today. Wiley Interdisciplinary Reviews: Computational Statistics, 6(6), 386-392.
Kumar, P., Gauba, H., Roy, P. P., & Dogra, D. P. (2017). A multimodal framework for sensor
based sign language recognition. Neurocomputing, 259, 21-38.
Kumar, P., Roy, P. P., & Dogra, D. P. (2018). Independent bayesian classifier combination based
sign language recognition using facial expression. Information Sciences, 428, 30-48.
Kundu, S., & Ari, S. (2020). P300 based character recognition using convolutional neural
network and support vector machine. Biomedical Signal Processing and Control, 55,
101645.
Page 93
78
Lahamy, H., & Lichti, D., “Towards Real-Time and Rotation-Invariant American Sign Language
Alphabet Recognition Using a Range Camera,” Sensors, Vol.12, no.11, pp.14416-14441,
2012.
LeCun, Y., Haffner, P., Bottou, L., & Bengio, Y. (1999). Object recognition with gradient-based
learning. In Shape, contour and grouping in computer vision (pp. 319-345). Springer, Berlin,
Heidelberg.
Le Cun, Y., Jackel, L. D., Boser, B., Denker, J. S., Graf, H. P., Guyon, I., ... & Hubbard, W.
(1989). Handwritten digit recognition: Applications of neural network chips and automatic
learning. IEEE Communications Magazine, 27(11), 41-46.
LeCun, Y., & Ranzato, M. (2013, June). Deep learning tutorial. In Proceeding of the Tutorials in
International Conference on Machine Learning (ICML’13) (pp. 1-29). Citeseer.
Liu, W., Anguelov, D., Erhan, D., Szegedy, C., Reed, S., Fu, C. Y., & Berg, A. C. (2016). Ssd:
Single shot multibox detector. In Proceeding of the European conference on computer vision
(pp. 21-37). Springer, Cham.
Liwicki, S., & Everingham, M. (2009). Automatic recognition of fingerspelled words in british
sign language. In Proceeding of the IEEE computer society conference on computer vision
and pattern recognition workshops (pp. 50-57). IEEE.
Li, Y., & Zhang, T. (2017). Deep neural mapping support vector machines. Neural Networks, 93,
185-194.
Madadi, M., Escalera, S., Baró, X., & Gonzalez, J. (2017). End-to-end global to local cnn
learning for hand pose recovery in depth data. arXiv preprint arXiv:1705.09606.
Ma, J., Gao, W., & Wang, R. (2000). A parallel multistream model for integration of sign
language recognition and lip motion. In Proceeding of the International Conference on
Multimodal Interfaces (pp. 582-589). Springer, Berlin, Heidelberg.
McCulloch, W. S., & Pitts, W. (1943). A logical calculus of the ideas immanent in nervous
activity. The bulletin of mathematical biophysics, 5(4), 115-133.
McGuire, R. M., Hernandez-Rebollar, J., Starner, T., Henderson, V., Brashear, H., & Ross, D. S.
(2004). Towards a one-way American sign language translator. In Proceeding of the Sixth
IEEE International Conference on Automatic Face and Gesture Recognition. (pp. 620-625).
IEEE.
Page 94
79
Naseer, S., & Saleem, Y. (2018). Enhanced Network Intrusion Detection using Deep
Convolutional Neural Networks. TIIS, 12(10), 5159-5178.
Neverova, N., Wolf, C., Nebout, F., & Taylor, G. W. (2017). Hand pose estimation through
semi-supervised and weakly-supervised learning. Computer Vision and Image
Understanding, 164, 56-67.
Nguyen, T. D., & Ranganath, S. (2012). Facial expressions in American sign language: Tracking
and recognition. Pattern Recognition, 45(5), 1877-1891.
Oberweger, M., Wohlhart, P., & Lepetit, V. (2015). Hands deep in deep learning for hand pose
estimation. arXiv preprint arXiv:1502.06807.
Oikonomidis, I., Kyriazis, N., & Argyros, A. A. (2011). Efficient model-based 3D tracking of
hand articulations using Kinect. In BmVC (Vol. 1, No. 2, p. 3).
Ong, S. C., & Ranganath, S. (2005). Automatic sign language analysis: A survey and the future
beyond lexical meaning. IEEE Transactions on Pattern Analysis & Machine Intelligence, (6),
873-891.
Oz, C., & Leu, M. C. (2007). Linguistic properties based on American Sign Language isolated
word recognition with artificial neural networks using a sensory glove and motion tracker.
Neurocomputing, 70(16-18), 2891-2901.
Pan, S. J., & Yang, Q. (2009). A survey on transfer learning. IEEE Transactions on knowledge
and data engineering, 22(10), 1345-1359.
Platt, J. C., Cristianini, N., & Shawe-Taylor, J. (2000). Large margin DAGs for multiclass
classification. In Advances in neural information processing systems (pp. 547-553).
Qi, Z., Wang, B., Tian, Y., & Zhang, P. (2016). When ensemble learning meets deep learning: a
new deep support vector machine for classification. Knowledge-Based Systems, 107, 54-60.
Rabiner, L., & Juang, B. (1986). An introduction to hidden Markov models. IEEE ASSP
magazine, 3(1), 4-16.
Rastgoo, R., Kiani, K., & Escalera, S. (2018). Multi-modal deep hand sign language recognition
in still images using restricted Boltzmann machine. Entropy, 20(11), 809.
Rastgoo, R., Kiani, K., & Escalera, S. (2020). Hand sign language recognition using multi-view
hand skeleton. Expert Systems with Applications, 113336.
Page 95
80
Redmon, J., Divvala, S., Girshick, R., & Farhadi, A. (2016). You only look once: Unified, real-
time object detection. In Proceedings of the IEEE conference on computer vision and pattern
recognition (pp. 779-788).
Redmon, J., & Farhadi, A. (2018). Yolov3: An incremental improvement. arXiv preprint
arXiv:1804.02767.
Rifkin, R., & Klautau, A. (2004). In defense of one-vs-all classification. Journal of machine
learning research, 5(Jan), 101-141.
Rosenblatt, F. (1958). The perceptron: a probabilistic model for information storage and
organization in the brain. Psychological review, 65(6), 386.
Rumelhart, D. E., Hinton, G. E., & Williams, R. J. (1985). Learning internal representations by
error propagation (No. ICS-8506). California Univ San Diego La Jolla Inst for Cognitive
Science.
Schmidhuber, J. (2015). Deep learning in neural networks: An overview. Neural networks, 61,
85-117.
Shanableh, T., Assaleh, K., & Al-Rousan, M. (2007). Spatio-temporal feature-extraction
techniques for isolated gesture recognition in Arabic sign language. IEEE Transactions on
Systems, Man, and Cybernetics, Part B (Cybernetics), 37(3), 641-650.
Shen, J., Liu, N., Sun, H., Tao, X., & Li, Q. (2019). Vehicle Detection in Aerial Images Based on
Hyper Feature Map in Deep Convolutional Network. TIIS, 13(4), 1989-2011.
Singha, J., & Das, K. (2013). Indian sign language recognition using eigen value weighted
Euclidean distance based classification technique. arXiv preprint arXiv:1303.0634.
Singh, A. K., John, B. P., Subramanian, S. V., Kumar, A. S., & Nair, B. B. (2016). A low-cost
wearable Indian sign language interpretation system. In Proceeding of the International
Conference on Robotics and Automation for Humanitarian Applications (RAHA) (pp. 1-6).
IEEE.
Starner, T. E. (1995). Visual Recognition of American Sign Language Using Hidden Markov
Models. Massachusetts Inst Of Tech Cambridge Dept Of Brain And Cognitive Sciences.
Starner, T., Weaver, J., & Pentland, A. (1998). Real-time american sign language recognition
using desk and wearable computer based video. IEEE Transactions on pattern analysis and
machine intelligence, 20(12), 1371-1375.
Page 96
81
Stokoe Jr, W. C. (2005). Sign language structure: An outline of the visual communication
systems of the American deaf. Journal of deaf studies and deaf education, 10(1), 3-37.
Sun, X., Wei, Y., Liang, S., Tang, X., & Sun, J. (2015). Cascaded hand pose regression. In
Proceedings of the IEEE conference on computer vision and pattern recognition (pp. 824-
832).
Szegedy, C., Liu, W., Jia, Y., Sermanet, P., Reed, S., Anguelov, D., ... & Rabinovich, A. (2015).
Going deeper with convolutions. In Proceedings of the IEEE conference on computer vision
and pattern recognition (pp. 1-9).
Szegedy, C., Vanhoucke, V., Ioffe, S., Shlens, J., & Wojna, Z. (2015). Rethinking the inception
architecture for computer vision. 2015. arXiv preprint arXiv:1512.00567.
Tang, D., Jin Chang, H., Tejani, A., & Kim, T. K. (2014). Latent regression forest: Structured
estimation of 3d articulated hand posture. In Proceedings of the IEEE conference on
computer vision and pattern recognition (pp. 3786-3793).
Tang, D., Taylor, J., Kohli, P., Keskin, C., Kim, T. K., & Shotton, J. (2015). Opening the black
box: Hierarchical sampling optimization for estimating human hand pose. In Proceedings of
the IEEE international conference on computer vision (pp. 3325-3333).
Tao, W., Leu, M. C., & Yin, Z. (2018). American Sign Language alphabet recognition using
Convolutional Neural Networks with multiview augmentation and inference fusion.
Engineering Applications of Artificial Intelligence, 76, 202-213.
Tomasi, C. (2012). Histograms of oriented gradients. Computer Vision Sampler, 1-6.
Uddin, M., & Kim, J. (2017). A Robust Approach for Human Activity Recognition Using 3-D
Body Joint Motion Features with Deep Belief Network. KSII Transactions on Internet &
Information Systems, 11(2).
Uijlings, J. R., Van De Sande, K. E., Gevers, T., & Smeulders, A. W. (2013). Selective search
for object recognition. International journal of computer vision, 104(2), 154-171.
Ulrich, A., Daniel, S., Jorg, Z., & Karl-Friedrich, K. (2006). Rapid signer adaptation for isolated
sign language recognition. In CVPRW ’06: Proceedings of the 2006 Conference on
Computer Vision and Pattern Recognition Workshop, page 159.
Van-der-Kooij, E., Crasborn, O., & Emmerik, W. (2006). Explaining prosodic body leans in Sign
Language of the Netherlands: Pragmatics required. Journal of Pragmatics, 38(10), 1598-
1614.
Page 97
82
Vaitkevičius, A., Taroza, M., Blažauskas, T., Damaševičius, R., Maskeliūnas, R., & Woźniak,
M., “Recognition of American Sign Language Gestures in a Virtual Reality Using Leap
Motion,” Applied Sciences, Vol.9, no.3, 445, 2019.
Vapnik, V. (2013). The nature of statistical learning theory. Springer science & business media.
Vogler, C., & Metaxas, D. (2004). Handshapes and movements: Multiple-channel ASL
recognition. J. Carbonell, J. Siekmann (eds.), Gesture-Based Communication in Human-
Computer Interaction, LNAI 2915.
Von Agris, U., Knorr, M., & Kraiss, K. F. (2008). The significance of facial features for
automatic sign language recognition. In Proceeding of the 8th IEEE International
Conference on Automatic Face & Gesture Recognition (pp. 1-6). IEEE.
Von Agris, U., Zieren, J., Canzler, U., Bauer, B., & Kraiss, K. F. (2008). Recent developments in
visual sign language recognition. Universal Access in the Information Society, 6(4), 323-362.
Wang, Q., Chen, X., Zhang, L. G., Wang, C., & Gao, W. (2007). Viewpoint invariant sign
language recognition. Computer Vision and Image Understanding, 108(1-2), 87-97.
Wang, Z., Healy, G., Smeaton, A. F., & Ward, T. E. (2018). A review of feature extraction and
classification algorithms for image RSVP based BCI. Signal processing and machine
learning for brain-machine interfaces, 243-270.
Yang, H. D., Sclaroff, S., & Lee, S. W. (2008). Sign language spotting with a threshold model
based on conditional random fields. IEEE transactions on pattern analysis and machine
intelligence, 31(7), 1264-1277.
Yang, H., & Zhang, J. (2016). Hand pose regression via a classification-guided approach. In
Proceeding of the Asian Conference on Computer Vision (pp. 452-466). Springer, Cham.
Yang, M. H., Ahuja, N., & Tabb, M. (2002). Extraction of 2d motion trajectories and its
application to hand gesture recognition. IEEE Transactions on pattern analysis and machine
intelligence, 24(8), 1061-1074.
Yang, R., Sarkar, S., & Loeding, B. (2007). Enhanced level building algorithm for the movement
epenthesis problem in sign language recognition. In CVPR07, (pp. 1-8).
Yang, R., Sarkar, S., & Loeding, B. (2009). Handling movement epenthesis and hand
segmentation ambiguities in continuous sign language recognition using nested dynamic
programming. IEEE transactions on pattern analysis and machine intelligence, 32(3), 462-
477.
Page 98
83
Yang, W., Tao, J., & Ye, Z. (2016). Continuous sign language recognition using level building
based on fast hidden Markov model. Pattern Recognition Letters, 78, 28-35.
Ye, Q., Yuan, S., & Kim, T. K. (2016). Spatial attention deep net with partial pso for hierarchical
hybrid hand pose estimation. In Proceeding of the European conference on computer vision
(pp. 346-361). Springer, Cham.
Zareapoor, M., Shamsolmoali, P., Jain, D. K., Wang, H., & Yang, J. (2018). Kernelized support
vector machine with deep learning: an efficient approach for extreme multiclass dataset.
Pattern Recognition Letters, 115, 4-13.
Zhang, L., Jia, J., Li, Y., Gao, W., & Wang, M. (2019). Deep Learning based Rapid Diagnosis
System for Identifying Tomato Nutrition Disorders. KSII Transactions on Internet &
Information Systems, 13(4).
Zhao, Z. Q., Zheng, P., Xu, S. T., & Wu, X. (2019). Object detection with deep learning: A
review. IEEE transactions on neural networks and learning systems, 30(11), 3212-3232.
Zhou, X., Wan, Q., Zhang, W., Xue, X., & Wei, Y. (2016). Model-based deep hand pose
estimation. arXiv preprint arXiv:1606.06854.
Page 99
84
APPENDIX 1
SOURCE CODES
Dataset Building
# python build_dataset.py
# import the necessary packages
from researchcenter import config
from imutils import paths
import shutil
import os
# loop over the data splits
for split in (config.TRAIN, config.TEST, config.VAL):
# grab all image paths in the current split
print("[INFO] processing '{} split'...".format(split))
p = os.path.sep.join([config.ORIG_INPUT_DATASET, split])
imagePaths = list(paths.list_images(p))
# loop over the image paths
for imagePath in imagePaths:
# extract class label from the filename
filename = imagePath.split(os.path.sep)[-1]
label = config.CLASSES[int(filename.split("_")[0])]
# construct the path to the output directory
dirPath = os.path.sep.join([config.BASE_PATH, split, label])
# if the output directory does not exist, create it
if not os.path.exists(dirPath):
os.makedirs(dirPath)
# construct the path to the output image file and copy it
p = os.path.sep.join([dirPath, filename])
shutil.copy2(imagePath, p)
Feature Extraction
# python extract_features.py
# import the necessary packages
from sklearn.preprocessing import LabelEncoder
Page 100
85
from keras.applications import InceptionV3
from keras.applications import imagenet_utils
from keras.preprocessing.image import img_to_array
from keras.preprocessing.image import load_img
from researchcenter import config
from imutils import paths
import numpy as np
import pickle
import random
import os
# load the InceptionV3 network and initialize the label encoder
print("[INFO] loading network...")
model =InceptionV3(weights="imagenet", include_top=False)
le = None
# loop over the data splits
for split in (config.TRAIN, config.TEST, config.VAL):
# grab all image paths in the current split
print("[INFO] processing '{} split'...".format(split))
p = os.path.sep.join([config.BASE_PATH, split])
imagePaths = list(paths.list_images(p))
# randomly shuffle the image paths and then extract the class
# labels from the file paths
random.shuffle(imagePaths)
labels = [p.split(os.path.sep)[-2] for p in imagePaths]
# if the label encoder is None, create it
if le is None:
le = LabelEncoder()
le.fit(labels)
# open the output CSV file for writing
csvPath = os.path.sep.join([config.BASE_CSV_PATH,
"{}.csv".format(split)])
csv = open(csvPath, "w")
# loop over the images in batches
for (b, i) in enumerate(range(0, len(imagePaths), config.BATCH_SIZE)):
# extract the batch of images and labels, then initialize the
# list of actual images that will be passed through the network
# for feature extraction
print("[INFO] processing batch {}/{}".format(b + 1,
int(np.ceil(len(imagePaths) / float(config.BATCH_SIZE)))))
batchPaths = imagePaths[i:i + config.BATCH_SIZE]
Page 101
86
batchLabels = le.transform(labels[i:i + config.BATCH_SIZE])
batchImages = []
# loop over the images and labels in the current batch
for imagePath in batchPaths:
# load the input image using the Keras helper utility
# while ensuring the image is resized to 299x299 pixels
image = load_img(imagePath, target_size=(299, 299))
image = img_to_array(image)
# preprocess the image by (1) expanding the dimensions and
# (2) subtracting the mean RGB pixel intensity from the
# ImageNet dataset
image = np.expand_dims(image, axis=0)
image = imagenet_utils.preprocess_input(image)
# add the image to the batch
batchImages.append(image)
# pass the images through the network and use the outputs as
# our actual features, then reshape the features into a
# flattened volume
batchImages = np.vstack(batchImages)
features = model.predict(batchImages, batch_size=config.BATCH_SIZE)
features = features.reshape((features.shape[0], 7 * 7 * 512))
# loop over the class labels and extracted features
for (label, vec) in zip(batchLabels, features):
# construct a row that exists of the class label and
# extracted features
vec = ",".join([str(v) for v in vec])
csv.write("{},{}\n".format(label, vec))
# close the CSV file
csv.close()
# serialize the label encoder to disk
f = open(config.LE_PATH, "wb")
f.write(pickle.dumps(le))
f.close()
Training and Classification
# python train.py
Page 102
87
# import the necessary packages
from sklearn.svm_model import LinearSVC
from sklearn.metrics import classification_report
from researchcenter import config
import numpy as np
import pickle
import os
def load_data_split(splitPath):
# initialize the data and labels
data = []
labels = []
# loop over the rows in the data split file
for row in open(splitPath):
# extract the class label and features from the row
row = row.strip().split(",")
label = row[0]
features = np.array(row[1:], dtype="float")
# update the data and label lists
data.append(features)
labels.append(label)
# convert the data and labels to NumPy arrays
data = np.array(data)
labels = np.array(labels)
# return a tuple of the data and labels
return (data, labels)
# derive the paths to the training and testing CSV files
trainingPath = os.path.sep.join([config.BASE_CSV_PATH,
"{}.csv".format(config.TRAIN)])
testingPath = os.path.sep.join([config.BASE_CSV_PATH,
"{}.csv".format(config.TEST)])
# load the data from disk
print("[INFO] loading data...")
(trainX, trainY) = load_data_split(trainingPath)
(testX, testY) = load_data_split(testingPath)
# load the label encoder from disk
le = pickle.loads(open(config.LE_PATH, "rb").read())
# train the model
Page 103
88
print("[INFO] training model...")
model = LinearSVC(svm="rbf", multi_class="auto")
model.fit(trainX, trainY)
# evaluate the model
print("[INFO] evaluating...")
preds = model.predict(testX)
print(classification_report(testY, preds, target_names=le.classes_))
# serialize the model to disk
print("[INFO] saving model...")
f = open(config.MODEL_PATH, "wb")
f.write(pickle.dumps(model))
f.close()
Page 104
89
APPENDIX 2
CURRICULUM VITEA
JOHN BUSH IDOKO Doga Sokak, Block 22, Flat 8, Metahan Kermia, North Cyprus
Email: [email protected] Mobile: +90533 825 9510.
SKILLS
Scientific research, deep learning/machine learning modeling, computer network administration,
system analysis, academic counseling, motivational speech
PERSONAL DETAILS
Nationality: Nigeria
State of Origin: Benue
Date of Birth: 22/05/1989
Marital Status: Single
Sex Male
ACADEMIC QUALIFICATION
2017-2020 Near East University, North Cyprus
Ph.D. Computer Engineering (First Class)
2015-2017 Near East University, North Cyprus
M.Sc. Computer Engineering (First Class)
2005-2010 Benue State University Makurdi
B.Sc. Computer Science (Second Class Division)
1997-2003 Emmanuel Secondary School Ugbokolo
Senior Secondary School Certificate (S.S.C.E)
ACADEMIC ACHIEVEMENTS
Reviewer at International Journal of Intelligent Computing and Cybernetics
Reviewer at International Journal of Advances in Fuzzy Systems
Reviewer at International Journal of Applied Biochemistry and Biotechnology
Reviewer at KSII Transactions on Internet and Information Systems
Reviewer at International Research Journal of Medicine and Medical Sciences (IRJMMS)
Reviewer at International Journal of Neurology, Neurological Science and Disorders
Reviewer at International Journal of Annals of Robotics and Automation
Reviewer at International Journal of Mathematics and Computer Science
Organizing Committee Member of several international conferences
Member, International Association of Engineers (IAENG)
Member, Near East University Center for Applied Artificial Intelligence Research
Page 105
90
LIST OF PUBLICATIONS
Research URL: https://scholar.google.com/citations?user=eVqc6HkAAAAJ&hl=en&oi=ao
Abiyev, R.; Arslan, M.; Bush Idoko, J.; Sekeroglu, B.; Ilhan, A. Identification of Epileptic
EEG Signals Using Convolutional Neural Networks. Appl. Sci. 2020, 10, 4089.
Abiyev, R. H., Arslan, M., & Idoko, J. B. (2020). Sign Language Translation Using Deep
Convolutional Neural Networks. KSII Transactions on Internet & Information
Systems, 14(2).
Idoko, John Bush; Abiyev, Rahib; Arslan, Murat. Impact of machine learning techniques on
hand gesture recognition. Journal of Intelligent & Fuzzy Systems. DOI: 10.3233/JIFS-
190353, 2019.
Abiyev, R. H., & Idoko, J. B., Arslan, M. Reconstruction of Convolutional Neural Network
for Sign Language Recognition. Proc. of the 2nd International Conference on Electrical,
Communication and Computer Engineering (ICECCE). 12-13 June 2020, Istanbul Turkey.
IEEE.
Ikenna, U., Ugochukwu, G.I., Idoko, J.B., and Shaban, I.A. Traffic Warning System for
Wildlife Road Crossing Accidents Using Artificial Intelligence. International Conference on
Transportation and Development, USA 2020
Idoko JB, Arslan M, Abiyev R. Fuzzy Neural System Application to Differential Diagnosis
of Erythemato-Squamous Diseases. Cyprus J Med Sci 2018; 3: 90-7.
Idoko John Bush, Rahib Abiyev, Mohammad Ma'aitah Khaheel and Hamit Altiparmak.
Integrated Artificial Intelligence Algorithm for Skin Detection. ITM Web of Conferences 16,
02004, 2018.
Murat Arslan, Rahib Abiyev, Idoko John Bush. Head Movement Mouse Control Using
Convolutional Neural Network for People with Disabilities. ICAFS 2018. Advances in
Intelligent Systems and Computing, 896, XIV, pp.239-248.
Idoko John Bush, Kamil Dimililer, Static and Dynamic Pedestrian Detection Algorithm for
Visual Based Driver Assistive System. ITM Web of Conferences 9, 03002 (2017).
Abdulkader Helwan, Dilber Uzun Ozsahin, Rahib Abiyev, John Bush, One-Year Survival
Prediction of Myocardial Infarction. International Journal of Advanced Computer Science
and Applications, Vol. 8, No. 6, 2017 173-178.
Mohammad Khaleel Sallam Ma‟aitah, Rahib Abiyev and Idoko John Bush, Intelligent
Classification of Liver Disorder using Fuzzy Neural System, International Journal of
Advanced Computer Science and Applications, Vol. 8, No. 12, 2017.
Idoko John Bush, Murat Arslan, Abiyev Rahib. (2019) Intensive Investigation in Differential
Diagnosis of Erythemato-Squamous Diseases. ICAFS-2018. DOI: 10.1007/978-3-030-
04164-9_21.
Abdulkader Helwan, John Bush Idoko, Rahib H Abiyev, Machine learning techniques for
classification of breast tissue, Procedia Computer Science, 2017, 120:402-410. Elsevier.
J.B. Idoko, R.H. Abiyev, and M.K. Ma‟aitah, Intelligent machine learning algorithms for
colour segmentation, WSEAS Transactions on Signal Processing, 2017.
K. Dimililer, J.B. Idoko, Automated classification of fruits: pawpaw fruit as a case study,
International Conference on Man–Machine Interactions, 2017, 365-374.
Page 106
91
WORK EXPERIENCE
Near East University ------------------------------------------------------------Feb, 2016 – Date
Lefkosa-Cyprus
Position: Research Assistant
Responsibilities:
Courses Lectured: System programing (ECC406), engineering management (ECC427),
automata theory (COM344), object-oriented programming (COM210), discrete structures
(ECC104), c programming lab (ECC106), data communication and networking lab
(ECC303)
Supervises undergraduate projects/research
Installation/maintenance of software applications as well as network equipment
Weekly routine check of systems in the laboratories.
First Bank of Nigeria Ltd ------------------------------------------------------Dec, 2012 – Sept, 2015
Abuja Main, CBD-Abuja
Position: IT/Help Desk Support
Responsibilities:
Provided first level Technical and operational Support to branches
Supervise the activities of outsourced service providers (ISP, CCTV, etc. vendors)
Installation and Configuration of Western Union Money Transfer (WUMT)/MoneyGram.
Installation, Configuration and Maintenance of Devices and Network Infrastructures.
Hardware handling/Service Desk duties and Provision of first-tier ATM support.
Monitoring and escalation procedures relative to appropriates SLAs.
LAN Installations in branches and Installation of Banks applications.
Configuration and IP Address leasing on DHCP Servers, repairs and reset of password on
Exchange server.
Government Secondary School ----------------------------------------------Nov, 2011-Oct, 2012
Keffi, Nasarawa State
Position: NYSC (Computer Education/Mathematics Teacher)
Job Description:
Delivered Computer Education and Mathematics lessons to students.
NYSC Community Development Service (CDS).
Ace Telecoms International -------------------------------------------------Sept, 2008- July, 2009
Bolton White Apartment, Zone 7-Abuja
Position: Industrial Trainee (Network Optimization Team)
Job Description:
Site Audit and Optimization
Antenna Orientation on Towers and Roof Tops without height phobia
Tilt Adjustment (Mechanical and Electrical) and Adjustment of Azimuth
Snags and Swap Detection and Correction.
Page 107
92
HOBBIES: Travelling, Reading and Football
REFEREE
Prof. Dr. Rahib Abiyev
Chairman of Computer Engineering Department
Near East University
[email protected]
Assoc. Prof. Dr. Kamil Dimililer
Chairman of Automotive Engineering Department
Near East University
[email protected]
Page 108
93
APPENDIX 3:
ETHICAL APPROVAL REPORT
ETHICAL APPROVAL DOCUMENT
Date: 18/09/2020
To the Graduate School of Applied Sciences
For the thesis topic entitled “Deep Learning-Based Sign Language Translation System” the
researchers declare that they did not collect any data from human/animal or any other subjects.
Therefore, this thesis does not need to go through the ethics committee evaluation.
Title: Prof. Dr.
Name Surname: Rahib Abiyev
Signature:
Role in the Thesis Research: Supervisor
Page 109
94
APPENDIX 4
SIMILARITY REPORT
Title: Prof. Dr.
Name Surname: Rahib Abiyev
Signature:
Role in the Thesis Research: Supervisor


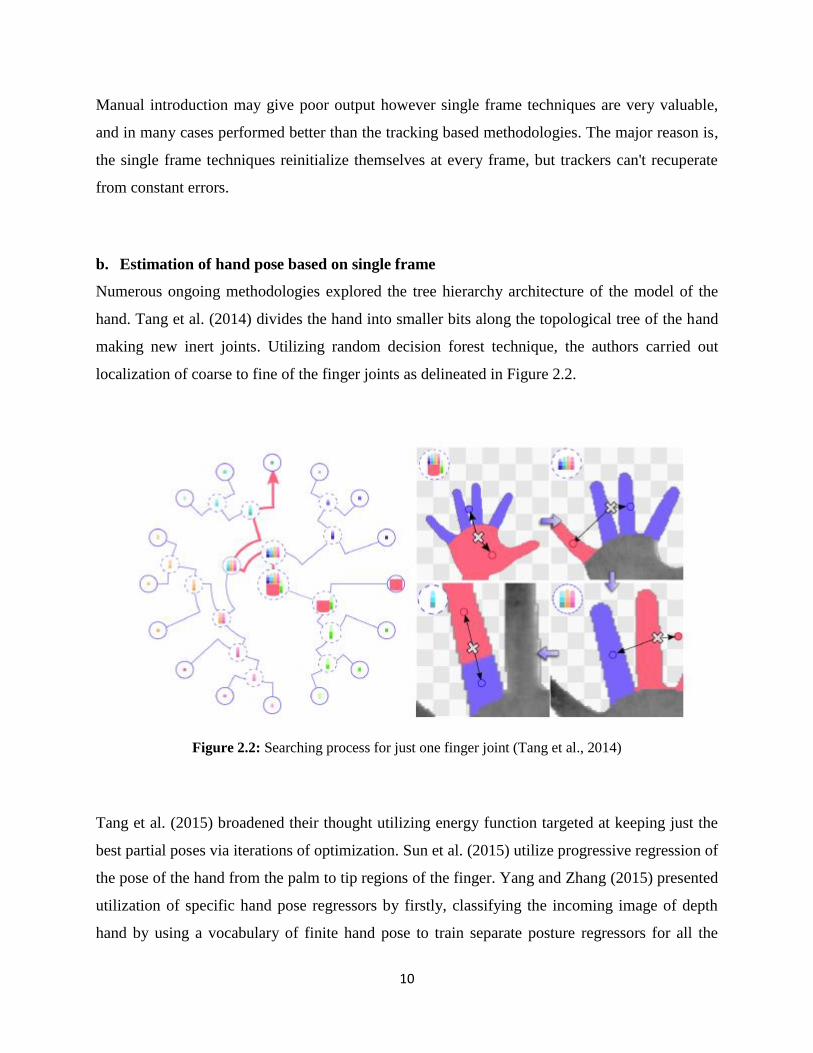

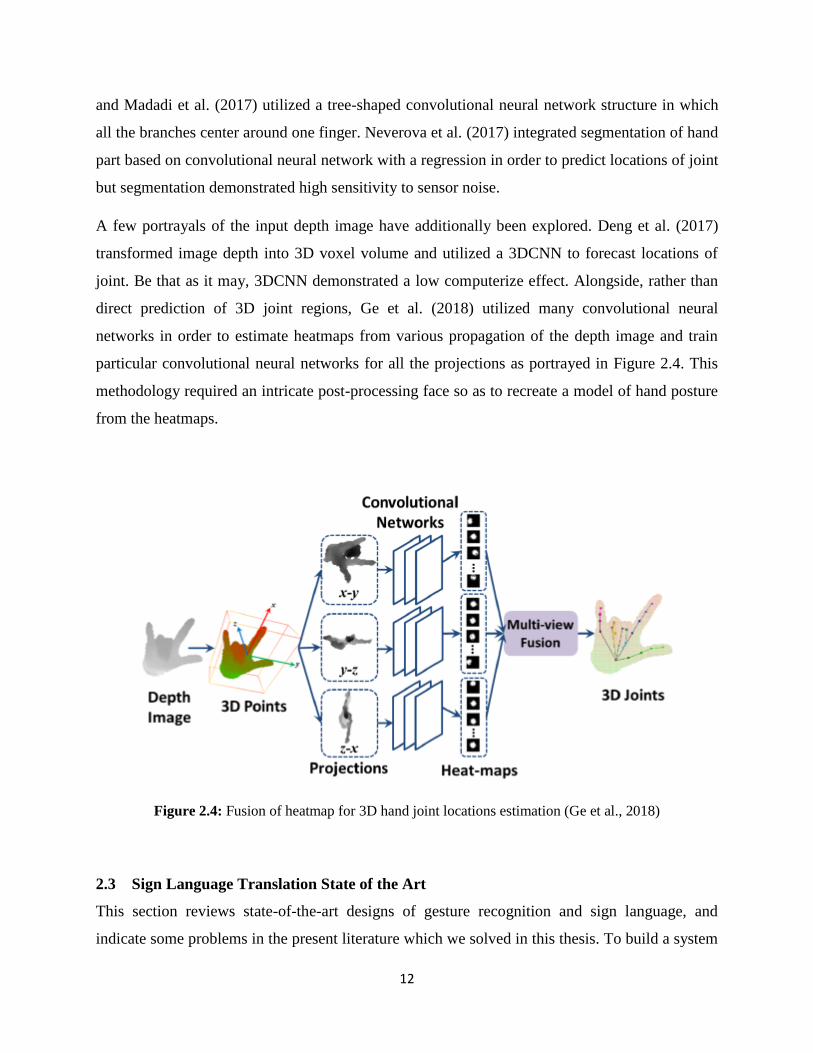


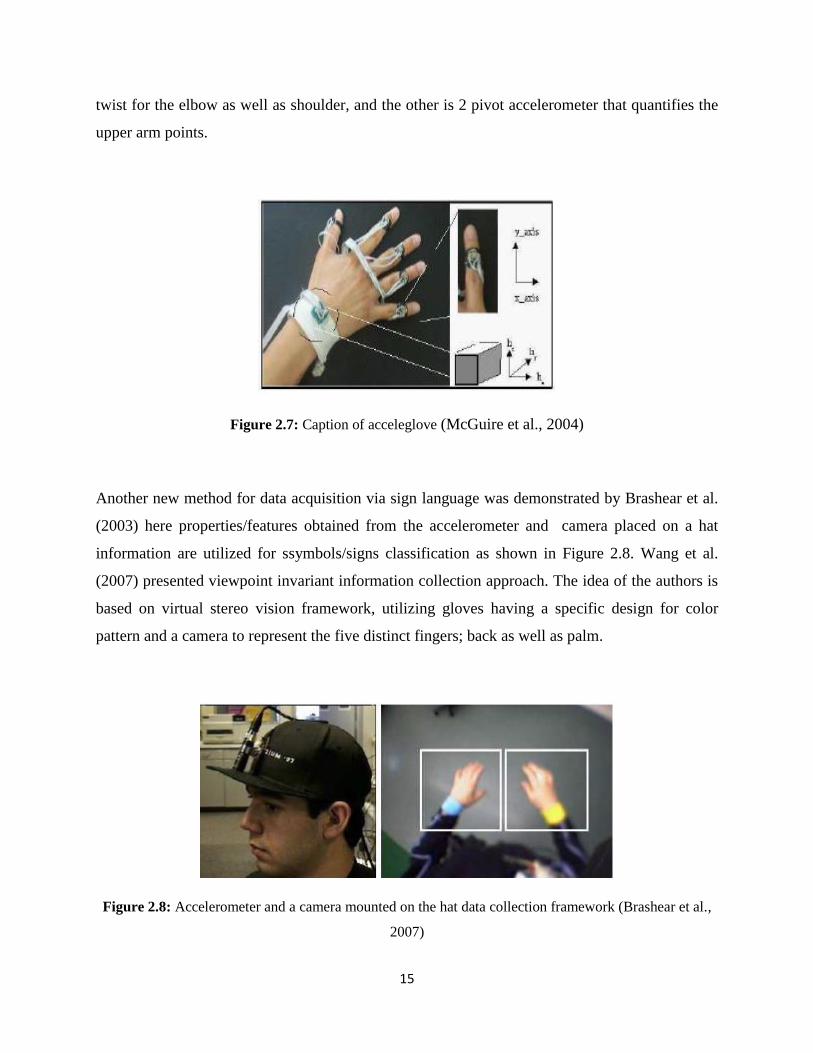
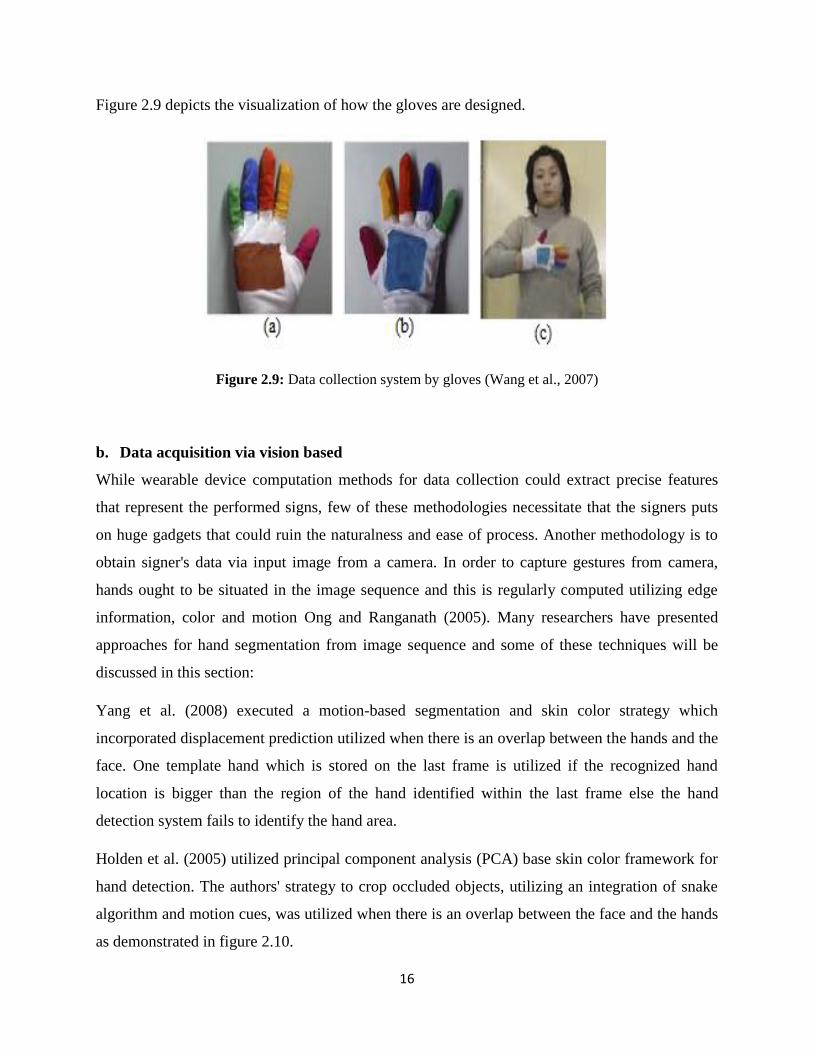
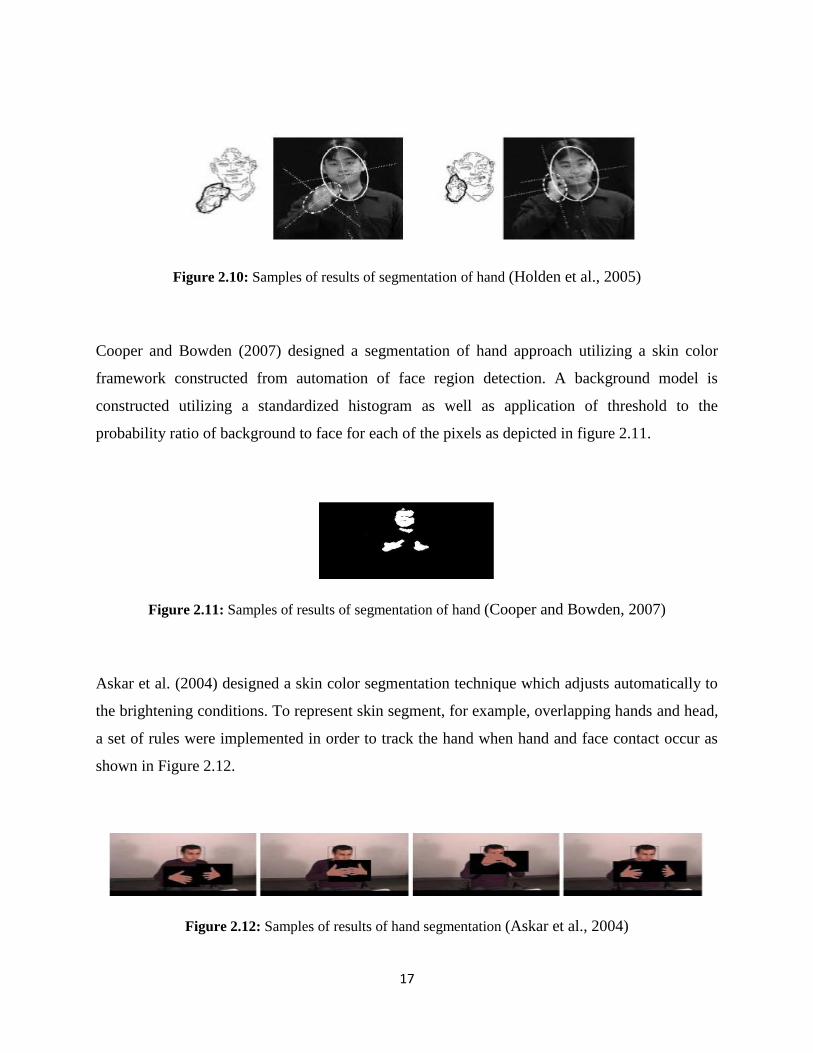
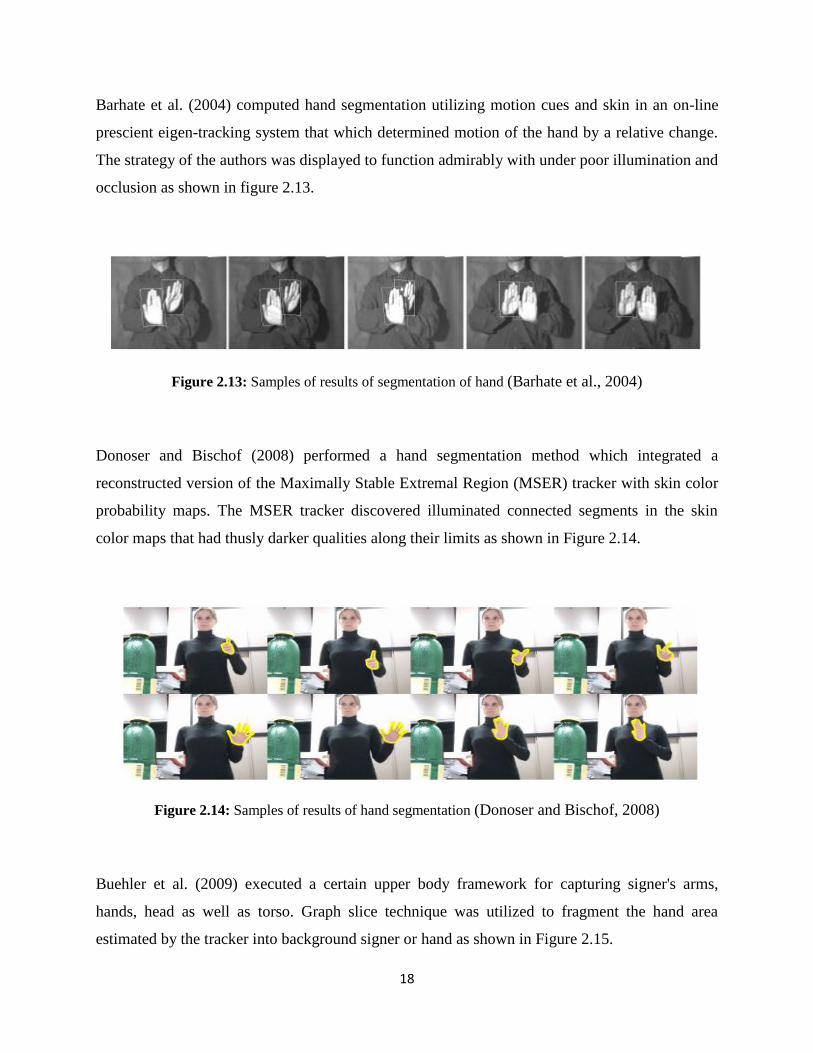


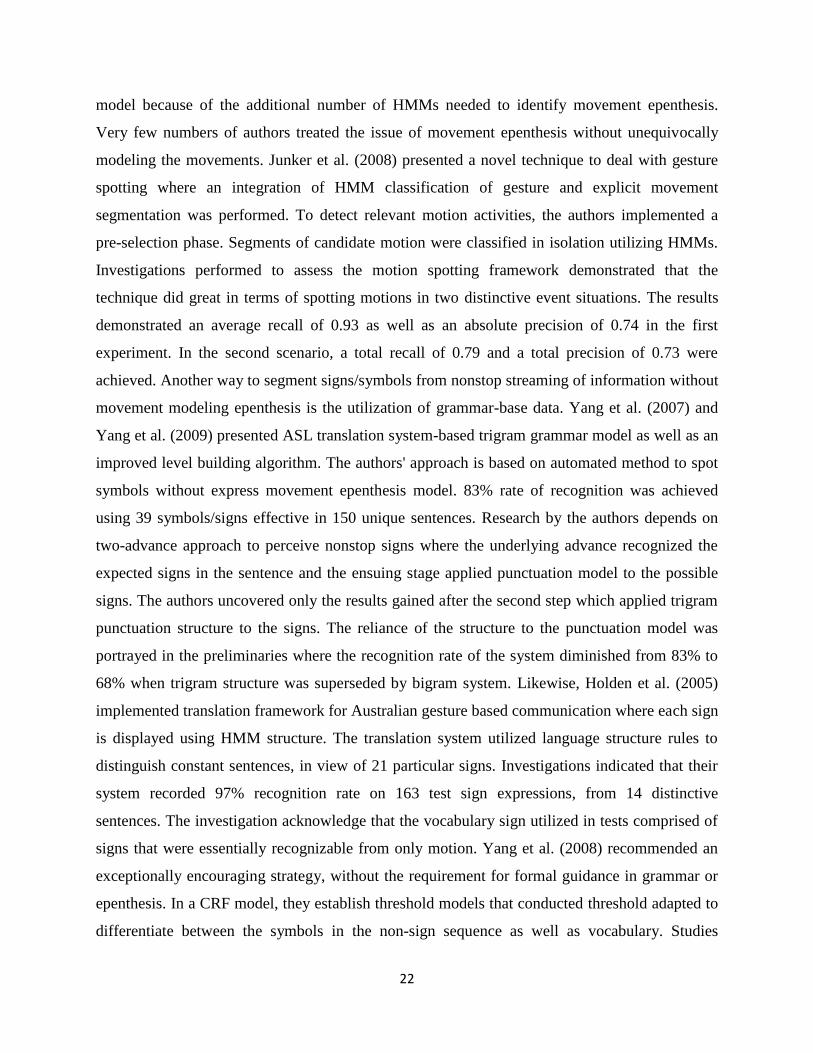


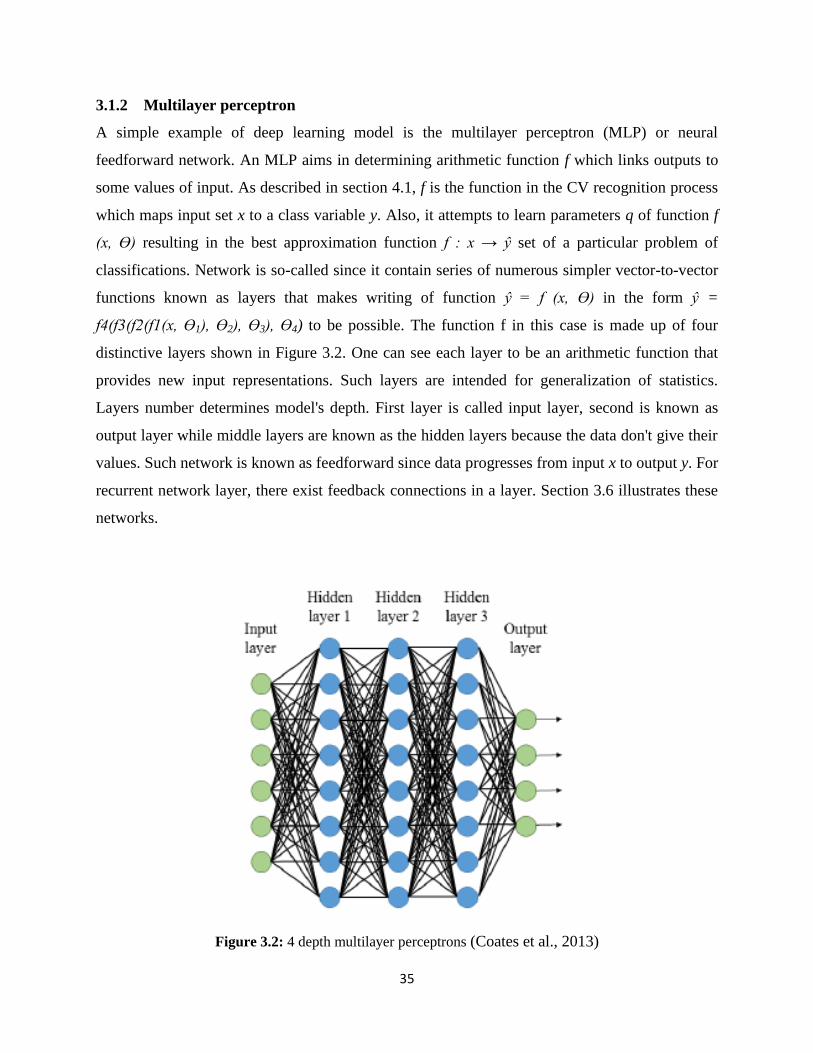
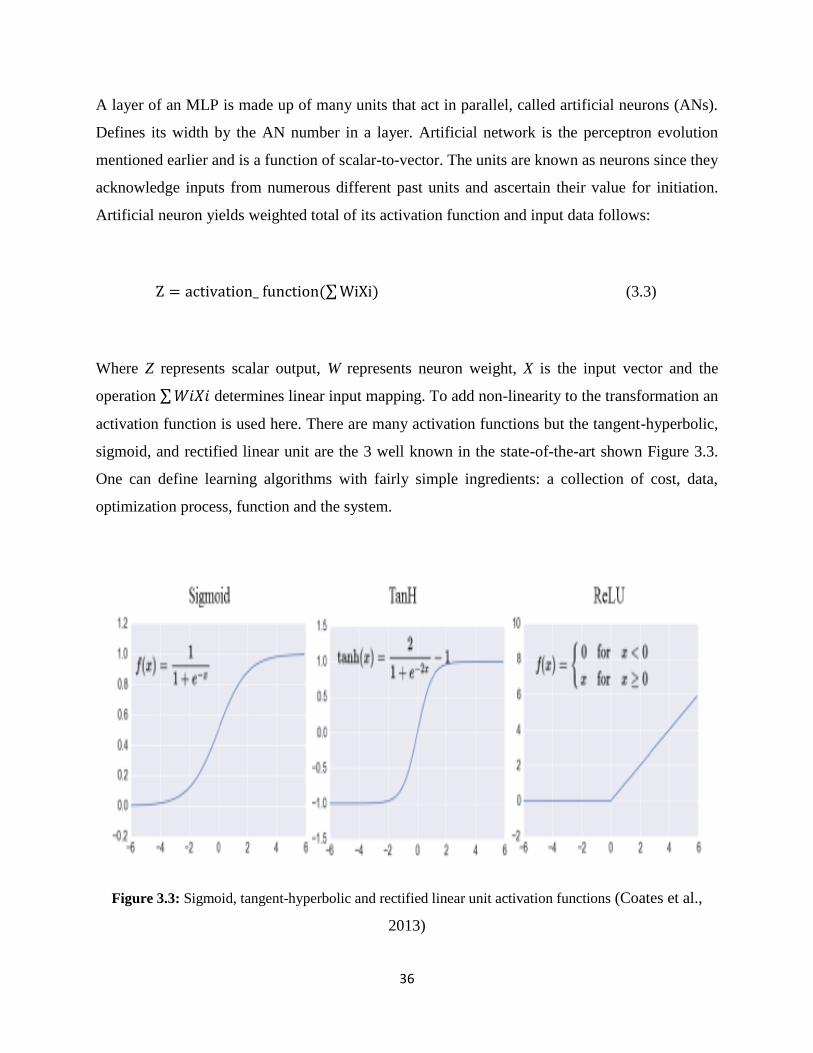

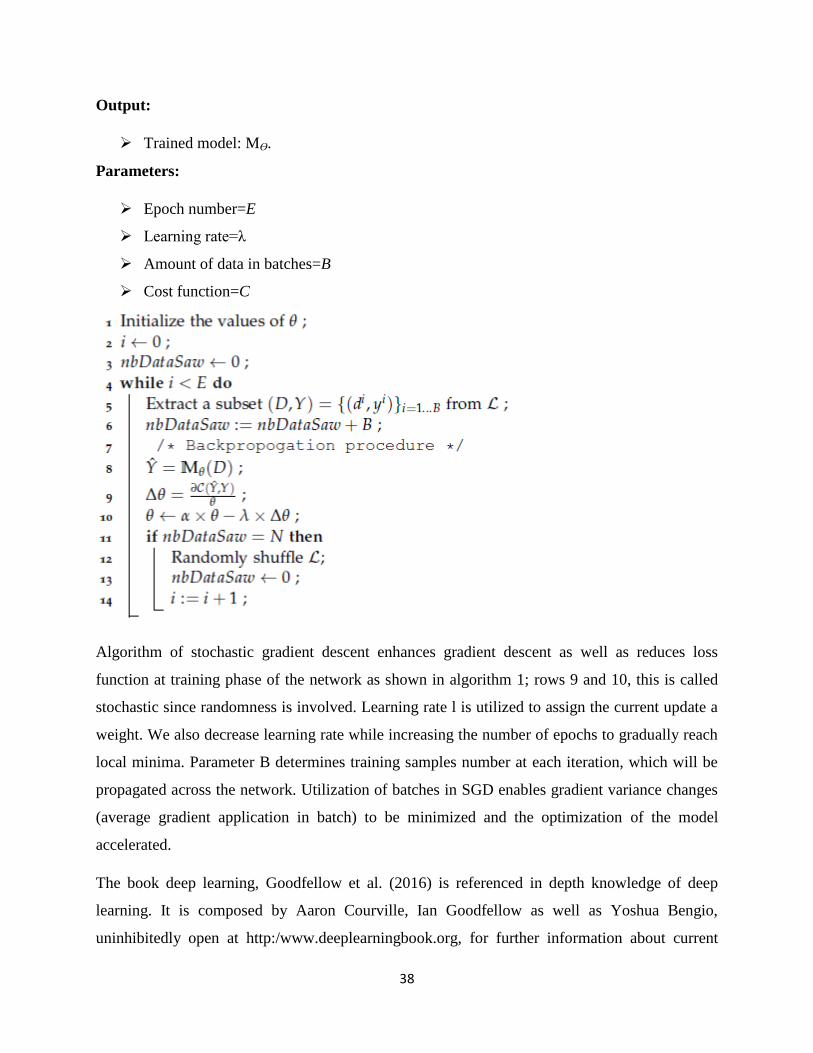


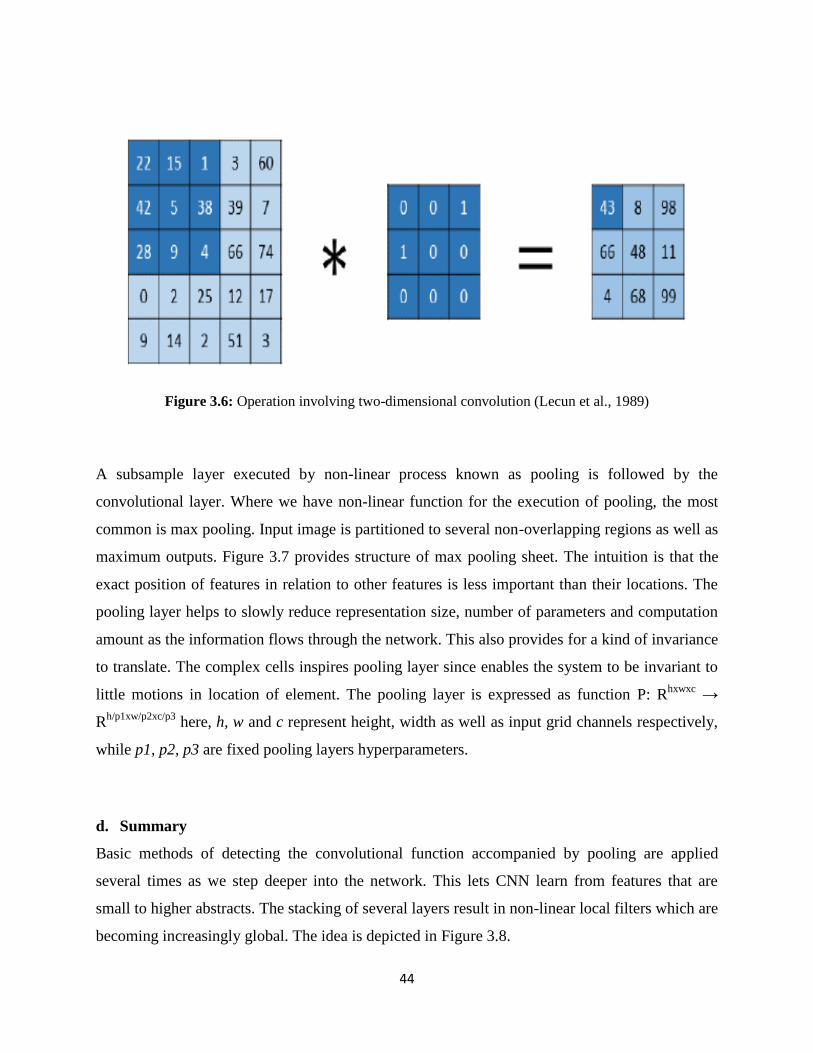

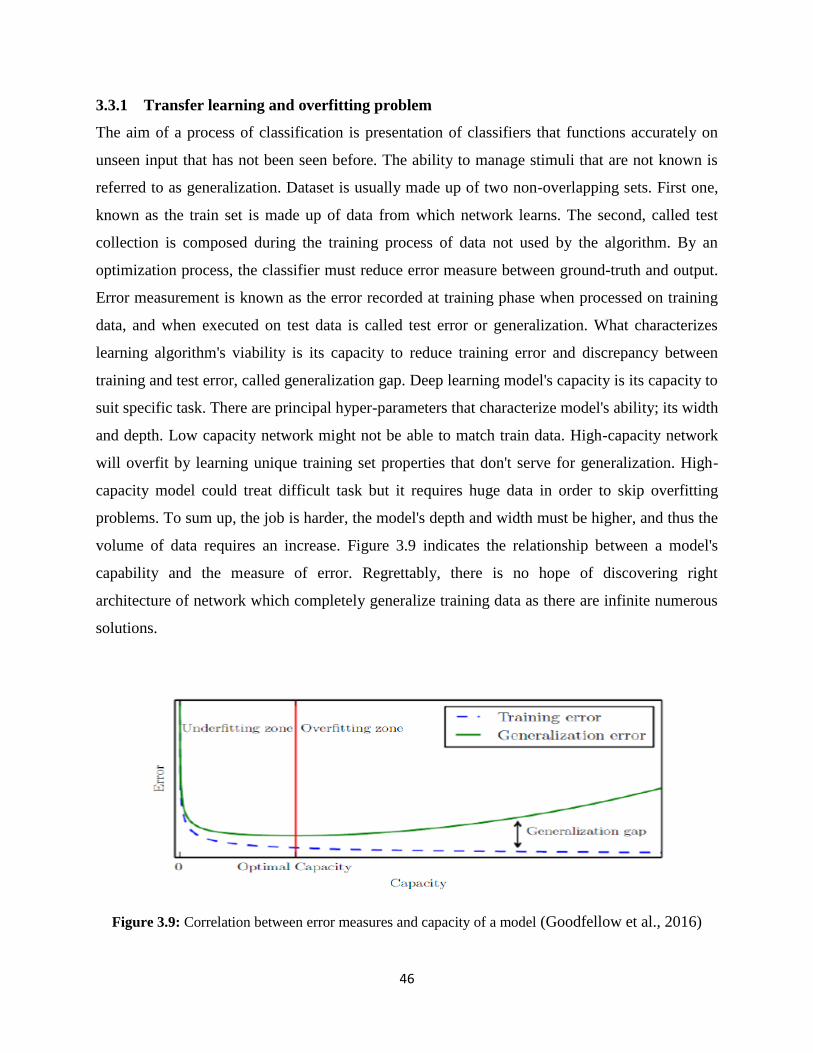


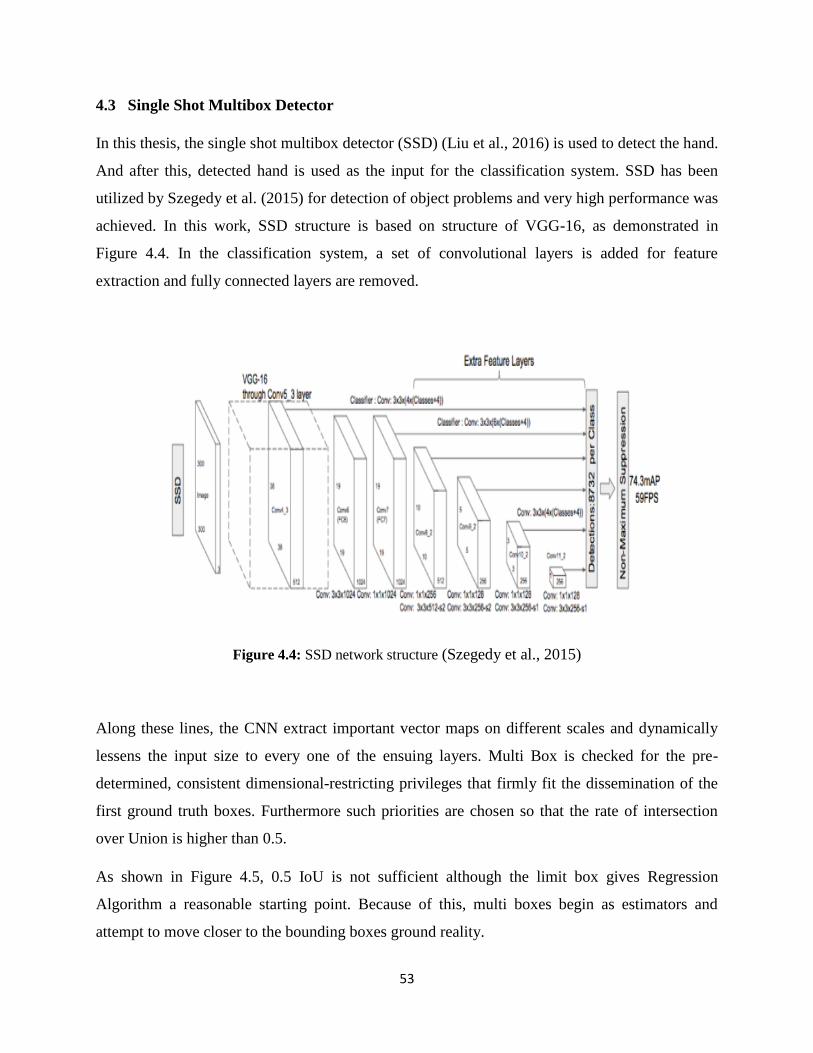


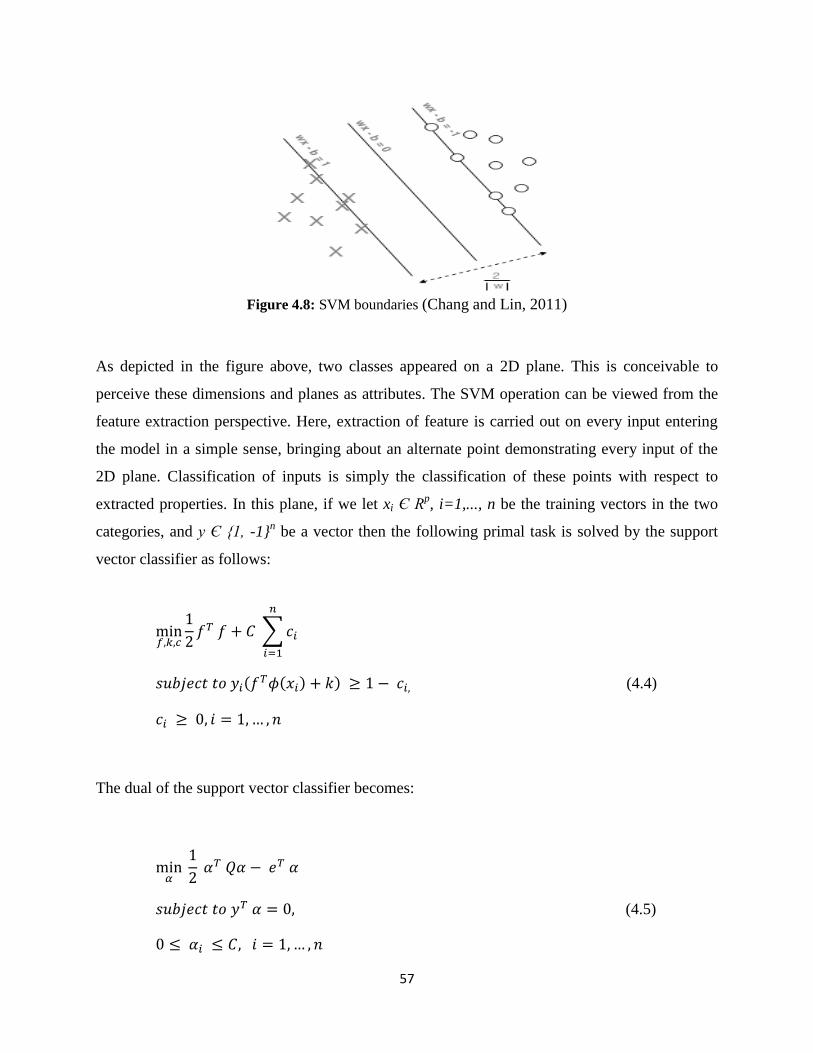

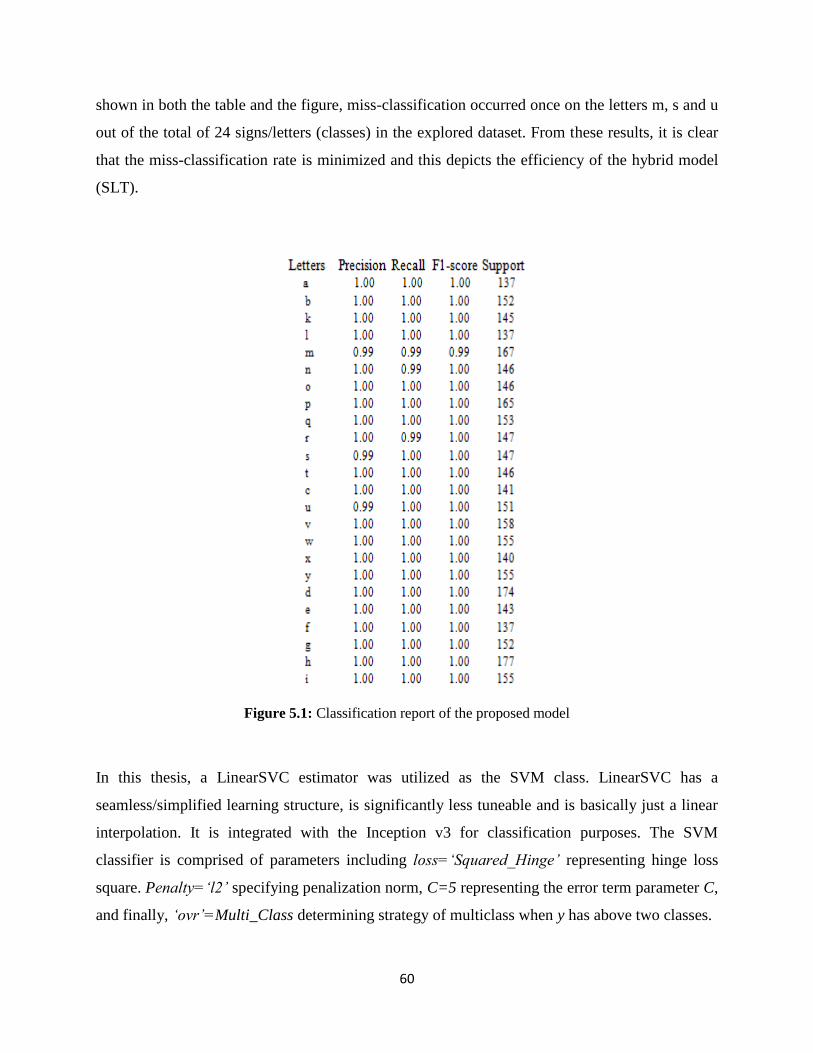
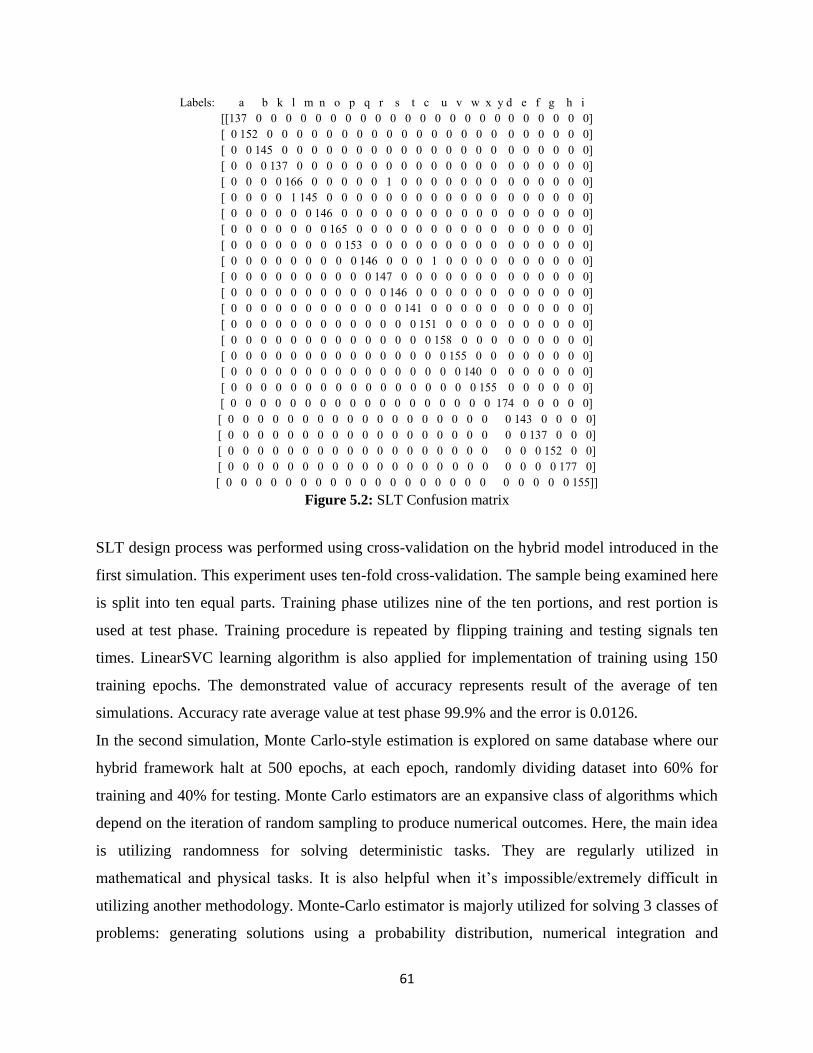


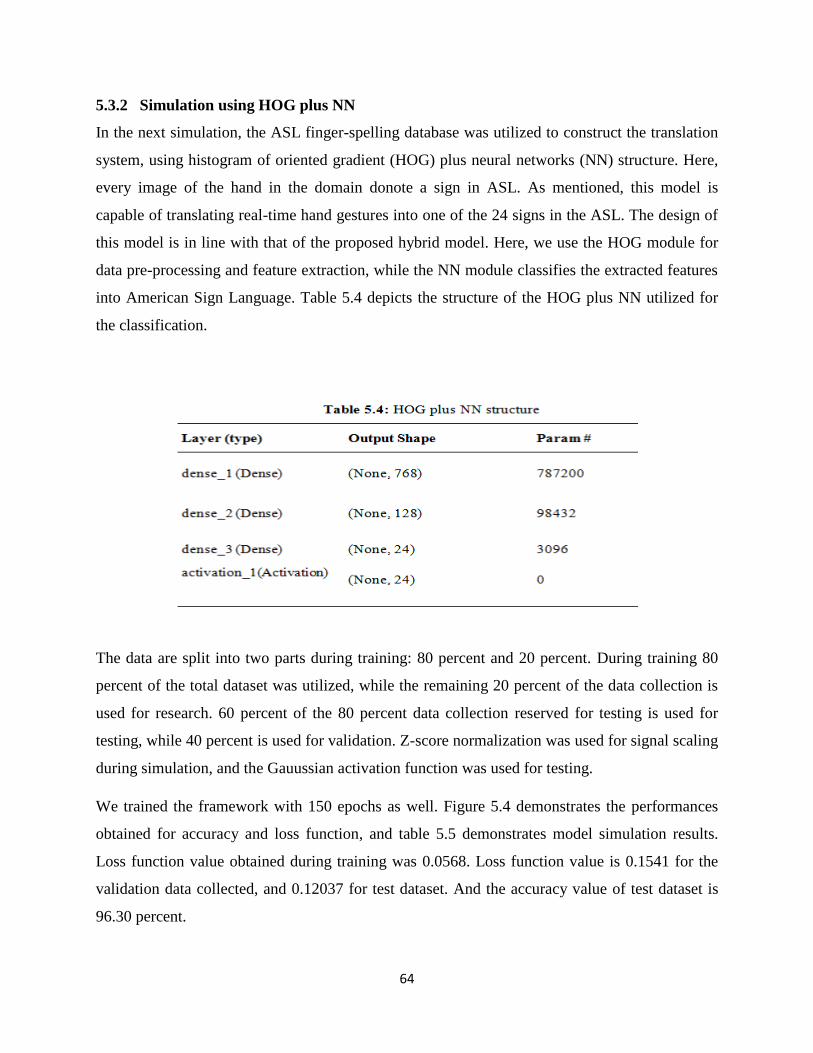


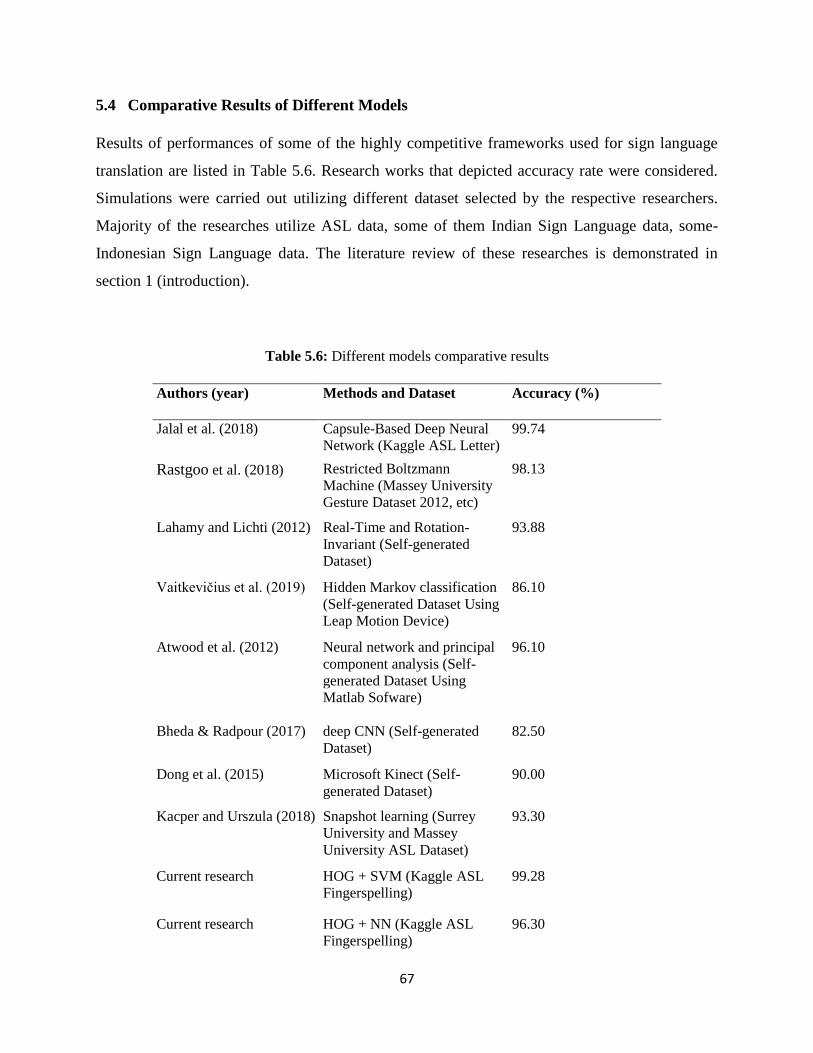
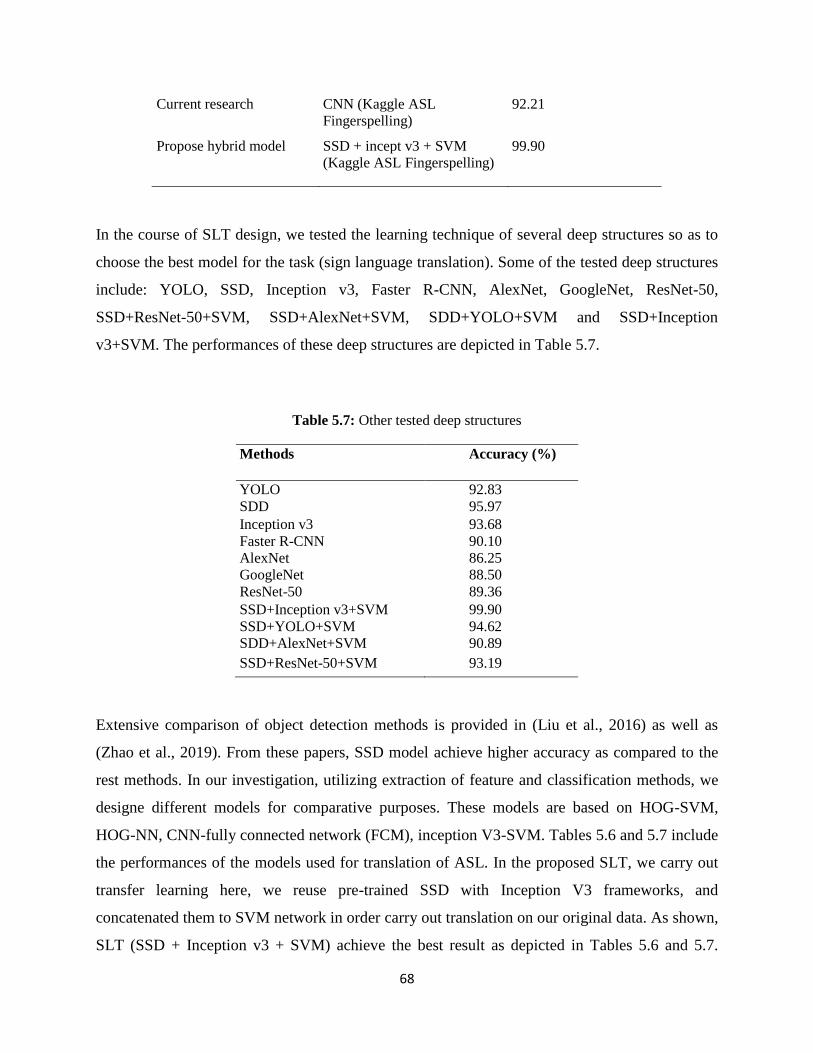


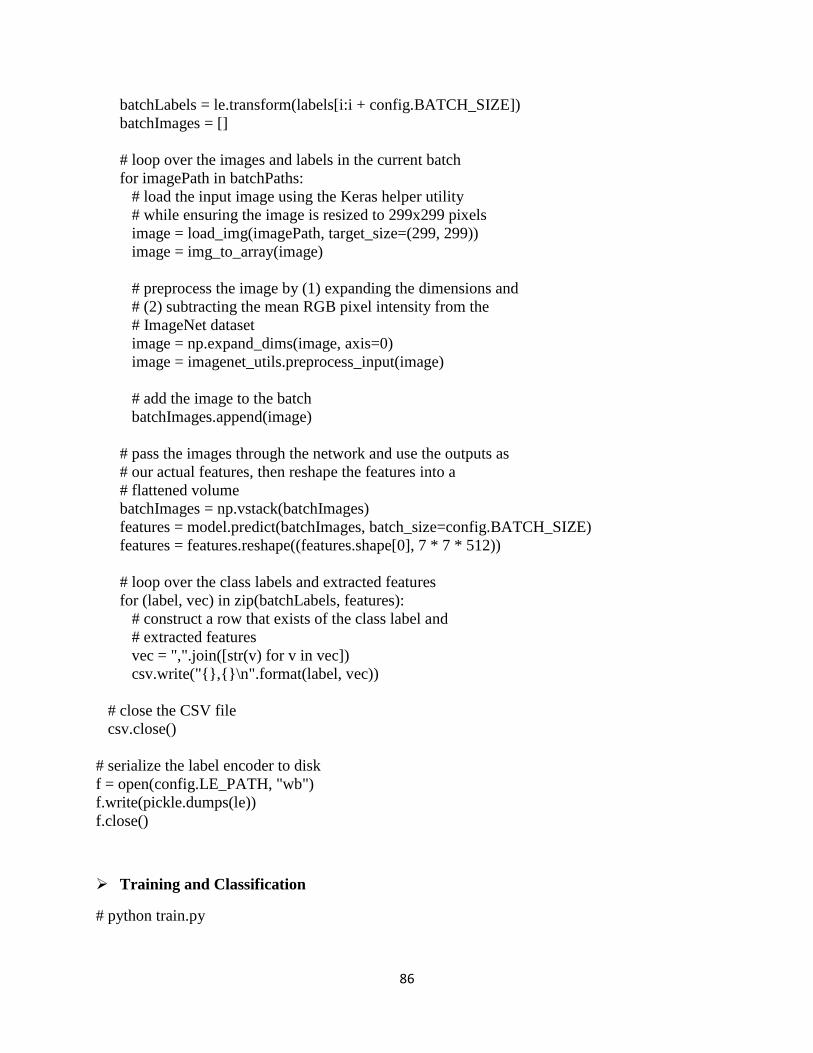


![Literature Review: Analysis of Sign Language Notations for ... · a phoneme in a Sign Language. Vogler [11] goes on to state that a better approach to Sign Language Translation would](https://static.documents.pub/doc/80x56/6043c642bcb6a6539247de93/literature-review-analysis-of-sign-language-notations-for-a-phoneme-in-a-sign.jpg)


