30
KONGSBERG AUTOMOTIVE Third Quarter 2012 1

KONGSBERG AUTOMOTIVEThird Quarter 2012
1

Group highlights for the third quarter
REVENUES
▸ Revenues of EUR 239.0 million, including positive cu rrency effect of EUR 15.5 million
▸ Market outlook for Q4 indicates a revenue level of c a. EUR 245 million
▸ EBITDA of EUR 14.8 million, including restructuring cost of EUR 5.2 million
22
PROFITABILITY
▸ EBITDA of EUR 14.8 million, including restructuring cost of EUR 5.2 million
▸ Driveline, adjusted for restructuring costs, delive red an EBITDA margin of 4.2 % demonstrating an underlying margin improvement
▸ Commercial vehicle segment continued to deliver str ong margins despite weak EU sales
MARKET▸ Continued to experience a positive North American m arket, offset by a slow European market
OPERATIONS▸ Completed closure of the operations in the facility in Dassel, Germany
▸ High level of business wins, EUR 94 million of annu al sales won in the quarter

New business wins last 4 quarters
New business winsEUR Million
▸ High level of quarterly business wins of MEUR 94 pe r annum, confirms good order intake trend
▸ KA needs to secure business wins in the area of 15 % of 94200
250
3
▸ KA needs to secure business wins in the area of 15 % of annual revenue to compensate for expiring programs
121
94
0
50
100
150
200
Q4 2011-Q2 2012 Q3 2012

44
Hans Peter Havdal
OPERATIONAL REVIEW

Q3 2012: Business area overview
INTERIOR DRIVELINE ACTUATION & CHASSISFLUID TRANSFER POWER PRODUCTS
PASSENGER CARS COMMERICAL VEHICLES
5
Market
Safety and comfort related products for vehicle interiors
Gear shift systems for light duty vehicles
Fluid handling systems for passenger cars, industrial and commercial vehicles
Driver control systems and chassis related products to commercial vehicles
Vehicle operator systems for the off-highway vehicle market
5
25%of total
revenues
33%of total
revenues
16%of total
revenues
14%of total
revenues
12%of total
revenues
-2%9%
14% 17%9%
EB
ITD
A-m
argi
n
*
* Including a one-time restructuring cost of EUR 5,2 million

Highlights and performance
▸ Operational update– On-going fixed cost reduction initiative is inline with the plan– All operations closed in Germany and final head count to be phased out in Q4-2012– Improved commercial terms reached with one out of three target customers. Agreements
expected to be reached for the other two in Q4-2012
DRIVELINE
6
expected to be reached for the other two in Q4-2012– These initiatives will gradually improve the underlying profitability of the business area during
Q4-2012
▸ Market & Trends– The US market is still going strong with a 12.4% YoY growth in Q3– EU market continue to be weak, -7.6% YoY– New launches in Q3 of European and Asian programs will strengthen business ahead:
• Automatic Shifter to Jaguar Land Rover with a full year volume of 37.000 vehicles
6

New contract- value EUR 181 million
▸ Contracts within Driveline core segments: Automatic gear shifters and shift by wire systems
DRIVELINE
7
▸ 6 different car models on a new platform in the period between 2015 and 2024
▸ C, D, E segment premium cars in Europe, North America and Asia
▸ Production from KA in Mullsjö, Sweden, likely expanded to Asia
Highlights and performance
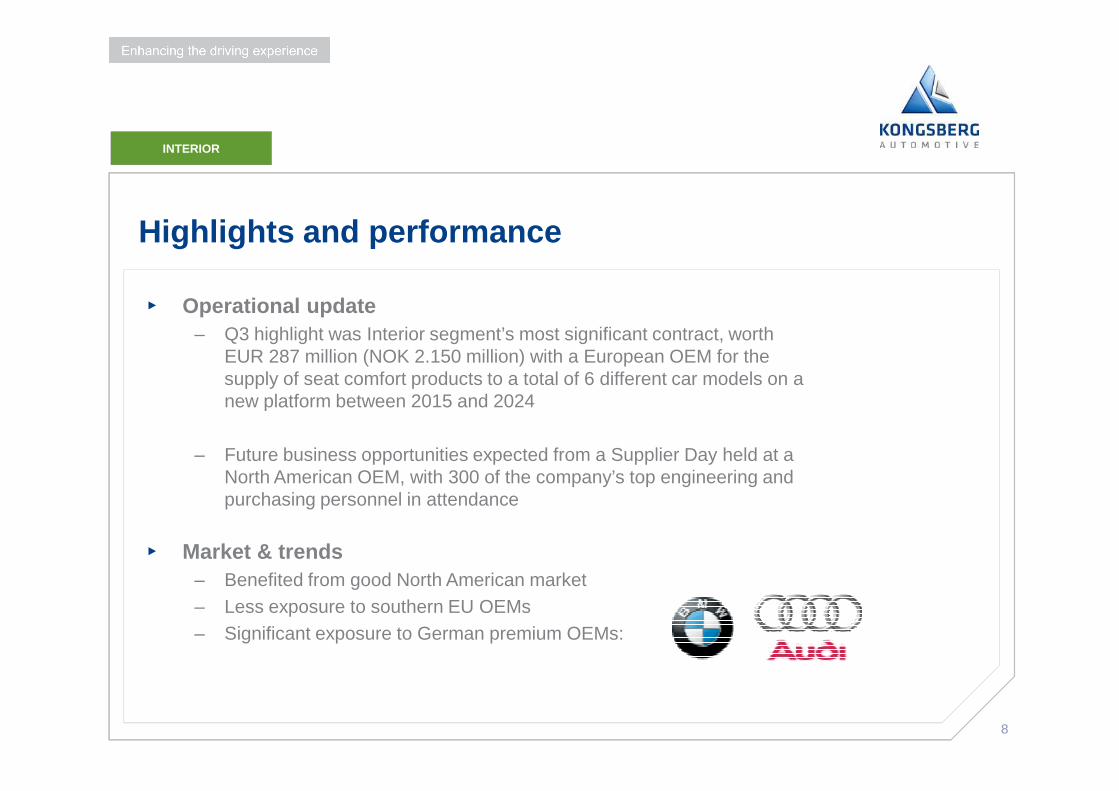
▸ Operational update– Q3 highlight was Interior segment’s most significant contract, worth
EUR 287 million (NOK 2.150 million) with a European OEM for the supply of seat comfort products to a total of 6 different car models on a new platform between 2015 and 2024
INTERIOR
8
new platform between 2015 and 2024
– Future business opportunities expected from a Supplier Day held at a North American OEM, with 300 of the company’s top engineering and purchasing personnel in attendance
▸ Market & trends – Benefited from good North American market– Less exposure to southern EU OEMs– Significant exposure to German premium OEMs:
8

New Contract – value EUR 287 million
▸ Seat comfort products : fixed, adjustable pneumatic lumbar support systems, seat heating, seat cooling ventilation.
▸ European OEM
INTERIOR
9
▸ Same platforms as Driveline contract: 6 different car models on a new platform between 2015 and 2024
▸ SOP: H2 2014 at Pruszkow, Poland
Highlights and performance
ACTUATION & CHASSIS
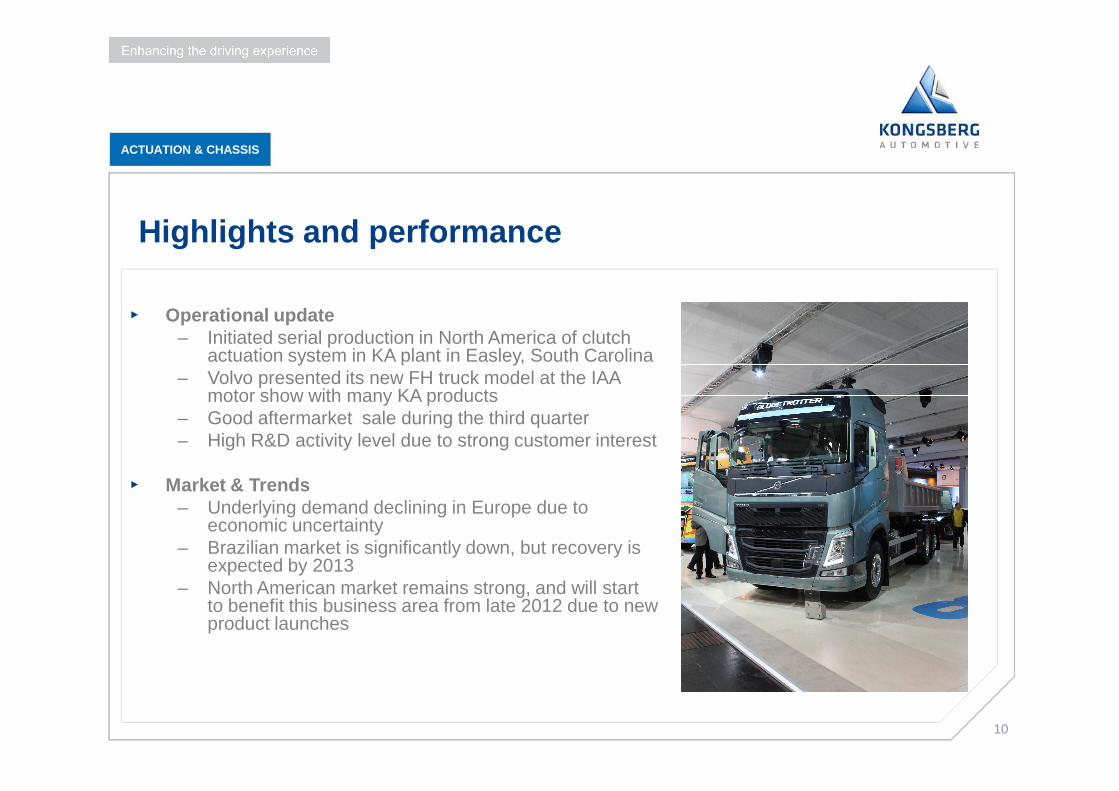
▸ Operational update– Initiated serial production in North America of clutch
actuation system in KA plant in Easley, South Carolina – Volvo presented its new FH truck model at the IAA
motor show with many KA products
10
motor show with many KA products– Good aftermarket sale during the third quarter– High R&D activity level due to strong customer interest
▸ Market & Trends– Underlying demand declining in Europe due to
economic uncertainty– Brazilian market is significantly down, but recovery is
expected by 2013– North American market remains strong, and will start
to benefit this business area from late 2012 due to new product launches

Highlights and performance
FLUID TRANSFER
▸ Operational update– Moved production from Pickens facility to Easley facility
in order to expand capacity and allow for future growth
1111
▸ Market & trends– The North American market remained strong for both
automotive and commercial vehicle segments– European market remains weak as expected – Continue to win new contracts strengthening our position
as an expert niche supplier

Highlights and performance
POWER PRODUCTS
▸ Operational update
– The transfer of production from Italy to Hungary is in the final phase and has been accomplished YTD with minimal negative financial
1212
impacts due to good cost controls and execution.
▸ Market & trends
– New product launches continue to provide revenue growth particularly for the electronic Tier 4 emission standards
– Order trend will continue to closely coincide with general economic conditions
– Weak European market offset by stronger North American market

1313
Trond Stabekk
FINANCIAL UPDATE

Revenue and EBITDA
RevenuesEUR Million
EBITDA and EBITDA MarginEUR Million and percent
23,2
8,7%
7,6%267,8
1414
15,4
14,2
23,2
20,0
14,8
6,7%
5,8%
7,6%
6,2%
Q3 2011 Q4 2011 Q1 2012 Q2 2012 Q3 2012
229,6
246,1
267,8
261,6
239,0
Q3 2011 Q4 2011 Q1 2012 Q2 2012 Q3 2012

58
,8 73
,3
38
,5
41
,1
28
,3
62
,6
82
,0
41
,9
40
,1
30
,2
69
,0
84
,9
39
,2
45
,4
40
,1
67
,3 80
,9
39
,6
45
,8
38
,4
60
,5
80
,1
36
,1
42
,1
29
,8
Segment financials 3rd quarter
Revenues and EBITDA marginEUR Million and percent
15
38
,5
41
,1
28
,341
,9
40
,1
30
,239
,2
45
,4
40
,1
39
,6
45
,8
38
,4
36
,1
42
,1
29
,8
5,6
%
1,3
%
15
,2%
16
,5%
7,3
%
8,5
%
-5,9
%
13
,0%
15
,2%
20
,1%
11
,5%
1,4
%
12
,0%
17
,1%
14
,6%
9,6
%
0,6
%
13
,4%
16
,2%
13
,5%
8,6
%
-2,3
%
16
,9%
14
, %
9,4
%
Interior Driveline Actuation & Chassis Fluid Power Products
15
Q3’
11
Q4’
11
Q1’
12
Q2’
12
Q3’
12
Q3’
11
Q4’
11
Q1’
12
Q2’
12
Q3’
12
Q3’
11
Q4’
11
Q1’
12
Q2’
12
Q3’
12
Q3’
11
Q4’
11
Q1’
12
Q2’
12
Q3’
12
Q3’
11
Q4’
11
Q1’
12
Q2’
12
Q3’
12
Q3’
11
Q4’
11
Q1’
12
Q2’
12
Q3’
12
Q3’
11
Q4’
11
Q1’
12
Q2’
12
Q3’
12
Q3’
11
Q4’
11
Q1’
12
Q2’
12
Q3’
12
Q3’
11
Q4’
11
Q1’
12
Q2’
12
Q3’
12
Q3’
11
Q4’
11
Q1’
12
Q2’
12
Q3’
12

73
,3
82
,0 84
,9
80
,9
80
,1
Driveline profitability
Revenues and EBITDA marginEUR Million and percent
� Adj for restructuring cost the underlying EBITDA margin improved from 1.3 % to 4.2 %
16
73
,3
1,3
%
-5,9
%
1,4
%
0,6
%
-2,3
%
Driveline
16
Q3’
11
Q4’
11
Q1’
12
Q2’
12
Q3’
12
� First wave of effects from implemented improvement actions
� Dassel operations closedAdj 4,2 %
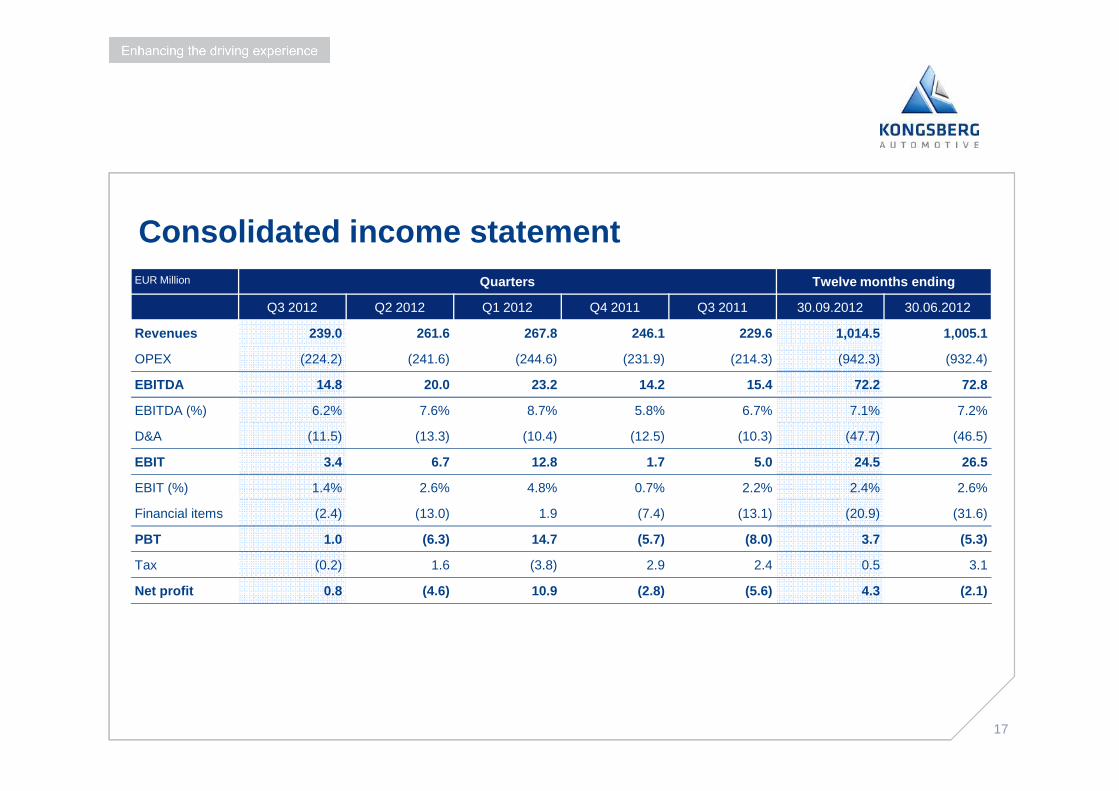
Consolidated income statementEUR Million Quarters Twelve months ending
Q3 2012 Q2 2012 Q1 2012 Q4 2011 Q3 2011 30.09.2012 30.06.2012
Revenues 239.0 261.6 267.8 246.1 229.6 1,014.5 1,005.1
OPEX (224.2) (241.6) (244.6) (231.9) (214.3) (942.3) (932.4)
EBITDA 14.8 20.0 23.2 14.2 15.4 72.2 72.8
1717
EBITDA (%) 6.2% 7.6% 8.7% 5.8% 6.7% 7.1% 7.2%
D&A (11.5) (13.3) (10.4) (12.5) (10.3) (47.7) (46.5)
EBIT 3.4 6.7 12.8 1.7 5.0 24.5 26.5
EBIT (%) 1.4% 2.6% 4.8% 0.7% 2.2% 2.4% 2.6%
Financial items (2.4) (13.0) 1.9 (7.4) (13.1) (20.9) (31.6)
PBT 1.0 (6.3) 14.7 (5.7) (8.0) 3.7 (5.3)
Tax (0.2) 1.6 (3.8) 2.9 2.4 0.5 3.1
Net profit 0.8 (4.6) 10.9 (2.8) (5.6) 4.3 (2.1)

Financial items
▸ First 9 months 2012 Net interest EUR 2.2 million lower compared to same period 2011
Net financial itemsEUR Million
Q2 2011 Q3 2011 Q4 2011 Q1 2012 Q2 2012 Q3 2012
18
▸ FX effects contributing positively by EUR 4.0 million
-5,3 -5,4
-3,9 -3,9-4,5
-5,2
-3,1
-6,7
-2,8
6,7
-5,6
4,0
-0,9
-1,0
-0,7
-0,9
-2,9
-1,2
Other items Currency effects
Net interest Net financial items

Cash flow development
Cash flowEUR Million
14.8
-3.7
1919
77.8 74.5
-3.7
-7.3-4.7
-4.42.0

Available funds and utilization
Available fundsEUR Million
Credit utilizationEUR Million
405390 390
400
450
2020
405390 390
370
328
0
50
100
150
200
250
300
350
Q3 2012 Q4 2012 Q1 2013 Q2 2013
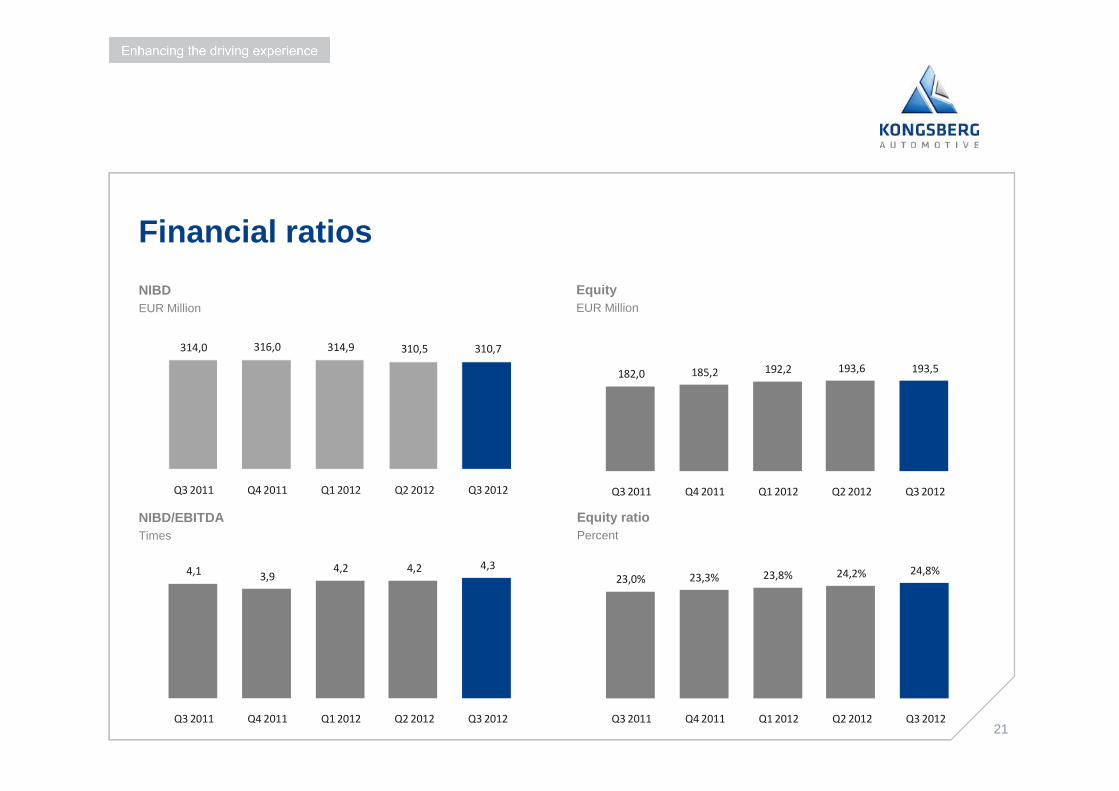
Financial ratios
NIBDEUR Million
Equity EUR Million
314,0 316,0 314,9 310,5 310,7
182,0 185,2 192,2 193,6 193,5
2121
NIBD/EBITDATimes
Equity ratioPercent
Q3 2011 Q4 2011 Q1 2012 Q2 2012 Q3 2012 Q3 2011 Q4 2011 Q1 2012 Q2 2012 Q3 2012
4,13,9
4,2 4,2 4,3
Q3 2011 Q4 2011 Q1 2012 Q2 2012 Q3 2012
23,0% 23,3% 23,8% 24,2% 24,8%
Q3 2011 Q4 2011 Q1 2012 Q2 2012 Q3 2012

2222
Philippe Toth
MARKET UPDATE

Production and revenue growth (YoY change)
North America
CV production growth * -0.5 %
LV production growth ** 12.4 %
KA revenue growth*** 7,9 %
Europe
CV production growth * -9.5 %
LV production growth ** -7.6 %
KA revenue growth*** -11,2%
2323
* CV: Commercial Vehicles (GVW>6t) estimates by LCM** LV: Light Vehicle (GVW<6t) estimates by LCM***: adjusted for currency effect
Worldwide
CV production growth * -2.7 %
LV production growth ** 2,4 %
KA revenue growth*** -2.7 %
Asia
CV production growth * 2.3 %
LV production growth ** 4.6 %
KA revenue growth*** 3,4%

Light vehicle production – 2012 forecast
▸ Total production– Total production revised down from 82
million to 81,7 millions vehicles in 2012 mainly due to the weak European and
Light vehicle production: revised world estimates ( ch Y/Y)
12,0%
14,0%
24
mainly due to the weak European and South American market
▸ Production growth– The global production of light vehicles is
expected to grow by 7 to 6 % in 2012– In Europe, LV production in Q4 is expected
to decline by 7.9%– In all other regions, LV production in Q4 is
expected to grow
24Source: LMC Automotive – October 2012
0,0%
2,0%
4,0%
6,0%
8,0%
10,0%
2012Q1 2012Q2 2012Q3 2012Q4 2012 2013 2014 2015 2016
World new (Oct) World old (July)
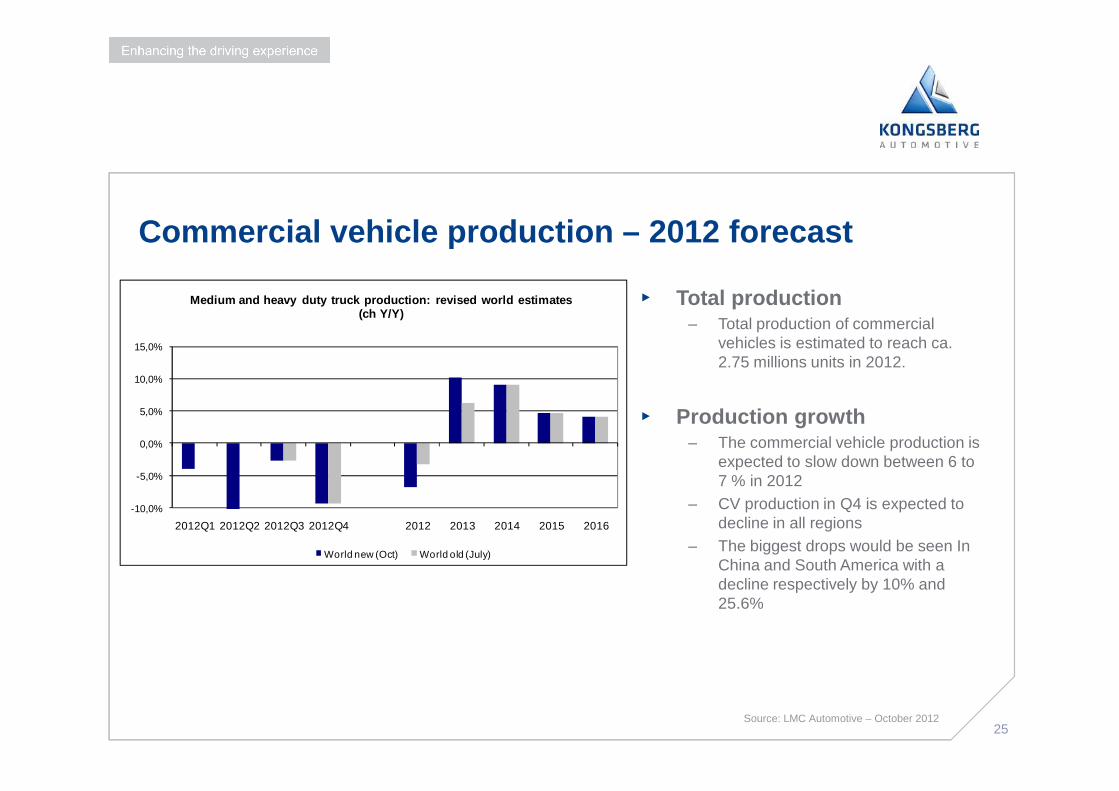
Commercial vehicle production – 2012 forecast
▸ Total production– Total production of commercial
vehicles is estimated to reach ca. 2.75 millions units in 2012.
10,0%
15,0%
Medium and heavy duty truck production: revised wor ld estimates (ch Y/Y)
25
▸ Production growth– The commercial vehicle production is
expected to slow down between 6 to 7 % in 2012
– CV production in Q4 is expected to decline in all regions
– The biggest drops would be seen In China and South America with a decline respectively by 10% and 25.6%
25Source: LMC Automotive – October 2012
-10,0%
-5,0%
0,0%
5,0%
2012Q1 2012Q2 2012Q3 2012Q4 2012 2013 2014 2015 2016
World new (Oct) World old (July)

2626
Hans Peter Havdal
SUMMARY AND OUTLOOK

Summary and outlook
▸ KA expects revenue of approx. EUR 245 million for Q4 2012
▸ Four out of five business areas are performing 250
300
Company outlook for Q4 2012EUR Million
27
▸ Four out of five business areas are performing well
▸ Driveline is improving and remains the main focus
245 246
0
50
100
150
200
250
Q4-2012 Q4-2011
27

Capital Markets Day, November 6
▸ Venue– At KA HQ in Kongsberg
▸ Program– Presentations by management
28
– Presentations by management– Lunch– Visit to R&D/Test center– Q&A session
▸ Transportation– Bus departs Vika Atrium at 0745h– Return to Vika Atrium by 1430h
▸ Registration– E-mail to [email protected] by
Oct. 31.
28

2929
QUESTIONS & ANSWERS
3030
THANK YOU FOR YOUR ATTENTION


