163
Ko’olaupoko Watershed Restoration Action Strategy Kailua Bay Advisory Council (KBAC) -June 2007- Hawai‘i’s Department of Health ASO Log No. 05-080 Finalized Plan
Ko’olaupoko Watershed Restoration Action Strategy Kailua Bay Advisory Council (KBAC)
-June 2007-
Hawai‘i’s Department of Health ASO Log No. 05-080 Finalized Plan

Table of Contents
Acknowledgement…………………………………………………………………..i Executive Summary…………………………………………………………………ii Acronyms……………………………………………………………………………vi Definitions…………………………………………………………………………...viii Chapter I: Introduction
A. General Landscape…………………………………………………. 1-1 B. Purpose of WRAS………………………………………………….. 1-2 C. EPA’s Nine Elements……………………………………………… 1-4 D. Methods………………………..……………………………………1-5 E. Limitations of WRAS……………………………………………… 1-10
Chapter II: Watershed Summaries
A. Introduction………………………………………………………… 2-1 B. Waimanalo Watershed………………………………………………2-6 C. Kailua Watershed……………………………………………………2-20 D. Kane’ohe Watershed………………………………………………...2-41 E. Southern Kane’ohe Watershed……………………………………....2-41 F. Northern Kane’ohe Watershed………………………………………2-67
Chapter III: Technical and Financial Needs
A: Estimated Implementation Costs…………………………………….3-1 B. Technical and Financial Assistance…………………………….........3-4 C. Prioritizing Watershed Restoration Opportunities:…………………..3-7
Chapter IV: Watershed Monitoring Strategy
A. Introduction………………………………………………………… 4-1 B. Monitoring Questions………………………….................................4-1 C. Monitoring Goals and Objectives………………………………….. 4-2 D. Types of Monitoring……………………………………………….. 4-4 E. Priority Areas………………………………………………………. 4-8
Chapter V: Public Participation, Outreach and Education A. Introduction………………………………………………………… 5-1 B. Members…………………………………………………….………5-1 C. Meetings……………………………………………………………. 5-2 D. Staffing…………………………………………………………….. 5-2 E. Education……………………………………………………………5-3
Appendices: A. Community Meeting Notes

B. Nonpoint Source Pollution and Erosion Comparison Tool (N-SPECT) C. References List of Figures: Figure I-1: Watershed Diagram……………………………………………………..1-2 Figure I-2: Ko‘olaupoko Moku…………………………………………………….. 1-3 Figure II-1: Watershed Impervious Cover…………………………………..............2-3 Figure II-2: Percent Impervious Surface for Ko’olaupoko Watersheds…………….2-4 Figure II-3: Stream Pollutants…………………………………………………….. 2-5 Figure II-4: Waimanalo Region…….……………………………………………… 2-9 Figure II-5: Waimanalo Watershed…………………………………………………2-12 Figure II-6: Waimanalo Riparian Restoration and Preservation……………………2-14 Figure II-7: Waimanalo Land Use…………………………………………………. 2-15 Figure II-8: Waimanalo Stream……………………………………………………. 2-16 Figure II-9: Waimanalo TMDL Load Allocation………………………………….. 2-18 Figure II-10: Waimanalo Management Recommendation Table………………….. 2-19 Figure II-11: Kailua Region……………………………………………………….. 2-22 Figure II-12: Kailua Geographical Locations……………………………………… 2-23 Figure II-13: Ka’elepulu Watershed……………………………………………….. 2-25 Figure II-14: Land Use within 100m of Ka’elepulu Stream……………………..... 2-28 Figure II-15: Kawainui Watershed……………………………………………….... 2-30 Figure II-16: Kawainui Land Use………………………………………………….. 2-31 Figure II-17: Maunawili Riparian Restoration and Preservation………………….. 2-34 Figure II-18: Kawainui Marsh………………………………………………………2-35 Figure II-19: Kapa’a Stream TMDL Load Allocation: Dry Season……………….. 2-36 Figure II-20: Kapa’a Stream TMDL Load Allocation: Wet Season………………. 2-37 Figure II-21: Kailua Management Recommendation Table………………………. 2-39 Figure II-22: South Kane’ohe Region…………………………………………….. 2-44 Figure II-23: Kawa Watershed…………………………….……………………….. 2-46 Figure II-24: Load Reductions Required to Achieve Kawa Stream TMDLs…….... 2-50 Figure II-25: Kane’ohe Watershed …………………………………………………2-51 Figure II-26: Kane’ohe Land Use …………………………………………………. 2-54 Figure II-27: Upland Erosion………………………………………………………. 2-54 Figure II-28: Kea’ahala Watershed………………………………………………… 2-55 Figure II-29: Kea’ahala Stream…..…………………………………………………2-58 Figure II-30: He’eia Watershed……………………………………………………..2-59 Figure II-31: He’eia Fishpond………………………………………………………2-60 Figure II-32: He’eia Land Use……………………………………………………... 2-62 Figure II-33: He’eia Riparian Restoration and Preservation………………………..2-63 Figure II-34: South Kane’ohe Management Recommendation Table……………... 2-65 Figure II-35: North Kane’ohe Region……………………………………… ……... 2-70 Figure II-36: Kahalu’u Watershed…………………………………………………. 2-72 Figure II-37: Kahalu’u Land Use…………………………………………………... 2-74 Figure II-38: Waihe’e Watershed………………………………………………….. 2-75 Figure II-39: Waihe’e Land Use…………………………………………… ……... 2-77

Figure II-40: Municipal Sewer Lines………………………………………………. 2-78 Figure II-41: Ka’alaea Watershed………………………………………………….. 2-80 Figure II-42: Ka’alaea Land Use……………………………………………………2-82 Figure II-43: Waiahole Watershed…………………………………………………. 2-84 Figure II-44: Waiahole Land Use………………………………………………….. 2-86 Figure II-45: Waiahole Riparian Restoration and Preservation……………………. 2-87 Figure II-46: North Kane’ohe Management Recommendation Table……………... 2-91 Figure III-1: Restoration or BMP Prioritization Sheet ……………………………. 3-9 Figure III-2: Prioritization Matrix …………………………………………………. 3-10 Figure IV-1: Waimanalo Monitoring Matrix………………………………………. 4-9 Figure IV-2: Kailua Monitoring Matrix……………………………………………. 4-10 Figure IV-3: Kane’ohe Monitoring Matrix………………………………… ……... 4-11 Figure V-1: Storm Drain Painting…………………………………………………..5-4
i
The Kailua Bay Advisory Council would like to thank the Hawai‘i Department of Health for funding this project and their staff for valuable feedback, especially Hudson Slay who provided endless technical support and advice. KBAC would also like to thank all the community members, agency staff and others who provide tireless comments and insight into this project, attended meetings and provided supporting documents. Specifically, KBAC would like to thank the current Board of Directors who consistently supported this project: Dr. Andrew Brittain, Scott Derrickson, Paul Friel, Jeffrey Harris, Mark Heckman, Snookie Mello, David Nagamine and Toby Rushforth. Sincere acknowledgement is also extended to KBAC Executive Director Todd Cullison, former KBAC Executive Director Maile Bay, current fiscal administrator Judy Nakamura and the Center for a Sustainable Future’s Dr. James R. Gaines and C. Barry Raleigh, the dynamic Duke University GIS duo of Neoma Lavalle and Miranda Smith and consultants, staff and interns including: John Goody, Christina Speed, Christina Anderson, Kia Okiwe, Peregrine Edison-Lahm, and Tiana Sudduth. MAHALO
Cover photo: Courtesy of Christina Speed

ii
Executive Summary The purpose Watershed Restoration Action Strategy (WRAS) is to serve as the master plan for the Kailua Bay Advisory Council (KBAC) and provide direction for implementation of Best Management Practices (BMPs), restoration, monitoring, education and outreach in the Ko’olaupoko area of windward O’ahu Hawai‘i. The WRAS integrates the Environmental Protection Agency (EPA) nine-priority elements to assess watershed health. Specifically, objectives for the WRAS are to:
guide KBAC and other community organizations and agencies in future implementation projects. KBAC will take an active role in implementing actions recommended in the WRAS as well as forge partnerships with other community organizations for implementation, education and monitoring;
serve as a planning tool that Ko‘olaupoko communities can use to improve water
quality for their watershed area; and
address the State of Hawai‘i’s watershed planning criteria as required for a WRAS for the Ko‘olaupoko watershed region.
As an approved WRAS, projects identified within the plan are given priority consideration (to the extent practical) for funding under the State’s 319(h) program established pursuant to the federal Clean Water Act. The WRAS attempted to review previously collected water quality data and literature, identify possible non-point pollution sources and provide management measure to help reduce the sources, all in an attempt to met state and federal water quality standards.
A. Watershed Summaries Each sub-watersheds (20 total) for the four major basins (Waimanalo, Kailua, South and North Kaneohe) have a watershed summary based on literature review and landscape features analyzed with GIS. The summaries highlight pollutants on the 303 (d) list, environmental impacts, management recommendations and management measures. Similar issues are found throughout the various watersheds in the Ko’olaupoko area such as nutrient, Total Suspended Solids (TSS), and turbidity. However, some of theses problems originate via different sources and therefore have different management measures for addressing the problems. Each sub-watershed has management recommendation based on literature and data review, watershed analysis, and professional judgment. Management measures are tied directly to watershed problems listed on the 303 (d) list and concerns raised in community meetings, discussions with agency representatives and state and federal prioritizes. B. Management Recommendations
iii
Waimanalo (303 (d) list: nutrients, turbidity and Suspended Solids) Management recommendations:
Implement farm management plans; Implements cesspool replacement; Implement riparian restoration; Riparian preservation and restoration; and Implement habitat restoration below Kalaniana’ole Highway in
Waimanalo Stream.
Kailua (303 (d) list: nutrients, turbidity, Suspended Solids, metals and trash) Management recommendations:
Implement TMDL recommendations; Implement street sweeping; Implement storm water catchment and recycling; Implement BMP on storm drains leading to Enchanted Lake; Implement stream clean-ups; Implement upland restoration; and Create partnership opportunities for Kawai Nui Marsh Restoration.
South Kane‘ohe (303 (d) list: nitrite/nitrate, nutrients, turbidity, Suspended Solids and trash) Management recommendations:
Implement TMDL is Kawa Stream; Implement Riparian Restoration; Deliver education to homeowners for BMP implementation; Implement upland restoration; Implement street sweeping; Riparian preservation and restoration; and Implement storm water catchments and recycling.
North Kane‘ohe (303 (d) list: nitrite/nitrates, total nitrogen, nutrients and turbidity) Management recommendations:
Implement upland restoration; Implement riparian restoration; Implement cesspool replacement; Riparian reservation and restoration; and Implement farm management plans.
C. Watershed Monitoring

iv
In addition to implementation of management measures, monitoring is a significant aspect of this plan to assess current watershed health, track changes over time and determine if projects are effective at addressing their intended purpose. Monitoring is recommended for all water bodies which are on the 303 (d) list as well as a basins and parameters of priority. The monitoring strategy is based on the understanding that the streams in the Ko’olaupoko area are extremely flashy (raise and fall with storm events very quickly) and to capture these events, automated samplers are needed throughout the various watersheds to capture sediment loads, TSS and record turbidity. Monitoring is recommended for water chemistry, habitat assessments, biological integrity and fish contaminant assessment in Enchanted Lake and tributaries Several of these monitoring activities will build on past monitoring efforts such as Total Maximum Daily Loads (TMDL) (Waimanalo and Kawa Streams), habitat assessments (Waimanalo) and biological assessment monitoring (Waimanalo, Kane‘ohe and Kawa Streams). Other monitoring activities will assess baseline conditions, particularly in the northern extents of the watershed (Waiahole, Waianu, Waikane and Hakipu‘u). Lastly, monitoring is recommended for future BMP/restoration activities to assess if projects are having positive impacts to watershed health.
D. Technical and Financial assistance The technical and financial assistance section is meant to provide a rough estimate of the cost to implement projects as well as possible sources of funding. Costs for implementation are estimated on past projects, discussions with contractors, and professional judgment. As important to the estimated cost of project implementation, each project suggests associated project elements, which include, but are not limited to the following:
Staffing; Permitting; Archeological monitoring; Project effectiveness monitoring; Travel; Office supplies; and Fiscal administration
Local and national community foundations as well as state and federal agencies are noted as possible funding sources for implementation of projects, monitoring and community outreach and education. This list is not exhaustive but will provide other community organizations implementing these activities a place to begin to seek grant funds.
E. Community Outreach

v
Engaging the community to take ownership and responsibility for the restoration of watershed is a key component to implementing the recommendations of this plan. A mechanism of involving stakeholders in the active participation of natural resource management is possible via the adoption of a Watershed Council model. For Watershed Councils to have the greatest opportunity for success, they should be locally organized, voluntary, non-regulatory groups established to improve the condition of watersheds in their local area The Ko‘olaupoko area should establish four Watershed Councils including: Waimanalo, Kailua, South and North Kane‘ohe. This allows members in each area to focus on local priority projects without being over-shadowed by other councils, differing priorities or additional outside pressures. Each Council should seek acknowledgment from local Neighborhood Boards as a lead community entity into the planning process of watershed restoration and natural resource management. The Watershed Councils should seek at a minimum membership/participation from the following segments of the population:
Interested citizens/community members; Private Landowners; Ag producers; County, State and Federal land management/natural resource agencies
(DLNR, Board of Water Supply, NOAA Fisheries, Soil and Water Conservation Districts, etc.)
Commercial and Recreational Fishers; Academia; Elected officials; and Private Industry.
This cross-section of the community will ensure the Councils have balanced interest represented and draw from different expertise and disciplines. Additionally, it will facilitate the sharing of information, limit duplication of efforts and maximize limited funding for watershed education, monitoring and restoration projects.

vi
F. Acronyms
BMP: Best Management Practice
CCAP: Coastal Change Analysis Program
CSC: Coastal Services Center
CWA: Clean Water Act
DDT: Dichloro-Diphenyl-Trichloroethane
DEM: Digital Elevation Map
DO: Dissolved Oxygen
EPA: US Environmental Protection Agency
GIS: Geographic Information System
ICM: Impervious Cover Model
KBAC: Kailua Bay Advisory Council
DOH: Department of Health (State of Hawaii)
KEY Project: Kualoa-He’eia Ecumenical Youth Project
NGO: Non-governmental agency
NH4: Ammonia
NOAA: National Oceanic and Atmospheric Administration
NPS: Non-point source (pollution)
NRCS: Natural Resources Conservation Service
NSPECT: Non-point Source Pollution and Erosion Comparison Tool
DLNR: Department of Land and Natural Resources (State of Hawaii)
OHA: Office of Hawaiian Affairs
PCB: Polychlorinated Biphenyl
pH: Potential of Hydrogen (A measure of acidity/alkalinity)
PRISM: Parameter –elevation Regression on Independent Slopes Model
TMDL: Total Maximum Daily Load
TSS: Total Suspended Solids
USACE: US Army Corps of Engineers
USDA: US Department of Agriculture
USFWS: US Fish and Wildlife Service

vii
USGS: US Geological Survey
WPDG: Wetland Program Development Grants
WRAS: Watershed Restoration Action Strategy
COE: Corp of Engineers (US Army Corp of Engineers)
CCH: City and County of Honolulu

viii
Definitions Best Management Practices (BMP): Best Management Practices (BMPs) are effective, practical, structural or nonstructural methods which prevent or reduce the movement of sediment, nutrients, pesticides and other pollutants from the land to surface or ground water, or which otherwise protect water quality from potential adverse effects of land-based activities. Chlorophyll a. A green pigment found in photo synthetic organisms. It plays a key role in the light-dependent reactions of photosynthesis, which convert sunlight into usable chemical energy. By measuring the abundance of chlorophyll A, scientists can use it as an indicator of the amount of algae present in a water body. Enterococci: An indicator organism used to assess the presence of human pollution (as distinct from animal pollution) in waterways or the sea. In bodies of water, the acceptable level of contamination is very low, for example in the state of Hawaii, with among the strictest tolerances in the United States, the limit for water off its beaches is 7 forming colonies per 100 ml of water, above which the state may post warnings to stay out of the ocean. In 2004, Enterococcus spp. took the place of fecal coliform as the new federal standard for water quality at public beaches. It is believed to provide a higher correlation than fecal coliform with many of the human pathogens often found in sewage.
Georeferencing: Georeferencing refers to how data is related to positions in the real world, or to locations in other datasets.
Nitrogen: Nitrogen is required by all organisms for the basic processes of life. It is very common and found in many forms in the environment.
Phosphorus: Phosphorus is a nutrient required by all organisms for the basic processes of life. It is a natural element found in rocks, soils and organic material. Phosphorus clings tightly to soil and is used by plants, so its concentrations in clean waters is generally very low. However, phosphorus is used extensively in fertilizer and other chemicals, so it can be found in higher concentrations in areas of human activity. Many seemingly harmless activities added together can cause phosphorus overloads.
PRISM :Parameter-elevation Regressions on Independent Slopes Model an analytical tool that uses point data, a digital elevation model, and other spatial data sets to generate gridded estimates of monthly, yearly, and event-based climatic parameters, such as precipitation, temperature, and dew point. PRISM is uniquely designed and constantly updated to map climate in the most difficult situations, including high mountains, rain shadows, temperature inversions, coastal regions, and other complex climatic regimes.
TMDL: A TMDL or Total Maximum Daily Load is a calculation of the maximum amount of a pollutant that a waterbody can receive and still meet water quality standards, and an allocation of that amount to the pollutant's sources. Water quality standards are set
ix
by States, Territories, and Tribes. They identify the uses for each waterbody, for example, drinking water supply, contact recreation (swimming), and aquatic life support (fishing), and the scientific criteria to support that use. A TMDL is the sum of the allowable loads of a single pollutant from all contributing point and non-point sources. The calculation must include a margin of safety to ensure that the waterbody can be used for the purposes the State has designated. The calculation must also account for seasonal variation in water quality. The Clean Water Act, section 303, establishes the water quality standards and TMDL programs.
Total Phosphorus: Total phosphorous is a measure of all the various forms of phosphorus (dissolved and particulate) found in water.
Total Nitrogen: Nitrogen exists in water in many forms, including inorganic, organic, dissolved and particulate. Total nitrogen is a measure of all forms of dissolved and particulate nitrogen present in a water sample.
Total Suspended Solids: TSS are solids in water that can be trapped by a filter. TSS can include a wide variety of material, such as silt, decaying plant and animal matter, industrial wastes, and sewage. High concentrations of suspended solids can cause many problems for stream health and aquatic life. Turbidity: Turbidity is a measure of the cloudiness of water- the cloudier the water, the greater the turbidity. Turbidity in water is caused by suspended matter such as clay, silt, and organic matter and by plankton and other microscopic organisms that interfere with the passage of light through the water. Turbidity is closely related to total suspended solids (TSS), but also includes plankton and other organisms.

WRAS, Kailua Bay Advisory Council 1- 1
Chapter I. Introduction
A. General Landscape People often ask, “What yardstick should be used to measure water quality?” The Federal Clean Water Act uses a common sense benchmark--water should be “swimmable and fishable.” One should feel safe swimming in the water and eating fish caught in the water. The actions recommended in this plan aim to restore a sense of stewardship for the ‘aina (land), wai (fresh water), and kai (ocean waters), provide direction for KBAC, state and federal agencies and community groups, as well as attain the legal goals and requirements of the Clean Water Act. From the earliest days, freshwater, as well as the ocean, has been one of the most important natural resources of native Hawaiians. Hawaiians call freshwater wai, and consider it sacred. Water is so valuable that Hawaiians also use the sacred word “wai” for wealth. Thus, when expressing abundance and prosperity, Hawaiians say waiwai. With waiwai meaning wealth, it naturally follows that the traditional Hawaiian land tenure system used the stream, or kahawai, as its core. Hawaiian communities lived in land divisions called ahupua‘a, often defined by natural watershed boundaries. Although different ahupua‘a varied in shape and size, each ahupua‘a included mauka (mountain) to makai (ocean) sections, including the land and water in between the mountain and coastal reef area. Each ahupua‘a shared a common feature: a stream. Streams fed by springs and rains in the mountains flowed through the plains or wetlands, and emptied into the sea, providing the people living in the ahupua‘a with abundant food and water. Today, many people have become disconnected from the land and its water resources. As a result, few streams in Hawai‘i are respected and cared for as they once were. In re-educating themselves about the relationship between land and water and learning how their activities have impacted their water quality and ecosystems, individuals and communities have turned to watershed management as a tool to help restore their environment. This plan uses a contemporary watershed management approach to focus on water quality and other watershed processes while using and incorporating such Hawaiian terms as, “Ahupua‘a,” defined by Marion Kelly as:
“... a large land division, oriented mauka-makai, ‘from the mountains to the sea,’ and under the Hawaiian system of land-use rights the people living within each ahupua‘a had access to all the necessities of life. Thus the system guaranteed its tenants a degree of economic independence, their needs being supplied by forest land, taro and sweet potato areas, and fishing grounds.”

WRAS, Kailua Bay Advisory Council 1- 2
A “watershed” is the drainage area that empties into a major body of water (figure I-1). An ahupua‘a often mirrors a watershed or several sub-watersheds. There are 11 ahupua‘a in the entire Ko‘olaupoko region–nine in Kane‘ohe watershed and one each for the Kailua and Waimanalo watersheds. A watershed can also include sub-watersheds defined by the drainage areas of tributary streams, which can have separate names from the major stream and the ahupua‘a. Using more contemporary methods of dividing the Ko’olaupoko moku (region), the watershed is divided into four major drainage areas: Waimanalo, Kailua, North and South Kane‘ohe with 20 sub-watersheds (figure I-2). Figure: I-1 Watershed Diagram
Source: Honolulu Board of Water Supply
B. Purpose of Watershed Restoration Action Strategy (WRAS) The purpose of the new WRAS is to update the 2002 Ko‘olaupoko Water Quality Action Plan that served as the master plan for the Kailua Bay Advisory Council (KBAC) and provided direction for implementation activities focused on non-point source (NPS) pollution. Updating the 2002 WRAS is done in part to address new elements for which the Environmental Protection Agency (EPA) has outlined as priority elements not taken into consideration in the previous version. Specifically, objectives for the WRAS are to:
guide KBAC, state and federal agencies and other community organizations and agencies in future implementation projects. KBAC will take an active role in implementing actions recommended in the WRAS as well as forge partnerships

WRAS, Kailua Bay Advisory Council 1- 3
with other community organizations and agencies for implementation, education and monitoring;
Figure I-2, Ko‘olaupoko Moku

WRAS, Kailua Bay Advisory Council 1- 4
serve as a tool that Ko‘olaupoko communities can use to improve water quality for their watershed area; and
address the State of Hawai‘i’s watershed planning criteria as required for a
WRAS in the Ko‘olaupoko watershed region. As an approved WRAS, projects identified within the plan are given priority consideration for funding under the State’s 319(h) program established pursuant to the federal Clean Water Act approved by DOH in August, 2002.
C. EPA’s Nine Elements The following nine elements established by the EPA were used as guidelines to complete the WRAS for the Ko’olaupoko moku. Descriptions of the nine elements are adopted from EPA language. 1. Identification of Causes & Sources of Impairment; An identification of the causes and sources or groups of similar sources that will need to be controlled to achieve the pollution load reductions estimated in the WRAS. 2. Expected Load Reductions; An estimate of the pollution load reductions expected for the management measures described in element #1. 3. Proposed Management Measures; A description of the non-point source (NPS) management measures that will need to be implemented to achieve the pollution load reductions estimated in element #2. 4. Technical and Financial Assistance Needs; An estimate of the amounts of technical and financial assistance needed, associated costs, and/or the sources and authorities that will be relied upon, to implement management measures in element #3. 5. Information, Education, and Public Participation Component; An education component that will be used to enhance public understanding of the project and encourage their early and continued participation in selecting, designing, and implementing the NPS management measures and watershed restoration. 6/7. Schedule and Milestones; A schedule for implementing the NPS management measures identified in this plan that is reasonably expeditious. A description of interim, measurable milestones for

WRAS, Kailua Bay Advisory Council 1- 5
determining whether NPS management measures or other control actions are being implemented. 8. Load Reduction Evaluation Criteria; A set of criteria that can be used to determine whether load reductions are being achieved over time and substantial progress is being made towards attaining water quality standards. 9. Monitoring Component. A monitoring component to evaluate the effectiveness of the implementation efforts over time, measured against the criteria established under element #8.
D. Methods
Sub-basin Assessment Protocols To assess each of the 20 sub-basins within the Ko‘olaupoko area of O‘ahu, a variety of tools were utilized including: Geographical Information System (GIS) analysis, water quality data, scientific documents from academia, private consulting firms, non-governmental organizations (NGOs), community input and professional judgment. This section is meant to describe the methods used to assess the sub-basins and subsequent management recommendations. Literature Review: KBAC reviewed water quality data, stream habitat assessments, bio-assessments and other natural resource literature as it pertained to NPS pollution and general watershed science. Documents originated from a variety of sources including: state/federal agencies, private consulting firms, University of Hawai‘i, Hawai‘i Pacific University, Windward Community College and other non-government agencies Water quality reports were reviewed for specific information on water quality limitations, data gaps and any future monitoring recommendations. Stream habitat assessments were utilized to provide an understanding of habitat conditions, origins of potential problems (i.e erosion) and any site specific restoration recommendations. Data from previously conducted monitoring efforts were used for sub-basin summaries and management recommendations. Certain streams and sub-basins, such as Waimanalo, have more available data and literature which provided more background into the problems, therefore providing more detailed management measures for implementation. Geographical Information System (GIS) GIS was used to assess the landscape of the Ko‘olaupoko moku and associated sub-basins. The majority of the data for land use such as zoning, originated from the State of Hawai‘i’s Office of Planning (http://www.hawaii.gov/dbedt/gis/). Still other data originated from the City and County of Honolulu Department of Planning and Permitting

WRAS, Kailua Bay Advisory Council 1- 6
(http://gis.hicentral.com/). Data from these sources allowed KBAC to assess various landscape attributes such as population density, road density, watershed development. Analyses were conducted to determine amount of development/impervious surface within each sub-watershed. This was conducted by using two different units of measurements—high intensity development and low intensity development. High intensity development is defined as having 75% or greater impervious surface, while low intensity development is defined as having 25-74% development. Following this analysis, a stream layer was laid over top and spatially analyzed to determine the amount of roads within each sub-basin and within 100 meters of streams. Population within each sub-basin was calculated using the 2000 Census data and represented spatially across the watershed to understand where population densities are the greatest. Land use was mapped and analyzed to help determine how various activities might have an impact on water quality within each sub-basin. Land use/Land cover layers had 10 land use categories listed, of which 5 were viewed as having potentially the most impact to water quality:
High intensity development Low intensity development Wetlands Agriculture Forestry Other (steep slope shrub/scrub, unconsolidated shoreline, grasslands, palustrine
emergent wetland and water) The following are the types of land use analysis and GIS mapping conducted:
Land cover/land use • High/low intensity development; • Conservation land; • Ag lands; • Development within 100 meters of streams; and • Street Density.
Population
• 2000 Census
General mapping • Soils (highly erodible, potentially erodible, non potentially erodible, and
unknown); • Critical Habitat; • Wetlands; and • Altered stream channel
WRAS, Kailua Bay Advisory Council 1- 7
Watershed Modeling (Non-point Source Pollution and Erosion Comparison Tool, NSPECT)
• Estimates the amount of pollutants (nutrients, phosphorus, sediment, etc) within the Ko‘olaupoko area.
Community involvement: KBAC hosted two public meetings in all four major watersheds (8 meetings total) to gain a greater understanding of watershed problems from local residents, natural resource managers, academic institutions and other knowledgeable community members. This information was reviewed and incorporated into the WRAS when appropriate (see appendix A). Additionally, KBAC met with several community members individually to gain a greater understanding of watershed issues and complexities. Based on these initial meetings, continued community involvement and support is needed to move into implementation of management recommendations.
Watershed Modeling: Computer watershed modeling was used to determine the
areas most likely contributing to and receiving the most impacts from NPS pollutants such as nutrients, turbidity or suspended solids, based on land use, landscape, soils, hydrology, rainfall and other factors (see appendix B).
Groundtruthing: Upon completing the aforementioned tasks, any questions
regarding data integrity, landscape discrepancies or questionable land use analysis were groundtruthed to ensure an accurate representation in mapping and watershed analysis. Groundtruthing required site visits, field reconnaissance or other means of verifying habitat. This was performed mainly during the accuracy assessment to determine land use/land cover. When land use did not accurately represent on-the-ground usage, it was updated to increase the accuracy of the assessment. This was not possible in all situations because of access issues, staff limitations and time constraints.
The WRAS conceptually divides the Ko‘olaupoko moku into four watersheds: Waimanalo, Kailua, South Kane‘ohe and North Kane‘ohe. For each watershed, the WRAS is divided into natural drainages or sub-watershed summaries which provide the following information:
Sub-basin watershed summaries; Identified Pollutants; Environmental Impacts (Health and Human Safety, Economic Resources and
Recreation); Management Recommendations; Implementation Feasibility; and Measurable Milestones.

WRAS, Kailua Bay Advisory Council 1- 8
Sub-basin summaries provide landscape information such as stream length and gradient, maximum watershed elevation, watershed size, population and identified pollutants on the 303 (d) list. The identified pollutant section provides information on any known pollutants on the 303 (d) list, whether the pollutants have known sources and if not, the confidence in knowing, based on literature reviews, GIS landscape analysis and community input, the source of pollutants. “Environmental impacts” focuses on any known impacts to health and human safety, economic resources and recreation. Management recommendations provide opportunities and ideas to implement projects that directly address the pollutant(s) source(s). Recommendations are based on literature review of documents such as TMDLs, community feedback, previously implemented projects and professional judgment. Lastly, implementation feasibility discusses hurdles to project implementation and project efficacy. To further assess watershed condition NSPECT was completed to help determine areas where management measured could be implemented (see appendix B for additional information). NSPECT was implemented to model watershed pollutants and help highlight areas which might be high in erosion or concentrations of nutrients, for example. This data, albeit limited, is also used for management recommendations. Management recommendations were based information from literature and data review and GIS analyses of landscape features. For example, the Northern Kane‘ohe watershed of Waihe‘e is listed on the 303 (d) list for nutrients. Landscape analysis was conducted determining population density, land use (farming, conservation, etc.) and road density to help determine the origins of the nutrients. Because the watershed has few residents and limited farming and does not have municipal hook-ups for sewer treatment, it’s likely the nutrient problem originates from cesspools. Accuracy Assessment- Methods The purpose of conducting an accuracy assessment was to evaluate the accuracy of the land use/land cover (LULC) layer used in the GIS analysis. This layer, which was obtained from the State of Hawai‘i’s GIS program, contains land use data documented in 1976. With the amount of development over the past thirty years, it became evident that this layer was no longer truly representative of Hawai‘i’s land use/land cover. In order to inform readers about the degree of this inaccuracy and to recommend practical management measures, KBAC compared the land use/land cover layer with satellite images of the Ko’olaupoko area. Due to the time-consuming nature of this type of assessment, a 5 % random sample of circles, representing a 30 meter diameter were laid over and compared to the satellite image. A comparison was made between each point on the layer with the satellite image on top, then noted whether the assigned land use at that point corresponded with the image. If not, it was noted what type of land use was actually in the area. Each type of land use was assessed on an individual basis to find the accuracy of the various types of land use. These were given in percentages. Then, the accuracies of all different land use types were added together to render a percentage of accuracy of the layer for the entire

WRAS, Kailua Bay Advisory Council 1- 9
watershed. Example: For Kawai Nui watershed, 123 points had the description “High Intensity Development” The inspection of these points revealed that all of them were in fact highly developed. Therefore in Kawai Nui, the High Intensity Development type of land use was 100% accurate in the layer. 159 points represented the land use type “Grassland.” During examination of the grassland sample points, it was observed that only 121 points were in fact grassland. 28 points were Low Intensity Development and 10 points were High Intensity Development. Therefore, this type of land use in this watershed is only 76% accurate in the LULC layer. By calculating these percentages together an overall accuracy of 91% for the LULC layer in the Kawai Nui watershed was calculated. The same procedure was used to calculate the accuracy of the layer for the entire Ko’olaupoko region which is 80%. A limitation to this type of assessment is the accuracy of the assessment itself. For example, the satellite image includes cloud cover therefore, points that were located under the cloud cover could not be examined directly and assumptions had to be made. Assumptions on land use under cloud cover were based on the surrounding land use. If the surrounding land use was all forested, it was assumed the point was also forested. Similarly, if the cloud cover was in an area surrounded by high intensity development, the point was assumed to be highly developed. Additionally, the satellite image itself was not always clear, so some points were not easily identifiable and identification of the land use at such points was up to the judgment of the examiner. When these problems were presented, groundtruthing was conducted to accurately assess the land use in a particular area. Additionally, depending on the number of points examined for each type of land use, land use types with small areas could have had only one sample point to represent 5%. If this one point happens to be incorrect, the accuracy for that land use type is 0%. However, since the points were random, computer-generated and selected, one particular point might be an insufficient representation. An additional constraint for the accuracy of many points is the geospatial accuracy of the LULC layer. As with other layers, some points were just a few feet off from the actual land, leading to the assumption that the layer is not 100% correctly geo-referenced. While this assessment is in no way precise enough to give an exact and correct percentage of accuracy, the idea is simply to notify readers that the land use has changed over the past 30 years, and the layer is no longer 100% correct. Instead, most of the areas in the layer described as developed are still developed, many of the forested areas are still forested today as they are on steep slopes and many areas that were untouched in 1976 (grassland, shrub/scrub, wetlands, etc.) are now also developed. Precision Riparian Buffers To further assess opportunities for restoration and preservation within the Ko‘olaupoko area, riparian habitat was assessed using a Precision Riparian Buffer Model. A precision or variable riparian buffer is a spatially variable riparian buffer. It is designed to achieve specific water conservation goals of reduction of non-point pollutants. It optimized its characteristics with respect to runoff contributing area, slope, soil type, land use and climate in that particular location (Lavalle April, 2007). This assessment yielded results
WRAS, Kailua Bay Advisory Council 1- 10
that will provide direction for KBAC and other natural resource mangers for management, preservation/restoration and potential policy recommendations of riparian habitat in the Ko‘olaupoko area. Results on riparian setbacks and associated management recommendation fit into four categories:
Preserve: areas well vegetated and forested; Restore: fields, nurseries or bare ground with minimal structures; Investigate: residential areas, cemeteries, golf courses and other types of
minimally develop land; and Channelized: highly manipulated stream channels, concreted, etc.
KBAC analyzed data for large landowners (>1,000 acres) that were recommended for preservation or restoration on different parcels of land. These recommendations are highlighted in the watershed summaries and noted as specific management recommendations to investigate opportunities. Community Input KBAC facilitated two community meetings each in Waimanalo, Kailua, South and North Kane‘ohe watersheds for a total of eight meetings. Each meeting captured watershed knowledge from community members, agency representatives and members of other watershed-based organizations. The first meeting focused on identification of pollutants from participants; the second meeting focused on refining the identification of NPS pollutants, potential sources of pollutants and types of restoration projects to address NPS pollution. KBAC presented data such as water bodies on the 303 (d) list, landscape features such as zoning, land use, road and population density, potential sources of pollutants and initial management recommendations. KBAC requested community feedback and additional concerns at each meeting. Community concerns included: additional monitoring of known pollutants, identification of sediment sources, trash and litter in waterways, excess fertilizer application from personal and commercial use, construction on steep slopes, lack of participation and coordination amongst state agencies (i.e. Department of Land and Natural Resources (DLNR) & Department Of Health (DOH)), stream maintenance techniques and infrastructure, specifically sewer capacity. Additionally, community members contributed ideas to address pollutants via restoration and education projects, including: storm drain filters, bio-swells along highway cuts for sediment control, stream flow restoration, creation of watershed council/manager position and continued community education. (For a complete summary of the group memory from the second round of meetings, see appendix A.) Lastly, KBAC worked with individual community members, agencies such as the DOH and other potential implementers to help identify management recommendations, costs, implementation pitfalls and partnership opportunities.
E. Limitations of WRAS

WRAS, Kailua Bay Advisory Council 1- 11
KBAC has made every effort to review existing data, meet with agency representatives, seek public participation and implement new watershed analysis using GIS, NSPECT and groundtruthing of the watershed. However, this WRAS has its limitations in that no new chemical (water quality), physical (stream condition) or biological (invertebrates and fish) data was collected to help provide background for management recommendations. Instead, existing data, GIS mapping, NSPECT modeling, public and government agency input was used for watershed assessment and management recommendations. Because some watersheds, such as Northern Kane‘ohe lack significant data, these sub-basins lack site specific management measures and recommendations.

WRAS, Kailua Bay Advisory Council 2 - 1
Chapter II: Watershed Summaries
A. Introduction
Introduction to the Ko‘olaupoko Watershed Area
The Ko‘olaupoko district and its 11 ahupua‘a have changed significantly since Western contact, although many of the natural features remain as a result of its steep topography. Only one-fourth of the land has been urbanized, with the remainder used for agriculture or designated forest reserves. Under the City and County of Honolulu’s current 20-year planning horizon, urban areas and suburbs are predicted to remain static at or near their current population levels. Windward O‘ahu is the largest water producing area on the island. Located on the east side of the island, the Ko‘olaupoko district comprises the southern half of the Ko‘olau Mountain range. In parts of the Ko‘olaupoko region, annual rainfall averages 300-350 inches, creating numerous perennial streams. Ko‘olaupoko extends from Kualoa Point in the north, about 23 miles along a winding coastline southeast to Makapu‘u Point. The watershed encompasses roughly 43,598 acres (17,644 hectares). The following is a brief overview of the three-major watersheds:
Waimanalo Watershed, 7,147 acres (2,892 hectares) in size, drains into Waimanalo Bay, which has a fringing reef with submerged margins;
Kailua Watershed, 12,910 acres (5,224 hectares) in size, drains into Kailua Bay
and is somewhat protected from the open ocean by a fringing reef;
Kane‘ohe Watershed, the largest of the Ko‘olaupoko watersheds, is about 23,500 acres (9,510 hectares) in size and drains into Kane‘ohe Bay; the 18-mile embayment is protected from the open ocean by an offshore barrier reef.
Human activities along with urbanization and other types of development in each of the major watersheds have severely altered the natural landscape and water collection system. Roads, houses, parking lots, and other impervious surfaces have reduced the capacity of the ground to absorb rainfall and recharge aquifers. Polluted runoff, that is,
The name Ko‘olaupoko comes from the Makahiki festival. During this time of rest, several gods appeared, including the Makahiki god, akua loa, who traveled in a right circuit around O‘ahu, and the akua poko, who traveled to the left (counter-clockwise) around the island from the beach of Waikiki. At the end of their journey, akua loa and akua poko met at Kalaeka‘o‘io, the cape of Ka‘o‘io, the division between Kualoa and Ka‘a‘awa. Thus, the names Ko‘olaupoko and Ko‘olauloa were given to the respective places above and below this meeting place of the two gods.
Summarized from Ka Po‘e Kahiko, Samuel M. Kamakau, as translated by Mary K. Pukui in The People of Old.

WRAS, Kailua Bay Advisory Council 2 - 2
rainwater that flows off these artificial surfaces along with various contaminants, is a major contributor of pollution. When rainwater rushes off streets and other paved areas, as well as off agricultural fields, lawns, and construction sites, the water carries everything in its path that dissolves or floats. This is likely a significant cause of muddy streams and sediment plumes in the nearshore waters. The end results are streams and nearshore waters low in oxygen, high in bacteria levels, and polluted with industrial, agricultural and household waste, garden chemicals and sediment. Parts of the original stream network have been filled, straitened and lined with concrete to accommodate development in the Ko’olaupoko area. Stormwater collection pipes, gutters, and drains, designed to direct water flow, have concentrated pollutants and reduced the effectiveness of the watershed’s natural ability to keep streams and coastal waters clean enough for swimming and fishing. Through urbanization, streams may also become conduits for stormwater flows from developed land when storm drains are connected to the streams. In such cases, these conditions may cause an increase over the natural stormwater volume delivered to receiving waters (MBA International, 1993). Streams more often function as flood control structures compared to natural stream systems, moving vast quantities of water and debris from the land to the sea, scouring and eroding stream banks in the process. Swollen with runoff water from the storm drain systems, urban streams rise rapidly during storms, causing larger and more frequent floods. Channelizing streams with concrete to control flooding removes water quickly, but also removes the natural features that maintain healthy streams and their associated ecosystems. In such cases the receiving waters may be degraded because of the near-instantaneous decrease in salinity and temperature due to the slug of fresh stormwater which can adversely affect coral and other marine life (MBA International, 1993) The watersheds or ahupua‘a of the Ko‘olaupoko moku are very diverse in physical characteristics, population and cultural heritage. The streams are equally diverse, yet have similar water quality limitations such as high nutrient concentrations, turbidity, suspended sediment and trash. The sources of these pollutants are unique to different streams and the ways in which water quality pollution is manifested through the watershed. For example, Ka‘elepulu Stream in Kailua is listed on the 2004 303 (d) list for nutrients. Studies indicate the nutrient problem originates from sources such as ducks, polluted run-off and episodic sewage spills. Conversely, Waihe‘e Stream in North Kane‘ohe is listed for elevated nutrient levels, yet the sources are not well known. Landscape analysis using GIS modeling suggests antiquated on-site sewer systems, perhaps cesspools, as the major nutrient contributor. The waters in Ko’olaupoko area are polluted primarily due to non-point source pollution such as:
Polluted run-off from yards, roofs and parking lots; Erosion from steep slopes and stream banks; and Antiquated sewer systems such as cesspools or leaking sewer lines.
Human activities and urbanization in the Ko’olaupoko watersheds contributes to the degradation of the streams, wetlands and receiving waters via impervious surfaces. For
WRAS, Kailua Bay Advisory Council 2 - 3
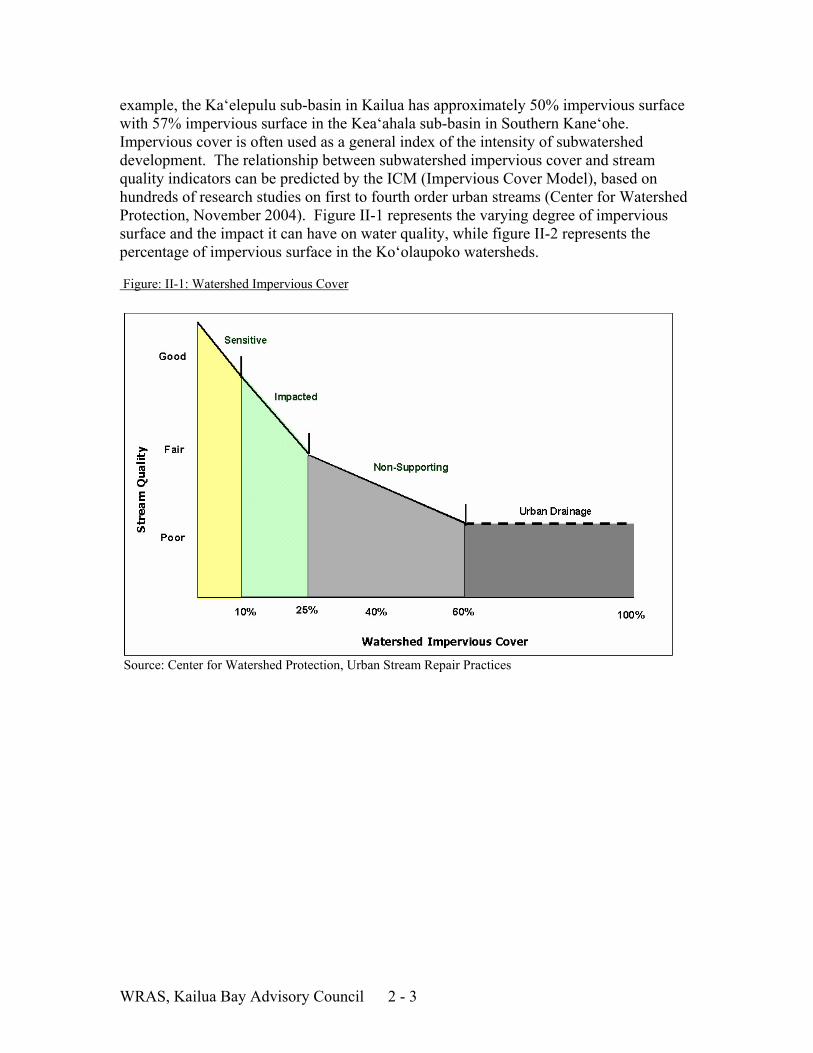
example, the Ka‘elepulu sub-basin in Kailua has approximately 50% impervious surface with 57% impervious surface in the Kea‘ahala sub-basin in Southern Kane‘ohe. Impervious cover is often used as a general index of the intensity of subwatershed development. The relationship between subwatershed impervious cover and stream quality indicators can be predicted by the ICM (Impervious Cover Model), based on hundreds of research studies on first to fourth order urban streams (Center for Watershed Protection, November 2004). Figure II-1 represents the varying degree of impervious surface and the impact it can have on water quality, while figure II-2 represents the percentage of impervious surface in the Ko‘olaupoko watersheds. Figure: II-1: Watershed Impervious Cover
Source: Center for Watershed Protection, Urban Stream Repair Practices

WRAS, Kailua Bay Advisory Council 2 - 4
Watershed% Impervious surface
Watershed quality 303 (d) listed pollutants Priority
Waikane 0.25% sensitive not listed N/AWaiahole 0.69% sensitive nitrite/nitrate MediumAhuimanu 1.21% sensitive not listed N/AHakipu'u 2.03% sensitive not listed N/AWaihee 2.52% sensitive nutrients MediumWaianu 2.59% sensitive not listed N/AKualoa 3.94% sensitive enterococci N/AKa'alaea 4.99% sensitive not listed MediumWaimanalo 9.17% sensitive nutrients, turbidity, SS TMDL 2001Kahalu'u 13.06% impacted turbidity MediumHaiamoa 15.08% impacted not listed N/AMakapu'u 15.75% impacted not listed N/AKahawai 16.03% impacted nutrients, turbidity, SS N/AHe'eia 18.41% impacted nitrite/nitrate MediumKawainui 19.67% impacted nutrients, turbidity, SS, trash,
metalsTMDL in progress
Kaneohe 22.77% impacted nutrients, turbidity, dieldrin TMDL in progressKawa 40.17% non-supporting nutrients, turbidity, SS TMDL 2002Pu'u Hawaiiloa 49% non-supporting not listed N/AKa'elepulu 49.82% non-supporting nutrients, turbidity HighKea'ahala 56.99% non-supporting nitrite/nitrate, Total N&P. turbidity,
trashHigh
In addition to impervious surface and polluted surface run-off, streams are impacted from, but not limited to, antiquated on-site septic systems, fecal matter from animals such as ducks or feral pigs, illegal dumping of trash and past uses of agricultural chemicals. All these contribute to the water quality problems and streams being on the 303 (d) list for impairment (figure II-3).
Figure II-2 Percent Impervious Surface for Ko’olaupoko Watersheds

WRAS, Kailua Bay Advisory Council 2 - 5
Figure II-3 Stream Pollutants

WRAS, Kailua Bay Advisory Council 2 - 6
B. Waimanalo Watershed
Waimanalo–potable or “sweet” water–ahupua‘a (figure II-4), named for its largest stream, covers just over 11 square miles. Before the planting of sugar cane on the lower slopes and low lands after Western contact, the area supported a large system of taro lo‘i with a wide variety of traditional Hawaiian crops clustered around the mouth of the stream. Additional upland taro patches, fed by small streams and springs, existed near the Ko‘olau mountain range. The taro lo‘i were destroyed when the entire ahupua’a was leased and cattle were introduced. The change destroyed the traditional plantings of ti, and wauke, as well as large trees, resulting in the loss of vegetation throughout the whole area. Modern development, along with roadways, and other landscape changes have likely contributed to flooding that occurs across the main roadway after heavy rain events. Three streams feed into Waimanalo Bay. Puha, the old name for Waimanalo Stream, was formerly used for the traditional Hawaiian sport of pu‘e wai1 (agitated water). Inoa‘ole Stream (Unnamed Stream) is the second stream that flows intermittently. The last intermittent stream, presently called “the ditch,” runs through Hawaiian Homelands, but was once called Muliwaiolena. The ahupua‘a was once rich with Hawaiian sites, though many have vanished or been destroyed over the years. Stories tell of former small fishing villages along the shore. Handy and Handy noted that the stories of the ahupua‘a did not tell of the ali‘i nor plantings there. The pu‘uhonua of Haunaniho (binding the teeth), a sacred site where anyone was forgiven, formerly rested on a small hill mauka of the present day highway. Various sources have recorded at least four heiau in Waimanalo and numerous sacred pohaku (stones). They include Kini, a fishing shrine that was tossed inland when the road was built, and Pohaku Pa‘akiki, found in the shoreline waters near Sea Life Park and Kaupo Beach Park, the site of the ancient fishing village of Ko‘onoapou which was abandoned in 1853, due to the smallpox epidemic. In 1840, Waimanalo was a ranch for sheep and cattle, but ten years later, sugar dominated the ahupua‘a. Due to an inadequate water supply in Waimanalo and the high water volume needed to grow sugar, pumping more water from Kawai Nui Stream in Kailua was required. In 1917, the 29-year-old Waimanalo Sugar Company sold 1,500 acres of beachfront property to the U.S. Government; the area that is presently Bellows Air Force Base. Sugar was not actually discontinued until 1947, but its decline meant that the two million gallons of water diverted daily from Kawai Nui Stream were no longer needed. As sugar became less profitable throughout the rest of the island, numerous farmers relocated away from the rapidly growing suburban centers of Kailua and Kane‘ohe to the relatively unpopulated Waimanalo watershed. Without a major highway connecting the area to the H-1 Freeway, its population has remained relatively unchanged over the years.
1 *Pu‘e wai was played by digging an opening twenty feet or more in the sand, damming the stream at the shoreline. The players swam in the raging waters created by rush of the stream water meeting the waves, the stream water moving at more than thirty knots.

WRAS, Kailua Bay Advisory Council 2 - 7
One of the most visible features along Waimanalo Bay is Waimanalo Beach. Covering nearly 5.5 miles (8.8 km), it is the longest stretch of sandy shoreline on O‘ahu and has the most extensive series of sand dunes of any beach on O‘ahu. Waimanalo Beach is a popular sunbathing and swimming area, especially where its sandy bottom slopes gently offshore. Two small islands appear offshore southeast of Waimanalo Beach. The larger and more distant is Manana, or Rabbit Island, where rabbits once ran wild. The other island is Kaohikaipu. Further southeast is Makapu‘u Beach, one of the state’s famous body surfing beaches. Located to the north of Waimanalo Beach is Bellows Air Force Station. Historically, this was once a beneficial natural wetland area and functioned to collect nutrients and trap sediments before water was discharged into the bay. An exceptionally wide submerged reef extends offshore of Waimanalo Bay. The reef margin, approximately 5,000 feet (1,500 m) from Waimanalo Beach, varies in depth up to 15 feet (5m) and consists of scattered shoals. Depths exceeding 30 feet (10 m) occur in a broad, lagoon-like depression behind the margin. This entire feature is suggestive of a submerged barrier reef. The bottom of the submerged reef flat includes areas of considerable relief and sand, with patchy coral cover. Only a few species of fish are abundant here. The entire coast is subject to high surf and tsunami (tidal wave) flooding. The steep mountain slopes of the Waimanalo Bay Watershed abruptly meet the more gradual slopes that lead to the flat terrain of the coastal plains. Unlike the watersheds of Kane‘ohe and Kailua, the Waimanalo watershed has retained much of its rural character and remains the least populated (8% of the total Ko‘olaupoko population). The steep slopes and the restrictions placed on potable water recharge areas limit development. The predominant land use is agricultural/residential with an abundance of livestock (horses, hogs, cattle, and chickens). Other land uses include small plant nursery operations, residential neighborhoods, a golf course, and a military installation at Bellows Field. Waimanalo’s freshwater sources come from the mountains, springs, and also a diversion from Kailua (e.g., upper Maunawili Valley). Today, Waimanalo Stream, which bisects Bellows Field, drains a primarily agricultural area, contributing to poor water quality along the shore. Net fishing for crabs, throw netting, and bait collecting occur where this stream enters the bay. The bay is influenced to a large extent by Waimanalo Stream, the watershed’s only true perennial stream, although there are several diversions in the upper stream valley. Waimanalo Stream is a highly altered waterway with just over 1% remaining natural; in many ways, it no longer functions as a natural stream. The channelized mouth of this stream is estuarine. Waimanalo Stream runs through a predominately agricultural area and is designated as a Water Quality Limited Segment (WQLS) for failing to meet the State’s water quality standards.
WRAS, Kailua Bay Advisory Council 2 - 8
Makapu‘u Sub-basin Summary
Makapu‘u Summary The Makapu‘u area does not have any streams throughout the watershed. The area is comprised of 402 acres (163 hectares) with a maximum elevation of 1,361 feet (415 meters) with a total of 196 residents (2000 Census). Identified pollutants No known pollutants are listed in the Makapu‘u watershed area.
Management measures A community group, Hui kū Maoli Ola, has expressed an ecological need and interest to implement native vegetation planting on Rabbit (Manana) Island. After heavy rains, noticeable turbidity is visible around the island. Before implementation of plantings occurs it is recommended efforts are coordinated with DLNR as there might be implications because the island is a bird sanctuary. Implementation feasibility Increased native vegetation on Rabbit Island could be feasible and effective if implemented properly. Limited invasive plant species exist on the island which increases the likelihood of successful plantings. However, proper irrigation may be needed to ensure plants survive through any drought conditions for the first few years following planting.

WRAS, Kailua Bay Advisory Council 2 - 9
Figure II-4 Waimanalo Region

WRAS, Kailua Bay Advisory Council 2 - 10
Waimanalo Sub-basin Summary
Waimanalo summary Waimanalo Stream2 (figure II-5) originates in the Ko‘olau Mountains, draining approximately 3,789 acres (1,533 hectares) flowing through a variety of land uses including: forested lands, agriculture and low intensity (figure II-8) development before entering Waimanalo Bay at Bellows Beach. The highly degraded stream listed for nutrients, turbidity and suspended solids on the 2004 303 (d) list, is 3.4 miles (5.5 meters) in length at 13% average gradient and has an average discharge of 5 cubic feet per second (Waimanalo Health Center’s Waimanalo Watershed Restoration Plan, September 2002). The Waimanalo watershed contains approximately 10.7 miles (17,181 meter) of mainstem and tributary streams. The watershed has a maximum elevation of 2,611 feet (796 meters) rising above its lowest elevation at sea level. The 2000 Census estimates a population of 6,642 residents within the watershed. In June 2002, the Waimanalo domesticated animal populations were estimated to be, 250 horses, 709 pigs, 60 cattle and 50,500 chickens (Waimanalo Health Center, 2002). Identified pollutants Waimanalo Stream is on the 2004 303 (d) list for nutrients, turbidity and suspended solids. The TMDL completed in 2001 concluded both animal waste and inorganic chemical fertilizers are contributors to the excess nutrient loads measured in surface waters, and are discharged into stream channels via both the surface runoff and shallow groundwater flows (Hawai‘i State Department of Health, 2001). The study continues to note a small percentage of homes in Waimanalo watershed are not connected to the sewer system and rely upon septic systems or cesspools to manage household wastewater. Septic system infiltration may also contribute to the excess nutrient loads. There are estimated 1,360 cesspools within the watershed limits, of which 34% are estimated to be defective (Thompson, 1993). A Nonpoint Source Pollution and Erosion Comparison (N-SPECT) (see appendix B) modeling project conducted by KBAC suggests approximately 83,126 kg of nitrogen and over one-million kg of TSS are contributed from the watershed annually. The TMDL notes eroding roads, driveways and bare road sides contribute excess sediments to the stream. Waimanalo Stream likely has pollution problems that not [sic] addressed in the TMDL, beyond just nutrients and sediments. Chlorofluorocarbons, pesticides, temperature, heavy metals, petroleum-based hydrocarbons, and bacteria may also exceed acceptable levels in Waimanalo Stream (Hawai‘i State Department of Health, 2001). In Tomlinson and DeCarlo, Investigations of Waimanalo and Kane‘ohe Streams, water quality monitoring led to the conclusion that Waimanalo stream is a highly eutrophic stream characterized by very pronounced diel cycles for temperatures, pH and
2 Total Maximum Daily Loads Estimated for Waimanalo Stream refers to Waimanalo Stream and Kahawai tributaries as Waimanalo Stream. Likewise, in this document, Waimanalo Stream refers to Kahawai and tributaries.

WRAS, Kailua Bay Advisory Council 2 - 11
Dissolved Oxygen (DO). DO and pH were also elevated during the day because of the unshaded, shallow nature of the stream plus high nutrient concentrations. In the report, Field Assessment: Alternatives for Restoration in Waimanalo Stream, NRCS July 2005, the authors note excessive stream bank erosion throughout the mainstem and two tributaries. Additionally, the report highlights site specific restoration opportunities for streambank erosion, road realignment, culvert maintenance and trash removal. A biological and habitat assessment of Waimanalo Stream concludes the habitat is both impaired and moderately impaired for supporting native communities of organisms (Hawai‘i’s Department of Health, March, 1998). Waimanalo Stream is impaired or moderately impaired based largely because of habitat loss. Habitat conversion and loss such as cementing of the substrate, fine sand and silt, and the uniform nature of the channel, bare and eroding soil along one section of bank, and heavy silt load and areas of bare soil were common in the riparian zone (Hawai‘i’s Department of Health, March, 1998) all have impacts to native biological communities. Environmental impacts Natural stream systems have the ability to receive water with a certain concentration of pollutants and still deliver clean water to bays and the open ocean without violating water quality standards. A functioning stream system will cycle nutrients and filter contaminants from runoff. However, two conditions can cause this process to break down: too large a concentration of pollutants and a nonfunctioning stream system. Both of these conditions appear to exist in Waimanalo Stream (Hawai‘i State Department of Health, 2001). Waimanalo Stream has been altered with its channel lined with concrete, natural sinuosity removed via straitening and riparian areas eliminated and replaced with urbanized activities. Because Waimanalo Stream does not have the ability to filter the high concentrations of pollutants, pollutants (figure II-8) enter directly to the receiving waters, Waimanalo Bay, which is Class A waters. Class A water protection states:
that their use for recreational purposes and aesthetic enjoyment be protected. Any other use shall be permitted as long as it is compatible with the protection and propagation of fish, shellfish, and wildlife, and with recreation in and on these waters. These waters shall not act as receiving waters for any discharge which has not received the best degree of treatment or control compatible with the criteria established for this class.
Based on the environmental impacts of Waimanalo Stream and the uses of the receiving waters, potential effects for Waimanalo Stream include:
Health and human safety: no health and human safety issues are known as a result of impaired water quality in Waimanalo stream;
Economic resources: as a result of high sediment loads, coral reef could be
negatively impacted, in turn having consequences on economic resources; and

WRAS, Kailua Bay Advisory Council 2 - 12
Recreation: limited recreation is available in Waimanalo Stream as a result of poor water quality and a lack of stream flow. Additionally, left unchecked, turbidity and other pollutants will continue to have a negative impact on recreational opportunities in Waimanalo Bay.
Management measures As a result of stream conditions and pollution loads, KBAC suggests following recommendations in the Waimanalo Stream TMDL Implementation Plan, August 2001. Additionally, based on the Precision Riparian Buffer Model, there is a potential to preserve over 215 acres (84 hectares) and restore 41 acres (16 hectares) of riparian habitat owned by large landowners in the Waimanalo and Kahawai sub-basins (figure II-6).
Figure II-5: Waimanalo Watershed

WRAS, Kailua Bay Advisory Council 2 - 13
General management recommendations include creating a community-based organization such as a Waimanalo Watershed Council to champion support for restoration and monitoring and a mechanism to create partnerships with other entities such as the Windward O‘ahu Soil and Water Conservation District. This will increase the capacity of all interested stakeholders in the watershed. Specific restoration recommendations include: Nutrients
Identify and prioritize cesspools for decommissioning/retrofitting for sewer hook-up or on-site septic system (High Priority);
Work with Windward Soil and Water Conservation District, NRCS and
landowners, specifically in the middle reaches of the watershed, to implement Farm Plans to address nutrient management (High Priority);
Continue baseline monitoring of listed 303 (d) parameters for trend monitoring
and project effectiveness.
Turbidity and Suspended Solids Work with landowners, specifically in the middle reaches of the watershed to
implement erosion control through riparian restoration, soft bio-revetments or other proven in-stream erosion control methods (High Priority);
Prioritize riparian restoration recommendations from, Field Assessment:
Alternatives for Restoration Waimanalo Stream. Restoration opportunities exist both mauka and makai of the Kalaniana‘ole Highway to re-grade stream banks, remove invasive species and plant native vegetation (High Priority).
Study sediment yield from Kailua Reservoir and subsequent stream bank erosion
(pers. Comm. Lisa Ferentinos February 9th, 2007)
Habitat Improvements Create channel sinuosity, floodplain connection, removal of concreted sections
and wetland restoration in the lower section of Waimanalo Stream along Bellows Air Force Base (High Priority); and
Research, prioritize and contact large landowners for riparian preservation and
restoration (High Priority)

WRAS, Kailua Bay Advisory Council 2 - 14
Implementation feasibility Because pollutant sources in the watershed are identified to a reach scale (middle section of the watershed), implementing the prescribed recommendations via active watershed
Figure II-6: Waimanalo riparian restoration and preservation

WRAS, Kailua Bay Advisory Council 2 - 15
restoration could prove both feasible and effective. Efforts to educate the landowners concerning available and effective erosion control BMPs could help reduce the sediment load in the system. Restoration techniques implemented in strategic locations to address erosion, slow stream velocities and trap and sort sediments will have a position impact on stream health as well as receiving waters. Additionally, projects which address the nutrients in the watershed, such a manure management and fertilizer application on agriculture lands, will also have positive implications for Waimanalo Stream. Partnering with the large landowners identified for perseveration and restoration of riparian habitat could provide significant protection and restoration opportunities for riparian habitat. This should be a high priority project in Waimanalo and Kahawai watersheds to improve watershed health starting with the largest properties first. Significant restoration work has been implemented in the Waimanalo watershed with varying degrees of success. For restoration to succeed, close coordination with other organizations such as Hui Kū Maoli Ola or the Waimanalo Health Center and state agencies such as DLNR will be important. Creating a partnership with Bellow Air Force Base for stream restoration will increase habitat value and complexity in the lower section of Waimanalo Stream
Waimanalo Land use (Hectares)
Wetlands, 0, 0%
Forested Lands, 412, 27%
Other, 756, 49%
Agricultural Lands, 226, 15%
Low Intensity Development, 104, 7%
High Intensity Development, 37, 2%
Figure II-7: Waimanalo Land use

WRAS, Kailua Bay Advisory Council 2 - 16
Figure II-8 Waimanalo Stream (above Kalaniana’ole Hwy.) Measurable Milestones Pollution Problem 1: Nutrients Measurable Milestones:
1. Assure good farm management practices to minimize potential for runoff and groundwater contamination.
a. Short-term implementation goal: work with Windward Soil and Water Conservation District/NRCS to help identify needed farm plans: implement 2007-2009.
b. Long-term implementation goal: seek additional funding to match and support the implementation of farm plan recommendations adjacent to riparian corridor: 2009-2012.
2. Identify and prioritize cesspools for decommissioning/retrofitting for sewer hook-
up or on-site septic system. a. Short-term implementation goal: work with Hawai‘i DOH to prioritizes
homes with cesspools in greatest need for up-grades: 2007-2009 b. Long-term implementation goal: work with private foundations, financial
intuitions, Hawai‘i DOH, EPA, legislators and others to create tax incentives, low interest loans and grants for cesspool replacement: 2008-2010.

WRAS, Kailua Bay Advisory Council 2 - 17
c. Long-term implementation goal: work with prioritized homeowners on funding packages and cesspools replacement: 2010-2015.
Pollution Problem 2: Turbidity, Suspended Solids and Habitat Restoration Measurable Milestones:
1. Stabilize stream banks and restore stream bank function. a. Short-term implementation goal: prioritize riparian restoration projects
listed in NRCS Habitat Assessment: 2007-2008. b. Short-term implementation goal: schedule meetings to introduce
opportunities, prioritize preservation and restoration projects with large landowners (federal government and State of Hawai‘i): 2007-2009.
c. Long-term implementation goal: implement watershed wide riparian restoration and preservation projects: 2009-2015.
2. Implement stream habitat restoration efforts throughout the watershed.
a. Short-term implementation goal: work with federal representative at Bellows for habitat restoration opportunities: 2007-2009
b. Long-term implementation goal: implement habitat restoration in lower section along Bellows: 2009-2012
Waimanalo Load Reduction For the purposes of this document, load allocations are adopted from the Waimanalo TMDL (figure II-9). These allocations are presented below and are intended to give the reader a better understanding into the breadth of projects needed to be implemented to reach load allocations as well as provide some targeted benchmarks. Project effectiveness monitoring for the parameters on the 303 (d) will provide data to assess if projects are helping to achieve load reduction goals in Waimanalo Stream.

WRAS, Kailua Bay Advisory Council 2 - 18
Figure II-9: Waimanalo TMDL Load Allocation

WRAS, Kailua Bay Advisory Council 2 - 19
Implementers/PartnersPotential Funders
Polluants: nutrients, turbidity, and suspended
solids
TMDL completed in 2001; follow recommendations $$$
Nutrients Id and replace cesspools $$
Nutrients Work with ag producers and other landowners for management plans
$$
Suspended Solids Steep slope and stream channel erosion $$
Wai
mān
alo
Stre
am
Urban / NPS Runoff, 2001 Waimānalo
TMDL
Contaminated groundwater inflows have resulted in development of highly
eutrophic conditions in Waimānalo Stream
Promote the use of engineered vegetated treatment systems such as constructed
wetlands or vegetated buffers along streams to filter pollutants and debris in runoff before
it reaches the streams
$$$ DOH, DLNR, NGOs, NRCS, CCH
W
aimān
alo
Stre
am
Other, 2001 Waimānalo
TMDL
Trash in the stream; illegal dumping and waste disposal
Increase capacity of community to protect and enhance stream ecosystem $$ Residents, agencies, elected
officials
Wai
mān
alo
Stre
am
Other, 2001 Waimānalo
TMDL
Stream habitat is severely degraded; a biological assessment categorized
Waimānalo Stream as "non-supporting" for aquatic life uses
Poor water quality in streams is often linked with habitat degradation, which leads to loss
of biotic integrity; implement measures to alleviate nutrient and sediment problems in
the watershed
$$$ DOH, DLNR, NGOs, residents
Clear vegetation and debris from the channel $$$
Use armored cable to help alleviate difficulties associated with animals (i.e.
blocked access, animal waste, etc.)$$
Conduct further studies $
Stream/ Waterbody Problem Category Polluant(s)/Source(s) Management Measure Est.
Cost
Wai
mān
alo
& K
ahaw
ai
Stre
am
Water Quality Limited Segments
DOH, KBAC, NGOs, landownersSources: Fertilizers, pesticides, ag lands,
cesspools
Wai
mān
alo
Stre
am Stream Flow
Channelization: due to its very shallow, artificial, and largely unshaded nature, Waimānalo Stream was found to have exceeding high daytime temperatures
and dissolved oxygen levels.
DOH, KBAC, ACOE, Bellows
Estimated Implementation Cost $ = 0 - 25K; $$ = 26K – 100K; $$$ = 101K – 250K; $$$$ = 251K – 1M
Figure II-10: Waimanalo Management Recommendation Table
WRAS, Kailua Bay Advisory Council 2- 20
C. Kailua Watershed
The name Kailua means two seas or two currents, referring to the two major lagoons and freshwater tributaries, Kawai Nui (the big waters) and Ka’elepulu (the moist darkness) that drain from the Ko‘olau Mountains. With its considerable water resources, Kailua provided an extensive resource to Hawai‘ians as seen in documentation of ancient sites as well as those still present in the ahupua‘a. Sites of O‘ahu documents ten heiaus. Most residents are familiar with the Ulupo Heiau which sits beside Kawai Nui Marsh along Kailua Road and has been restored and maintained. Numerous other sites have been destroyed, including an adze quarry, a holua slide, fish ko‘a (altars and markers), and other wahi pani (sacred sites) symbolized in the form of pohaku (rock). The Kailua watershed encompasses just over 20 square miles (figure II-11) and drains into Kailua Bay. The watershed, flanked by the precipitous Pali slopes, gradually flows into the foothills (Olomana Peak, Olomana Ridge, Olumawao, Aniani Nui Ridge, Pu‘u O Ehu, Keaalu, Mahinui, and Pu‘u Papa‘a) before joining the coastal plain. The Mokapu Peninsula (in South Kane‘ohe), an essentially flat terrain except for the extinct cinder cone peaks (Pu‘u Hawai‘iloa, a watershed in South Kane‘ohe, and Ulupau Head) has runoff that ends up in both Kane‘ohe and Kailua Bays. In the mauka boundary, the second highest peak on O‘ahu, Konahuanui stands at 3,150 feet and overlooks Mount Olomana (divide hill) at 1,643 feet. Kawai Nui, the larger of these two water systems draining the rain forests of the Pali and Maunawili highlands into Kawai Nui Marsh, enters Kailua Bay through the channelized Oneawa Canal. The 830- acre Kawai Nui Marsh is the largest remaining wetland in Hawai‘i, but is now significantly smaller in size. Historically, more than half of the acreage was a fishpond, kept clear of encroaching vegetation by the communal efforts of residents of Windward O‘ahu. The original pond drainage was a canal, called Kawai Nui Stream, at the southeast corner of the pond that fed directly into Ka‘elepulu Canal and out into the ocean. Some of the drainage from Kawai Nui was diverted to feed taro patches. Hawai‘ians of old cultivated fertile taro lo‘i and kept excellent fishponds in the area, making Kawai Nui famous by the year 1100. The mo‘olelo of the pond tells of the Makalei tree that was brought from Hilo to attract fish by bewildering and fascinating them. Over the next several centuries, this system changed from a lagoon open to the ocean into a closed system of lo‘i and fishponds. Hawai‘ians caught milkfish, mullet, aholehole, and ‘o‘opu from the Kawai Nui. The famous lepo ‘ai ‘ia or edible dirt was found only at Kawai Nui, and the story is told that a Kailua chief brought it from Kahiki (Tahiti). Legend has it that when it was being gathered no one could speak, for if they did, the diver would be smothered by ordinary mud. For a time, rice replaced taro in Kawai Nui Marsh. When the repetitive clearing of vegetation ceased, the natural process of ecological succession continued unchecked. Since that time, the original pond has shrunk to a fraction of its former size through sedimentation, development and encroaching vegetation. The largest natural water source flowing into Kawai Nui Marsh is Maunawili Stream. A smaller drainage, Kahanaiki Stream, also feeds the marsh but is less than one-sixth of the water that passes through Maunawili Stream. Another small intermittent stream, Kapa‘a, enters the marsh near the present location of the rock

WRAS, Kailua Bay Advisory Council 2- 21
quarry. Since 1878, the State Department of Agriculture, Irrigation District, has diverted water from Kailua to irrigate agriculture in Waimanalo. The chronic flooding of Kawai Nui Marsh prevented permanent residences, and canals were built to change the path of the water. After 1911, with the completion of Hamakua Canal along the southern side, and 1924, with the construction of Kawai Nui Canal on the northern end, the options for development opened. Lots were sold, but flooding continued. In 1952, the Army Corps of Engineers widened the channel at the Kawai Nui Stream, creating Oneawa Canal, and began construction of a dike to help control flooding. A new dike completed in 1997, was designed to protect against a 20-year storm event flood. Kailua’s shallow groundwater table is partially responsible for major flooding that tends to occur during large storm events. The Kawai Nui Flood Control Project, completed in 1966, was created to move water from Kawai Nui Marsh to Kailua Bay; and the Ka‘elepulu Canal, originally built by early rice farmers to control water flow from the marsh to their pond fields, has reduced flooding. However, urbanization and the increase of paved surfaces have created localized flooding problems. Oneawa Canal, the major outlet for Kawai Nui Marsh, flows at about 10 million gallons per day. This water originates from streams and springs that drain a large area of inland watershed (Maunawili) and about 1.35 square miles (3.5 sq km) of densely inhabited residential lands. The original drainage into Kawaonui Stream was blocked in 1966 by the construction of a dike along the northeast edge of the marsh, eliminating the natural flow of water into the ocean. A wide manmade channelized drainage (Kawai Nui Canal) was constructed as an alternative drainage in the north corner of the marsh. The upper streams and remnant ponds in the marsh are primarily fresh water, while the salinity of water within Kawai Nui Canal fluctuates with the ocean’s tidal influences. Patterns of water flow and circulation within the marsh are poorly understood. The amount of open water left in the marsh varies considerably with patterns of rainfall runoff. A large central pond, ranging in depth from three feet to more than ten feet in places, has remained open and free of floating vegetation in recent years. A dense mat of water hyacinth now covers other small ponds in the marsh, but part of this pond cover is opened during periods of heavy rainfall or high winds. Ka‘elepulu, the second, lesser tributary system drains the lower rises of Olomana, Keolu, Ehu, Kaiwa, and Kalae Ridges into the Ka‘elepulu Pond (Enchanted Lake) and marshes before emptying into Kailua Bay from Ka‘elepulu Stream (figure II-12). Formerly a freshwater fishpond, it covered 280 acres. Kailua Bay is protected by coral reef at a depth of approximately 20 feet (6 m). Makai of the reef margin, the gently sloping bottom is patchy with corals and algae. Popoi‘a Island (Flat Island) lies just offshore of Kailua Beach and is a low, limestone reef remnant that has been lifted above present-day sea level. It is separated from the northwest reef margin of the bay by a ten-foot (3 m) deep, sandy channel. Besides being a popular picnic, snorkeling, and surfing spot, Popoi‘a Island is a designated bird sanctuary. Several freshwater sources discharge into Kailua Bay, including the Mokapu sewage outfall, storm drains, the Nu‘upia Ponds seaward canal, Ka‘elepulu Canal, which drains Enchanted

WRAS, Kailua Bay Advisory Council 2- 22
Figure II-11: Kailua Region
Lake, and Oneawa Canal which drains Kawai Nui Marsh. Significant volumes of fresh water are released from these sources during periods of heavy rains. Waters within 660 feet (about 200 m) of shore are commonly greenish in color, indicating an enrichment of algae (phytoplankton). Moderate enrichment of nutrients occurs in a small area over the sewage outfall.
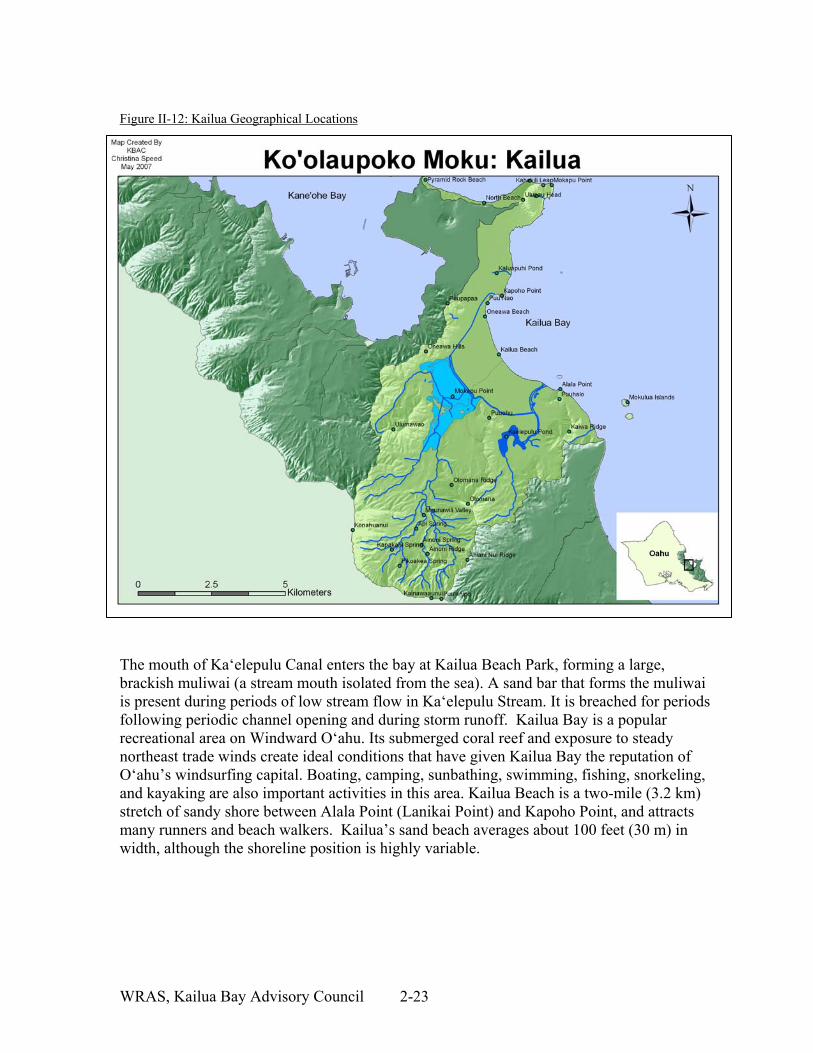
WRAS, Kailua Bay Advisory Council 2- 23
Figure II-12: Kailua Geographical Locations
The mouth of Ka‘elepulu Canal enters the bay at Kailua Beach Park, forming a large, brackish muliwai (a stream mouth isolated from the sea). A sand bar that forms the muliwai is present during periods of low stream flow in Ka‘elepulu Stream. It is breached for periods following periodic channel opening and during storm runoff. Kailua Bay is a popular recreational area on Windward O‘ahu. Its submerged coral reef and exposure to steady northeast trade winds create ideal conditions that have given Kailua Bay the reputation of O‘ahu’s windsurfing capital. Boating, camping, sunbathing, swimming, fishing, snorkeling, and kayaking are also important activities in this area. Kailua Beach is a two-mile (3.2 km) stretch of sandy shore between Alala Point (Lanikai Point) and Kapoho Point, and attracts many runners and beach walkers. Kailua’s sand beach averages about 100 feet (30 m) in width, although the shoreline position is highly variable.

WRAS, Kailua Bay Advisory Council 2- 24
Ka‘elepulu Sub-basin Summary
Sub-watershed summary Ka‘elepulu Stream (figure II-13) originates from the mountains of Olomana, Keolu, Ehu, Kaiwa and Kalae Ridges and flows into Ka‘elepulu Pond (Enchanted Lake). The watershed is approximately 3,486 acres (1411 hectares) flowing through a predominately residential landscape before entering Kailua Bay at Kailua Beach Park. The highly channelized stream is 9.6 miles (15.52 meters) in length with a nine-percent average gradient; primarily above Ka‘elepulu Pond. The Ka‘elepulu watershed has a maximum elevation of 1,621 feet (494 meters) rising above its lowest elevation at sea level. Within the watershed, Ka’elepulu Pond or Enchanted Lake is the 90-acre estuary remnant of an ancient Hawaiian fishpond. The Pond is central to the highly urbanized watershed and drains to the ocean across Kailua Beach through the Honolulu City owned Ka’elepulu Stream. About half way to the ocean, the stream is joined by another canal, the dead-end remnant of Kawai Nui Stream. Ka’elepulu and Kawai Nui canals each add about 10 acres to the water surface area of the estuary system. Kawai Nui, sometimes referred to as Hamakua Canal, courses through the back of Kailua Town and the Hamakua Wetland but has been separated from Kawai Nui Marsh by a flood control levee since about 1965. Kawai Nui Stream receives only urban runoff and is essentially stagnant for much of the year. The City of Honolulu has 37 NPDES permitted storm drains entering Ka’elepulu Pond and another 36 entering the Kawai Nui Stream and lower Ka’elepulu Stream. Some of the City permitted drains also receive runoff from drains under the Kalaniana’ole Highway and a separate NPDES permit to the State Department of Transportation (Bourke, April 2006).
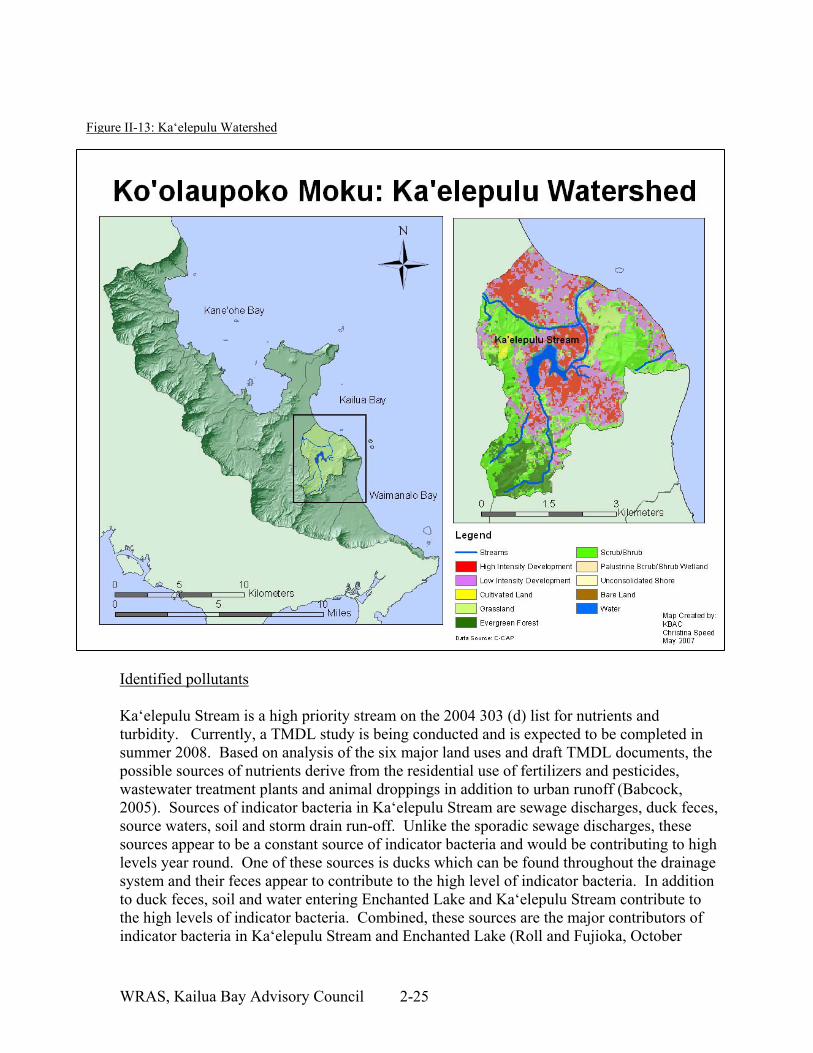
WRAS, Kailua Bay Advisory Council 2- 25
Identified pollutants Ka‘elepulu Stream is a high priority stream on the 2004 303 (d) list for nutrients and turbidity. Currently, a TMDL study is being conducted and is expected to be completed in summer 2008. Based on analysis of the six major land uses and draft TMDL documents, the possible sources of nutrients derive from the residential use of fertilizers and pesticides, wastewater treatment plants and animal droppings in addition to urban runoff (Babcock, 2005). Sources of indicator bacteria in Ka‘elepulu Stream are sewage discharges, duck feces, source waters, soil and storm drain run-off. Unlike the sporadic sewage discharges, these sources appear to be a constant source of indicator bacteria and would be contributing to high levels year round. One of these sources is ducks which can be found throughout the drainage system and their feces appear to contribute to the high level of indicator bacteria. In addition to duck feces, soil and water entering Enchanted Lake and Ka‘elepulu Stream contribute to the high levels of indicator bacteria. Combined, these sources are the major contributors of indicator bacteria in Ka‘elepulu Stream and Enchanted Lake (Roll and Fujioka, October
Figure II-13: Ka‘elepulu Watershed

WRAS, Kailua Bay Advisory Council 2- 26
1993). NSPECT modeling estimates nearly 1.5 million kg of TSS could be contributed to the Ka‘elepulu watershed annually. TSS is likely derived from eroding bare soil (construction sites), forested lands and urban runoff. Environmental impacts As noted in the Waimanalo TMDL, natural stream systems have the ability to receive water with a certain concentration of pollutants and still deliver clean water to bays and the open ocean without violating water quality standards. A functioning stream system will cycle nutrients and filter contaminants from runoff. However, two conditions can cause this process to break down: too large a concentration of pollutants and a nonfunctioning stream system. Similar to Waimanalo Stream, both of these conditions appear to exist in Ka‘elepulu Stream. Because the stream is channelized and void of natural stream characteristics, pollutants likely settle into Ka‘elepulu Pond or migrate downstream and settle with low stream gradient and flow. Similarly, high concentrations of pollutants are likely found at the river mouth as flow is stopped due to the sand bar. When the sandbar is naturally or mechanically breached at Kailua Bay, increased level of pollutants spill directly into this popular recreation spot. When the stream mouth of Ka‘elepulu Stream is open, recreational standards [water quality standards] are exceeded in Kailua Bay and therefore Ka‘elepulu Stream impacts the water quality of Kailua Bay. (Roll and Fujioka 1993). Additionally, when the mouth of Ka‘elepulu Stream is closed, samples taken in Kailua Bay were always below State and Federal Water Quality limits. When Ka‘elepulu Stream was open it exceeded the State standard 80 percent of the time and the Federal standard 60 percent of the time (Babcock 2005). Based on these studies, Babcock summarizes recreational water standards for Ka‘elepulu were exceeded at almost all sampling locations and recreational water standards for Kailua Bay were exceeded when the Ka‘elepulu Stream mouth was open. Enchanted Lake, an estuarine pond, is tidally influenced when the sandbar is mechanically or naturally removed and consistently has salinity averaging 17 parts per thousands (ppt) with a maximum salinity of nearly 35 ppt (Roll and Fujioka, October 1993). As a result, water quality standards are different, and significantly more stringent than standards for streams or Class A coastal waters, and should be managed as such. Based on data collected from the Enchanted Lakes Residents Association during storm events between January 2002 and March 2006, storm drains appear to be the largest contributor to sediment load in Enchanted Lake. Primary present day sources of sediment to the pond are from the urban development on the slopes of Mt. Olamana under Kalaniana’ole Highway, open lands above Ka‘elepulu School and the flood control basin at the top of Ka‘elepulu Stream (Bourke, April 2006). Additional conclusions include:
A total of 78 tons of sediment entered the pond during 4 storms, only 6 tons of which left the pond to the ocean at Kailua Beach.
An estimated 77 percent to over 90 percent of the sediment entering the pond,
remains in the pond and does not flow to the ocean

WRAS, Kailua Bay Advisory Council 2- 27
Based on the environmental impacts of Ka‘elepulu Stream and the uses of the receiving waters, potential effects for Ka‘elepulu Stream include:
Health and human safety: no official health and human safety issues are known as a result of impaired water quality in Ka‘elepulu stream; however, preliminary studies indicate elevated levels of dieldrin, total PCBs, chlordane and heptachlor epoxide in fish tissue samples from Ka‘elepulu Pond. Assessment of the Chemical Contamination in Enchanted Lake Areas, (KBAC, 2006) concludes consuming fish frequently contaminated with the maximum concentration of dieldrin and total PCBs could present a significant excess human health risk.
Economic resources: a continued degradation of lake and stream health could have a
negative impact on adjacent home values. Additionally, if recreational water quality standards are not met and recreation areas such as Kailua Beach closed periodically, this would have negative impact on the local economy;
Recreation: recreation such as canoeing and kayaking upstream of the mouth are
popular activities; however, with improved water quality additional activities such as swimming are possible. Enchanted Lake is privately owned which limits recreation for the general public, nevertheless, boating is a popular activity in the lake. The State of Hawai‘i posts a warning signs regarding water quality at the mouth of Ka’elepulu Stream after mechanical breaching of the sandbar.
Management measures Ka‘elepulu watershed is a mix of land use with development (both high and low intensity) dominating 50% of the watershed. Within 100 m (328 feet) of Ka‘elepulu Stream, 88% of the land is dominated by development with approximately 1% remaining as wetlands (figure II-14,). As a result, the stream is not able to filter pollutants before runoff enters the stream. To address these issues, KBAC recommends the following management measures: Nutrients
Distribute homeowner/resident educational curriculum and management guidelines for nutrient and fertilizer application appropriate for small-scale urban gardening and lawn care, resources available at (http://www2.ctahr.hawaii.edu/rwq/resource_materials/nutrient.htm). Curriculum should include application rates and timing of various chemicals, signs of over treatment, native vegetation options to reduce nutrient loading and the effects of chemicals on ground, surface, and ocean waters;
Work with managers at Mid-Pac golf course for riparian plantings. Approximately
2,000 feet (600 meters) of native vegetation could be established along the lower section of Ka‘elepulu Stream. Use the Bishop Museum riparian plant database as a guide for implementation (http://www.ctahr.hawaii.edu/rnre/Riparian_Restoration_Plant_Database.asp) (Medium Priority)

WRAS, Kailua Bay Advisory Council 2- 28
Coordinate efforts with future TMDL recommendations;
Turbidity
Work with City of Honolulu on street sweeping efforts along Keolu Drive (High
Priority); and
Identify sources of TSS originating from steep upland erosion, road cuts and/or urban run-off;
General Recommendations
Implement pilot project in Ka‘elepulu watershed to capture rain/storm water on residential and commercial lots. This could include recycling rainwater for on-site plant watering, installing cisterns whereby the water can be used for toilets and washing machine uses, installing permeable parking lots for new development and retrofitted parking lots and driveways (High Priority).
Enchanted Lakes Recommendations
Implement BMPs to storm drains that run directly to Enchanted Lake
o Improve DOT Highway storm drains above Kalaniana’ole Highway to limit
the quantity of sediment and debris entering the drains via bio-retention (High Priority);
o Install sediment and trash catchment BMPs on the major drainage ways entering into Enchanted Lake (High Priority);
Implementation feasibility Educating landowners and residents regarding implementation of BMPs can be an effective tool to reduce pollutants entering Ka‘elepulu Stream. However, residents need repeated exposure to the importance of the BMPs to change their behavior. With the large number of land parcels in the watershed and the lack of a specific, identified source, full participation and cooperation from residents is unlikely. Thus, implementing an education curriculum is feasible, but may not show significant results in the near future that reduce nutrients in the watershed. Residents will require repeated educational opportunities in order for their behavior to result in improved water quality. Partnering with landowners such as Mid-Pac Golf Course to plant native vegetation as well as provide education on fertilizer management is a feasible approach. However, such a small amount of riparian area is in need of restoration, little marked improvement will result from this project. Nevertheless, implementing a comprehensive management program with the golf course could have positive impacts, especially as an education and demonstration project.

WRAS, Kailua Bay Advisory Council 2- 29
Creating a pilot project to capture rain/storm water at individual residents and commercial lots is feasible and could prove effective to limit the amount of storm water and the subsequent polluted runoff entering Ka‘elepulu Stream. Activities such as disconnecting downspouts, creating rain gardens and using rain barrels can be used to capture and recycle stormwater. Installing storm-drain filters or other BMP such as bio-retention ponds could prove feasible and effective in the Enchanted Lake sub-basin to control stormwater from entering the lake. However, researching the most effective methods is needed as well as participation from City and County of Honolulu road department and Hawai‘i DOT. Figure II-14: Land use within 100m of Ka’elepulu Stream

WRAS, Kailua Bay Advisory Council 2- 30
Kawai Nui Sub-basin Summary
Sub-watershed summary Kawai Nui watershed (Figure II-15) is comprised of several tributary streams draining to Kawai Nui Marsh including, Maunawili, Kahanaiki and Kapa‘a. Maunawili Stream is the largest and is a medium priority for nutrients, turbidity and trash on the 2004 303 (d) list while Kapa‘a Stream is listed for nutrients, turbidity, suspended solids and metals. The watershed is approximately 9,422 acres (3,813 hectares) with a mix of land use including residential, industrial and forested land. The Kawai Nui Watershed has a maximum elevation of 3,136 feet (956 meters) rising above its lowest point at sea level with a total of approximately 33 miles (53,108 meters) of streams. The largest wetland in Hawai‘i is the Kawai Nui Marsh at 830 acres (336 hectares). Historically, more than half of the acreage was a fishpond, kept clear of encroaching vegetation by the communal efforts of the residents of Windward O‘ahu (KBAC, 2002). Drainage from Kawai Nui Marsh is highly manipulated for flood control. Historically, draining through Kawai Nui Stream, it now drains through Oneawa Canal at about 10 millions gallons per day before entering into northern Kailua Bay (KBAC, 2002). Figure II-15 Kawai Nui Watershed

WRAS, Kailua Bay Advisory Council 2- 31
Identified pollutants Maunawili Stream is medium priority on the 2004 303 (d) list for nutrients, turbidity and trash, while Kapa‘a Stream is listed for nutrients, turbidity, suspended solids and metals. A TMDL is currently in development for Kapa‘a Stream. Based on land use in Maunawili Stream (figure II-16), nutrient levels are likely derived from past agricultural practices of using fertilizers or possible landscaping practices at the Luana Hills Golf Course. Turbidity is likely the result of unvegetated steep slopes in the upper watershed and stream bank erosion, while trash originates from anthropogenic sources and seems to be heaviest in the area of Kapa’a Quarry Road. According to the document, Kapa‘a Stream Hydrology, Biology, and Water Quality Survey (Oceanit, 2002), pollutants are likely derived from several sources. Oceanit summarizes turbidity being attributed to four main sources: Ameron Hawai‘i, H3 Highway, Kapa‘a landfill and steep, non-vegetated slopes in the surrounding watershed (these are not listed in order of magnitude). Nutrients, such as nitrogen and phosphorus, in Kapa‘a Stream appear to originate from two sources. Nitrogen is likely derived from groundwater inputs as a result of leaching from Kapa‘a Landfill, while phosphorus is manifested in surface runoff from eroding hillsides in the upper watershed (Oceanit, 2002). Metals sampled in Kapa‘a Stream are likely derived from Kapa‘a Landfill as well; however, data suggest there is little reason for concern about heavy metal contamination of Kapa`a Stream waters (Oceanit, 2002). Additionally, the 2006 Draft TMDL for Kapa‘a Stream notes primary sources of discharged runoff volumes (60%) and pollutant loads (96% TSS, 75% TN, 71% TP) are the Kapa‘a and Kalaheo landfill areas and the areas known for off-road vehicular erosion. Environmental impacts
Figure II-16 Kawai Nui Land use
Kawainui Land use (Hectares)
High Intensity Development, 217, 6%
Low Intensity Development, 533, 14%
Forested Lands, 1134, 30%
Other, 1687, 43%
Wetlands, 215, 6%
Agricultural Lands, 28, 1%
WRAS, Kailua Bay Advisory Council 2- 32
The most significant environmental impacts resulting from pollutants in the Kawai Nui watershed could manifest themselves in the marsh. With the reduction in the historic size of the marsh and the increase in pollutants with watershed development, the Marsh plays an important role in filtering pollutants before water enters Kailua Bay. Based on the environmental impacts in the surrounding watershed and the uses of the receiving waters, potential effects for Kawai Nui watershed include:
Health and human safety: no official health and human safety issues are known as a result of impaired water quality in Kawai Nui watershed;
Economic resources: no known economic resources are impacted as a result of
impaired water quality in Kawai Nui watershed; degraded water quality could impact the receiving waters of Kailua Bay;
Recreation: water quality standards are not being met for recreation in the several
streams in the Kawai Nui watershed. Management measures Kawai Nui watershed has a mix of land use with the majority of the watershed comprised of forested and other land use category (shrub/scrub vegetation), thirty percent and forty-three percent, respectively (figure II-17). Based on the Precision Riparian Buffer Model, there is a potential to preserve over 154 acres (62 hectares) and restore 32 acres (13 hectares) of riparian habitat owned by large landowners in the Maunawili sub-basin (figure II-15). To address these issues and opportunities, KBAC recommends the following management measures: Nutrients
Monitor nutrient loads in Kapa‘a Stream; and
Implement TMDL recommendations once finalized. Turbidity
Identify erosion caused by off-road vehicles on private property in upper watershed, implement road decommissioning, native vegetation planting and work with landowners to restrict access to area. This will also help reduce the amount of phosphorus entering Kapa‘a Stream via sediment (High Priority);
Increase sediment pond capacity at Kapa‘a landfill to capture increased runoff (State
of Hawai‘i, Department of Health, 2006) (High Priority); and
Work with Ameron to ensure runoff from quarry operations are confined on-site;
Trash

WRAS, Kailua Bay Advisory Council 2- 33
Work with Windward Ahupua‘a Alliance on streamlining process at County level for community clean-ups and trash removal; and
Implement quarterly stream clean-ups (Medium Priority)
General Recommendations
Research, prioritize and contact large landowners for riparian preservation and restoration (High Priority);
Create partnership with ‘Ahahui Malama I Ka Lokahi and other organizations to
continue monitoring, restoration and education in the Kawai Nui Marsh.
Implementation feasibility Implementing erosion control by targeting off-road vehicles can be a very effective and feasible way to reduce erosion and sediment entering the system. However, a project such as this may be unpopular with the off-road recreational community and will require sensitive community-outreach and landowner cooperation.

WRAS, Kailua Bay Advisory Council 2- 34
Creating a partnership with Ameron can provide assurance that run-off is being property treated and provide the company with additional opportunities to promote its environmental procedures and stewardship.
Figure II-17: Maunawili riparian restoration and preservation
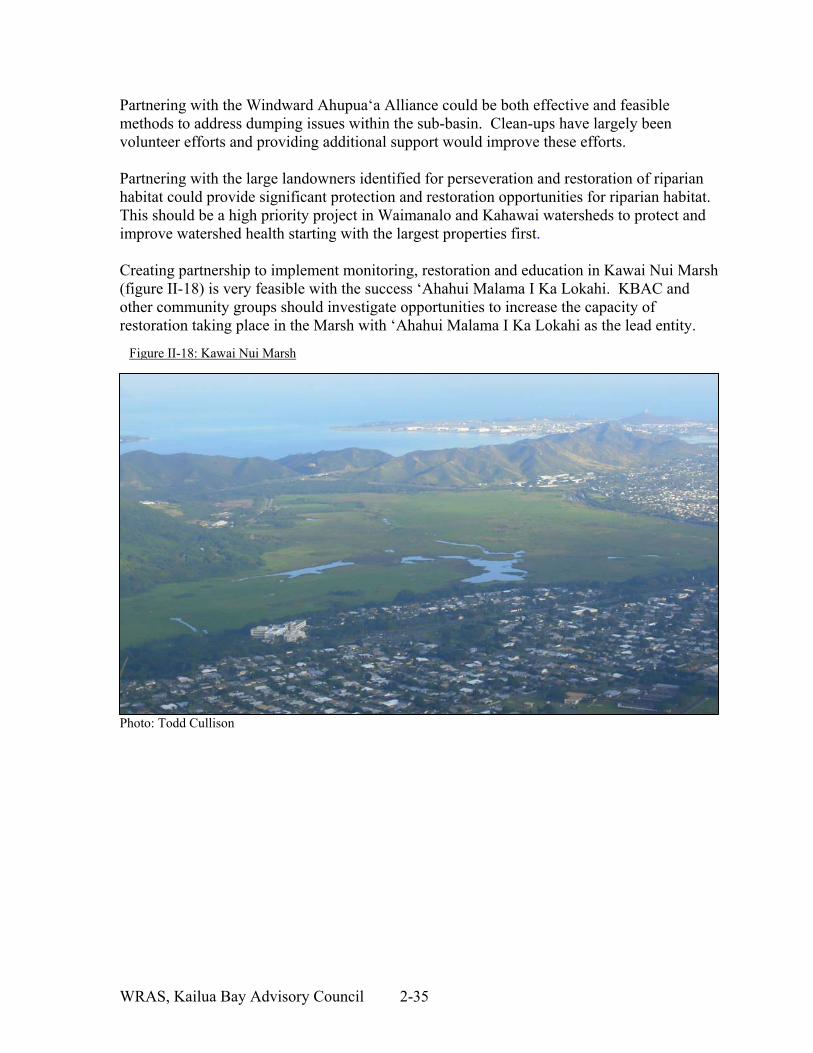
WRAS, Kailua Bay Advisory Council 2- 35
Partnering with the Windward Ahupua‘a Alliance could be both effective and feasible methods to address dumping issues within the sub-basin. Clean-ups have largely been volunteer efforts and providing additional support would improve these efforts. Partnering with the large landowners identified for perseveration and restoration of riparian habitat could provide significant protection and restoration opportunities for riparian habitat. This should be a high priority project in Waimanalo and Kahawai watersheds to protect and improve watershed health starting with the largest properties first. Creating partnership to implement monitoring, restoration and education in Kawai Nui Marsh (figure II-18) is very feasible with the success ‘Ahahui Malama I Ka Lokahi. KBAC and other community groups should investigate opportunities to increase the capacity of restoration taking place in the Marsh with ‘Ahahui Malama I Ka Lokahi as the lead entity.
Photo: Todd Cullison
Figure II-18: Kawai Nui Marsh
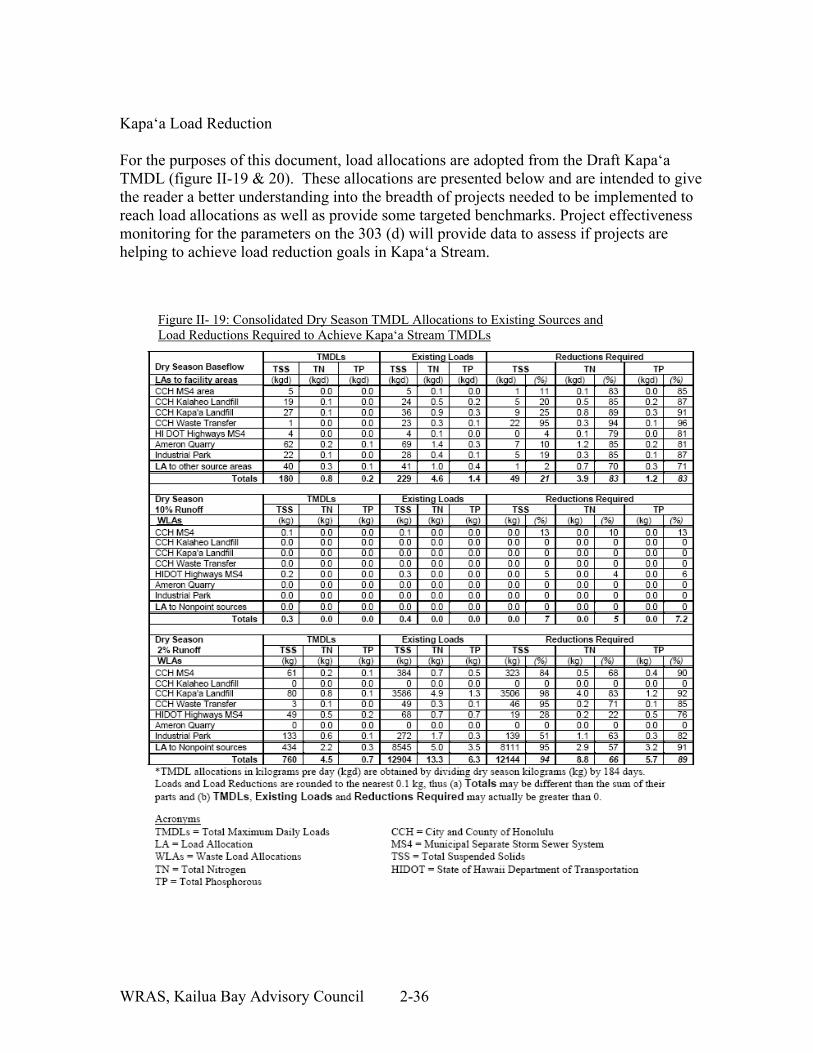
WRAS, Kailua Bay Advisory Council 2- 36
Kapa‘a Load Reduction For the purposes of this document, load allocations are adopted from the Draft Kapa‘a TMDL (figure II-19 & 20). These allocations are presented below and are intended to give the reader a better understanding into the breadth of projects needed to be implemented to reach load allocations as well as provide some targeted benchmarks. Project effectiveness monitoring for the parameters on the 303 (d) will provide data to assess if projects are helping to achieve load reduction goals in Kapa‘a Stream.
Figure II- 19: Consolidated Dry Season TMDL Allocations to Existing Sources and Load Reductions Required to Achieve Kapa‘a Stream TMDLs
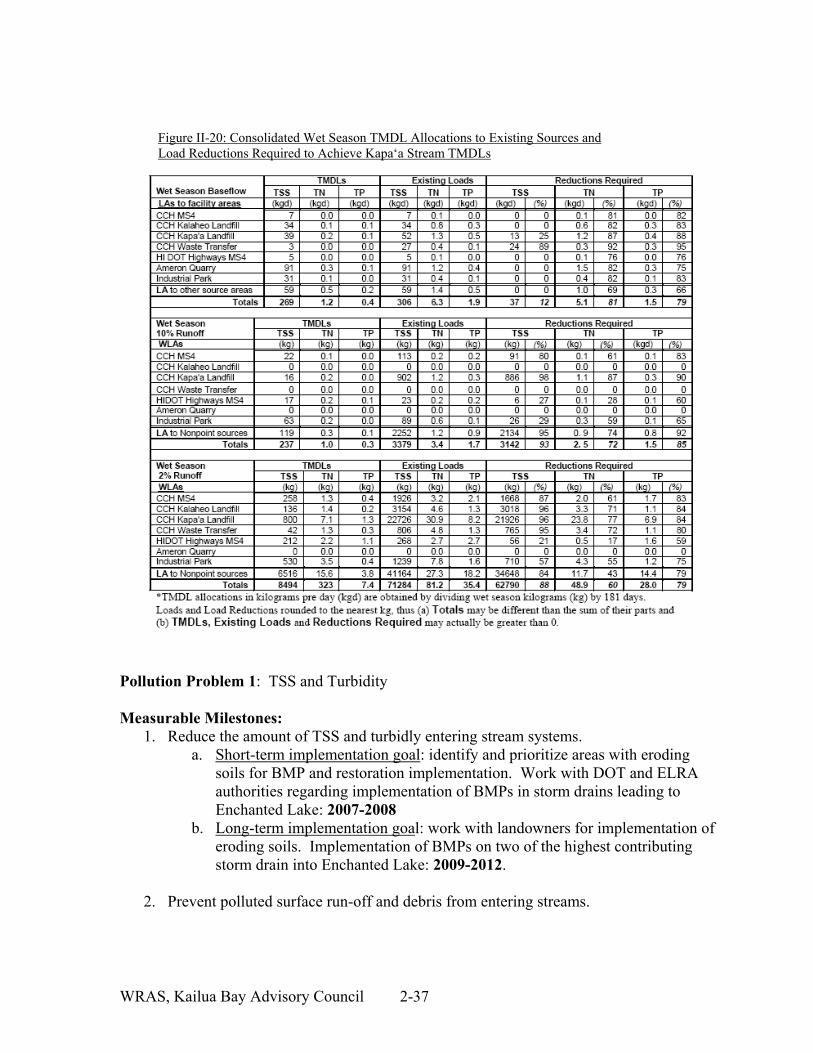
WRAS, Kailua Bay Advisory Council 2- 37
Pollution Problem 1: TSS and Turbidity Measurable Milestones:
1. Reduce the amount of TSS and turbidly entering stream systems. a. Short-term implementation goal: identify and prioritize areas with eroding
soils for BMP and restoration implementation. Work with DOT and ELRA authorities regarding implementation of BMPs in storm drains leading to Enchanted Lake: 2007-2008
b. Long-term implementation goal: work with landowners for implementation of eroding soils. Implementation of BMPs on two of the highest contributing storm drain into Enchanted Lake: 2009-2012.
2. Prevent polluted surface run-off and debris from entering streams.
Figure II-20: Consolidated Wet Season TMDL Allocations to Existing Sources and Load Reductions Required to Achieve Kapa‘a Stream TMDLs

WRAS, Kailua Bay Advisory Council 2- 38
a. Short-term implementation goal: work with City/County of Honolulu on scheduling street sweeping along Keolu Loop and other prioritized areas: 2007-2008
b. Long-term implementation goal: Seeks funds and partner with City/County to implement regular street sweeping: 2008.
3. Treat surface water runoff.
a. Short-term implementation goal: conduct scoping phase with landowner, business owners and potential funders to determine interest in implementing pilot project to capture and recycle storm water. 2008-2009
b. Long-term implementation goal: Implement a pilot project to capture rain/storm water at individual residents and commercial lots: 2010-2012
Pollution Problem 2: Trash Measurable Milestones:
1. Prevent illegal littering. a. Short-term implementation goal: establish a “citizen’s watch” to prevent
illegal dumping: 2008-2009 b. Long-term implementation goal: increase penalties and enforcement.
2. Reduce water quality impacts from recreational use of waterways.
a. Short-term implementation goal: provide more trash cans at public beaches: 2009-2010.
b. Long-term implementation goal: public information campaign on sanitary practices for recreational beach and bay use: 2010.

WRAS, Kailua Bay Advisory Council 2 -39
Figure II-21: Kailua Management Recommendation Table
Implementers/PartnersPotential Funders
Polluant(s): nutrients, turbidity, total nitrogen and
phosphorous, enterococci, sediment and chlorophyll a
Complete and implement TMDL; follow recommendations, $$ DOH, ELRA, KBAC, NGOs and
landowners
Nutrients, Total Nitrogen & Phosphorous ID and replace cesspools $$
Turbidity constructrion site BMPs, riparain vegetation $$
Polluants: nutrients, turbidity, suspended solids,
and metals
Complete and implement TMDL; follow recommendations $$$ DOH,DOH, KBAC, NGOs,
Ameron and private landowners
Turbidity & suspended solids Vegetate and protect steep slopes, close off-
road traffic and revegetateSSS Local/regional/national
foundations, federal grants
Tubidity work with Ameron on runoff issues $ KBAC, Ameron Hawaii
Polluant(s): nutrients, turbidity, and trash
Complete and implement TMDL; follow recommendations,landowner education, ,
install trash recepicals, quarterly stream clean-ups
$$$ DOH,DOH, KBAC, NGOs and landowners
Tubibity vegetate and protect steep slopes SSS Local/regional/national
foundations, federal grantsTrash
landowner and public education $$ KBACMau
naw
ili S
tream
Water Quality Limited Segments, 2004 303(d) List
Source(s):
Local/regional/national foundations, federal grants
Kap
a‘a
Stre
am
Water Quality Limited Segments, 2004 303(d) List
Source: Steep slope erosion, Ameron Hawaii,
H3 (turbidity), ground water and landfill leaching (nutrients), landfill
(metals)
Est. Cost
Ka‘
elep
ulu
Stre
am
Water Quality Limited Segments, 2004 303(d) List
Source(s): steep slopes, bare soil and construction
sites (turbidity), residential use of fertilizers and pesticides, wastewater
treatment plants and animal droppings in addition to urban runoff (nutrients)
Stream/ Waterbody Problem Category Polluant(s)/Source(s) Management Measure
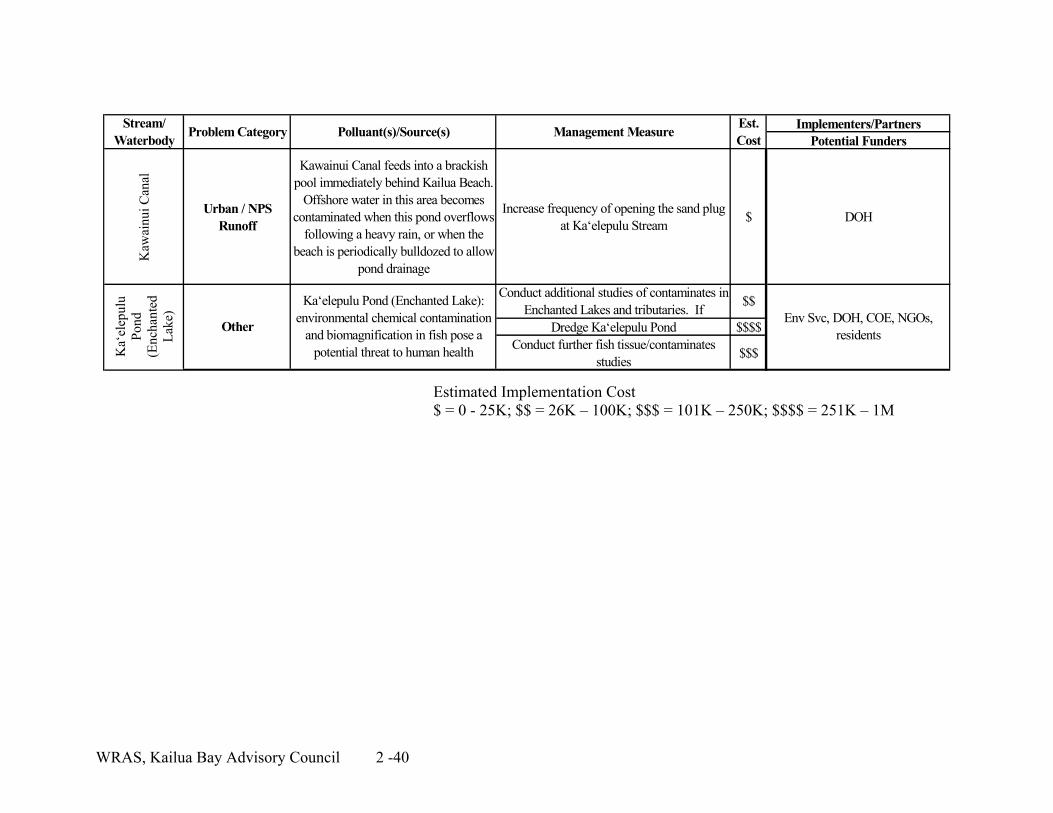
WRAS, Kailua Bay Advisory Council 2 -40
Estimated Implementation Cost $ = 0 - 25K; $$ = 26K – 100K; $$$ = 101K – 250K; $$$$ = 251K – 1M
Implementers/PartnersPotential Funders
Kaw
ainu
i Can
al
Urban / NPS Runoff
Kawainui Canal feeds into a brackish pool immediately behind Kailua Beach.
Offshore water in this area becomes contaminated when this pond overflows
following a heavy rain, or when the beach is periodically bulldozed to allow
pond drainage
Increase frequency of opening the sand plug at Ka‘elepulu Stream $ DOH
Dredge Ka‘elepulu Pond $$$$Conduct further fish tissue/contaminates
studies $$$
Conduct additional studies of contaminates in Enchanted Lakes and tributaries. If $$
Env Svc, DOH, COE, NGOs, residents
Management Measure Est. Cost
Ka‘
elep
ulu
Pond
(E
ncha
nted
La
ke)
Other
Ka‘elepulu Pond (Enchanted Lake): environmental chemical contamination
and biomagnification in fish pose a potential threat to human health
Stream/ Waterbody Problem Category Polluant(s)/Source(s)

WRAS, Kailua Bay Advisory Council 2-41
D. Kane‘ohe Watershed Nearly half the shoreline of the Ko‘olaupoko district surrounds Kane‘ohe Bay. There are five major islands in the Bay: Moku o Lo‘e (Coconut Island), Mokoli‘i (Chinaman’s Hat), Kapapa, Ahu o Laka, and Kekepa (Turtle Back Rock). Two natural shallow channels cross the barrier reef into the bay, the northwest Mokoli‘i Passage and the southeast Kane‘ohe Passage (called Sampan Channel). Kane‘ohe Bay has three inshore to offshore zones: a fringing reef zone, a lagoon zone, and a barrier reef complex. Three types of reefs -- fringing, patch, and barrier -- are found in the Bay. For the most part, fringing reefs are present around the shoreline, except for gaps were freshwater streams enter the Bay or where modified by dredging. Kane‘ohe Bay is divided into three distinctive regions based on physical characteristics and human activity. The southern region of the Bay has the most restricted water circulation, receives the most impact from adjacent coastal land use, and has the lowest average salinity. The most urbanized residential, commercial, and industrial lands of the watershed surround it. This area was the most heavily dredged, significantly altering the coral reef network. The University of Hawai‘i’s Institute of Marine Biology, a world-renowned marine research facility, is located on Moku o Lo‘e (Coconut Island) between the southern and central Bay regions. A number of recreational activities occur in the central Bay region, as this section is easily accessed from He‘eia Kea Harbor, the only major public boat ramp in the bay. He‘eia Kea Harbor is the point of origin for most commercial recreational activity, commercial and recreational fishing. The offshore sand bar remains a favorite destination for many commercial and recreational boaters. The northern region of the bay is the most oceanic. There is a large influx of ocean water over the deeper parts of the barrier reef and through Mokoli‘i channel. The northern section of the bay is much quieter, as most of the land surrounding it has remained rural and people pursue low impact activities, such as fishing. More than 30 Hawaiian fishponds once existed in Kane‘ohe Bay. They were strategically located in direct relationship to streams and depended heavily on fresh water and its associated nutrients. Hawaiian fishponds often served to buffer the impacts of large discharges of fresh water in the offshore marine environment. Recent findings support the theory that fishponds served as sediment collection basins as nutrient levels are found to be consistently lower in fishponds as compared to levels detected in outside waters. Today, only six fishponds remain intact within the bay, alongside eight others on the Mokapu Peninsula. Of these, only three–Kahouna, He‘eia, and Moli‘i–are capable of fish production.
E. Southern Kane‘ohe Watershed
The discussion of South Kane‘ohe (figure II-22) is divided into the two ahupua‘a, Kane‘ohe and He‘eia. In this plan, South Kane‘ohe reaches from He‘eia south to include the ridgeline
WRAS, Kailua Bay Advisory Council 2-42
between Kane‘ohe and Kailua; these two ahupua‘a of Kane‘ohe and He‘eia are watersheds of the larger area encompassed by Kane‘ohe Bay Watershed (which includes the North Kane‘ohe area discussed above). South Kane‘ohe includes He‘eia, Kea‘ahala, Kane‘ohe (Kamo‘a‘ali‘i), and Kawa Streams and covers 11,500 acres, making it the largest ahupua‘a in the Ko‘olaupoko region. These two ahupua‘a–He‘eia and Kane‘ohe–are the most urbanized with the most radically altered landscape. South Kane‘ohe is almost entirely developed, and most of its streams have been channelized. He‘eia–washed away. The mo‘olelo of the ahupua‘a tell of the primordial ancestor, Wakea, his wife, Haumea, and their followers being “washed away” in a big wave. Hawaiians of old said that the souls of the dead leapt from He‘eia into the sea after being judged. Handy and Handy documented that the ahupua‘a had numerous taro lo‘i terraces and streams: He‘eia, Kalimukele (which flows into Kane‘ohe), the small Puolena, Haiku, and ‘Ioleka‘a, fed by the smaller stream, Kaiwike‘e. They also noted that the salt marshes at the He‘eia inlet from the fishpond could not be cultivated. Numerous sources write of a former sandy beach at He‘eia existing as late as 1929. Others say that the shoreline of Kane‘ohe Bay at one time glistened with white sand before Westernized agricultural practices were implemented in the watershed. The introduction of pineapple by Libby in the early 20th century loaded the waters with tons of sediment that sits in the offshore tidal flats along parts of the bay. Records document at least 22 fishponds in the area, many still intact at the beginning of the 1900s. Four ponds remain intact, including He‘eia fishpond, restored and in use today, which encloses the 88-acre pond with a 5,000-foot wall; Nu‘upia (225-acre pond, formerly three separate ponds); and Waikalua (11-acre pond), rebuilt in the 1930s and presently under restoration. Hawaiian stories tell of the eel, also seen as a mermaid, being the guardian of fishponds. The mo’olelo of Mokapu tell that the eel that guarded the royal fishponds created them by burrowing across the neck of land between Kane‘ohe and Kailua bays. In the two ahupua‘a, over ten heiau have been documented including Kawa‘ewa‘e and Leleahina (which measures 110 feet by 115 feet), both preserved and placed on the National Register of historic places. Sites of O‘ahu notes Chief Olopana built five heiau in the 12th century, including Kawa‘ewa‘e on the hillside near Kawa Stream, where Olopana ordered the sacrifice of Kamapua‘a, the pig god, who in turn killed Olopana and escaped. The rest appear to have been lost in history or destroyed, including Kukuiokane and the extensive Kaualauki (which measured 115-feet long, 10-feet high with a 20-foot slope) which were demolished by the construction of the H-3 Freeway and pineapple cultivation. Pineapple plantations also destroyed a slide in the hills above Kane‘ohe, used by Hawaiians in their robust, dangerous dry-land skiing game of holua. Old timers claim that pineapple cultivation ended in Kane‘ohe because the plantation destroyed the heiau; others say the climate was too wet to grow pineapple. He‘eia ahupua‘a extends across the bay to a portion of Mokapu, originally called Mokukapu—sacred (taboo) island/peninsula--where myriad archaeological sites have been documented and matched with mo‘olelo too numerous to recount in this document. The remaining Mokapu sites on its southern side are located within the Kane‘ohe ahupua‘a. Kamakau wrote of Mokapu being the place where the gods Lono, Ku, and Kane created

WRAS, Kailua Bay Advisory Council 2-43
people from earth. In the 16th century, King Peleiholani’s palace sat next to Nu‘upia Fishpond and the bay. A century later, Kamehameha also selected the site as his royal meeting place. In olden times, the sea around Mokapu was kapu, with the ali‘i having the sole right to take fish. In 1918, the U.S. military’s extensive construction on the site uncovered and disrupted many graves of Hawaiians, the largest known burial site located to date in the State. Today, Mokapu is the only surfing spot in Kane‘ohe, but as a U.S. military base and airfield, it remains off limits to the public. The island of Moku o Lo‘e–the island of the curve of a fishhook (Coconut Island)–sits offshore within the boundaries of the ahupua‘a of He‘eia. According to the mo‘olelo, the island, which served the Hawaiian ali‘i, is named for one of the four children banished to Kane‘ohe from ‘Ewa for their misconduct. It later provided a sanctuary for First Lady Jacqueline Kennedy and her children in the wake of President Kennedy’s assassination, and it currently houses a research institute for the University of Hawai‘i Manoa. Kane‘ohe–bamboo husband– ahupua‘a named for the story: “A woman asked another, ‘Is he a good husband?’ The second woman replied, ‘He kane ‘ohe.’” (He is like a bamboo knife). Handy and Handy offer Portlock’s description of the area in the early 18th century: “...The bay all around has a very beautiful appearance, the low land and valleys being in high state of cultivation, and crowded with plantations of taro, sweet potatoes, sugar cane, etc., interspersed with a great number of coconut trees, which renders the prospect truly delightful.” With one of the most intricate taro complexes in the islands, patches ranged in size from 40 square feet (which could feed one person for a year) to 2-3 acres. Today, the plantations have been replaced by buildings and most of the major streams have been channelized to prevent flooding and to safeguard development next to streams, with Kawa Stream being slated for more channelization in the near future. The largest stream system above the mouth of Kane‘ohe Stream, sometimes called Kamo‘oali‘i Stream, forms three pana (distinguished places) for the three reaches that merge into the main stream. The mo‘olelo names each reach: Hi‘ilaniwai (cherished water), Kahuaiki, and Mamalahoa. They are wives of the god Kane; they meet at Ho‘okui ana keia o na wai a Kane, the place where Kane can meet the three women harmoniously, thus preventing individual jealousy. If they were to become jealous, they would divert their courses causing suffering to the people of the valley. The sacred water from this site was used for ceremonial cleansing and taken home for spiritual healing. Kamo‘oali‘i Stream is named for the story of a prince from Kaena Point; he had arranged to meet a princess from Maui at a stream in Kane‘ohe. Arriving first, the princess mistook a handsome man there to be the prince, but when the prince came he saw a half-man and half-lizard (mo‘o) carry the princess into the stream. He cried out for her and that place is now called UE Wahine. Other Hawaiian stories tell of how the only red dirt in the district came to Ko‘olaupoko. When the Kane‘ohe chief, Manu-ka (Frightener of Birds) died, he was buried in a large grave. But before he was covered, the akua (god) brought red dirt from ‘Ewa to fill the grave, creating a red hill. In 1795, when Kamehameha conquered O‘ahu, he kept Kane‘ohe, passing

WRAS, Kailua Bay Advisory Council 2-44
it to his sons Liholiho and Kauikeaoli when he died in 1819. With Kauikeaoli’s death, Queen Kalama, his wife, received the lands. Since 1940, Kane‘ohe’s population grew from 5,387 to 29,622 by 1960. With the completion of the Pali Highway in 1957, and three years later the additions of the Likelike Highway and Wilson Tunnel connections, Kane‘ohe became a bedroom community to Honolulu. Over the next 20 years, its population rose to 47,335, a 60% increase. By the 1990s, three major highways, including the H-3 Freeway, connected Kane‘ohe to the rest of the island. Population projections predict only 1/2% increase annually.
Figure II-22: South Kane‘ohe Region
WRAS, Kailua Bay Advisory Council 2-45
Pu‘u Hawaii Loa Sub-basin Summary
Sub-watershed summary Pu‘u Hawaii Loa Watershed is 2,330 (943 hectares) with a maximum elevation of 524 feet (160 meters). The streams total 1.7 miles (2,800 meter) in length. The watershed is comprised of the Marine Corp Base Hawai’i with nearly 50% of its landscape committed to development. The 2000 Census list 14,931 reside in the watershed. Identified pollutants Pu‘u Hawaii Loa is not on the 303 (d) listed for any pollutants.

WRAS, Kailua Bay Advisory Council 2-46
Kawa Sub-basin Summary
Sub-watershed summary Kawa Stream (figure II-23) originates from springs in the Ko‘olau Mountains draining approximately 1,336 acres (541 hectares). Kawa flows through residential and light industrial areas, passes through remnants of Waikalua-Loka fishponds (Kawa TMDL. 2002) before it enters into South Kane‘ohe Bay. Kawa Stream is perennial with approximately 2.8 miles (4,499 meters) of mainstem and tributary streams. The average continuous mainstem flow is not well documented with one study suggesting approximately one-million gallons per day enter the bay (State of Hawai‘i, Oct. 2002) with an average mainstem gradient of 11%. The watershed has a maximum elevation of 938 feet (286 meters) rising above its lowest elevation at sea level. The 2000 Census estimates 12,273 residents live in the sub-basin. Figure II-23: Kawa Watershed

WRAS, Kailua Bay Advisory Council 2-47
Identified pollutants Kawa stream is on the 2004 303 (d) list for nutrients, turbidity and suspended solids. A TMDL completed in 2002 identified sources of pollutants based on existing and newly collected monitoring data. For nutrients, A Total Maximum Daily Load Implementation Plan for watershed health notes, the largest source areas for these loads [nitrogen] seem to be cemetery lands and residential areas (combined, about 68% of total loads), where as the largest source areas for phosphorous loads seem to be forest land and residential area (combined, about 67% of the total loads). Additionally, the largest source areas for sediment loads seem to be residential areas and cemetery lands (combined, about 65% of the total load). Kawa Stream functions basically as a storm drain that rushes polluted runoff water from the watershed directly into Kaneohe Bay as quickly as possible – precluding the potential for pollution reduction and recycling that could be accomplished by a normally-functioning stream system (Hawai‘i’s Department of Health Environmental Planning Office, February 2001). A stream bioassessment concludes the overall habitat quality of Kawa Stream is Non-supporting for biotic integrity, causing the biotic integrity of Kawa Stream to be Moderately impaired to Impaired. The different sections of Kawa Stream all share some characteristics of poor habitat quality such as a low percentage of native plants in the riparian zone, a lack of understory, a high sediment load, and embedded stream bottom. (Hawai‘i’s Department of Health Environmental Planning Office, February 2001). NSPECT modeling approximates Kawa watershed contributing nearly 450,000 kg of TSS and over 26,000 kg annually to the stream. Environmental impacts Kawa Stream is a Class 2 inland water body. The objective of class 2 waters, is to protect their use for recreational purposes, the support and propagation of aquatic life, agricultural and industrial water supplies, shipping, and navigation. (Hawai‘i Administrative Rules §11-54-03). In its current condition, Kawa Stream supports only aquatic life uses (mainly introduced and invasive species); irrigation (use varies depending upon crop cycles and water availability during low flow conditions), and limited recreational uses (hampered by low flows, nuisance vegetation, and poor water quality) (State of Hawai‘i. 2002). Kawa’s receiving waters, South Kane‘ohe Bay, is listed on the 2004 303 (d) list for nutrients, nitrates/nitrites, NH4 (ammonia), turbidity, chlorophyll a and enterococci. The receiving waters within Kane‘ohe Bay provide important habitat for freshwater and marine species of importance to subsistence, commercial and cultural uses. Based on the environmental impacts of Kawa Stream and the uses of the receiving waters, potential effects for Kawa Stream include:
Health and human safety: no health and human safety issues are known as a result of impaired water quality in Kawa Stream;

WRAS, Kailua Bay Advisory Council 2-48
Economic resources: no known direct economic resources are impacted as a result of impaired water quality in Kawa Stream. However, degraded fisheries habitat such as coral reefs likely have an indirect economic impact in lost fishing opportunities, both commercially and recreationally; and
Recreation: currently, Kawa does not support recreation as a result of water quality
conditions. Limited recreational uses are available in Kawa due to low flows, nuisance vegetation and poor water quality (State of Hawai‘i. 2002). Additionally, unchecked turbidity will increasingly have a negative impact on recreation opportunities in Kane‘ohe Bay.
Management measures A number of management measures are recommended to address the nutrients, turbidity and suspended solids in Kawa stream. Theses recommendations, adopted from, A Total Maximum Daily Load Implementation Plan for watershed health (Oct. 2002), include: Nutrients
Use best management practices for fertilizer use in agriculture, golf courses, and landscaped areas (cemeteries, lawns, parks, school grounds) including:
Erosion and Sediment
Use best management practices for controlling erosion and sedimentation, including:
o Identify badly eroding hillslopes and stream banks o Revegetate hillslopes to reduce their erodibility o Create sediment detention/retention basins to manage hillslope runoff o Create vegetated buffers along the stream to filter runoff and prevent it
from reaching stream o Revegetate stream banks with plants that have extensive root systems to hold
soil o Reduce herbicide use on vegetated stream banks and buffers o Reduce erosion in deeply incised channel sections by stabilizing stream banks
with toe protection and/or bank protection (e.g. boulders, gabions, vegetative root structure)
In addition to these recommendations, specific recommendations include:
Create a partnership and provide technical support to Hawai‘i Veterans Cemetery and Hawai‘i Memorial Park Cemetery for fertilizer management, erosion, irrigation and weed and pest management (High Priority);
Create partnership with Bayview Golf Course for fertilizer management, erosion
control, irrigation and riparian planting. Upward of 1,300’ (400 meters) on both sides of Kawa Stream could potentially benefit from native plantings (High Priority).

WRAS, Kailua Bay Advisory Council 2-49
Implement bank stability in the upper reaches of Kawa Stream (station # 8 from the Kawa Stream Bioassessment, February 2001) (High Priority)
We recommend that revegetation efforts take place at every section of stream that is
not hardened. The City and County of Honolulu maintenance crews who denude the stream banks near Castle High School with over-application of herbicides should be asked to evaluate their maintenance goals and attempt to find alternative methods to achieve their intended goal (Hawai‘i Department of Health, February 2001) (High Priority);
Work with Castle High School on Storm Water Management and Riparian
Restoration opportunities and watershed education; and
Distribute homeowner/resident educational curriculum and management guidelines for nutrient and fertilizer application appropriate for small-scale urban gardening and lawn care, resources available at (http://www2.ctahr.hawaii.edu/rwq/resource_materials/nutrient.htm). Curriculum should include application rates and timing of various chemicals, signs of over treatment, native vegetation options to reduce nutrient loading and the effects of chemicals on ground, surface, and ocean waters.
Implementation feasibility Pollutant source contributors are identified in Kawa Stream, cemeteries for nutrients and eroding stream backs for turbidity and total suspended solids, implementing the prescribed recommendations via active watershed restoration and education can be both feasible and effective. Efforts to educate landowners concerning available and effective erosion control BMPs could help reduce the sediment load in the system. Stream restoration techniques that use porous buffers and stream bank stabilization methods to cut erosion, slow the flow of storm waters and create stream habitat would be appropriate remedies (State of Hawai‘i., Oct. 2002). Working with cemeteries and golf courses to implement alternative methods of fertilizers, application rates and erosion control practices can be effective given the scale (multiple sites) and identified sources of pollution.

WRAS, Kailua Bay Advisory Council 2-50
For the purposes of this document, load allocations are adopted from the Kawa TMDL (figure II-24). These allocations are presented below and are intended to give the reader a better understanding into the breadth of projects needed to be implemented to reach load allocations as well as provide some targeted benchmarks. Project effectiveness monitoring for the parameters on the 303 (d) will provide data to assess if projects are helping to achieve load reduction goals in Kawa Stream
Figure II-24: Load Reductions Required to Achieve Kawa Stream TMDLs

WRAS, Kailua Bay Advisory Council 2-51
Kane‘ohe Sub-basin Summary Sub-watershed summary Kane‘ohe Stream (figure II-25) originates in the Ko’olaupoko Mountains, flows through a variety of land uses, and drains into Southern Kane‘ohe Bay. The watershed totals approximately 3,641 acres (1,473 hectares) with 20 miles (31,744 meters) of perennial and intermittent streams. The watershed has a maximum elevation of 2,792 feet (851 meters) rising above it lowest elevation at sea level. Based on the 2000 Census, 18,280 residents reside in the watershed with the majority living in the lower makai area. Figure II-25: Kane‘ohe Watershed

WRAS, Kailua Bay Advisory Council 2-52
Identified pollutants Two streams in the watershed are on the 2004 303 (d) list for pollutants: Kane‘ohe Stream for nutrients, turbidity and dieldrin and Kamo‘oali‘i Stream for nutrients and turbidity. Currently, a TMDL is being conducted for both streams. Based on the five major land use types and other scientific literature review, the likely contributors for pollutants come from a variety of sources including;
turbidity: eroding slopes and surface runoff from roads; nutrients: sewage systems; and dieldrin: residuals from past agricultural practices and pest control.
The Kane‘ohe watershed, according to NSPECT modeling has the potential to contribute nearly 1.5 million kg of TSS, over 100,000 kg of nitrogen and 10,000 kg of phosphorus annually into the stream system. Environmental impacts Kane‘ohe Watershed drains into southern Kane‘ohe Bay, which is designated as Class AA waters, providing the highest priority water quality protection; therefore, upland problems such as turbidity caused by erosion can directly impact Kane‘ohe Bay. The receiving waters within Kane‘ohe Bay provide important habitat for freshwater and marine species of importance to subsistence, commercial and cultural uses. Dieldrin was widely used in pesticides for agricultural practices until banned in 1974; however, its use for termite control was permitted until 1987. Dieldrin in soil or water degrades very slowly, sticks to soil and may stay there unchanged for many years (Department of Health and Human Services, Agency for Toxic Substances and Disease Registry, website). Based on the environmental impacts of Kane‘ohe Watershed and the uses of the receiving waters, potential effects for Kane‘ohe Watershed include:
Health and human safety: no health and human safety issues are known as a result of impaired water quality in Kane‘ohe Watershed; however, dieldrin in drinking water could pose a potential risk. The EPA notes, dieldrin at very low concentrations indicated by monitoring data, coupled with the fact that they are no longer manufactured or used in this country; indicate that aldrin/dieldrin concentrations of concern are unlikely to be found in public water systems (EPA, 2003).
Economic resources: no known direct economic resources are impacted as a resulted
of impaired water quality in Kane‘ohe Watershed. However, degraded fisheries habitat such as coral reefs likely have an indirect economic impact in lost fishing opportunities, both commercially and recreationally; and
Recreation: limited stream-based recreation exist in Kane‘ohe Watershed; However,
unchecked turbidity will increasingly have a negative impact on recreation opportunities in the receiving waters of Kane‘ohe Bay.

WRAS, Kailua Bay Advisory Council 2-53
Management measures Kane‘ohe Watershed is dominated largely by forested lands (30%) and other land use (shrub/scrub, 43%) and has limited large agriculture (1%) or intense industrial development; however, nearly 23% of the sub-basin is developed (mostly residential) with significant impervious surface (figure II-126). Sewage sources provide most of the anthropogenic nitrogen loads to southern Kane‘ohe Bay (Hoover, 2002). As a result of this, it’s likely the majority of nitrogen in Kane‘ohe watershed is derived from cesspools or leaking sewer pipes. Turbidity is likely derived from eroding hill-slopes in forested land, construction areas and potentially eroding streams banks in the watershed. To address erosion from riparian areas, calculations from the Precision Riparian Buffer Model, estimate a potential to preserve over 22 acres (9 hectares) of riparian habitat owned by large landowners in the Kane‘ohe watershed. To address these issues and opportunities, KBAC recommends the following management measures: Nutrients
Identify and prioritize cesspools for decommissioning/retrofitting for on-site septic system hook-up. Creating a technical assistance program to inventory, assess and prioritize cesspools for conversion should be the first step. Once this is completed, KBAC and other organizations should work with City, County and State officials to create options for landowners for cesspool replacement. Options could include creating tax incentives for landowners, partnering with financial institutions for low-interest loans and available grants from the EPA, Hawai‘i DOH and private foundations.
Turbidity
Research, prioritize and contact large landowners for riparian preservation (High Priority)
Identify erosion from anthropogenic and natural causes in upper watershed (figure II-
27), implement road decommissioning and native vegetation planting, riparian restoration;
Create partnership programs with City and County of Honolulu for street sweeping in
areas with increased sediment from construction, natural erosion, etc; Dieldrin
Dieldrin is no longer used for agriculture purposes or termite control. KBAC makes no recommendation on the best way to avoid or remove dieldrin residuals.
Implementation feasibility Identifying cesspools for conversion to septic system is possible for documented cesspools; however, there are likely undocumented cesspools within the watershed. Identifying opportunities to revegetate erosive areas is feasible and could be successful to control

WRAS, Kailua Bay Advisory Council 2-54
sediment entering streams if implemented on a large enough scale which crosses ownership. Partnering with the large landowners identified for perseveration and restoration of riparian habitat could provide significant protection and restoration opportunities for riparian habitat. This should be a high priority project in Kane‘ohe and tributaries to improve watershed health starting with the largest properties first.
Kane'ohe Land use(Hectares)
High Int ensit y Development , 217, 6%
Forest ed Lands, 1134, 30%
Ot her, 1687, 43%
Wet lands, 215, 6%
Agricult ural Lands, 28, 1%
Low Int ensit y Development , 533, 14%
Figure II-26: Kane‘ohe Land use
Figure II-27 Upland erosion

WRAS, Kailua Bay Advisory Council 2-55
Kea‘ahala Sub-basin Summary
Sub-watershed summary Kea‘ahala is the smallest watershed (figure II-28) in the Ko’olaupoko moku at approximately 312 acres (126 hectares) and 1.9 miles (3,043 meters) in length with an average stream gradient of seven percent (7%). The stream originates in the foothills of the Ko‘olau Mountains (figure II-20) flowing to its receiving waters in southern Kane‘ohe Bay. The watershed’s maximum elevation is 1,470 feet (448 meters) rising above its lowest point at sea level. Based on data from the 2000 Census, 14,236 people reside in the watershed. Figure II-28: Kea‘ahala Watershed

WRAS, Kailua Bay Advisory Council 2-56
Identified pollutants Kea‘ahala Stream is a high priority stream on the 2004 303 (d) list for nitrite/nitrates, total nitrogen and phosphorus, turbidity and trash. Limited monitoring has been conducted to determine likely sources of pollutants. However, based on land use in the watershed and sources of pollutants in the surrounding watersheds, inferences can be made. Nitrites, nitrates, total nitrogen and phosphorus are likely from personal use of yard fertilizers and sewage sources such as cesspools, or antiquated sewer infrastructure and polluted run-off. Because the watershed has fewer steep slopes compared to other watersheds, turbidity is likely derived from construction runoff and sediment collected on impervious surfaces such as roads and parking lots, while trash is from anthropogenic sources.
Environmental impacts Kea‘ahala Stream flows into Southern Kane‘ohe Bay, which is designated as Class AA waters, providing the highest priority water quality protection. The receiving waters in Southern Kane‘ohe Bay are listed for nutrients, nitrites/nitrates NH4, turbidity, chlorophyll A and enterococci on the 2004 303 (d) list. The receiving waters within Kane‘ohe Bay provide important habitat for freshwater and marine species of importance to subsistence, commercial and cultural uses. Based on the environmental impacts of Kea’ahala Stream and the uses of the receiving waters, potential effects for Kea’ahala Stream include:
Health and human safety: no health and human safety issues are known as a result of impaired water quality in Kea‘ahala; nevertheless, the receiving waters are classified for highest priority protection of water quality.
Economic resources: no known direct economic resources are impacted as a resulted
of impaired water quality in Kea‘ahala Watershed. However, degraded fisheries habitat such as coral reefs likely have an indirect economic impact in lost fishing opportunities, both commercially and recreationally; and
Recreation: little, if any recreational opportunities exist in the stream as a result of
water quality and channelization. Additionally, unchecked turbidity will increasingly have a negative impact on recreation opportunities in Kane‘ohe Bay.
Management measures Kea‘ahala Watershed is a very small watershed, highly populated with fifty-three (53) percent of the watershed converted to development with the stream lined with concrete for the majority of its length (figure II-229). As a result of these factors, the stream does not have the ability to filter pollutants through natural processes such as nutrient uptake from riparian vegetation and has limited exchange between surface and ground water. To address these issues, KBAC recommends the following management measures:

WRAS, Kailua Bay Advisory Council 2-57
Nitrite/Nitrates, Total Nitrogen and Phosphorus Identify and prioritize cesspools for decommissioning/retrofitting for on-site
wastewater disposal (High Priority); and
Distribute homeowner/resident educational curriculum and management guidelines for nutrient and fertilizer application appropriate for small-scale urban gardening and lawn care, resources available at (http://www2.ctahr.hawaii.edu/rwq/resource_materials/nutrient.htm). Curriculum should include application rates and timing of various chemicals, signs of over treatment, native vegetation options to reduce nutrient loading and the effects of chemicals on ground, surface, and ocean waters.
Turbidity
Create partnership programs with City and County of Honolulu for street sweeping in areas with increased sediment from construction, natural erosion, etc.; and
Implementation of runoff and erosion control on construction sites.
Trash
Work with Windward Ahupua‘a Alliance on streamlining process at County level for community clean-ups and trash removal; and
Implement quarterly stream clean-ups (Medium Priority).
General Recommendation:
Implement pilot project in Kea‘ahala watershed to capture rain/storm water on residential and commercial lots (High Priority).
Implementation feasibility Educating landowners and residents regarding implementation of BMPs can be an effective tool to reduce pollutants entering Kea‘ahala Stream. However, residents need repeated exposure to the importance of the BMPs to change their behavior. With the large number of land parcels in the watershed and the lack of a specific, identified source, full participation and cooperation from residents is unlikely. Thus, implementing an education curriculum is feasible, but may not show significant results in the near term that reduce nitrates and nitrates. Identifying cesspools for opportunities for conversion to sewer is possible for documented cesspools; however, there are likely undocumented cesspools within the watershed. Creating a partnership with the City and County of Honolulu to implement street sweeping is possible; however, with limited resources for this, sweeping should be prioritized to have the greatest positive impact on water quality. Creating a pilot project to capture rain/storm water at individual residents and commercial lots is feasible and could prove effective to limit the amount of storm water and the

WRAS, Kailua Bay Advisory Council 2-58
subsequent polluted run off entering Kea‘ahala Stream. Programs such as disconnecting downspouts, creating rain gardens, creating permeable surfaces and using rain barrels can be effective methods.
Figure II-29: Kea‘ahala Stream

WRAS, Kailua Bay Advisory Council 2-59
He‘eia Sub-basin Summary
Sub-watershed summary He’eia Stream (figure II-30) flows into Kane‘ohe Bay from the Ko‘olau Mountains draining approximately 2,843 acres (1,150 hectares) before entering Central Kane‘ohe Bay. He‘eia Stream is perennial with approximately 7.4 miles (11,909 meters) of mainstem and tributary streams. The average continuous mainstem flow is 2.8 cfs (Wilson Okamoto Corporation, 2004) with an average gradient of 11%. The watershed has a maximum elevation of 2,802 feet (854 meters) rising above its lowest elevation at sea level. He’eia watershed is culturally significant with a variety of archaeological sites including Kawa‘ewa‘e and Leleahina heiau and the very visible He’eia Fishpond (figure II-31). The 2000 Census estimates 13,595 residents reside within the watershed. Figure II-30: He‘eia Watershed
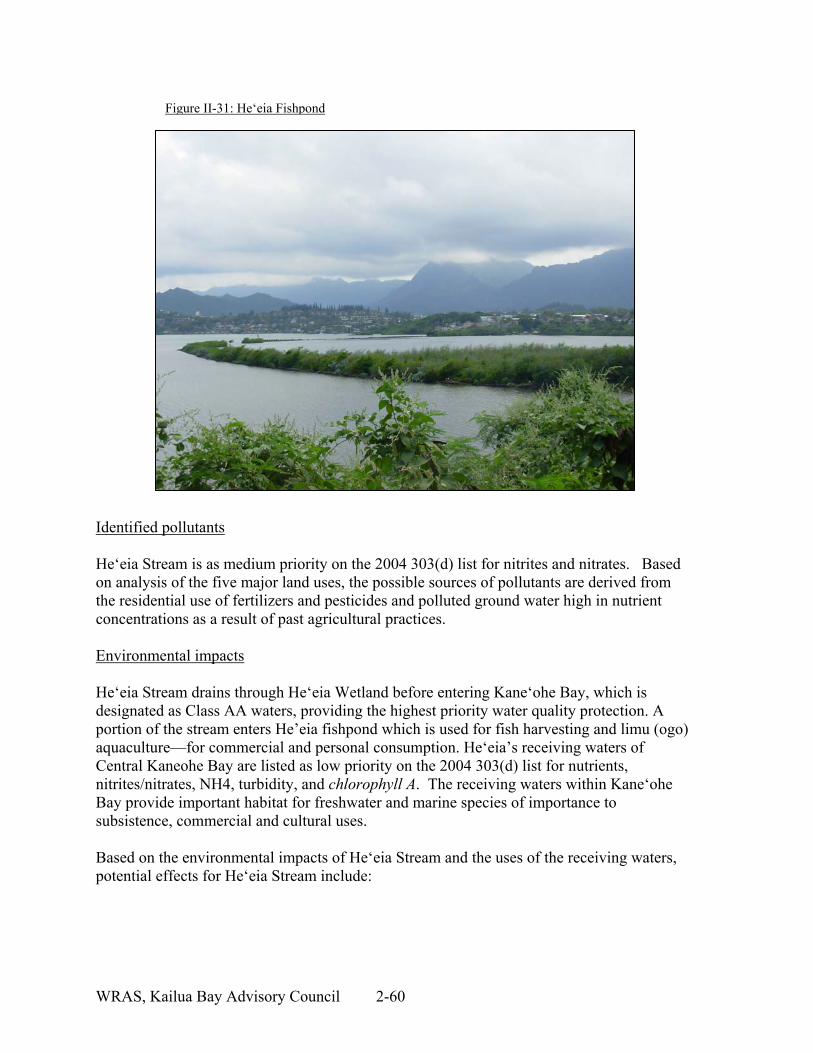
WRAS, Kailua Bay Advisory Council 2-60
Identified pollutants He‘eia Stream is as medium priority on the 2004 303(d) list for nitrites and nitrates. Based on analysis of the five major land uses, the possible sources of pollutants are derived from the residential use of fertilizers and pesticides and polluted ground water high in nutrient concentrations as a result of past agricultural practices. Environmental impacts He‘eia Stream drains through He‘eia Wetland before entering Kane‘ohe Bay, which is designated as Class AA waters, providing the highest priority water quality protection. A portion of the stream enters He’eia fishpond which is used for fish harvesting and limu (ogo) aquaculture—for commercial and personal consumption. He‘eia’s receiving waters of Central Kaneohe Bay are listed as low priority on the 2004 303(d) list for nutrients, nitrites/nitrates, NH4, turbidity, and chlorophyll A. The receiving waters within Kane‘ohe Bay provide important habitat for freshwater and marine species of importance to subsistence, commercial and cultural uses. Based on the environmental impacts of He‘eia Stream and the uses of the receiving waters, potential effects for He‘eia Stream include:
Figure II-31: He‘eia Fishpond

WRAS, Kailua Bay Advisory Council 2-61
Health and human safety: for consumptive use of fish and limu raised in He‘eia fishpond the levels of chemical pollution measured in He‘eia Stream do not pose a human health hazard for the indicated uses;
Economic resources: He‘eia Fishpond is not negatively impacted by the indicated
levels of chemical pollution; and
Recreation: no negative impacts are posed to recreation from nitrates and nitrites in the nearshore environment of Central Kane‘ohe Bay.
Management measures He‘eia watershed is dominated largely by forested lands (with scrub/scrub in higher elevation of the Ko’olau Mountains) and void of large agriculture or intense industrial development (figure II-32). As a result, pollutants are potentially derived from residents applying fertilizers and pesticides, which enter He‘eia Stream as polluted runoff via impervious surfaces. Additionally, a secondary source of nutrients is derived from polluted run-off from past agricultural practices. Based on the Precision Riparian Buffer Model, there is a potential to preserve over 91 acres (36 hectares) and restore 7acres (4 hectares) of riparian habitat owned by large landowners in the He‘eia sub-basins (figure II-33). To address these issues and opportunities, KBAC recommends the following management measures:
Permanently conserve and restore the wetlands at He‘eia Stream mouth, ensuring pollutants are filtered before entering Kane‘ohe Bay (High Priority);
o Research, prioritize and contact large landowners for riparian preservation and
restoration; (High Priority);
Distribute homeowner/resident educational curriculum and management guidelines for nutrient and fertilizer application appropriate for small-scale urban gardening and lawn care, resources available at (http://www2.ctahr.hawaii.edu/rwq/resource_materials/nutrient.htm). Curriculum should include application rates and timing of various chemicals, signs of over treatment, native vegetation options to reduce nutrient loading and the effects of chemicals on ground, surface, and ocean waters;
Partner with He‘eia State Park on water quality monitoring, restoration and
educational opportunities; and
Continue baseline monitoring of nitrate and nitrite levels to track changes over time and determine source.

WRAS, Kailua Bay Advisory Council 2-62
Implementation feasibility Educating landowners and residents regarding implementation of BMPs can be an effective tool to reduce pollutants entering He‘eia Stream. However, residents need repeated exposure to the importance of the BMPs to change their behavior. With the large number of land parcels in the watershed and the lack of a specific, identified source(s), full participation and cooperation from residents is unlikely. Thus, implementing an education curriculum is feasible, but may not show significant results in the near term that reduce nitrates and nitrates in the watershed without residents having repeated educational opportunities that result in actions that improve water quality. Partnering with the large landowners identified for perseveration and restoration of riparian habitat could provide significant protection and restoration opportunities for riparian habitat. This should be a high priority project in He‘eia and tributaries to protect and improve watershed health starting with the largest properties first.
He'eia Landuse (in hectares)
High Intensity Development, 70.38, 6%
Forested Lands, 360.72, 31%Other, 543.96, 48%
Wetlands, 30.87, 3%
Agricultural Lands, 2.25, 0%
Low Intensity Development, 141.48, 12%
Figure II-32 He‘eia Land use

WRAS, Kailua Bay Advisory Council 2-63
Figure II-33: He‘eia riparian restoration and preservation
WRAS, Kailua Bay Advisory Council 2-64
Pollution Problem 1: Nutrients in Urban Runoff Measurable Milestones:
1. Develop, implement, and periodically update nutrient and irrigation management plans for farms, nurseries, golf courses, and other operations.
a. Short-term implementation goal: provide information and resources to educate various landowners: 2008-2009
b. Long-term implementation goal: revisit landowners for feedback, updates on new technologies/applications, tie to monitoring efforts: 2009-2010
2. Identify and prioritize cesspools for decommissioning/retrofitting for sewer hook-up
or on-site septic system. a. Short-term implementation goal: work with Hawai‘i DOH to prioritizes
homes with cesspools in greatest need for up-grades: 2007-2009 b. Long-term implementation goal: work with private foundations, financial
intuitions, Hawai‘i DOH, EPA, legislators and others to create tax incentives, low interest loans and grants for cesspool replacement: 2008-2010.
c. Long-term implementation goal: work with prioritized homeowners on funding packages and cesspools replacement: 2010-2015.
Pollution Problem 2: Sediments in Urban Runoff Measurable Milestones:
3. Stabilize stream banks and restore stream bank function. a. Short-term implementation goal: prioritize riparian restoration projects listed
in Kawa Stream TMDL: 2007-2008. b. Short-term implementation goal: schedule meetings to introduce
opportunities, prioritize preservation and restoration projects with large landowners (federal government and State of Hawai‘i): 2007-2009.
c. Long-term implementation goal: implement riparian restoration and preservation projects: 2009-2015.
1. Implement construction BMPs to reduce runoff from building sites.
a. Short-term implementation goal: educational workshops with construction companies, developers and City/County building authorities or erosion control BMP: 2008-2009.
b. Long-term implementation goal: ensure that developers prepare and implement an approved erosion and sediment control plan or similar administrative document: 2009.

WRAS, Kailua Bay Advisory Council 2-65
Implementers/PartnersPotential Funders
Polluant(s): nitrite/nitrate
Complete and implement TMDL; follow recommendations, , $$$ DOH, KBAC, Friends of He'eia,
NGOs landowner education $$
Investigate sewer system at Haiku Village, hook to municipal system $$
Restore and preserve wetlands $$
Polluant(s): nutrients and turbidity
Complete and implement TMDL; follow recommendations, vegetate and protect steep
slopes$$$
Nutrients ID and replace cesspools $$
Turbidity vegetate and protect steep slopes $$$ Local/regional/national
foundations, federal grants Polluant(s):
nutrients, turbidity, and dieldrinComplete and implement TMDL; follow
recommendations $$$
Dieldrin No recommendations
Turbidity vegetate and protect steep slopes $$
Nutrients ID and replace cesspools $$
Pollutants: nutrients, turbidity, and suspended
solids
TMDL completed in 2002; follow recommendations $$$ DOH,KBAC, cemeteries, private
landowners
Source: cemetery lands and residential areas
(nutrients), forest land and residential
Nutrient, Turbidity and Suspended Solids Work with cemeteries and other landowners
for management plans$$ Local/regional/national
foundations, federal grants
Est. Cost
He‘
eia
Stre
am
Water Quality Limited Segments,
2004 303(d) ListSource(s):
Personal use of Fertilizers, pesticides, sewers system from Haiku Village
Stream/ Waterbody Problem Category Polluant(s)/Source(s) Management Measure
Local/regional/national foundations, federal grants
Kam
o‘oa
li‘i S
tream
Water Quality Limited Segments,
2004 303(d) List
DOH, KBAC, landowners
Source(s): steep slope (erosion), sewer systems
(nutrients)
Kan
e'ohe
Stre
am
Water Quality Limited Segments,
2004 303(d) List
DOH,KBAC, landowners
Source(s): steep slope (erosion), sewer systems
(nutrients) past ag practices (dieldrin) Local/regional/national foundations, federal grants
Kaw
a St
ream
TMDL Completed 2002
Figure II-34: South Kaneohe Mange Recommendation Table

WRAS, Kailua Bay Advisory Council 2-66
Implementers/Partners
Potential Funders
Pollutants: nitrite/nitrate, total nitrogen and phosphorous, turbidity, and trash
Complete and implement TMDL; follow recommendations $$$
nitrite/nitrate, total nitrogen and phosphorous
ID and replace cesspools$$
Turbidity Bio-swells, retention ponds $$$ Local/regional/national
foundations, federal grants
Est. Cost
DOH, KBAC, NGOs
Source: ag practices of applying
fertilizers/pesticides; sewer systems Kea
‘aha
la S
tream
Water Quality Limited Segments,
2004 303(d)
Stream/ Waterbody Problem Category Polluant(s)/Source(s) Management Measure
Estimated Implementation Cost $ = 0 - 25K; $$ = 26K – 100K; $$$ = 101K – 250K; $$$$ = 251K – 1M

WRAS, Kailua Bay Advisory Council 2 - 67
F. Northern Kane‘ohe Watersheds
Kahalu‘u–the diving place–is known for its curious winds that blow during wet weather, said to wet all sides of a house. The shape of the valley and the winds cause the rain to swirl in a manner that completely wets a house, giving rise to the old saying “Ua poai hale o Kahalu‘u,” the house-surrounding rain of Kahalu‘u. Kahalu‘u has several streams, including the small Kalokaha, Ahulimanu (or Ahuimanu, bunches of birds), Waiola, and Kahalu‘u, which watered considerable areas of lo‘i in ancient times. Kahalu‘u had five heiau: two were destroyed by road building and a cannery was built on another. MacAllister in Sites of O‘ahu documented Kahonu Fishpond with its 1,200-foot wall and a heiau and ko‘a (fishing shrine) on the island of Kapapa. Waihe‘e–water of the octopus. According to one mo‘olelo, the name of the ahupua‘a comes from the story of a speechless man, Keakaoku, who was attacked by an octopus on his journey to Kahiki (Tahiti) to marry and to have his speech restored. Keakaoku killed the octopus and threw it to Kahalu‘u on O‘ahu and the slime from its body flowed over the land of Waihe‘e. However, Handy and Handy provide two origin stories for the name Waihe‘e: an old legend says that Pikoi a ka‘ala speared a huge octopus at sea and flung it ashore at this place; and alternatively, the name came from a kapu lo‘i belonging to the ali‘i (chief) of the area. Beginning in Ko‘olau mountains at a waterfall, Waihe‘e Stream, joined by the Hamama and Kalia Streams, supplied water to one of the largest areas of taro lo‘i in Ko‘olaupoko. The area also includes the Haiamoa Stream that runs only when rain is plentiful. Ka‘alaea–the red earth–ahupua‘a is named for the ‘alaea (red earth used for dye) found there. Springs provided most of the water for the taro lo‘i, with the main Ka‘alaea stream supplying the near shore lo‘i. A hill named Pu‘u Kahea–the hill of calling–is located here, from which the mo‘olelo tells that Pele’s sister, Hi‘iaka once chanted. Pu‘u Kahea also served as a fish lookout where a spotter would signal the location of schools of ‘ama‘ama (mullet) and ‘awa (milkfish) to canoes in the bay. Kamakau wrote of sacred rock formations by the sea in the shape of small canoes that the chants say served to bring sand from Tahiti; these formations were destroyed during the road building. Waiahole–water of the ahole fish – ahupua‘a contains three streams: Uwau and Waianu which join together with the Waiahole Stream. Waianu Stream also supported a sizable section of lo‘i in the ahupua‘a. According to Handy and Handy, the ahupua‘a, with its extensive taro lo‘i system that went up into the current forest reserve, it remains one of the last places on O‘ahu to cultivate large amounts of taro. Waiahole Poi Factory continues to mill the valley’s poi. Like Hakipu‘u, in ancient times, the ruling chiefs gave the land of Waiahole to kahuna of Lono. There is an ancient adze quarry on the ridge of the valley where tools were made from blue basalt found on the slopes. In 1916, the three-mile Waiahole Ditch was created at the head of the valley to divert water from the windward side of O‘ahu to the drier leeward areas of the island. In recent years, the diversion has stirred considerable controversy, which remains unresolved. The current

WRAS, Kailua Bay Advisory Council 2 - 68
remedy by the State Water Commission divides the water allocation, allowing half to remain in the streams. Waikane–water of Kane–marks the beginning of a “broad valley of bottoms and flatlands” in a coastal plain that extends into Kane‘ohe. Waikane is the most extensive wet taro region on O‘ahu, watered from both springs and streams. According to the mo‘olelo, Pele’s sister, Hi‘iaka, named the land as the place that Kane first dug water. The ahupua‘a has a main stream formed by two large streams, Waikane and Waikeekee, which once fed an extensive system of taro lo‘i. Sites of O‘ahu identifies two heiau in Waikane. In ancient times, the area had a famous holua sledding site called Kapahu. Hakipu‘u–broken hill–a small coastal plain area that once held taro lo‘i, with a single large stream, a wetland, and several smaller streams that lead from the “broken hills.” The major feature, Moli‘i fishpond, covering 124 acres, is shared with the Kualoa ahupua‘a. The mo‘olelo speak of this ahupua‘a being the home to Kahai, a sailor who brought breadfruit seeds to Hawai‘i from Samoa two thousand years ago. From ancient times and into the reign of Kamehameha I, which began in 1795, Hakipu‘u was traditionally given to kahuna, the priests. Sites of O‘ahu (Site 31) notes an ancient heiau whose stones have been used mostly for road building in the ahupua‘a. A dozen lo‘i were cultivated along the main stream as late as 1935, fed by water from Kailau Spring located on the hill above the fishpond. The ahupua‘a has an unbroken reef that continues south in front of Waikane. Kualoa–long back–formerly known as Paliku for its distinguishing feature -- an upright cliff that separates the next moku o loko3, Ko‘olauloa, from Ko’olaupoko, this ridge of the Ko‘olau extends to the sea at Mo‘okapu o Haloa. Ancient Hawaiians recognized Kualoa as an extremely sacred place; all canoes passing here lowered their sails in deference, and it was a pu‘uhonua, a sanctuary for the condemned. It was also home to the ancient shrine of Lono (the rain god and patron of agriculture) and his priests, the sacred drums of Kapahuula and Kaahuulapunawai, and the sacred hill of Kauahai a Kaho‘owaha. Additinally, it was believed to be the place of conception of Haloa (long stalk and the first taro plant) the progenitor of humans from Wakea and Papa; and the birthplace of the chant of Kamapua‘a, the famous hog-man god and incarnate of Lono. The island’s most famous burial cave sits on the slopes of Kanehoalani above Kualoa. Sites of O‘ahu notes one heiau in the area. Although most of North Kane‘ohe (figure II-35) at one time had taro growing abundantly, without a stream, no wetland taro grew in Kualoa. Instead, Kualoa was famous for growing wauke (paper mulberry) used to make tapa. The island Mokoli‘i (Chinaman’s Hat) sits offshore: the mo‘olelo describes Hi‘iaka, Pele’s sister, killing a mo‘o (dragon or lizard), creating the island with its flukes. Sites of O‘ahu notes the existence of Koholalele Pond, 885-feet long and 30-85 feet wide, on the south shore.
3 Ancient Hawaiians divided the island of O‘ahu into eight moku o loko, or districts; Ko‘olauloa and Ko‘olaupoko were two of the eight.

WRAS, Kailua Bay Advisory Council 2 - 69
Hawaiians said the menehune built this pond, though others say the Judds dug it in the 1850s. Today, this pond is called the Moli‘i fishpond and remains in use. A smaller fishpond, Apua Pond, located on the south side of Kualoa County Regional Park, is home to Hawaiian stilts, Hawaiian coots and the Hawaiian moorhen as well as occasional shorebirds such as tattlers, sanderlings, and gulls. The native black-crowned night heron is also present. In the 1860s, the Judds and Wilders built a sugar mill that the descendants of Dr. Judd sustain today as part of Kualoa Ranch, a tourist destination that also includes cattle ranching.

WRAS, Kailua Bay Advisory Council 2 - 70
Figure II-35: North Kane‘ohe Region

WRAS, Kailua Bay Advisory Council 2 - 71
‘Ahuimanu Sub-basin Summary
Sub-watershed summary ‘Ahuimanu Watershed originates in the Ko’olau Mountains at an elevation of 2,818 feet (859 meters) flowing at approximately a twenty percent gradient before draining into Central Kane‘ohe Bay. The watershed drains 1,543 acres (624 hectares) with 5.5 miles (8,881 meters) of streams though a variety of land uses including forestry, development and other habitat (shrub/scrub) with 9,615 living in the watershed according to the 2000 Census. Identified pollutants ‘Ahuimanu is not on the 303 (d) listed for any pollutants.
Kahalu‘u Sub-basin Summary
Sub-watershed summary Kahalu‘u Stream (figure II-36) is a perennial stream that has been modified in its lower reaches with realigned and cleared channels, elevated culverts and concrete lining. It was dredged in 1997 through the Kahalu‘u Stream Flood Control Project (Wilson Okamoto Corporation, June 2004). Kahalu‘u Watershed has a maximum elevation of 2,520 feet (768 meters) rising above its lowest point at sea level. The stream has an approximate length of 4 miles (5.8 meters) and drains a total area of 836 acres (338 hectares). According to the 2000 Census, 3,590 residents reside in the watershed. The watershed supports a variety of land uses including development, agriculture and forested land.

WRAS, Kailua Bay Advisory Council 2 - 72
Figure II-36: Kahalu‘u Watershed
Identified pollutants Kahalu‘u Stream is a medium priority stream for turbidity on the 2004 303 (d) list. Based on analysis of the five major land uses (figure II-37), the likely sources of turbidity are erosion in the forested, steep slope Ko’olau Mountains, stream bank erosion and possible run-off from agriculture land. Environmental impacts Kahalu‘u Stream drains to Northern Kane‘ohe Bay which is listed for turbidity among other pollutants on the 2004 303 (d) list. The receiving waters within Kane‘ohe Bay provide important habitat for freshwater and marine species of importance to subsistence, commercial and cultural uses.

WRAS, Kailua Bay Advisory Council 2 - 73
Based on the environmental impacts of Kahalu‘u Stream and the uses of the receiving waters, potential effects for Kahalu‘u Stream include:
Health and human safety: no known health and human safety impacts are known as a result of turbidity problems;
Economic resources: no known economic resources are impacted as a result of turbidity problems; and
Recreation: no negative impacts are posed to recreation from turbidity in Kahalu‘u
Stream. However, unchecked turbidity will increasingly have a negative impact on recreation opportunities in Kane‘ohe Bay.
Management measures Kahalu‘u Watershed is dominated by shrub/scrub land use (other 61%) and forested land (21%). Based on the Precision Riparian Buffer Model, there is a potential to preserve over 23 acres (9.5 hectares) of riparian habitat owned by large landowners in the Kahalu‘u sub-basin. As a result of land use, the likely source of turbidity is natural erosion in the upper watershed and riparian habitat. To address this issue and opportunities, KBAC recommends the following management measures:
Research, prioritize and contact large landowners for riparian preservation opportunities (High Priority); and
Identify anthropogenic and natural erosion in upper watershed and implement
native vegetation planting to slow erosion into Kahalu‘u Stream (High Priority);
Identify agriculture related erosion, work with agricultural producers to implement BMPs for erosion control (High Priority);
Riparian restoration where feasible including soft bio-revetment to control
erosion. Implementation feasibility Working with landowners is feasible to identify sources of erosion and subsequent turbidity in Kahalu‘u Stream. However, to show marked improvements in turbidity levels, working on a watershed scale is critical. Partnering with the large landowners identified for perseveration and restoration of riparian habitat could provide significant protection and restoration opportunities for riparian habitat. This should be a high priority project in Kahalu‘u sub-basin and tributaries to protect and improve watershed health starting with the largest properties first.
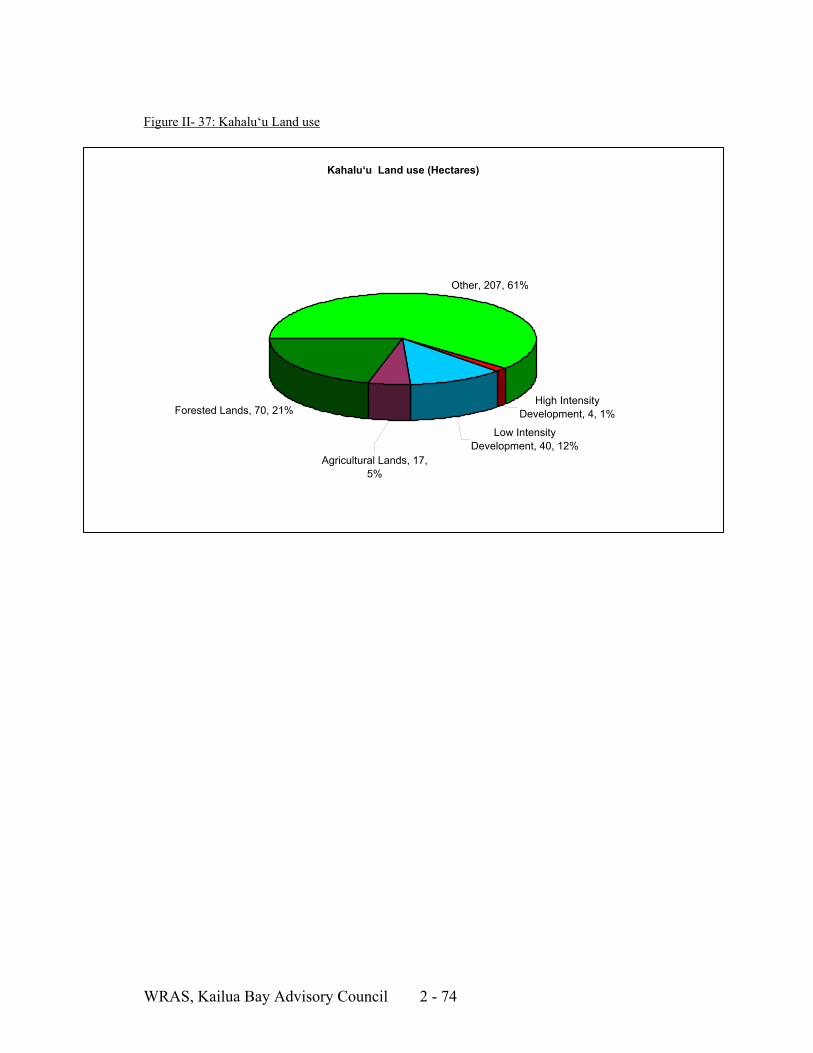
WRAS, Kailua Bay Advisory Council 2 - 74
Figure II- 37: Kahalu‘u Land use
Kahalu‘u Land use (Hectares)
High Intensity Development, 4, 1%
Low Intensity Development, 40, 12%
Forested Lands, 70, 21%
Other, 207, 61%
Agricultural Lands, 17, 5%

WRAS, Kailua Bay Advisory Council 2 - 75
Waihe‘e Sub-basin Summary
Sub-watershed summary Waihe‘e Stream (figure II-38) is a perennial stream that originates in the Ko‘olau Mountains and runs for approximately 2.9 miles (4,667 meters) at an average gradient of 28% draining 1,448 acres (586 hectares). The highest elevation in the watershed is 2,628 feet (801 meters) rising above its lowest elevation at sea level. The watershed has little development with the primary land uses dedicated to undeveloped steep upland slopes (shrub/scrub 37%), forested land (26%) and agriculture (8%) (figure II-39). Additionally, the watershed also has twenty-seven percent of its land use in wetlands. The 2000 Census estimates 1,575 people reside in the watershed. Figure II-38: Waihe‘e Watershed

WRAS, Kailua Bay Advisory Council 2 - 76
Identified pollutants Waihe‘e Stream is a medium priority stream for nutrients on the 2004 303 (d) list. Based on analysis of the six major land uses, the possible sources of nutrients could derive from the limited agricultural practices; however, no homes are connected to municipal sewer systems in the watershed (figure II-40) and as a result, nutrients are likely from sewage including on-site waste disposal such as cesspools.
Environmental impacts Waihe‘e Stream drains into Northern Kane‘ohe Bay which is listed for nutrients among other pollutants on the 2004 303 (d) list. The receiving waters within Kane‘ohe Bay provide important habitat for freshwater and marine species of importance to subsistence, commercial and cultural uses. Based on the environmental impacts of Kahalu‘u Stream and the uses of the receiving waters, potential effects for He‘eia Stream include:
Health and human safety: no known health and human safety impacts are known as a result of nutrients problems;
Economic resources: no known economic resources are impacted as a result of nutrients problems; and
Recreation: no negative impacts are posed to recreation from nutrients in Waihe’e
Stream or the nearshore environment of Northern Kane‘ohe Bay. Management measures With a lack of large development and very little agriculture, the possible sources of nutrients are likely derived from antiquated sewage systems such as cesspools. Based on the Precision Riparian Buffer Model, there is a potential to preserve over 111 acres (45 hectares) and restore 13 acres (5.3 hectares) of riparian habitat owned by large landowners in the Waihe‘e sub-basin. To address these issues and opportunities, KBAC recommends the following management measures:
Identify and prioritize cesspools for decommissioning/retrofitting for sewer hook-up (High Priority);
Work with landowners, specifically agricultural producers to implement Farm Plans to address nutrient management (High Priority);
Research, prioritize and contact large landowners for riparian preservation and
restoration opportunities (High Priority);

WRAS, Kailua Bay Advisory Council 2 - 77
Maintain low population densities in watersheds not serviced with public sewer facilities (e.g. do not develop these watersheds) (Kane‘ohe Bay Master Plan, May 1992); and
Monitor baseline conditions for changes over time and identification of
nutrient source(s). Implementation feasibility Working with landowners and Soil and Water Conservation District could be feasible and effective to implement for conservation plans to address nutrient management. Identifying cesspools for opportunities for conversion to contemporary on-site sewer systems such as septic system is very feasible following technical assistance and creation of a funding package.
Partnering with the large landowners identified for perseveration and restoration of riparian habitat could provide significant protection and restoration opportunities for riparian habitat. This should be a high priority project in Waihe‘e and tributaries to protect and improve watershed health starting with the largest properties first.
Waihe‘e land use (hectares)
Wetlands, 214.65, 27%
Forested Lands, 208.17, 26%
Other, 300.33, 37%
Agricultural Lands, 62.73, 8%
Low Intensity Development, 13.23, 2%
High Intensity Development, 1.53, 0%
Figure II-39: Waihe‘e Land use

WRAS, Kailua Bay Advisory Council 2 - 78
Figure II-40 Municipal Sewer lines

WRAS, Kailua Bay Advisory Council 2 - 79
Haiamoa Sub-basin Summary
Sub-watershed summary Haiamoa Stream originates in the Ko’olau Mountains, flowing for less than one mile (1,500 meters) at an average gradient of 11%. The watershed has a maximum elevation of 971 feet (296 meters) rising above its lowest elevation at sea level and drains an area of 101 acres (41 hectares). The 2000 Census listed the watershed as having 1,699 residents. Identified pollutants Haiamoa is not on the 303 (d) listed for any pollutants. Management Measures The watershed is not listed for any pollutants; however, KBAC recommends protection of the existing wetlands, 12.6 acres (5.1 hectares) and baseline water quality monitoring.

WRAS, Kailua Bay Advisory Council 2 - 80
Ka‘alaea Sub-basin Summary
Sub-watershed summary Ka‘alaea Watershed (figure II-41) is approximately 1,126 acres (456 hectares) with one main water body, Ka‘alaea Stream, which is 2.6 miles (4,139 meters) in length. The maximum elevation for the watershed is 1,469 feet (448 meters) rising above its lowest elevation at sea level. Ka’alaea Stream has an average gradient of seven percent flowing through sparsely developed landscape dominated by forest, agriculture and steep mountain slopes (figure: II-42). The 2000 Census lists the watershed as having 1,735 residents. Figure II-41: Ka‘alaea Watershed
WRAS, Kailua Bay Advisory Council 2 - 81
Identified pollutants Ka‘alaea Stream is a medium priority stream for nitrite/nitrates and Total Nitrogen on the 2004 303 (d) list. Based on analysis of the major land uses in the watershed, possible sources of pollution derive from agricultural practices of applying fertilizers or pesticides to crops and antiquated sewer systems such as cesspools.
Environmental impacts Ka‘alaea Stream flows into Northern Kane‘ohe Bay, which is designated as Class AA waters, providing the highest priority water quality protection. The receiving waters in Northern Kane‘ohe Bay are listed for nutrients and nitrites/nitrates as well as other pollutants on the 2004 303 (d) list. The receiving waters within Kane‘ohe Bay provide important habitat for freshwater and marine species of importance to subsistence, commercial and cultural uses. Based on the environmental impacts of Ka‘alaea Stream and the uses of the receiving waters, potential effects for Ka‘alaea Stream include:
Health and human safety: no health and human safety issues are known as a result of impaired water quality in Ka‘alaea;
Economic resources: no known economic resources are impacted as a result of impaired water quality in Ka‘alaea watershed; and
Recreation: no negative impacts are posed to recreation from pollutants in the
nearshore environment of Southern Kane‘ohe Bay. Management measures Ka‘alaea Watershed is a very small watershed, not heavily populated or developed with nearly 85% of the landscape in forested and steep slope upland habitat. The watershed supports approximately 12% of its land to agricultural practices. As a result of these factors KBAC recommends the following management measures: Nitrite/Nitrates and Total Nitrogen
Identify and prioritize cesspools for decommissioning/retrofitting for sewer hook-up (High Priority);
Work with landowners to implement Farm Plans to address nutrient management
(High Priority); and
Continue baseline monitoring to track changes over time and identify pollutant source(s).

WRAS, Kailua Bay Advisory Council 2 - 82
Implementation feasibility Working with landowners could be feasible and effective to implement Farm Management Plans to address nutrient management. Identifying cesspools for opportunities for conversion to contemporary on-site sewer systems such as septic system is very feasible following technical assistance and creation of a funding package.
Ka‘alaea Watershed Land use (Hectares)
Forested Lands, 105.39, 23%
Other, 273.51, 60%
Agricultural Lands, 53.91, 12%
Low Intensity Development, 22.32, 5%
High Intensity Development, 0.45, 0%
Figure II-42: Ka‘alaea Land use

WRAS, Kailua Bay Advisory Council 2 - 83
Waiahole Sub-basin Summary
Sub-watershed summary The Waiahole Watershed (figure II-43) is approximately 2,332 acres (944 hectares) with a maximum elevation of 2,778 feet (847 meters) rising above its lowest elevation at sea level. The watershed supports two major stream systems, Waiahole and Waianu. Waiahole Stream is nearly six and half miles (10,190 meters) in length and Waianu Stream is approximately 3.9 miles (6,350 meters). The gradient for Waiahole and Waianu streams are, 28% and eleven-percent 11% respectively. The watershed is comprised primarily of forested and steep-sloped uplands (92% land cover). The 2000 Census lists 674 residents in the watershed. Waiahole Stream and associated ahupua’a were known for its historically extensive taro lo‘i system. Today, the Waiahole Poi Factory continues to mill the valley’s poi (KBAC, 2002). Waiahole Stream was partially diverted in 1916 via the Waiahole Ditch. The ditch diverted water to Central and Leeward O‘ahu for agricultural uses (KBAC, 2002). As a result of this diversion, controversy has surrounded the stream and its use of water. However, even with the diversion of as much as half of its flow, Waiahole has significant stream flow (37.3 cfs) and remains Ko’olaupoko’s largest unmodified stream that flows without channelization to the bay (Wilson Okamoto Corporation, June 2004).

WRAS, Kailua Bay Advisory Council 2 - 84
Identified pollutants Waiahole Stream is a medium priority on the 303 (d) list for nitrite/nitrates, Waianu Stream is not on the 303 (d) list. Based on the six major land use types in the watershed, the nitrite/nitrates in Waiahole Stream are possibly derived from antiquated on-site sewer systems such as cesspools. Additionally, only seven percent of the watershed is in agricultural production, limiting the amounts of fertilizers or pesticide entering Waiahole Stream (figure II-44).
Environmental impacts Waiahole Stream flows into Northern Kane‘ohe Bay, which is designated as Class AA waters, providing the highest priority water quality protection. The receiving waters in Northern Kane‘ohe Bay are listed for nitrites/nitrates as well as other pollutants on the 2004 303 (d) list. The receiving waters within Kane‘ohe Bay provide important habitat for freshwater and marine species of importance to subsistence, commercial and cultural uses.
Figure II-43: Waiahole Watershed

WRAS, Kailua Bay Advisory Council 2 - 85
Based on the environmental impacts of Waiahole Stream and the uses of the receiving waters, potential effects for Waiahole Stream include:
Health and human safety: no health and human safety issues are known as a result of impaired water quality in Waiahole;
Economic resources: no known economic resources are impacted as a resulted of impaired water quality in Waiahole Watershed; and
Recreation: no negative impacts are posed to recreation from pollutants in the
nearshore environment of Northern Kane‘ohe Bay. Management measures Waiahole Watershed is not heavily populated or developed with nearly 92% of the landscape in forested or steep-sloped upland habitat. Based on the Precision Riparian Buffer Model, there is a potential to preserve over 323 acres (130 hectares) and restore 59 acres (23.75 hectares) of riparian habitat owned by large landowners in the Waiahole sub-basin (figure II-45). The watershed commits about seven percent of its land to agricultural practices; as a result of these factors, KBAC recommends the following management measures: Nitrite/Nitrates and Total Nitrogen
o Identify and prioritize cesspools for decommissioning/retrofitting for on-site septic hook-up (High Priority);
o Research, prioritize and contact large landowners for riparian preservation and
restoration opportunities (High Priority);
Determine amount of agriculture related runoff contributing to nutrient problem;
o Work with agricultural producers to implement Farm Plans;
Maintain low population densities in watersheds not serviced with public sewer facilities (e.g. do not develop these watersheds) (Kane‘ohe Bay Master Plan, May 1992);and
o Continue baseline monitoring to track changes over time and determine pollutant
source(s) Implementation feasibility Working with landowners could be feasible and effective to implement Farm Management Plans to address nutrient management. Identifying cesspools for

WRAS, Kailua Bay Advisory Council 2 - 86
opportunities for conversion to contemporary on-site sewer systems such as septic system is very feasible following technical assistance and creation of a funding package. . Partnering with the large landowners identified for perseveration and restoration of riparian habitat could provide significant protection and restoration opportunities for riparian habitat. This should be a high priority project in Waiahole sub-basin to protect and improve watershed health starting with the largest properties first.
Waiahole Watershed Land use (Hectares)
Forested Lands, 477.09, 47%
Other, 460.53, 45%
High Intensity Development, 0.36, 0%
Low Intensity Development, 6.66, 1%
Agricultural Lands, 75.33, 7%
Wetlands, 2.61, 0%
Figure II-44: Waiahole Land use

WRAS, Kailua Bay Advisory Council 2 - 87
Figure II-45: Waiahole Riparian Restoration and Preservation

WRAS, Kailua Bay Advisory Council 2 - 88
Waianu Sub-basin Summary
Sub-watershed summary The Waianu Watershed is 687 acres (278 hectares) with a maximum elevation of 1,040 feet (317 meters) raising above its lowest elevation at sea level. Waianu Stream is 3.9 miles (6,350 meters) in length with and average gradient of 11%. The 2000 Census lists 309 residents within the watershed. Identified pollutants Waianu Watershed is not listed for any pollutants on the 303 (d) list.
Waikane Sub-basin Summary
Sub-watershed summary Originating in the Ko’olau Mountains, Waikane Stream and tributaries total 8.7 miles (13,990 meters) in length running at an average gradient of 29%. The watershed has a maximum elevation of 2,752 feet (839 meters) rising above its lowest point at sea level and drains an area of 1,695 acres (686 meters). The watershed is sparsely populated with 632 residents (2000 Census) primarily living in the lower makai area. Identified pollutants Waikane is not on the 303 (d) listed for any pollutants.
Hakipu‘u Sub-basin Summary
Sub-watershed summary Originating in the Ko’olau Mountains, Hakipu‘u Stream is 2.4 miles (3,930 meters) in length with a 19% gradient. The watershed has a maximum elevation of 2,216 feet (675 meters) and drains an area of 408 acres (165 hectares). The watershed is sparsely populated with only 412 residents (2000 Census) living in the lower makai region of the watershed. Identified pollutants Hakipu‘u is not on the 303 (d) listed for any pollutants.
WRAS, Kailua Bay Advisory Council 2 - 89
Kualoa Sub-basin Summary
Kualoa Summary The Kualoa area does not have any streams throughout the area. The area is comprised of 568 acres (230 hectares) with a maximum elevation of 1,824 feet (556) and a total of 196 residents (2000 Census) in the area. Identified pollutants Kualoa is not on the 303 (d) listed for any pollutants. Measurable Milestones Pollution Problem 1: Cesspools Measurable Milestones:
3. Identify and prioritize cesspools for decommissioning/retrofitting for sewer hook-up or on-site septic system.
a. Short-term implementation goal: work with Hawai‘i DOH to prioritizes homes with cesspools in greatest need for up-grades: 2007-2009
b. Long-term implementation goal: work with private foundations, financial intuitions, Hawai‘i DOH, EPA, legislators and others to create tax incentives, low interest loans and grants for cesspool replacement: 2008-2010.
c. Long-term implementation goal: work with prioritized homeowners on funding packages and cesspool replacement: 2010-2015.
Pollution Problem 2: Nutrients Measurable Milestones:
3. Assure good farm management practices to minimize potential for runoff and groundwater contamination.
a. Short-term implementation goal: work with Windward Soil and Water Conservation District/NRCS to help identify needed farm plans: implement 2007-2009.
b. Long-term implementation goal: seek additional funding to match and support the implementation of farm plan recommendations adjacent to riparian corridor: 2009-2012.
Habitat Preservation/restoration Measurable Milestones: 1. Preserve and restore riparian habitat.

WRAS, Kailua Bay Advisory Council 2 - 90
d. Short-term implementation goal: schedule meetings to introduce opportunities, prioritize preservation and restoration projects with large landowners (county, state and private landowners): 2007-2009.
e. Long-term implementation goal: implement watershed wide riparian restoration and preservation projects: 2009-2015.
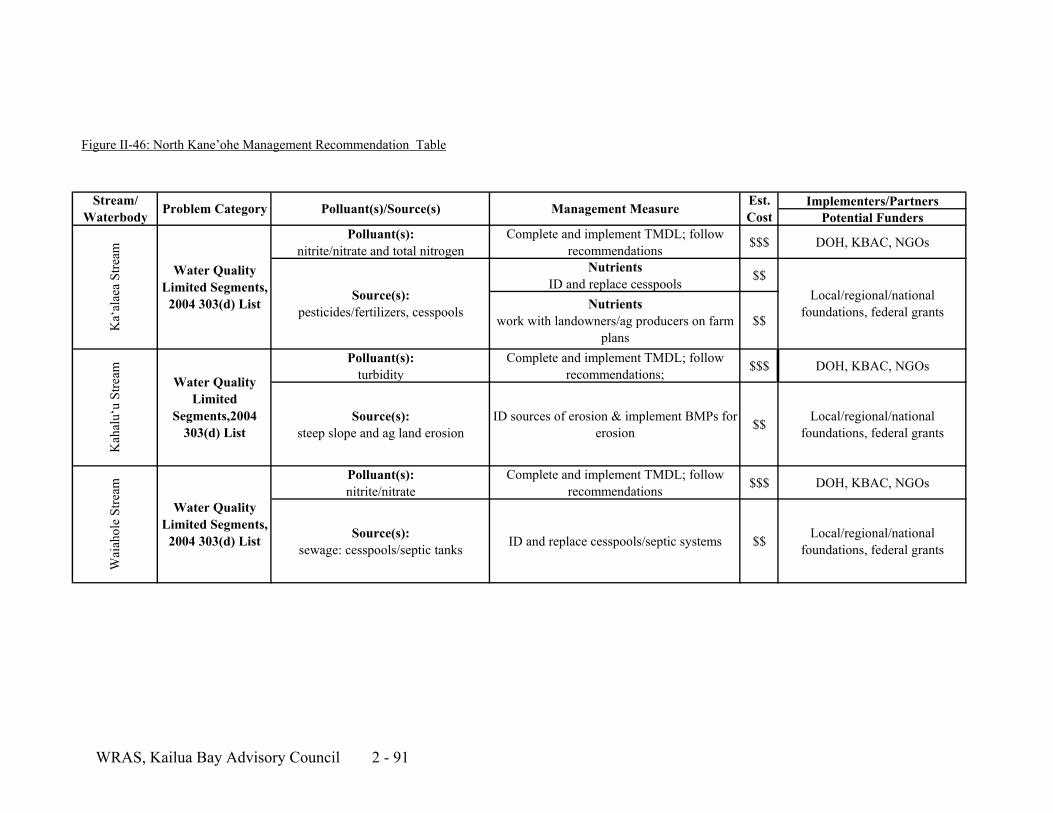
WRAS, Kailua Bay Advisory Council 2 - 91
Implementers/PartnersPotential Funders
Polluant(s): nitrite/nitrate and total nitrogen
Complete and implement TMDL; follow recommendations $$$ DOH, KBAC, NGOs
Nutrients ID and replace cesspools $$
Nutrients work with landowners/ag producers on farm
plans$$
Polluant(s): turbidity
Complete and implement TMDL; follow recommendations; $$$ DOH, KBAC, NGOs
Source(s): steep slope and ag land erosion
ID sources of erosion & implement BMPs for erosion $$ Local/regional/national
foundations, federal grants
Polluant(s): nitrite/nitrate
Complete and implement TMDL; follow recommendations $$$ DOH, KBAC, NGOs
Source(s): sewage: cesspools/septic tanks ID and replace cesspools/septic systems $$ Local/regional/national
foundations, federal grants
Kah
alu‘
u St
ream
Water Quality Limited
Segments,2004 303(d) List
Wai
ahol
e St
ream
Water Quality Limited Segments,
2004 303(d) List
Local/regional/national foundations, federal grants
Stream/ Waterbody Problem Category Polluant(s)/Source(s) Management Measure Est.
Cost
Ka‘
alae
a St
ream
Water Quality Limited Segments,
2004 303(d) ListSource(s):
pesticides/fertilizers, cesspools
Figure II-46: North Kane’ohe Management Recommendation Table

WRAS, Kailua Bay Advisory Council 2 - 92
Implementers/Partners
Potential Funders
Polluant(s): nutrients
Complete and implement TMDL; follow recommendations, $$ DOH,KBAC, NGOs
Source(s): sewer systems ID and replace cesspools/septic systems $$ Local/regional/national
foundations, federal grants
Polluant(s)/Source(s) Management Measure Est. Cost
Wai
hee Water Quality
Limited Segments, 2004 303(d) List
Stream/ Waterbody Problem Category
Estimated Implementation Cost $ = 0 - 25K; $$ = 26K – 100K; $$$ = 101K – 250K; $$$$ = 251K – 1M

WRAS, Kailua Bay Advisory Council 3 - 1
Chapter III. Technical and Financial Needs
A. Estimated Implementation Costs In addition to community support, willing landowners and project sponsors of BMPs, technical and financial support is a major component to project implementation. Several projects are listed below and are meant to provide a general guideline for implementation cost. More important perhaps than the actual cost are the various elements needed to implement a project such as project management, engineering, permitting cost, implementation (contractor, supply/materials), project management, maintenance, monitoring and fiscal administration. Several of the projects (water quality monitoring and riparian restoration) can utilize the help of volunteers to off-set cost, yet other projects such as cesspool replacement have fewer opportunities for volunteer involvement. Each project will have its own hidden cost and could vary from location to location. Cesspool Cesspools are found in all four of the major watershed areas (Waimanalo, Kailua, South and North Kane‘ohe) with the greatest numbers suspected to be in the Northern Kane‘ohe watersheds. The conversion of cesspools to a more contemporary sewer system such as on-site septic tank will require coordination with the County of Honolulu, local communities and homeowners. To replace cesspools, it will first require researching the number of cesspools throughout the Ko‘olaupoko moku, prioritizing which areas or sub-basins need cesspool replacement based on water quality impacts, followed by a public outreach campaign. This project itself will be costly; however, it should be implemented before any known cesspools are replaced. To replace a single cesspool, the following activities will be part of the cost:
Engineering and design; Materials; Construction/equipment (cesspool removal/install); Project management; Archaeological monitoring; Permits; Monitoring; and Fiscal Administration
The overall cost is based on other cesspool replacements in Hawai‘i and will vary from site-to-site, with an estimated cost of: $15,000-25,000/unit Community education

WRAS, Kailua Bay Advisory Council 3 - 2
Educating individual landowners on implementing BMPs for small urban landscaping, fertilizer use and pest control will be essential in order to reduce the amount of NPS pollution. Education and outreach should include workshops, door-to-door educational campaigns, mailings to strategic landowners and outreach to local contractors for BMP education. Several important factors will need to be researched for planning the most effective educational campaign such as priority sub-basins, types of outreach, most effective educational material/delivery method, etc. To implement a Ko‘olaupoko wide education program, the following activities are components of the budget:
Planning; Materials; Staffing; Meeting location; Postage; Printing; Outreach; and Fiscal Administration.
The overall cost for community education on BMPs is based on one year .5 FTE and will vary with the intensity of community outreach, with an estimated cost of: $40,000 - 60,000/year Monitoring Monitoring for baseline water quality data, trend monitoring and project effectiveness is essential for long-term watershed trends. Monitoring has many variables such as the type being conducted, monitoring equipment, sampling frequency and duration of monitoring. To implement monitoring, the following activities will be part of the budget:
Planning (landowner outreach); Supplies; Staffing; Transportation; Analysis; and Fiscal Administration.
Monitoring protocols are discussed in detail in Chapter IV; however, cost estimates are based on baseline water quality monitoring for temperature, dissolved oxygen, nutrient, turbidity and suspended solids for one-year effort: $100,000 - $150,000/year. Riparian restoration Riparian restoration and associated monitoring and maintenance has many variables which affect the cost of a project such as location, size of restoration site/condition, maintenance and monitoring. The following activities will be part of the budget:

WRAS, Kailua Bay Advisory Council 3 - 3
Planning; Supplies; Staffing; Transportation; Monitoring; Maintenance; and Fiscal Administration.
The following costs are based on past projects in the Ko‘olaupoko moku: $11,000-15,000/acres. Additionally, each project should factor in approximately $1,000/acre/year for maintenance for 2 years. Trash clean-up Trash clean-up can largely be accomplished with the use of volunteers and donated services. The Windward Ahupua‘a Alliance has been coordinating efforts for trash clean-up in the Kapa‘a watershed with the help of volunteers who have been very effective. Costs will vary depending on the amount of trash, donated items and services and number of clean-up. However, some costs are still associated with this activity, including:
Garbage bags; Gloves for volunteers; Staffing; Dumping fee; Food; and Miscellaneous items
The following costs are based on past projects in the Ko‘olaupoko moku: $1,000/clean-up effort.
Street Sweeping Street Sweeping is a BMP that can be implemented in highly urbanized watersheds where turbidity and sediment have elevated level. This type of project will have to be a partnership with City and County of Honolulu Road Department. Before any sweeping is implemented, determining the priority areas should be conducted. Depending on the details of a partnership with the City and County of Honolulu, the following costs will be associated with this activity: Sweeping (sweeper, staff time, waste disposal); Staff time; and Grant administration. The following costs are based on estimates from sweeping efforts from the City and County of Honolulu: $500/day Watershed Council Staffing

WRAS, Kailua Bay Advisory Council 3 - 4
To facilitate community-based participation in natural resource issues, the establishment of four watershed councils in the Ko’olaupoko area is recommended in Chapter V. Watershed Councils will allow community members, agencies, community groups and academia to come together to pro-actively discuss, prioritize and implement restoration and monitoring efforts. To accomplish this, the following cost will be associated with this activity:
Staffing Travel to meetings Mailings Office supplies Fiscal Administration
A watershed council coordinator position is estimated on a yearly basis at a cost of: 80,000 – 100,000/year based on 1 FTE.
B. Technical and financial assistance
Below are several agencies and non-governmental organizations which support NPS pollution improvement and watershed restoration. This list is not exhaustive; rather it highlights some of the larger organizations/agencies which provide funding for the types of projects recommended in the WRAS. The following section was taken verbatim from the Kailua Waterway Improvement Plan: A Framework for Stakeholder Action, Draft, December 2003, Tetra Tech.
Federal/State/Government Programs U.S. Army Corps of Engineers (USACE) Ecosystem Restoration Program: Sections 206 and 1135 of the Water Resources Development Act of 1986 authorize the USACE to evaluate, plan, design, and construct projects that benefit the environment through restoration, improvement, or protection of habitat. Section 1135 projects are focused on areas affected by prior USACE projects or actions, while Section 206 projects are not. A restoration project is initiated after a detailed investigation shows it is technically feasible, environmentally acceptable, and provides cost-effective environmental benefits. The maximum federal expenditure per project is $5 million, and a local match of either 25 percent or 35 percent is required for Section 1135 or Section 206 projects, respectively. Land values may be credited toward the local match amount. Watershed Initiative (Program Management, Demonstration Projects, Monitoring, Training): Governors nominate watershed organizations from their state to receive grants to support innovative watershed-based approaches to preventing, reducing, and eliminating water pollution. The initiative will also support local communities in their efforts to expand and improve existing protection measures with tools, training, and technical assistance, and provide for ten federal liaison positions. EPA will then select 20 organizations for funding. Nominations that are likely to result in environmental improvements in a relatively short time frame and that show broad stakeholder involvement would be strong candidates. Clean Water Act (CWA) Section 319 Water Quality Grants (Program Management, Demonstration Projects, Monitoring, Community Education, Training): Clean Water Act Section 319(h) funds are provided by EPA to designated state and tribal agencies to implement their approved nonpoint source management programs. State and tribal nonpoint source programs include a variety of components, including technical assistance, financial assistance, education, training, technology transfer, demonstration projects, and regulatory programs. The Hawaii Department of Health (DOH) grant requirements state that projects that prevent, control,

WRAS, Kailua Bay Advisory Council 3 - 5
and/or reduce nonpoint source pollution of Hawaii’s water resources are eligible for funding. Projects may include, but are not limited to, one or more of the following activities:
Implementation of a portion of the Hawaii Coastal Nonpoint Pollution Control Plan Implementation of BMPs Demonstration of a new or innovative BMP or institutional approaches to accelerate technology
transfer and adoption Restoration of resources, enhancement of resources, information and education programs, and
coordination of citizen or volunteer monitoring programs which lead to the implementation of BMPs U.S. EPA Watershed Assistance Grants (Program Management, Training): EPA provides Watershed Assistance Grants for programs that build on cooperative agreements with one or more nonprofit organizations or other eligible entities to support watershed partnerships and long-term effectiveness. Funding supports organizational development and capacity building for watershed partnerships with a diverse membership. Wetland Program Development Grants Guidelines (Demonstrations, Monitoring): Wetland Program Development Grants (WPDG) provide eligible applicants an opportunity to conduct projects that promote the coordination and acceleration of research, investigations, experiments, training, demonstrations, surveys, and studies relating to the causes, effects, extent, prevention, reduction, and elimination of water pollution. While WPDGs can continue to be used by recipients to build and refine any element of a comprehensive wetland program, priority is given to funding projects that address three areas identified by EPA: (1) Developing a comprehensive monitoring and assessment program; (2) improving the effectiveness of compensatory mitigation; and (3) refining the protection of vulnerable wetlands and aquatic resources. States, tribes, local governments, interstate associations, and national nonprofit, nongovernmental organizations are eligible to apply. Water Quality Cooperative Agreements (Demonstrations, Training, Monitoring): Under authority of Section 104(b)(3) of the Clean Water Act, EPA makes grants to state water pollution control agencies, interstate agencies, and other nonprofit institutions, organizations, and individuals to promote the coordination of environmentally beneficial activities. These activities include storm-water control, sludge management, and pretreatment. Among the efforts that are eligible for funding are research, investigations, experiments, training, environmental technology demonstrations, surveys, and studies related to the causes, effects, extent, and prevention of pollution In addition to agencies and federal grants, a variety of Hawai‘i based foundations have grant sources available for restoration and BMP implementation.
Private Foundation Harold K.L. Castle Foundation: The Castle Foundation, located in Kailua, Hawai’i provides grants throughout all of Hawai‘i. One focus of the foundations granting is how activities impact marine resources such as coral reef health and marine resources. The following is taken from the Castle Foundation website:
The Harold K.L. Castle Foundation believes, however, that the community can come together to restore the reef habitat and bring the fish back. The threatened nearshore areas around the main Hawaiian Islands (South East Hawaiian Islands) are home to a remarkable variety of fish, including species found nowhere else in the world. The nearshore marine environment is one of Hawaii's most precious resources. The Foundation is committed to working with a broad group of stakeholders to ensure that future generations can enjoy and learn from this rich natural resource (http://www.castlefoundation.org/marine-conservation.htm).

WRAS, Kailua Bay Advisory Council 3 - 6
Hawaii Community Foundation: The Hawai‘i Community Foundation, located in Honolulu, provides funding assistance throughout all of Hawai‘i. The Foundation has a variety of grant opportunities ranging from on-the-ground restoration to organizational capacity building. The various grant opportunities can be viewed at the Foundations website: http://www.hawaiicommunityfoundation.org/ Other organizations/agencies which fund restoration projects include, but are not limited to:
National Fish and Wildlife Foundation http://www.nfwf.org/
U.S. Fish and Wildlife Service
http://www.fws.gov/grants/
National Oceanic and Atmospheric Administration (NOAA) http://www.ago.noaa.gov/grants/
Fish America Foundation http://www.fishamerica.org/grants/
The Environmental Protection Agency http://www.epa.gov/owow/funding.html The Environmental Grant Making Foundation publishes a comprehensive list of foundations that fund watershed restoration, environmental education, BMP implementation and organizational capacity building. Obtaining a copy of this publication will give an organization an understanding of the number of foundations, types of projects they fund and all necessary information needed to apply for funding. http://www.environmentalgrants.com/
WRAS, Kailua Bay Advisory Council 3 - 7
C. Prioritizing Watershed Restoration Opportunities
To effectively implement projects that target NPS pollution, wetland or stream restoration, a prioritization metric must be developed and used whenever possible to compare projects or BMP implementation activities. There are numerous variables which can factor into a prioritization metric; however, for the purpose of this project, recommendations are keep to the major themes use to prioritize restoration. Landowner support: Implementing restoration fits into two landownership categories: public and private. Implementing restoration on public land is often easier than implementing restoration on private land. Public pressure can be applied to the managing agency for project implementation on public lands. Additionally, implementing restoration on public land can provide opportunities for more access, education or long-term research/monitoring. Nevertheless, private landowners should be viewed as critical partners in watershed restoration and opportunities sought for such restoration. When deciding to implement restoration, several questions around the ownership should be asked: Is the proposed project supported by the landowner (private, county, state, federal, etc.)? If so, at what level is the landowner contributing to the project-- access to site, staff time, material donation, cash, property or other means of supporting the restoration activity? If the project has a potential or a perceived potential impact on adjacent landowners, have they been consulted and do they support the project? The following metrics are used to rank landowner support: Public ownership (landowner supported + 1): (1) Private ownership (landowner supported + 1): (1) Community support: In addition to landowner support, community support is needed to implement restoration projects. Various segments of the population should be consulted for support and stakeholder buy-in. The following metrics are used to rank community involvement: The problem is meaningful to a variety of stakeholders and a plan being developed by several resource management people, agencies or NGOs and landowners. The plan includes a mechanism for feedback and comment such as public meetings for updates: (3) The problem is relevant to many and plan circulated and reviewed by citizens, landowners, resource agencies and elected officials: (2) The problem is meaningful only to project sponsor with little other public involvement: (1)

WRAS, Kailua Bay Advisory Council 3 - 8
Scale of restoration project: The scale of the restoration or BMP project could dictate the effectiveness of the project at addressing a known pollution source(s). For example, is the proposed project isolated to a single site or is it being proposed on a larger scale or multiple sites. The following metrics are used to rank the scale of a restoration/BMP project: Watershed: (2) Sub-Basin: (1.5) Reach (length of stream): (1) Single Site: (.5) Efficacy of project/BMP at addressing source(s) of pollutant(s): Before implementing a project or BMP, it should be determined if the proposed project will be effective at is addressing the pollution source. For example, sediment is being contributed to the system from eroding streams banks with little or no vegetation. The proposed project is to revegetate riparian areas to control sediment. However, if only a small area is proposed for restoration, this project may not address the source. The following metrics are used for ranking known sources of pollutants: Directly addressing source: (2) Obliquely addressing source: (1) Likely not addressing source: (0) Technical feasibility: Implementing projects can range from experimental in nature to highly proven techniques. Projects with a proven track record of success that address the pollution source or restoration need are the most desirable projects to implement. The following metrics are used for ranking technical feasibility: Basic technology such as BMP’s could easily be used to solve the problem: (3) Standard technology can be used and is acceptable to address the problem: (2) Technology exists but not widely demonstrated or accepted: (1) Level of impairment: Determining if projects should focus on the most degraded area or uses resources to preserve the least degraded is an on-going debate in watershed restoration. For the purpose of this prioritization matrix and the metrics used, implementing projects in areas that are more degraded and have the potential to impact human health, recreation and economic resources receive a higher ranking. The following metrics are used for ranking the level of impairment: Impacts to human health, recreation and economic resources: (3)
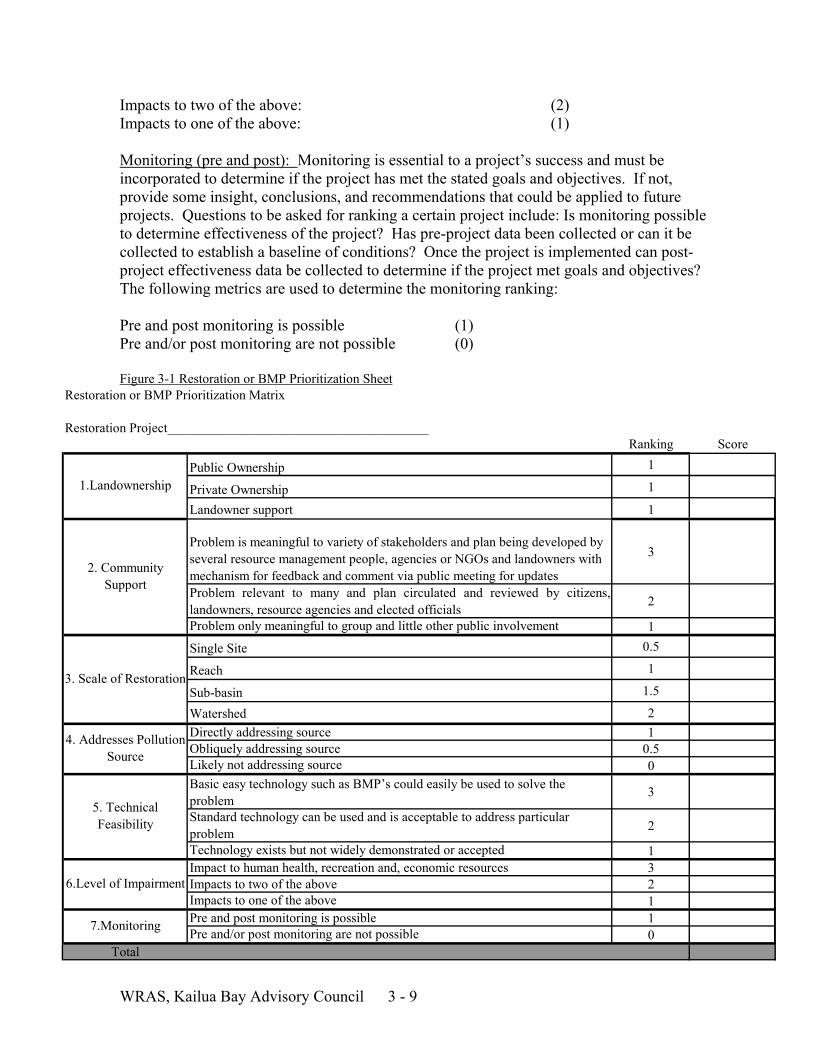
WRAS, Kailua Bay Advisory Council 3 - 9
Impacts to two of the above: (2) Impacts to one of the above: (1) Monitoring (pre and post): Monitoring is essential to a project’s success and must be incorporated to determine if the project has met the stated goals and objectives. If not, provide some insight, conclusions, and recommendations that could be applied to future projects. Questions to be asked for ranking a certain project include: Is monitoring possible to determine effectiveness of the project? Has pre-project data been collected or can it be collected to establish a baseline of conditions? Once the project is implemented can post-project effectiveness data be collected to determine if the project met goals and objectives? The following metrics are used to determine the monitoring ranking: Pre and post monitoring is possible (1) Pre and/or post monitoring are not possible (0) Figure 3-1 Restoration or BMP Prioritization Sheet
Restoration or BMP Prioritization Matrix
Restoration Project_______________________________________Ranking Score
Public Ownership 1
Private Ownership 1
Landowner support 1
3
2
1Single Site 0.5
Reach 1
Sub-basin 1.5
Watershed 2Directly addressing source 1Obliquely addressing source 0.5Likely not addressing source 0
3
2
Technology exists but not widely demonstrated or accepted 1Impact to human health, recreation and, economic resources 3Impacts to two of the above 2Impacts to one of the above 1
1Pre and/or post monitoring are not possible 0
Total
2. Community Support
1.Landownership
3. Scale of Restoration
Basic easy technology such as BMP’s could easily be used to solve the problem
Problem is meaningful to variety of stakeholders and plan being developed by several resource management people, agencies or NGOs and landowners with mechanism for feedback and comment via public meeting for updates Problem relevant to many and plan circulated and reviewed by citizens,landowners, resource agencies and elected officialsProblem only meaningful to group and little other public involvement
Pre and post monitoring is possible
6.Level of Impairment
5. Technical Feasibility
4. Addresses Pollution Source
7.Monitoring
Standard technology can be used and is acceptable to address particular problem

WRAS, Kailua Bay Advisory Council 3 - 10
Ranking of projects Ranking of projects are based on numerical criteria (up to 15 points) and placed in one of three categories as follows: Low priority: 1 – 5 points Medium priority: 6 – 10 points High priority: 11 – 15 points Higher ranked projects should be investigated for implementation first, however, it must be understood that this is not always possible. First and foremost, for a project to move forward it must have a willing landowner. Regardless of the ranking, if a project is not supported by the landowner and is only recommended by KBAC or another community group, the project may not ultimately be implemented. The Prioritization Matrix below (figure 3-2) is another way of assessing project feasibility. Projects which fit into the upper left shaded area will be the most effective projects to implement and should be research further. Figure 3-2: Prioritization Matrix Highly feasible/highly effective Feasibility -<cost -few regulations/permitting -cooperative landowners Effectiveness - addresses known source(s) of pollution -method(s) address pollution source(s)
Low feasibility/low effectiveness Feasibility ->cost -many regulations/permits -number of landowners Effectiveness -no known pollution source(s) is identified -method(s) does not address pollution source(s)
Highly Feasible/low effectiveness Feasibility -<cost -cooperative landowners -few regulations/permits Effectiveness -Many or unidentified sources of pollution -method does not address pollution source(s)
Low feasibility/highly effective Feasibility ->high cost -number of landowners -many regulations/permits Effectiveness -address known source(s) of pollution -method addresses pollution source(s)
Feasibility:

WRAS, Kailua Bay Advisory Council 3 - 11
Cost: Costs are compared to other identified management measures (i.e., both projects address the pollution source with comparable outcomes, but project A costs twice as much as project B). Regulations/permitting: Implementing projects that require agency permits (ACOE, C and C of Honolulu, USFWS, etc,) require greater staff oversight, funding, expertise and time. Landowners: Implementing projects with multiple landowners takes time to establish needed relationships and trust. However, having multiple landowners willing to participate in a project allows implementation across a larger landscape to address a known pollutant(s). Effectiveness: Sources of pollution: Projects addressing pollution are more effective if a know source is identified. i.e., high nutrient loads are identified as having originated on agriculture lands with grazing animals. Methods: Projects that have track records to directly address a known source of pollution are more effective than those which do not (i.e., implementing riparian restoration to control erosion is a proven method, if done properly with maintenance, etc.).

WRAS, Kailua Bay Advisory Council 4 - 1
Chapter IV: Watershed Monitoring Strategy
A. Introduction Past monitoring efforts Several monitoring efforts have been undertaken in the Ko’olaupoko region to characterize baseline water quality conditions, habitat assessments and biological integrity. The DOH has completed TMDLs in Kane‘ohe, Kawa, Kapa‘a and Waimanalo Streams and is currently completing Ka’elepulu Stream. A NRCS Stream Assessment was completed in Waimanalo Stream (July, 2005) a stream bioassessment completed in Waimanalo Stream (March, 1998), Kane‘ohe Stream (January, 2003) and Kawa Stream (February, 2001). Professors and students from the University of Hawai‘i, Windward Community College and Hawai‘i Pacific University have conducted monitoring in several Ko‘olaupoko streams as well. Private consulting firms such as AECOS and Oceanit have conducted monitoring in Kapa’a Stream, Kane‘ohe, Kawa and other streams. Continued monitoring in these streams for water quality parameters such as nutrients, total suspended solids and turbidity could provide additional trend data to determine changes over time. Data Gaps Despite the amount of water quality data collected in the region, considerable data gaps exist for streams as well as entire basins and watersheds. Data gaps are particularly prevalent in the northern portions of the Ko‘olaupoko moku in such watersheds as Waiahole and Waihe’e. Additionally, limited data exist for streams within the Ko‘olaupoko moku which are not listed on the 303 (d) list. Waikane, Waianu and Hakipu’u in Northern Kane‘ohe, for example. These streams and others should be considered for baseline monitoring, determined if they warrant a 303 (d) listing and, if not, determined if they can be used for paired monitoring sites or as reference sites for desired future conditions for streams on the 303 (d) list. B. Monitoring Questions Monitoring Questions There are various reasons to implement monitoring for water quality, habitat assessment and biological integrity. For example, the State of Hawai‘i implements monitoring for TMDL development and beach monitoring for public health concerns. Higher education institutions conduct monitoring for educational purposes while private consulting firms often implement compliance monitoring for permit regulations. To effectively implement a monitoring plan, KBAC and other organizations interested in monitoring must answer several questions, such as:
What type of monitoring should be implemented? • Chemical (DO, pH, nutrients, etc.); • Physical (stream flow, temperature, channel condition, habitat, etc.);

WRAS, Kailua Bay Advisory Council 4 - 2
• Biological (macroinvertebrates, fish, etc.); • Baseline, trend or project-effectiveness • Location or monitoring • Duration and; • Frequency.
KBAC will begin to answer these question throughout with the Ko‘olaupoko monitoring strategy. KBAC is interested in a variety of watershed issues in the Ko’olaupoko region and how they impact water quality, habitat and biological integrity. Issues such as how agriculture, cesspools, development and BMP/restoration implementation impact the watershed both positively and negatively. To assess water quality, habitat and biological integrity, KBAC poses the following two questions: Question #1 Is water quality, habitat and biological integrity meeting state standards in the various Ko’olaupoko watersheds? For example, are water quality, habitat and biological standards being met, exceeded or do they remain the same over time? Question #2 Is the implementation of BMPs or other changes throughout the watershed improving conditions? To answer these monitoring questions, the following goals, objectives and monitoring parameters are recommended for future monitoring efforts. The following three monitoring goals are for the entire Ko‘olaupoko area. C. Monitoring Goals and Objectives Goal 1: Assess the current status or condition of individual streams in the Ko‘olaupoko region and determine whether standards are being met. Chemical, biological, and physical investigations will be performed on a majority of watersheds over a five year period to determine whether the requirements of the Hawai‘i Water Quality Standards are being attained.
Objective 1a: Create a monitoring program, multi-parameter in scope, that will provide data on water quality, habitat assessment and biological integrity to determine if standards are being met, changing over time or to capture baseline conditions.
Objective 2a: Characterize water quality, habitat and biological integrity in areas with little existing data.
WRAS, Kailua Bay Advisory Council 4 - 3
Goal 2: Measure temporal and spatial trends in the quality of Ko‘olaupoko surface waters. Temporal and spatial water quality trends will be evaluated by measuring levels of indicator parameters in water chemistry and biological indicator (fish and macroinvertabrates) samples collected from long-term monitoring stations at set intervals. Biological integrity and physical habitat quality changes occurring within (intra) and between (inter) watersheds also will be assessed qualitatively by comparing monitoring data generated in different basins. Because of the need to distinguish natural water quality variability from water quality changes caused by humans, trend monitoring protocols will need to be carefully designed. Trend data are important for measuring the effects of human activity on the aquatic environment and whether water quality protection programs and BMP implementation lead to long-term water quality, habitat and biological improvements.
Objective 2a: Collect enough data temporally and spatially of high integrity to assess if streams meet standards for monitored parameters. Objective 2b: Collect enough data temporally and spatially to assess intra- and inter-watershed conditions.
Goal 3: Provide data to support Hawai‘i’s DOH Clean Water Branch for protection programs and evaluate their effectiveness. All water quality programs benefit from, and often require, timely ambient water quality data, especially NPDES permits, nonpoint source, beach monitoring, community health, and BMP activities. In addition, follow-up monitoring is needed to measure whether actions taken by these programs improve the ecological integrity of a waterbody.
Objective 3a: Create a monitoring program tied to specific projects such as BMP implementation to assess project effectiveness.
Objective 3b: Create a monitoring program to help Hawai‘i’s DOH on NPDES permits or other compliance monitoring.
Goal 4: Detect new and emerging water quality, habitat and biological problems. It is more cost-effective to prevent environmental degradation than to remediate sites after degradation has occurred. Emerging water quality problems include the presence of a new chemical in surface water whose adverse impacts have yet to be identified, nutrient enrichment, the occurrence of invasive plant conditions or exotic species in a waterbody, or the loss of critical habitat essential to the maintenance of a healthy aquatic community. In each case, early warning of the potential problem through an effective monitoring program would allow the Hawai‘i DOH to take action before a problem develops.
Objective 4a: Create a pro-active monitoring program large enough in scale to detect changes or threats in water quality, habitat degradation and biological integrity.

WRAS, Kailua Bay Advisory Council 4 - 4
Objective 4b: Monitor if known landscape changes, such as large developments are eminent.
Monitoring Principles The following three principles are key components to the strategy for overall program success. All monitoring should be coordinated with various agencies and stakeholders, use accepted standards and protocols and create a mechanism for reporting data and findings to appropriate agencies, community organizations and the public. Principle 1: Integrate and coordinate the use of scarce monitoring resources with those of other state agencies, community groups, private consulting firms and higher education institutions. The scarcity of funds dedicated to monitoring demands that all entities work closely together to ensure the broadest possible monitoring and sharing of data. An annual monitoring summit to share data, upcoming monitoring efforts and partnership opportunities should be organized with DAR, DOH, academia, HIMB and USGS as well as other interested agencies and organizations invited. Principle 2: Generate monitoring data that are scientifically collected and defensible and relevant to the decision-making process. All of the monitoring activities described in this strategy will link to specific goals and objectives that are established to be consistent with sound scientific and statistical concepts. Considerable emphasis is given to ensuring that the quality of the monitoring data is sufficient to support sound decision-making. Principle 3: Manage and report water quality data in a way that is meaningful and understandable to the intended audience. For monitoring information to be truly useful, it must be managed properly and reported to intended audiences in a meaningful and timely manner. The strategy commits to data automation and the establishment of data format standards to ensure that the water quality data are easily accessible and understandable to primary and secondary users. The strategy recognizes that different levels of detail are needed depending on the audience and several types of data reports will be produced.
D. Types of Monitoring Several different types of monitoring will be implemented to achieve the above stated goals and objectives, including baseline, trend and effectiveness monitoring. Baseline Monitoring Baseline monitoring is designed to characterize existing or undisturbed conditions for comparison with other monitoring activities. This type of monitoring can be useful as a starting point for other monitoring efforts (especially trend monitoring and project effectiveness monitoring). Sites for baseline monitoring must be carefully selected to ensure

WRAS, Kailua Bay Advisory Council 4 - 5
they are representative of the conditions with which they will be compared. (State of Oregon, July 1999) Trend Monitoring This monitoring type requires development of a record over time (usually five years or more). Sites should be established which are “stable” and not impacted by ancillary factors. Project Effectiveness Monitoring A major component to BMP implementation and restoration is post-project effectiveness monitoring. Project effectiveness monitoring is important to determine if BMP/restoration projects are meeting stated goals and objectives. Or, if projects are not meeting goals and objectives, provide data to determine adaptive management actions or changes to project implementation. Project effectiveness should be implemented strategically as fiscal resources can be scarce for project monitoring. For example, it may not be necessary to monitor every riparian restoration plot once implementation is completed. Rather, monitoring a sub-section of plots that provide different conditions and variables can provide valuable data. Additionally, post-project effectiveness is best accomplished when paired with pre-project conditions. If septic tanks in a certain sub-basin are being replaced to address a nutrient issue in the stream, having enough pre-project data on nutrient is needed to compare any change after project implementation. To implement this effectively, consistent sampling techniques for pre and post project monitoring is needed. For example, water quality monitoring should be conducted with the same instrumentation and be similar in time and scale. Monitoring Parameters To answer the overall monitoring questions, several monitoring parameters are needed to gain a comprehensive understanding of watershed health using accepted standards and protocols. WATER CHEMISTRY The chemical character of the waters of the Ko‘olaupoko region will be assessed by measuring one or more of the following parameters, which include: dissolved oxygen, temperature, pH, total suspended solids, total dissolved solids, biochemical oxygen demand, nitrite- and nitrate- total nitrogen, total phosphorus, and enterococci. Not all streams or watersheds will be monitored for the entire suite of parameters. Parameters will be determined based on the listed pollutant(s) on the 303 (d) list; however, future emergence of new chemicals might initiate the need for additional monitoring of parameters. Water chemistry monitoring goals:
provide assistance in the development of water quality-based effluent limits;
identify sites where state standards are exceeded;

WRAS, Kailua Bay Advisory Council 4 - 6
identify high quality sites/reference locations;
evaluate the effectiveness of Best Management Practices and watershed management
plans; and
investigate new emerging water chemistry problems. Objectives for water chemistry monitoring: Objective 1: Determine whether the chemical character of the waters in that Ko’olaupoko waters is suitable for indigenous aquatic life and human health, based on Hawai‘i state standards. Objective 2: Determine whether the waters of the state are safe for agricultural use, based on standards. Objective 3: Determine whether nutrients are present in the Ko‘olaupoko area at levels that won’t stimulate the growth of nuisance aquatic plants or algae blooms. Objective 4: Determine whether the chemical character of the waters in the Ko‘olaupoko area of the state is changing over time. Objective 5: Identify waters in the Ko‘olaupoko area of high quality and those that are not meeting standards. Objective 6: Identify new chemicals impairing waters of the Ko‘olaupoko area. Physical and Biological Monitoring The State of Hawai‘i conducts both physical and biological monitoring in various streams in the Ko‘olaupoko region to assess the physical stream condition and biological integrity of the system. Physical A standard protocol for assessing the physical characteristics of Hawai‘i’s streams is the NRCS: Hawai‘i Stream Visual Assessment Protocol. The guide can be downloaded at: (http://www.hi.nrcs.usda.gov/technical/water_quality.html). Implementing a stream assessment will provide information on channel conditions, sedimentation (embeddedness), bank stability, riparian canopy cover and litter/trash presence. This information can provide a comprehensive ‘snapshot’ of the conditions of the stream, opportunities for stream restoration and potential NPS pollution contributors such as erosion from stream banks. Biological A standard protocol for assessing the biological integrity of streams in the Ko‘olaupoko streams is to use The Hawai‘i Stream Bioassessment Protocol (HSBI). The guide can be downloaded at: (http://www.hawaii.gov/health/environmental/env-

WRAS, Kailua Bay Advisory Council 4 - 7
planning/wqm/hsbp301.pdf). Implementing stream bioassessment monitoring will provide an index of biological stream health which can be used to track changes over time, baseline monitoring or effectiveness of BMP. Physical and biological monitoring goals
increase the number of Ko‘olaupoko streams with completed physical and biological assessments;
identify sites where standards are exceeded;
identify high quality sites/reference locations; and
evaluate the effectiveness of Best Management Practices and watershed management
plans. The Biological Integrity and Physical Habitat assessment program element addresses six objectives: Objective 1: Assess the biological integrity of the waters of the Ko‘olaupoko area. Objective 2: Determine whether the biological integrity of specific waters are attaining standards. Objective 3: Determine whether the biological integrity of the Ko‘olaupoko waters are changing over time. Objective 4: Determine whether BMPs and other restoration efforts are effective in protecting and/or restoring biological integrity and physical habitat. Objective 5: Identify waters of the Ko‘olaupoko area that are high quality (can be uses as reference/benchmark sites) and those that are not meeting standards. Objective 6: Identify the waters of the state that are impacted by nuisance aquatic plants, algae blooms or invasive biological species. FISH CONTAMINANTS Fish contaminant monitoring is important to assess if fish are safe for human consumption and may be used as a surrogate to assess bioaccumulation within a sub-basin. Fish Contaminant monitoring goals are:
increase the number of streams and recreational fishing waters with assessed fish contaminant monitoring;
conduct additional sampling to confirm the results of preliminary sampling in
Enchanted Lake: and
WRAS, Kailua Bay Advisory Council 4 - 8
if contamination levels pose a risk to human health, implement a public outreach campaign.
The Fish Contaminant program element addresses six objectives: Objective 1: Determine whether fish from Ko‘olaupoko waters, especially Enchanted Lake and its tributaries are safe for human consumption. Objective 2: Determine whole fish contaminant concentrations in Ko‘olaupoko waters. Objective 3: Determine whether the levels of contaminants in fish are changing over time. Objective 4: Assist in the identification of Ko‘olaupoko waters that may exceed standards and target additional monitoring activities. Objective 5: Determine if new chemicals are bioaccumulating in fish in Ko‘olaupoko area. Objective 6: Determine causes of fish contamination (e.g. direct anthropogenic, eutrophication, etc.) through analysis. Volunteers Volunteers can play an important role in water quality data collection, education and project support. To have consistent data collected from volunteers, proper training and understandable protocols are essential to project success. Realistic expectation of the data quality and integrity should be taken into account before creating a volunteer water quality monitoring program. The EPA has extensive documents (http://www.epa.gov/owow/monitoring/volunteer/qappcovr.htm) that outline the methods for establishing a volunteer monitoring program. This information should be adapted to fit the needs in Hawai‘i; nevertheless, it will provide solid background information. Perhaps the best role for volunteers is the accompaniment with other staff. This will provide a second person to help collect data, learn proper protocols and ensure a safe field experience.
E. Priority areas
The following monitoring recommendations are based on an overall lack of data for most parameters throughout the Ko’olaupoko area. However, it must be realized that resources are scarce and priority areas/parameters must be selected for monitoring. The priority areas and parameters are highlighted in yellow in the charts below. Waimanalo Future recommendations for monitoring parameters, location and frequencies for the Waimanalo Watershed are listed in figure 4-1. Exact locations, sampling designs and quality assurance project plans will need to be developed prior to any monitoring.

WRAS, Kailua Bay Advisory Council 4 - 9
WaimanaloParameter Stream/sub-
basinLocation Purpose of
MonitoringFrequency Duration
Nutrient Waimanalo & Kahawai
Trib junctions, land use changes,
below/above ag lands
TrendAutomated
samplers, tied to storm events
3-5 years
Turbidity Waimanalo & Kahawai
Trib junctions, land use changes,
below/above ag lands
TrendAutomated
samplers,tied to storm events
3-5 years
Suspended Solids
Waimanalo & Kahawai
Waimanalo & Kahawai Streams
TrendAutomated
sampler, tied to storm events
3-5 years
Temperature Waimanalo & Kahawai
Waimanalo & Kahawai Streams
Baseline Hourly 3-5 years
Dissolved Oxygen
Waimanalo & Kahawai
Waimanalo & Kahawai Streams
Baseline Hourly 3-5 years
Biological Assessment Waimanalo
Repeatable from 1998 DOH assessment
Trend Once Every 3-5 years
Habitat Assessment Waimanalo
Repeatable from 2005 NRCS assessment
Trend Once Every 3-5 years
Sediment Studies Waimanalo
Above head of tide, middle
reach, above/ below Kailua
Reservoir
Baseline Automated samplers 3-5 years
Biological Assessment Kahawai Entire system at
selected sites Baseline Once Every 3-5 years
Habitat Assessment Kahawai Entire system at
selected sites Baseline Once Every 3-5 years
Kailua
Figure 4-1: Waimanalo Monitoring Matrix Figure 4-1: Waimanalo Monitoring Matrix

WRAS, Kailua Bay Advisory Council 4 - 10
Future recommendations for monitoring parameters, locations and frequencies for the Kailua Watersheds are listed in figure 4-2. Exact locations, sampling designs and quality assurance project plans will need to be developed prior to any monitoring.
KailuaParameter Stream/sub-
basinLocation Purpose of
MonitoringFrequency Duration
Nutrients/ turbidity
Ka’elepulu Stream & Enchanted
Lake
Above, in and below lake Trend
Automated samplers,
tied to storm events
3-5 years
Nutrients/ turbidity & suspended
solids
Kapa'a
Trib junctions, land use changes,
below/above developed
lands
Trend
Automated samplers,
tied to storm events
3-5 years
Nutrients/ turbidity Maunawili
Land use changes,
above/below Luana Hills Golf Course
Trend
Automated samplers,
tied to storm events
3-5 years
Biological Assessment Maunawili
Kawainui Marsh to
headwatersBaseline Once Every 3-5
years
Habitat Assessment Maunawili
Kawainui Marsh to
headwatersBaseline Once Every 3-5
years
Biological Assessment Kapa'a
Kawainui Marsh to
headwatersBaseline Once Every 3-5
years
Fish Contaminants Monitoring
Ka’elepulu Stream
Enchanted Lake & tribs
Trend, build on 2005 DOH assessment
Once Once
Kaneohe Future recommendations for monitoring parameters, locations and frequencies for the Kaneohe Watersheds are listed in figure 4-3. Exact locations, sampling designs and quality assurance project plans will need to be developed prior to any monitoring.
Figure 4-2: Kailua Monitoring Matrix

WRAS, Kailua Bay Advisory Council 4 - 11
South Kaneohe
Parameter Stream/sub-basin Location Purpose of
Monitoring Frequency Duration
Nutrients He'eia
Trib junctions, land use changes,
below/above developed
lands
Trend
Automated samplers,
tied to storm events
3-5 years
Nutrients & turbidity Kamo'oali'i
Trib junctions, land use changes,
below/above developed
lands
Trend
Automated samplers,
tied to storm events
3-5 years
Nutrients & turbidity
Kaneohe Stream
Trib junctions, land use changes,
below/above developed
lands
Trend
Automated samplers,
tied to storm events
3-5 years
Nutrients, turbidity & suspended
solids
Kawa
Trib junctions, land use changes,
below/above developed/
cemetery lands
Trend
Automated samplers,
tied to storm events
3-5 years
Nutrients, turbidity & suspended
solids
Kea'ahala Above/below
highly developed land
Baseline
Automated samplers,
tied to storm events
2-4 years
Biological Assessment Kaneohe
Repeatable from AECOS
2003 assessment
Trend once Every 3-5 years
Habitat Assessment Kaneohe Entire system
at selected sites Baseline once Every 3-5 years
Figure 4-3: Kane‘ohe Monitoring Matrix

WRAS, Kailua Bay Advisory Council 4 - 12
North Kaneohe
Parameter Stream/sub-basin Location Purpose of
Monitoring Frequency Duration
Nutrients Waiahole, Waihee
DOH monitoring
stationsBaseline
Automated samplers,
tied to storm events
1-3 years
Turbidity Kahalu'uDOH
monitoring stations
Baseline
Automated samplers,
tied to storm events
1-3 years
Biological Assessment
Waiahole, Waihee,
Waikane, Waianu, Hakipu'u
Entire system at selected
sites
Baseline/ reference site once Every 3-5
years
Nutrients/ turbidity & suspended
solids
Wiakane, Waianu Hakipu'u
Trib junctions, land use changes,
below/above ag lands
Baseline
Automated samplers,
tied to storm events
1-3 years
Habitat Assessment
Waihee, Wiakane, Waianu,
Hakipu'u, Waiahole
Entire system at selected
sites
Baseline/ reference site once Every 3-5
years

WRAS, Kailua Bay Advisory Council 5 -
1
Chapter V: Public Participation, Outreach and Education A. Introduction
Throughout the planning of the WRAS, KBAC hosted meetings inviting community members, agency representatives, academia and other interested citizens to provide feedback, information and technical support for the WRAS. A common theme in each meeting was the lack of having an organized, well planned approach to watershed management—in which community members could participate. Additionally, community members expressed a concern with a lack of agency to agency and bottom up (community to agency) communication and collaboration. As a result of this, for marked improvements in water quality throughout the Ko‘olaupoko region, it will take involvement and participation from a larger community effort which cuts across political boundaries and manages natural resources on a watershed and/or a ahupua’a scale. This effort requires all community members, agencies and industry to take responsibility for watershed health, create partnerships and synergisms with an avenue for communication. Adopting a mechanism of involving stakeholders in the active participation of natural resource management is possible via the adoption of a Watershed Council model. Watershed Council models have become common methods for community-based participation in natural resource management. For Watershed Councils to have the greatest opportunity for success, they should be locally organized, voluntary, non-regulatory groups established to improve the condition of watersheds in their local area. This will allow balanced representation ranging from community members to federal agencies and provide a forum to organize, discuss, offer solutions and pro-actively implement education, monitoring and restoration projects based on local priorities. Comprising Watershed Councils of local communities, they represent local knowledge and have ties to the existing community and have a better understanding of watershed issues and their complexities. The Councils should work across jurisdictional boundaries and across agency mandates to manage the watersheds more holistically. The Ko‘olaupoko area should establish four Watershed Councils including: Waimanalo, Kailua, South and North Kane‘ohe. This allows members in each area to focus on local priority projects without being over-shadowed by other councils, differing priorities or additional outside pressures. Each Council should seek acknowledgment from local Neighborhood Boards as a lead community entity into the planning process of watershed restoration and natural resource management. Creating Councils in the Ko‘olaupoko moku can also serve as a model for other regions on O‘ahu and throughout the Hawaiian Islands as an alternative method of natural resource management.
B. Members

WRAS, Kailua Bay Advisory Council 5 -
2
Each Watershed Council should seek at a minimum membership/participation from the following segments of the population:
Interested citizens/community members; Private Landowners; Ag producers; County, State and Federal land management/natural resource agencies (DLNR, Board
of Water Supply, NOAA Fisheries, Soil and Water Conservation Districts, etc.) Commercial and Recreational Fishers; Academia; Elected officials; and Private Industry
This cross-section of the community will ensure the Councils have balanced interest represented and draw from different expertise and disciplines. Additionally, it will facilitate the sharing of information, limit duplication of efforts and maximize limited funding for watershed education, monitoring and restoration projects.
C. Meetings At a minimum, quarterly meetings should be held in Waimanalo, Kailua, South Kane‘ohe and North Kane‘ohe at which time participating members are encouraged to bring issues to the table for discussion, investigation, prioritization and future implementation. Meetings should focus on issues which are relevant for the local watershed or ahupua’a. Meetings should be structured with all participating members having an equal voice and vote, creating an atmosphere which encourages active dialogue and participation. For Watershed Councils to function effectively, all members must be willing to work together, have equal voice and vote, realize the value of public-private partnerships and forge collaboration within the various State agencies.
D. Staffing To ensure the success of the Councils, the position of a Watershed Council Coordinator should be created. The Coordinator’s responsibilities should include:
key point of contact with Council members; meeting facilitator; partnership facilitation; research project feasibility; grant research and writing; project management and reporting; and data/information dissemination.
Providing staff for the Councils relieves volunteer council members from the day-to-day administrative activities, increases the probability for project implementation and provides continuity and institutional knowledge of projects.
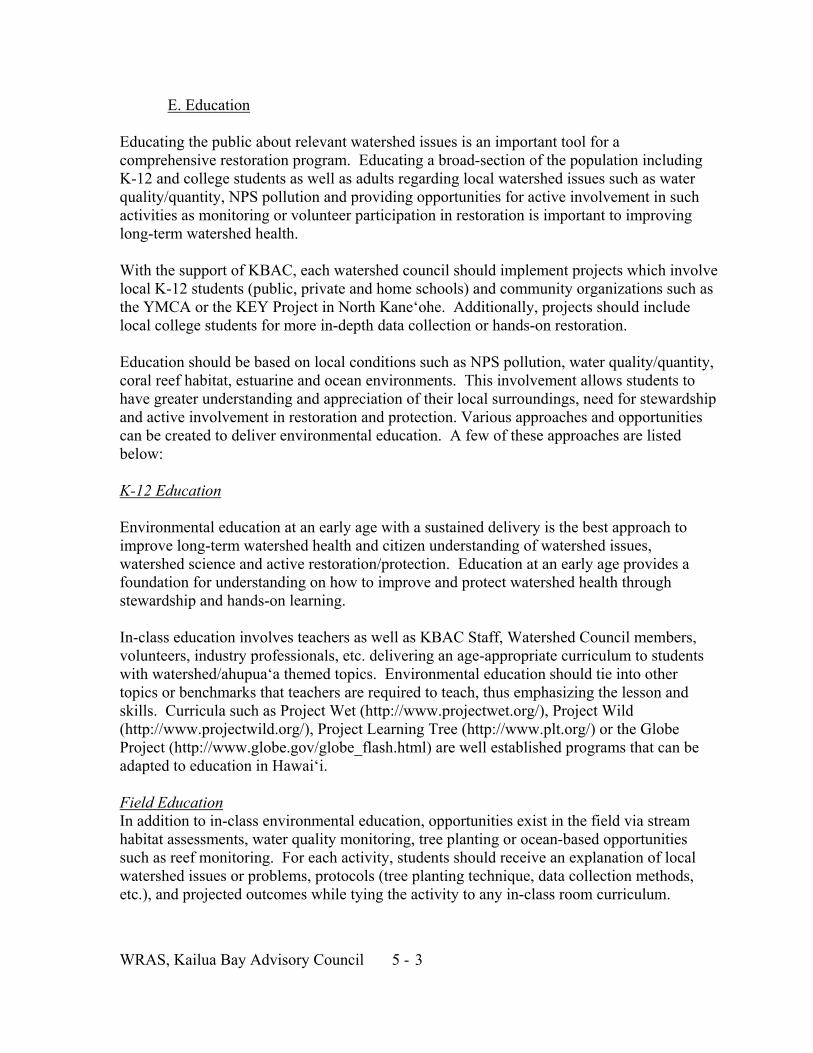
WRAS, Kailua Bay Advisory Council 5 -
3
E. Education Educating the public about relevant watershed issues is an important tool for a comprehensive restoration program. Educating a broad-section of the population including K-12 and college students as well as adults regarding local watershed issues such as water quality/quantity, NPS pollution and providing opportunities for active involvement in such activities as monitoring or volunteer participation in restoration is important to improving long-term watershed health. With the support of KBAC, each watershed council should implement projects which involve local K-12 students (public, private and home schools) and community organizations such as the YMCA or the KEY Project in North Kane‘ohe. Additionally, projects should include local college students for more in-depth data collection or hands-on restoration. Education should be based on local conditions such as NPS pollution, water quality/quantity, coral reef habitat, estuarine and ocean environments. This involvement allows students to have greater understanding and appreciation of their local surroundings, need for stewardship and active involvement in restoration and protection. Various approaches and opportunities can be created to deliver environmental education. A few of these approaches are listed below: K-12 Education Environmental education at an early age with a sustained delivery is the best approach to improve long-term watershed health and citizen understanding of watershed issues, watershed science and active restoration/protection. Education at an early age provides a foundation for understanding on how to improve and protect watershed health through stewardship and hands-on learning. In-class education involves teachers as well as KBAC Staff, Watershed Council members, volunteers, industry professionals, etc. delivering an age-appropriate curriculum to students with watershed/ahupua‘a themed topics. Environmental education should tie into other topics or benchmarks that teachers are required to teach, thus emphasizing the lesson and skills. Curricula such as Project Wet (http://www.projectwet.org/), Project Wild (http://www.projectwild.org/), Project Learning Tree (http://www.plt.org/) or the Globe Project (http://www.globe.gov/globe_flash.html) are well established programs that can be adapted to education in Hawai‘i. Field Education In addition to in-class environmental education, opportunities exist in the field via stream habitat assessments, water quality monitoring, tree planting or ocean-based opportunities such as reef monitoring. For each activity, students should receive an explanation of local watershed issues or problems, protocols (tree planting technique, data collection methods, etc.), and projected outcomes while tying the activity to any in-class room curriculum.
WRAS, Kailua Bay Advisory Council 5 -
4
Collecting scientific data such as water quality or invasive species data combines scientific data collection techniques, math skills and analytical skills through data interpretation. Additionally, any student presentation made to classmates or at public meetings combines writing and public speaking skills. College Students Offering opportunities to college students (University of Hawai‘i, Windward Community College and Hawai‘i Pacific University) can provide additional educational opportunities including high integrity data collection and analysis and volunteers for on-the-ground restoration. Partnering with biology or environmental science classes on projects can provide in-kind match, students for data collection and localized environmental education. Community education Education involving students is important; however, opportunities for adults to participate in watershed-based education are critical as well for future watershed health. Events such as KBACs stream walks allow community members to learn about local stream conditions including problems, water quality monitoring as well as current and future restoration activities. Each stream walk should include a ‘local stream expert’ with cultural and/or biological knowledge of the stream, stream condition and history. Stream walks, water quality monitoring, stream clean-ups, invasive species removal or other hands-on restoration projects should be offered to the public and integrated into grant applications. Example projects include, but are not limited to:
Additional streamwalks with data collection, cultural history and general stream habitat information;
Adopt-A-Stream Program (http://www.streamkeeper.org/); Water Quality Monitoring; and Storm Drain Painting (figure V-1).
Figure V-1: Storm drain painting
Image Source: University of Montana Watershed Health Clinic

WRAS, Kailua Bay Advisory Council
Appendix A: Community Meeting Notes
KBAC Meeting Waimanalo Watershed
November 14, 2006 6:30PM to 8:30 PM
Group Memory
The meeting began with a short overview by KBAC regarding the various streams in the Waimanalo Watershed area. The presentation described the various types of pollutants found in the streams and suggested projects that could lead to a lessening of the pollutant problems. Those members of the community attending were then asked three questions: What pollutants have we missed, what other types of projects would be useful in decreasing the pollutants in the area and what areas that may be causes of non-point pollution have we missed. What follows are those items identified by the community members present. Pollutants or information missed:
• Need to verify where the soil erosion polluting the stream is coming from – you say it is steep slope erosion - from walking the stream I note that it may be from stream bank erosion or a combination
• If you haven’t looked at you should look at the NRCS study done in 2004 by Doug Lows and Tina Hendersen
• Trash is a huge pollution factor – that and the nurseries use the stream for dumping • Other polluting factors are the temperature of the water and the dissolved oxygen –
especially in the channelized sections • Also need to look at the USGS studies on pesticides done in 03/04 – found
terminicides, dieldrin, chlorodanes etc. • Must properties adjacent to the stream have fill – very few natural stream banks
remain – “active incision” • The Olomana area was cleaned up in ’03 with a Spring Cleanup • Any place that is convenient for dumping along the stream you will find trash
Projects to consider
• Some project needs to be undertaken to address the lack of support and coordination from the state regarding stream restoration issues: DOH will give money short term for stream restoration and then expect that the ongoing maintenance will be picked up by the community or others – DLNR will not support restoration projects in its maintenance process – so when a successful project has no funds to maintain it the DLNR crew come in and spray and clear the area to avoid flooding – this is a huge problem and a very demoralizing one for community members that work on these projects.
• Need to establish MOUs between the various partners including DOH and DLNR to provide for long term maintenance and support of these restoration projects

WRAS, Kailua Bay Advisory Council
• Need to repair the disconnect within the departments between reef health and stream restoration and health – one is vital to the other
• Need to document current stream maintenance techniques used by the state and the impact these have on stream and reef ecosystems
• Need to have better stream monitoring for pollutant source identification – need agency coordination and buy in to do this
• Need to get a handle on over watering and over fertilizing of plants at nurseries – have tried nutrient plans and they don’t work – mainland all nursery run off needs to go unto impervious surface and then through drain system not into streams
• City needs to get involved and set up a plan for septic tank and cesspool problems – they should prioritize the extension of the sewer system to environmentally sensitive areas first
• There should be commitment on the part of the state, communities and landowners to watershed management and planning activities at the watershed level – need watershed manager positions and funding
• Need to also look at injection well issues Meeting adjourned at 8:15 PM.

WRAS, Kailua Bay Advisory Council
KBAC Meeting Kailua Watershed November 6, 2006
6:30PM to 8:30 PM Group Memory
The meeting began with a short overview by KBAC regarding the various streams in the Kailua Watershed area including Ka`elepulu, Kapa`a and Maunawili streams. The presentation described the various types of pollutants found in the streams and suggested projects that could lead to a lessening of the pollutant problems. Those members of the community attending were then asked three questions: What pollutants have we missed, what other types of projects would be useful in decreasing the pollutants in the area and what areas that may be causes of non-point pollution have we missed. What follows are those items identified by the community members present. Pollutants or information missed:
• The Enchanted Lakes Community Association has collected data on the amounts and types of trash they have removed from the lake
• Are the impacts of vehicles traveling on the roads being assessed and added – i.e. oils etc. – these can be seen floating on the lake
• Turbidity can also be attributed to individual yards and landscaping projects • Need to look at proposed construction on the slopes around the area and landslides on
the slopes • Yard people blow their yard opala into the streams and storm drains which
contributes to the problems • Need to explore and identify causes for the nutrient bloom that comes out of Oneawa
Channel – is there research that has been done there – any measurements etc. Projects to consider
• Install a mechanism on the Pali Highway that would handle the silt and debris during times of high precipitation
• Install storm drain filters within all storm drains in the watershed area – this type of project must also include a way to provide for the ongoing maintenance of these filters
• Develop a series of educational materials on how individual actions impact the health of the watershed and what role they can play in improving it – make sure they are at the proper level and language to meet the various target audiences
• Need to look at dredging Ka`elepulu (Enchanted Lake) – the community has identified specific places that would be most helpful – some noted that the lake was originally 18 feet and now is 9 or less depending on the area – also need to install sediment traps (Representatives left a handout regarding these projects with staff)
• Need to identify bio-remediation projects • Any projects we propose must look at how the continuing maintenance needs are
addressed

WRAS, Kailua Bay Advisory Council
• Some of the issues involved in getting things done on the lake involve ownership – there may be ownership models that would facilitate clean up and maintenance that fall between private ownership and public ownership – land trust etc. that should be looked at
• Work with the Corp and the community to split the flow off Kawainui Marsh so that it does not all run to Oneawa Channel
• Some thought the sand flow was a problem that should be looked at others questioned whether this was a problem
• Require that all types of work in Kailua require the use of permeable surfaces rather then impermeable surfaces – this would include public as well as private
• Explore regulations that require residents to contain and handle the water that falls on their property on the property
• Look at incentives to private landowners etc to make projects or behaviors that assist in maintaining or restoring the health of the watershed more attractive
• There were several opinions about the berm and opening it – the city does it but it is haphazard and should be more regular – maybe we should let the berm open naturally – what is the status of the City’s permit to do this – should revisit CDUA for opening the stream
• Need to identify best practices, educate on best practices and provide incentives to residents and businesses for implementing best practices on stream banks and drainage ditch shoulders
• There should be a GIS overlay developed for the watershed that shows all pollutants and where they are present – this could be used as a poster to get the community educated about the size of the problem and motivated to take individual actions suggested to help improve the situation
• As projects are undertaken they need to be monitored and evaluated to assist with the building of a data base for the area and what types of projects are most successful
• Need to encourage the state and city to continue and conclude discussions on the ownership of Kawainui Marsh as this is an impediment to implementing some projects
• Need to develop and implement a restoration plan for Kapa`a stream – there is a willing landowner
• Need to study the impact of pollution on the reef and how it effects protection of the reef ecosystem and the sustainability of the system given current pollutant level and use
• Explore alternative ownership ideas for the purchase of land slated for urbanization that could have significant impacts on the health of the watershed – need to purchase and return these areas to forest or appropriate native ecosystem to decrease the impacts on the watershed – this is being discussed in Maunawili for an area slated for development and OHA may be interested in participating
• Look at partnering with the Army Corp on watershed restoration – Corps is currently doing a study in the Marsh
• Look at bringing the water back to Kailua that is currently diverted to Waimanalo through the Maunawili Ditch

WRAS, Kailua Bay Advisory Council
• Educate individuals that pools should be drained through the sewer system and not to the storm drains
The group next discussed other areas that could produce pollution that had not been identified
• North side of Kapa`a Quarry road where there used to be a junk yard – this area needs to be studied – should explore a possible Brownfields designation for this area
• Impacts of ranching operations on Kawainui Marsh • The filling of areas of Hamakua Marsh • The old clay pigeon shooting range in the area of Oneawa Channel • Runoff and existing and proposed uses on Ulunawao Ridge
The meeting adjourned at 8:15

WRAS, Kailua Bay Advisory Council
KBAC Meeting Ko`olaupoko Watershed – South Kaneohe
November 9, 2006 6:30PM to 8:30 PM
Group Memory The meeting began with a short overview by KBAC regarding the various streams in the Waimanalo Watershed area. The presentation described the various types of pollutants found in the streams and suggested projects that could lead to a lessening of the pollutant problems. Those members of the community attending were then asked three questions: What pollutants have we missed, what other types of projects would be useful in decreasing the pollutants in the area and what areas that may be causes of non-point pollution have we missed. What follows are those items identified by the community members present.
• Hydro modification project: If KBAC sunsets in 2007, the hydro-mod project will end just at it was “getting its wheels on.”
• If the Hydro mod project is yielding good results, lets find funding to help municipalities to fund more or ongoing initiatives.
• Ko`olaupoko is supposed to be an area of low growth – it’s a hard sell to get land you can’t legally build in reclassified. Look at the % available for building and the % left to be built. Look at cemeteries and golf courses too.
• Curious about the “other” category in presentation (Land use: Kane`ohe Watershed). Are those vertical cliffs? These calculate out as lots of land – is that mostly what other is?
• Different layers on the map. There is one that depicts locations for sewers – across from the ball field hole – striking/noteworthy.
• Castle High School football field has significant impact on Kawa Stream. • There are two flows that join by Ko’s Pancake House parking lot – tributary of a
stream? • Did KBAC ID He`eia watershed area mauka of where it comes down to the ocean?
State land in that vicinity is used by off road vehicles. This use negatively affects turbidity.
• Other General Comments: o It seems you’ve covered most of the things. o Some of businesses have pipes that run from their warehouse floors directly
into Keahala stream and/or tributaries of Haiku Stream? o Is it legal to directly discharge into the stream. (if it’s water it’s ok, but if the
drains convey other material?) this could be problematic. o Dieldrin toxicity noted at different locations. This chemical is associated with
termite eradication – it adheres to soil and is subsequently taken up by squash/cucumber along with significant levels ppb.
o Nobody talks about Pearl Harbor being polluted like they do the Ala Wai. Is Pearl Harbor industrial?

WRAS, Kailua Bay Advisory Council
o PCB’s at Pearl Harbor are military in origin vs. chlordane, DDT, Dieldrin – possible result of runoff from sugar plantations.
o Willing to look at information for accuracy. Cultural should be part of the first round of presentations. Paul will look at the information and provide feedback.
o Changing demographics change the sense of community – it’s not as strong now.
o Kaneohe Bay in this area (in vicinity of meeting site) was all mudflats – as you go toward the Marine Base. Up to 20 years ago, oysters were gathered regularly in the wetlands. Don’t see that anymore.
o Don’t see torch fishing off shore anymore – water quality degradation has resulted in reduced fish populations.
o Puu Alii run off is terrible into the bay. Mike McCormick’s heritage area? o Across Kamehameha Hwy by the shopping center there is heavy run off. o Enforcement is more vigorous now. If you can see run off today like in the old
days people would be calling and demanding that something be done. o There is a lot facing Coconut Island. The owner did grading. Could see the
potential for problems no matter how they tried to contain it. o The main threat to water is urban uses – stuff that flows into storm drains and
into streams, etc. o The most positive action would be to leave all mauka areas undeveloped –
like Ho`omaluhia Park. o Kaneohe and Kawa streams have water all the time – and flow to the Bay.
Kaelepulu stream has little intercourse with the ocean. o There is potential for contributions to a healthy eco system – grant
opportunities: Kawa stream has strong possibilities. Landowners are wary of potential undercutting of lots – wanted more concrete to protect them.
o It would be difficult to do much with the stream that runs through the main part of town.
o Steep, flashy streams can’t handle pollutants – partially concreted. If riparian area abutting might see better assimilation.
o There are a number of pollutants from the landscape that go into the stream channels.
Project: Kawa Stream - bio remediation with akuli kuli - try using these kinds of mats at other locations. Setting the plants into floating mats has, over the last year, improved the water quality of Kawa stream – which flows into the fishpond. A stated goal is to improve the quality of the stream that runs by it. UH person is looking for a demo site – where roots can kill algae.

WRAS, Kailua Bay Advisory Council
Appendix B: Nonpoint Source Pollution and Erosion Comparison Tool (N-SPECT)
A: Introduction Nonpoint Source Pollution and Erosion Comparison (N-SPECT) is an informative spatial tool developed by National Oceanic Atmospheric Administration (NOAA) Coastal Services Center (CSC) for watershed managers and planners. It is a GIS-based application that models potential water-quality impacts from non-point source pollution and erosion. Model Inputs The model inputs include soil characteristic maps from U.S. Department of Agriculture (USDA), Natural Resources Conservation Service (NRCS), Soil Survey Geographic Database, 30m Digital Elevation Maps (DEMs) from the United States Geological Survey (USGS) National Elevation Dataset, annual precipitation from the Parameter-elevation Regressions on Independent Slopes Model (PRISM) group, and Coastal Change Analysis Program (CCAP) land cover. Each land cover type has an associated impervious surface co-efficient. Though ideal data are of highest resolution and of an extent large enough to include the entire study site, there are often difficulties obtaining such data. The data used in the project must be based on the lowest common denominator of the data. Thus, the final resolution and extent of the analysis is the same as lowest resolution dataset and dataset with the smallest extent, respectively. Basic Assumptions The basic assumptions of the model include an implicit trust in the land cover and soil erosion coefficients, the accuracy of rainfall and soil data, and the ubiquitous precision of the model throughout the entire watershed- from summit to sea. In reality, datasets used as NSPECT inputs are often low resolution and improperly geo-referenced. Also, NSPECT is not adept at modeling run-off over wet steep slopes throughout large topographically diverse watersheds. The model’s limitations often result in weak interpretations of model outputs—thus are not entirely accurate. Accuracy Accuracy is the degree to which the datasets and model outputs reflect true or accepted characteristics of the land at that spatial point. Accuracy issues arise from inputs of poor quality (data may not represent reality at that point), how well data are described and interpreted (attributes of data may be incorrect), and how many errors are contained within each dataset (data may not be entered correctly). NSPECT has known issues with weaker, less accurate modeling of erosion for wet, steep slopes. This is due, in part, to poor data collection for inaccessible mountainous areas. Other examples of poor accuracy are datasets which are poorly georeferenced to other maps--thus a point on a map may be describing rainfall at a specific point/location, but erosion at a point that is really 20 meters away. The accuracy assessment with the
WRAS, Kailua Bay Advisory Council
associated error term is a useful way to describe the accuracy of the land cover data. There are trade-offs between cost-efficiency and higher accuracy- which can be costly and time-intensive. The level of accuracy for NSPECT should be greater at the sub – ahupua’a level if managers care to look within an ahupua’a for sources of pollutants. If managers care to implement conservation measures at the parcel level, data should be greater or accurate to the parcel level and so on. Precision Precision is the level of measurement of datasets and how exact that measurement is. Precision issues arise from outdated datasets that may be collected with outdated technology or methods, the scale of the measurements that may be taken at an illogical scale (such as rainfall over 10 km cells), and the density of recorded observations (such as too few observations in heterogeneous steep slopes or too many in homogenous areas). As with accuracy, there are trade- offs between high-precision and cost. High-precision recordings often require more intensive data collection and more expensive technology to record data. High accuracy and high precision are not substitutable; you can certainly have one without the other. Thus, extremely precise data can be inaccurate if incorrectly recorded or transferred into a digitized dataset The level of precision needed by NSPECT varies depending on the weight of the attribute in the model. For example, road data do not need to be accurate to the tenth of an inch, but rainfall data should be more precise than the current 1 km input because rainfall contributes to more than one aspect of the model. Inputs to NSPECT, such as rainfall and soil erosion factors, are often derived from interpolation of few recorded data points and are subsequently low resolution datasets. Outputs The basic outputs include modeled accumulated nitrogen, phosphorus, sediment, total suspended solids, lead, and zinc in kilograms. NSPECT also models concentrations of the same parameters in milligrams/ Liter and where the concentrations exceed standards for that parameter. The limitations on interpreting these outputs will be discussed in more detail below. Outputs can be viewed over the entire Ko‘olaupoko watershed or by individual ahupua’a. The watershed-wide outputs for pollutant concentrations are not as informative as the outputs for accumulated parameters, given the varying precision problems and number of modeled basins in each ahupua’a (Figure: 1). An example is in Kawai Nui sub-basin where there are a few thousand modeled basin polygons and subsequently high concentrations of modeled pollutants over the small basin polygon areas. A watershed-wide comparison of accumulated pollutants is slightly more useful as a scoping tool to inform conservation planners or managers about the conservation needs for different ahupua’a and where to prioritize pollutant control measures (Figure:2, 3 & 4). As with pollutant concentration outputs, there are precision and

WRAS, Kailua Bay Advisory Council
Figure:1. Basin Polygons
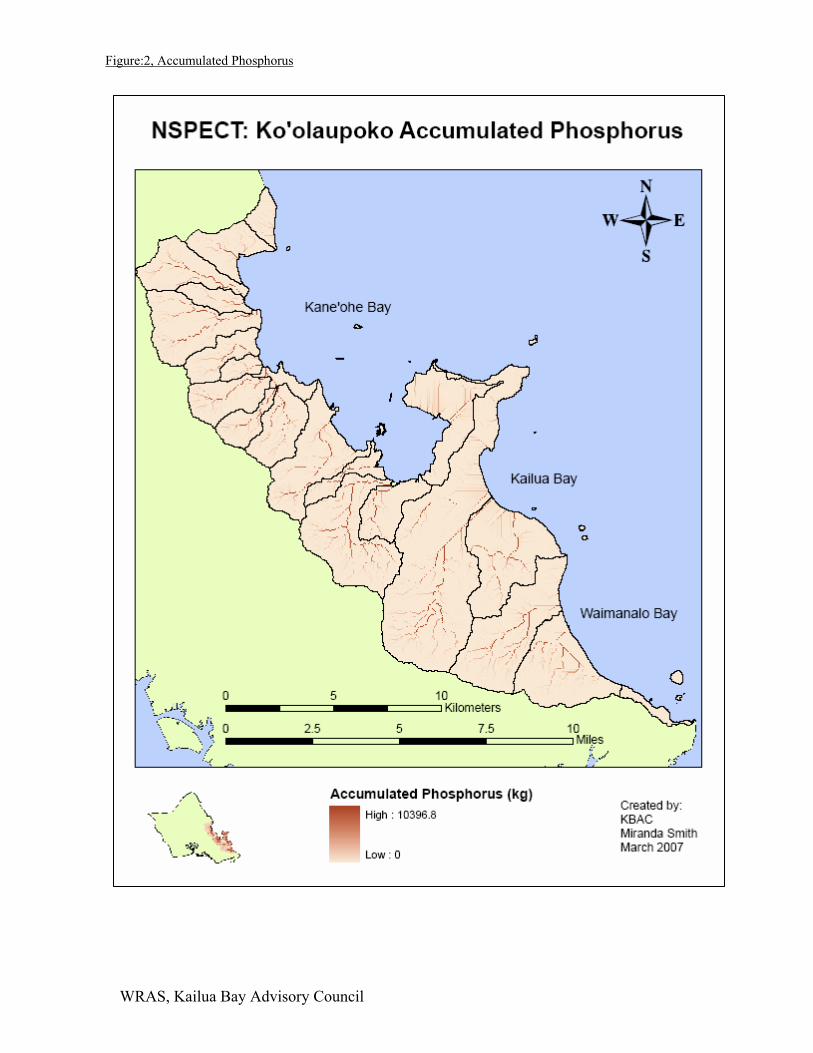
WRAS, Kailua Bay Advisory Council
Figure:2, Accumulated Phosphorus

WRAS, Kailua Bay Advisory Council
Figure:3. Accumulated Nitrogen

WRAS, Kailua Bay Advisory Council
Figure: 4. Accumulated TSS

WRAS, Kailua Bay Advisory Council
accuracy issues associated with accumulated pollutant outputs that may exist in one ahupua’a and not others. An example of two very different ahupua’a are Makapu’u, which is characterized by steep wet slopes, and Ka’elepulu, which is more makai and not adjacent to the Ko’olaupoko ridge. Thus, it is important to remember the watershed-wide application of the NSPECT tool as a scoping, not a decision-making tool. Modeled pollutant concentration outputs are most useful at the scale of individual ahupua’a (figure: 5, 6 & 7). For the conservation manager or watershed planner, these concentration outputs are useful ways to locate possible upstream pollutant source within each ahupua’a. All accuracy and precision issues do not disappear- but intrinsic variation between ahupua’a, as discussed above, are no longer relevant.
B. Future recommendation with NSPECT Additional model outputs include scenario analyses of different land cover change. These scenarios are simple polygons with a single land use designation which overlay the CCAP land use data and replace the land use/ land cover inputs for that area. The scenario land use changes the modeled outputs described above. The magnitude of the change is a function of the area in the scenario polygon, the type of original land use, the slope, and the type of land use of the scenario polygon. The power in using the NSPECT application comes from noting changes in modeled parameters as a result from scenario alternative land uses. Future use of the NSPECT tool should be focused in this direction. The current database and datasets include modeled baseline pollutant accumulations and concentrations. Users can now model scenarios of best management practices or possibly changes in run-off coefficients as a result from storm water catchments or buffers. The tool is also being updated to include more accurate and more precise erosion coefficients for steep wet slopes. A new version of NSPECT will certainly provide a more accurate description of pollutant accumulation and concentrations. In addition to better models, more precise land cover data and precipitation are becoming increasingly public, as well. It is strongly recommend that this region be frequently remodeled using the newer datasets and technologies.
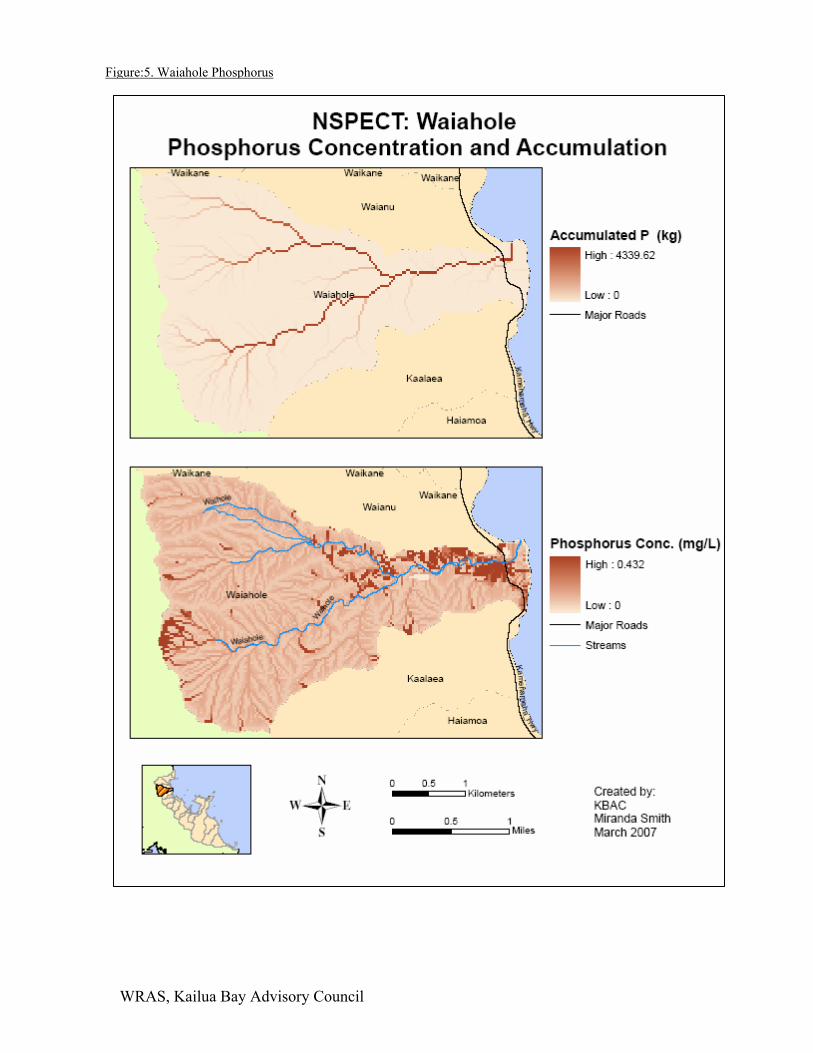
WRAS, Kailua Bay Advisory Council
Figure:5. Waiahole Phosphorus
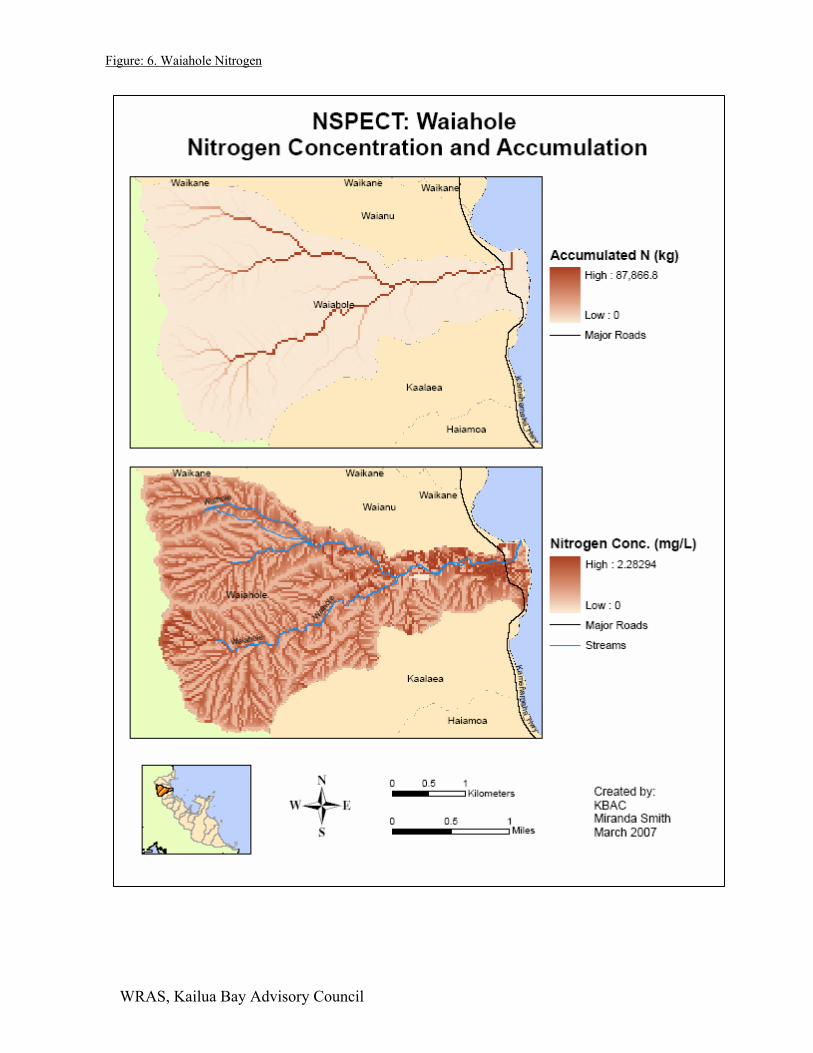
WRAS, Kailua Bay Advisory Council
Figure: 6. Waiahole Nitrogen
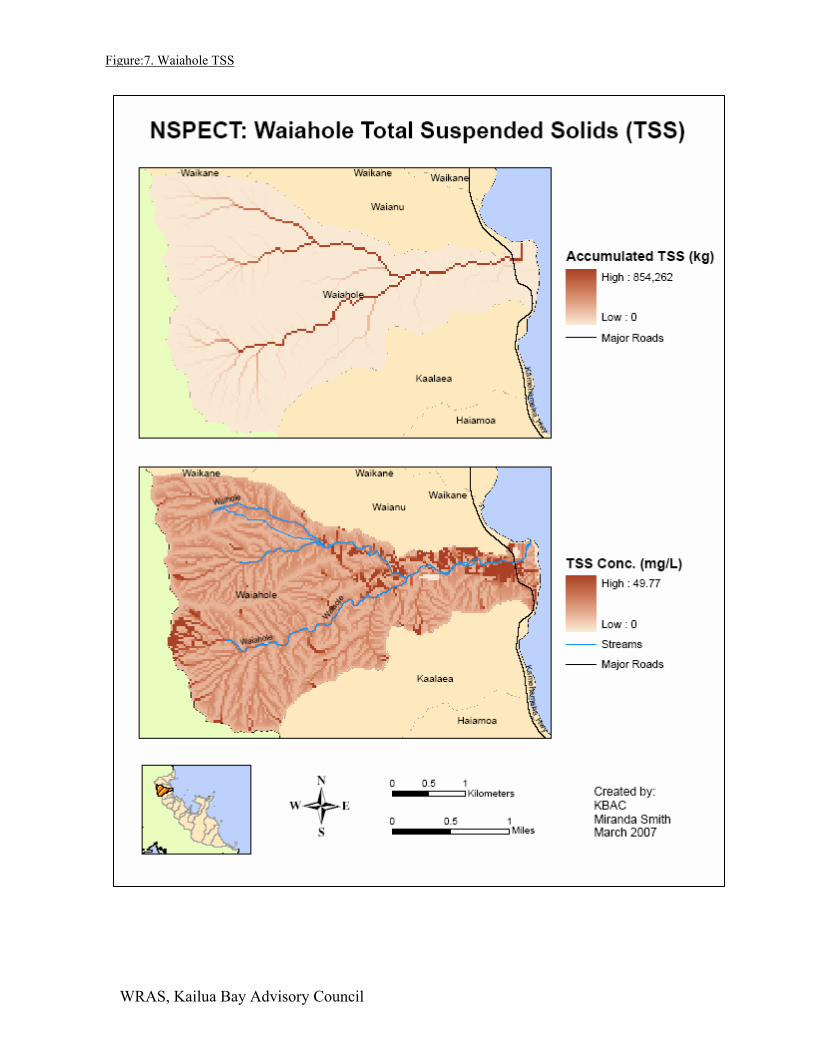
WRAS, Kailua Bay Advisory Council
Figure:7. Waiahole TSS

WRAS, Kailua Bay Advisory Council
Table: 1. Quantitative outputs for pollutant accumulation and concentration
Ahupua'aHighest
Accumulated Phosphorus
Highest Concentration Phosphorus
Highest Accumulated
Nitrogen
Highest Concentration
Nitrogen
Highest Accumulated
TSS
Highest Concentration
TSS(kg) (mg/ L) (kg) (mg/ L) (kg) (mg/ L)
Ahuimanu 3,629.97 0.43 47,461.30 2.36 553,077.00 56.61Haiamoa 1,797.50 0.40 27,877.50 2.36 307,693.00 49.22Hakipuu 974.98 0.41 18,943.40 2.27 187,339.00 48.16Heeia 5,048.42 0.45 59,963.30 2.34 788,797.00 68.37Kaalaea 1,774.53 0.42 27,733.50 2.33 304,676.00 48.10Kaelepulu 8,391.45 0.46 130,130.00 2.38 1,429,420.00 67.17Kahaluu 2,560.01 0.41 35,656.00 2.26 406,885.00 48.30Kahaluu segment 10,396.80 0.38 137,784.00 1.99 1,630,660.00 53.25Kahawai 5,091.51 0.45 47,544.10 2.63 728,807.00 65.68Kaneohe 10,017.80 0.48 104,383.00 2.46 1,465,040.00 66.47Kawa 3,384.85 0.47 26,196.40 2.42 444,600.00 63.94Kawainui 8,057.34 0.45 127,953.00 2.31 1,385,610.00 68.61Keaahala 2,444.27 0.44 19,531.60 2.25 334,524.00 65.50Kualoa 244.59 0.44 2,558.76 2.29 31,694.00 52.07Makapuu 20.59 0.37 236.24 1.89 3,125.84 60.16Puu Hawaiiloa 1,514.95 0.46 9,630.64 2.41 190,100.00 69.38Waiahole 4,339.62 0.41 87,866.80 2.28 854,262.00 48.38Waianu 749.70 0.43 12,551.90 2.42 134,741.00 49.81Waihee 6,496.02 0.44 85,789.10 2.52 1,000,390.00 52.63Waikane 2,839.75 0.45 67,004.90 2.32 612,608.00 55.43Waimanalo 7,007.28 0.47 83,126.80 2.55 1,067,760.00 60.96
Numbers are represented in Annual Loads

WRAS, Kailua Bay Advisory Council
Appendix C: References Babcock, R. Jr. (2005). Scoping report Ka’elepulu Stream total maximum daily loads (Draft). Bay Pacific Consulting. (1996). Recommendations for Hawaii’s riparian areas: Functions, best management practices, approaches and implementation strategy. Bourke, R.E. (2006). Water quality in Ka’elepulu Pond, results and summary of sampling from five storms. Center for Watershed Protection. (2004). Urban stream repair practices. Department of Health and Human Services, Agency for Toxic Substances and Disease Registry. (2002). ToxFAQs for aldrin/dieldrin. Retrieved from http://www.atsdr.cdc.gov/tfacts1.html Hoover, D. J. (2002). Fluvial nitrogen and phosphorus in Hawaii: Storm runoff, land use, and impacts on coastal waters. University of Hawaii at Manoa, Department of Oceanography. Kailua Bay Advisory Council. (2002). Ko‘olaupoko water quality action plan. Kailua Bay Advisory Council. (2006). Assessment of the chemical contamination in Enchanted Lake areas. Kane’ohe Bay Master Planning Task Force. (1992). Appendix volume to the Kane‘ohe Bay master plan. MBA International. (1993). Background studies of nonpoint source pollution in the State of Hawaii. Roll, B. M., and Fujioka, R.S. (1993). Microbiological assessment of Ka’elepulu Stream and the impact of discharge in Kailua Bay. State of Hawai‘i: Department of Health and Environmental Planning Office. (2006) Total maximum daily loads (TMDLs) for total suspended solids, nitrogen and phosphorus in Kapa‘a Stream Kailua, Hawaii (Draft). State of Hawai‘i: Department of Health and Environmental Planning Office. (2001). Total maximum daily loads estimated for Waimanalo Stream, island of Oahu, Hawai‘i.

WRAS, Kailua Bay Advisory Council
State of Hawai‘i: Department of Health and Environmental Planning Office. (1998) Biological assessment and habitat characterization of Waimanalo Stream: Establishing environmental goals and a TMDL for watershed management. State of Hawai‘i: Department of Health and Environmental Planning Office. (2001) Kawa Stream bioassessment. Tetra Tech. (2003). Controlling polluted surface water runoff in Kailua watershed, a guide to stormwater best management practices (Draft). Thomson, J. (1993). Waimanalo preliminary water quality study: An assessment of non point source water pollution in the hydrologic unit. Toews, D.W. & Henderson, K.D. (2005). Field assessment: Alternatives for restoration in Waimanalo Stream. NRCS. Tomlinson, M. S. and DeCarlo, E.H. (2001). Investigation of Waimanalo and Kane‘ohe Stream. University of Hawai‘i at Manoa, Department of Oceanography. United States Environmental Protection Agency. (2003). Health effects support document for aldrin/dieldrin. Waimanalo Health Center. (2002) Waimanalo watershed restoration plan. Wilson Okamoto Corporation. (2004). Kane‘ohe-Kahalu’u stream restoration & maintenance, a community guidebook.


