Koichi Yamaura* and Tian Xia Measuring Bilateral Market Power in International Markets of Vertically Differentiated Agricultural Commodities Abstract: Two features of international markets of agri- cultural commodities are bilateral market power of exporting and importing countries and the coexistence of non-genetically modified (non-GM) and genetically modified (GM) products. The two features were not taken into account in most extant studies on market power in international agricultural commodity markets. This research develops a bilateral oligopoly model with the interaction between non-GM and GM commodity and conducts an empirical estimation for U.S.–Japan soybean trade. The estimation results show that U.S. exporters and Japanese importers are almost equally sharing the dom- inance of market power. The analysis in this research provides new measures of market power and improves the understanding on world soybean markets. Keywords: bilateral oligopoly, market power, non-GM soybeans, vertically differentiated products JEL Classification: Q17, F12, D43 DOI 10.1515/jafio-2013-0020 Introduction World agricultural commodity trade flows have changed dramatically during the last decade. On the production side, major agricultural commodity producing countries such as the United States, Brazil, and China started and expanded the production of genetically modified crops. On the consumption side, world demand for agricultural commodities has been increasing significantly, mostly due to higher incomes in developing countries and world population growth. An important issue in world markets of agricultural commodities is market power. Market power may exist in these markets due to high market concentration, barriers to entry, product differen- tiation, or state trading behaviors. The existence and degree of the market power have important implications for world agricultural producers, consumers, and governments. To examine and measure the degree of market power, two important features of international markets of agri- cultural commodities need to be taken into account. One feature is that, on either side of a market, exporting or importing, there are usually a few countries that account for the majority of trade flow. 1 Thus, both exporting and importing countries may have market power to influence the market price. The second feature is that non-GM and GM products co-exist in international markets of some agricultural commodities, such as soybeans. For any type of agricultural commodity, the non-GM commodity and the GM commodity are vertically differentiated in the sense that, if the prices of the two goods are the same, all consumers will generally prefer the non-GM commodity. The first feature that both exporting and importing countries have market power is an example of bilateral oligopoly (BO). Gabszewicz and Michel (1997) presented a bilateral oligopoly structure as a special case of a com- plete multilateral oligopoly structure. A single consump- tion commodity is traded in a commodity money. Sellers have endowments of the consumption commodity and buyers have endowments of the commodity money. Each agent has market power in the market for which her initial endowment of the commodity is positive. The relative price that clears both markets is the ratio of aggregate offers of two commodities. Bloch and Ghosal (1997) analyzed the incentives to form trading groups in a bilateral oligopoly. Only when all agents trade on the same market, the trading structure is strongly stable. Dickson and Hartley (2013) found that, when the number of buyers becomes large, bilateral oligopoly approaches an alternative game of quantity competition, the market *Corresponding author: Koichi Yamaura, International Environmental and Agricultural Science, Tokyo University of Agriculture and Technology, Tokyo, Japan, E-mail: [email protected]Tian Xia, Agricultural Economics, Kansas State University, Manhattan, KS, USA, E-mail: [email protected]1 For example, in the world soybean market, the United States and Brazil are the major exporting countries and China, European Union, and Japan are the major importing countries. Journal of Agricultural & Food Industrial Organization 2016; 14(1): 33–42 Brought to you by | Kansas State University Libraries Authenticated Download Date | 8/4/17 12:20 AM
Transcript
Koichi Yamaura* and Tian Xia
Measuring Bilateral Market Power in InternationalMarkets of Vertically Differentiated AgriculturalCommodities
Abstract: Two features of international markets of agri-cultural commodities are bilateral market power ofexporting and importing countries and the coexistenceof non-genetically modified (non-GM) and geneticallymodified (GM) products. The two features were nottaken into account in most extant studies on marketpower in international agricultural commodity markets.This research develops a bilateral oligopoly model withthe interaction between non-GM and GM commodity andconducts an empirical estimation for U.S.–Japan soybeantrade. The estimation results show that U.S. exporters andJapanese importers are almost equally sharing the dom-inance of market power. The analysis in this researchprovides new measures of market power and improvesthe understanding on world soybean markets.
World agricultural commodity trade flows have changeddramatically during the last decade. On the productionside, major agricultural commodity producing countriessuch as the United States, Brazil, and China started andexpanded the production of genetically modified crops.On the consumption side, world demand for agriculturalcommodities has been increasing significantly, mostlydue to higher incomes in developing countries andworld population growth. An important issue in worldmarkets of agricultural commodities is market power.
Market power may exist in these markets due to highmarket concentration, barriers to entry, product differen-tiation, or state trading behaviors. The existence anddegree of the market power have important implicationsfor world agricultural producers, consumers, andgovernments.
To examine and measure the degree of market power,two important features of international markets of agri-cultural commodities need to be taken into account. Onefeature is that, on either side of a market, exporting orimporting, there are usually a few countries that accountfor the majority of trade flow.1 Thus, both exporting andimporting countries may have market power to influencethe market price. The second feature is that non-GM andGM products co-exist in international markets of someagricultural commodities, such as soybeans. For anytype of agricultural commodity, the non-GM commodityand the GM commodity are vertically differentiated in thesense that, if the prices of the two goods are the same, allconsumers will generally prefer the non-GM commodity.
The first feature that both exporting and importingcountries have market power is an example of bilateraloligopoly (BO). Gabszewicz and Michel (1997) presented abilateral oligopoly structure as a special case of a com-plete multilateral oligopoly structure. A single consump-tion commodity is traded in a commodity money. Sellershave endowments of the consumption commodity andbuyers have endowments of the commodity money.Each agent has market power in the market for whichher initial endowment of the commodity is positive. Therelative price that clears both markets is the ratio ofaggregate offers of two commodities. Bloch and Ghosal(1997) analyzed the incentives to form trading groups in abilateral oligopoly. Only when all agents trade on thesame market, the trading structure is strongly stable.Dickson and Hartley (2013) found that, when the numberof buyers becomes large, bilateral oligopoly approachesan alternative game of quantity competition, the market*Corresponding author: Koichi Yamaura, International
Environmental and Agricultural Science, Tokyo University ofAgriculture and Technology, Tokyo, Japan, E-mail:[email protected] Xia, Agricultural Economics, Kansas State University,Manhattan, KS, USA, E-mail: [email protected]
1 For example, in the world soybean market, the United States andBrazil are the major exporting countries and China, European Union,and Japan are the major importing countries.
Journal of Agricultural & Food Industrial Organization 2016; 14(1): 33–42
Brought to you by | Kansas State University LibrariesAuthenticated
Download Date | 8/4/17 12:20 AM
share game. Azzam (1996) is one of the few empiricalstudies using a bilateral oligopoly model to analyze mar-ket power in agricultural and food markets. In the study,an empirical bilateral oligopoly model was developed toestimate the relative market power of packers and retai-lers in the U.S. beef slaughter and retail industries.Maude-Griffin et al. (2004) conducted an empirical ana-lysis based on a bilateral oligopoly framework to measurethe market power of health maintenance organizationsand employers in the health insurance market.
The second feature is the coexistence of two differ-entiated products, non-GM and GM products, in interna-tional markets of some agricultural commodities. Thereare two major approaches for estimating market power inmarkets of differentiated products: one is estimating theresidual demand faced by each firm and the other isestimating a demand system (Perloff et al. 2007). Berry,Levinsohn, and Pakes (1995) studied the U.S. automobileindustry by using product-level price and quantity data toestimate demand parameters for a class of differentiatedproducts. Their estimates were the sum of individualpurchase probabilities, which is equal to the actual mar-ket share of new cars. Goldberg (1995), however, usedhousehold-level data in the U.S. automobile industry toexamine the probability that a household purchases todetermine the demand curve faced by firms. Nevo (2001)decomposed estimated price–cost margins into marginsdue to product differentiation, multiproduct firm pricing,and potential price collusion in the ready-to-eat cerealindustry using a mixed logit model. Pinske, Slade, andBrett (2002) examined the retail gasoline market by usingan alternative approach. The product differentiation wasdue to special competition in their study, and a semipara-metric approach was used to analyze cross-price responsecoefficients. Some problems still exist in estimating mar-ket power and further research is needed. For example,because of lacking detailed data on costs, researchershave introduced strong assumptions about cost, e.g.,constant returns to scale (Perloff et al. 2007).
Numerous studies have estimated the degree of mar-ket power in international markets of commodities andother agricultural/food products.2 However, the two fea-tures of international agricultural commodity marketswere in general not taken into account in the extant
research. First, the potential bilateral market power ofexporting and importing countries was not structurallymodeled in previous studies on international markets ofagricultural commodities.3 Second, the interactionbetween two vertically differentiated goods − non-GMand GM commodity − was ignored in almost all existinganalysis. Yamaura (2014) included the interactionbetween non-GM and GM soybeans in the estimation ofmarket power in U.S.–Japan soybean trade, but the bilat-eral market power in international soybean markets wasnot modeled in his analysis. In sum, no existing studyhas taken both features, the bilateral market power ofexporting and importing countries and the interactionbetween non-GM and GM commodity, together into con-sideration to examine market power in international mar-kets of agricultural commodities.
Failing to include either or both features can result inincorrect measures of exporters’ or importers’ marketpower in international commodity markets and mislead-ing policy and welfare implications (Mulik and Crespi2011). This paper addresses this gap in the literature byexplicitly including both bilateral market power ofexporting and importing countries and the interactionbetween non-GM and GM commodity in an analysis onthe market power of exporters and importers in interna-tional soybean markets. We first develop a bilateral oli-gopoly model to incorporate the interaction between non-GM and GM commodity in the analysis. Then, we use themodel to conduct an empirical estimation on U.S.–Japansoybean trade.
Bilateral oligopoly model
Both U.S. exporters and Japanese importers may havemarket power to influence the soybean prices in theU.S.–Japan soybean trade. In addition, both non-GM andGM soybeans, the two vertically differentiated commod-ities, are exported from the United States to Japan. Thus,we develop a bilateral oligopoly model with the inter-action between non-GM and GM commodity to capturethese two features of the international soybean market.
2 Carter, MacLarean, and Yilmaz (1999), Yang and Lee (2001), Cho,Jin, and Koo (2002), Reed and Saghaian (2004), Poosiripinyo andReed (2005), Song (2006), Andersen, Asche, and Roll (2008), Songet al. (2009), Felt, Gervais, and Laure (2010), Mulik and Crespi(2011), and Yamaura (2011) measure the degree of market power inthe trade of agricultural and food products.
3 Andersen, Asche, and Roll (2008) and Song et al. (2009) tried touse both the residual demand elasticity (RDE) and residual supplyelasticity (RSE) model to measure both exporters’ and importers’power in the European dried salted cod market and Chinese soybeantrade market. One deficiency of these studies using both RDE andRSE together is that they did not provide a theoretical foundationthat allows both exporters’ and importers’ market power to interactin determining the final market equilibrium.
34 K. Yamaura and T. Xia: Measuring Bilateral Market Power in International Markets
Brought to you by | Kansas State University LibrariesAuthenticated
Download Date | 8/4/17 12:20 AM
This model is developed and specified based on the frame-works in previous research on bilateral oligopoly includingAzzam (1996), Gabszewicz and Michel (1997), Bloch andGhosal (1997), Maude-Griffin et al. (2004), and Dicksonand Hartley (2013).
Consider the international soybean market with Nexporters and L importers. The market inverse demandfunction is PO ¼ f QO
� �with f 0<0 , where PO and QO are
the price and the trade volume in international non-GMsoybean market, respectively, and superscript “O”denotes non-GM commodity. The market inverse supplyfunction is PO ¼ h QO
� �with h0 >0 .
We first derive the price in international soybeanmarket when N exporters have complete dominanceover importers in terms of market power. The profit ofexporter n (n ¼ 1, 2, …, N) is
πexn ¼ ðPO � ζYÞqexn ¼ f QO� �� ζY� �
qexn ;
where qexn is the export volume of exporter n, Y is a vectorof supply shifters of exported soybeans, ζ is a vector ofparameters, ζY is the average cost of exported soybeans,and superscript “ex” denotes exports. Taking the deriva-tive of πexn with respect to qexn yields exporter n’s the first-order condition,
@πexn@qexn
¼ PO þ @f=@QO� �
@QO=@qexn� �
qexn � ζY ¼ 0;
from which we obtain PO 1þ @f�@QO
� �QO
�PO
� ��@QO
�@qexn
� �qexn
�QO
� �� � ζY ¼ 0 for n ¼ 1, 2, …, N.Calculating the summation of the conditions of all Nexporters and dividing the summation by N yield
PO 1þ @f�@QO
� �QO
�PO
� ��XN
n¼1@QO
�@qexn
� �qexn
�QO
� �.N
h io� ζY ¼ 0
) PO 1þ ν="Dð Þ½ � ¼ ζY ;
where "D ¼ 1@f=@QOð Þ QO=POð Þ is the demand elasticity of inter-
national soybean market, ν ¼ PNn¼1 @QO
�@qexn
� �
qexn�QO
� �.N is the quantity weighted average of expor-
ter-specific conjectural elasticity. We solve the last con-
dition for PO to obtain the equilibrium price when Nexporters have complete dominance of market power,
Pupper ¼ 11þ ν="Dð Þ ζY ¼ ηY ;
where η is defined as η ¼ 11þ ν="Dð Þ ζ and it is a vector of
parameters to be estimated, and superscript “upper” indi-cates that Pupper is the upper limit of price in the interna-tional soybean market.
Then we derive the price in international soybeanmarket when L importers have complete dominanceover exporters in terms of market power. The profit ofimporter l (l ¼ 1, 2, …, L) is
πiml ¼ POr � PO
� �qiml � CO
r qiml� �
¼ POr � h QO� �� �
qiml � COr qiml� � ;
where qiml is the import volume of importer l, POr is the
retail/wholesale price that importer l can receive fromselling the imported soybeans in its own country’s mar-ket, CO
r qiml� �
is the importer’s selling cost of soybeans,superscript “im” denotes imports, and subscript “r”denotes retail/wholesale. Taking the derivative of πimlwith respect to qiml yields importer l’s the first-ordercondition,
@πiml@qiml
¼ POr � PO � @h
�@QO
� �@QO
�@qiml
� �qiml �MCO
r ¼ 0;
where MCOr ¼ @CO
r
�@qiml is the importer’s marginal selling
cost of imported soybeans. From the first-order condition,we find PO
r � PO 1þ @h�@QO
� �QO
�PO
� �@QO
�@qiml
� ��qiml
�QO
� �� �MCOr ¼ 0 for l ¼ 1, 2, …, L. Taking the sum-
mation of the conditions of all L importers and dividingthe summation by L yield
POr � PO 1þ @h
�@QO� �
QO�PO� ��XL
l¼1@QO
�@qiml
� �qiml
�QO
� �.L
h io�MCO
r ¼ 0
) PO 1þ μ="Sð Þ½ � ¼ POr �MCO
r ;
where "S ¼ 1@h=@QOð Þ QO=POð Þ is the supply elasticity of inter-
national soybean market, μ ¼ PLl¼1 @QO
�@qiml
� �
qiml�QO
� �.L is the quantity weighted average of impor-
ter-specific conjectural elasticity. We solve the last con-
dition for PO to find the equilibrium price when Limporters have complete dominance of market power,
Plower ¼ 11þ μ="Sð ÞZ ¼ λZ;
where Z ¼ POr �MCO
r is a vector of demand shifters ofimported soybeans, λ is defined as λ ¼ 1
1þ μ="Sð Þ and it is avector of parameters to be estimated, and superscript“lower” indicates that Plower is the lower limit of price inthe international soybean market.
In a more common bilateral oligopoly market, neitherimporters nor exporters have complete dominance. Bothimporters and exporters have some degree of influenceon the market price. If the relative dominance of impor-ters over exporters in terms of market power is denoted asα, the market equilibrium price of bilateral oligopoly can
K. Yamaura and T. Xia: Measuring Bilateral Market Power in International Markets 35
Brought to you by | Kansas State University LibrariesAuthenticated
Download Date | 8/4/17 12:20 AM
be specified as a weighted average of the lower andupper price limit,
For the relative dominance in terms of market power,Azzam (1996) used a single parameter α 2 0; 1½ � to repre-sent the degree of dominance of downstream firms (beefretailers) and 1� α to represent the degree of dominanceof upstream firms (beef packers). Then the parameter α
was estimated and the estimates, α̂ and 1� α̂ , are used tointerpret the relative dominance of retailers and packers.Maude-Griffin et al. (2004) used a function of variousfactors, γit ¼ exp Z0
itθð Þ , to represent the degree of dom-inance of health maintenance organizations (HMOs) interms of market power and 1� γit to represent the degreeof dominance of employers in the health insurance mar-ket, where Zit is a vector of variables affecting the HMOs’and employers’ relative dominance such as the localHMO market structure and the administrative cost ratioof HMOs. θ is a vector of parameter to be estimated. γitand 1� γit are calculated using the estimates of θ and thevariable values of Zit to measure the relative dominanceof HMOs and employers.
We derive and use a function of various factors (seeAppendix for the derivation),
α ¼ g WN ; RL;PGM;JP;PGM;US� �
¼ 1
1þ exp δ1 þ δ2PGM;JP þ δ3PGM;US þ fWN þ τRL� � ;
½2�
to represent the degree of dominance of importers and1� α to represent the degree of dominance of exporters,where WN is a vector of the cost shifters for competingsoybean exporting countries, RL is a vector of the costshifters for competing soybean importing countries,PGM;JP and PGM;US are the prices of the vertically differen-tiated substitute, GM soybeans, in Japan and the UnitedStates, and δ1, δ2, δ3, f, τ are parameters or vectors ofparameters to be estimated. The functional form in eq. [2]can guarantee α 2 0; 1½ � but impose no sign constraints onparameters. α ¼ 0 indicates the complete dominance ofexporters and α ¼ 1 indicates the complete dominance ofimporters. When α1 <0:5 (α1 >0:5), importers have less(more) market power than exporters. When importerscompletely dominate exporters, the equilibrium interna-tional soybean price reaches the lower limit of possibleprice levels. However, if exporters completely dominateimporters, the equilibrium international soybean price isthe upper limit of possible price levels. The equilibrium
soybean price of a bilateral oligopoly market is theweighted average of the lower and upper price limit andthe weights are the degrees of dominance of importers andexporters in terms of market power.
We substitute eq. [2] into eq. [1] to obtain the empiri-cal bilateral oligopoly model with the interaction betweennon-GM and GM soybeans as
½3�where WN is a vector of the cost shifters for competingsoybean exporting countries consisting of the exchangerates between Japan and competing exporting countriessuch as Canada and China, RL is a vector of the costshifters for competing soybean importing countries con-sisting of the exchange rates between the United Statesand competing importing countries such as the EU,China, and South Korea, Z is a vector of demand shiftersof the Japanese market consisting of Japanese averageincome, Y is a vector of supply shifters in the UnitedStates including labor cost, energy cost, and the soy-bean-corn futures price ratio, δ1, δ2, δ3, f, τ, λ, and η
are parameters or vectors of parameters, and u is the errorterm.
For comparison, we also estimate the empirical BOmodel when the interaction between non-GM and GMsoybeans is ignored. Without the interaction term, therelative dominance of importers over exporters changes to
~α ¼ 1
1þ exp δ1 þ fWN þ τRL� � : ½4�
So the empirical bilateral oligopoly model without theinteraction between non-GM and GM soybeans is speci-fied as
POUS;JP ¼ 1
1þ exp δ1 þ fWN þ τRL� � λZð Þ
þ exp δ1 þ fWN þ τRL� �
1þ exp δ1 þ fWN þ τRL� � ηYð Þ þ u
ðModel without InteractionÞ:½5�
Equations [3] and [5] specify two versions of the empiricalBO model for U.S.–Japan soybean trade. PO
US;JP is theequilibrium price of non-GM soybeans that Japanimports from the United States. In the estimation, the
36 K. Yamaura and T. Xia: Measuring Bilateral Market Power in International Markets
Brought to you by | Kansas State University LibrariesAuthenticated
Download Date | 8/4/17 12:20 AM
data of Japanese non-GM soybean import price is usedfor PO
US;JP.4
The parameters of interest are α, ~α, δ2, and δ3.The values of α and ~α measure the relative degrees ofdominance of Japanese importers vs. U.S. exporters interms of market power in two versions of the empiricalBO model. The magnitudes of α and ~α can help us under-stand the nature of competition in U.S.–Japan soybeantrade and provide useful insights for industry partici-pants, researchers, and policy makers. The estimates ofδ2 and δ3 can show whether the interaction between twovertically differentiated products (non-GM and GM soy-beans) should be included in the estimation of thedegrees of market power of soybean importers andexporters.
Data
Weekly data from January 2000 to December 2011 are usedin the estimation. The weekly export price data for U.S. GMsoybeans were obtained from Chicago Board of Trade(CBOT). The weekly price and quantity of Japanese non-GM soybean imports and the weekly price of Japanese GMsoybean imports from the United States were obtained fromTokyo Grain Exchange. Through contacting representativesof Cargill5 and Huron Commodities, Inc.,6 we obtain thedata of non-GM soybean premiums paid to U.S. farmersand know that the non-GM soybean premiums are greatlyaffected by its demand. Thus, we calculate U.S. non-GMsoybean prices as the sum of U.S. GM soybean prices from
CBOT and the (high-protein) non-GM soybean premiums.Since Japanese soybean wholesalers7 import non-GM soy-beans to make food products such as tofu, miso, and natto(Japan Tofu Association 2014, Japan Natto CooperativeSociety Federation 2014, Miso Online 2014), we use thehigh protein non-GM soybean premium price to calculateU.S. non-GM soybean prices.8
We use real export and import prices in the estima-tion. U.S. non-GM and GM soybean export prices aretransformed to the real terms by using the consumerprice index (CPI) in Japan. Data on the monthly CPI inJapan were obtained from the portal site of OfficialStatistics of Japan, e-Stat. Japanese non-GM and GMsoybean import prices are converted into real terms byusing the producer price index (PPI) in the UnitedStates. The data on the monthly PPI in the UnitedStates were obtained from the U.S. Bureau of LaborStatistics.9
Japanese personal disposable income (PDI) is used asthe destination market demand shifters.10 Data on themonthly PDI were obtained from e-Stat. The PDI dataare converted into real terms by using the CPI in Japan.Weekly exchange rates between Japan and competingexporting countries including Canada and China wereobtained from PACIFIC Exchange Rate Service, theUniversity of British Columbia. These exchange rates are
4 The data of Japanese non-GM soybean import price instead of U.S.non-GM soybean export price is used for PO
US;JP in the estimation ofBO model because the data of Japanese non-GM soybean importprice is obtained directly from a single source (Tokyo GrainExchange) while the data of U.S. non-GM export price is obtainedindirectly using the sum of U.S. GM soybean price from CBOT andthe (high-protein) non-GM soybean premiums from Cargill andHuron Commodities, Inc. So Japanese import price may be a moreaccurate representation of the equilibrium price (PO
US;JP) of non-GMsoybeans that Japan imports from the United States. When U.S. non-GM soybean export price is used for PO
US;JP in the estimation, theestimation results show that the signs remain the same and themagnitudes and significance levels are similar for most coefficientestimates.5 Mr. Jeff Duckworth, Cargill, Bloomington, IL. http://www.cargillag.com.6 Mr. Jim Traub, Huron Commodities USA, Monticello, IL. http://www.huron.com/.
7 Major soybean wholesalers are Marubeni Corporation http://www.marubeni.com/index.html, Mitsui & CO., LTD. http://www.mitsui.com/jp/en/index.html, and Sojitz Corporation http://www.sojitz.com/en/index.html.8 Because the GM soybean price from the CBOT is quoted in centsper bushel and the non-GM soybean premiums are quoted in dollarsper bushel, we use Metric Conversions (1 Metric Ton ¼ 36.7437bushels for soybeans) from the Ag Decision Maker at Iowa StateUniversity to convert the data from dollar per bushel to dollar permetric ton.9 The rationale of using real values instead of nominal values in theempirical estimation is that Japan experienced long-time deflationduring the time period (2000–2011) of the study. This long-timedeflation is unusual compared with the common slight inflation inmany other economies. We are concerned that using the nominalvalues from a long period of deflation in the estimation may distortsome coefficient estimates. For comparison, we also estimate themodels with the nominal values. When nominal values are used inthe BO model estimation, the signs are the same and the magnitudesand significance levels are similar for most coefficient estimates,compared with the results using real values.10 Mulik and Crespi (2011) used destination countries’ wage index,wholesale price index, or producer price index (PPI) as the costshifters in an RDE model for Indian and Pakistan Basmati riceexports analysis.
K. Yamaura and T. Xia: Measuring Bilateral Market Power in International Markets 37
Brought to you by | Kansas State University LibrariesAuthenticated
Download Date | 8/4/17 12:20 AM
expressed as the number of competing exporting coun-tries’ currencies per Japanese yen.11
Cho et al. (2002) emphasized the importance of usingreal exchange rates, while most previous studies usednominal exchange rates in the estimation of RDE andRSE models. In this study, we use real exchange rates,which are obtained by multiplying nominal exchangerates with the ratios of price levels in the two correspond-ing countries (Krugman and Obstfeld 2002).12
We use labor cost and energy cost as the producers’supply shifters. Data on the monthly labor cost wereobtained from the OECD iLibrary, and a monthly com-modity fuel index was obtained from the InternationalMonetary Fund as the energy cost. The labor cost andenergy cost data are converted to the real terms by usingthe PPI in the United States. We also use the soybean-corn futures price ratio (SCR) that is synthetically gener-ated using soybean and corn futures prices. The SCR isnot a tradable futures contract and is being distributedfor information purposes only (CME Group).13 Data on theSCR were obtained from CBOT. The EU, China, and SouthKorea are other importing countries of U.S. non-GM
soybeans. Weekly exchange rates between the UnitedStates and the other destination countries including theEU, China, and South Korea were obtained from thePACIFIC-ERS. These exchange rates are expressed as thenumber of other destination countries’ currency per U.S.dollar. Table 1 shows the summary statistics of quantity,real prices for U.S. non-GM and GM soybean exports andJapanese non-GM and GM soybean imports, demand shif-ters, supply shifters, and cost shifters.
Estimation results
We use nonlinear least squares (NLS) method for theestimation of the empirical BO model based on Azzam(1996) and Maude-Griffin, Feldman, and Wholey (2004).In the estimation, we address the autocorrelation issue.The heteroskedastic-consistent (White robust) standarderrors are used and reported. We initially included energycosts of the competitors in the estimation, but these vari-ables were eventually dropped from the model based onthe significance levels of coefficient estimates and AkaikeInformation Criterion (AIC). In addition, to check thepotential multi-collinearity among exchange rate vari-ables, we used Collin command in STATA to obtain thetolerance and variance inflation factor (VIF) for eachexchange rate variable in all empirical models. All toler-ance values are much larger than 0.10 and all VIF’s aresmaller than 10 so that these values suggest that multi-collinearity is not a severe concern for the empiricalmodels.
Table 1: Summary statistics of Non-GM soybean analysis.
11 For instance, the exchange rate between Japan and Canada onDecember 30, 2011, is 0.013157 Canadian dollars per Japanese yen.12 The real exchange rate measures the purchasing power of acurrency relative to another, which is known as purchasing powerparity (PPP).13 The November soybean futures over December corn futures is akey index for the present U.S. soybean farmers to help them decidewhether they will continue planting soybeans or shift to corn duringthe next year.
38 K. Yamaura and T. Xia: Measuring Bilateral Market Power in International Markets
Brought to you by | Kansas State University LibrariesAuthenticated
Download Date | 8/4/17 12:20 AM
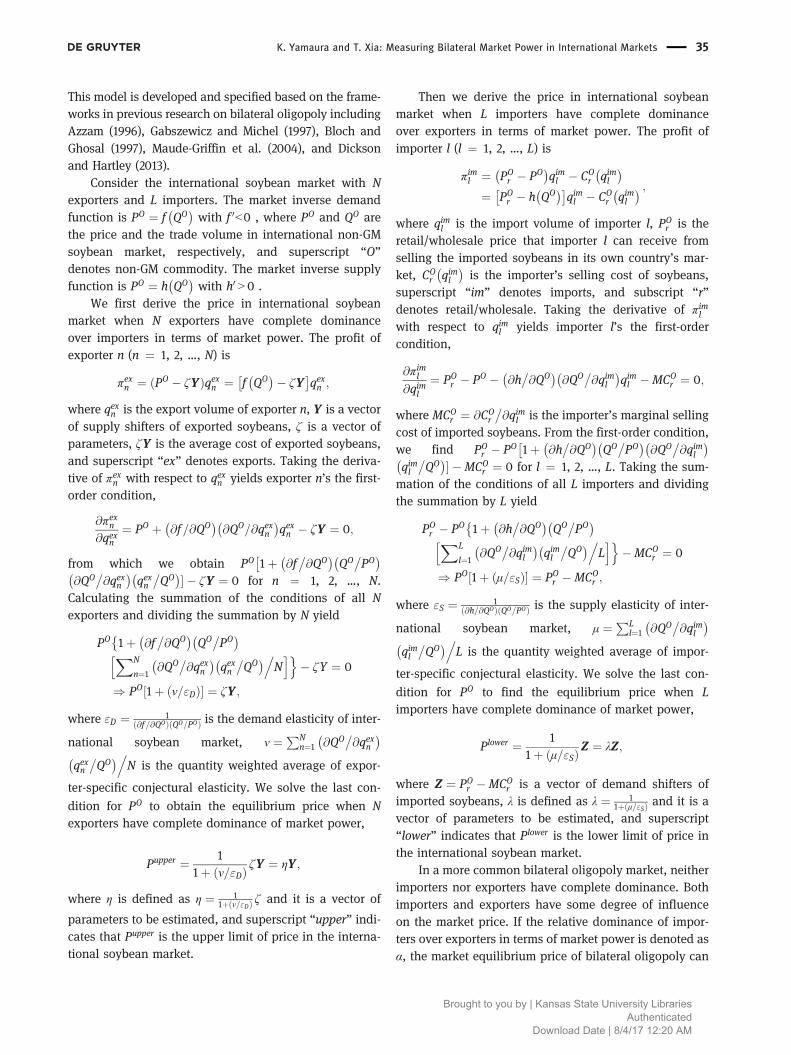
The model with interaction
The estimation results of the empirical BO model with theinteraction of non-GM and GM soybeans are reported inTable 2. The degrees of dominance (α and 1� α) ofJapanese importers and U.S. exporters in terms of marketpower are calculated using the formulae in eq. [2] andtheir coefficient estimates.14 The average values of α and
1� α are 0.415 and 0.585, respectively. These resultsshow that U.S. exporters and Japanese importers havealmost equal market power in international soybean mar-kets with a slight U.S. dominance. It is usually believedthat U.S. soybean exporters may have strong marketpower while Japanese importers have little influence onprice due to the significant share of U.S. soybeans inJapanese import market.15 The estimation results in thisstudy show that taking the two features, bilateral marketpower and the interaction between non-GM and GM com-modity, into account can provide a new measure, therelative dominance in terms of market power of importersand exporters, to examine the market competition ininternational markets of agricultural commodities.
The coefficient estimates (δ̂2 and δ̂3) of the Japaneseand U.S. GM soybean price are significant at the 1% and10% level, respectively.16 These results indicate that themodel with the interaction between non-GM and GMsoybeans is preferred.
The model without interaction
For comparison, we also estimated the empirical BOmodel without the interaction between non-GM and GMsoybeans and its results are included in Table 2. Themodel’s coefficient estimates and the formulae in eq. [4]are used to calculate the degrees of dominance (~α and1� ~α) of Japanese importers and U.S. exporters in termsof market power. The average values of ~α and 1� ~α are0.359 and 0.641, respectively. These values indicate thatU.S. exporters have significantly more market power thanJapanese importers in international soybean market. Thecomparison of these values with the estimates of α and
Table 2: Estimation results of the Bilateral Oligopoly (BO) models.
Model without Interaction Model with Interaction
PGM;JP −0.0054***(0.0010)
PGM;US −0.0001*(0.00003)
ERJP;CA 148.629 −24.1688(127.7) (29.4213)
ERJP;CH −21.324 −2.3763(25.939) (6.0550)
ERUS; EU −0.0010 −0.0004*(0.0011) (0.0002)
ERUS;CH 2.3654 0.6320***(2.1773) (0.2286)
ERUS;KO 1.5301*** 0.2673***(0.5294) (0.0855)
IncomeJP 0.0141 0.0206**(0.0117) (0.0085)
SCRUS 2270.65** −861.879(1021.7) (1050)
ECUS 68.277 329.058***(171) (122.4)
LCUS 162.138*** −10.938(62.0611) (68.4916)
Constant −12.0656** 0.2729(4.7155) (0.8184)
Adjusted R2 0.9408 0.9613DW 2.1524 2.0409
Note: *, **, and *** indicate coefficient estimates are statisticallysignificant at the 10%, 5%, and 1% level, respectively.The values in the parenthesis are heteroskedastic consistent standarderrors.
þ0:26ERUS;KOÞ�, and the mean values of variables are used in thecalculation. Six of the eight coefficient estimates used in the calcu-lation are statistically significant while two are insignificant. Usingonly the significant estimates in the calculation does not lead tomuch change in the calculated average values of α and 1� α . Whenall coefficient estimates are used, the average values of α and 1� α
are 0.415 and 0.585, respectively. When only significant coefficientestimates are used, the average values of α and 1� α are 0.414 and0.586, respectively.
15 Using estimates of residual demand and supply elasticities,Yamaura (2011) found that U.S. non-GM soybean exporters’ marketmargin is 22% and Japanese importers’ market margin is only 4%.Nakajima (2013) showed that U.S. exporters’ market margin is 10.1%in U.S.–Japan soybean trade.16 The signs of δ̂2 and δ̂3 depend on several factors including theinteraction/coordination between U.S. exporters’ selling strategy fornon-GM soybeans and that for GM soybeans, and the substitutability(or complementary) between non-GM and GM soybeans for thedemand by Japanese importers and consumers. U.S. exporters’ sell-ing strategies for two vertically differentiated products, non-GM andGM soybeans, can result in either a positive or negative relationshipbetween the prices of the two products, depending on the qualityand cost difference between the two products, the distribution ofconsumer preferences, etc. The substitutability (complementary)between two products in consumption can lead to a positive (nega-tive) relationship between the two prices. The signs of δ̂2 and δ̂3 willdepend on the nature and relative magnitudes of these effects.
K. Yamaura and T. Xia: Measuring Bilateral Market Power in International Markets 39
Brought to you by | Kansas State University LibrariesAuthenticated
Download Date | 8/4/17 12:20 AM
1� α in the model with the interaction shows that failingto include the interaction between non-GM and GM soy-beans leads to overestimated U.S. non-GM soybeanexporters’ market power and underestimated Japaneseimporters’ market power.
Conclusions
In this research, a bilateral oligopoly (BO) model is devel-oped and the corresponding empirical estimation is con-ducted for U.S.–Japan soybean trade. The interactionbetween non-GM and GM soybeans is included in theBO model. Thus, this study takes two features, bilateralmarket power of exporters and importers and the coex-istence of non-GM and GM commodity, of U.S.–Japansoybean trade into account to improve the measurementsof market power of U.S. exporters and Japaneseimporters.
The estimation results show that U.S. exporters andJapanese importers are almost equally sharing the marketpower with a slight U.S. dominance. Taking the twofeatures, bilateral market power and the interactionbetween non-GM and GM commodity, into account pro-vides a new measure, the relative dominance of U.S.exporters and Japanese importers in terms of marketpower, to evaluate the market competition in U.S.–Japan soybean trade. The statistical significances of thecoefficient estimates of the interaction terms, Japaneseand U.S. GM soybean price, suggest that the inclusionof the interaction between non-GM and GM soybeans isnecessary and preferred.
This research can be useful for industry participantsin international soybean markets, academic researchers,and policy makers. With the decreasing non-GM soybeanproduction in the United States, Japanese non-GM soy-bean importers have to pay higher premiums for U.S.non-GM soybeans. Given the significant share of U.S.soybeans in the Japanese import market, it is usuallybelieved that U.S. non-GM soybean exporters could influ-ence the market price while Japanese non-GM soybeanimporters were just price takers. However, our resultsindicate that U.S. exporters and Japanese importers arealmost equally sharing the dominance in terms of marketpower in U.S.–Japan soybean trade.
Since the beginning of this century, other large agri-cultural exporting countries such as Brazil and Argentinahave become increasingly stronger competitors to theUnited States in international markets of agriculturalcommodities (Yang and Lee 2001; Poosiripinyo and
Reed 2005; Song et al. 2009; Felt et al. 2010). Betterpolicies based on new and improved research are neededto assist agricultural producers and exporters in theUnited States. Our new estimation results for interna-tional soybean markets can be helpful to policy makersin the United States, Japan, and other major agriculturalexporting and importing countries. Our results of almostequally shared market power between U.S. exporters andJapanese importers, and the effect of the interactionbetween non-GM and GM soybeans can be used by policymakers in the design and implementation of policies forthe soybean industry. Given that U.S. exporters andJapanese importers share the market power, Japanesepolicy makers know that the import price their importerspay is not too much higher than the competitive level sothat they can adjust their policies and support for domes-tic soybean producers and consumers accordingly. U.S.soybean exporters do not have much market power asusually expected in U.S.–Japan trade. So U.S. policymakers may reconsider the support level for U.S. soy-bean producers and exporters. The effect of the interac-tion between non-GM and GM soybeans in marketcompetition can cause policy makers to make furtherefforts to coordinate their policies for the industries andmarkets of non-GM and GM commodities. In addition,the empirical models and estimation results can providesome references for academic researchers analyzingcompetition issues in international agricultural com-modity markets with bilateral market power and differ-entiated products.
Appendix: Derivation of the degreeof dominance (α and 1� α) ofimporters and exporters in terms ofmarket power
The degrees (α and 1� α) of dominance of importers andexporters depend on the factors that affect the relativemarket power of importers and exporters. For importers,the cost shifters for competing soybean importing coun-tries can influence their market power in internationalmarkets. The market power of exporters will be affectedby the cost shifters for competing soybean exportingcountries. In addition, the prices of the vertically differ-entiated substitute, GM soybeans, will impact the relativemarket power of importers and exporters. Thus, we spe-cify the degrees (α and 1� α) of dominance of importersand exporters as functions of these factors,
40 K. Yamaura and T. Xia: Measuring Bilateral Market Power in International Markets
Brought to you by | Kansas State University LibrariesAuthenticated
Download Date | 8/4/17 12:20 AM
α ¼ g WN ; RL;PGM;JP;PGM;US� �and
1� α ¼ 1� g WN ; RL;PGM;JP;PGM;US� �
where WN is a vector of the cost shifters for competingsoybean exporting countries, RL is a vector of the costshifters for competing soybean importing countries,PGM;JP and PGM;US are the prices of the vertically differ-entiated substitute, GM soybeans, in Japan and theUnited States.
In addition, the functional forms used for α and 1� αneed to guarantee α 2 0; 1½ � but impose no sign con-straints on parameters so that we can allow the flexibilityfor data to find the sign, magnitude, and significance ofthe effect of each factor. The functional form, 1
1þexp γXð Þ ,can keep its value in the range of 0; 1½ � and do notimpose sign constraints on the coefficient ( γ ) of its argu-ment (X ), so that we set the degree of dominance as
α ¼ g WN ; RL;PGM;JP;PGM;US� �
¼ 1
1þ exp Φ WN ; RL;PGM;JP;PGM;US� �� � and
½6�
1� α ¼ 1� g WN ; RL;PGM;JP;PGM;US� �
¼ exp Φ WN ; RL;PGM;JP;PGM;US� �� �
1þ exp Φ WN ; RL;PGM;JP;PGM;US� �� � : ½7�
Then we use a linear functional form for Φ WN ;�
RL;PGM;JP;PGM;USÞ in order to avoid too complicatedfinal empirical specification for the econometric model.So we have
Φ WN ; RL;PGM;JP;PGM;US� � ¼ δ1 þ δ2PGM;JP
þ δ3PGM;US þ fWN þ τRL;½8�
where δ1, δ2, δ3, f, τ are parameters or vectors of para-meters to be estimated. We substitute [8] into [6] and [7]to obtain the specifications for the degrees of dominanceof importers and exporters,
½10�The function forms in [9] and [10] can guaranteeα 2 0; 1½ � but impose no sign constraints on parameters.
References
Andersen, T. B., F. Asche, and K. H. Roll. 2008. “Oligopoly andOligopsony Power in Concentrated Supply Chains.” ISIACWorking Paper 08–1. University of Rhode Island.
Azzam, A. M. 1996. “Estimating the Degree of Dominance in aBilateral Oligopoly.” Applied Economics Letters 3:209–11.
Berry, S., J. Levinsohn, and A. Pakes. 1995. “Automobile Prices inMarket Equilibrium.” Econometrica 63:841–90.
Bloch, F., and S. Ghosal. 1997. “Stable Trading Structures inBilateral Oligopolies.” Journal of Economics Theory 74:368–84.
Carter, C. A., D. MacLarean, and A. Yilmaz. 1999. “How Competitiveis the World Wheat Market.” Working Paper No. 99–002,Department of Agricultural and Resource Economics, Universityof California, Davis.
Cho, G., H. J. Jin, and W. W. Koo. 2002. “Measuring the MarketPower of the U.S. Wheat Exporters in Asian countries: An Issueabout Adjustment of Nominal Exchange Rate When Using as ACost Shifter.” Paper presented at the American AgriculturalEconomics Association conference, Long Beach, CA,28–31 July.
Dickson, A., and R. Hartley. 2013. “Bilateral Oligopoly and QuantityCompetition.” Economic Theory 52:979–1004.
Felt, M. H., J. P. Gervais, and B. Laure. 2010. “Market Power andImport Bans: The Case of Japanese Pork Imports.” Agribusiness26:1–18.
Gabszewicz, J. J., and P. Michel. 1997. “Oligopoly Equilibrium inExchange Economies.” In Trade, Technology and Economics:Essays in Honor of Richard G. Lipsey, edited by Easton, B. C.and R. G. Harris,217–40. Cheltenham: Elgar.
Goldberg, P. K. 1995. “Product Differentiation and Oligopoly inInternational Markets: The Case of the U.S. AutomobileIndustry.” Econometrica 63:891–951.
Japan Natto Cooperative Society Federation. 2014. Available at:http://www.710.or.jp/english/index.html
Japan Tofu Association. 2014. Available at: http://www.tofu-as.jp/english/index.html
Krugman, P., and M. Obstfeld. 2002. International Economics:Theory and Policy, 6th. ed. Boston, MA: Addison Wesley.
Maude-Griffin, R., R. Feldman, and D. Wholey. 2004. “NashBargaining Model of HMO Premiums.” Applied Economics36:1329–36.
Miso Online 2014. Available at: http://www.miso.or.jp/ (inJapanese).
Mulik, K., and J. M. Crespi. 2011. “Geographical Indications and theTrade Related Intellectual Property Rights Agreement (TRIPS): ACase Study of Basmati Rice Exports.” Journal of Agricultural &Food Industrial Organization 9(4):1–19.
Nakajima, T. 2013. “Price Transmission and Market Power in theInternational Vegetable Oil Markets.” PhD dissertation,University of Tokyo.
Nevo, A. 2001. “Measuring Market Power in the Ready-to-Eat CerealIndustry.” Econometrica 69:307–42.
Perloff, J. M., L. S. Karp, and A. Golan. 2007. Estimating MarketPower and Strategies. Cambridge: Cambridge University Press.
Pinske, J., M. E. Slade, and C. Brett. 2002. “Spatial PriceCompetition: A Semiparametric Approach.” Econometrica70:1111–53.
K. Yamaura and T. Xia: Measuring Bilateral Market Power in International Markets 41
Brought to you by | Kansas State University LibrariesAuthenticated
Download Date | 8/4/17 12:20 AM
Poosiripinyo, R., and M. Reed. 2005. “Measuring Market Power inthe Japanese Chicken Meat Market.” Journal of InternationalAgricultural Trade and Development 1:135–48.
Reed, M. R., and H. S. Saghaian. 2004. “Measuring the Intensity ofCompetition in the Japanese Beef Market.” Journal ofAgricultural and Applied Economics 34(1):113–21.
Song, B. 2006. “Market Power and Competitive Analysis of China’sSoybean Import Market.” PhD dissertation, University ofKentucky.
Song, B., M. A. Marchant, M. R. Reed, and S. Xu. 2009. “CompetitiveAnalysis and Market Power of China’s Soybean Import Market.”International Food and Agribusiness Management Review12(1):21–42.
Yamaura, K. 2011. “Market Power of the Japanese Non-GM SoybeanImport Market: The U.S. Exporters Vs. Japanese Importers.”Asian Journal of Agriculture and Rural Development 1(2):80–89.
Yamaura, K. 2014. “Market Power of the Japanese Soybean ImportMarket: GMO, Non-GMO, and Vertically DifferentiatedProducts.” Japanese Journal of Rural Economics SpecialIssue (Nihon Nogyo Keizai Gakkai Ronbun-shu 2013) 16:113–17.
Yang, S. R., and W. J. Lee. 2001. “Exporters’ Market Power inAgricultural Import Markets in Korea.” In Paper presented atthe American Agricultural Economics Association annualmeeting, Chicago, IL, 5–8 August.
42 K. Yamaura and T. Xia: Measuring Bilateral Market Power in International Markets
Brought to you by | Kansas State University LibrariesAuthenticated


![Untitled-2 [] … · presentation : 4 Blister Dose : 24 bolus daily for 3-5 days Or as Directed bv Veterinariarv . Pachna I gm 0.8 gm I gm gm I gm 0.2 gm Composition : Zingiber Officinale](https://static.documents.pub/doc/80x56/5f99e7b9edd6ad336456d9e8/untitled-2-presentation-4-blister-dose-24-bolus-daily-for-3-5-days-or.jpg)


