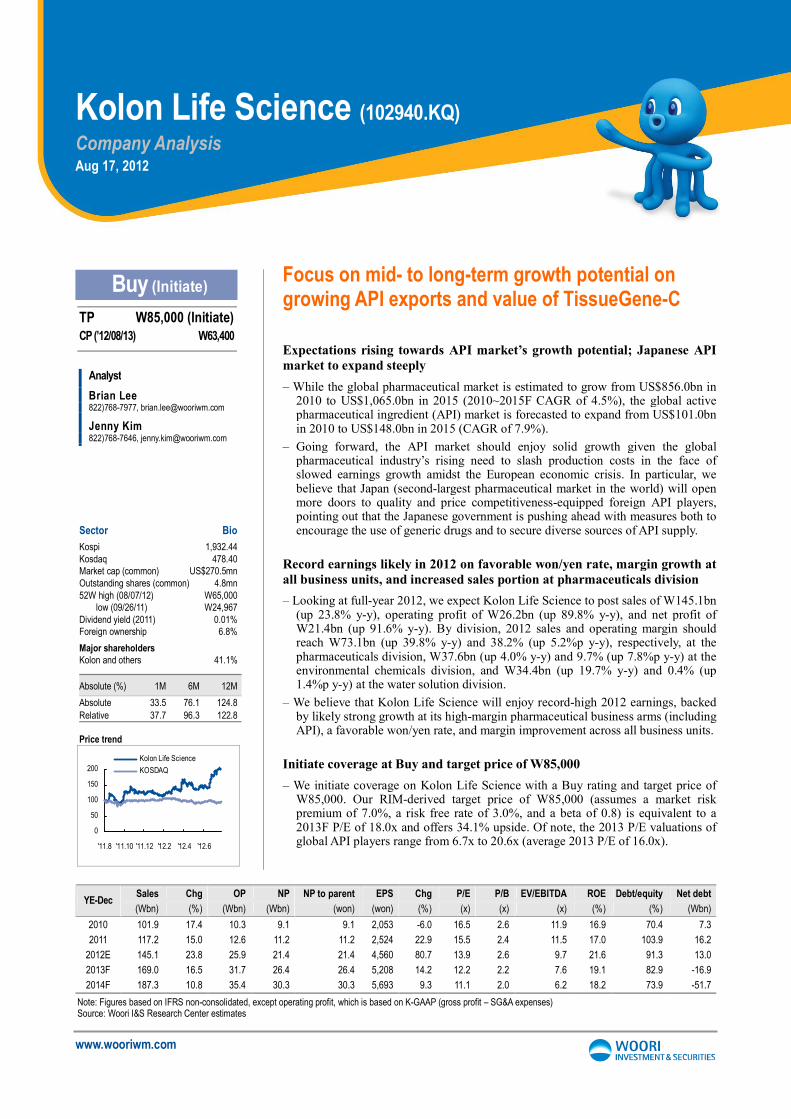
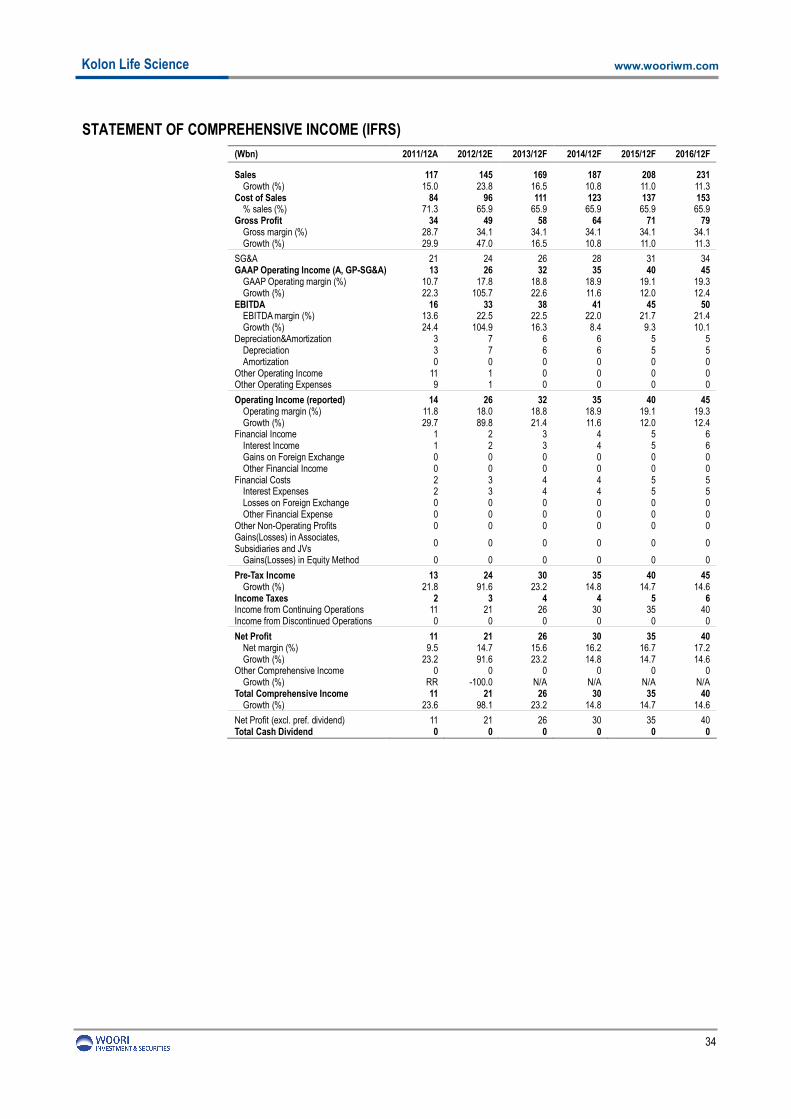
www.wooriwm.com Focus on mid- to long-term growth potential on growing API exports and value of TissueGene-C Expectations rising towards API market’s growth potential; Japanese API market to expand steeply – While the global pharmaceutical market is estimated to grow from US$856.0bn in 2010 to US$1,065.0bn in 2015 (2010~2015F CAGR of 4.5%), the global active pharmaceutical ingredient (API) market is forecasted to expand from US$101.0bn in 2010 to US$148.0bn in 2015 (CAGR of 7.9%). – Going forward, the API market should enjoy solid growth given the global pharmaceutical industry’s rising need to slash production costs in the face of slowed earnings growth amidst the European economic crisis. In particular, we believe that Japan (second-largest pharmaceutical market in the world) will open more doors to quality and price competitiveness-equipped foreign API players, pointing out that the Japanese government is pushing ahead with measures both to encourage the use of generic drugs and to secure diverse sources of API supply. Record earnings likely in 2012 on favorable won/yen rate, margin growth at all business units, and increased sales portion at pharmaceuticals division – Looking at full-year 2012, we expect Kolon Life Science to post sales of W145.1bn (up 23.8% y-y), operating profit of W26.2bn (up 89.8% y-y), and net profit of W21.4bn (up 91.6% y-y). By division, 2012 sales and operating margin should reach W73.1bn (up 39.8% y-y) and 38.2% (up 5.2%p y-y), respectively, at the pharmaceuticals division, W37.6bn (up 4.0% y-y) and 9.7% (up 7.8%p y-y) at the environmental chemicals division, and W34.4bn (up 19.7% y-y) and 0.4% (up 1.4%p y-y) at the water solution division. – We believe that Kolon Life Science will enjoy record-high 2012 earnings, backed by likely strong growth at its high-margin pharmaceutical business arms (including API), a favorable won/yen rate, and margin improvement across all business units. Initiate coverage at Buy and target price of W85,000 – We initiate coverage on Kolon Life Science with a Buy rating and target price of W85,000. Our RIM-derived target price of W85,000 (assumes a market risk premium of 7.0%, a risk free rate of 3.0%, and a beta of 0.8) is equivalent to a 2013F P/E of 18.0x and offers 34.1% upside. Of note, the 2013 P/E valuations of global API players range from 6.7x to 20.6x (average 2013 P/E of 16.0x). Kolon Life Science (102940.KQ) Company Analysis Aug 17, 2012 Price trend 0 50 100 150 200 '11.8 '11.10 '11.12 '12.2 '12.4 '12.6 Kolon Life Science KOSDAQ Sales Chg OP NP NP to parent EPS Chg P/E P/B EV/EBITDA ROE Debt/equity Net debt YE-Dec (Wbn) (%) (Wbn) (Wbn) (won) (won) (%) (x) (x) (x) (%) (%) (Wbn) 2010 101.9 17.4 10.3 9.1 9.1 2,053 -6.0 16.5 2.6 11.9 16.9 70.4 7.3 2011 117.2 15.0 12.6 11.2 11.2 2,524 22.9 15.5 2.4 11.5 17.0 103.9 16.2 2012E 145.1 23.8 25.9 21.4 21.4 4,560 80.7 13.9 2.6 9.7 21.6 91.3 13.0 2013F 169.0 16.5 31.7 26.4 26.4 5,208 14.2 12.2 2.2 7.6 19.1 82.9 -16.9 2014F 187.3 10.8 35.4 30.3 30.3 5,693 9.3 11.1 2.0 6.2 18.2 73.9 -51.7 Note: Figures based on IFRS non-consolidated, except operating profit, which is based on K-GAAP (gross profit – SG&A expenses) Source: Woori I&S Research Center estimates Buy (Initiate) TP W85,000 (Initiate) CP (’12/08/13) W63,400 Sector Bio Kospi 1,932.44 Kosdaq 478.40 Market cap (common) US$270.5mn Outstanding shares (common) 4.8mn 52W high (08/07/12) W65,000 low (09/26/11) W24,967 Dividend yield (2011) 0.01% Foreign ownership 6.8% Major shareholders Kolon and others 41.1% Absolute (%) 1M 6M 12M Absolute 33.5 76.1 124.8 Relative 37.7 96.3 122.8 Analyst Brian Lee 822)768-7977, [email protected]Jenny Kim 822)768-7646, [email protected]
Transcript
www.wooriwm.com
Focus on mid- to long-term growth potential on growing API exports and value of TissueGene-C
Expectations rising towards API market’s growth potential; Japanese API market to expand steeply
– While the global pharmaceutical market is estimated to grow from US$856.0bn in 2010 to US$1,065.0bn in 2015 (2010~2015F CAGR of 4.5%), the global active pharmaceutical ingredient (API) market is forecasted to expand from US$101.0bn in 2010 to US$148.0bn in 2015 (CAGR of 7.9%).
– Going forward, the API market should enjoy solid growth given the global pharmaceutical industry’s rising need to slash production costs in the face of slowed earnings growth amidst the European economic crisis. In particular, we believe that Japan (second-largest pharmaceutical market in the world) will open more doors to quality and price competitiveness-equipped foreign API players, pointing out that the Japanese government is pushing ahead with measures both to encourage the use of generic drugs and to secure diverse sources of API supply.
Record earnings likely in 2012 on favorable won/yen rate, margin growth at all business units, and increased sales portion at pharmaceuticals division
– Looking at full-year 2012, we expect Kolon Life Science to post sales of W145.1bn (up 23.8% y-y), operating profit of W26.2bn (up 89.8% y-y), and net profit of W21.4bn (up 91.6% y-y). By division, 2012 sales and operating margin should reach W73.1bn (up 39.8% y-y) and 38.2% (up 5.2%p y-y), respectively, at the pharmaceuticals division, W37.6bn (up 4.0% y-y) and 9.7% (up 7.8%p y-y) at the environmental chemicals division, and W34.4bn (up 19.7% y-y) and 0.4% (up 1.4%p y-y) at the water solution division.
– We believe that Kolon Life Science will enjoy record-high 2012 earnings, backed by likely strong growth at its high-margin pharmaceutical business arms (including API), a favorable won/yen rate, and margin improvement across all business units.
Initiate coverage at Buy and target price of W85,000
– We initiate coverage on Kolon Life Science with a Buy rating and target price of W85,000. Our RIM-derived target price of W85,000 (assumes a market risk premium of 7.0%, a risk free rate of 3.0%, and a beta of 0.8) is equivalent to a 2013F P/E of 18.0x and offers 34.1% upside. Of note, the 2013 P/E valuations of global API players range from 6.7x to 20.6x (average 2013 P/E of 16.0x).
Kolon Life Science (102940.KQ)
Company Analysis Aug 17, 2012
Price trend
0
50
100
150
200
'11.8 '11.10 '11.12 '12.2 '12.4 '12.6
Kolon Life Science
KOSDAQ
Sales Chg OP NP NP to parent EPS Chg P/E P/B EV/EBITDA ROE Debt/equity Net debt YE-Dec
Note: Figures based on IFRS non-consolidated, except operating profit, which is based on K-GAAP (gross profit – SG&A expenses) Source: Woori I&S Research Center estimates
I. Investment points..............................................................................................................................
II. Valuations................................................................................................................................
III. Overview of API business ................................................................................................
1. API overview
2. Global API market outlook
3. Status of API exports and imports in Korea
4. Attractive aspects of global API market
IV. API: Competitiveness and entry barrier...................................................................................
V. Company profile...............................................................................................................................
1. Overview
2. Business profile and outlook
3. Pharmaceutical division
4. Environmental chemicals division
5. Water solutions
VI. Value of TissueGene-C..................................................................................................................
3
4
8
16
19
30
3
Kolon Life Science
www.wooriwm.com
I. Investment points
API market to grow from US$101.0bn in 2010 to US$148.0bn in 2015 (CAGR of 7.9%); merchant API market to expand from US$39.0bn in 2010 to US$50.0bn in 2015 (CAGR of 5.1%)
While the global pharmaceutical market is estimated to grow from US$856.0bn in 2010 to US$1,065.0bn by 2015 (2010~2015F CAGR of 4.5%), the global API market should expand from US$101.0bn in 2010 to US$148.0bn by 2015 (CAGR of 7.9%). In detail, the global captive API market is likely to expand from US$62.0bn to US$98.0bn by 2015 (CAGR of 9.6%), while the global merchant API market is expected to grow from US$39.0bn in 2010 to US$50.0bn by 2015 (CAGR of 5.1%). Within the global merchant API market, the global API market for generics should expand from US$19.0bn in 2010 to US$27.0bn by 2015 (CAGR of 7.3%; China: 12.6%; Brazil: 11.1%; India: 10.3%; South Korea: 8.3%; Russia: 8.0%; the Ukraine: 6.1%).
Amid slowing pharmaceutical market growth and economic downturn, API market’s growth potential attracts attention
The API market, which once grew in tandem with the pharmaceutical industry, is becoming relatively more attractive due to slowing pharmaceutical industry growth and the increasing need for pharmaceutical companies to cut costs amid the slowing global economy. In particular, Japan, the second-largest pharmaceutical market in the world (the biggest in Asia), has unveiled a series of measures aimed at raising its generic drug prescription rate. Moreover, in an effort to secure a stable API supply following its Mar 2011 earthquake, Japan has attempted to diversify its API supply sources, including opening more doors to quality and price competitiveness-equipped foreign API players.
Record-high 2012 earnings expected on favorable won/yen rate, margin improvement across all business units, and pharmaceutical division’s increased sales portion
Looking at full-year 2012, we forecast that Kolon Life Science will post sales of W145.1bn (up 23.8% y-y), operating profit of W26.2bn (up 89.8% y-y), and net profit of W21.4bn (up 91.6% y-y). In detail, the pharmaceutical division’s 2012 sales and operating margin should reach W73.1bn (up 39.8% y-y) and 38.2% (up 5.2%p y-y), respectively. Meanwhile, we expect the environmental chemicals division to record 2012 sales of W37.6bn (up 4.0% y-y) and an operating margin of 9.7% (up 7.8%p y-y), while the water solution division will likely secure sales of W34.4bn (up 19.7% y-y) and an operating margin of 0.4% (up 1.4%p y-y). In terms of operating profit contribution, we expect the pharmaceuticals division to account for 106.9% of Kolon Life Science’s 2012 operating profit, the environmental chemicals division 14.0%, the water solution division 0.5%, and the bio division (bio industry-related R&D investment) -21.5%. We expect the company to enjoy record-high earnings in 2012, backed by likely strong growth at the high-margin pharmaceuticals division (includes API), a favorable won/yen rate (strong yen trend), and improving margins across all business units.
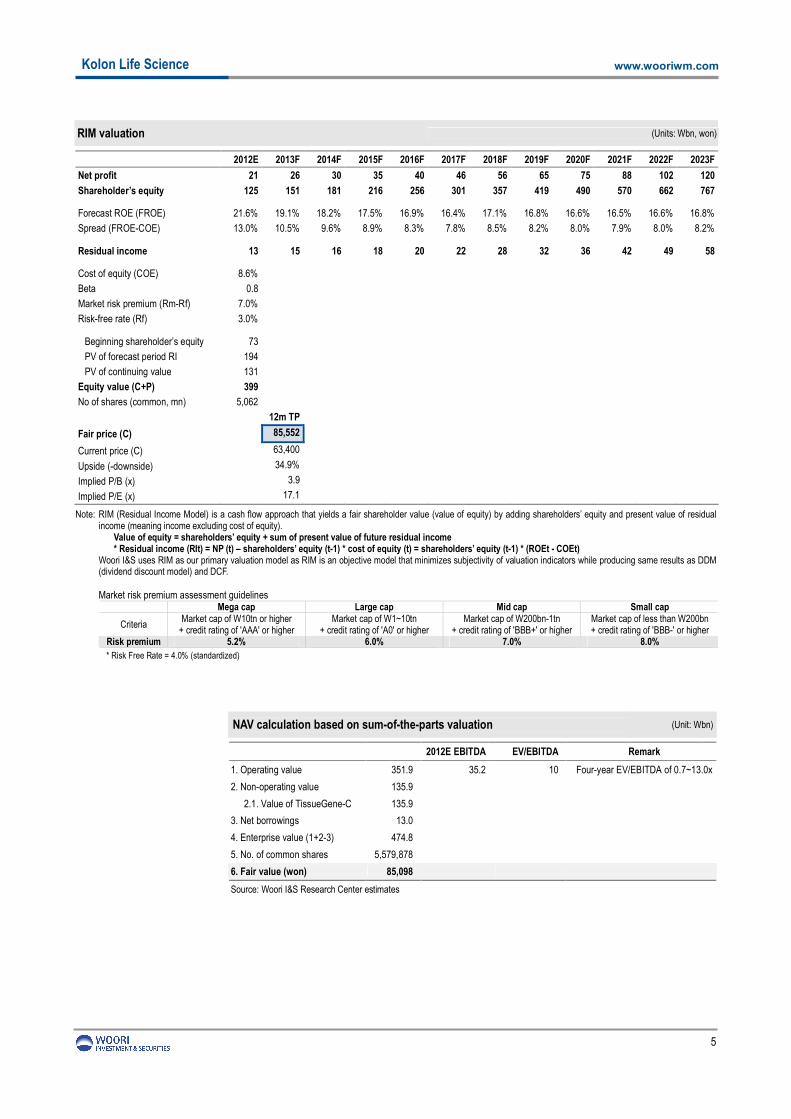
Target price of W85,000 offers 34.1% upside; operating value of W351.9bn (W63,067/shr) and new drug value of W135.9bn (W24,357/shr)
We initiate coverage on Kolon Life Science with a Buy rating and target price of W85,000. Our RIM-derived target price of W85,000 assumes a market risk premium of 7.0%, a risk free rate of 3.0%, and a beta of 0.8, and offers 34.1% upside potential. Using a sum-of-the-parts valuation method, we verified our target price, estimating the company’s operating value at W351.9bn (W63,067/share; based on a 12M fwd EBITDA of W35.2bn and target EV/EBITDA of 10.0x) and the value of ‘TissueGene-C’ (cell-mediated gene therapeutic drug for treating degenerative arthritis) at W135.9bn (W24,357/share; assuming a price of W5mn, a 2015 market share (first year of release) of 1.0%, a maximum market share of 10% in 2023, a 40% operating margin, a 12.4% corporate tax rate, a 9.6% COE, and a 60% success rate). Accordingly, Kolon Life Science’s corporate value is estimated at W474.8bn, with a fair price per share of W85,098.
4
Kolon Life Science
www.wooriwm.com
II. Valuations
Target price of W85,000 offers 34.1% upside
We initiate coverage on Kolon Life Science with a Buy rating and target price of W85,000. Our RIM-derived target price of W85,000 assumes a market risk premium of 7.0%, a risk free rate of 3.0%, and a beta of 0.8, and offers 34.1% upside potential.
SOTP valuation: Operating value of W351.9bn and new drug value of W135.9bn
Using a sum-of-the-parts valuation method, we verified our target price, estimating the company’s operating value at W351.9bn (W63,067/share; based on a 12M fwd EBITDA of W35.2bn and target EV/EBITDA of 10.0x) and the value of TissueGene-C (cell-mediated gene therapeutic drug for treating degenerative arthritis) at W135.9bn (W24,357/share; assuming drug price at W5mn, 2015 market share (first year of release) at 1.0%, a maximum market share of 10% in 2023, a 40% operating margin, a 12.4% corporate tax rate, a 9.6% COE, and a 60% success rate). Accordingly, Kolon Life Science’s corporate value is estimated at W474.8bn, with a fair price per share of W85,098.
Target price:
Operating value -W63,067/share & new drug value - W24,357/share
Our target price of W85,000 is equivalent to a 2013 P/E of 18.0x (2013 EPS forecast of W4,725 is based on 5,579,878 outstanding shares, including warrants). Meanwhile, the company’s current share price of W63,400 is equivalent to a 2013 P/E of 13.4x (vs a historic P/E band of 9.9~46.8x). The 2013 P/E valuations of global API players range from 6.7x to 20.6x (average 2013 P/E of 16.0x). Believing that its current share price fails to reflect the value of the firm’s TissueGene-C, we expect Kolon Life Science’s shares to sharply rise in 4Q12 upon the anticipated completion of domestic phase IIb clinical trials for TissueGene-C.
P/E band P/B band
0
20,000
40,000
60,000
80,000
100,000
'09.1 '09.7 '10.1 '10.7 '11.1 '11.7 '12.1 '12.7
Price 30.0x 25.0x
20.0x 15.0x 10.0x
(won)
0
20,000
40,000
60,000
80,000
100,000
'09.1 '09.7 '10.1 '10.7 '11.1 '11.7 '12.1 '12.7
Price 7.5x 6.0x
4.5x 3.0x 1.5x
(won)
Source: DataGuide Pro, Woori I&S Research Center Source: DataGuide Pro, Woori I&S Research Center
Note: RIM (Residual Income Model) is a cash flow approach that yields a fair shareholder value (value of equity) by adding shareholders’ equity and present value of residual income (meaning income excluding cost of equity).
Value of equity = shareholders’ equity + sum of present value of future residual income * Residual income (RIt) = NP (t) – shareholders’ equity (t-1) * cost of equity (t) = shareholders’ equity (t-1) * (ROEt - COEt) Woori I&S uses RIM as our primary valuation model as RIM is an objective model that minimizes subjectivity of valuation indicators while producing same results as DDM
(dividend discount model) and DCF.
Market risk premium assessment guidelines Mega cap Large cap Mid cap Small cap
Criteria Market cap of W10tn or higher
+ credit rating of 'AAA' or higher Market cap of W1~10tn
+ credit rating of 'A0' or higher Market cap of W200bn-1tn
+ credit rating of 'BBB+' or higher Market cap of less than W200bn + credit rating of 'BBB-' or higher
Risk premium 5.2% 6.0% 7.0% 8.0%
* Risk Free Rate = 4.0% (standardized)
NAV calculation based on sum-of-the-parts valuation (Unit: Wbn)
2012E EBITDA EV/EBITDA Remark
1. Operating value 351.9 35.2 10 Four-year EV/EBITDA of 0.7~13.0x
2. Non-operating value 135.9
2.1. Value of TissueGene-C 135.9
3. Net borrowings 13.0
4. Enterprise value (1+2-3) 474.8
5. No. of common shares 5,579,878
6. Fair value (won) 85,098
Source: Woori I&S Research Center estimates
6
Kolon Life Science
www.wooriwm.com
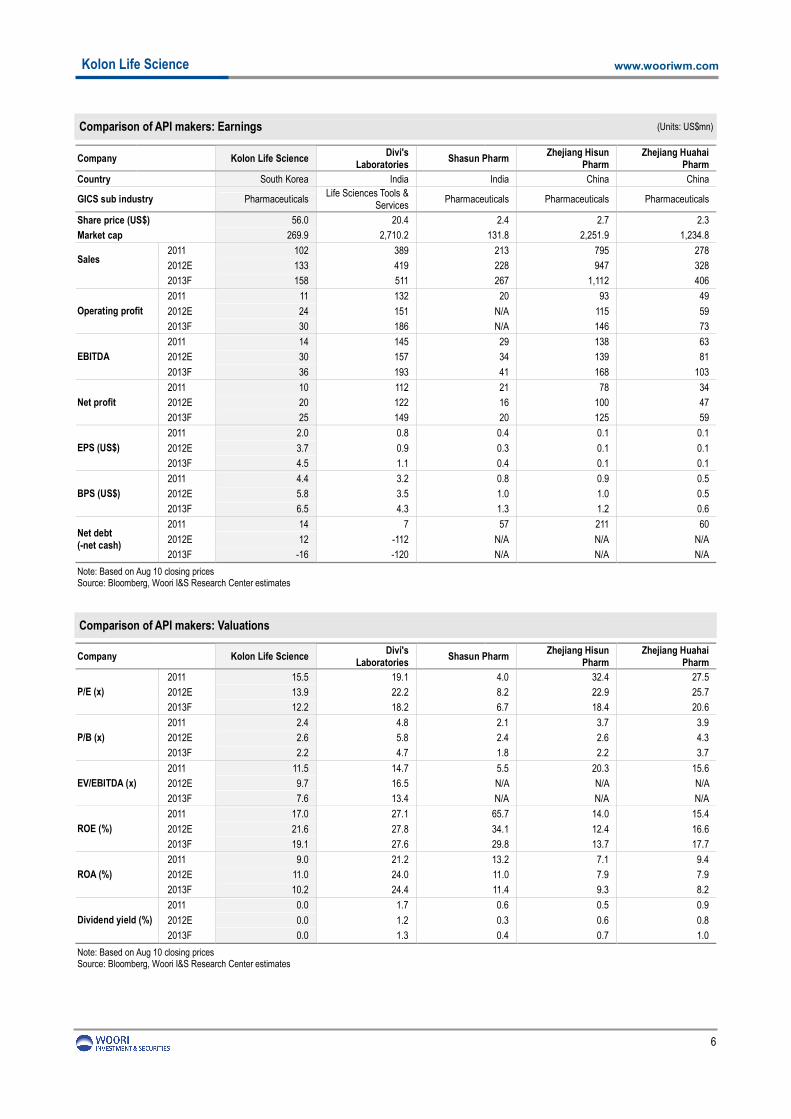
Comparison of API makers: Earnings (Units: US$mn)
Company Kolon Life Science
Divi's Laboratories
Shasun Pharm Zhejiang Hisun
Pharm Zhejiang Huahai
Pharm
Country South Korea India India China China
GICS sub industry Pharmaceuticals Life Sciences Tools &
Note: Based on Aug 10 closing prices Source: Bloomberg, Woori I&S Research Center estimates
Comparison of API makers: Valuations
Company Kolon Life Science
Divi's Laboratories
Shasun Pharm Zhejiang Hisun
Pharm Zhejiang Huahai
Pharm
2011 15.5 19.1 4.0 32.4 27.5
2012E 13.9 22.2 8.2 22.9 25.7 P/E (x)
2013F 12.2 18.2 6.7 18.4 20.6
2011 2.4 4.8 2.1 3.7 3.9
2012E 2.6 5.8 2.4 2.6 4.3 P/B (x)
2013F 2.2 4.7 1.8 2.2 3.7
2011 11.5 14.7 5.5 20.3 15.6
2012E 9.7 16.5 N/A N/A N/A EV/EBITDA (x)
2013F 7.6 13.4 N/A N/A N/A
2011 17.0 27.1 65.7 14.0 15.4
2012E 21.6 27.8 34.1 12.4 16.6 ROE (%)
2013F 19.1 27.6 29.8 13.7 17.7
2011 9.0 21.2 13.2 7.1 9.4
2012E 11.0 24.0 11.0 7.9 7.9 ROA (%)
2013F 10.2 24.4 11.4 9.3 8.2
2011 0.0 1.7 0.6 0.5 0.9
2012E 0.0 1.2 0.3 0.6 0.8 Dividend yield (%)
2013F 0.0 1.3 0.4 0.7 1.0
Note: Based on Aug 10 closing prices Source: Bloomberg, Woori I&S Research Center estimates
7
Kolon Life Science
www.wooriwm.com
Comparison of API makers: Share performance
Company Kolon Life Science Divi's Laboratories Shasun Pharm
Zhejiang Hisun Pharm
Zhejiang Huahai Pharm
Share price (US$) 56.0 20.4 2.4 2.7 2.3
Market cap (US$mn) 269.9 2,710.2 131.8 2,251.9 1,234.8
1 week -4.1 0.1 5.6 10.5 -3.5
1 month 5.1 5.1 8.7 6.9 -3.5
3 months 31.3 27.2 14.0 12.9 18.7
6 months 86.1 51.1 70.9 6.5 38.1
1 year 106.9 41.6 80.7 -16.4 2.0
Relative (%)
YTD 51.5 27.7 144.8 -12.9 32.2
1 week 1.0 1.0 6.5 12.4 -1.8
1 month 12.8 7.2 10.8 6.1 -4.3
3 months 33.3 37.1 22.8 2.3 7.5
6 months 80.6 49.3 68.8 -1.8 27.4
1 year 124.5 47.7 88.4 -30.1 -14.6
Absolute (%)
YTD 61.5 45.1 178.1 -14.1 30.4
Note: Based on Aug 10 closing prices Source: Bloomberg, Woori I&S Research Center
8
Kolon Life Science
www.wooriwm.com
III. Overview of API business
1. API overview
APIs critical to safety and efficacy of finished drugs
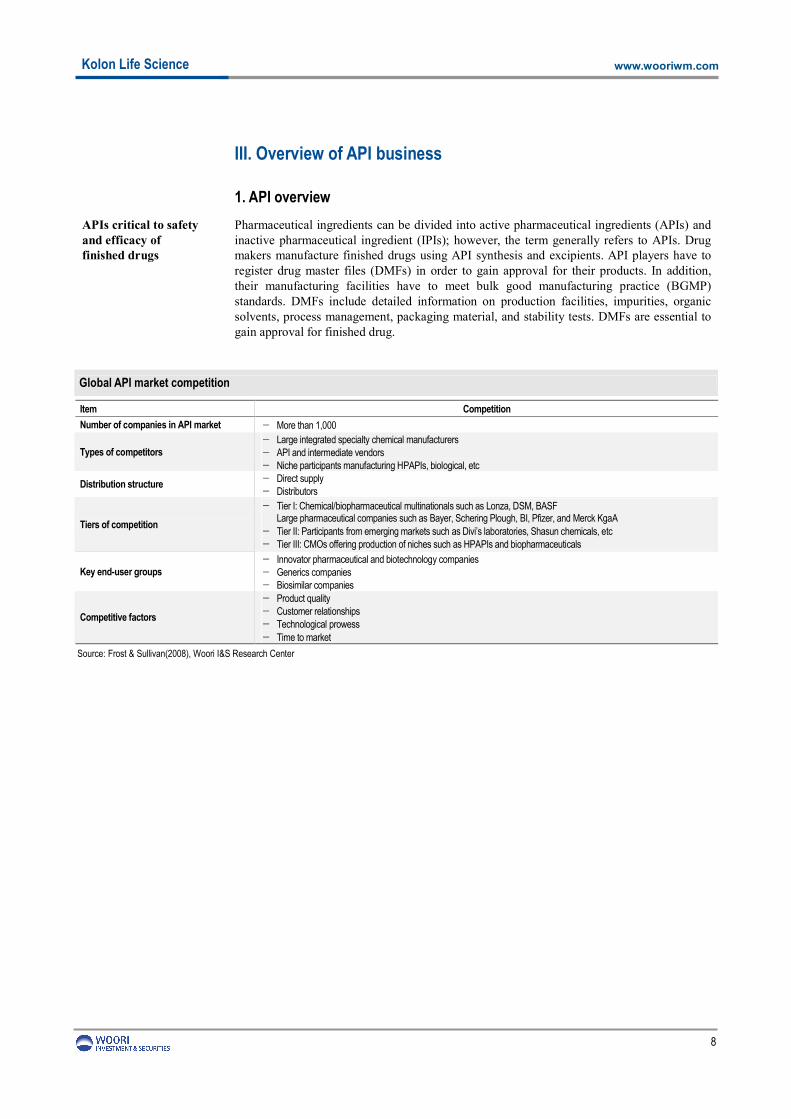
Pharmaceutical ingredients can be divided into active pharmaceutical ingredients (APIs) and inactive pharmaceutical ingredient (IPIs); however, the term generally refers to APIs. Drug makers manufacture finished drugs using API synthesis and excipients. API players have to register drug master files (DMFs) in order to gain approval for their products. In addition, their manufacturing facilities have to meet bulk good manufacturing practice (BGMP) standards. DMFs include detailed information on production facilities, impurities, organic solvents, process management, packaging material, and stability tests. DMFs are essential to gain approval for finished drug.
Global API market competition
Item Competition
Number of companies in API market - More than 1,000
Types of competitors - Large integrated specialty chemical manufacturers - API and intermediate vendors - Niche participants manufacturing HPAPIs, biological, etc
Distribution structure - Direct supply - Distributors
Tiers of competition
- Tier I: Chemical/biopharmaceutical multinationals such as Lonza, DSM, BASF Large pharmaceutical companies such as Bayer, Schering Plough, BI, Pfizer, and Merck KgaA
- Tier II: Participants from emerging markets such as Divi’s laboratories, Shasun chemicals, etc - Tier III: CMOs offering production of niches such as HPAPIs and biopharmaceuticals
Key end-user groups - Innovator pharmaceutical and biotechnology companies - Generics companies - Biosimilar companies
Source: Frost & Sullivan(2008), Woori I&S Research Center
9
Kolon Life Science
www.wooriwm.com
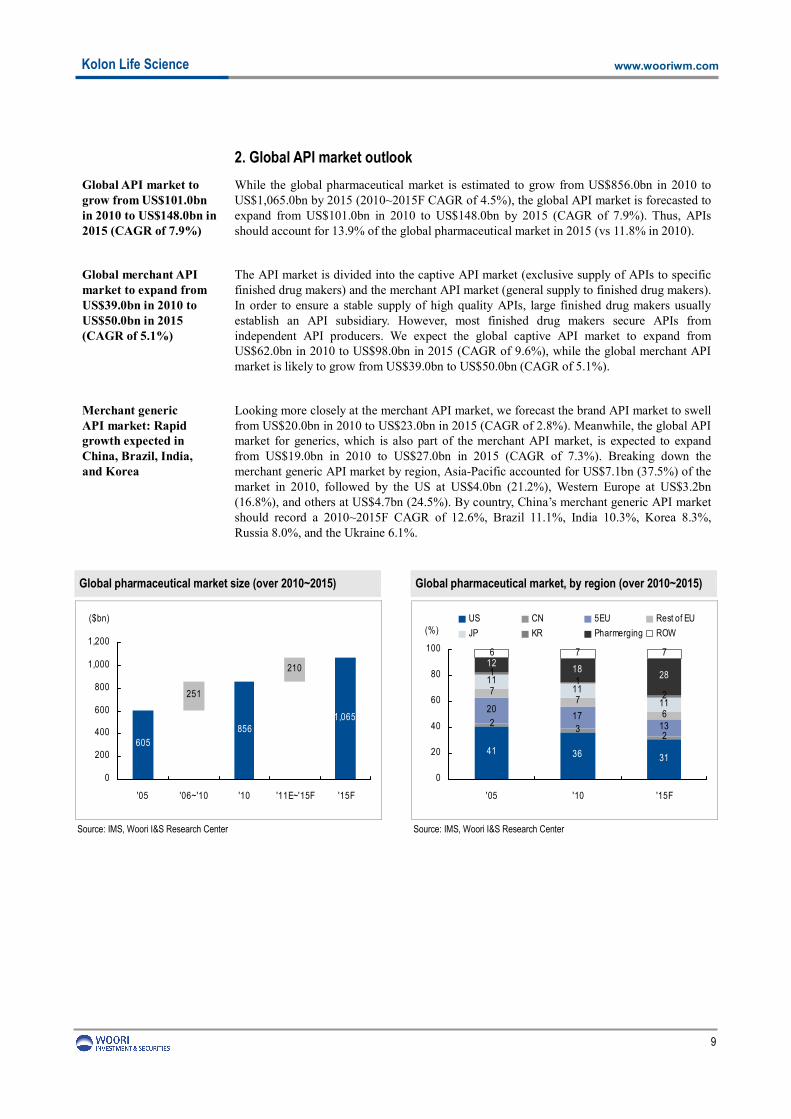
2. Global API market outlook
Global API market to grow from US$101.0bn in 2010 to US$148.0bn in 2015 (CAGR of 7.9%)
While the global pharmaceutical market is estimated to grow from US$856.0bn in 2010 to US$1,065.0bn by 2015 (2010~2015F CAGR of 4.5%), the global API market is forecasted to expand from US$101.0bn in 2010 to US$148.0bn by 2015 (CAGR of 7.9%). Thus, APIs should account for 13.9% of the global pharmaceutical market in 2015 (vs 11.8% in 2010).
Global merchant API market to expand from US$39.0bn in 2010 to US$50.0bn in 2015 (CAGR of 5.1%)
The API market is divided into the captive API market (exclusive supply of APIs to specific finished drug makers) and the merchant API market (general supply to finished drug makers). In order to ensure a stable supply of high quality APIs, large finished drug makers usually establish an API subsidiary. However, most finished drug makers secure APIs from independent API producers. We expect the global captive API market to expand from US$62.0bn in 2010 to US$98.0bn in 2015 (CAGR of 9.6%), while the global merchant API market is likely to grow from US$39.0bn to US$50.0bn (CAGR of 5.1%).
Merchant generic API market: Rapid growth expected in China, Brazil, India, and Korea
Looking more closely at the merchant API market, we forecast the brand API market to swell from US$20.0bn in 2010 to US$23.0bn in 2015 (CAGR of 2.8%). Meanwhile, the global API market for generics, which is also part of the merchant API market, is expected to expand from US$19.0bn in 2010 to US$27.0bn in 2015 (CAGR of 7.3%). Breaking down the merchant generic API market by region, Asia-Pacific accounted for US$7.1bn (37.5%) of the market in 2010, followed by the US at US$4.0bn (21.2%), Western Europe at US$3.2bn (16.8%), and others at US$4.7bn (24.5%). By country, China’s merchant generic API market should record a 2010~2015F CAGR of 12.6%, Brazil 11.1%, India 10.3%, Korea 8.3%, Russia 8.0%, and the Ukraine 6.1%.
Global pharmaceutical market size (over 2010~2015) Global pharmaceutical market, by region (over 2010~2015)
605
8561,065
251
210
0
200
400
600
800
1,000
1,200
'05 '06~'10 '10 '11E~'15F '15F
($bn)
41 36 31
23
2
2017
13
77
6
1111
11
11
2
1218
28
6 7 7
0
20
40
60
80
100
'05 '10 '15F
US CN 5EU Rest of EU
JP KR Pharmerging ROW(%)
Source: IMS, Woori I&S Research Center Source: IMS, Woori I&S Research Center
10
Kolon Life Science
www.wooriwm.com
Captive and merchant API markets Brand and generic API markets
62
98
39
50
0
20
40
60
80
100
120
140
160
'10 '15F
Captive Merchant
($bn)
1927
20
23
0
10
20
30
40
50
60
'10 '15F
Generic Brand
($bn)
Source: Chemical Pharmaceutical Generic Association, Woori I&S Research Center
Source: Chemical Pharmaceutical Generic Association,
Woori I&S Research Center
Merchant generic API market breakdown in 2010 Merchant generic API market growth, by country (over 2010~2015)
US
21.2%
Western EU
16.8%
Others
24.5%Asia-Pacific
37.5%
[As of 2010]
12.6
11.110.3
8.3 8
6.1
0
2
4
6
8
10
12
14
China Brazil India South
Korea
Russia Ukrine
(%, 2010~2015F CAGR)
Source: Chemical Pharmaceutical Generic Association,
Woori I&S Research Center
Source: Chemical Pharmaceutical Generic Association, Woori I&S Research Center
11
Kolon Life Science
www.wooriwm.com
3. Status of API exports and imports in Korea
Korea’s total API exports amounted to US$906.83mn (up 122.6% y-y) in 2011, while imports came to US$1,981.49mn (up 104.4% y-y)
According to the Korea Pharmaceutical Traders Association (KPTA), Korea exported US$2,880.64mn (up 124.5% y-y) worth of pharmaceutical and cosmetic products in 2011, with finished drugs exports amounting to US$1,155.46mn (up 119.5% y-y), API exports reaching US$906.83mn (up 122.6% y-y), and cosmetics exports climbing to US$804.5mn (up 134.7% y-y). Meanwhile, Korea imported US$6,514.87mn (up 122.4% y-y) worth of pharmaceutical and cosmetic products in 2011, including finished drugs valued at US$2,934.14mn (up 116.4% y-y), APIs at US$1,981.49mn (up 104.4% y-y), and cosmetics at US$9,088.76mn (up 116.2% y-y).
Exports to Asia grew to US$423.63mn (up 47.2%y-y), while imports reached US$908.3mn (up 45.8% y-y)
By region, Korea mainly exported APIs to Asia (US$427.63mn, 47.2%) in 2011, followed by Europe (US$161.01mn, 17.8%), North America (US$58.4mn, 6.4%), and Latin America (US$15.7mn, 1.7%). Meanwhile, the majority of API imports stemmed from Asia (US$908.3mn, 45.8%), followed by Europe (US$832.49mn, 42.0%), North America (US$115.19mn, 5.8%), and the South Pacific (US$10.82mn, 0.5%). In the case of Asia, the portion of API exports and imports stood at 47.2% and 45.8%, respectively, far exceeding figures from other regions (vs 24.2% and 47.8% for developed nations, such as North America and Europe).
Exports to Japan reached US$215.72mn (up 23.8% y-y), while imports came to US$423.41mn (up 21.4% y-y)
By country, Korea’s API exports focused on the following five countries in 2011: Japan (US$215.72mn, up 8.7% y-y), China (US$69.31mn, up 34.1% y-y), US (US$58.4mn, up 6.2% y-y), India (US$56.66mn, down 1.4% y-y), and Italy (US$53.18mn, up 34.7% y-y). Meanwhile, Korea primarily imported APIs from Japan (US$423.41mn, down 0.8% y-y), China (US$335.97mn, up 7.8% y-y), Italy (US$222.94mn, down 15.8% y-y), Germany (US$193.33mn, up 2.5% y-y), and France (US$166.2mn, up 7.3% y-y). As we can see from the figures above, Japan is Korea’s largest API trading partner, accounting for 23.8% of Korea’s exports and 21.4% of its imports.
API market becoming increasingly attractive on slowing pharmaceutical industry growth amid economic downturn
The API market, which once grew in tandem with the pharmaceutical industry, is becoming relatively more attractive due to slowing pharmaceutical industry growth and the increasing need for pharmaceutical companies to cut costs amid the slowing global economy. In particular, since 2011, amid heated competition to introduce low-priced generic drugs following the patent expiration for global blockbusters, pharmaceuticals have been fiercely competing to gain an upper hand in terms of profitability and pricing power. Moreover, cost competitiveness has become increasingly important as the prescription of low-priced generics widens due to the global economic downturn.
Attractiveness of Japan’s API market
In the case of Japan (the world’s second largest API market behind the US), due to its strong preference for original drugs, the nation’s generic prescription rate is low compared to that of other countries. However, Japan’s Ministry of Health is laying out various policy measures to increase generic prescriptions so as to stabilize health insurance costs. Moreover, in an effort to secure a stable API supply following its Mar 2011 earthquake, Japan has attempted to diversify its API supply sources, including opening more doors to quality and price competitiveness-equipped foreign API players
Global API market drivers and restraints
Market D
riversM
arket Restrain
ts
Increasing influence of API participants from emerging markets
Increasing emphasis on high-potency APIs
Emerging technologies such as continuous processing and separation technology
Continuing spate of patent expiries
Decline in overall R&D productivity is affecting the pharmaindustry
The economic
recession is expected to restrain growth
Fragmented nature of the market is expected to limit growth prospects
Stringent regulatory requirements are likely to delay approvals
2009 2015
Source: Frost & Sullivan (2008), Woori I&S Research Center
15
Kolon Life Science
www.wooriwm.com
Generic drug market forecast, by country (2010~2015)
31.7
21.3
24.2
13.4
16.2
15.3
12.8
11.9
5.0
3.3
6.7
3.8
8.6
5.8
6.7
3.2
2.1
4.0
0 5 10 15 20 25 30 35 40
Korea
UK
Canada
US
Germany
France
Spain
Italy
Japan
2010 2015F
(%)
Source: IMS, Woori I&S Research Center
Global blockbuster drugs’ patent cliff (2002~2016)
Japanese government’s policy on increasing generic drug prescription
Implemented Detail
2002 - Provision of prescription fees (including cost for providing information on generic drugs) by national health
insurance corporation to medical institutions
2003 - Introduction of diagnosis and procedure combinations (DPC) flat-fee payment system
2006 - Revision of doctor’s signature system needed to allow preparation of generic drugs
2008 - Require approval to limit generic prescriptions and scrap additional fees charged for generic prescriptions
2010 - Introduction of additional policy measures such as providing incentives based on prescribed dose, changing
method of calculating prescribed dose, and increasing incentive points
2012 - Reshaping pharmaceutical coverage system (planned)
2013 - Reshaping medical care coverage system for seniors (planned)
2014 - Reshaping medical care coverage system (planned)
Source: Japan Generic Medicines Association (2010), Woori I&S Research Center
16
Kolon Life Science
www.wooriwm.com
IV. API: Competitiveness and entry barrier
API competitiveness hinges on quality, cost, and synthesis technology
API competitiveness lies in quality (purity, stability, and uniformity) and cost (largely determined by synthesis technology). APIs are made via synthesis, separation, and refining processes. It is important to remove by-products from the synthesis in order to raise purity and stability and to maintain quality. In addition, it is critical to lower costs by developing various synthesis processes (allows for the use of cheaper raw materials and the reduction of processes). API players’ product line ups and their ability to reduce costs are determined by their core technology—eg, cryotechnology, organometallic reaction technology, high-pressure reaction know-how, asymmetric synthesis with chirotechnology, and optical resolution technology. In particular, it is important to develop a technology that eludes original drug technology patents for generic drug APIs.
17
Kolon Life Science
www.wooriwm.com
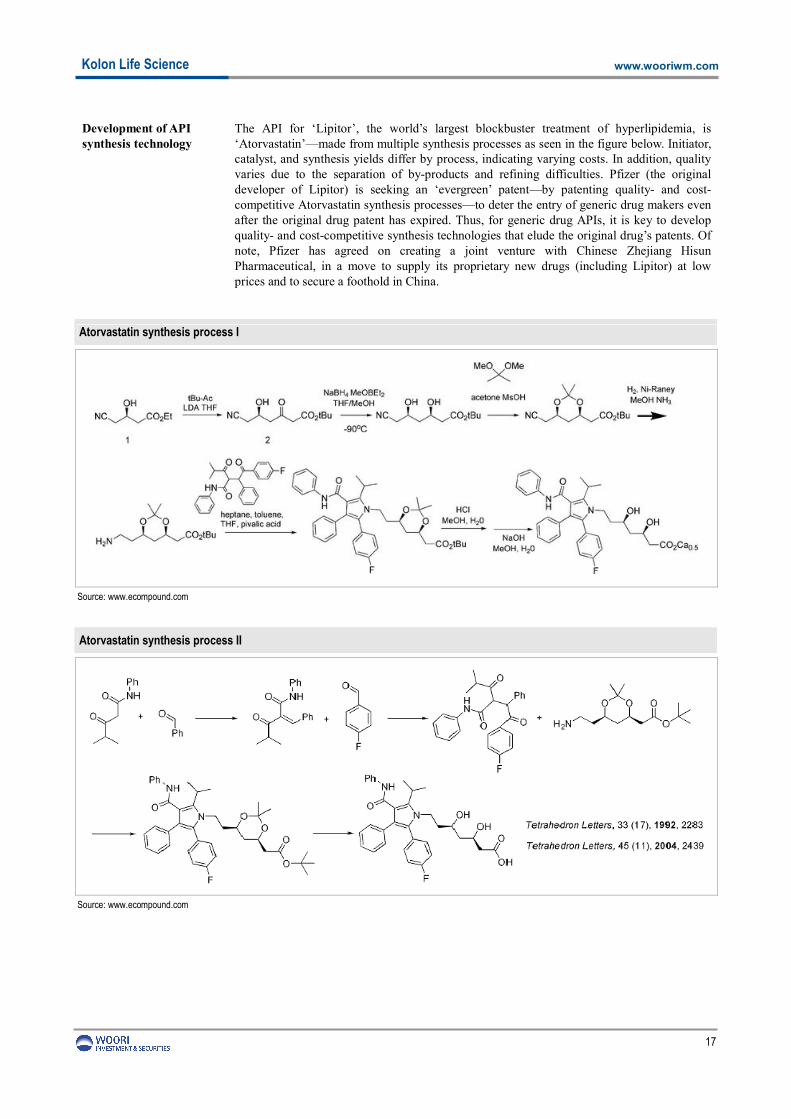
Development of API synthesis technology
The API for ‘Lipitor’, the world’s largest blockbuster treatment of hyperlipidemia, is ‘Atorvastatin’—made from multiple synthesis processes as seen in the figure below. Initiator, catalyst, and synthesis yields differ by process, indicating varying costs. In addition, quality varies due to the separation of by-products and refining difficulties. Pfizer (the original developer of Lipitor) is seeking an ‘evergreen’ patent—by patenting quality- and cost-competitive Atorvastatin synthesis processes—to deter the entry of generic drug makers even after the original drug patent has expired. Thus, for generic drug APIs, it is key to develop quality- and cost-competitive synthesis technologies that elude the original drug’s patents. Of note, Pfizer has agreed on creating a joint venture with Chinese Zhejiang Hisun Pharmaceutical, in a move to supply its proprietary new drugs (including Lipitor) at low prices and to secure a foothold in China.
Atorvastatin synthesis process I
Source: www.ecompound.com
Atorvastatin synthesis process II
Source: www.ecompound.com
18
Kolon Life Science
www.wooriwm.com
API entry barrier: DMF registration, BGMP approval, and proven track record
API entry barriers include DMF registration, BGMP approval, and a proven track record. In addition, in order to export an API to new markets, API makers have to register their DMFs and gain BGMP approval in each respective country. DMFs for APIs are required for approval of finished drugs. Meanwhile, as APIs are key indicators of the safety and efficiency of finished drugs, large finished drug makers tend to establish specialized API subsidiaries in order to procure a steady supply of quality APIs. Indeed, exclusive API makers accounted for 61.4% of the global API market in 2010. Thus, it is crucial for API makers to secure proven track records.
19
Kolon Life Science
www.wooriwm.com
V. Company profile
1. Overview
Established in Apr 2000; listed on the Kosdaq in Apr 2009
TissueGene Asia, which was established in Apr 2000, was renamed Kolon Life Science in Jan 2006. The company took over pharmaceutical, environmental materials, and water solutions units from Kolon Industries in Jan 2006 and was listed on the Kosdaq in Apr 2009. In 2012, the firm completed domestic clinical trial phase 2b for TissueGene-C (cell-mediated gene therapeutic drug for treating degenerative arthritis), with domestic release of the drug slated for 2015.
Shareholders—Group chairman: 15.4%; Kolon: 20.4%
Major shareholders in Kolon Life Science include Kolon Group chairman Woong-yeul Lee (15.4% stake, including 815,482 BWs), Kolon (20.4%), and KB Asset Management (4.1%). Of note, warrant exercise is allowed from Sep 23, 2011 to Jul 23, 2014 at an exercise price of W25,670. As outstanding shares including warrants stand at only 5,579,878 shares and daily average trading volume amounts to only 50,000 shares, we believe that the company needs to increase its share liquidity.
Kolon Group governance structure Ownership structure
KolonKolon
Group chairmanGroup chairman
Kolon IndustriesKolon Industries
Kolon GlotechKolon Glotech
Kolon Fashion MaterialKolon Fashion Material
Kolon PlasticsKolon Plastics
Kolon GlobalKolon Global
Kolon Water & EnergyKolon Water & Energy
Kolon Life ScienceKolon Life Science
TissuegeneTissuegene
Kolon PharmaKolon Pharma
48.2%
56.9%
54.6%
20.4%
35.6%
48.1%
75.2%
66.7%
70.0%
15.4%27.8%
KB Asset Mgt,
4.1%
Affiliates'
board
members,
2.9%Others,
57.2
Group
chairman,
15.4% Kolon
(holding co),
20.4
Source: Kolon Life Science, Woori I&S Research Center Note: 1. Shareholders as of May 31, 2012 2: Based on outstanding shares (5,579,878 including warrants)
Source: Kolon Life Science, Woori I&S Research Center
Shareholder breakdown History
History
Apr 2000 TissueGene Asia established
Jan 2006
Renamed to Kolon Life Science Took over three business units from Kolon Industries (pharmaceutical ingredients, environmental materials and water solutions)
Apr 2009 Listed on Kosdaq
Dec 2010 Approval for phase IIb clinical trial of TissueGene-C (Korea) Approval for phase II clinical trial of TissueGene-C (US)
Apr 2011 Completed plant construction (water solutions, etc) in Gimcheon
Shareholder No. of shrs Warrant Stake (%)
Group Chairman 694,120 162,530 15.4
Kolon (holding co) 1,141,042 - 20.4
Affiliates’ board members
153,778 9,265 2.9
KB Asset Mgt 226,109 - 4.1
Others 2,549,347 643,687 57.2
Total 4,764,396 815,482 100.0
Sep 2012 Construction of API plant (cGMP) in Chungju
Source: Kolon Life Science, Woori I&S Research Center Source: Kolon Life Science, Woori I&S Research Center
20
Kolon Life Science
www.wooriwm.com
2. Business profile and outlook
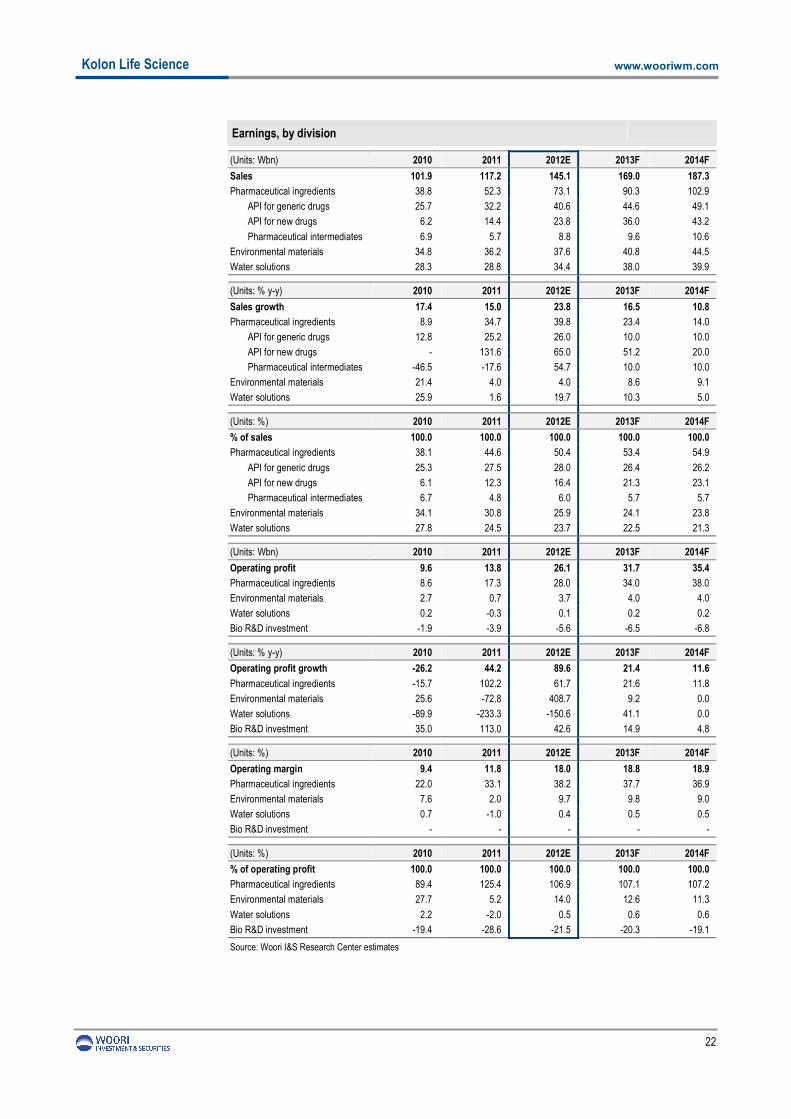
Earnings reach record high in 2011
Kolon Life Science posted 2011 sales of W117.2bn (up 15.0% y-y), operating profit of W13.8bn (up 29.7% y-y), and net profit of W11.2bn (up 23.2% y-y). In detail, sales broke down to pharmaceutical ingredients 44.6%, environmental materials 30.8%, and water solutions 24.5%. The operating margin for pharmaceutical ingredients came in at 33.1% (up 11.0%p y-y), environmental materials 2.0% (down 5.6%p y-y), and water solutions -1.0% (down 1.7%p y-y). Operating profit contributions from pharmaceutical ingredients stood at 125.4%, environmental materials 5.2%, water solutions -2.0%, and bio business (R&D investment in bio business) -28.6%.
Profitability to improve from yen appreciation; strong yen expected in 2012; appreciation to ease in 2013
By currency, 2011 sales broke down to US$34.03mn, JPY3.4bn, W27.5bn, and EUR1.98mn (dollar settlement at 32.7%, yen at 42.0%, won at 22.8% and euro at 2.5%). In particular, yen settlement stood at 81.8% at the pharmaceutical ingredient unit in 2011, with dollar settlement reaching 11.1% and won settlement coming in at 7.2%. Given the high portion of yen settlement at the pharmaceutical ingredient unit, yen appreciation greatly contributes to profitability. Of note, we forecast a won/yen rate of W1,430/JPY100 (down 6.5% y-y) in 3Q12, W1,410/JPY100 (down 5.9% y-y) in 4Q12, W1,400/JPY100 (up 1.4% y-y) in 1Q13, and W1,370/JPY100 (down 5.8% y-y) in 2Q13. The appreciation of yen should continue through 2012, before easing entering 2013.
Record-high earnings expected in 2012 on favorable won/yen rate, margin improvement across all business units, and pharmaceuticals division’s increased sales portion
Looking at full-year 2012, we forecast that Kolon Life Science will post sales of W145.1bn (up 23.8% y-y), operating profit of W26.2bn (up 89.8% y-y), and net profit of W21.4bn (up 91.6% y-y). In detail, the pharmaceutical division’s 2012 sales and operating margin should reach W73.1bn (up 39.8% y-y) and 38.2% (up 5.2%p y-y), respectively. Meanwhile, we expect the environmental chemicals division to record 2012 sales of W37.6bn (up 4.0% y-y) and an operating margin of 9.7% (up 7.8%p y-y), while the water solution division will likely secure sales of W34.4bn (up 19.7% y-y) and an operating margin of 0.4% (up 1.4%p y-y). In terms of operating profit contribution, we expect the pharmaceuticals division to account for 106.9% of Kolon Life Science’s 2012 operating profit, the environmental chemicals division 14.0%, the water solution division 0.5%, and the bio division (bio industry-related R&D investment) -21.5%. We expect the company to enjoy record-high earnings in 2012, backed by likely strong growth at the high-margin pharmaceuticals division (includes API), a favorable won/yen rate (strong yen trend), and improving margins across all business units.
21
Kolon Life Science
www.wooriwm.com
2010~2014 sales 2010~2014 operating margin
187.3
169.0
145.1117.2
101.9
0
40
80
120
160
200
240
'10 '11 '12E '13F '14F
0
5
10
15
20
25
30Sales (LHS)
Growth (RHS)
(Wbn) (% y-y)
10.312.6
25.9
31.7
35.4
18.918.817.8
10.710.1
0
7
14
21
28
35
42
'10 '11 '12E '13F '14F
0
4
8
12
16
20
24
Adj. operating profit (LHS)
Adj. operating margin (RHS)
(Wbn) (%)
Source: Kolon Life Science, Woori I&S Research Center estimates Source: Kolon Life Science, Woori I&S Research Center estimates
2010~2014 sales breakdown 2010~2014 operating profit, by division
Kolon Life Science began to supply APIs for generic drugs in 2007 and APIs for new drugs in 2010; of note, Kolon Life Science supplies 18 APIs for generics and 1 API for new drugs to more than 70 Japanese pharmaceutical companies. In 2011, Kolon Life Science’s API exports to Japan accounted for 17.7% (JPY58.5mn; equivalent to W44.2bn if applying the won/yen rate as of 2011-end (W1,497/JPY100); assuming exports to Japan are calculated using the yen-denominated settlement method) of Korea’s total API exports (US$215.72mn; equivalent to W250bn if applying the won/dollar rate as of end-2011(W1,159/US$)). This implies that Kolon Life Science is the leading domestic exporter of APIs to Japan.
Increased supply of APIs for new drugs to large Japanese pharmas
Since 2010, Kolon Life Science has been supplying APIs for new anti-inflammatory drugs to large pharmas in Japan. The company exported 20 tons in 2010 (sales of W6.2bn) and 45 tons in 2011 (sales of W14.4bn, up 131.6% y-y), with plans to export 75 tons in 2012 (sales to total W23.8bn, up 65.0% y-y) and 120 tons in 2013 (W36bn, up 51.2% y-y). In addition, Kolon Life Science is looking to conclude contracts to supply APIs for new anti-ulcerants (2012) and APIs for new antibiotics (2013). If the company succeeds in winning the contracts, increased sales of APIs for new drugs should improve its profitability.
Upon operation of Chungju plant in 2Q12, total plant capacity to amount to W260bn
In addition to operating a pharmaceutical plant in Eumseong, Kolon Life Science has invested W65bn (land: W9.5bn, equipment & device: W55.5bn) in constructing a new plant in Chungju (construction period: 2011 to Sep 2012). Capacity at the Eumseong plant currently amounts to W80bn, while capacity at the Chungju plant is estimated at W180bn; thus, upon the operation of the Chungju plant in 2Q13, total plant capacity should increase to W260bn.
High-margin pharmaceutical division contributing to profitability
The pharmaceutical division recorded 2011 sales of W52.3bn (up 34.7% y-y), operating profit of W17.3bn (up 102.2% y-y), and an operating margin of 33.1% (up 11.1%p y-y), accounting for 44.6% (up 6.5%p y-y) of the company’s 2011 sales and 125.4% (up 35.9% y-y) of its operating profit. Of note, the division’s yen-denominated and dollar-denominated settlement portions stood at 81.8% and 11.1%, respectively, in 2011.
In 2012, the pharmaceutical division is anticipated to post sales of W73.1bn (up 39.8% y-y), operating profit of W28bn (up 61.7% y-y), an and operating margin of 38.2% (up 5.1%p y-y), contributing to 50.4% (up 5.8%p y-y) of the company’s total sales and 106.9% (down 18.4%p y-y) of its operating profit.
Source: Kolon Life Science, Woori I&S Research Center estimates Source: Kolon Life Science, Woori I&S Research Center estimates
Pharmaceutical division’s major clients (2011) Pharmaceutical division’s major sales channels (2011)
Others,
13.1%
GSK, 10.5%
Nissin, 17.6%
SPI, 27.6%
Yoshindo,
31.3%
Direct export,
82.9%Domestic
demand,
7.4%
Local export,
0.4%
Source: Kolon Life Science, Woori I&S Research Center Source: Kolon Life Science, Woori I&S Research Center
26
Kolon Life Science
www.wooriwm.com
4. Environmental chemicals division
Global anti-microbial market estimated at US$5.3bn, Korean market at US$0.39bn
As of 2009, the global anti-microbial market was worth US$5.3bn, while the Korean market was valued at W40bn. Meanwhile, the global pyrithione-based anti-microbial market stood at US$0.39bn, growing 18.0% y-y thanks to the increasing popularity of environment-friendly chemicals. Arch Chemicals (acquired by Swedish company Lonza in 2011) held a 70% share of the global pyrithione-based anti-microbial market. Anti-microbials are mostly used in water solutions, applied in lumber, and added to paint and cosmetics. Following the introduction of the International Maritime Organization (IMO)’s 2003 regulations on the use of tin-based paints on hulls (which was known to cause maritime pollution), the non-tin based paint market has expanded rapidly, bolstering the use of pyrithione.
Supplier of environmentally-friendly chemicals to Unilever, Jotun, Janssen, P&G, and L’Oreal
Kolon Life Science has been supplying its ‘CleanBio’ (pyrithione-based anti-microbial) to Unilever since 2004. It also supplies anti-microbials used in hull paints to Jotun and Janssen. The company’s environmental chemicals division is expected to grow further as it has recently begun to supply environmentally-friendly chemicals to P&G and L’Oreal.
Margin at environmental materials business to normalize upon operation of Gimcheon plant #2
The environmental materials division posted 2011 sales of W36.2bn (up 4.0% y-y), operating profit of W700mn (down 72.8% y-y), and an operating margin of 2.0% (down 5.6%p y-y). Accordingly, the division accounted for 30.8% (down 3.3%p y-y) of Kolon Life Science’s total sales and 5.2% of its operating profit (down 22.5%p y-y). Of note, the sharp deterioration in margin is attributed to the purchase of intermediates in 2H11 to meet orders accepted ahead of the start of operations at Gimcheon plant #2. As such, the division’s margin is expected to normalize in 2012, in line with the operation of the new plant. Dollar settlement accounted for 80.8% of the division’s sales in 2011, versus won settlement of 12.7% and yen settlement of 6.5%.
We forecast the environmental materials division to record 2012 sales of W37.6bn (up 4.0% y-y), operating profit of W3.7bn (up 408.7% y-y), and an operating margin of 9.7% (up 7.8%p y-y). The division should contribute to 25.9% of sales (down 4.9%p y-y) and 14.0% of operating profit (up 8.8%p y-y).
27
Kolon Life Science
www.wooriwm.com
2010~2014 sales forecasts for environmental materials division
2010~2014 operating profit forecasts for environmental materials division
44.540.8
37.636.2
34.89.18.6
4.04.0
21.4
0
10
20
30
40
50
'10 '11 '12E '13F '14F
0
5
10
15
20
25
Sales (LHS)
Change (RHS)
(Wbn) (% y-y)
2.7
0.7
3.7
4.0 4.0
9.89.0
9.7
2.0
7.6
0
1
2
3
4
5
'10 '11 '12E '13F '14F
0
3
6
9
12
15Operating profit (LHS)
Operating margin (RHS)
(Wbn) (%)
Source: Kolon Life Science, Woori I&S Research Center estimates Source: Kolon Life Science, Woori I&S Research Center estimates
Customer breakdown for environment materials (2011) Major sales routes for environmental materials (2011)
Unilever,
29.0%
Jotun, 16.4%
Janssen,
10.0%
BASF,
5.5%
Others,
39.0%
Local export,
16.9%
Domestic,
12.2%
Direct export,
70.9%
Source: Kolon Life Science Woori I&S Research Center Source: Kolon Life Science Woori I&S Research Center
28
Kolon Life Science
www.wooriwm.com
5. Water solutions
Global water solutions market worth US$29bn (domestic market W62bn)
The global water solution market is valued at US$29bn (as of 2008), with the Chinese and Asian markets offering strong growth potential. Meanwhile, the value of the Korean water solution market is estimated at W62bn, with urban water sewage and paper representing 40% of the total. SNF controls 37% of the global market, followed by BASF, with a 18% market share. The domestic market is now expanding into facility operation, management, and renewal, in line with the government’s plan to foster the water industry. According to Freedonia Group, Europe is the largest water solutions market. While Asia accounts for a small portion of the market, the region is observing strong growth. In particular, the Chinese water solutions market is expanding at a CAGR of 10~15%, suggesting that it will take a greater portion of the market going forward.
To evolve into top-ten global player
Kolon Life Science took over Environmental Facility Management Corp (Korea’s largest private sewage treatment company) in 2006, changing the company’s name to Kolon Water & Energy. Assisted by Kolon E&C and Kolon Water & Energy, the Kolon Group hopes to become a top-ten global player in the global water solution market, encompassing the construction and operation of facilities and the procurement of materials.
Margins to fall amid rising Acrylamide prices
The water solution division delivered 2011 sales of W28.8bn (up 1.6% y-y), an operating loss of W300mn (TTL y-y), and an operating margin of -1.0% (down 1.7%p y-y. The division contributed to 24.5% of Kolon Life Science’s sales (down 3.2%p y-y) and -2.0% of its operating profit (down 4.2%p y-y). The low margin is attributed to rising acrylamide (AAM) prices. Won settlement accounted for 67.1% of the business’s sales in 2011, followed by dollar settlement of 18.6% and yen settlement of 14.3%.
We forecast 2012 water solution sales of W34.4bn (up 19.7% y-y), operating profit of W100mn (TTP y-y), and an operating margin of 0.4% (up 1.4%p y-y). The division should contribute to 23.7% of Kolon Life Science’s sales (down 0.8%p y-y) and 0.5% of its operating profit (up 2.6%p y-y).
2010~2014 sales forecasts for water solution division 2010~2014 operating profit forecasts for water solution division
39.938.0
34.428.828.3
25.9
1.6
5.0
10.3
19.7
0
9
18
27
36
45
'10 '11 '12E '13F '14F
0
5
10
15
20
25
30
Sales (LHS)
Change (RHS)
(Wbn) (% y-y)
0.20.20.1
-0.3
0.2
-1.0
0.70.50.50.4
-0.4
-0.2
0.0
0.2
0.4
0.6
'10 '11 '12E '13F '14F
-1.5
-1.0
-0.5
0.0
0.5
1.0
Operating profit (LHS)
Operating margin (RHS)
(Wbn) (%)
Source: Kolon Life Science, Woori I&S Research Center estimates Source: Kolon Life Science, Woori I&S Research Center estimates
29
Kolon Life Science
www.wooriwm.com
Acrylonitrile (raw material for AAM) price Quarterly ASP for water solutions
0
500
1,000
1,500
2,000
2,500
3,000
3,500
'07.1 '08.1 '09.1 '10.1 '11.1 '12.1
AN(acrylonitrile)
(US$/ton)
3,000
3,200
3,400
3,600
3,800
4,000
4,200
4,400
1Q09 3Q09 1Q10 3Q10 1Q11 3Q11 1Q12
Export price
Domestic price
(Won/kg)
Source: Thomson Reuters, Woori I&S Research Center Source: DART, Woori I&S Research Center
Customer breakdown for water solutions (2011) Major sales routes for water solutions (2011)
Others,
56.8%
Osaka Godo
Korea, 4.9%
Hansu,
5.6%
EFMC, 15.1%
Trion, 17.7%
Local export,
26.4%
Domestic,
65.9%
Direct export,
7.6%
Source: Kolon Life Science, Woori I&S Research Center Source: Kolon Life Science, Woori I&S Research Center
30
Kolon Life Science
www.wooriwm.com
VI. Value of TissueGene-C
TissueGene-C, new bio solution for cartilage regeneration
Kolon Life Science has developed TissueGene-C, a proprietary form of stem cell-mediated gene therapy for the treatment of degenerative arthritis that delivers a transforming growth factor (TGF-β) gene into damaged heterologous tissue cells in order to repair injured bone, cartilage, and tendons without the need for surgery. TGF-βs are cytokines that control proliferation, cellular differentiation, and other functions in most cells, and play a role in immune tolerance. TissueGene-C therapy isolates single clone expressing TGF-βs by the limit dilution method and injects the stable population of genetically modified cells into the damaged tissue area. The modified cells secrete growth factor proteins directly into the injured site.
Depending on the severity of cartilage damage, there are three different treatments for degenerative arthritis: 1) allogeneic stem cell therapy; 2) micro facture surgery; and 3) total joint replacement. Allogeneic stem cell therapy uses stem cells cultivated from umbilical cord blood. The nurtured stem cells are injected to the damaged cartilage. The therapy was approved by the Korean Food & Drug Administration (KFDA) on Jan 19, 2012. Meanwhile, micro fracture surgery creates tiny factures in the underlying bone. Blood and bone marrow seep out of the fractures, creating a blood clot that releases cartilage-constructing cells. In joint replacement surgery, damaged cartilage is replaced with an artificial joint. Allogeneic stem cell therapy is applied to mild cases of cartilage damage. Meanwhile, micro fracture surgery is used for moderate cases of cartilage damage, and total joint replacement is used in severe cases of cartilage damage.
Compared to Medipost’s ‘Cartistem’ (also a allogeneic stem cell therapy), Kolon Life Science’s TissueGene-C’s strengths lie in its cost competitiveness and the fact that patients can be treatment by injection (no need for surgery). However, due to a lack of clinical trials, it is hard to compare the safety and efficacy—the key determinants of a drug’s marketability—of the two drugs.
TissueGene-C valued at W135.9bn (W68bn~W226.5bn)
According to the Health Insurance Review & Assessment Service, a total of 72,708 patients (up 6.9% y-y) suffering from gonarthrocace were admitted to hospitals in 2011. In calculating the value of TissueGene-C, we assumed that the number of patients hospitalized due to gonarthrocace will increase by 7.0% pa over 2015~2026. Other assumptions for the calculation were as follows: a TissueGene-C price of W5mn, a 2015 market share (first year of release) of 1.0%, a maximum market share of 10% in 2023, a 40% operating margin, a 12.4% corporate tax rate, a 9.6% COE, and a 60% success rate. Based on the above-mentioned assumptions, the value of TissueGene-C is estimated at W135.9bn. Of note, our sensitivity analysis places the value of TissueGene-C between W68bn and W226.5bn.
Medipost’s Cartistem: Medipost’s market cap up from W80.9bn to W251.0bn
TissueGene-C is now under phase-IIb clinical trials in Korea. The 54 patients which were injected with the drug in Apr 2012 will be closely observed over the next six months. The company plans to wrap up the phase-IIb trials by 4Q12, and to carry out phase-III trials in 2013. It hopes to gain approval in 2014, before rolling out the drug in 2015. Of note, upon beginning phase-III clinical trials for Cartistem on Jul 25, 2008, Medipost’s market cap stood at W80.9bn. By the time phase III trials were completed on Jan 27, 2011, the company’s market cap had soared to W251bn. Believing that its current share price fails to reflect the value of the firm’s TissueGene-C, we expect Kolon Life Science’s shares to sharply rise in 4Q12 upon the anticipated completion of domestic phase IIb clinical trials for TissueGene-C.
31
Kolon Life Science
www.wooriwm.com
Kolon Life Science’s cellular and genetic therapy pipeline
Source: Kolon Life Science, Woori I&S Research Center
Treatment of degenerative arthritis using TissueGene-C
Delivers a TGF-β gene into damaged tissue cells
Isolates single clone expressing TGF-βs by the limit dilution method and injects the stable population of genetically modified cells into the damaged tissue area
The modified cells secrete growth factor proteins directly into the injured site
Delivers a TGF-β gene into damaged tissue cells
Isolates single clone expressing TGF-βs by the limit dilution method and injects the stable population of genetically modified cells into the damaged tissue area
The modified cells secrete growth factor proteins directly into the injured site
Source: Kolon Life Science, Woori I&S Research Center
32
Kolon Life Science
www.wooriwm.com
Tissuegene-C clinical trial timeline
Phase I
2011 2013 2015
Number of patients injected• 12 patients during phase I • 28 patients during phase IIa
→ Safety and efficacy verification
USUS
KoreaKorea
Number of patients injected• 54 patients during phase IIb• 100 patients to be injected during phase III
Number of patients who underwent minimal invasive surgery
• 18 patients during phase II
→ Specialized MRI, Bio market, safety and efficacy
cGMP manufacturing facility to begin operation
Licensing out deals with multinational pharmas to be propelled
InjectionInjection
InjectionInjection
Minimal invasive surgery
Minimal invasive surgery
Phase II Phase III
Phase I/IIa Phase IIbInjection to 54 patients completed in April, 2012: Phase IIb clinical trials to be completed within 2012
Phase IIIPhase III clinical trials to be completed by early 2014
Phase IIApproval for IND application for phase II clinical trials received in May 2012
Phase III
BLA/Product
Source: Kolon Life Science, Woori I&S Research Center
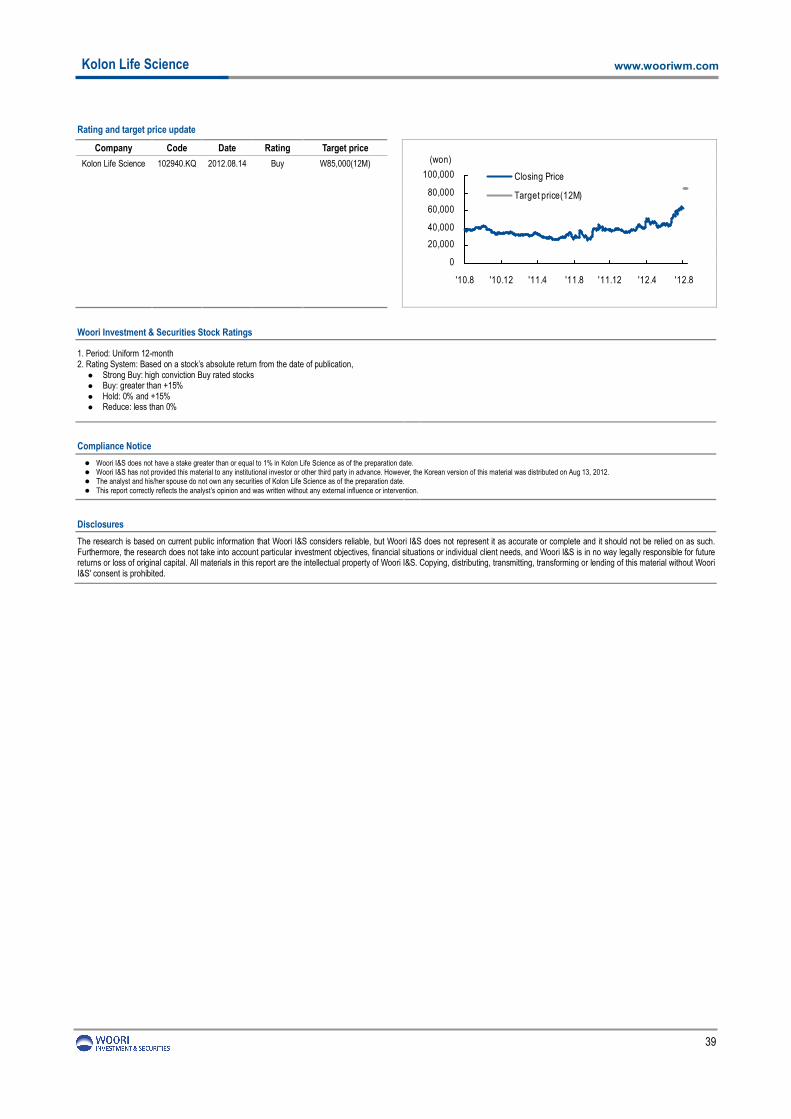
Kolon Life Science 102940.KQ 2012.08.14 Buy W85,000(12M)
0
20,000
40,000
60,000
80,000
100,000
'10.8 '10.12 '11.4 '11.8 '11.12 '12.4 '12.8
Closing Price
Target price(12M)
(won)
Woori Investment & Securities Stock Ratings
1. Period: Uniform 12-month 2. Rating System: Based on a stock’s absolute return from the date of publication, l Strong Buy: high conviction Buy rated stocks l Buy: greater than +15% l Hold: 0% and +15% l Reduce: less than 0%
Compliance Notice
l Woori I&S does not have a stake greater than or equal to 1% in Kolon Life Science as of the preparation date. l Woori I&S has not provided this material to any institutional investor or other third party in advance. However, the Korean version of this material was distributed on Aug 13, 2012. l The analyst and his/her spouse do not own any securities of Kolon Life Science as of the preparation date. l This report correctly reflects the analyst’s opinion and was written without any external influence or intervention.
Disclosures
The research is based on current public information that Woori I&S considers reliable, but Woori I&S does not represent it as accurate or complete and it should not be relied on as such. Furthermore, the research does not take into account particular investment objectives, financial situations or individual client needs, and Woori I&S is in no way legally responsible for future returns or loss of original capital. All materials in this report are the intellectual property of Woori I&S. Copying, distributing, transmitting, transforming or lending of this material without Woori I&S' consent is prohibited.