28
KONE Q1 2017 Interim Report for January–March

KONE Q1 2017Interim Report for January–March
Q12
KONE’s January–March 2017 review
January–March 2017: Continued sales growth in a mixed operating environment
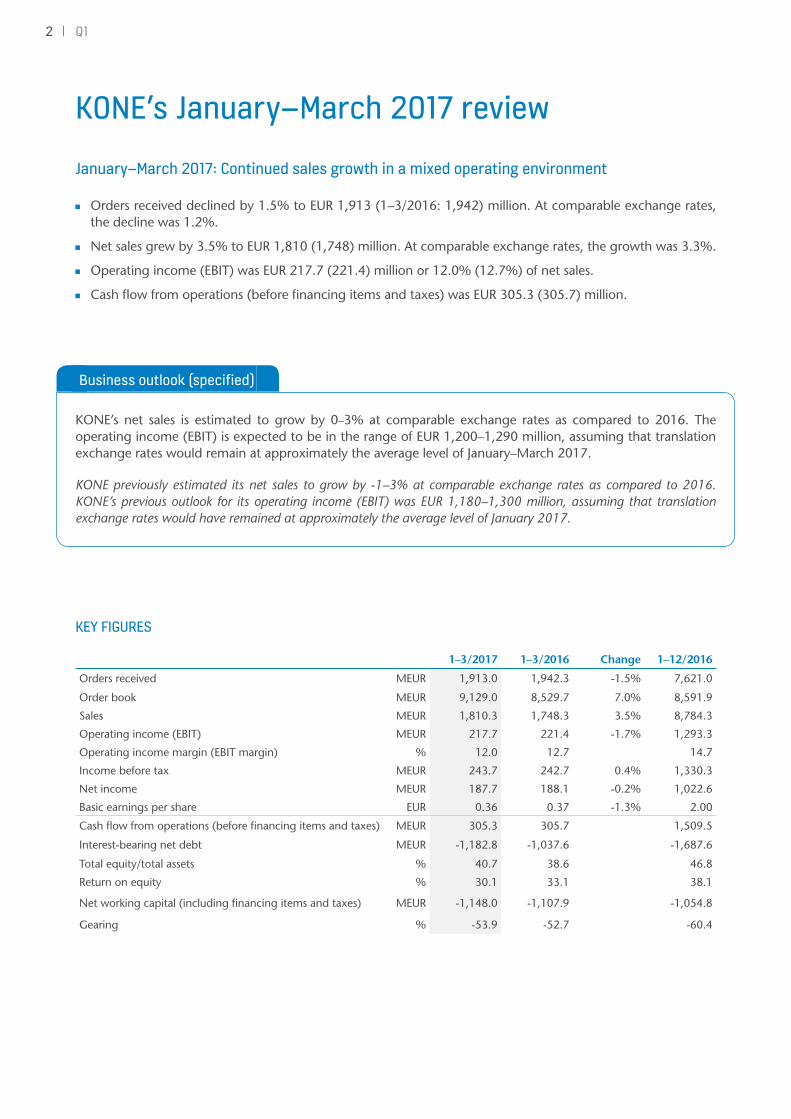
Orders received declined by 1.5% to EUR 1,913 (1–3/2016: 1,942) million. At comparable exchange rates, the decline was 1.2%.
Net sales grew by 3.5% to EUR 1,810 (1,748) million. At comparable exchange rates, the growth was 3.3%.
Operating income (EBIT) was EUR 217.7 (221.4) million or 12.0% (12.7%) of net sales.
Cash flow from operations (before financing items and taxes) was EUR 305.3 (305.7) million.
Business outlook (specified)
KONE’s net sales is estimated to grow by 0–3% at comparable exchange rates as compared to 2016. The operating income (EBIT) is expected to be in the range of EUR 1,200–1,290 million, assuming that translation exchange rates would remain at approximately the average level of January–March 2017.
KONE previously estimated its net sales to grow by -1–3% at comparable exchange rates as compared to 2016. KONE’s previous outlook for its operating income (EBIT) was EUR 1,180–1,300 million, assuming that translation exchange rates would have remained at approximately the average level of January 2017.
KEY FIGURES
1–3/2017 1–3/2016 Change 1–12/2016
Orders received MEUR 1,913.0 1,942.3 -1.5% 7,621.0
Order book MEUR 9,129.0 8,529.7 7.0% 8,591.9
Sales MEUR 1,810.3 1,748.3 3.5% 8,784.3
Operating income (EBIT) MEUR 217.7 221.4 -1.7% 1,293.3
Operating income margin (EBIT margin) % 12.0 12.7 14.7
Income before tax MEUR 243.7 242.7 0.4% 1,330.3
Net income MEUR 187.7 188.1 -0.2% 1,022.6
Basic earnings per share EUR 0.36 0.37 -1.3% 2.00
Cash flow from operations (before financing items and taxes) MEUR 305.3 305.7 1,509.5
Interest-bearing net debt MEUR -1,182.8 -1,037.6 -1,687.6
Total equity/total assets % 40.7 38.6 46.8
Return on equity % 30.1 33.1 38.1
Net working capital (including financing items and taxes) MEUR -1,148.0 -1,107.9 -1,054.8
Gearing % -53.9 -52.7 -60.4

3Q1
KONE’s January–March 2017 review
Henrik Ehrnrooth, President and CEO:
”I am pleased with the solid start to the year in a mixed operating environment. Our performance was strong on a broad basis although the result was burdened by price pressures seen in 2016 and by increasing raw material costs. I am also happy that the active development of our services business is delivering continued good growth. Our cash flow remained strong, which shows that we have maintained healthy business fundamentals and strong execution throughout our businesses. We saw good developments in the new equipment business in many regions. In the Americas, the new equipment orders grew significantly supported by the well-received 2016 product launches and positive development continued also in EMEA. In China, our sales and orders continued to decline year-on-year. However, order volumes were stable year-on-year and prices started to stabilize after having declined throughout 2016.
The new phase in our strategy has begun with good momentum. It is still early days in the new strategic phase, but so far our Winning with Customers strategy has been well received by both the customers and KONE’s employees. During the quarter, we launched new ground-breaking services for elevators and escalators. Our new KONE Care™ service offering is an improved way of bringing value to our customers. It provides the ability to tailor services to the individual needs of customers. We also launched our new 24/7 Connected Services, which utilize the IBM Watson IoT platform. With these launches, we started a new era in services by bringing intelligence and predictability to the maintenance business. For our customers, it means a significant improvement in safety, transparency and predictability. These are some of the first steps that we are taking to drive even stronger differentiation in the service business. Thanks to the encouraging results of our new services and product launches, we continue to increase our development activity throughout KONE.
For 2017, we have specified our business outlook as the first quarter of the year is now behind us. We now expect sales growth of 0–3% at comparable rates, and the operating income to be in the range of EUR 1,200–1,290 million, assuming that the translation exchange rates would remain at the average level of January–March 2017. I am convinced that as a result of our development actions and strong execution, we will continue our solid performance in the coming quarters despite the headwinds we are facing this year.”

Q14
Key Figures
Sales (MEUR)
Orders received (MEUR) In January–March 2017, orders received declined by 1.5% at historical exchange rates (1.2% at comparable exchange rates).
At comparable rates, new equipment orders received declined slightly with a decline in the volume business and growth in major projects.
At comparable rates, modernization orders received grew slightly with growth in the volume business and a decline in major projects.
Orders received saw a positive development in the EMEA region and significant growth in the Americas region. In Asia-Pacific, orders received declined significantly.
Margin of orders received declined slightly year-on-year but remained at a good level.
In January–March 2017, net sales increased by 3.5% at his-torical exchange rates (3.3% at comparable exchange rates ).
New equipment sales declined by 1.6% at historical exchange rates (-1.3% at comparable exchange rates). Service sales grew by 8.5% (7.7%), with maintenance sales growing by 7.9% (7.1%) and modernization sales by 10.3% (9.5%).
Sales in the EMEA region grew by 4.5% at historical exchange rates (5.0% at comparable rates). Sales grew by 23.3% (19.6%) in the Americas region and declined by 6.1% (-5.8%) in the Asia-Pacific region.
10,000
8,000
6,000
4,000
2,000
0
1,7481,691
10,000
8,000
6,000
4,000
2,000
0
1,9422,054
1,810
1,810(3.5%)
1,913
1,913 (-1.5%)
Sales by businessSales by region
EMEA 41% (41%) Americas 22% (18%) Asia-Pacific 37% (41%)
1–3/2017 (1–3/2016)
New equipment 47% (49%) Maintenance 40% (38%) Modernization 14% (13%)
1–3/2017 (1–3/2016)
8,7848,647
7,6217,959
1–3/201720162015
1–3/201720162015
Q1
Q1
Q1 Q1
Q1 Q1

5Q1
2) Cash flow from operations before financing items and taxes
1) Including financing items and taxes
Net working capital1 (MEUR)
EBIT (MEUR)
Cash flow2 (MEUR)
In January–March 2017, operating income was 12.0% of net sales (1–3/2016: 12.7%)
The progress was good in the service business and, geographi-cally, in the EMEA and Americas regions. However, profitability was burdened by the price pressure seen in new equipment orders in China in 2016 combined with rising material costs as well as higher R&D and IT spend.
Translation exchange rates had a negative impact of EUR 0.3 million on the operating income.
In January–March 2017, net working capital improved from an already good level.
The improvement in net working capital was driven by a con-tinued good level of advance payments relative to inventories. Other net working capital items were rather stable.
In January–March 2017, cash flow from operations remained strong at EUR 305.3 million.
Net working capital continued to contribute positively to the cash flow.
1,750
1,500
1,250
1,000
750
500
250
0
0
-250
-500
-750
-1,000
-1,250
1,500
1,250
1,000
750
500
250
0
-1,148
218(-1.7%)
-1,108-1,055
1,2411,293
1,5091,474
1–3/201720162015
1–3/2017Q4/2016Q1/2016
1–3/201720162015
218
221212
306212 305
305
Q1Q1 Q1
Q1Q1 Q1

Q16
KONE’s January–March 2017 review
January–March 2017The global new equipment market was rather stable com-pared to the first quarter of 2016 when measured in units. In Asia-Pacific, the new equipment volumes were stable. The new equipment market in China was stable in units, but conti-nued to decline year-on-year in monetary value. The residential segment in China was impacted by the government’s housing restriction measures, while the development in the commercial segment was slightly better. The infrastructure segment conti-nued to grow driven by stimulus measures. Demand remained relatively stable in the higher-tier cities despite restrictions and there were some signs of improving demand in the lower-tier cities. In the rest of Asia-Pacific, the new equipment markets declined slightly. In the EMEA region, the new equipment market developed positively. New equipment demand in Central and North Europe grew with the residential segment continuing to see the most positive development. In South Europe, the market continued to see slight growth from a low level, whereas the picture remained mixed in the Middle East. In North America, the new equipment market growth was driven by the U.S., which saw a positive development across segments and areas.
Global service markets continued to grow. In moderniza-tion, the large European and North American modernization markets continued to see slight growth, while the smaller Asia-Pacific market grew significantly. Also the maintenance market continued to see growth across regions, with the strongest rate of growth seen in the Asia-Pacific region and slight growth in Europe and North America.
Pricing trends remained varied during the first quarter. In China, competition remained intense in new equipment, but pricing stabilized compared to the previous quarter. In the EMEA region, pricing in new equipment remained rather challenging in the South European markets in particular. In North America, new equipment pricing continued to develop positively. In services, the pricing environment continued to be characterized by strong competition in the EMEA region, particularly in South Europe and also in some of the Central and North European markets. In North America, pricing com-petition also remained rather intense in maintenance but con-tinued to develop positively in modernization.
Not fully comparable with previously used terminology
– – – Significant decline (>10%), – – Clear decline (5–10%), – Slight decline (<5%), Stable, + Slight growth (<5%), ++ Clear growth (5–10%), +++ Significant growth (>10%)
KONE’s operating environment
Operating environment by region
New equipment market Maintenance market Modernization market1–3/2017 1–3/2017 1–3/2017
Total market Stable + +
EMEA + + +Central and North Europe + + +South Europe + + +Middle East + + ++
North America + + +
Asia-Pacific Stable +++ +++China Stable +++ +++
7Q1
Orders received and order book
Orders received
MEUR 1–3/2017 1–3/2016Historical change1)
Comparable change2) 1–12/2016
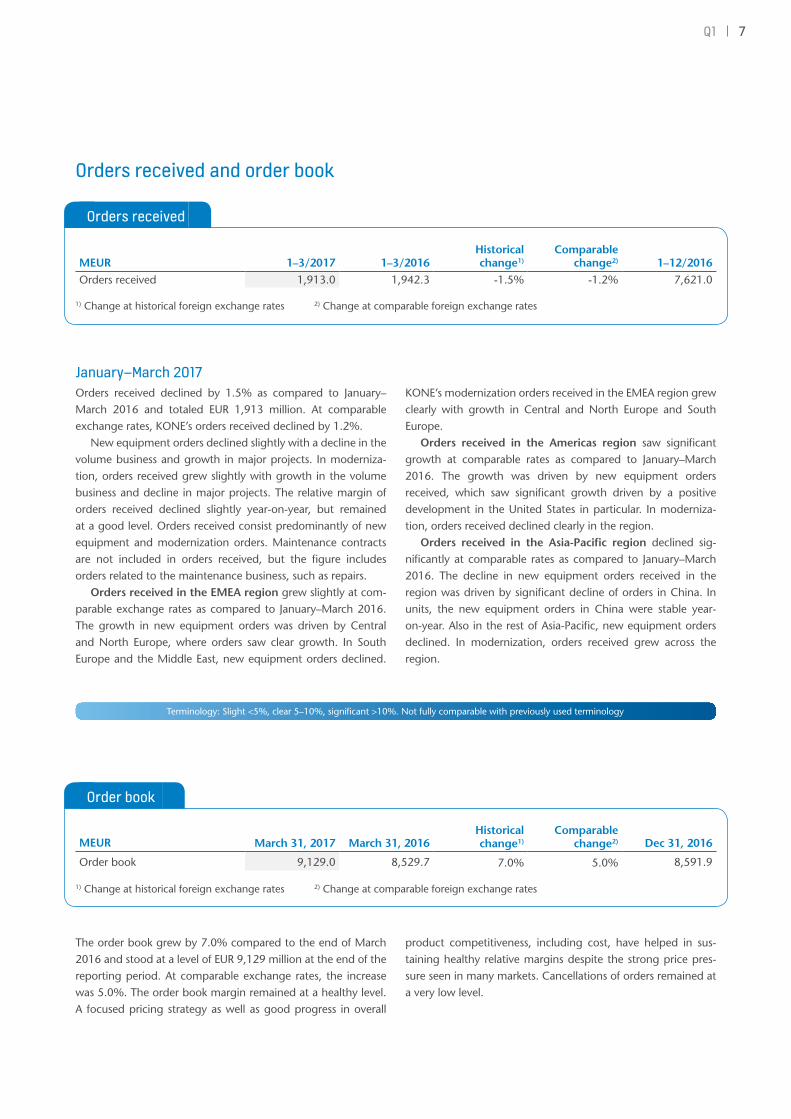
Orders received 1,913.0 1,942.3 -1.5% -1.2% 7,621.0
1) Change at historical foreign exchange rates 2) Change at comparable foreign exchange rates
January–March 2017Orders received declined by 1.5% as compared to January–March 2016 and totaled EUR 1,913 million. At comparable exchange rates, KONE’s orders received declined by 1.2%.
New equipment orders declined slightly with a decline in the volume business and growth in major projects. In moderniza-tion, orders received grew slightly with growth in the volume business and decline in major projects. The relative margin of orders received declined slightly year-on-year, but remained at a good level. Orders received consist predominantly of new equipment and modernization orders. Maintenance contracts are not included in orders received, but the figure includes orders related to the maintenance business, such as repairs.
Orders received in the EMEA region grew slightly at com-parable exchange rates as compared to January–March 2016. The growth in new equipment orders was driven by Central and North Europe, where orders saw clear growth. In South Europe and the Middle East, new equipment orders declined.
KONE’s modernization orders received in the EMEA region grew clearly with growth in Central and North Europe and South Europe.
Orders received in the Americas region saw significant growth at comparable rates as compared to January–March 2016. The growth was driven by new equipment orders received, which saw significant growth driven by a positive development in the United States in particular. In moderniza-tion, orders received declined clearly in the region.
Orders received in the Asia-Pacific region declined sig-nificantly at comparable rates as compared to January–March 2016. The decline in new equipment orders received in the region was driven by significant decline of orders in China. In units, the new equipment orders in China were stable year-on-year. Also in the rest of Asia-Pacific, new equipment orders declined. In modernization, orders received grew across the region.
Order book
MEUR March 31, 2017 March 31, 2016Historical change1)
Comparable change2) Dec 31, 2016
Order book 9,129.0 8,529.7 7.0% 5.0% 8,591.9
1) Change at historical foreign exchange rates 2) Change at comparable foreign exchange rates
The order book grew by 7.0% compared to the end of March 2016 and stood at a level of EUR 9,129 million at the end of the reporting period. At comparable exchange rates, the increase was 5.0%. The order book margin remained at a healthy level. A focused pricing strategy as well as good progress in overall
product competitiveness, including cost, have helped in sus-taining healthy relative margins despite the strong price pres-sure seen in many markets. Cancellations of orders remained at a very low level.
Terminology: Slight <5%, clear 5–10%, significant >10%. Not fully comparable with previously used terminology
Q18
Net sales
By region
MEUR 1–3/2017 1–3/2016Historical change1)
Comparable change2) 1–12/2016
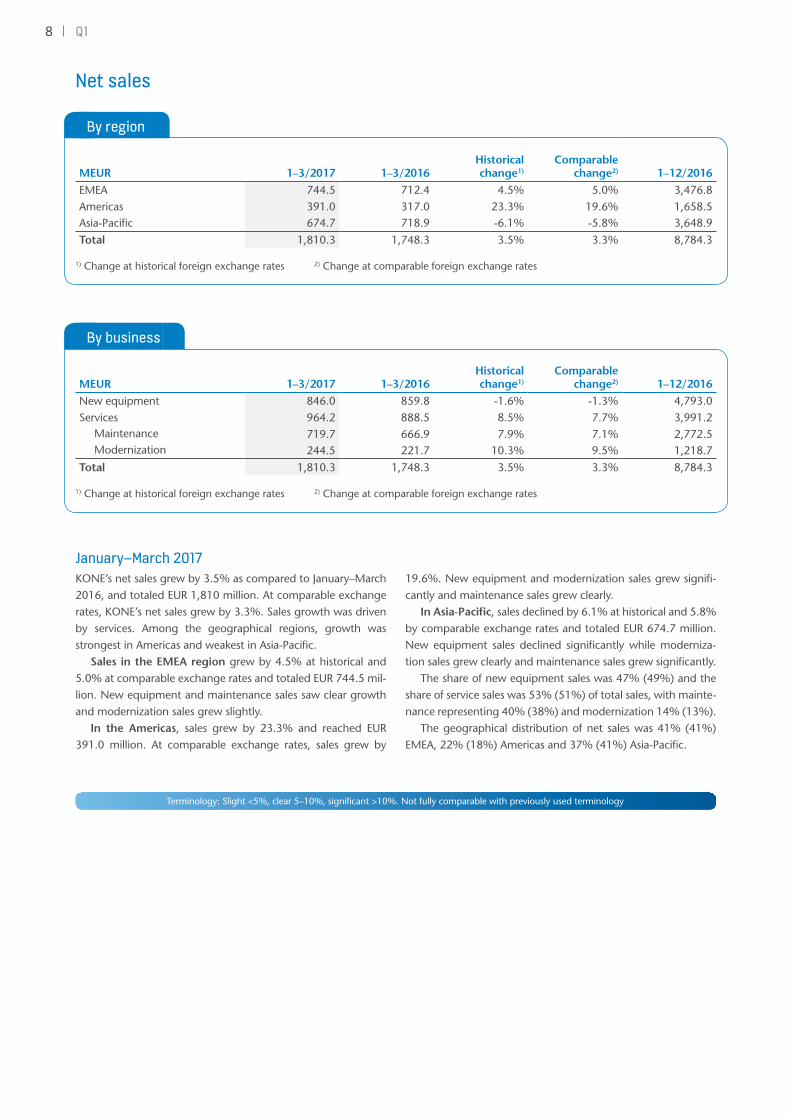
EMEA 744.5 712.4 4.5% 5.0% 3,476.8Americas 391.0 317.0 23.3% 19.6% 1,658.5Asia-Pacific 674.7 718.9 -6.1% -5.8% 3,648.9
Total 1,810.3 1,748.3 3.5% 3.3% 8,784.3
1) Change at historical foreign exchange rates 2) Change at comparable foreign exchange rates
By business
MEUR 1–3/2017 1–3/2016Historical change1)
Comparable change2) 1–12/2016
New equipment 846.0 859.8 -1.6% -1.3% 4,793.0Services 964.2 888.5 8.5% 7.7% 3,991.2
Maintenance 719.7 666.9 7.9% 7.1% 2,772.5Modernization 244.5 221.7 10.3% 9.5% 1,218.7
Total 1,810.3 1,748.3 3.5% 3.3% 8,784.3
1) Change at historical foreign exchange rates 2) Change at comparable foreign exchange rates
January–March 2017KONE’s net sales grew by 3.5% as compared to January–March 2016, and totaled EUR 1,810 million. At comparable exchange rates, KONE’s net sales grew by 3.3%. Sales growth was driven by services. Among the geographical regions, growth was strongest in Americas and weakest in Asia-Pacific.
Sales in the EMEA region grew by 4.5% at historical and 5.0% at comparable exchange rates and totaled EUR 744.5 mil-lion. New equipment and maintenance sales saw clear growth and modernization sales grew slightly.
In the Americas, sales grew by 23.3% and reached EUR 391.0 million. At comparable exchange rates, sales grew by
19.6%. New equipment and modernization sales grew signifi-cantly and maintenance sales grew clearly.
In Asia-Pacific, sales declined by 6.1% at historical and 5.8% by comparable exchange rates and totaled EUR 674.7 million. New equipment sales declined significantly while moderniza-tion sales grew clearly and maintenance sales grew significantly.
The share of new equipment sales was 47% (49%) and the share of service sales was 53% (51%) of total sales, with mainte-nance representing 40% (38%) and modernization 14% (13%).
The geographical distribution of net sales was 41% (41%) EMEA, 22% (18%) Americas and 37% (41%) Asia-Pacific.
Terminology: Slight <5%, clear 5–10%, significant >10%. Not fully comparable with previously used terminology

9Q1
Financial result
Financial result
1–3/2017 1–3/2016 Change 1–12/2016Operating income, MEUR 217.7 221.4 -1.7% 1,293.3
Operating income margin, % 12.0% 12.7% 14.7%Income before taxes, MEUR 243.7 242.7 0.4% 1,330.3Net income, MEUR 187.7 188.1 -0.2% 1,022.6
Basic earnings per share, EUR 0.36 0.37 -1.3% 2.00
KONE’s operating income (EBIT) declined slightly to EUR 217.7 million or 12.0% of net sales. Profitability was burdened by the price pressure seen in new equipment orders in China in 2016 combined with rising material costs. This was partly compen-sated by good development in services and, geographically, in the EMEA and Americas regions. KONE also continued to increase fixed costs in areas that support the growth of the busi-ness, particularly in growth markets as well as R&D, process
development and IT. Translation exchange rates had a negative impact of EUR 0.3 million on the operating income.
Income before taxes was EUR 243.7 million. Taxes totaled EUR 56.1 (54.6) million, taking into account taxes proportion-ate to the amount estimated for the financial year. This repre-sents an effective tax rate of 23.0% (22.5%) for the full financial year. Net income for the period under review declined slightly to EUR 187.7 million. Basic earnings per share was EUR 0.36.
Cash flow and financial position
Cash flow and financial position
1–3/2017 1–3/2016 1–12/2016Cash flow from operations (before financing items and taxes), MEUR 305.3 305.7 1,509.5Net working capital (including financing items and taxes), MEUR -1,148.0 -1,107.9 -1,054.8
Interest-bearing net debt, MEUR -1,182.8 -1,037.6 -1,687.6
Gearing -53.9% -52.7% -60.4%
Total equity / total assets 40.7% 38.6% 46.8%
Equity per share, EUR 4.25 3.75 5.42
Cash flow from operations (before financing items and taxes) during January–March 2017 remained strong at EUR 305.3 million. Net working capital improved from an already good level to EUR -1,148 million at the end of March 2017, includ-ing financing items and taxes. The improvement in net working capital was driven by a good level of advance payments rela-tive to inventories. Other net working capital items were rather stable during the quarter.
KONE’s financial position was very strong at the end of March 2017. Interest-bearing net debt was EUR -1,183 million. KONE’s cash and cash equivalents together with current depos-its and loan receivables were EUR 1,590 (2,086) million at the end of the reporting period. Interest-bearing liabilities were EUR 414.4 (405.5) million, including a net pension liability of EUR 179.9 (176.7) million and short-term loans of EUR 20.2 (15.4) million.

Q110
Capital expenditure and acquisitions
Capital expenditure & acquisitions
MEUR 1–3/2017 1–3/2016 1–12/2016On fixed assets 19.3 26.6 99.6On leasing agreements 4.5 6.4 27.8On acquisitions 0.7 22.2 99.2
Total 24.5 55.2 226.6
KONE’s capital expenditure and acquisitions totaled EUR 24.5 million in January–March 2017. Capital expenditure was mainly related to facilities and equipment in R&D, IT, operations and production.
Acquisitions totaled EUR 0.7 million in January–March 2017. KONE completed only a couple of small acquisitions of mainte-nance businesses in Europe.
Research and development expenses totaled EUR 36.6 million, representing 2.0% of net sales in January–March 2017. R&D expenses include the development of new product and service concepts as well as the further development of existing solu-tions and services.
KONE’s vision is to deliver the Best People Flow® experience by providing ease, effectiveness and experiences to its customers and users. In line with its strategy, Winning with Customers, the objective of KONE’s solution and ser-vice development is to drive differen-tiation further by putting the needs of customers and users at the center of all development. By closer collaboration with customers and partners, KONE will increase the speed of bringing new services and solutions to the market.
During January–March 2017, KONE launched the new KONE Care™, a unique elevator maintenance offering designed to meet indi-vidual customer needs, and new 24/7 Connected Services, which bring more intelligent services to elevators and esca-lators. With KONE Care™, which can be fully customized to meet the individual needs of our customers, KONE brings new levels of flexibility to elevator maintenance. KONE’s 24/7
Connected Services uses the IBM Watson Internet of Things platform to bring new added value to customers and enables elevator data to be monitored and analyzed to improve equip-ment performance. Both the new KONE service offering
and 24/7 Connected Services will be commercially broadly available dur-ing 2017 with the roll-out continuing throughout 2018.
In addition, KONE launched several updates to its existing product offering during the reporting period. The next generation of the inclined KONE Travel Master™ autowalk was launched pro-viding easy and safe access for envi-ronments with demanding people flow needs. In India, KONE launched a small-machine-room, gearless eleva-tor KONE Neo™ for the residential segment. Furthermore, KONE released various updates to its existing offering
in different geographic regions.In March, KONE unveiled its renewed high-rise elevator
testing facility in Tytyri, Finland. The test lab reaches a depth of 350 meters and hosts the world’s tallest elevator test shaft. As a result, KONE can develop and test the ultimate high-rise innovations and technologies under extreme conditions.
Research and development
R&D expenditure
MEUR 1–3/2017 1–3/2016 1–12/2016R&D expenditure, MEUR 36.6 30.2 140.5As percentage of sales, % 2.0% 1.7% 1.6%
HIGHLIGHTS Q1/2017• KONE revolutionized elevator
maintenance with its new customizable KONE Care™ service offering and 24/7 Connected Services
• KONE opened its renewed high-rise test laboratory in Tytyri, Finland
11Q1
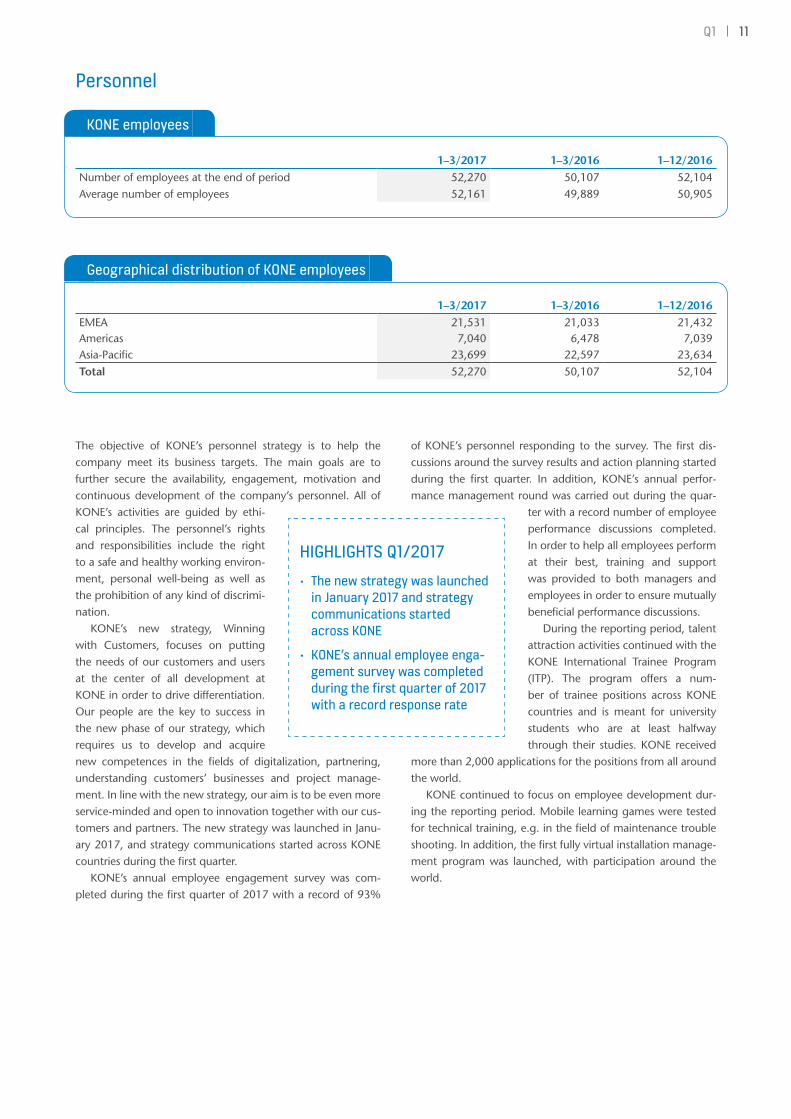
The objective of KONE’s personnel strategy is to help the company meet its business targets. The main goals are to further secure the availability, engagement, motivation and continuous development of the company’s personnel. All of KONE’s activities are guided by ethi-cal principles. The personnel’s rights and responsibilities include the right to a safe and healthy working environ-ment, personal well-being as well as the prohibition of any kind of discrimi-nation.
KONE’s new strategy, Winning with Customers, focuses on putting the needs of our customers and users at the center of all development at KONE in order to drive differentiation. Our people are the key to success in the new phase of our strategy, which requires us to develop and acquire new competences in the fields of digitalization, partnering, understanding customers’ businesses and project manage-ment. In line with the new strategy, our aim is to be even more service-minded and open to innovation together with our cus-tomers and partners. The new strategy was launched in Janu-ary 2017, and strategy communications started across KONE countries during the first quarter.
KONE’s annual employee engagement survey was com-pleted during the first quarter of 2017 with a record of 93%
of KONE’s personnel responding to the survey. The first dis-cussions around the survey results and action planning started during the first quarter. In addition, KONE’s annual perfor-mance management round was carried out during the quar-
ter with a record number of employee performance discussions completed. In order to help all employees perform at their best, training and support was provided to both managers and employees in order to ensure mutually beneficial performance discussions.
During the reporting period, talent attraction activities continued with the KONE International Trainee Program (ITP). The program offers a num-ber of trainee positions across KONE countries and is meant for university students who are at least halfway through their studies. KONE received
more than 2,000 applications for the positions from all around the world.
KONE continued to focus on employee development dur-ing the reporting period. Mobile learning games were tested for technical training, e.g. in the field of maintenance trouble shooting. In addition, the first fully virtual installation manage-ment program was launched, with participation around the world.
Personnel
KONE employees
1–3/2017 1–3/2016 1–12/2016Number of employees at the end of period 52,270 50,107 52,104Average number of employees 52,161 49,889 50,905
Geographical distribution of KONE employees
1–3/2017 1–3/2016 1–12/2016EMEA 21,531 21,033 21,432Americas 7,040 6,478 7,039Asia-Pacific 23,699 22,597 23,634
Total 52,270 50,107 52,104
HIGHLIGHTS Q1/2017• The new strategy was launched
in January 2017 and strategy communications started across KONE
• KONE’s annual employee enga-gement survey was completed during the first quarter of 2017 with a record response rate
Q112
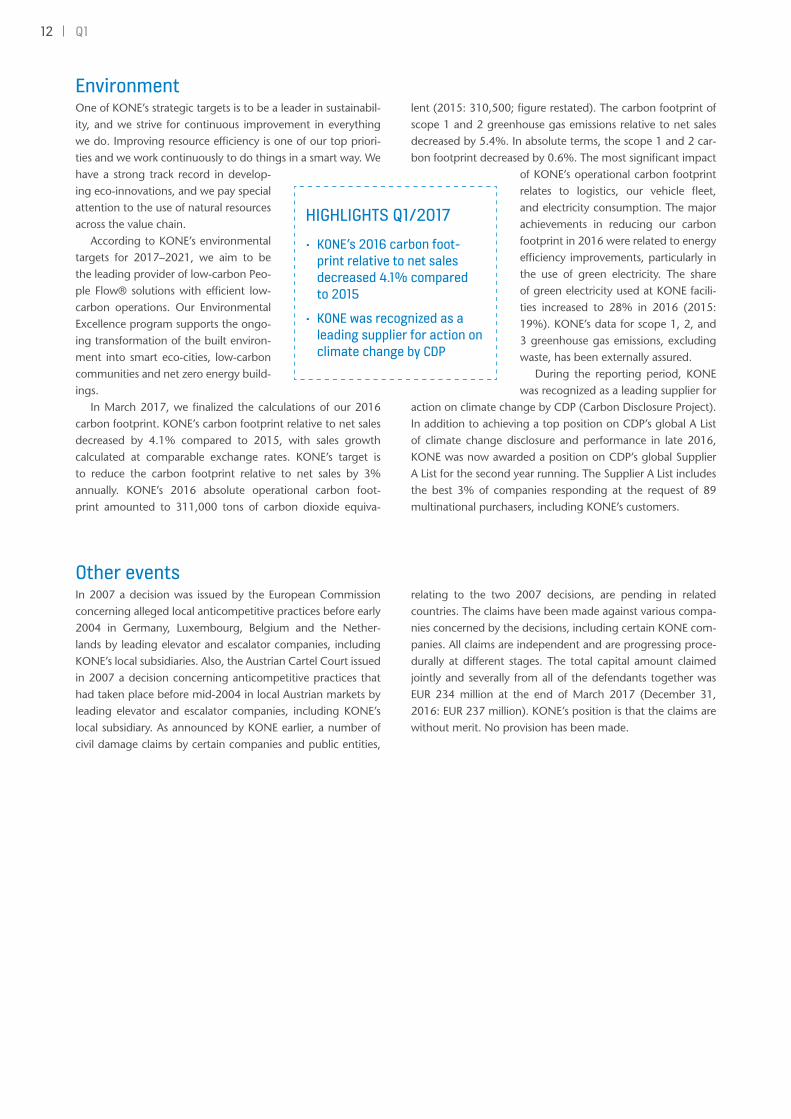
Environment One of KONE’s strategic targets is to be a leader in sustainabil-ity, and we strive for continuous improvement in everything we do. Improving resource efficiency is one of our top priori-ties and we work continuously to do things in a smart way. We have a strong track record in develop-ing eco-innovations, and we pay special attention to the use of natural resources across the value chain.
According to KONE’s environmental targets for 2017–2021, we aim to be the leading provider of low-carbon Peo-ple Flow® solutions with efficient low-carbon operations. Our Environmental Excellence program supports the ongo-ing transformation of the built environ-ment into smart eco-cities, low-carbon communities and net zero energy build-ings.
In March 2017, we finalized the calculations of our 2016 carbon footprint. KONE’s carbon footprint relative to net sales decreased by 4.1% compared to 2015, with sales growth calculated at comparable exchange rates. KONE’s target is to reduce the carbon footprint relative to net sales by 3% annually. KONE’s 2016 absolute operational carbon foot-print amounted to 311,000 tons of carbon dioxide equiva-
lent (2015: 310,500; figure restated). The carbon footprint of scope 1 and 2 greenhouse gas emissions relative to net sales decreased by 5.4%. In absolute terms, the scope 1 and 2 car-bon footprint decreased by 0.6%. The most significant impact
of KONE’s operational carbon footprint relates to logistics, our vehicle fleet, and electricity consumption. The major achievements in reducing our carbon footprint in 2016 were related to energy efficiency improvements, particularly in the use of green electricity. The share of green electricity used at KONE facili-ties increased to 28% in 2016 (2015: 19%). KONE’s data for scope 1, 2, and 3 greenhouse gas emissions, excluding waste, has been externally assured.
During the reporting period, KONE was recognized as a leading supplier for
action on climate change by CDP (Carbon Disclosure Project). In addition to achieving a top position on CDP’s global A List of climate change disclosure and performance in late 2016, KONE was now awarded a position on CDP’s global Supplier A List for the second year running. The Supplier A List includes the best 3% of companies responding at the request of 89 multinational purchasers, including KONE’s customers.
Other eventsIn 2007 a decision was issued by the European Commission concerning alleged local anticompetitive practices before early 2004 in Germany, Luxembourg, Belgium and the Nether-lands by leading elevator and escalator companies, including KONE’s local subsidiaries. Also, the Austrian Cartel Court issued in 2007 a decision concerning anticompetitive practices that had taken place before mid-2004 in local Austrian markets by leading elevator and escalator companies, including KONE’s local subsidiary. As announced by KONE earlier, a number of civil damage claims by certain companies and public entities,
relating to the two 2007 decisions, are pending in related countries. The claims have been made against various compa-nies concerned by the decisions, including certain KONE com-panies. All claims are independent and are progressing proce-durally at different stages. The total capital amount claimed jointly and severally from all of the defendants together was EUR 234 million at the end of March 2017 (December 31, 2016: EUR 237 million). KONE’s position is that the claims are without merit. No provision has been made.
HIGHLIGHTS Q1/2017• KONE’s 2016 carbon foot-
print relative to net sales decreased 4.1% compared to 2015
• KONE was recognized as a leading supplier for action on climate change by CDP

13Q1
Most significant risks KONE is exposed to risks that may arise from its operations or changes in the operating environment. The risk factors described below can potentially have an adverse effect on KONE’s business operations and financial position and, as a result, on the value of the company. Other risks, which are cur-rently either unknown or considered immaterial to KONE may, however, become material in the future.
Strategic risks A weakening of the global economic environment could result in a deterioration of the market environment and the com-petitive situation in the industry. In particular, a stronger than anticipated decline or a prolonged weakness of the construc-tion market could result in a significant decline in the new equipment market and a more challenging market environ-ment for services. In particular, a sustained market decline in China, which accounts for approximately 30% of KONE’s sales, could have an adverse effect on KONE’s growth and profitability.
Digitalization, and the resulting new customer require-ments as well as potential new competition, ecosystems and business models, could have a significant impact on the eleva-tor and escalator industry. A failure to anticipate or address changes in the external market environment could result in a deterioration of KONE’s growth, competitiveness, market share or profitability.
KONE operates in an industry with various local regula-tory requirements. Sudden or unanticipated changes in regu-lations, equipment codes or standards may result in a need for process or technology adjustments, which could adversely impact KONE’s profit development in affected countries. In addition, an increase in geopolitical tensions or a rise in regu-latory protectionism could result in more challenging market conditions in affected countries. Such developments could have an adverse impact on KONE’s operations.
A significant part of KONE’s component suppliers and global supply capacity is located in China, both in the eleva-tor and in the escalator business. Therefore KONE’s operations may be adversely impacted by changes in trade agreements or introduction of restrictions to trade.
Operational risks As one of the leading companies in the industry, KONE has a strong brand and reputation, meaning that reputation or brand issues could have an impact on KONE’s business and financial performance. Such reputation risks could materialize
e.g. in the case of an incident or a product quality issue. Issues with product integrity or quality could also have an impact on KONE’s financial performance.
KONE operates in certain high growth markets, where focused management of rapid business growth is required. This applies in particular to the availability of skilled personnel, the adequate supply of components and materials, and the ability to ensure the quality of delivered products and services. Failure to adequately manage resourcing, quality of delivery, or other critical aspects in projects, could have an adverse impact on KONE’s profitability.
KONE’s business activities are dependent on the uninter-rupted operation, quality and reliability of its manufacturing facilities, sourcing channels, operational service solutions and logistics processes. KONE’s operations also utilize information technology extensively and its business is dependent on the quality and availability of information. Thus, in addition to physical risks, KONE is exposed to cyber security risks as opera-tional information systems and products may be vulnerable to interruption, loss of data or malfunctions which can result in disruptions in processes and equipment availability and there-fore impact KONE’s business. Such cyber incidents could be caused by, including but not limited to, cyber-attacks, com-puter malware, denial of service attacks, fraudulent attempts and data breaches.
The majority of components used in KONE’s supply chain are sourced from external suppliers, which exposes KONE to component price risk as well as raw material price risk. There-fore stronger than anticipated increases in raw material and component prices may have a significant impact on KONE’s profitability.
Financial risks The majority of KONE’s sales is denominated in other curren-cies than the euro, which exposes KONE to risks arising from foreign exchange rate fluctuations. KONE is also exposed to counterparty risks related to financial institutions through the significant amounts of liquid funds that are deposited with financial institutions in the form of financial investments and in derivatives. Additionally, KONE is exposed to risks related to the liquidity and payment schedules of its customers, which may lead to credit losses. Significant changes in local financial or taxation regulation could also have an impact on KONE’s financial performance. For further information on financial risks, please refer to notes 2.4 and 5.3 in the Financial State-ments for 2016.
Q114
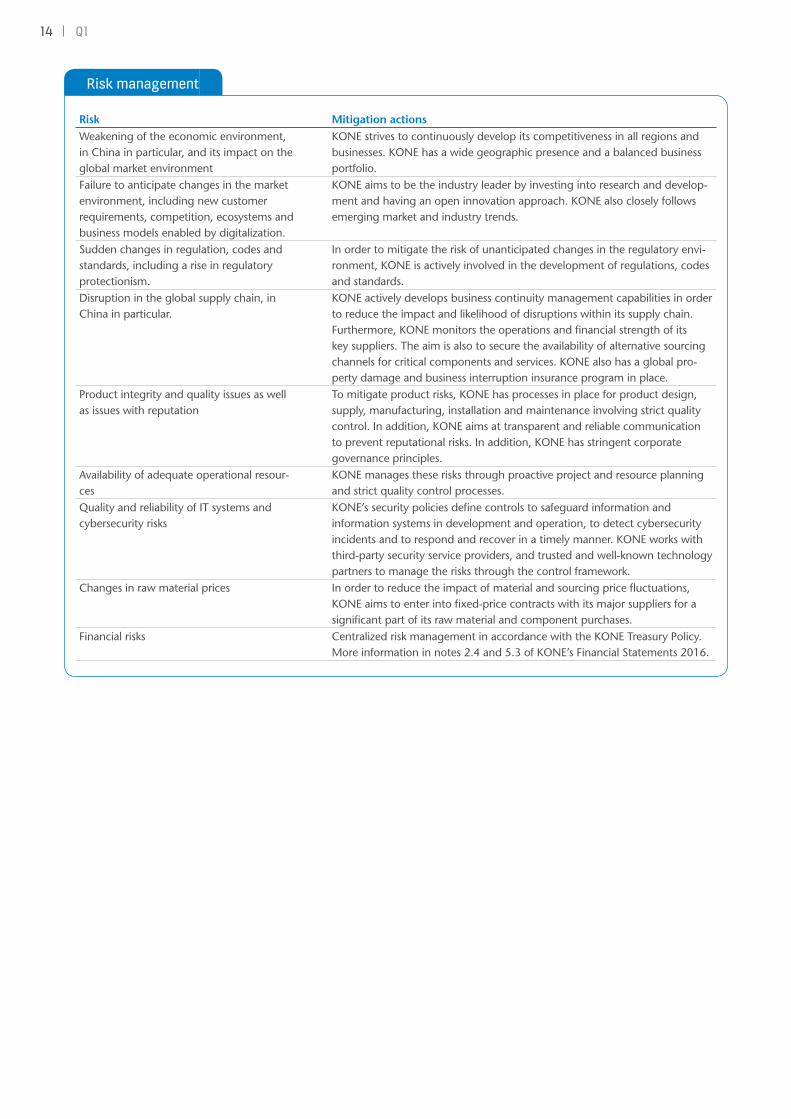
Risk management
Risk Mitigation actionsWeakening of the economic environment, in China in particular, and its impact on the global market environment
KONE strives to continuously develop its competitiveness in all regions and businesses. KONE has a wide geographic presence and a balanced business portfolio.
Failure to anticipate changes in the market environment, including new customer requirements, competition, ecosystems and business models enabled by digitalization.
KONE aims to be the industry leader by investing into research and develop-ment and having an open innovation approach. KONE also closely follows emerging market and industry trends.
Sudden changes in regulation, codes and standards, including a rise in regulatory protectionism.
In order to mitigate the risk of unanticipated changes in the regulatory envi-ronment, KONE is actively involved in the development of regulations, codes and standards.
Disruption in the global supply chain, in China in particular.
KONE actively develops business continuity management capabilities in order to reduce the impact and likelihood of disruptions within its supply chain. Furthermore, KONE monitors the operations and financial strength of its key suppliers. The aim is also to secure the availability of alternative sourcing channels for critical components and services. KONE also has a global pro-perty damage and business interruption insurance program in place.
Product integrity and quality issues as well as issues with reputation
To mitigate product risks, KONE has processes in place for product design, supply, manufacturing, installation and maintenance involving strict quality control. In addition, KONE aims at transparent and reliable communication to prevent reputational risks. In addition, KONE has stringent corporate governance principles.
Availability of adequate operational resour-ces
KONE manages these risks through proactive project and resource planning and strict quality control processes.
Quality and reliability of IT systems and cybersecurity risks
KONE’s security policies define controls to safeguard information and information systems in development and operation, to detect cybersecurity incidents and to respond and recover in a timely manner. KONE works with third-party security service providers, and trusted and well-known technology partners to manage the risks through the control framework.
Changes in raw material prices In order to reduce the impact of material and sourcing price fluctuations, KONE aims to enter into fixed-price contracts with its major suppliers for a significant part of its raw material and component purchases.
Financial risks Centralized risk management in accordance with the KONE Treasury Policy. More information in notes 2.4 and 5.3 of KONE’s Financial Statements 2016.

15Q1
Decisions of the Annual General MeetingKONE Corporation’s Annual General Meeting was held in Hel-sinki on February 28, 2017. The meeting approved the finan-cial statements and discharged the responsible parties from liability for the financial period January 1-December 31, 2016.
The number of Members of the Board of Directors was confirmed as eight. Re-elected as Members of the Board were Matti Alahuhta, Anne Brunila, Antti Herlin, Iiris Herlin, Jussi Herlin, Ravi Kant, Juhani Kaskeala and Sirpa Pietikäinen.
At its meeting held after the General Meeting, the Board of Directors elected from among its members Antti Herlin as its Chairman and Jussi Herlin as Vice Chairman.
Jussi Herlin was elected as Chairman and Anne Brunila, Antti Herlin and Ravi Kant as members of the Audit Commit-tee. Anne Brunila and Ravi Kant are independent of both the company and of significant shareholders.
Antti Herlin was elected as Chairman and Matti Alahuhta, Jussi Herlin and Juhani Kaskeala as members of the Nomina-tion and Compensation Committee. Juhani Kaskeala is inde-pendent of both the company and of significant shareholders. Matti Alahuhta was independent of significant shareholders
until March 31, 2017 and independent of both the company and of significant shareholders from April 1, 2017.
The General Meeting confirmed an annual compensation of EUR 54,000 for the Chairman of the Board, EUR 44,000 for the Vice Chairman and EUR 37,000 (previously EUR 33,000) for Board Members. In addition, a compensation of EUR 500 was approved for attendance at Board and Committee meet-ings. For Committee members residing outside of Finland, a compensation of EUR 2,000 for attendance at Committee meetings was approved. Of the annual remuneration, 40 per-cent will be paid in class B shares of KONE Corporation and the rest in cash.
The General Meeting approved the authorization for the Board of Directors to repurchase KONE’s own shares. Alto-gether no more than 52,440,000 shares may be repurchased, of which no more than 7,620,000 may be class A shares and 44,820,000 class B shares. The authorization shall remain in effect for a period of one year from the date of decision of the General Meeting.
Authorized public accountants PricewaterhouseCoopers Oy and Niina Vilske were nominated as auditors.
Dividend 2016The General Meeting approved dividends in line with the Board of Director’s proposal of EUR 1.5475 for each of the 76,208,712 class A shares and EUR 1.55 for each of the out-
standing 437,076,029 class B shares. The date of record for dividend distribution was March 2, 2017 and dividends were paid on March 9, 2017.
Share-based incentivesKONE has two separate share-based incentive plans. One plan is targeted for the senior management of KONE including the President & CEO, members of the Executive Board and other top management, consisting of approximately 60 individuals. A second plan is targeted for other key personnel of KONE, totaling approximately 450 individuals. The potential reward is based on the annual growth in sales and operating income (EBIT) in both plans. However, KONE’s Board of Directors has the possibility to change the basis of the target setting annu-ally. The potential reward is to be paid as a combination of KONE class B shares and a cash payment equivalent to the taxes and similar charges that are incurred from the receipt of shares. Plans include conditions preventing participants from transferring and participants are obliged to return the shares and the cash payments if employment or service contract is terminated during a period of two years following the end-ing of each earning period. As part of the plan for the senior management, a long-term target for the their ownership has been set.
In 2013, KONE granted a conditional option program. The stock options 2013 were listed on the Nasdaq Helsinki Ltd. as of April 1, 2015. The total number of stock options was
750,000 and 55,000 of them are held by KONE Corporation’s subsid¬iary. During the reporting period, no class B shares were subscribed for with the 2013 option rights. On March 31, 2017 a maximum of 514,278 shares could be subscribed for with the remaining outstanding option rights. Each option entitles its holder to subscribe for two (2) new class B shares at the price of, from March 1, 2017, EUR 22.45 per share. The share subscription period for the stock option 2013 is April 1, 2015–April 30, 2017.
In December 2013, KONE granted a conditional 2014 option program. The stock options 2014 were listed on the Nasdaq Helsinki Ltd. as of April 1, 2016. The total number of stock options was 1,500,000 and 133,000 of them are held by KONE Corporation’s subsidiary. During the reporting period, no class B shares were subscribed for with the 2014 option rights. On March 31, 2017, a maximum of 1,353,870 shares could be sub-scribed for with the remaining outstanding option rights. Each option entitles its holder to subscribe for one (1) new class B KONE share at the price of, from March 1, 2017, EUR 26.65 per share. The share subscription period for the stock options 2014 is April 1, 2016–April 30, 2018.

Q116
In December 2014, KONE granted a conditional 2015 option program. The share subscription period began on April 1, 2017 since the financial performance of the KONE Group for the financial years 2015–2016 based on the total consideration of the Board of Directors was equal to or bet-ter than the average performance of the key competitors of KONE. The stock options 2015 were listed on the Nasdaq Hel-sinki Ltd. as of April 1, 2017. The number of stock options was 1,500,000 and 131,000 of them are held by KONE Corpora-
tion’s subsidiary. The original share subscription price for the option was EUR 36.20 per share and it is further reduced in situations mentioned in the terms, for example with dividends distributed before the subscription of the shares. Each stock option entitles its holder to subscribe for one (1) new class B KONE share at the price of, from March 1, 2017, EUR 32.05 per share. The share subscription period for the stock options 2015 is April 1, 2017–April 30, 2019.
Share capital and market capitalization
Share capital and market capitalization*
March 31, 2017 Dec 31, 2016Number of class B shares 449,960,170 449,960,170Number of class A shares 76,208,712 76,208,712Total shares 526,168,882 526,168,882
Share capital 65,771,110 65,771,110
Market capitalization 21,127 21,851
* Market capitalization is calculated on the basis of both the listed B shares and the unlisted A shares excluding treasury shares. Class A shares are valued at the closing price of the class B shares at the end of the reporting period.
Shares in KONE’s possession
Shares in KONE’s possession
1–3/2017Shares in KONE’s possession at the start of the period 12,884,141Changes in own shares during the period 0Shares in KONE’s possession at the end of the period 12,884,141
At the end of March 2017, the Group had 12,884,141 class B shares in its possession. The shares in the Group’s possession
represent 2.9% of the total number of class B shares. This cor-responds to 1.1% of the total voting rights.

17Q1
Shares traded on the Nasdaq Helsinki Ltd.
Trading on the KONE share
1–3/2017 1–3/2016 1–12/2016
Shares traded on the Nasdaq Helsinki Ltd., million 51.1 59.8 194.7
Average daily trading volume 797,958 980,008 769,607
Volume-weighted average share price EUR 41.53 39.57 41.47
Highest share notation EUR 45.71 43.35 47.89
Lowest share notation EUR 39.77 35.50 35.50
Share notation at the end of period EUR 41.16 42.36 42.57
In addition to the Nasdaq Helsinki Ltd., KONE’s class B share is traded also on various alternative trading platforms. The vol-ume of KONE’s B shares traded on the Nasdaq Helsinki Stock Exchange represented approximately 25.4% of the total vol-ume of KONE’s class B shares traded in January–March 2017 (source: Fidessa Fragmentation Index, www.fragmentation.fidessa.com).
The number of registered shareholders was 57,471 at the beginning of the review period and 61,025 at its end. The
number of private households holding shares totaled 57,045 at the end of the period, which corresponds to approximately 13.3% of the listed B shares.
According to the nominee registers 49.2% of the listed class B shares were owned by foreign shareholders on March 31, 2017. Other foreign ownership at the end of the period totaled 1.3%. Thus a total of 50.5% of KONE’s listed class B shares were owned by international investors, corresponding to approximately 18.8% of the total votes in the company.
Flagging notifications During January–March 2017, The Capital Group Companies, Inc. announced a notice to KONE Corporation in accordance with the Finnish Securities Market Act, Chapter 9, Section 10. The notice was announced on March 10. The notice has been released as a stock exchange release and is available on KONE Corporation’s internet pages at www.kone.com. According to
the notification, released on March 13, 2017, the total num-ber of KONE Corporation shares owned by The Capital Group Companies, Inc. and its funds decreased below five (5) per cent of the share capital of KONE Corporation on March 9, 2017.

Q118
North AmericaNew equipment Services
Slight growth
Maintenance
Slight growth
Modernization
Slight growth
EMEANew equipment Services
Slight growth
Maintenance
Slight growth
Modernization
Slight growth
Asia-PacificNew equipment Services
China
To decline by 0–5% in units, competition to
continue intense
Outside China
Growth
Maintenance
Strong growth
Modernization
Strong growth
Outlook
Market outlook 2017
Business outlook 2017 (specified)KONE’s net sales is estimated to grow by 0–3% at comparable exchange rates as compared to 2016.
The operating income (EBIT) is expected to be in the range of EUR 1,200–1,290 million, assuming that translation exchange rates would remain at approximately the average level of January–March 2017.
The sales outlook is based on KONE’s maintenance base and order book as well as the market outlook.
KONE’s operating income outlook is based on the current sales forecast combined with factors impacting profitability. In 2017, profitability is expected to be impacted by factors such as improved quality and productivity, pricing and business mix, a slight decrease in the margin of orders received in 2016 as well as cost pressures resulting from increased material costs and R&D and IT spend. The negative factors are expected to be more pronounced in the coming quarters than during the first quarter.
Previous business outlookKONE’s net sales is estimated to grow by -1–3% at comparable exchange rates as compared to 2016
The operating income (EBIT) is expected to be in the range of EUR 1,180-1,300 million, assuming that translation exchange rates would remain at approximately the average level of January 2017.
Helsinki, April 27, 2017
KONE Corporation’s Board of Directors
Market outlook 2017In new equipment, the market in China is expected to decline by 0–5% in units ordered and also the competition to con-tinue intense. In the rest of Asia-Pacific, the market is expected to grow. The market in North America and in the Europe, Mid-dle East and Africa region is expected to grow slightly.
The modernization market is expected to grow slightly in Europe and in North America and to develop strongly in Asia-Pacific.
Maintenance markets are expected to see the strongest growth rate in Asia-Pacific and to grow slightly also in other regions.
Accounting PrinciplesKONE Corporation’s Interim Report for January–March 2017 has been prepared in line with IAS 34, ‘Interim Financial Reporting’ and should be read in conjunction with KONE’s financial statements for 2016, published on January 26, 2017. KONE has applied the same accounting principles in the preparation of this Interim Report as in its Financial Statements for 2016, except for the adoption of new standards and interpretations effective during 2017 that are relevant to its operations. The changes did not have a material impact on the Interim Report. The information presented in this Interim Report has not been audited.

19Q1
MEUR 1–3/2017 % 1–3/2016 % 1–12/2016 %
Sales 1,810.3 1,748.3 8,784.3
Costs and expenses -1,564.2 -1,501.4 -7,384.5
Depreciation and amortization -28.4 -25.5 -106.5
Operating income 217.7 12.0 221.4 12.7 1,293.3 14.7
Share of associated companies' net income 0.3 0.3 1.2
Financing income 28.5 23.3 66.8
Financing expenses -2.8 -2.3 -31.0
Income before taxes 243.7 13.5 242.7 13.9 1,330.3 15.1
Taxes -56.1 -54.6 -307.7
Net income 187.7 10.4 188.1 10.8 1,022.6 11.6
Net income attributable to:
Shareholders of the parent company 185.4 187.8 1,023.7
Non-controlling interests 2.2 0.3 -1.1
Total 187.7 188.1 1,022.6
Earnings per share for profit attributable to the shareholders of the parent company, EUR
Basic earnings per share, EUR 0.36 0.37 2.00
Diluted earnings per share, EUR 0.36 0.37 1.99
Consolidated statement of comprehensive income
MEUR 1–3/2017 1–3/2016 1–12/2016
Net income 187.7 188.1 1,022.6
Other comprehensive income, net of tax:
Translation differences -3.8 -79.0 -23.2
Hedging of foreign subsidiaries 5.6 11.8 -8.6
Cash flow hedges 4.4 -1.0 -13.7
Items that may be subsequently reclassified to statement of income 6.2 -68.2 -45.5
Remeasurements of employee benefits -3.2 -15.1 -9.9
Items that will not be reclassified to statement of income -3.2 -15.1 -9.9
Total other comprehensive income, net of tax 3.0 -83.3 -55.3
Total comprehensive income 190.6 104.8 967.3
Total comprehensive income attributable to:
Shareholders of the parent company 188.4 104.5 968.4
Non-controlling interests 2.2 0.3 -1.1
Total 190.6 104.8 967.3
Consolidated statement of income
Q120
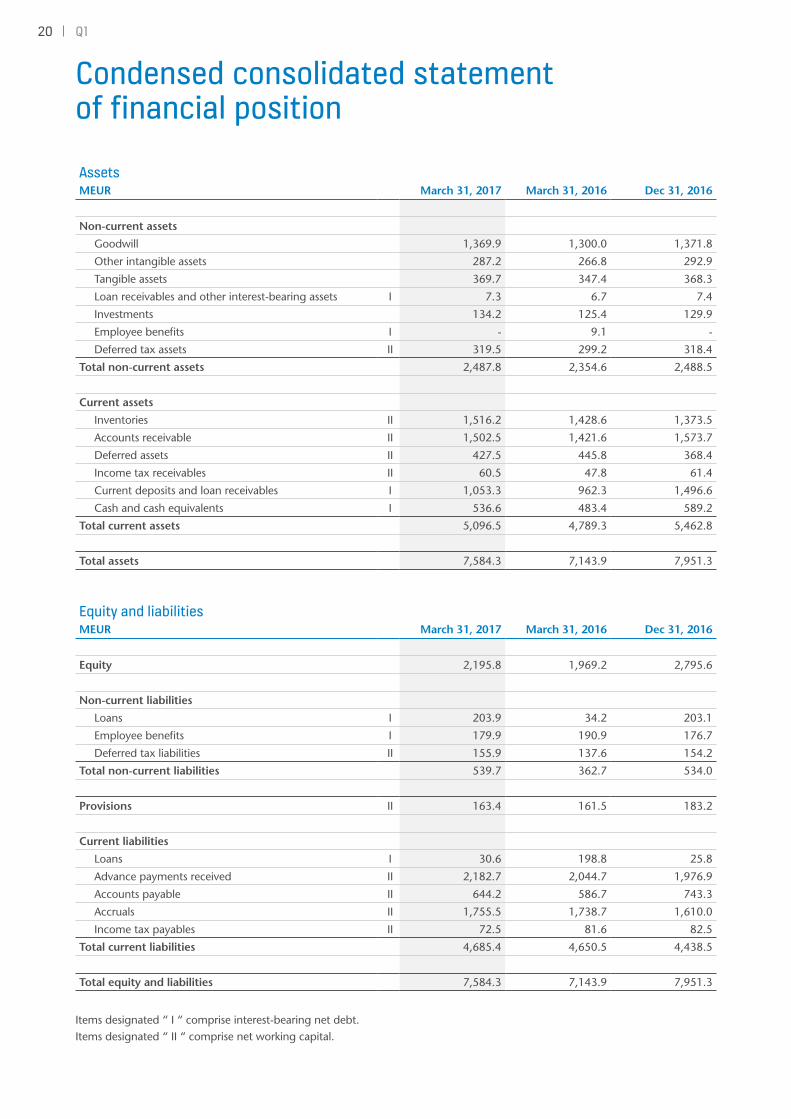
Condensed consolidated statement of financial position
Assets MEUR March 31, 2017 March 31, 2016 Dec 31, 2016
Non-current assets
Goodwill 1,369.9 1,300.0 1,371.8
Other intangible assets 287.2 266.8 292.9
Tangible assets 369.7 347.4 368.3
Loan receivables and other interest-bearing assets I 7.3 6.7 7.4
Investments 134.2 125.4 129.9
Employee benefits I - 9.1 -
Deferred tax assets II 319.5 299.2 318.4
Total non-current assets 2,487.8 2,354.6 2,488.5
Current assets
Inventories II 1,516.2 1,428.6 1,373.5
Accounts receivable II 1,502.5 1,421.6 1,573.7
Deferred assets II 427.5 445.8 368.4
Income tax receivables II 60.5 47.8 61.4
Current deposits and loan receivables I 1,053.3 962.3 1,496.6
Cash and cash equivalents I 536.6 483.4 589.2
Total current assets 5,096.5 4,789.3 5,462.8
Total assets 7,584.3 7,143.9 7,951.3
Equity and liabilitiesMEUR March 31, 2017 March 31, 2016 Dec 31, 2016
Equity 2,195.8 1,969.2 2,795.6
Non-current liabilities
Loans I 203.9 34.2 203.1
Employee benefits I 179.9 190.9 176.7
Deferred tax liabilities II 155.9 137.6 154.2
Total non-current liabilities 539.7 362.7 534.0
Provisions II 163.4 161.5 183.2
Current liabilities
Loans I 30.6 198.8 25.8
Advance payments received II 2,182.7 2,044.7 1,976.9
Accounts payable II 644.2 586.7 743.3
Accruals II 1,755.5 1,738.7 1,610.0
Income tax payables II 72.5 81.6 82.5
Total current liabilities 4,685.4 4,650.5 4,438.5
Total equity and liabilities 7,584.3 7,143.9 7,951.3
Items designated “ I “ comprise interest-bearing net debt.Items designated “ II “ comprise net working capital.

21Q1
Consolidated statement of changes in equity
MEUR Shar
e ca
pit
al
Shar
e
pre
miu
m
acco
unt
Paid
-up
un
rest
rict
ed
equi
ty r
eser
ve
Fair
val
ue
and
oth
er
rese
rves
Tran
slat
ion
d
iffe
ren
ces
Rem
easu
rem
ents
of
em
plo
yee
ben
efits
Ow
n
shar
es
Ret
ain
ed
earn
ing
s
Net
inco
me
fo
r th
e p
erio
d
Non
-con
trol
ling
in
tere
sts
Tota
l eq
uity
Jan 1, 2017 65.8 100.3 166.1 -29.9 240.3 -113.5 -236.7 2,590.5 12.7 2,795.6
Net income for the period 185.4 2.2 187.7
Other comprehensive income:Translation differences -3.8 -3.8Hedging of foreign subsidiaries 5.6 5.6Cash flow hedges 4.4 4.4Remeasurements of employee benefits -3.2 -3.2
Transactions with shareholders and non-controlling interests:
Profit distribution -795.4 -795.4Increase in equity (option rights) -Purchase of own shares -Change in non-controlling interests -0.3 -0.3Option and share-based compensation 3.3 1.9 5.2
March 31, 2017 65.8 100.3 169.4 -25.5 242.1 -116.7 -236.7 1,797.0 185.4 14.6 2,195.8
MEUR Shar
e ca
pit
al
Shar
e
pre
miu
m
acco
unt
Paid
-up
un
rest
rict
ed
equi
ty r
eser
ve
Fair
val
ue
and
oth
er
rese
rves
Tran
slat
ion
d
iffe
ren
ces
Rem
easu
rem
ents
of
em
plo
yee
ben
efits
Ow
n
shar
es
Ret
ain
ed
earn
ing
s
Net
inco
me
fo
r th
e p
erio
d
Non
-con
trol
ling
in
tere
sts
Tota
l eq
uity
Jan 1, 2016 65.7 100.3 140.7 -16.2 272.1 -103.6 -210.6 2,279.1 48.0 2,575.5
Net income for the period 187.8 0.3 188.1
Other comprehensive income:Translation differences -79.0 -79.0Hedging of foreign subsidiaries 11.8 11.8Cash flow hedges -1.0 -1.0Remeasurements of employee benefits -15.1 -15.1
Transactions with shareholders and non-controlling interests:
Profit distribution -718.2 -718.2Increase in equity (option rights) -Purchase of own shares -Change in non-controlling interests 1.7 1.7Option and share-based compensation 5.5 5.5
March 31, 2016 65.7 100.3 140.7 -17.2 204.9 -118.7 -210.6 1,566.3 187.8 50.0 1,969.2

Q122
Consolidated statement of changes in equity
MEUR Shar
e ca
pit
al
Shar
e
pre
miu
m
acco
unt
Paid
-up
un
rest
rict
ed
equi
ty r
eser
ve
Fair
val
ue
and
oth
er
rese
rves
Tran
slat
ion
d
iffe
ren
ces
Rem
easu
rem
ents
of
em
plo
yee
ben
efits
Ow
n
shar
es
Ret
ain
ed
earn
ing
s
Net
inco
me
fo
r th
e p
erio
d
Non
-con
trol
ling
in
tere
sts
Tota
l eq
uity
Jan 1, 2016 65.7 100.3 140.7 -16.2 272.1 -103.6 -210.6 2,279.1 48.0 2,575.5
Net income for the period 1,023.7 -1.1 1,022.6
Other comprehensive income:Translation differences -23.2 -23.2Hedging of foreign subsidiaries -8.6 -8.6Cash flow hedges -13.7 -13.7Remeasurements of employee benefits -9.9 -9.9
Transactions with shareholders and non-controlling interests:
Profit distribution -718.2 -718.2Increase in equity (option rights) 0.1 18.3 18.4Purchase of own shares -39.3 -39.3Change in non-controlling interests 9.1 -34.2 -25.1Option and share-based compensation 7.1 13.1 -3.1 17.1
Dec 31, 2016 65.8 100.3 166.1 -29.9 240.3 -113.5 -236.7 1,566.7 1,023.7 12.7 2,795.6

23Q1
MEUR 1–3/2017 1–3/2016 1–12/2016
Operating income 217.7 221.4 1,293.3
Change in working capital before financing items and taxes 59.2 58.8 109.7
Depreciation and amortization 28.4 25.5 106.5
Cash flow from operations before
financing items and taxes 305.3 305.7 1,509.5
Cash flow from financing items and taxes -50.0 -38.7 -331.0
Cash flow from operating activities 255.3 267.0 1,178.4
Cash flow from investing activities -27.0 -53.6 -197.6
Cash flow after investing activities 228.4 213.4 980.8
Purchase of own shares - - -39.3
Increase in equity (option rights) - - 18.4
Profit distribution -729.8 -658.4 -718.2
Change in deposits and loans receivable, net 443.1 375.8 -154.2
Change in loans payable and other interest-bearing debt 4.7 4.4 -20.9
Changes in non-controlling interests - - -26.7
Cash flow from financing activities -282.0 -278.1 -941.0
Change in cash and cash equivalents -53.6 -64.8 39.8
Cash and cash equivalents at beginning of period 589.2 552.7 552.7
Translation difference 1.0 -4.5 -3.3
Cash and cash equivalents at end of period 536.6 483.4 589.2
CHANGE IN INTEREST-BEARING NET DEBT
MEUR 1–3/2017 1–3/2016 1–12/2016
Interest-bearing net debt at beginning of period -1,687.6 -1,512.6 -1,512.6
Interest-bearing net debt at end of period -1,182.8 -1,037.6 -1,687.6
Change in interest-bearing net debt 504.8 475.0 -175.0
Condensed consolidated statement of cash flows
Q124
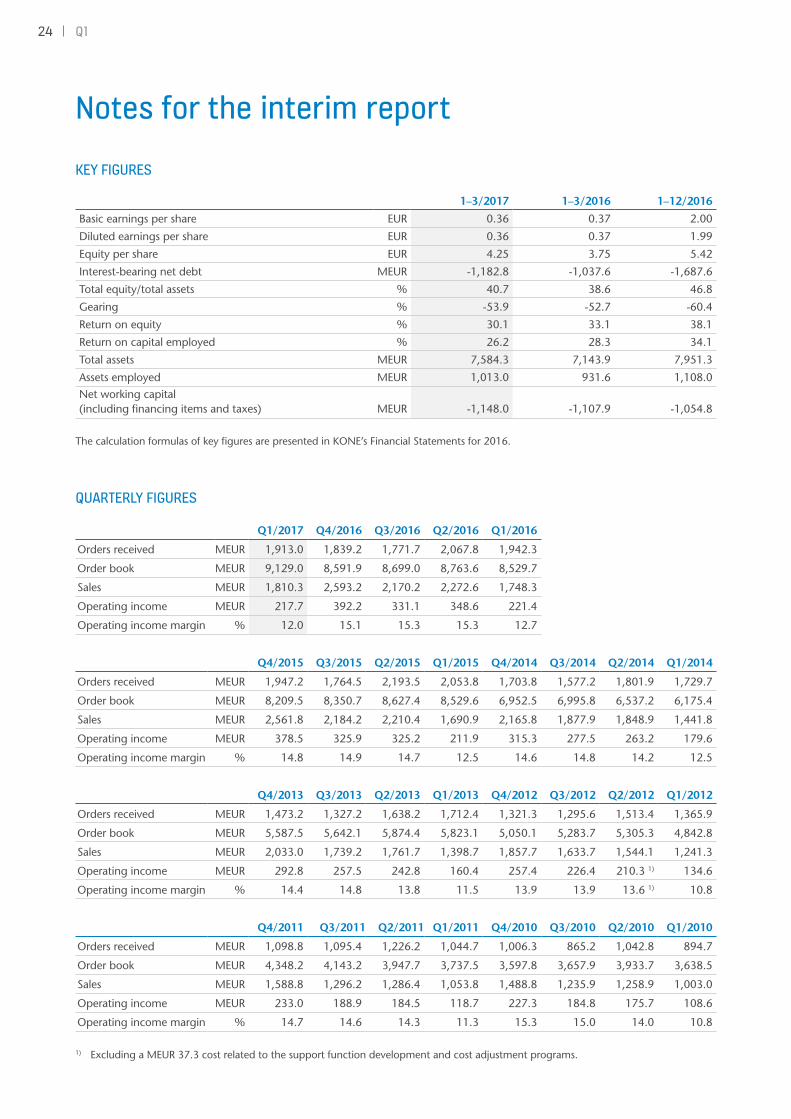
KEY FIGURES
1–3/2017 1–3/2016 1–12/2016
Basic earnings per share EUR 0.36 0.37 2.00
Diluted earnings per share EUR 0.36 0.37 1.99
Equity per share EUR 4.25 3.75 5.42
Interest-bearing net debt MEUR -1,182.8 -1,037.6 -1,687.6
Total equity/total assets % 40.7 38.6 46.8
Gearing % -53.9 -52.7 -60.4
Return on equity % 30.1 33.1 38.1
Return on capital employed % 26.2 28.3 34.1
Total assets MEUR 7,584.3 7,143.9 7,951.3
Assets employed MEUR 1,013.0 931.6 1,108.0Net working capital (including financing items and taxes) MEUR -1,148.0 -1,107.9 -1,054.8
The calculation formulas of key figures are presented in KONE’s Financial Statements for 2016.
QUARTERLY FIGURES
Q1/2017 Q4/2016 Q3/2016 Q2/2016 Q1/2016
Orders received MEUR 1,913.0 1,839.2 1,771.7 2,067.8 1,942.3
Order book MEUR 9,129.0 8,591.9 8,699.0 8,763.6 8,529.7
Sales MEUR 1,810.3 2,593.2 2,170.2 2,272.6 1,748.3
Operating income MEUR 217.7 392.2 331.1 348.6 221.4
Operating income margin % 12.0 15.1 15.3 15.3 12.7
Q4/2015 Q3/2015 Q2/2015 Q1/2015 Q4/2014 Q3/2014 Q2/2014 Q1/2014
Orders received MEUR 1,947.2 1,764.5 2,193.5 2,053.8 1,703.8 1,577.2 1,801.9 1,729.7
Order book MEUR 8,209.5 8,350.7 8,627.4 8,529.6 6,952.5 6,995.8 6,537.2 6,175.4
Sales MEUR 2,561.8 2,184.2 2,210.4 1,690.9 2,165.8 1,877.9 1,848.9 1,441.8
Operating income MEUR 378.5 325.9 325.2 211.9 315.3 277.5 263.2 179.6
Operating income margin % 14.8 14.9 14.7 12.5 14.6 14.8 14.2 12.5
Q4/2013 Q3/2013 Q2/2013 Q1/2013 Q4/2012 Q3/2012 Q2/2012 Q1/2012
Orders received MEUR 1,473.2 1,327.2 1,638.2 1,712.4 1,321.3 1,295.6 1,513.4 1,365.9
Order book MEUR 5,587.5 5,642.1 5,874.4 5,823.1 5,050.1 5,283.7 5,305.3 4,842.8
Sales MEUR 2,033.0 1,739.2 1,761.7 1,398.7 1,857.7 1,633.7 1,544.1 1,241.3
Operating income MEUR 292.8 257.5 242.8 160.4 257.4 226.4 210.3 1) 134.6
Operating income margin % 14.4 14.8 13.8 11.5 13.9 13.9 13.6 1) 10.8
Q4/2011 Q3/2011 Q2/2011 Q1/2011 Q4/2010 Q3/2010 Q2/2010 Q1/2010
Orders received MEUR 1,098.8 1,095.4 1,226.2 1,044.7 1,006.3 865.2 1,042.8 894.7
Order book MEUR 4,348.2 4,143.2 3,947.7 3,737.5 3,597.8 3,657.9 3,933.7 3,638.5
Sales MEUR 1,588.8 1,296.2 1,286.4 1,053.8 1,488.8 1,235.9 1,258.9 1,003.0
Operating income MEUR 233.0 188.9 184.5 118.7 227.3 184.8 175.7 108.6
Operating income margin % 14.7 14.6 14.3 11.3 15.3 15.0 14.0 10.8
1) Excluding a MEUR 37.3 cost related to the support function development and cost adjustment programs.
Notes for the interim report

25Q1
Net working capital
MEUR March 31, 2017 March 31, 2016 Dec 31, 2016Net working capital
Inventories 1,516.2 1,428.6 1,373.5
Advance payments received -2,182.7 -2,044.7 -1,976.9
Accounts receivable 1,502.5 1,421.6 1,573.7
Deferred assets and income tax receivables 488.0 493.6 429.8
Accruals and income tax payables -1,828.0 -1,820.3 -1,692.5Provisions -163.4 -161.5 -183.2Accounts payable -644.2 -586.7 -743.3
Net deferred tax assets/liabilities 163.6 161.6 164.1Total net working capital -1,148.0 -1,107.9 -1,054.8
Key exchange rates in euros
March 31, 2017 March 31, 2016Income
statementStatement of
financial positionIncome
statementStatement of
financial position
Chinese Renminbi RMB 7.3399 7.3642 7.1821 7.3514US Dollar USD 1.0646 1.0691 1.1020 1.1385British Pound GBP 0.8565 0.8555 0.7689 0.7916Australian Dollar AUD 1.4146 1.3982 1.5088 1.4807
Derivatives
Fair values of derivative financial instruments Derivative assets
Derivative liabilities
Fair value,net
Fair value,net
Fair value,net
MEURMarch 31,
2017March 31,
2017March 31,
2017March 31,
2016Dec 31,
2016
Foreign exchange forward contracts and swaps 31.3 -27.3 4.1 -19.0 -6.0
Electricity price forward contracts - -0.5 -0.5 -1.1 -0.4
Total 31.3 -27.8 3.5 -20.2 -6.4
Nominal values of derivative financial instrumentsMEUR March 31, 2017 March 31, 2016 Dec 31, 2016
Foreign exchange forward contracts and swaps 2,685.0 2,532.8 2,629.3
Electricity price forward contracts 1.4 2.3 1.6
Total 2,686.4 2,535.1 2,630.9
Q126
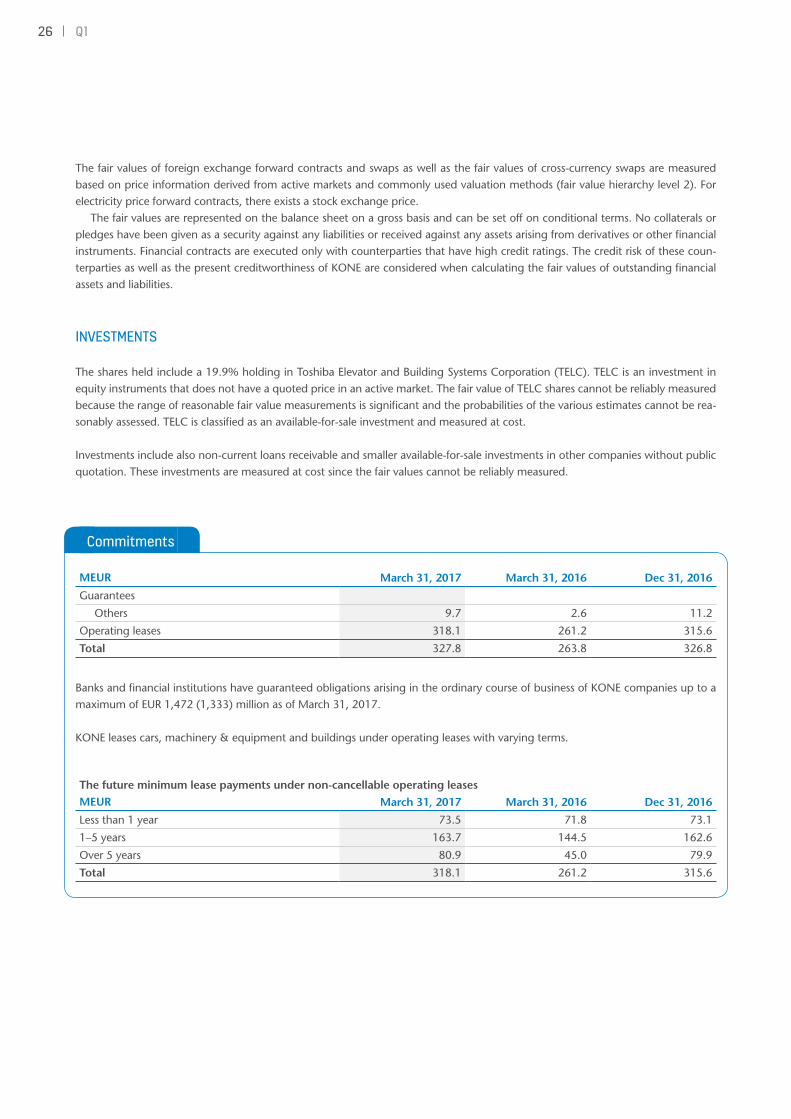
The fair values of foreign exchange forward contracts and swaps as well as the fair values of cross-currency swaps are measured based on price information derived from active markets and commonly used valuation methods (fair value hierarchy level 2). For electricity price forward contracts, there exists a stock exchange price.
The fair values are represented on the balance sheet on a gross basis and can be set off on conditional terms. No collaterals or pledges have been given as a security against any liabilities or received against any assets arising from derivatives or other financial instruments. Financial contracts are executed only with counterparties that have high credit ratings. The credit risk of these coun-terparties as well as the present creditworthiness of KONE are considered when calculating the fair values of outstanding financial assets and liabilities.
INVESTMENTS
The shares held include a 19.9% holding in Toshiba Elevator and Building Systems Corporation (TELC). TELC is an investment in equity instruments that does not have a quoted price in an active market. The fair value of TELC shares cannot be reliably measured because the range of reasonable fair value measurements is significant and the probabilities of the various estimates cannot be rea-sonably assessed. TELC is classified as an available-for-sale investment and measured at cost.
Investments include also non-current loans receivable and smaller available-for-sale investments in other companies without public quotation. These investments are measured at cost since the fair values cannot be reliably measured.
Commitments
MEUR March 31, 2017 March 31, 2016 Dec 31, 2016
Guarantees
Others 9.7 2.6 11.2
Operating leases 318.1 261.2 315.6
Total 327.8 263.8 326.8
Banks and financial institutions have guaranteed obligations arising in the ordinary course of business of KONE companies up to a maximum of EUR 1,472 (1,333) million as of March 31, 2017.
KONE leases cars, machinery & equipment and buildings under operating leases with varying terms.
The future minimum lease payments under non-cancellable operating leasesMEUR March 31, 2017 March 31, 2016 Dec 31, 2016
Less than 1 year 73.5 71.8 73.1
1–5 years 163.7 144.5 162.6
Over 5 years 80.9 45.0 79.9
Total 318.1 261.2 315.6

KONE Corporation
Corporate OfficesKeilasatama 3P.O. Box 7FI-02150 Espoo, FinlandTel. +358 (0)204 751Fax +358 (0)204 75 4496
www.kone.com
For further information please contact:Sanna KajeVice President, Investor RelationsTel. +358 (0)204 75 4705
KONE as a companyAt KONE, our mission is to improve the flow of urban life. As a global leader in the elevator and escalator industry, KONE provides elevators, escalators and automatic building doors, as well as solutions for maintenance and modernization to add value to buildings throughout their life cycle. Through more effective People Flow®, we make people’s journeys safe, convenient and reliable, in taller, smarter buildings. In 2016, KONE had annual net sales of EUR 8.8 billion, and at the end of the year over 52,000 employees. KONE class B shares are listed on the Nasdaq Helsinki Ltd. in Finland. www.kone.com
This bulletin contains forward-looking statements that are based on the current expectations, known factors, decisions and plans of the management of KONE. Although the management believes that the expectations reflected in such forward-looking statements are reasonable, no assurance can be given that such expectations will prove to be correct. Accordingly, results could differ materially from those implied in the forward-looking statements as a result of, among other factors, changes in economic, market and competitive conditions, changes in the regulatory environment and other govern-ment actions as well as fluctuations in exchange rates.
KONE’s financial reporting schedules 2017
Interim Report January 1–June 30, 2017 Wednesday, July 19, 2017Interim Report January 1–September 30, 2017 Thursday, October 26, 2017 KONE Capital Markets Day Friday, September 29, 2017


