ReportNo. 16211 -KO Korea Impact Evaluation Report DelayedDevelopment of the Cholla Region: An Institutional Study December 31, 1996 Operations EvaluationDepartment u Documnent of the WorWd Bank Public Disclosure Authorized Public Disclosure Authorized Public Disclosure Authorized Public Disclosure Authorized Public Disclosure Authorized Public Disclosure Authorized Public Disclosure Authorized Public Disclosure Authorized
Transcript
Report No. 16211 -KO
KoreaImpact Evaluation ReportDelayed Development of the Cholla Region:An Institutional Study
December 31, 1996
Operations Evaluation Department
u
Documnent of the WorWd Bank
Pub
lic D
iscl
osur
e A
utho
rized
Pub
lic D
iscl
osur
e A
utho
rized
Pub
lic D
iscl
osur
e A
utho
rized
Pub
lic D
iscl
osur
e A
utho
rized
Pub
lic D
iscl
osur
e A
utho
rized
Pub
lic D
iscl
osur
e A
utho
rized
Pub
lic D
iscl
osur
e A
utho
rized
Pub
lic D
iscl
osur
e A
utho
rized
Currency Equivalents
Currency Unit = WonUS$1.00 = Won 814 (July 1996)Won 1.00 = US$0.0012
Abbreviations and Acronyms
CPI Consumer Price IndexEDI Economic Development InstituteERR Economic Rate of ReturnGAO General Accounting OfficeGDP Gross Domestic ProductGNP Gross National ProductGRP Gross Regional ProductIDD Industrial Development DivisionIER Impact Evaluation ReportKCDI Kwangju-Chunnam Development InstituteKIET Korea Institute for Industrial Economics and TradeKLDC Korea Land Development CorporationKRIHS Korea Research Institute for Human SettlementsLG Lucky-Goldstar, Ltd.MOC Ministry of Construction (now MOCT)MOCT Ministry of Construction and TransportationOED Operations Evaluation DepartmentPCR Project Completion ReportSAR Staff Appraisal ReportSCP South Cholla Province
Fiscal Year
January I - December 31
Vice President Robert PicciottoDirector Francisco Aguirre-SacasaDivision Yves AlbouyStaff Member Kyu Sik Lee
FOR OFFICIAL USE ONLYThe World Bank
Washington, D C 20433U.S A
Office of the Director-GeneralOperations Evaluation
MEMORANDUM TO THE EXECUTIVE DIRECTORS AND THE PRESIDENT
SUBJECT: Impact Evaluation Report on KoreaDelayed Development of the Cholla RegionSecondary Cities Regional Project (Loan 1070-KO)Second Gwangju Regional Project (Loan 1758-KO)Jeonju Regional Development Project (Loan 2388-KO)
Attached is the Impact Evaluation Report (IER) on the above mentioned regional developmentprojects in the Cholla region. The main objective of the impact evaluation was to assess the medium andlong-term impacts of the projects, five to fifteen years after completion. The study focused on (i) industrialdevelopment in the region; (ii) institutional leaming at both the national and local levels of government; and(iii) the impact of bridges on the development of island economies.
The Cholla region did not develop early on because of the policy bias of the national government.The Govemment played an important role in the first two decades of Korea's development, but the people ofCholla were excluded from participating in the process of development and institutional learning until the1980s. This study offered an opportunity to examine the nexus of the role of government, of institutions,and development in Cholla as a specific case study, since, by default, Cholla could be viewed as a"controlled area" in the early phase of Korea's development "experiment."
Tlhe study documents that the Bank intervention acted as a catalyst in triggering the industrializationprocess in the Gwangju area. It made a strong and positive impact on the development of the islandeconomies: by linking the Tolsan Island to Yeosu city, the bridge expanded the urban area of Yeosu andhelped transform Tolsan into an urban community; the Chindo bridge brought a significant change to theChindo Island's economy by increasing the share of cash crops for export to the mainland. Institutionaldevelopment was substantial at all levels of government. The overall project impacts are expected to besustained.
The study showed the "centrality of side-effects" in project-induced development. The projects'success and spillover effects over time in Gwangju were due to a series of side-effects which contributed tothe growth, expansion, and sustainability of the projects: (i) The local authorities learned how to plan,finance, build and operate a large-scale industrial estate, and executed three more estates after the initialBank-financed project was completed. Backward and forward industrial linkages were established. (ii) Theextension of the first industrial estate to the second phase by the city alone was a significant turning pointfor the city government's institutional learning which involved manv organizational changes and improvedits capacity and quality of project management. (iii) New rules. through a series of devolition andderegulation, changed the incentive structure to the benefit of the industrialists, and resulted in closecooperation and coordination between the local governments and the private sector.
Regional Bias in Korea's Development ......................................................... IIKorea's Experience with Industrial Location Policy ......................................................... I IWorld Bank Projects Description ......................................................... 12Rationale and Objectives of the Study ......................................................... 13Scope of the Study and Two Distinct Approaches ......................................................... 13Information and Data Collection ......................................................... 14
PART I. INDUSTRIAL DEVELOPMENT AND INSTITUTIONAL LEARNING
2. Direct Impacts: "Triggering" the Industrialization Process .............................................. 15
Baseline Conditions in the 1970s ......................................................... 15Evaluation Framework ......................................................... 16Impact on Industrial Infrastructure: Hanam Phase I ....................................................... 18Impact on Manufacturing ......................................................... 19
Manufacturing Establishment Survey Results ........................................................... 20Impact on National-Local Government Relations and Management Capacity ................ 22Impact on Public-Private Sector Interaction ......................................................... 23
3. Side Effects and Spillovers ............................................................... 25
Industrial Base and Linkages ......................................................... 25Industrial Infrastructure: Hanam II, III, and Pyung-Dong Follow-up Projects ......... 25Backward and Forward Industrial Linkages ..................................... 26
Local Bureaucracy's Behavior and Capacity Building ..................................... 28"Rules of the Game", Private Sector Confidence, and Public-Private Partnership .......... 29Ultimate Impact: Regional Growth ......................................................... 30Necessary Conditions for Success ......................................................... 32A Caveat on Attribution ......................................................... 33
4. Lessons from Industrial Development ............................................................... 35
Centrality of Side-Effects: the Hirschman Effect ......................................................... 35"Rules of the Game" and Private Sector Responses: the Baumol Effect .......................... 35"Piloting" and "Mainstreaming" .......................................................... 36
This Report was prepared by Mr. Kyu Sik Lee (Task Manager), Mr. Roy Gilbert (consultant), and astudy team at the Kwangju-Chunnam Development Institute consisting of Messrs. Chang Soo Moon(President), Jong-Pyung Jeon (Team Leader), Jae-Oh Kim, and Sangho Kim; and Messrs. Dong Ho Shinand Yang-Jae Lee at Wonkwang University in Iksan, Korea. Ms. Stacy Ward provided administrativeassistance.
2
Shortcomings of Industrial Estate Development Strategy . ............................... 36Transferability ............................................ . 37
PART II. INTEGRATING ISLAND ECONOMIES INTO REGIONAL DEVELOPMENT
5. Project Rationale for Improved Transport Linkages .................................................. 39
Island Development: The Baseline ............................................. 39Evaluation Framework ............................................. 40
6. Tolsan Island: A New Threshold for Urban Development .................................................. 43
A Solution to Yeosu City's Acute Shortage of Urban Land ............................................ 43Transforming Tolsan's Population into an Urban Community ......................................... 43New Patterns of Urban Living on Tolsan Island ............................................ 45Increased Tourism ............................................ 47Bridge Impact Upon Activities in Rural Areas ............................................ 48Environmental Impacts ............................................ 49Impacts Upon Local Government ............................................ 49Need for Complementary Infrastructure ............................................ 50Economic Rate of Return ............................................ 50
7. Chindo Island: Incorporating as Part of the Mainland ................................................... 51
Chindo: No Longer an Island .................................................. 51Restructuring Chindo's Rural Economy .................................................. 51Impact Upon Islanders' Standard of Living ............ ........................ ............ 52Modest Urban Development Impacts .................................................. 54Accelerated Out-Migration .................................................. 54Impact on Tourism .................................................. 55Environmental and Social Vulnerability .................................................. 56Impacts Upon Local Government .................................................. 56Is Chindo Better or Worse-off9 .................................................. 56Economic Rate of Return .................................................. 57
8. Lessons from Integrating Island Economies .................................................. 59
1. Statistical Tables .................................................. 652. Project Description and Timelines .................................................. 833. Institutional Development Timelines .................................................. 914. Summary of Establishment Survey Results .................................................. 955. Study Questionnaire .................................................. 1156. List of People Interviewed .................................................. 127
Map IBRD No. 28484
3
Preface
This is an Impact Evaluation Report (IER) for three World Bank supported regional developmentprojects in Korea: Secondary Cities Regional Project (Loan 1070); Second Gwangju Regional Project (Loan1758); and Jeonju Regional Development Project (Loan 2388).1 The main objective of the impactevaluation study was to assess the projects' medium and long-term impacts, five to fifteen years after thecompletion of the projects.
The Bank-supported regional development program in Korea was unique in that no such sustainedefforts extending over a period of two decades can be found elsewhere. Among more than twenty projectcomponents included, this study focused on (i) industrial development in the Cholla region; (ii) institutionallearning at both national and local levels of government; and (iii) development of island economies viabridge connections.
The IER was prepared by the Operations Evaluation Department (OED) of the World Bank. Thestudy was launched during the first impact evaluation mission to Korea in June 1995. A local study team atthe Kwangju-Chonnam Development Institute participated in all phases of the study: formulatinghypotheses, collecting the data, participating in informant interviews, and providing inputs to drafting thereport. During the second mission in February 1996, a preliminary draft report was discussed with the localteam and government officials, and additional information needed was collected.
The kind assistance and cooperation for this study given by the local government officials in projectcities, the officials of the Ministry of Construction and Transportation in Seoul and Iksan, members of localChambers of Commerce and Industry, local industrialists, and researchers are gratefully acknowledged. Inparticular, the staff of the Korea Research Institute for Human Settlements (KRIHS) interacted with thestudy mission and provided invaluable information. The staff of the Korea Institute for IndustrialEconomics and Trade (KIET) kindly provided regional data for key economic variables used in the study.
The study results were reviewed and discussed at an internal seminar held at the Kwangju-Chonnam Development Institute, and also presented at a 1977 World Development Report workshop on the"Role of the State in Development" in Tokyo in October 1996.
Basic Loan DataLn Number Project Name US$ million Approval Completion
1. Henceforth these three projects will be referred to as Kwangju I (Loan 1070), Kwangju 11 (Loan 1758) and Chonju project (Loan2388). Current English names of the cities are used in this report: Kwangju and Chonju instead of Gwangju and Jeonju.
5
Evaluation Summary
"Nothing is lasting without institutions."
Jean MonnetBackground
1. Korea's "economic miracle" has diverted attention from a heavy regional bias in Korea'sdevelopment strategy stretching over three decades from the 1960s to the 1980s. The Cholla region laggedbehind the impressive economic development that was taking place in other parts of Korea. Any significantinfrastructure investment for industrial development did not come into South Cholla province until the early1980s, 20 years behind the rival Kyungsang provinces (paras. 2.5-2.6). Today, Kwangju, the capital city ofSouth Cholla province, is the fastest growing city in Korea with its population increasing at a rate of 4.5percent per year. Moreover, Kwangju is the only city, among the six largest cities in Korea, which isgaining manufacturing employment (para. 3.21). This study attempts to document the process ofdevelopment of the region during the past two decades based on the experiences of World Bank financedprojects, identifying the elements of success, and drawing lessons to be learned.
2. That the Cholla region was not developing early on was not a manifestation of the traditionalcharacteristics of a "lagging region", a resource-poor region without any potentiaF for development.Cholla's case was largely due to the policy bias of the national government in Korea's development. TheWorld Bank (1993) sponsored study on the East Asian Miracle documented that the Government played animportant role at the early stages of Korea's economic development. It created the necessary "rules of thegame", i.e., the institutional framework for the private sector to respond and grow, that is, it filled the"institutional vacuum" created after the Korean war. But such vacuum continued to prevail in Cholla for along time, and the people of Cholla were excluded from participating in the process of development andinstitutional learning. This study offered an opportunity to examine the nexus of the role of government,institutions and development in Cholla as a specific case study, since, by default, Cholla can be viewed as a"controlled area" in the Korean development "experiment".
The Projects
3. The main objectives of the three projects were to support the government's efforts to develop theCholla region and reduce inter-regional disparities. Kwangju I, the first World Bank financed regionaldevelopment project world-wide, actually initiated Korea's first regional investment program as a pilotproject. Kwangju II and the Chonju project explicitly aimed at industrial development through investmentin industrial estates and increasing employment and income of island population, while Kwangju I waslimited to improving urban infrastructure including housing and roads. Even though all three projects werecomplex, together covering seven cities, five islands, and two provinces, and with a total of 22 projectcomponents, most of the physical targets were met and institutional development .was substantial, one of theareas covered in this study.
4. The main hypothesis tested in this study is that the. govemment-invited World Bank intervention"triggered" the industrialization process in South Cholla (para 2.7) and that it brought the opportunity toextend the "rules of the development game" to the region. This study shows that "setting institutions right"was a condition perhaps more crucial for development than "setting the prices right".
5. The study confirms the Baumol and North's framework for "institutional analysis" that asserts:
6
The rules of the game that specify the relative payoffs to different entrepreneurial activities play akey role in determining whether entrepreneurship will be allocated in productive or unproductivedirections and that this can significantly affect the vigor of the economy's growth (Baumol, 1990, p.918).
In his Nobel Prize lecture, North stated that:
It is the interaction between institutions and organizations that shapes the institutional evolution ofan economy. If institutions are the rules of the game, organizations and their entrepreneurs are theplayers.. .if the institutional framework rewards productive activities then organizations-firms-will come into existence to engage in productive activities (North, 1994, p. 361).
Scope of the Study
6. The study assesses (i) "direct" project impacts on the beneficiaries as anticipated by the projects,and (ii) long-term "side-effects" on the industrialization process and institutional learning. Part I of thereport covers "industrial development" and "institutional learning" using a case study approach (para. 1.18).Part II which covers the impacts of bridges on the island economies, not only relies on historical data tocompare the before and after the project conditions, but also contrasts the "project" islands with otherislands.
Findings
7. In the case of industrial development and institutional learning (Part I), the key findings are asfollows (para. 2.13):
(i) Industrial infrastructure expanded more than five times the original investment of the HanamIndustrial Estate component of Kwangju II. The Kwangju city government, without the I-elp of thenational government or the World Bank, replicated the Hanam component in a second and thirdphases, and in a fourth phase at Pyung Dong during a ten-year period (paras. 3.2-3.6).
(ii) A solid industrial base has been established in Kwangju with backward and forward industriallinkages (paras. 3.7-3.9). In 1995, 39 percent of manufacturing jobs in Kwangju were at Hanam,and 44 percent of manufacturing output and 60 percent of exports were produced by firms inHanam (para. 3.29).
(iii) Local government management capacity reached the level of sophistication needed to supporta rapid industrialization process. The local govemment officials became "task-oriented" as thepartners of economic development of the region (paras. 3.10-3.11). The management capacity ofKwangju city officials now equals that of other cities in Korea (paras. 3.14-3.15).
(iv) The "rules of the game" (government bureaucracy and regulations) became more conducive toprivate investment and growth (paras. 3.16-3.17). They evolved from those of a nationalgovernment-directed to those of a local government- and market-based development with strongprivate sector responses in the region. The diminishing role of the Hanam Management Office atthe site, which left most of its previous functions to the markets, is a strong indication of thatevolution over the decade (para. 3.20).
8. In the case of integrating the island economies into regional development (Part II), the majorfindings are as follows:
7
(i) By linking the Tolsan Island to Yeosu city, the bridge expanded the urban area of Yeosu, adynamic medium-sized city facing acute land constraints. The bridge helped transform Tolsan intoan urban community linked to Yeosu. Daily commuting from the island to the city became feasibleand efficient after the bridge (para. 6.3). Far from arresting out-migration, though, the bridgeappears to have accelerated it from Tolsan (para. 6. 7), but population decline, including debilitatedfamily structures following the departure of younger breadwinners, was more serious on otherislands still unconnected by bridges. After the bridge, Tolsan islanders enjoyed ease of access tourban services that other islanders didn't have (paras. 6.10-6.13). There has been a real estate boomon Tolsan (para. 6.14). Tourism flows have increased dramatically there as have services on theisland for visitors (paras. 6.16-6.17). Entirely new lines of business, such as floriculture, appearednow that perishable products like fresh flowers can be reliably exported from the island (para.620).
(ii) In the case of Chindo Island, an important side-effect of the bridge was to re-structure theisland economy giving it characteristics typical of a rural economy on the mainland. Laborintensive subsistence farming was replaced by the more mechanized production of cash crops,which could be reliably and more cheaply exported from the island (paras. 7.5-7.6). Land prices onthe island increased dramatically when compared with the sluggish real estate of other islands stillunconnected by bridges (para. 7.9). As happened in Tolsan, an indirect impact of the bridge toChindo was to accelerate out-migration (paras. 7.11-7.12). Tourism expanded dramatically withthe bridge, although with some negative environmental side effects (paras. 7.13-7.16). But on thewhole, the island population is better off today than before the bridge was opened.
Lessons
9. Centrality of Side-effects. This study shows the "centrality of side-effects" in the project-induceddevelopment as noted by Hirschman. The project's success and its spillover effects over time was due to aseries of side-effects which contributed to the growth, expansion and sustainability of the project, whichincluded:
(i) Replicating Industrial Estates: The local authorities learned how to plan, finance, build andoperate large-scale industrial estates on the model of the Hanam Phase I and they executedthree more large-scale industrial estate projects (paras. 3.2-3.6).
(ii) Backward and Forward Industrial Linkages: Satellite industries have been established inHanam. With a strong locational advantage of being near the parent industry, they use as aprincipal input an output of the parent industry or their principal outputs are used as aninput of the parent industry (paras. 3.7-3.9).
(iii) "Task-oriented" Bureaucratic Behavior: The extension of Hanam I to the second phasewithout the help of MOC or the World Bank was a significant turning point for the citygovernment's institutional learning. Local governments' responsibilities grew rapidly aspromoters and partners of industrial development (paras. 3.10 -3.11).
(iv) Evolution of Local Government Organization and Capacity Building: City govemmentsmade many internal changes to their organizations to help change the rules and providemore incentives for industrialists to invest (paras. 3.12-3.13). Moreover, through theimplementation of Bank-financed projects, local government officials improved thecapacity and quality of project management (paras. 3.14-3.15).
8
(v) Private Sector Confidence and Public-Private Partnership: With a series of devolutionand deregulation, local governments assumed responsibilities as guarantors and managersof "rules of the manufacturing game" for private industrial development (paras. 3.16-3.18).Local governments' passion and commitment to industrial development in the region,
together with changing regulatory and institutional environment, enhanced the privatesector's confidence in the local governments and a strong public-private partnershipemerged (paras. 3.19-3.20).
10. Importance of the "Rules of the Game ". The new rules, through a series of devolution andderegulation over time, changed the incentive structure to the benefit of the industrialists. They alsochanged the behavior of the bureaucracy and led to the creation of an enabling environment where closecooperation and coordination between the local government and the private sector materialized. These side-effects were initially triggered by the Bank-financed projects. They became central to the economicdevelopment in the Kwangju region. The project strengthened the growth- and task-oriented behavior ofgovernment officials. The Bank's 57 missions over twenty years provided a sustained period of institutionallearning at all levels of government.
11. "Piloting" and "mainstreaming". The modestly sized Bank project for Hanam Phase I served as a"pilot". It resulted in opportunities for the city government to pursue on its own the "mainstreaming" ofindustrial development with its follow-up projects.
12. Shortcomings of Industrial Estate Development Strategy.
The Incubator Hypothesis. Small new firms with five to ten employees tend to locate in the centralarea of cities to exploit all the benefits of externalities there (Lee, 1989). The project-financedindustrial estates are located outside the central city far away from the city center. They may nothelp reducing site constraints for small firms.
Costs of Location Distortion. When the land market is functioning efficiently, infrastructureinvestment tends to follow the market. When a large infrastructure project such as an industrialestate is put in place by the public sector as is this case, the following negative impacts could occur:
(i) Lack of Complementary Investments: The main road connection to Hanam estate was notexpanded until 1992. Most establishments in the Hanam Industrial Estate operate a large fleet ofcompany buses for workers' commuting because of the lack of public transportation. Whencomplementary investments were not included in the project design, such unintended negativeimpacts would result.
(ii) Negative Environmental Effects: Even though pollution control is strictly enforced, windblows toward the city center carrying smoke from the industrial areas.
(iii) Land Use Patterns: Because the cities grew and expanded rapidly, the industrial complexesare now close to the newly developed expanding commercial centers preventing further expansionof the cities outward.
13. Lessonsfrom Tolsan and Chindo Bridges. The lessons for integrating island economies as aninstrument of regional development policy are as follows:
9
(i) Territorial incorporation by building bridges is easy to achieve, but it may require ingenious andcostly engineering solutions.
(ii) Despite identical engineering solutions, long-term side-effects in urban and rural areas are quitedifferent: urban areas offer better prospects for economic returns as expected, but the territorialincorporation of rural islands could be justified as a national policy for equitable growth.
(iii) Public sector responses with investment in complementary infrastructure-access roads andutilities in particular-should be swift to realize long-term side effects to the maximum extent.
(vi) Forward looking plans should be made from the project planning stage onward. Such anexercise should include attempts to identify likely project impacts, opportunities for privateinvestment, and the needs for complementary infrastructure.
14. An important caveat of this case study is that it documents project impacts in a country with asustained economic growth. The same projects may fail to generate such impacts in a slow growingeconomy. Also, other regions of Korea developed early on without a similar World Bank intervention. Theprocess of "learning by doing" in other regions provided lessons for the Cholla region. Using a case study(historical) approach (para. 1.18) and the Hirschman-Baumol framework (paras. 2.8-2.10), however, thisstudy shows that the World Bank intervention acted as a catalyst in triggering the industrialization processin the Cholla region which had been excluded from Korea's development process in the first two decades.
15. On transferability. This report supports the proposition that the patterns of behavioral responses ofindividual actors to the rules of the game transcend time and places, i.e., regional or national boundaries.2
What varies across regions or countries is the quality of the rules of the game, for example, "the use ofincentives and organizational design within the public sector to enhance efficiency and to reduce thelikelihood of corruption" (Stiglitz, 1996, p. 174). Such an organizational design, however, can be learnedfrom experiences of other countries. The challenge is to find a mechanism, political or otherwise, to"trigger" the process of such organizational learning. Wade (1993) suggests that "... from time to timeopportunities to make major organizational changes do occur in any society, and at that time it matters whatknowledge of alternative arrangements key policy makers have in their heads." But such opportunities werecreated by policy makers themselves in Korea and other East Asian countries. They did not merely wait forthe opportunities to come.
2. Baumol (1990) shows historical evidence from Ancient Rome, Medieval China and through the Middle Ages.
11
1. Introduction
Regional Bias in Korea's Development
1.1 Korea's "economic miracle" diverted attention from a heavy regional bias in Korea'sdevelopment strategy stretching over three decades from the 1960s to the 1980s. The regional imbalancecan be attributed to two factors: (i) comparative advantage, and (ii) regional rivalry. Historically,Korea's industry and commerce developed along the Seoul-Pusan axis from the capital region in thenorthwestern part of the peninsula to the Kyungsang provinces in the southeast. These regions offeredcomparative advantages for industrial development, while the Cholla provinces in the southwestern partof the country relied on a rich and productive agricultural tradition.
1.2 The regional rivalry, going back a thousand years, intensified once the late President Park, anative of Kyungsang, came to power in 1961. His government ruled the country until 1979 and launchedalmost all major industrial development projects in the Kyungsang region, including the Ulsan IndustrialEstate (in 1962) where the Hyundai automobile plant and shipyards were established, the Pohang SteelMills (in 1971), and the Seoul-Pusan Expressway, the first major highway in Korea, which wascompleted in the early 1970s.
1.3 During the 1960s, industrial development began expanding from the capital region to theKyungsang region, while the southwestern region of Cholla provinces lagged. As the Korean economycontinued to expand at a real growth rate of nearly 10 percent per year, the regional income disparities,especially between the Cholla region and the Seoul and Kyungsang regions widened, the regional rivalrydeepened, and regional equity emerged as an important political issue. In 1975; 73 percent of SouthCholla's employment was in agriculture and fishery, the largest proportion among the nine provinces.3Only 6 percent was in manufacturing (Table A 1.1 )4
1.4. In parallel, popular anger and frustration rose in the Cholla provinces, especially in Kwangju, theprovincial capital of South Cholla. Distrust of local government and antagonism toward the nationalgovernment accentuated. Table A 1.2 shows a steady out-migration of population from the Cholla region.
Korea's Experience with Industrial Location Policy
1.5 Confronted with the increasing concentration of population and economic activity in the capitalregion, the Korean Government, as was the case in many other developing countries in the 1970s,implemented explicit spatial policies to decentralize population and employment to less developedregions. A previous World Bank sponsored study (Lee, 1985a, and 1985b; Lee and Choe, 1990)evaluated the effectiveness and impacts of such policies which were intended to influence the locationpatterns of manufacturing industries by various financial schemes to relocate industries to outlying areasor less developed regions.
1.6 The study found that the majority of relocating firms moved within the same region becausefirms find it very costly to move long distances. The 1982 manufacturing survey showed that of those
3. In this study, 15 geographic regions are used for comparative analysis: six "Direct Administration Cities" (Jikhalsi)-Seoul,Pusan, Taeku, Inchon, Kwangju, and Taechon-and nine provinces. The status of a Direct Administration City is equal to thatof a province.
4. Tables with an "A" in front of the number are in Annex 1.
12
moved, only 6.5 percent did so influenced by government incentives like tax breaks.5 Most moved forinternal reasons such as the need for more plant space. The study concluded that government spatialpolicies had a relatively minor impact on the location choices of manufacturing firms.
1.7 Since firms do not move long distances and relocation policies did not work, it was difficult forthe Kwangju region to attract industries from outside. The regional bias in infrastructure investmentmentioned above did not help attract industries to the Kwangju region. The establishment of the HanamIndustrial Estate as part of the World Bank project became a turning point in "triggering" the process ofindustrial development in the region, as documented below.
World Bank Projects Description
1.8 In 1972, the Korean government requested assistance from the World Bank in developing SouthCholla, then the poorest region in Korea, to attract employment generating industries. The SecondaryCities Regional-Project (Loan 1070), approved in 1975, was followed by a Second Kwangju RegionalProject (Loan 1758) approved in 1979, also in South Cholla (Chonnam) Province. In 1984, World Bankoperations expanded to North Cholla (Chonbuk) Province with the Chonju Regional DevelopmentProject (Loan 2388).
1.9 Objectives and Components. The main objectives of the above mentioned three projects were tosupport the Government's efforts to develop the Cholla region and reduce inter-regional disparities.Kwangju I with a loan amount of US$15 million, actually initiated Korea's first regional investmentprogram as part of the Third Five Year Economic Plan, 1972-76. While Kwangju I focused onimproving urban infrastructure, including housing sites and access roads, Kwangju II with a loan amountof US$65 million, explicitly aimed at "promoting industrialization in the region's cities to expandemployment opportunities" and "increasing the income earning opportunities of the region's islandpopulation" (PCR, p. v). It included the first phase of the Hanam Industrial Estate and the technicallycomplex Tolsan and Chindo bridges that were instruments of the Government's island developmentpolicy, the two components chosen for this study. The third (Chonju) project with a loan amount ofUS$60 million had similar objectives for developing North Cholla province with an investment packagesimilar to that of Kwangju II.
1.10 All three projects were complex, together covering seven cities and five islands in two provincesand each project had a half dozen project components (displaying the "Christmas-tree" characteristics ofmany Bank-financed urban projects). They included industrial estates, housing estates, tourism estates(including national parks), market places, bridges connecting islands with the mainland, fisherycomplexes, urban services components such as water supply and drainage systems, and both national andurban road improvements (see Annex 2 for detailed project description).
1.11 Implementation and Performance. Most of the physical targets of all three projects were met.Implementation of the physical components was in general satisfactory although Kwangju II took twomore years to complete than planned, mainly because of the technical complexity of the Tolsan andChindo bridges (para 5.3). According to the Kwangju II PCR, the project had "a positive effect instrengthening the economic base of the region through industrial development in Kwangju" (p. 15). TheChonju project PCR concluded that "the project was generally successful in promoting economicdevelopment and creating employment opportunities in the Chonju region" (p. 6). Institutional
5. The relative efficiency of various location subsidy schemes in the form of credit, wage and land subsidies was simulated aspart of the World Bank study (Murray, 1988).
13
development at all levels of government was significant. The Kwangju Regional Development Unit,established by Presidential Decree in 1975 as the project management unit for Kwangju I (PCR, p. 41),was the seed for institutional learning for regional development in Korea that occurred over the twodecades of World Bank-financed project implementation, another subject of this impact evaluation study.
1.12 Earlier the OED had rated the project (Kwang u II) outcome as satisfactory, its sustainability aslikely, but its institutional development was not rated. This impact evaluation study confirmed the firsttwo ratings and documented that institutional development was substantial. Furthermore, the studydemonstrated the importance of understanding Hirschman's concept of "centrality of side-effects" inproject work (see Chapter 3). For example, predicting such side-effects would make it possible to plancomplementary investments that would be required for a realization of fuller development impacts of aproject (para. 4.5).
Rationale and Objectives of the Study
1.13 Regional income disparities and inequities in resource allocation constitute a major challenge tosustained development. Nevertheless, regional development projects are rare in the Bank urban lendingportfolio. The Bank-supported regional development program in Korea is unique: no such sustainedefforts extending over a period of two decades can be found elsewhere.
1.14 The main objectives of the study are two-fold: to assess (i) short-run "direct" project impacts onthe beneficiaries as anticipated by the projects, and (ii) long-run "side-effects"7 (indirect impacts) on theindustrialization process and institutional learning.
Scope of the Study and Two Distinct Approaches
I.15 The amount of Bank project financing was substantial in the region when the projects started inthe mid- 1 970s, but the amount was only a small portion of the total accumulated infrastructureinvestment in the region during the two decades of project implementation. Therefore, the physicalimpacts of these complex projects (total of 22 components) were negligibly small considering the factthat the country's economy grew at such a high rate over a sustained period, accompanied by a rapidgrowth of cities. During the study mission, many of the project components were not visible orrecognizable at the individual project sites because of the overall development that had taken place in thesurrounding areas, e.g., Ycosu's access roads to the business district are now part of the fully developedcity center. An impact evaluation of these types of project components would be impractical.
1.16 The study's coverage had to be very selective and focused. It concentrated on the Kwangjuregion where the first two projects were located. The experiences of the third project in Chonju arecompared with those of the Kwangju projects as appropriate. The study focused on: (i) impacts of theHanam industrial estate on industrial development in the region; (ii) impacts on institutionaldevelopment at both national and local levels, and (iii) impacts of the Tolsan and Chindo bridges onintegrating the island economies into the regional development. These three investment components, atotal of $103 million, accounted for 48 percent of Kwangju II's total project costs of $216 million (PCR,p. 22). Chapters 2 to 4 of the report present items (i) and (ii), and Chapters 5 to 8 present (iii).
6. The Project Performance Audit Report (No. 9610) was issued in May 1991 when OED's ratings were not included in theEvaluative Memorandum. This rating information was obtained from the Bank's OED Data File.
7. Hirschman (1995). See the discussion in Chapter 3.
14
1.17 Two Distinct Approaches. Even after decades of research on regional development, there is nowidely accepted analytical framework to assess project impacts. For the study of industrial developmentand institutional learning in Part I, a case study approach is followed. It focuses on the catalytic role ofthe World Bank projects in "triggering" the process of industrialization and sustained institutionallearning (see para. 1.18). In Part II, however, the approach comparing the conditions "before" and"after" the bridges is complemented by a comparison of the project islands with the "other" islandswithout bridge connections.
I.18 A Case Study Method: Historical Approach. The evaluation methodology used for institutionaldevelopment in this study is a case study method which is "for learning about a complex instance" (U.S.General Accounting Office, 1990, p. 14). "Case studies are frequently used in public policy analysis toexamine the effects of non-experimental events such as political decisions by cities and towns" (GAO,1992, p. 48; Yin and Heald, 1975). Such studies heavily rely on qualitative (non-quantitative) andhistorical information. Baumol's view on the historical approach is that: "it is surely a standard tenet ofscientific method that tentative confirmation of a hypothesis is provided by observation of phenomenathat the hypothesis helps to explain and that could not easily be accounted for if that hypothesis wereinvalid" (Baumol, 1990, p. 895). Two principles to help establish validity and reliability in a case studyare: (i) use multiple sources of evidence, e.g., via triangulation of data; and (ii) maintain a chain ofevidence (GAO, 1991, p. 43).
Information and Data Collection
1.19 Data Needs. The design of the World Bank projects did not contain any data collection schemesfor evaluation such as baseline data and monitoring and evaluation. This study therefore resorts tosecondary data and the information collected during two study missions. A small survey ofmanufacturing establishments was conducted for the firms located within and outside the industrialestates (see Chapter 2 and Annexes 4 and 5). Wherever data would permit, quantitative analyses basedon the "before/after" and "with/without" methods were followed.
1.20 Sources of Information. The information collected during the two study missions includedsecondary data and interview results. There were three groups of informants: (i) national governmentofficials (including a focus group meeting with Division Chiefs who had implemented the projects); (ii)local government officials at both provincial and city governments; and (iii) private sector peopleincluding manufacturers within and outside industrial estates, representatives of local Chambers ofCommerce and Industries, local university professors and researchers (see Annex 6 for a list of thepeople interviewed). In addition, information was obtained by site visits and interviews withbeneficiaries at the project sites, and also from review of project documents and other related secondarydata.
8. To obtain and confirm corroborating evidence from multiple sources.
15
PART I. INDUSTRIAL DEVELOPMENT AND INSTITUTIONALLEARNING
2. Direct Impacts: "Triggering" the Industrialization Process
Baseline Conditions in the 1970s
2.1 National Government-Directed Institutional Environment. The Korean Government's consciousdevelopment effort started with the First Five-Year Economic Plan in 1962 immediately after the latePresident Park took power through a military coup. The Plan was prepared and implemented by a smallgroup of American-educated technocrats in the national government under the direction of the "BlueHouse" (the presidential mansion). The institutional environment for development was completelydominated by a classic command system of decision making: almost 100 percent of the country'sloanable funds was allocated by the Blue House according to the investment priority set in the EconomicPlan (for materials on the modern history of Korean economic development, see Amsden, 1989; Song,1990; Sakong, 1993; Cho, 1994; Kim and Leipziger, 1993).
2.2 Recovery from the complete destruction of Korea's socio-economic infrastructure during theKorean war (which ended in 1953) was slow. With the country's annual per capita GNP of $87, Koreawas still dependent on foreign aid. The country completely lacked the basic "institutional" infrastructure,i.e., the "rules of the game", by which different actors can play to achieve the goal of economicdevelopment. The new set of "rules of the game" was quickly established by the Park government.
2.3 During the First Five Year Plan period, the government established a set of basic principles fordevelopment policies, i.e., "rules of the game": (i) the government should determine the direction ofpolicies, and the goals of economic development should be achieved both by the price mechanism andgovernment investment and financing, but the government may employ other means than the pricemechanism for promoting priority industries; (ii) the government could complement and replace privatedecisions in the case of major investments; (iii) for economic development, growth should have a higherpriority than redressing imbalances in income distribution and uneven industrial development acrossgeographical regions (Cho, 1994, pp. 31-32).
2.4 Exclusion of Cholla from Development Process. Not sharing the benefits of the nationalgovernment's industrialization strategy and infrastructure investment programs, the Cholla region wasleft behind Korea's rapid economic growth in the 1960s and 1970s. Cholla was not a "lagging region" inthe traditional sense of lacking any development potential with no resources; rather it was "lagging"because of the policy bias as much as from market failures (especially in utilizing the high quality laborforce). The rapidly changing incentive structure (i.e., the rules of the game) in Korea for businessoperations did not reach entrepreneurs in Cholla whereas the economy was picking up speed along theSeoul-Pusan axis.
2.5 Lack of Industrial Infrastructure. The manufacturing base in the city of Kwangju in the 1970swas rather weak having only several large indigenous manufacturing establishments (e.g., Kumho Tire;Kia Automobiles) and several industrial areas in the central city where small and medium scale firmswere concentrated. Table Al .3 shows that in 1978, the industrial area in the Cholla provinces was only aquarter that of the Kyongsang provinces. In the 1975 Kwangju City Master Plan, the spatial planningstrategy for the future expansion of the city was outlined including the designation of the Hanam area asan industrial area which was then outside the city boundary.
16
2.6 Large scale industrial estates in Kwangju and the Cholla region came only in 1983 when theHanam Industrial Estate opened as part of the World Bank's second Kwangju project. In fact, this largescale industrial estate development came to the Cholla region 20 years(!) after the establishment of theUlsan industrial complex in Kyungsang province in 1962 that was part of the First Five Year EconomicPlan (Choe and Song, 1984, p. 79).
Evaluation Framework
2.7 The hypotheses tested here relate to direct impacts (propositions I and 2) and long-term side-effects (propositions 3 and 4):
Proposition 1: The Hanam Industrial Estate as a component of Kwangju II had the "triggering"effect on the process of industrialization in the region.
Proposition 2: The World Bank projects offered both national and local government officials thefirst opportunity of its kind for learning project preparation and implementation for industrialdevelopment in the region.
Proposition 3: Hanam Phase I, as a component of Kwangju II, led to three additional phases ofindustrial estate development (in a period of 10 years), and resulted in the ultimate impact ofestablishing the region's industrial base with "backward and forward linkages".
Proposition 4: The "rules of the game" evolved from national government-directed institutionalenvironment for development to local government-based, enabling environment to which theprivate sector actively responded in the region.
2.8 Hirschman's "Centrality of Side-Effects". According to Hirschman (1995, p. 161): "...some ofthe so-called side-effects thus turn out, a bit surprisingly, to be inputs essential to the realization of theproject's principal effect and purpose." In other words, many unexpected side-effects of developmentprojects are central to the purpose of the project itself, sometimes even becoming inputs to thesustainability of the project. Hirschman's concept of "backward and forward lifikages" is a good exampleof the centrality of side-effects (Ibid, p. 165) and it provides an analytical framework for explaining thesuccess of the Hanam Industrial Estate and its expansion to the subsequent phases of development.
2.9 Baumol-North Framework. "Rules of the Game " and Entrepreneurship. The analysis ofinstitutional learning in this study corroborates the Baumol theory of entrepreneurial behavior whichstates that "one of the prime determinants of entrepreneurial behavior at any particular time and place isthe prevailing 'rules of the game' that govern the payoff of one entrepreneurial activity relative toanother" (Baumol, 1990, p. 898). The resulting policy guidance is that:
"The rules of the game that specify the relative payoffs to different entrepreneurial activities playa key role in determining whether entrepreneurship will be allocated in productive orunproductive directions and that this can significantly affect the vigor of the economy'sproductive growth" (Ibid., p. 918).9
2.10 In this study, "institution" is broadly defined as "rules of the game" which were changed overtime by the national and the local governments in such a way that the incentive systems improved and
9. Baumol (1986) showed that implicit incentive structures matter in explaining patterns of growth among countries. For arecent study on manufacturers' responses to infrastructure deficiencies and regulatory constraints, see Lee, Anas and Oh (1996),and Baumol and Lee (1991).
17
the private sector responded in the productive direction. One of the key elements in this study is todocument the "process by which those rules 'were' modified" (Ibid., p. 916) over the study period and tounderstand how private businesses responded to the changing rules. The theoretical foundation forinstitutional analysis has been advanced by North' 0 (1990). In his Nobel Prize lecture, North stated that:
It is the interaction between institutions and organizations that shapes the institutional evolutionof an economy. If institutions are the rules of the game, organizations and their entrepreneursare the players...if the institutional framework rewards productive activities then organizations-firms-will come into existence to engage in productive activities.. .the most fundamental long-run source of change is learning by individuals and entrepreneurs of organizations (North, 1994,p. 361).
2.11 Aoki's "Market Enhancing View" of the Role of Government. According to Aoki, "...thegovernment's role is to facilitate the development of private sector institutions that can overcome these[market] failures..." (Aoki, 1995, p. 11). In other words, its "coordination" role enhances the functioningof the market. This is what the governments did in the Cholla region, that is, induce the private sector toparticipate in the industrialization process in that region. Aoki's proposition complements the Baumol-North framework which is based on the behavior of individual actors and organizations.
2.12 The construction of the industrial estate in Hanam began in January 1981 and was completed inDecember 1983. The time period set for the study of long-term impacts (mostly side-effects) is the ten-year period after project completion, 1986-1995, as shown in Table 2.1.
2.13 The study documents the following four major outcomes: (1) industrial infrastructure expandedmore than five times the original investment of Hanam 1; (2) a solid industrial base has been establishedwith backward and forward linkages; (3) local government capacity reached the level of sophistication tosupport a rapid industrialization process; and (4) the "rules of the game" (government, bureaucracy andregulations) evolved to an incentive structure conducive to private investment. As shown in Table 2. 1,direct impacts and longer-term side-effects are traced and analyzed to substantiate these outcomes. Thestudy of the "Direct Impacts" is presented in the sequel of Chapter 2 and its longer-term "Side-Effects"(indirect impacts) in Chapter 3.
10. North (1973) refers to Baumol's Welfare Economics and the Theory of the State (1952), as part of the intellectual origin ofthe theory in institutional analysis.
I1. Aoki's ongoing research with EDI (Aoki, 1995) is an attempt to extend the analysis of the role of government addressed inThe East Asian Miracle(World Bank, 1993). In his pioneering work, North (1973, pp. 1-8) showed that the role of governmentsin establishing and enforcing property rights is the key to efficient economic organization and growth.
18
Table 2.1: Evaluation Logic for Hanam Impacts
Direct Impacts Long-term Side-Effects
Time Period 1978-1985 1986-1995
Bank Intervention Kwangju II None in Kwangju
1) Industrial Infrastructure Hanam Industrial Estate Phase I Hanam Phase II, III and Pyung-Dong Phase
2) Manufacturing Industries Large "anchor firms"; relocation Industrial linkages, expansion,(Private sector responses) of small and medium size firms and diversification, including
exports
3) Institutional Environment National Government-led City government-leddevelopment; mandates and development; responses toorders markets
4) Institutional Learning a) Intergovernmental relations; a) Devolution and jurisdictionb) Public-private sector b) Laws and regulations;
interaction; c) Organization andc) Local government management responsibilities;
challenge d) Local government capacitybuilding;
e) Private sector confidence
Impact on Industrial Infrastructure: Hanam Phase I
2.14 The Hanam Industrial Estate Phase I, completed in 1983, was the largest project investmentcomponent of Kwangju II in an amount of 20 billion won (US$41 million), which was about 20 percentof the total project costs. This component alone constituted 15 percent of the total amount of capitalformation of 132 billion won (PCR, p. 19) for the city of Kwangju during the five-year period 1980-1985. The land area of the estate was 460,000 pyongs (1.5 million square meters) which was about thesame as the sum of all industrial areas that existed in the city before the project (Table 2.2).
2.15 Recently completed World Bank studies show that when publicly provided infrastructureservices are deficient, manufacturers undertake significant expenditures to substitute or complementthese deficiencies, and smaller firms, and those in regional cities, sustain heavier burdens (Lee and Anas1992; Anas, Lee and Murray, 1996). The low level of infrastructure investment in the Cholla
12. The actual amount disbursed was US$51.2 million after cancellation of US$13.8 million due to the cost savings from asubstantial devaluation. But the total project cost at completion was US$216 million, 40 percent larger than the appraisalestimate of US$154 owing to additional investments by the borrower (PCR, p. 22).
19
region in the 1960s and 1970s, especially the lack of industrial sites (Table A 1.3), was one of the majorconstraints on the birth and growth of manufacturing in the region. The coming of the Hanam IndustrialEstate clearly marked the beginning of a new era for industrialists in the region.
Table 2.2: Expansion of Industrial Estates in Kwangju
Land Area Development Costs ConstructionCompletion Date
Industrial Estate 1,000 pyong percent billion won percent
Hanam I 460 12.5 25.5 7.5 Dec. 1983
Hanam II 617 16.8 39.7 11.7 Dec. 1988
Hanam III 727 19.8 91.4 26.9 Feb. 1991
Pyong-dong 820 22.3 156.0 45.8 Jun. 1995
Science Complex (1) 494 13.4 - - 2001
All Other Ind. Areas (2) 557 15.2 27.7 8.1 n.a.
Total 3,675 100.0| 340.3 100.01
(1) Total land area including R&D complex, university, and residential and commercialareas will be 2,980,000 pyongs with total development cost of 727.7 billion won forPhase I, to be completed in 2001.
(2) Includes Bonchon, Songnam, and Sochon industrial areas, but excludes Kumho Tireand Asia Automobiles.
Sources: National Industrial Estate Status, Korea Chamber of Commerce and Industries,June 10, 1994.Regional Economic White Paper 1994, Kwangju City, December 1994.Industrial Estate Status, Kwangju City, March 1995.
Impact on Manufacturing
2.16 As indicated above, firms do not move long distances because of high expected costs anduncertainties at new location. Infrastructure and tax breaks alone are not sufficient to attract industries toless developed remote areas. Therefore, the major challenge for the project's success was to inducefirms, especially several large-scale ones, to the newly developed industrial estates. The city andprovincial governments actively promoted the estate nationwide aiming at attracting several large scale"anchor" firms, supported by the help of the central government's clout for moral suasion (including thatof the "Blue House"). The following contributed to the success of Hanam Phase I as critical factors.
2.17 "Anchor" Firms. Daewoo Electronics, LG (Goldstar) and three other firms came as the "anchorfirms". The availability of low price land and high quality labor and their marketing strategy influencedtheir decisions to locate in the Hanam Industrial Estate, but the active promotion activities by localgovernment officials, and local business groups (Chamber of Commerce and Industries) and the pressurefrom the national government (the Blue House) influenced their decisions.
20
2.18 City Planning and Zoning as Instruments. Small and medium size firms relocated from the oldindustrial areas in Kwangju's central city due to city planning and zoning changes. Their capital gainsfrom selling old factory sites were substantial enough for relocating to the Hanam Industrial Estate andinvesting in new plant and equipment. The land price at Hanam was several times lower than theirprevious locations at the central city.
2.19 Subcontracting Small and Medium Size Firms. A large number of subcontracting firms camewith Daewoo and LG. Backward and forward linkages were beginning to be established. In the case ofDaewoo, 35 small and medium size firms came with it to Hanam, 20 from Seoul. (See Chapter 3 onlinkage effects.)
2.20 On the whole, all of the new industrial sites in the Hanam Industrial Estate completed inDecember 1983 were occupied quickly, due to the pent-up demand accumulated over the past twodecades. As the estate was being filled up in 1984, development of the second phase of Hanam wasproposed and its construction began in 1986 (see more details in chapter 3).
Manufacturing Establishment Survey Results
2.21 Sample Design and Sampling Strategy. A survey of manufacturing establishments wasconducted in Kwangju to learn about the characteristics of the firms in the Hanam Industrial Estate andat other locations in the city. A stratified random sample of 80 manufacturing establishments wasselected using location and firm size as stratification variables: (i) 50 percent was selected from each"within" the Hanam Industrial Estate, the project site, and from "outside", respectively; and (ii) largefirms were oversampled. In 1995, Kwangju had only 25 manufacturing establishments with more than200 employees, 10 of them at Hanam. All 25 firms except two were included in the sample (TableAl.5). There were a total of 1,945 manufacturing establishments in Kwangju in 1995, of which 395were located in Hanam, 256 in other small industrial estates closer to the central city, and 1,294 outsideindustrial estates. Of those outside, 975 (75 percent) were microenterprises with less than 5 employees(Table 2.3). The sample was 10 percent of those with 5 or more employees. The survey outcomeproduced 44 establishments located in Hanam and 36 "outside" (Table A1.6). More details of the surveyresults appear in Annex 4.
21
Table 2.3: Firm Size Distribution Within and Outside Hanam Industrial Estates, 1995
Firm Size
Large Medium Small Micro Number ofIndustrial Estate (300 or more) (20-299) (6-19) (Less than 5) Total Workers
Hanaml 5 51 45 15 116 10,344
Hanam II 2 55 51 6 114 4,442
Hanam III - 65 84 16 165 3,607
Sub-total 7 171 180 37 39.5 18,393
Bonchon 2 38 45 7 92 3,888
Songnam - 28 35 4 67 2,410
Sochon IE _ 12 23 22 57 999
Sochon AIE - 26 13 1 40 1,583
Sub-total 2 104 116 34 256 8,880
Outside of IE 6 62 251 975 1,294 19,488
Total 1 337 547 1,0461 1,9451 46,761
Source: Kwangju Industrial Estate Status, 1995.
2.22 Survey Instruments. The survey questionnaire was designed using the questionnaires from twoprevious World Bank studies on industrial location in Colombia and Korea (Lee, 1989; Lee and Choe,1990). The underlying analytical framework was to relate manufacturing firm attributes with locationattributes. Government policies and infrastructure investment tend to influence the location attributes towhich individual firms respond. The questionnaire is attached as Annex 5. The survey was conductedby the study team at Kwangju-Chonnam Development Institute in the summer of 1995.
2.23 Firm attributes included employment size, industry type, age, and whether newly established ormoved from other locations. Location attributes included access to input and output markets, industriallinkages, means of shipments of goods and commuting of employees, and quality of variousinfrastructure services.
2.24 Survey Findings. The survey results are tabulated (i) for the sample as a whole, and (ii) bylocation: Hanam I, Hanam II and III, and "outside". Some of the highlights of the survey results can besummarized as follows. The majority (62.6 percent) of the sample firms were in the medium sizecategory of having 50 to 199 employees (Table A 1.5); 60 percent of the firms were founded since 1983(when Hanam I was completed); 36 firms were newly established while 44 moved from other locations(6 came from outside Cholla). Of the 44 firms in Hanam, 28 (63.6 percent) moved from other locations(Table A1.6). New firms had more advanced technology than the relocated firms (Table A4.6). Thesample firms were concentrated in the fabricated metal industries (61 percent) indicating their links tolarge firms as suppliers of intermediate products (Table A1.7). The extent of backward and forwardlinkages was significant (Tables 3.1 and 3.2), which is discussed in Chapter 3.
22
2.25 The quality of electricity supply was better in Hanam than "outside" (Table A4.12). The samplefirms reported that utility and other infrastructure services improved after relocation (Table A4. 15). Thefirms in Hanam were "very satisfied" with road access, proximity to clients, and plant capacity, whilethose "outside" were satisfied with the availability of workers (Table A4. 11), which reflects the centrallocation of those firms outside Hanam. Indeed, large firms moved long distances (Table A4.13) and theshipping distances and the availability of workers became worse after relocation. Also, only a smallportion of relocated firms reported any improvements of commuting distances (Table A4. 15). About 80percent of sample firms use trucks as the means of shipping outputs and receiving inputs (Table A4.8).Only a small portion of their outputs was sold in Kwangju (i.e., manufacturing is an export sector inKwangju) and a small portion of inputs originates within the city (Table A4.8). We may conclude thatthe quality of various infrastructure services improved with the establishment of the Hanam IndustrialEstate, but logistics costs, especially for shipping and commuting, increased because of the distancefactor. Possible location distortions resulting from the establishment of Hanam are discussed inparagraph 4.5.
Impact on National-Local Government Relations and Management Capacity
2.26 One of the most significant direct impacts of World Bank intervention was to establish a newworking relationship between national and local governments. For mobilizing much needed resourcesand symbolizing the long awaited government commitment to the region's development, the World Bankprojects were welcomed by the provincial and the city governments as much as the national government.Nearly all principal project components came from proposals submitted by local governments, which
generated strong project ownership at the local level. For MOC, committed to regional development inKorea since 1971, the projects were an opportunity to put into practice and implement the many plansand study recommendations made over the years. For local governments, the projects not only providedan opportunity to work closely with MOC as one team but also forged a new alliance with the privatesector for the benefit of the region's development, which neither provincial or local governments alonecould bring about by themselves.13
2.27 To implement the project, MOC set up a special project implementation unit called KwangjuRegional Development Unit (para 1.11) which was relocated to Iri in 1981 as part of a governmentreorganization in that year (Kwangju II PCR, para. 1.3). The Regional Development Bureau of MOCstill existing in Iri (now called Iksan) with a total of 200 employees, is a direct result of the Bank project.Initially, this unit supervised the construction of all project facilities, giving instructions to localauthorities to carry out the details. As local governments acquired a stronger voice with subsequentprojects, the Regional Development Bureau provided an important channel of communication betweendifferent levels and departments of governments and a source of advice. Indeed, it played the crucialrole of interagency coordination for the development efforts in the region. Most of the Bureau's adviceconcerned the construction of industrial infrastructure, one of the main lines of business of MOC. Forthe operation of the completed industrial estates, a different kind of interaction developed as the citygovernment became responsible for its management.
2.28 After the completion of the Hanam Industrial Estate, the city of Kwangju inherited the projectand had the mandate to manage it. The Hanam Industrial Estate Management Office was created tooperate the estate under the direction of the Industry Development Division of the city government. At
13. The sources of evidence in this and the following section and the two sections on the side-effects in Chapter 3 are based onthe triangulation of information from multiple sources (para. 1. 18). The list of people met in the national and local governmentsand the private sector during the two study missions is attached in Annex 6.
23
the outset, this office with a staff of 17 took care of all the details for the operations and maintenance ofthe estate facilities in addition to its role of promotion and sale of the vacant lots. Over the 20 yearperiod which saw the expansion of the estate to the second and third phases, the size and the function ofthis office have been reduced rather than increased, owing to (i) a series of regulatory reforms in theareas of industrial and urban development which reduced the workload of this office; (ii) better access ofinformation to the local manufacturers; and (iii) their improved efficiency in business operations. Thisdiminishing role of the Hanam Industrial Estate Management Office illustrates the evolution of the "rulesof the game" from government-led to market-led institutional environment over the study period, whichis elaborated in Chapter 3 (see para. 3.20).
Impact on Public-Private Sector Interaction
2.29 For the private sector, the projects were the first strong signals coming from the Blue Houseindicating that the "rules of the game" for industrial development in the region were about to change.Private industrialists interviewed during the study mission always highlighted the World Bank's catalyticrole in initiating the industrial development process in the region and bringing the three stakeholders,national and local governments and private sector, together through the projects.
2.30 The direct contact between local governments who operated the industrial estates, and privatemanufacturers located in them, changed the nature of public-private sector interaction in the context ofthe region's industrial development. New actors on the scene, the city government and privateentrepreneurs, meant that new relationships had to be forged. Different criteria for business decisionmaking meant that the "rules of the game" had to be changed to induce private entrepreneurs from withinand outside the region to invest in the expanding manufacturing activities there. This process ofinstitutional learning on both sides is documented further in Chapter 3 using Hirschman's concept of the"centrality of side-effects" in impact evaluation.
2.31 In interviews with the impact evaluation study team, many businessmen in the region expressedthat local government officials became increasingly knowledgeable about industrial development. Localgovernments indeed became partners in this process of industrialization for the first time, owing to theexposure to private sector interests through World Bank project implementation. For example,cooperation between the coalition of government agencies and the private sector itself took the forn ofjoint local government/Chamber of Commerce and Industry delegations to lobby for the interests of theregion at government agencies (including the "Blue House") and "chaebols" (business conglomerates) inSeoul.
25
3. Side Effects and Spillovers
3.1 "Impacts on the ground" are often longer-term, indirect, and unintended. Using Hirschman'sconceptual framework of the "centrality of side-effects", this chapter will document three types of "side-effects" observed from the World Bank projects: (i) establishing an industrial base through backward andforward linkages (Hirschman, 1958); (ii) changing the "behavior of the bureaucracy" (Hirschman, 1995,pp. 166-167) especially of the local governments and their institutional learning; and (iii) increasingprivate sector confidence and participation in the development process in response to changing "rules ofthe game". For the latter, Hirschman's conceptual framework is complemented by Baumol's paradigm onthe entrepreneurial responses to the "rules of the game" (Baumol, 1990).
Industrial Base and Linkages
Industrial Infrastructure: Hanam II, III, and Pyung Dong Follow-up Projects
3.2 One of the most significant-and yet unexpected-side effects of the Kwangju II project was forthe local authorities to learn how to plan, finance, build and operate large-scale'industrial estates on themodel of Hanam Phase I. Since they had to operate the project facilities and expand them urgently tomeet additional demand, the governments of Kwangju city and South Cholla province had to learnquickly to put their newly acquired knowledge and skills into practice.
3.3 The World Bank's estimate of the future demand for industrial sites was below the Koreanprojection. Korean officials wished to build a larger estate at Hanam. The final outcome, 66 percent ofall sites sold before completion and the rest quickly occupied, proved the bullish Korean estimate to becloser to the mark. Had the World Bank agreed to build a much larger first phase estate at Hanam, theBank's decision would have deprived the local authorities of much of their rich learning experiences inthe planning and construction of large industrial estates. Hanam I turned out to be a "pilot" phase thatled to the "mainstreaming" phase of Hanam II, III, and Pyung-Dong, three more industrial estate projectsexecuted by the city alone in only a ten-year period (Picciotto and Weaving, 1994).
3.4 The institutional learning discussed earlier-including strong compact and coordination betweenMOC and local governments, local government participation and ownership, private sector confidenceand participation, and local government capacity building-were "side-effects" from the initial phase ofthe project which became, as Hirschman put it, "inputs essential to the realization of the project'sprincipal effects and purpose." "They increase[d] and spread with and through use so that the resultingincrement [could] then be channeled to new ventures" (Hirschman, 1995, p. 161)-in our case, thefollow-up projects of Hanam Phase II, III, and Pyung-Dong, the ultimate long-r.un side effects.
3.5 As Hanam Phase I was already fully occupied by 1984, and industrialists had expressed interestin acquiring further land, the local authorities began work on the Hanam Phase II extension in 1986 andcompleted in 1988, but this time without the help of MOC and World Bank involvement, only assistedby the Korea Land Development Corporation (KLDC). To meet the increasing demand for sites, theKwangju city authorities launched Hanam Phase III in 1989 by the city alone without MOC, KLDC, orthe World Bank, and completed in 1991. When the study mission visited the site, 85 percent of the siteswere occupied. As the Phase III sites were sold out even before completion of the project, the citycontinued expansion of industrial sites by the construction of Pyung-Dong Industrial Estate, an areasouth of Hanam including an area for foreign direct investment that was completed in 1995 (Table 2.2).The land area of Hanam II and III together is 1,344,000 pyongs (I pyong=3.3 square meters), three times
26
larger than that of Hanam I (460,000 pyongs). In addition, the land area of Pyung-Dong is 820,000pyongs (Table 2.2).
3.6 This sequence of massive industrial estate development during a little over ten years by the cityalone is a remarkable achievement for the city government of Kwangju. On the whole, developingHanam Phase II, a land area of 617,000 pyongs (2 million square meters), without the help of MOC, wasthe most important benchmark in the local government's capacity building for managing a largeindustrial development project.
Backward and Forward Industrial Linkages
3.7 Table 2.3 shows the size distribution of manufacturing firms located within and outside HanamIndustrial Estates in 1995. It is striking to see that 81 percent of medium and large scale firms arelocated in the industrial estates while only 23 percent of small firms (with less than 20 employees) arelocated in the estates. This implies that the industrial estates provide both economies of scale and scopeof infrastructure and other services that are vital for medium and large scale operations. In terms ofemployment, three Hanam estates offered 40 percent of Kwangju's total number of manufacturing jobs in1995. It is clear that Hanam Industrial Estate had a significant impact on the city's employment growth.
3.8 One important contribution by Hirschman is the analytical framework of "backward and forwardlinkages" in the industrial development process (Hirschman, 1958). This linkage effect is one of the keyexamples of the "centrality of side-effects". According to Hirschman (1995, p. 165):
[backward and forward linkage effects] are not ordinarily required for the proper functioning ofthe project as such. Forward linkages that increase the demand for the project's outputs will,however, be very useful and in some cases essential for the future growth of theproject...Backward linkage effects have a similar function: they reduce the import-intensity ofthe project whose future growth ...may well be conditioned on such a reduction; thus both linkageeffects may play an important role in enabling the project expand [and grow].
3.9 In this study, three of Hirschman's linkage effects are observed:
(i) "Satellite" Industry Effect on Establishing an Industrial Base. A satellite industry can beestablished through backward or forward linkages. Such an industry enjoys a strong locationaladvantage of being near the parent industry and it uses as a principal input an output of the parentindustry, or its principal output is used as an input of the parent industry (Hirschman 1958, p. 102). Ourestablishment survey shows the following linkage effects: Table 3.1 shows that more than 60 percent ofthe establishments at Hanam supply their outputs as intermediate inputs of other industries; 28 percent ofthem send 100 percent of their outputs to other industries, a strong indication of forward linkages. Table3.2 shows the extent of backward linkages: at Hanam nearly 80 percent of establishments receiveoutputs of other industries as intermediate inputs, a strong indication of backward linkages.
27
Table 3.1: Proportion of Outputs Used as Inputs to Other Industries: Forward Linkages
0 % | 1-20 % 1 21-40 %I 41-60 %| 61-80 %I 81-99 %I 100% % n.a. I Total
Industrial Estate --------------- (percent of establishments) ---------------
Hanam 1 34.8 13.0 4.4 0.0 0.0 8.7 34.8 4.4 100.0
Hanam II & III 42.9 14.3 0.0 4.8 4.8 0.0 23.8 9.5 100.0
(ii) "Last stage" Industry Effect of the "Anchor" Firms. When an input-output matrix isarranged in a triangular form, there is a "last" sector whose output goes entirely to final demand andwhich takes in inputs from a number of other sectors (Ibid., p. 110). The backward linkage effects ofsuch "last stage" industries are of considerable importance for industrial development. The "anchor"firms in the Hanam Industrial Estate (Phase I) produced such effects (although they were not "last" in aliteral sense since some of their outputs were inputs of other industries). For example, DaewooElectronics which produces household appliances for final demand such as refrigerators, microwaveovens, color TVs, has established 1,200 subcontracting firms, of which 180 are located in Kwangju, 35 inthe Hanam Industrial Estate (para. 3.30). The firm's linkage effects on manufacturing employment andincome are remarkable considering that Daewoo's own plant has only 1,800 employees.
(iii) Multiple Linkage Effects on "Acceleration" of Industrial Growth. According to Hirschman"the fact that the linkage effects of two industries viewed in combination are larger than the sum of thelinkage effects of each industry in isolation helps to account for the cumulative character ofdevelopment." (Ibid., p. 104) The data in Table 2.3 shows that only 7 out of 395 establishments locatedat Hanam are large scale firms (having more than 300 employees). This may imply that more than halfof those small firms (assuming that each of the seven large firms have subcontracting arrangements withabout 20 to 30 small firms) came into existence as the result of "secondary linkage effects" with no directconnections to the seven anchor firms. This experience in Kwangju tends to support Hirschman'shypothesis on the "acceleration of industrial growth" at an early stage of development (Ibid., p. 104).
28
Local Bureaucracy's Behavior and Capacity Building
3.10 "Task-oriented" Bureaucratic Behavior. Local governments began to replicate and expand theproject infrastructure on their own account, mobilizing their own financial resources, soon after theWorld Bank funded projects were completed. Local governments' growing responsibilities, as theguardians and managers of industrial development in the region, led them to assume ever greaterresponsibilities over the projects and follow-on operations. In other words, local governments becamepromoters and partners of industrial development.
3.11 Industrialists interviewed by the impact evaluation mission reported that in the 1960s and 1970s,local governments were synonymous with red tape, for example, obtaining building permits and licenseswas a challenging if not impossible job. In the case of Kwangju, the implementation of the World Bankproject with Hanam I and its extension to the second phase without the help of MOC was the mostsignificant turning point for the city government's institutional learning. Hirschman characterizes such achange (in this case very drastic) in the behavior and role of government bureaucracy as "a mostimpressive side-effect of development projects in the public sector [as] a growth- and task-orientedgroup of public officials [emerged]" (Hirschman, 1995, pp. 166-167).
3.12 Evolution in Local Government Organization, Functions, and Responsibilities. This study foundthat city governments, especially, made many internal changes to their organizations to help change therules and provide more incentives for entrepreneurs to invest in industry in the Cholla region. The firstphase of the Hanam Industrial Estate was completed in 1983 and, up to that time, there was no specificunit or department within the Kwangju city administration where interested entrepreneurs could directtheir inquiries about acquiring a plot and setting up a manufacturing establishment. Steps taken to fillthis gap included (see Annex 3):
1985 - the creation of a special Industrial Estates Planning Sub-Division within Kwangju citygovernment, to plan, finance and market the estates and staffed initially by five professionals.
1986 - Kwangju city status upgraded to that of autonomous Direct Administration City (anational government decision that coincided with the project implementation).
1987 - the establishment of the Hanam Industrial Estate Management Office as a "one-stop shop"at the site.
1987 - industrial development rises in the organizational hierarchy as the Industrial DevelopmentSection was elevated to a full division.
3.13 Within the Kwangju city government, the Industrial Development Division is responsible for thepromotion and marketing of opportunities for private sector industrialists within the region. Thisfunction did not even exist within the city government before the World Bank projects. Duringinterviews for this study, IDD officials explained that marketing of industrial estates is done on a biggerscale today than ever before, using a whole range of methods from newspaper advertisements, flyers andvisits to interested firms. As the need arises, the Kwangju city mayor himself becomes directly involvedin promoting the sale of the sites. Administrative changes such as these were the result of side-effects ofthe Kwangju II project especially.
3.14 More significant side-effects of the projects, however, are on the capacity and quality of projectmanagement of the local government officials. According to the officials who actually implemented the
29
Bank financed projects, they are now using the approaches and methods they learned from the Bankprojects in project preparation, appraisal, and implementation: taking the formal steps of feasibilitystudies, engineering design and economic analysis is now the standard practice while this did not existbefore the Bank projects. With so many World Bank missions-57 in all, over a period of twentyyears-there was plenty of opportunity for interaction with Bank missions, exchanges of experience andlearning on both sides.
3.15 The city government of Kwangju not only successfully managed the first phase of the HanamIndustrial Estate, it carried out the second and the third phase expansion of the Hanam estate withoutMOC and Bank involvement and kept expanding to the Pyung-Dong Industrial Estate aimed at inducingdirect foreign investment. The level of managerial sophistication of the staff of the Kwangju citygovemment now appears equal to that of any city in Korea, catching up with the rest of the country inonly a ten year period.
"Rules of the Game", Private Sector Confidence, and Public-Private Partnership
3.16 Evolution of the "Rules of the Game". A series of devolution with changes in jurisdictionalboundaries and laws and regulations during the twenty year period (see Timelines in Annex 3) coincidedwith the important benchmarks of the implementation of the Bank financed projects. Consequently,local governments assumed responsibilities as guarantors and managers of "rules of the game" for privateindustrial development, a responsibility that had formerly been the monopoly of the nationalgovernment. Kwangju city government, having to operate the industrial estate they inherited from theWorld Bank financed project from the early 1980s, was obliged then for the first time to consider whatincentives industrial entrepreneurs might need in order to participate in the development of the region.Thanks to the project experience, therefore, the city government embarked upon industrial developmentas a means of making the "rules of the manufacturing game" more attractive for private investment. Thecity government's promoting industrial development in the region discussed above was something thatthey never did in the 1970s before the Bank-financed regional development projects were implemented.
3.17 As in most other countries, city governments in Korea are responsible for granting buildingpermits and licensing the use of the completed facilities. Industrialists interviewed by the impactevaluation mission reported that obtaining building permits and licenses is much easier today than it wasbefore the Kwangju II project. City governments also became adept at re-assigning agricultural land onthe urban periphery for industrial use, especially after they were given the previous KLDCresponsibilities for land use regulation in 1990. In practice, there has been more conversion ofagricultural land for industrial use under these local autonomy arrangements. In 1994, Hanam IndustrialEstate Management Office functions were simplified to only register applications for industrialdevelopment which are all automatically approved. The office no longer tries to assess the economic orfinancial feasibility of the proposed operation. When it was established, the primary function of theHanam site office was to promote the sale of plots in the industrial estate and the "one-stop-shop"function for industrialists mentioned above. Owing to a series of devolution and deregulations, itsadministrative workload has decreased lately and its staffing was reduced from -I 7 in 1987 to only 9today (paras. 2.28, 3.20).
3.18 For their part, private sector industrialists came to recognize local governments in the region asguarantors and managers of the "rules of the game" and arbiters of the conditions of entrepreneurialparticipation in industrial development in the region. Business managers interviewed for this studyconfirmed that local officials' understanding of the needs of private sector industrial development hadimproved significantly after the completion of the World Bank-financed projects. Similar reports were
30
made about city governments in Iksan and Chonju cities, the Chonju Regional Development Project sitesin neighboring North Cholla province. Entrepreneurs also reported that they noted a reduction of citygovernment red-tape following the creation of the Industrial Development Division. Significant changesin rules gave them new incentives to invest in Kwangju. Industries setting up within an industrial estatewere exempt from municipal taxes from two to five years. Perhaps just as important, these industriescould feel equally exempted from many of the tight land uses and building controls that effectivelysuffocated industrial development in other parts of the urban areas. The project experience provided avital schooling for city governments that they should develop rules that allow private industrialists toreap benefits from their investments without undue hindrance from regulations.
3.19 Private Sector Confidence and Public-Private Partnership. The local government's passion andcommitment to industrial development in the region, together with changing regulatory and institutionalenvironment, enhanced the private sector's confidence in the local governments and a strong public-private partnership emerged-another significant side-effect of the projects (Hirschman, 1995, p. 166).In the case of Kwangju, the city government is now able to maintain an "enabling environment" for theprivate entrepreneurs to invest and grow, to the extent that the city is now actively promoting directforeign investment in newly opened Pyung-Dong Industrial Estate (the fourth phase after Hanam III).Recently, Kwangju city's stature and reputation rose markedly when it won from a severe competitionamong major cities a national government financed project to locate a Science Park with a hi-techcomplex in Kwangju (see Table 2.2), which is now under construction for completion in 2001. Privatecooperation has been forthcoming in big ways. For example, Kumho Tire Company, one of the largestindigenous business conglomerates, sponsored the establishment of an engineering college in the SciencePark.
3.20 The overall picture emerging from the analysis is that over the twenty year study period, the"rules of the game" evolved from those of national government-directed development to those of localgovernment- and market-based development with strong private sector responses in the region with theirconfidence and cooperation. As indicated above (paras. 2.28 and 3.17), this process can be illustrated bythe diminishing role of the Hanam site office by leaving most of its previous functions to the markets.This experience confirms Baumol's proposition that entrepreneurial responses are productive when the"rules of the game" provide positive incentives (paras. 2. 9-2. 1 0). 4 What was observed in the Chollaregion through the Bank-financed projects tells such a story.
Ultimate Impact: Regional Growth
3.21 Kwang/u is Now the Fastest Growing City in Korea. Population grows at a rate of 4.5 percentper year, which comes close to the growth rate of Seoul (5 percent) in the 1970s (see Table Al .2).15According to the Industrial Census statistics, Kwangju was the only Direct Administration city wheremanufacturing employment grew during 1988-1993 (Table Al.8). In the other five DirectAdministration cities, the level of manufacturing employment (in establishments with 5 or moreemployees) during this period actually declined.'6 In terms of growth of both regional product and
14. This outcome could be interpreted as a case where the evolution of efficient institutions (rules of the game) led to thereduction of transaction costs, which resulted in productive private sector responses (North, 1990 and 1994; Coase, 1960;Williamson, 1995).
15. The population growth rates of the Direct Administration cities and provinces not appearing in Table 2.1 for the 1975-1990period were: Inchon=1.96; Taechon=3.14; Kangwon=0.81; Chungbug=0.99; Chungnam=0.99; and Cheju=3.65.
31
manufacturing output, South Cholla (including Kwangju) was second only to Kyonggi (Table A 1.9, andTable Al.10). These two provinces were the only ones that gained the output share in the country duringthat period (Table A 1.9).
3.22 Cholla Region is Still Far Behind. In Table 3.3, the 15 regions are ranked in descending orderaccording to each region's manufacturing share of its total regional product in 1992. South Cholla andKwangju ranked the 6th and 7th respectively with a little over a quarter of their output coming frommanufacturing. South Kyungsang where Pusan is located had the largest share of 54.4 percent. Thesecond column of Table 3.3 shows the per capita gross regional product (GRP) of each region. Its rankcorrelation with manufacturing output share is almost perfect with the exception of Seoul and Taechon.South Kyungsang had the largest per capita GRP. Cholla ranked the 7th and Kwangju the I 0th. Cholla'sper capita GRP was 95.3 percent of the country's average of 5.5 million won (about US$7,000) andKwangju's was only 81.9 percent, among the lowest (Table 3.3).
Table 3.3: Ranking of Regions by Share of Manufacturing Ouputand Per Capita GRP, 1992
Source: Gross Regional Product 1994, National Statistcal Office.Korea Institute for Economics and Technology, 1995.
3.23 Table 3.3 shows that manufacturing is closely related to the level of income. Even though SouthCholla, especially Kwangju, showed an impressive growth of manufacturing (Tables A 1.8 and A 1.10),
16. The data in Table Al .8 shows that the number of manufacturing establishments increased in all I 5 regions during the sameperiod. This implies that the new establishments created in this period were relatively small and existing large establishmentswent through "down-sizing" with technological changes. The average manufacturing firm size in the country declined from 52in 1988 to 32 in 1993.
32
the Cholla region still has a lot of catching-up to do. Table A 1.1 shows that the agricultural share ofemployment of South Cholla declined markedly from 73.1 percent in 1975 to 60.9 percent in 1990, butthis share is still the largest among the 15 regions in Korea.
3.24 During the impact evaluation study mission, many people in both governments and private sectormentioned that the Seoul and the Pusan regions are now saturated and polluted with no more room fordevelopment and that the era for "delayed industrialization" has come to Cholla with the opportunitiesfor developing with environmental conservation. The public officials and local entrepreneurs areoptimistic about the future prospects:
(i) The "western coast era" with increasing economic ties with China is just beginning (Lee andKim, 1995).
(ii) A half dozen foreign firms have already signed contracts to locate in the Pyung-DongIndustrial Estate. Technology-intensive non-polluting industries are envisaged in the newlydeveloped, national government-financed Science Park with a hi-tech complex.
(iii) Cholla has the comparative advantage of high quality labor and the potential for "eco-tourism" along the southern archipelago.
Necessary Conditions for Success
3.25 The successful implementation of Bank projects, especially the Hanam Industrial Estatecomponent, cannot be explained by the government efforts and operations of the local land market alone.There were critical institutional elements that were exogenous to the region: Korea's civil service systemand education system which did not have regional bias.
3.26 Existing Government Bureaucracy and the System of Career Government Officials (Civil ServiceSystem). Korea had a long tradition of a highly regarded public administration system going back to theYi dynasty, partly owing to the informal caste system which ranked "scholar/bureaucrats" at the top.Even now, the entry level management positions are filled by taking the national "high civil serviceexaminations". Competition for passing these examinations always has been intense. Between 1963 and1985, 157,000 persons took them and only 2,600 (1.7 percent) succeeded (Kim and Leipziger, 1993).Because of this rigorous selection process, a high quality of government officials has been maintained.
3.27 Until the local elections in 1995 (the first since the late President Park abolished them in 1962)the heads of local governments, including mayors and county executives, were on the payroll of theMinistry of Interior and they were periodically rotated with those in the central offices in Seoul. Thelegal and administrative systems were also well developed long before the World Bank projectintervention. Even though provincial and city government officials had no previous experiences ofimplementing World Bank projects or managing a large scale industrial development project, theirlearning was quick (as discussed in chapter 3).
3.28 Strong Education System and Educated Labor Force. Korea has had a long tradition of putting ahigh priority on education. Korea's spending on public education in the 1980s was 3.4 percent of GNP,comparable to other Asian countries, but Korea's spending on private education was 2.5 times more thanother countries. The country's total spending including private education was 10 percent of GNP in 1990(Kim and Leipziger, 1993). Korea's high level of educational attainment did not have regional bias.Cholla's education system, including national universities, was as good as anywhere in Korea. Hence,
33
the region had highly educated manpower and provided a high quality trainable labor force.17
A Caveat on Attribution
3.29 Kwangju's strong economic growth cannot be attributed solely to the World Bank projects perse, but the Hanam Industrial Estate played a major role in the region's industrialization process. Tables2.3 and A1.4 show that 39.3 percent of manufacturing jobs in Kwangju were in Hanam (in 1995); 43.6percent of manufacturing output and 60.7 percent of exports (to foreign countries) were produced by theestablishments located in Hanam (in 1994). Almost all of the exports (98 percent) were from HanamPhase 1, the World Bank financed project.
3.30 What actually happened on the ground can be seen by an example of Daewoo Electronics. Itsplant which was established at Hanam I in 1983, is now the largest in Korea with an annual sale of US$2billion in 1995, of which 70 percent was exported worldwide (including refrigerators, microwave ovens,color TVs, and other home appliances). The plant has 1,800 employees of whom 800 are women. (Ithad 3,800 employees until 1990 when it was downsized with the adoption of new advanced technology.)Within Korea, it has established 1,200 subcontracting firms of which 180 are located in Kwangju and 35at Hanam. The rest are mostly in Seoul and Pusan. Recently, Daewoo Electronics established plants inMexico and China in addition to 22 factories overseas and 47 dealerships worldwide. DaewooElectronics became a world class establishment in merely a little over ten years! 18 A similar story can betold about LG (Goldstar) and Samsung also located in the Hanam Industrial Estate. On the whole, theproject's impacts on the region's manufacturing base, employment and income generation, and generalliving standard were highly significant. Indeed, this experience illustrates the "centrality of side-effects"in project impact evaluation.
3.31 An important caveat of this case study is that it documents project impacts in a country with asustained economic growth. The same projects may fail to generate such impacts in a slow growingeconomy. Also, other regions of Korea developed early on without a similar World Bank intervention.The process of "learning by doing" in other regions provided lessons for the Cholla region. Using a casestudy (historical) approach (para. 1.18) and the Hirschman-Baumol framework (paras. 2.8-2.10),however, this study shows that the World Bank intervention acted as a catalyst in triggering theindustrialization process in the Cholla region which had been excluded from Korea's developmentprocess in the first two decades.19
17. The World Bank's (1993) East Asian Miracle Study singled out education as one of the most important mechanisms forachieving" shared growth". But it did not cover regional disparities in Korea even though the benefits were not "shared" byCholla.
18. Mr. Kyung Suk Seo, Manager, Daewoo Electronics Co., who participated in the construction of its plant at Hanam in 1983kindly met with the impact evaluation mission twice and provided valuable information not only about his firm but also on theestate development in general.
19. During the second impact study mission, a focus group meeting was held at the Ministry of Construction and Transportationwith the five Division Chiefs of MOCT who had implemented the three regional development projects. At the end of themeeting after the four-hour session where the mission presented our findings and tentative conclusions, the following consensuswas reached: (i) the World Bank intervention had the "triggering" effect on the industrialization process in the Cholla region,and (ii) the project implementation significantly contributed to institutional learning at both the national and the local levels, andthe lessons learned became the basis for preparing more World Bank projects in urban and infrastructure subsectors thatfollowed in subsequent years.
35
4. Lessons from Industrial Development
Centrality of Side-Effects: the Hirschman Effect
4.1 This study shows the "centrality of side-effects" in projects. The World Bank-financed project inKwangju triggered the process of industrialization in the region. The project's success and its spillovereffects over time were due to a series of side-effects which contributed to the growth, expansion, andsustainability of the project, which included:
(i) Replicating Industrial Estates: The local authorities learned how to plan, finance, buildand operate large-scale industrial estates on the model of the Hanam Phase I and executedby the city alone three more large-scale industrial estate projects (paras. 3.2-3.6).
(ii) Backward and Forward Industrial Linkages: Satellite industries have been established inHanam. With a strong locational advantage of being near the parent industry, they use as aprincipal input an output of the parent industry or their principal outputs are used as aninput of the parent industry (paras. 3. 7-3.9).
(iii) "Task-oriented" Bureaucratic Behavior: The extension of Hanam I to the second phasewithout the help of MOC or the World Bank was a significant turning point for the citygovernment's institutional learning. Local governments' responsibilities grew rapidly aspromoters and partners of industrial development (paras. 3.10 -3.11).
(iv) Evolution of Local Government Organization and Capacity Building: City governmentsmade many internal changes to their organizations to help change the rules and providemore incentives for industrialists to invest (paras. 3.12-3.13). Moreover, through theimplementation of Bank-financed projects, local government officials improved thecapacity and quality of project management (paras. 3.14-3.15).
(v) Private Sector Confidence and Public-Private Partnership: With a series of devolutionand deregulation, local governments assumed responsibilities as guarantors and managersof "rules of the manufacturing game" for private industrial development (paras. 3.16-3.18).Local governments' passion and commitment to industrial development in the region,
together with changing regulatory and institutional environment, enhanced the privatesector's confidence in the local governments and a strong public-private partnershipemerged (paras. 3.19-3.20).
"Rules of the Game" and Private Sector Responses: the Baumol Effect
4.2 The study shows that the private sector responded in a most productive way to the changing"rules of the game" for industrial development in the region. Not only did the rules change the incentivestructure to the benefits of the industrialists such as a series of devolution and deregulation over time, butthey also changed the behavior of the bureaucracy that led to the creation of an enabling environmentwhere close cooperation and coordination between the local government and the private sector werematerialized. Our analysis shows that these side-effects were initially triggered by the World Bank-financed project which offered such an opportunity to occur. The World Bank-financed projectstrengthened the growth- and task-oriented behavior of government officials. The Bank's 57 missions
36
over twenty years provided a sustained period of institutional learning at all levels of government to thepoint of creating an enabling environment for the private sector in the region.
"Piloting" and "Mainstreaming"
4.3 The risk minimizing project size (Hanam Phase I) turned into a "pilot" and created opportunitiesfor the city government (without MOC or the World Bank) "mainstream" industrial development with itsown follow-up projects. This experience illustrates how a "new project cycle" (Picciotto and Weaving,1994) can achieve the twin objectives of (i) reducing the project risk and lowering the Bank projectfailure rate, and (ii) providing opportunities for institutional learning on the borrower side.
Shortcomings of Industrial Estate Development Strategy
4.4 The Incubator Hypothesis. Previous Bank studies on the "incubator hypothesis" (Lee, 1985a,1985b, and 1989) showed that small new firms with five to ten employees tend to locate in the centralareas of cities to get all the benefits of externalities there. As they grow and need to expand, they tend tomove to outer areas but moving a short distance at a time. The project-financed industrial estates arelocated outside the central city far away from the city center where small new firms cannot afford tolocate. Possible site constraints for small and micro-enterprises and the project's possible negativeimpacts on the growth patterns of small firms are not covered in this study because of the limited scopeand budget.
4.5 Costs of Location Distortions. Previous Bank studies found that in counties like Colombia (Lee,1989) and Thailand (Lee, 1992) where the land market is functioning efficiently, infrastructureinvestment tends to follow the market (Hirschman, 1958, Chapter 5). In the case of the Hanam IndustrialEstate, the Bank-financed project "triggered" the development process stimulating the idle market. Asmentioned earlier, this role of the public sector could be supported by Aoki's (1995) "market enhancingview" and also by North and Thomas' (1973) earlier view of institutional requirements for markets tofunction. Nevertheless, the following negative impacts were observed during the impact evaluationmission:
(i) Lack of Complementary Investments: The main road connection to the Hanam estate was notexpanded until 1992. This was also true in Chonju. Residential and commercial development inthe Hanam industrial area which is only 9.5 kilometers from the city center started only recently.Consequently, most establishments in the Hanam Industrial Estate operate a large fleet ofcompany buses for workers' commuting because of the lack of public transportation. Some largefirms have fifty to a hundred buses. This is a good example of shortcomings of infrastructureprojects where complementary investments were not included in the project design or theirprobable negative side-effects ignored.
(ii) Negative Environmental Effects: Even though pollution control is strictly enforced, windblows toward the city center carrying smoke from the industrial areas in both Kwangju andChonju.
(iii) Land use Patterns: Ten years ago, the location of industrial estates was outside of the cityin both Kwangju and Chonju. Because the cities grew and expanded rapidly, the industrialcomplexes are now close to the newly developed expanding commercial centers. Such locationdistortions may have serious negative impacts in the long run preventing further expansion of thecities outward.
37
Transferability
4.6 On transferability. This report supports the proposition that the patterns of behavioral responses ofindividual actors to the rules of the game transcend time and places. i.e. regional or national boundaries.20What varies across regions or countries is the quality of the rules of the game, for example, "the use ofincentives and organizational design within the public sector to enhance efficiency and to reduce thelikelihood of corruption" (Stiglitz, 1996, p. 174). Such an organizational design, however, can be learnedfrom experiences of other countries. The challenge is to find a mechanism, political or otherwise, to"trigger" the process of such organizational learning. Wade (1993) suggests that "... from time to timeopportunities to make major organizational changes do occur in any society, and at that time it matters whatknowledge of alternative arrangements key policy makers have in their heads." But such opportunities werecreated by policy makers themselves in Korea and other East Asian countries. They did not merely wait forthe opportunities to come.
20. Baumol (1990) shows historical evidence from Ancient Rome, Medieval China and through the Middle Ages.
39
PART II. INTEGRATING ISLAND ECONOMIES INTO REGIONALDEVELOPMENT
5. Project Rationale for Improved Transport Linkages
Island Development: The Baseline
5.1 The Kwangju II project bridges supported the then Ministry of Construction's (MOC) nationalpolicy of island development in a country which has over three thousand islands altogether. Theobjective of this policy is to physically integrate island territory with the mainland through permanentroad bridge connections, where technically feasible, and to extend the development process to theislands. This was the case of coastal islands such as Tolsan and Chindo. The policy also aims to linktogether groups of islands that are too far offshore to be connected to the mainland.
5.2 South Cholla Province (SCP) was an appropriate place to implement MOC's policy. Nearly two-thirds of Korea's islands are situated along the irregular coastline of the province. Increasing the income-earning opportunities of the region's island population was an explicit objective of the Kwangju II projectwhen appraised in 1979 (Kwangju II SAR para. 2.01). At that time, 459,773 people, some 11.5 percentof SCP's population, lived on 318 of the province's 1,921 islands. Physically isolated from economicdevelopment on the mainland, SCP island people were an appropriate poverty target group for theproject. In 1979, their average income was less than half the national average.
5.3 Chindo and Tolsan (the third and the seventh largest islands in Korea) were priority locations forMOC to build access bridges. Through building bridges to Tolsan and Chindo, the largest and mostpopulous coastal islands still without permanent access to the mainland at that time, the Kwangju IIproject aimed to benefit some 25 percent of this target group. Both bridges used an identical cable staysuspension design, the first time such technology had been used in Korea.21 There were longimplementation delays and considerable cost overruns, largely because of the lack of experience inbuilding this kind of bridge in Korea.22 Both bridges were open to traffic at the beginning of 1985, abouttwo years behind schedule. Each having a single cable span of nearly 400 meters, the bridges werenoteworthy engineering achievements.
5.4 Baseline Situation for Tolsan. Tolsan, the seventh largest among Korea's many offshore islands,is separated from Yeosu city on the mainland only by a narrow sea channel four hundred meters wide.Despite its closeness to Yeosu, a major fishing port and third most populous urban center in the SouthCholla region, Tolsan Island was not fully part of the dynamic urban development of the neighboring citybefore the bridge. The lack of a permanent access to the mainland city meant that Tolsan did not providea suitable location for Yeosu workers to live, even though these people were hard put to find affordablehousing within the city of Yeosu itself. Yeosu's rapid population growth and the constraints totopography of the site imposed upon urban development placed a premium upon urban land there.
21. A cable stay suspension design for the Tolsan Bridge replaced the Kwangju 11 project's original design for a less expensivegirder box design. Site conditions and heavy marine traffic along the sea channel precluded the construction of supportingpillars midstream that a girder bridge would have required (Kwangju 11 PCR para. 4.5). The cable stay suspension technologytransfer was effectively replicated in Korea with the construction of the Olympic Bridge over the Han River in Seoul.
22. According to the PCR, causes of implementation delays included: (i) Bank suspension of disbursements on the Tolsanbridge until qualified supervisory consultants were appointed (Kwangju 11 PCR para. 4.7); (ii) interruption of Chindo bridgeconstruction in September 1981 because of lack of government counterpart funds (Kwangju 11 PCR para. 4.7); and (iii)disagreements between the Korean contractors and the bridge supervisory consultants (Kwangju 11 PCR para. 4.14).
40
Before the bridge, Tolsan residents had only a short ferry boat crossing, but normal delays in embarkingand disembarking precluded efficient commuting from Tolsan as an acceptable urban way of life formany. Tolsan Island was, nevertheless, the last major area close to Yeosu that was ripe for urbandevelopment; all that was needed to trigger urban occupation was a permanent link to the mainland thata bridge was to provide. Before such a link, traditional agricultural and fishing activities-always withan eye to the neighboring, if somewhat inaccessible urban market-figured strongly in the island'seconomy. Through its proximity to Yeosu, though, Tolsan's rural economy was different from that foundon more remote islands elsewhere in Korea. Tolsan farmers already produced cash crops on a smallscale, in contrast to the subsistence farming for local consumption typically found in isolated islandcommunities.
5.5 Baseline Situation for Chindo. Chindo is the third largest among Korea's many coastal islands.Although like Tolsan, it is separated from the mainland only by a narrow marine channel, Chindo Islandis more remote than Tolsan for two reasons. First, there is no major urban center adjacent to Chindo onthe mainland itself. Second, abruptly shifting tides in the area can make shipping along the channeldifficult and the ferry crossing unreliable if not dangerous at times. Chondo's isolation ensured that theisland economy before the bridge was different from that found in rural areas on the mainland. Thus,Chindo's population was mostly engaged in agricultural production destined for the local island market,sustained by a population twice as large as found today on the island. Before the bridge, this was not agrowing economy, however. The island population was falling as younger people, especially, soughtmore rewarding opportunities for employment in mainland cities. With falling local demand, Chindofarmers had to retrench. Before the bridge, they could not supply mainland markets, as access using theferry boats was unreliable and costly.
Evaluation Framework
5.6 The direct impacts are limited to territorial incorporation by connecting the islands to themainland and subsequent improvements of transport access. The study focuses on the impacts of thebridges upon regional development. By highlighting income creation among l6w-income islanders, theKwangju II project itself was pointing towards poverty reduction as an important example of a possible"side-effect" of the bridges. As in the case of industrial development, "impacts on the ground" are long-term, indirect, and often unintended. Indirect "side-effects" of the bridges on the islands' socio-economicconditions are documented in Chapters 6 and 7. Times series data allow us to compare the before projectand after project situations. Cross-sectional data describe with project and without project situationssince other islands adjacent to Tolsan and Chindo that were still unconnected by bridges can be used forthe comparison group. The underlying analytical framework in Part II is also that of Hirschman's"centrality of side effects" as described in Part I (para. 2.8).
5.7 Thanks to the bridges, 65,757 people now living on Tolsan and Chindo Islands have permanentlinks to mainland Korea and ready access to the opportunities of Korea's rapidly developing economy.Identical engineering solutions for the bridges were used to end the isolation of each island, but theimpacts were quite different in each case. The Tolsan bridge opened up a new threshold for theexpansion of neighboring Yeosu city, made it possible for the island to become part of that city's largerurban area, and helped an urban community to develop on the island itself. For Chindo, the bridgeallowed the island's economy and community to develop in much the same way as those in rural areas ofmainland Korea did. Chindo residents before the bridge had felt truly isolated. Thus, the bridge's directimpacts succeeded in incorporating both these islands' territories and their indirect impacts led tochanges over time in the way they developed. The different ways in which this happened, however, callfor a separate treatment of each.
41
5.8 Bridges were not a sufficient condition for growth to occur. Tolsan's prosperity over the pastdecade would not have occurred without the rapid growth of the Yeosu urban economy and that of Koreaas a whole. Similarly, Chindo's transformation would not have taken place without the rapid industrialdevelopment and urbanization that has continued in Korea since the bridge opened ten years ago.
43
6. Tolsan Island: A New Threshold for Urban Development
A Solution to Yeosu City's Acute Shortage of Urban Land
6.1 Tolsan Island lies just offshore from the port city of Yeosu on the southern coast of SCP, some110 kilometers to the south-east of Kwangju city. With a current population of some 190,000, Yeosu isthe third largest city in the region. It has one of SCP's most dynamic urban economies that benefits fromthe city's strategic location near to the Kwangyang steel plant, one of the country's most modem, and theYeochon chemical complex, one of the largest. As an important fishing port, 117,000 tons total catch in1994, or 3.4 percent of the nation's total, the city's fisheries sector is a key provider of employment tolocal people. Recognizing the importance of this sector, the Kwangju I project invested US$8.4 millionin the city's fisheries complex to extend harbor quays and piers to allow larger vessels to berth there.
6.2 Yeosu's population was growing rapidly, at about 3.2 percent per annum during the 1970s whenthe Kwangju II project was being prepared (Kwangju II SAR para. 1.07). To help the city cope with itsgrowing population, the Kwangju II project included components to improve: (i) the city's watersupply-US$4.6 million; (ii) low-income housing-US$1.0 million; and (iii) the main city commercialroad-US$1.5 million. While these and other investments provided urban services and infrastructure forthe people of Yeosu, they did not address the basic problem of land shortage facing the city. The uneventopography of Yeosu's site imposed severe physical constraints upon a city needing to open a newthreshold for expansion. This was not only to accommodate its growing population, but also to enhancethe quality of the urban environment by avoiding excessive densities and the overcrowding that theseimply.
6.3 Tolsan Island, just 400 meters across a maritime strait from the city, was a new threshold for theurban expansion of Yeosu. In spite of its large unoccupied space,23 Yeosu city could not spill over on toTolsan Island for the lack of permanent access to the area. When it opened to traffic at the beginning of1985, the Tolsan Bridge provided the necessary link. Now located right within the urban area of Yeosu,
just five minutes by car from the city center, the bridge allowed Tolsan Island to become a part of theurban agglomeration of Yeosu. After the bridge, residents of Tolsan had ready access to Yeosu's urbanservices and to the opportunities of its urban economy. Tolsan began to transform itself into an urbancommunity, with all the advantages, and some of the disadvantages, that this implied. Thesetransformations could not take place before the bridge. Despite close physical proximity, the limitedcapacity of the ferry service prevented effective integration of the island into Yeosu's urbandevelopment. A car journey from Tolsan to Yeosu involving a ferry crossing would take 20-30 minutesbefore the bridge. The same trip after the bridge would take only 5 minutes. At its peak traffic in 1984,the ferries carried only 1,300 vehicles per day, barely 10 percent of the daily trips made across the TolsanBridge today.
Transforming Tolsan's Population into an Urban Community
6.4 Although the Tolsan Bridge is now part of the urban transport network of Yeosu City, theindirect impacts of this bridge upon the population of Tolsan Island itself are more readily discernible.This is because of the different scale of the communities on either side of the bridge. Yeosu's populationis more than ten times larger than Tolsan's. Moreover, Yeosu is a complex medium-sized urban center inwhich the impacts of a single project component like the bridge would be difficult to separate from the
23. Tolsan island-the seventh largest in Korea-has an area of 71.6 square kilometers, 59 percent larger than the built up area ofYeosu City. In 1974, it had a population of 24,015, eight times less than Yeosu's at that time.
44
many other factors at work within the city's economy and community. Tolsan, on the other hand, had arelatively small community of 21,922 people who suddenly found the opportunities and challenges ofYeosu literally at their doorstep uniquely because of the bridge.
6.5 After the bridge, most of Tolsan Island came within a 20-30 minute car commuting radius ofYeosu. Currently the bridge carries some 12,841 vehicles per day, mostly daily commuters. The island'sempty spaces, especially where the bridge makes landfall, can develop as over-spill suburban residentialareas for the first time. On the island's east coast, attractive beach areas have the potential to becomeresidential neighborhoods for higher income commuters. Of course, by itself, the bridge investment wasnot a sufficient condition to transform Tolsan into an urban community. Complementary infrastructureinvestment was also necessary. This included the widening and paving National Highway 17 across theisland during 1984-88 and extending water supply services throughout the island by 1985. Thesecomplementary investments were not financed through the Kwangju 11 project although the appraisaldocument recognized that they would become necessary (Kwangju II SAR para. 7.02 and 7.06).
6.6 Today, some ten years after the bridge was opened, Tolsan population indicators reveal some ofthe indirect impacts of the bridge. Table Al. .11 summarizes key population data for Yeochon County,which includes Tolsan Island, before and after the bridge. Tolsan indicators are compared and contrastedwith those of the County's Other Islands 4 which remain without bridge connections to the mainland, andwhose situation describes what we call a "without-project" scenario.
6.7 After the bridge, Tolsan's population continued to fall. MOC had hoped that its islanddevelopment policy might arrest local population decline, but this was not achieved in the case ofTolsan.25 Out-migration from Tolsan continued at a even higher rate after the bridge than before. Out-migration from Other Islands not connected by bridges-the without-project scenario-was twice ashigh as Tolsan's during 1984-1994. But, before the Tolsan bridge, these Other Islands' rate of out-migration during 1974-1984 was already very high, nearly four times Tolsan's. -Thus out-migration fromTolsan accelerated more rapidly than from Other Islands after the Tolsan bridge opened. These findingsshow us that, contrary to arresting population decline, a bridge such as Tolsan's actually stimulates it.Timely complementary investments such as housing infrastructure could have reversed this trend,however (see para. 6.23).
6.8 While the total population on Tolsan fell, the number of households actually increased after thebridge, reversing a decline that had set in before the bridge (Table Al .11). Such a result would beconsistent with new, smaller urban families moving onto the island. Average household size on Tolsandid indeed fall from 6.4 persons per household in 1974 before the bridge to 4.0 persons per householdafter the bridge in 1994. The shrinkage of household size on the other Islands was even faster, however,from 6.4 to 3.4 persons per household over the same period. A household size of only 3.4 persons issimilar to that found in the predominantly rural Chindo island group (Table Al .14), where there isevidence of families debilitated by the out-migration of their younger working members. Since theaverage Tolsan Island household is significantly larger, with 4.0 members today, we may conclude thaturban settlement made possible by the bridge helped stall households' aging and weakening characteristicof rural islands in Korea. By incorporating the territory of Tolsan into Yeosu's functional urban area, theTolsan bridge helped give a significantly urban look to one aspect of the island's demographics.
24. These islands belong mostly to the Kumogundo group and Kaedo island adjacent to Tolsan. .
25. Continued population loss seems to be a key feature of islands in the South Cholla province still. The SCP islandpopulation had fallen from 459,773 in 1979 to 159,411 in 1994. SCP had 318 inhabited islands in 1979, down to 273 in 1994.In 1979, 11.5 percent of the SCP population lived on the islands; in 1994, only 7.0 percent did.
45
New Patterns of Urban Living on Tolsan Island
6.9 Officially, most of the population of Tolsan is now classified as urban. In 1994, 22.4 percent ofthe economically active population of Tolsan worked in the industrial and service sectors, economicactivities typical of an urban economy. Before the bridge, such urban employment was negligible amongthe Tolsan population. Agriculture, which employed nearly all of Tolsan's economically activepopulation before the bridge, now employs 77.5 percent.
6.10 Access. Daily commuting by Tolsan residents in urban employment in Yeosu's industries andservices became a common pattern after the bridge. Most manufacturing and service industry employeeswho live on Tolsan go to work every day in Yeosu city. Before the bridge, the ferryboat service couldnot support such a commuting pattern efficiently. Today's pattern of journeys to work is typical of anymature urban economy and was made possible through the Tolsan Bridge and its complementarytransport infrastructure (Table 6.1).
Table 6.1: Tolsan Island Road and Traffic Indicators, 1974-1993
Notes: Traffic data refer to 1974, 79, 84, 90, and 94. 1979 figures are KCDI estimates.Source: Yeochon Statistical Yearbooks.
6.11 Due to this complementary investment-made to coincide with the opening of the bridge, but notfinanced through the Kwangju II project-the Tolsan Island road network is now twice as long as it wasbefore the bridge. Meantime, the Other Islands in Yeochon County, the without project scenario,continue to have no paved roads outside the main villages. The number of registered vehicles alsoincreased dramatically on Tolsan, but much of the growth may be due simply to the transfer ofregistration procedures from the mainland to the island. Traffic flows on Tolsan island are neverthelessten times higher today than they were before the bridge. Although precise data does not exist, trafficflows on the Other Islands continue to be negligible.
6.12 On weekdays, 12,841 vehicles per day now use the Tolsan bridge. Owing to daily commutingtrips that it encourages, traffic flows peak during the two to three hour rush in both the morning andevening to some 2,200 vehicles per hour, exceeding the design capacity of the bridge's two-lane roadwayof 2,000 vehicles per hour. Only ten years after its opening and with a long useful life ahead of it, the
26. For being part of the urban road network of Yeosu, the carrying capacity of the Tolsan bridge is evidently affected by thecapacity of related links elsewhere in the network. Our study did not review the efficiency of the Yeosu network as a whole.We assumed that access to the bridge was unimpeded at all times and that there were no bottlenecks in other parts of the networkthat could lead to traffic congestion to "tail back" on to the bridge itself. Under these assumptions, a 2,000 vehicle per hourcapacity flow of mixed mode urban traffic on one lane and in one direction alternating between the morning and then eveningcommute would be possible. Six hours of peak traffic per day (three in the morning and three in the afternoon) could carry12,000 vehicles (6 x 2,000), accounting for 93.5 percent of the daily traffic count reported. Of course, this would mean
46
Tolsan Bridge has itself become a bottleneck. Traffic congestion and tailbacks delay bridge crossingstoday at peak hours. Some Korean officials wanted a four-lane bridge built at the time of appraisal, butBank missions were not convinced that the growth in traffic would be as fast as projected. A secondbridge was, however, approved by MOC in 1996 and needs to be completed soon to allow commuting tocontinue to expand and Tolsan's newly formed urban community to consolidate.
6.13 Urban Services. Better access after the bridge also meant that Tolsan residents could make dailyuse of Yeosu City's urban services, particularly for health and education, just as easily as people living inYeosu city itself. Yeosu City authorities reported to the impact evaluation mission, however, that actualuse of these services by Tolsan residents did not increase dramatically after the bridge. The fact that theTolsan community now has better services of its own on the island itself may explain this apparent lackof growth. After the bridge opened, three new schools and 3 new health clinics opened on Tolsan, forinstance. With a smaller population, urban service per family living on Tolsan has increasedsignificantly. Meantime, there has been no significant improvement in the provision of these services onthe Other Islands that, without bridge connections, remain in a situation of rural isolation. That Tolsanresidents could readily use Yeosu's services may be very important to them in a psychological sense,even if they do not fully avail themselves of their new opportunities. Thanks to the bridge, people inTolsan can now reliably use emergency services available in Yeosu twenty four hours per day, should theneed arise. Those living on other Coastal Islands without a permanent link to the mainland still have toface a sea crossing which, however short, still poses a major barrier to access to such services, especiallyat night.
6.14 Land Prices. Another important indicator of an urban community in the making is the buoyantdemand for urban homes on Tolsan. In real terms, residential land values on Tolsan increased at anannual rate of 10.6 percent during the 1974-94 period, somewhat less than the 11.7 percent annual ratefor Yeosu City itself (Table 6.2). There was such a strong demand for the residential land on Tolsan thatits price increased more than seven-fold in real terms during 1979-1984, a period of only five years.Unfortunately, data was not available to illustrate comparative trends for the without project scenariosince the Other Islands in this area had practically no market in urban real estate to speak of during thisperiod. Yeosu city itself still remains the preferred residential location for urban living in this area. Thevalue of land for residential development in the city was nearly three times higher than equivalent landon Tolsan in 1994. This helps to make Tolsan housing less expensive than Yeosu's, so that Tolsan is aplace where younger families-including those from Yeosu itself-can more easily acquire their firsturban home. Furthermore, with its attractive natural environment of beaches and open space, Tolsancould become one of Yeosu's prime residential areas in the future. These natural assets were alwaysthere, but they only became accessible after the bridge. The Tolsan Woodoo housing scheme, once theKLDC sewerage impasse is resolved, should give a great boost to residential development. Built next tothe Yeochon County office and near the Tolsan Bridge, the development covers 96 hectares. Whencompleted, it will provide 4,602 houses for 18,000 people, practically doubling the island population.
negligible traffic flows outside the peak hours. Visits of the impact evaluation mission to the Tolsan took place at an off-peaktime, when there was little traffic using the bridge.
47
Table 6.2: Tolsan Island and Yeosu City:Average Urban Land Prices, 1974-1994
Constant 1994 won per pyong
Before Tolsan Bridge After Tolsan Bridge
TOLSAN ISLAND 1974 1979 1984 1989 1994
Serviced housing land 19,690 12,227 87,924 116,524* 128,000Serviced commercial land 131,269 61,135 106,8888 110,909 149,000
YEOSU CITY 19741 1979 1984 1989 1994
Serviced housing land 45,944 183,404 149,988 210,586 373,000Serviced commercial land 328,173 305,674 508,580 477,329 998,000
Notes: CPI to convert from current to constant prices: 1974=19.7; 1979=42.3;1984=75.0; 1989=92.1; 1994=129.3; 1 pyong =3.3058 square meters.
Source: Yeochon County Office.
6.15 The value of commercial land on Tolsan, on the other hand, barely rose at all-only 0.6 percentper annum during 1974-1994. Yeosu city's commercial land value, by contrast, grew at a steady 5.7percent per annum over the same period. The relatively slack demand for this kind of land on Tolsanreflects the still embryonic stage of the urban economy there. An urban community is indeed in theprocess of formation, but it is still a predominantly suburban residential one at the present stage.
Increased Tourism
6.16 There are many tourist attractions on Tolsan Island, including extensive beaches and a number ofhistorical sites. These places existed before the Tolsan bridge was opened, but they were inaccessible toall but a few, more adventurous tourists or sailors. Tourists visiting Tolsan before the bridge were so fewthat statistics were only kept from 1984 onwards (Table 6.3). In that last year prior to the bridgeopening, only 84,000 tourists came to Tolsan. Since then, growth has been dramatic, reaching 1.6million visitors in 1993. Since the bridge, tourism to Tolsan increased ten times faster than in Korea as awhole.27 Most of the visitors to Tolsan make day trips. Despite their short stay, tourists on Tolsan helpinject some 2.5 billion won (US$3.1 million)28 into the island economy each year, according to theYeochon County Yearbook. The sharp increase in the number of restaurants operating on the Islandafter the bridge, and the lack of new hotels is evidence of the kind of day-trip excursion the touristsmake. More than one third of these visitors, 590,000 each year, make a trip to the nationally famousHangilam site. The Pangjukpo beach area is also popular with visitors.
27. Between 1989 (343.2) and 1996 (449.8), the number of tourists in Korea will grow at a annual rate of 3.9 percent, accordingto the Korean Transport Institute's Medium and Long Term Plan for Tourism, dated 1995.
28. Throughout this report, we convert 1994 and more recent won to US dollars using an exchange rate of 800:1.
48
Table 6.3: Tolsan Island Tourism Indicators, 1974-1993
Before Tolsan Bridge After Tolsan Bridge
1974 1979 1984 1989 1993
INDICATORS number number number number number
Tourists - 84,000 1,182,000 (1) 1,585,000 (2)Hotels/inns in operation I 1 2 2 2Restaurants in operation 15 15 33 60 121Restaurants planned (3) - I 1 3 16Other facilities planned (3) 9 20 4 25 18
6.17 Private investors, perceiving the potential for further expansion of tourism on Tolsan, havebegun to invest in the sector on the island. Of particular note is the Musulmok Resort Development Planin the south-east of Tolsan, planned to open in the year 2000. To support this development, the YeochonCounty government plans to invest 10.2 billion won (US$12.8 million) in infrastructure (access roadsand parking lots) over the next four years. This project, with a total government expenditure of US$18million is expected to trigger US$147 million of private investment-eight times the initial public sectoroutlay-in the form of the construction of tourism facilities. The Kwangju II project itself made nodirect investment in tourism in Tolsan, but none of the tourism development we have discussed wouldhave been feasible without the Tolsan bridge provided through the project, a significant side-effect.
Bridge Impact Upon Activities in Rural Areas
6.18 Fisheries: Before the bridge, Tolsan Island was a traditional fishing and farming community.By improving access to markets on the mainland and beyond, the bridge helped the local fisheriesindustry develop by allowing it to supply distant urban markets more easily. Output increasedsubstantially after the bridge opened. In 1994, 15,908 tons of fish products were shipped out of Tolsan,nearly twice the last before bridge shipment of 8,750 tons in 1984. The 10.9 percent annual growth ofTolsan's catch is considerably higher than the average of 2.7 percent per annum for the country as awhole. In order to further stimulate the local fishery industry, the provincial government is planning toinvest 3,900 million won (US$4.9 million) to build a Comprehensive Fishery Exhibition Center.
6.19 Not only did the bridge make the shipment of perishable products-such as fresh fish-morereliable, it also led to a reduction of transport costs from Tolsan by an average of some 40 percent,according to the Yeochon County authority. New high value products, such as clams, lobsters and crabsnow account for 6.9 percent of the volume of fishing products shipped. Some even make their waythrough Yeosu to Seoul and even to export markets, especially in Japan. At the same time, theseproducts are appreciated by tourists to the island, who can savor them at one of the many new restaurantsthat have recently opened there.
6.20 Floriculture: Within the agricultural sector, the opening of the Tolsan bridge allowed an entirelynew agricultural activity to prosper, namely the production of cut flowers. Tolsan's farmers were always
49
able to ship vegetable products to Yeosu before the bridge, using the available ferry service. After thebridge, though, they were able to ship higher value perishable products, like cut flowers, more reliablyand cheaply. Floriculture thus became firmly established on the island after the opening of the TolsanBridge (Table 6.4). Before the bridge, there were practically no commercial shipments of flowers to themainland. Activities began to pick up in 1984, in anticipation of the bridge opening. After the bridge,output in 1994 had risen to 6.3 million stems, generating annual sales of 2.1 billion won (US$2.7million). In the years before the bridge, there had been no flower producers on Tolsan. By 1994, 74establishments were engaged in the business, cultivating an area of 33.6 hectares. From the evidence ofthis case, we can see how the bridge was able to provide conditions for an entirely new economic activityto develop.
Table 6.4: Tolsan Island Production of Cut Flowers, 1974-1993
Before Tolsan Bridge After Tolsan Bridge
INDICATORS 1974 1979 1984 1989 1993
Producers (number) - - 3 37 74Cultivated area (hectares) - - I 18 34Output (thousands of stems) - - 151 5,492 6,349
Total income (thousands of - 33,527 1,344,102 2,142,957constant 1994 won) 3 1 0 2,142,957
Notes: CPI series used to convert from current to constant prices: 1984=75.0; 1989=92.1;1993 = 121.7; 1994=129.3.
Source: Yeochon County Office.
Environmental Impacts
6.21 So many changes in Tolsan's economy and the consolidation of an urba n life style are bound toaffect the island's environment. Evidence of serious island environmental degradation after the openingof the Tolsan Bridge is scarce, however. Pressure upon the land from residential development is stillrelatively small on an island whose population density is still only 238 persons per square kilometer.Even so, reports of environmental violations became much more common after the Tolsan Bridge (TableA1.12). Before the bridge, there were no such reports at all. From the limited data available, though, wecannot be sure whether increased environmental violations are due to more rigorous enforcement ofenvironmental standards in recent years or whether they are due to a real deterioration of the Tolsanenvironment.
Impacts Upon Local Government
6.22 After the Tolsan Bridge opened in 1985, Yeochon County's administrative capacity strengthenedas its responsibilities and workload grew. Before the bridge in 1984, the County employed only 35engineers to supervise urban development projects. Today, the County employs 60. Now, the County isvery active in reviewing and approving applications for urban development, a function that waspractically non-existent before the bridge. In 1993, the County received 183 applications to approveprojects for residential and commercial development. In the meantime, local administration on the OtherIslands not connected by bridges has remained weak and unchanged over the years. From this
50
evidence, we may conclude that an important side effect of the Tolsan Bridge was to hasten changes inlocal government on the island in preparation of the challenge of managing urban development.
Need for Complementary Infrastructure
6.23 Much additional investment, in access roads, utilities and community equipment, was necessaryfor the bridge impacts to be felt on the island. With its strong ownership of the Kwangju II project,central government made funds readily available to finance infrastructure not formally within the scopeof the project itself. Thus, for the most part, the central government and local authorities recognized thatthe Tolsan Bridge was a necessary condition for island development but not a sufficient one. Animportant exception was the delayed implementation by KLDC of the sewerage system for the Woodooresidential development on Tolsan island. Although all other infrastructure and utilities wereimplemented at the site, occupation certificates could still not be awarded to the site owners at Woodoobecause of the lack of sewerage to the area. As a result, a major investment project remains tied up at thetime of writing without delivering any real services to its potential beneficiaries. The opportunity cost ofsuch an idle investment is considerable, with annual benefits foregone of the order of US$ 6.9 million.29
A clear lesson of the project experience is that complementary public investment must be provided in atimely fashion if project impacts are to be fully realized.
Economic Rate of Return
6.24 The PCR lower re-estimate of the Tolsan Bridge of 11.5 percent, compared with the appraisal's29.0 percent, indicated that this was, nevertheless, still a worthwhile investment from an economic pointof view (Kwangju II PCR p. 32). This was in spite of the seven-fold increase in the cost of the bridge,resulting from the replacement of the cheaper girder box design by the much more expensive cable staystructure and the higher than expected costs of materials. The PCR treated benefits as consisting ofvehicle operating cost savings (about 70 percent of total) and time savings (about 30 percent of the total).The continuing economic feasibility of this investment in adverse cost conditions probably derives from:(i) higher unit value of benefits in line with the trend of rising costs in the Korean economy; (ii)importance of time savings through the improvement to an essential intra-urban link used primarily forcommercial and journey-to-work purposes; and (iii) heavier than expected traffic flows leading theTolsan Bridge to reach design capacity sooner than expected. Thus, traditional cost-benefit analysis onits own regards the Tolsan Bridge as a worthwhile investment, even if the many beneficial side-effectsidentified by our impact evaluation study were not taken into consideration.
29. A very conservative estimate based upon 4,602 deposits of 10 million won (for 100 square meter units) yielding an annualinterest of 12 percent. The estimated value of the deposit is only one quarter of what is required for a similar dwelling inKwangju city, for instance. At the same time, it must be recognized that the Tolsan bridge's traffic capacity for commuters issaturated and it would not be able to handle the doubling of commuting flows that the full occupation of the Woodoo site wouldimply (details: para. 6.12).
51
7. Chindo Island: Incorporating as Part of the Mainland
Chindo: No Longer an Island
7.1 Chindo Island is located at the south-western tip of the Korean peninsula. The nearest importantcity is Mokpo (231,519 population in 1994), now some 90 kilometers by road. Kwangju City (1,273,854population in 1994) is 132 kilometers away. Dependence upon coastal shipping before the bridge madeChindo look to Mokpo as the principal external focus of its economy. After the bridge, with the roadjourney taking less than two-and-a half hours, Kwangju took on this role.
7.2 With an area of 427 square kilometers, Chindo is Korea's third largest island. At the time of theKwangju II project appraisal, it was the largest coastal island in Korea still without a bridge connectionto the mainland.30 Being rich in natural resources and with fertile agricultural land covering 29.7 percentof its area, Chindo was easily self-sufficient in local agricultural produce. Only a narrow sea channelseparates Chindo from the mainland, but strong maritime currents along that channel made ferrycrossings dangerous under certain tide conditions, fostering the sense of isolation of the islandcommunity.3 1 This led many Chindo islanders to seek opportunities on the mainland. Out-migration, ofyounger people in particular, ensured the steady decline of the island population since its peak of110,351 inhabitants in 1968-69.
7.3 Before the bridge, Chindo's isolation gave the island economy a different structure from thatfound in rural areas on the mainland. Whereas mainland rural areas in Korea began to supply rapidlygrowing urban markets with cash crops, vegetables and fruits in the 1960s and 1970s, inaccessibility cutChindo off from these markets. Before the bridge, therefore, little agricultural produce was sent off theisland and similarly, few processed goods were imported from the mainland. The Chindo bridgechanged all that and in 1985 provided a permanent link between the island and the mainland for the firsttime, effectively ending Chindo's isolation. After Chindo's bridge access to Korea's main urban centers,the island's economy and community took on similar characteristics to those rural areas on the mainlandthat were equally distant from main urban markets. Chindo's farm and fishery products, for instance,gained access to these rapidly expanding markets on the same terms as those produced on the mainland.Shipping times from Chindo to main urban centers such as Kwangju and Mokpo were halved. Costswere reduced. In addition, regular bus services, for example, now ply between Chindo and KwangjuCity three times an hour every day of the week, just as they do between cities and towns on the mainland.Before the bridge, even a simple public transport service such as this was not possible.
Restructuring Chindo's Rural Economy
7.4 In allowing trade in agricultural products to take place between Chindo island and the mainlandon a large scale for the first time, an important side effect of the bridge was to encourage a shift of islandagricultural production in favor of higher value cash crops for sale to urban markets. Labor intensivesubsistence farming almost vanished. As a result, a smaller share of the population was engaged inagriculture after the bridge. Even so, output increased significantly. Cash cropping was much moreproductive and mechanized, as can be seen from the sharp increase of agricultural machinery on Chindoafter the bridge (Table Al.13).
30. Large islands off Korea's southern coast that already had bridge connections were Koje and Namhae. A bridge connectionto Korea's largest island. Cheju is not feasible, however. Cheju lies some 70 kilometers offthe southern tip of the peninsula.
31. It was in this sea channel that Korean admiral Soon Shin Lee inflicted a celebrated defeat upon Japanese naval forces at theBattle of Ul Tol Mok in 1597.
52
7.5 Before the bridge in 1974, only 14.8 percent of Chindo's farm output was cash crops, fruit andvegetables, for shipment to the mainland. At the same time, 85.2 percent of agricultural output wasmade up of traditional crops, such as rice and barley, mostly for consumption on the island itself. By1994, ten years after the bridge opened, the proportions of cash and traditional crops in the total wereinverted: 60.3 percent cash crops and 39.7 percent for local consumption. The growing demand fromthe mainland was not for Chindo's traditional crops, such as rice and barley. It was for peppers, garlic,onions, Chinese lemons and fruits of the Chinese matrimony vine, all of them products that Chindo couldsupply on a large scale. Another factor that encouraged the shift into cash crops was export. Chindo'sdeclining population (Table Al .14) meant that the island's own market for food products was itselfshrinking. There were simply fewer people to feed.
7.6 Total agricultural output on Chindo almost doubled between 1974 and 1994, from 50,325 tons to99,828 tons (Table Al.13). During that period the total cultivated area barely increased at all and thenumber of people engaged in agriculture fell significantly, both trends indicating productivity gains. Thechanges were most rapid from 1984 onwards, after the bridge was opened. We may conclude therefore,that an important side-effect of the bridge was to accelerate the modernization and restructuring ofagriculture on the island.
Impact Upon Islanders' Standard of Living
7.7 Expanding more productive agriculture, the mainstay of the Chindo economy should translateinto higher absolute levels of income per capita for the population that remains on the island. Since1980, when data first became available, the gross regional product (GRP) of Chindo has grown very littlein real terms, however (Table 7.1). There was a rise of GRP per capita after the bridge opened, but thisincrease was largely due to the decline of Chindo's population. Chindo's increase in GRP per capita wasalso much slower that than for Korea as a whole over the same period, meaning that, in relative terms,incomes have declined on Chindo. Before the bridge in 1980, Chindo's GRP per capita was 48.6 percentof the national average. By 1992, after the bridge, it was only 32.8 percent of the national average.Chindo's income per head had risen with the bridge but not as fast as in the country as a whole. Thebridge brought only modest prosperity to Chindo, not as much as developed on the increasinglyurbanized mainland. As it intended, therefore, the Kwangju II project did succeed in increasing theincome earning opportunities of the islanders but did not prevent income disparities with the mainlandfrom widening even further. The urban/industrial economy of the mainland was simply moving aheadtoo fast for that to happen.
53
Table 7.1: Chindo Island Gross Regional Product, 1974-1992(constant 1994 won)
Before Chindo Bridge After Chindo Bridge
CHINDO ISLAND 1974 1980 1984 1991 1992
Population (number) 104,031 83,423 75,389 56,975 52,890GRP (millions of won) n.a. 96,062 119,732 115,677 106,249GRP per capita (thousands of won) n.a. 1,152 1,588 2,030 2,009
KOREA 1974 1980 1984 1991 1992
Population (thousands) 34,692 38,124 40,513 43,268 43,663GDP (billions of won) 50,335 90,251 125,238 255,210 267,723GDP per capita (thousands of won) 1,451 2,367 3,091 5,898 6,132
Notes: CPI series used to convert from current to constant prices: 1974= 19.7; 1980=54.5;1984=75.0; 1991=109.3; 1992= 116.1; 1994=129.3.
Sources: Korea Statistical Yearbook, National Statistical Office.Chindo Comprehensive Plan. 1994-2002, Chindo County Office, 1994.
7.8 An additional factor that helped improve the standard of living of island residents after thebridge is the generally lower level of consumer prices, according to Chindo County officials. Detailedhistorical data for Chindo price levels is not available, but it is reasonable to expect that, after the bridge,prices would approach those of the mainland, following integration of mainland and island wholesale andretail markets and the reduction of transport costs. As well as allowing Chindo's produce to be exportedmore reliably and cheaply, the bridge permitted industrialized goods from the mainland and further afieldto be imported to the island more efficiently. The impact evaluation mission's inquiries confirmed thatthe prices of many consumer goods in Chindo were similar to those prevailing in nearby urban marketson the mainland. Chindo County officials reported that island prices had been higher than those on themainland before the bridge.
7.9 The impact of the Chindo Bridge upon land prices is worthy of attention in view of the dramaticchanges that occurred on the island. Serviced residential land on Chindo in 1994 was worth, in realterms, one hundred times its value in 1974. The value of commercial land increased even more rapidly,multiplying more than two hundred times between 1974 and 1994 (Table 7.2). Although actual pricelevels in Chindo are still much below land values in cities throughout the region, the bridge did bringChindo territory within the scope of the modem real estate market in Korea. By contrast, the verymodest price increases of real estate on the Other Islands in the Chindo area highlights the sluggishnessof still isolated markets in inaccessible places. In 1974 before the bridge, Chindo residential land wasworth two-and-a-half times similar land on the Other Islands. By 1994 after the bridge, Chindo land wasworth fifteen times as much. With more buoyant agriculture on the island, the demand for rural land onChindo led to an increase in agricultural land prices, which are now at a similar level to those found inrural areas throughout mainland Korea. Without bridge access, the price of island fanning land growsonly very slowly, as the data for the other Islands in the Chindo area show (Table 7.2).
54
Table 7.2: Chindo Island and Other Islands: Average Urban and Rural Land Prices, 1974-1994
Constant 1994 won per pyong
With-project Scenario Before Chindo Bridge After Chindo Bridge
CHFTrDO ISLAND 1974 1979 1984 1989 1994
Serviced housing land 177 86 11,316 - 181,500Serviced cormmercial land 249 134 40,209 - 547,525Agricultural land 72 37 116 - 34,485
Without-project Scenario Before Chindo Bridge After Chindo Bridge
OTHER ISLANDS (1) (without bridges) 1974 1979 1984 1989 1994
Serviced housing land 66 34 222 - 1,189Serviced commercial land 85 40 222 1,225Agriculturallanid~ -53 24 55 _750-
Notes: (1) Shin Nan County covering a neighboring island group. CPI series used to convert fromcurrentto constant prices: 1974=19.7; 1979=42.3; 1984=75.0; 1989=92.1; 1994=129.3.
1 pyong = 3.3058 square meters.Source: Yeochon County Office.
Modest Urban Development Impacts
7.10 Chindo is still predominantly a rural economy, and the bridge stimulated only modest urbandevelopment. The County capital, Chindo Town, administered as a district ('myon') council underKorea's local government arrangements, has nevertheless become a key service center for the islandeconomy. Although its population has fallen, Chindo Town remains the largest urban center on theisland, with a population of 12,159 in 1994 (Table Al.14). The rate of decline of the town's populationhas been much less than that of the population of the island as a whole. Before the bridge in 1974, it waswhere 15.7 percent of the island residents lived. After the bridge in 1994, Chindo Town accounted for24.0 percent of the total island population. Chindo Town today provides important communications andfinancial services for an island economy firmly integrated into mainland markets. It is also the principalservice center for the population as a whole. In 1994, Chindo had eleven hospitals and clinics, more thantwice the number it had in 1974 when the island population was twice as large.
Accelerated Out-Migration
7.11 By ending the isolation of Chindo and helping to incorporate the island economy into that of themainland, the bridge had a major indirect impact upon the people living there. Contrary to stalling thedeparture of residents from Chindo, the bridge seems to have helped accelerate out-migration modestly.Island residents continued to search for even better economic opportunities on the mainland (TableA1.14). In the decade after the bridge was completed (1984-94), Chindo's population fell at a annualrate of 0.9 percent. During the decade before the bridge (1974-84) the rate of decline was slower, 0.5percent per annum. Chindo had 50,659 inhabitants in 1994, barely half the 1979 population of 92,168when the Kwangju II project was appraised. On the other hand, declining population is a characteristicof rural Korea in general.32 Despite its acceleration immediately after the bridge, the decline of the
55
Chindo population has been slower than the rural average for Korea and for the Other Islands stillunconnected by bridges.
7.12 Since younger breadwinners are the ones most likely to migrate, they leave behind them smallerhouseholds and an aging population. In 1974, the average Chindo household had 5.8 members; theequivalent figure for 1994 is only 3.3 persons. Chindo's household shrinkage occurred more rapidly thaniit did in rural Korea as a whole (5.7 persons in 1974; 3.4 persons in 1993), but the present household sizeon Chindo is now close to the national average for rural areas. At 14.7 percent of the total in 1993, theshare of people over 60 years old in the population in Chindo is nearly twice as large as in Korea as awhole, which was only 7.7 percent in 1990. One Chindo resident told the impact evaluation mission that"a 50 year old is considered to be a young man here". A businessman running a small construction firnnreported that it was difficult to keep younger workers who were "always attracted to the bright citylights" on the mainland. An indirect indicator of the aging of Chindo's population has been the drop inthe number of primary schools from 41 in 1974 to only 27 in 1994. Examples of trends such as thesefrom Chindo may be found in many rural areas on the Korean peninsular.
Impact on Tourism
7.13 Tourism to Chindo benefited enormously with the advent of the bridge. Chindo island has rmanytourist attractions, the most important of which is the tidal phenomenon known in Korea as the "miracleof Moses". At certain times of the year, strong neap tides expose a causeway, allowing visitors to walktwo kilometers "through the sea" from Chindo to a small adjacent island. On peak days, traffic jams ofvisitors to this phenomenon tail back 2 kilometers from the site, where the county authorities have builtan enormous car park, with unfortunately adverse environmental impacts through the sheer volume ofvisitors that it allows. In 1994, 1.5 million visitors came to Chindo, an annual increase of 4.6 percentsince the bridge opened (Table 7.3).
Table 7.3: Chindo Island Tourism Indicators, 1974-1994
Notes: (1) data for 1982; (2) data for 1990; (3 ) data for 1993.Sources: Chindo County June 1995 Mission Briefing Note.
32. In 1974, Korea had a rural population of 13, 459,000 (2,381,000 households). In 1993, it was only 5.407,000 (1,592,000households). During 1972-76, agriculture, forestry and fishing accounted for 24,7 percent of GDP. During 1987-91, this scctuoaccounted for only 9.4 percent.
56
7.14 Facilities for tourists have increased substantially (Table 7.3). Before the bridge in 1974, Chindohad only 7 hotels/inns and 14 tea-houses. In 1994, ten years after the bridge opening, there were 29 and58 respectively. A better road system after the bridge opening helped tourism considerably. Before thebridge in 1974, only 3.4 kilometers of the island's 168 kilometer road network was paved. By 1994, 55kilometers out of a 199.8 kilometer network were. Current tourism projects under way include twonational resorts, at Hae-Dong and Nokjin, covering a total area of 195 hectares (590,000 pyongs).Altogether, it is expected that these will involve public investments to the value of US$ 2.6 million ontop of the US$2.2 million already invested so far. The bridge and its complementary infrastructure madeit possible to exploit Chindo's natural beauty for the purposes of tourism on a large scale.
Environmental and Social Vulnerability
7.15 As a result of the large influx of tourists to Chindo made possible by the bridge, the naturalenvironment of some coastal areas has suffered from heavy vehicular traffic especially. Although airpollution from vehicle emissions has not proved yet to be a serious problem, irregular parking of privatevehicles has damaged the natural vegetation cover and accelerated the erosion of the sea-front and beachareas in many places. After the bridge, there have been a number of reported violations of air and waterpollution norms. Before the bridge, there were none at all (Table A 1 .15). With respect to theenvironment, the bridge ended Chindo's isolation, bringing the island face to face with kind of challengeconfronted by rural areas that have a tourism vocation throughout mainland Korea.
7.16 County officials also report higher crime rates on Chindo since the opening of the bridge.Clearly, many unoccupied houses still containing household possessions are attractive and easy prey forburglars. Also, alcoholism may be a factor in crime on an island that now has 17 bars, when before thebridge it had at most only two. From the data available, crime rates on Chindo were higher after thebridge than before (Table A 1.1 5). At the same time, it should be acknowledged that crime is only aminor problem on Chindo compared with that of mainland cities. Traffic accidents increased togetherwith traffic flows, but again at much lower levels than on the mainland.
Impacts Upon Local Government
7.17 Despite the dramatic impacts of the bridge on Chindo Island, and the growing revenues of theChindo County authority, the formal administrative organization of local government on the island hasremained unchanged for more than two decades. Responsibilities and workloads nevertheless increasedafter the bridge. Before the bridge and shortly after its completion, the Chindo County authority wasonly an observer, albeit an astute one, of events unfolding on the island. Major public investments onChindo after the bridge, such as the paving of the national highway across the island, were made by thenational government. Recently, the County Government has developed a more forward looking planningfunction through the preparation of the 1994-2002 Chindo Comprehensive Plan. In hindsight, a moreactive stance by local authorities could have been achieved earlier if an operation like the Kwangju IIproject had provided greater technical assistance support for local government. This would have helpedthem anticipate unintended side-effects and formulate and implement plans to curtail unsatisfactoryimpacts and ensure that the satisfactory ones are sustained.
Is Chindo Better or Worse-Off?
7.18 Having identified the many impacts of the bridge upon the island economy and community, animportant question that remains unanswered is whether the Chindo people are better off-in a broadsense-today than they were without the bridge. We can begin to answer this question if two issues are
57
initially clarified. First of all, we must recognize that, in addition to affecting those people who still liveon Chindo today, the bridge's impacts also affected the lives of a large number of former residents whoare now living somewhere else in Korea. In assessing the overall impact of the bridge, we should ideallywant to learn how well off both groups are. Today's residents, in terms of income, are somewhat betteroff than they were before the bridge, although their incomes have increased more slowly than forKoreans as a whole over the 1974-1994 period. As for former residents of Chindo now departed fromthe island, we unfortunately do not have any data on their present economic and social status on themainland.
7.19 Secondly, we have to make a judgment upon the quality of rural life in modern Korea today. Forthose who believe the quality of rural life has improved, the impact of the bridge would thus have madeChindo people better off, since the islanders now live and work in similar ways to those living in otherrural parts of Korea. There can be no doubt that the impact of the bridge has severely disrupted thetraditional way of life of Chindo Island, though. Many Chindo people have gone away, houses are leftempty and a huge influx of tourists places parts of the island under severe environmental and socialstress. On the other hand, as incomes on the island are higher than before the bridge, the remainingpopulation has more opportunities to earn a decent living today and enjoys greater access to goods andservices in today's urban centered economic development of Korea. The bridge allowed thesedevelopments to take place and bring Chindo into the mainstream of modern rural development, eventhough improvements on the island still come more slowly than in urban areas on the mainland. Onbalance, we conclude that the islanders are better off thanks to the territorial incorporation made possibleby the bridge.
Economic Rate of Return
7.20 According to the PCR re-estimate of the ERR of the Chindo Bridge of 18.3 percent, comparedwith the appraisal's 16.0 percent, this was a worthwhile investment from an economic point of view(Kwangju 11 PCR p. 32). That the PCR found a higher ERR than at appraisal, in spite of cost overruns of263 percent due to increased materials costs, is surprising. For the PCR estimate, benefits consisted ofvehicle operating costs savings (about 8 percent of total) and time savings (about 92 percent of the total).As in the case of the Tolsan Bridge, benefits were valued more highly in the PCR estimate in line withgenerally rising cost levels in Korea. Traffic flows on Chindo are, however, less than half Tolsan's.Since the majority of Chindo's traffic is for tourism purposes only, the time saved by these visitors to theisland has little economic value for two reasons: (i) tourists would not have visited Chindo without thebridge, preferring to visit more accessible areas on the mainland and, therefore, do not save any time in ameaningful sense; and (ii) whatever time loss there may be has little opportunity cost. If time savingswere removed from the benefit equation, the ERR for the Chindo Bridge falls to only 0.03 percent as thepresent value of the benefits barely exceeds the present value of the costs. 3 3 Clearly, a traditional cost-benefit analysis would not recommend the Chindo Bridge as a worthwhile investment without heavilyfactoring in supposed time savings. A positive assessment of the many side-effects that our study hasidentified would nevertheless support investment in the Chindo Bridge. There can also be no doubt thatthe bridge fully and immediately achieved its intended direct impact of physically incorporating newterritory.
33. By contrast, the ERR of the Tolsan Bridge would fall to only 8.3 percent if time saving benefits were excluded from thebenefit stream on that case.
CZA
59
8. Lessons from Integrating Island Economics
8.1 Territorial Incorporation Itself is Immediate. By permanently linking these islands to themainland, both bridges succeeded in incorporating new territory on which the urban and industrial-basedprocess of economic development in Korea could eventually be played out. Physical isolationimmediately ceased, especially on Chindo, where people suddenly found themselves within themainstream of Korean development for the first time. The experience of implementing these bridges andthe awareness of their impacts gave governments at all levels increasing confidence to incorporate moreterritory through bridge construction among the many coastal islands still isolated from the mainland andfrom each other.
8.2 Impacts in Urban and Rural Areas are Different. Tolsan Island was very close to the importanturban area of Yeosu city. Chindo was remote from urban centers. The impacts of the bridges were quitedistinct in each case. Contiguous with the Yeosu City urban area after the bridge was built, TolsanIsland became part of it. The Chindo Bridge's main impact was to allow the transformation of a ruralsubsistence economy into an export-based agriculture producing cash crops for urban markets on themainland. After the Chindo bridge, the island economy became much like the local economies ofmainland rural areas in Korea.
8.3 Profound Structural Change can be an Important Side-Effect. After the bridges the isolation ofthe residents of the islands ended. In an economic and social sense, they ceased to be "islanders".Psychologically, the horizons of both the Tolsan and Chindo communities were broadened. Chindoislanders especially broke with the stigma of feeling cut off from the mainstream of contemporaryKorean society and modem economic development. While many residents left the islands altogether toseek better economic opportunities on the mainland, those who remained could enjoy a somewhat higherstandard of living through new economic opportunities on the islands themselves. For Tolsan islanders,this involved daily commuting to Yeosu that the bridge made possible up to the point that its capacitybecame saturated. In the case of Chindo, it involved working in a modernized agricultural sector or inthe rapidly growing tourism business on the island. The structural changes in the respective islandeconomies also brought some social disruption and pose environmental challenges to them. Thesenegative impacts are but one more indicator, albeit an undesirable one, of the incorporation of the islandsinto the mainstream of Korea's rapid economic development.
8.4 Anticipating Opportunities for the Private Sector. Private sector agents seized new economicopportunities that the bridge impacts provided. In Tolsan, major private investment is under way in realestate development of urban housing after the bridge. Significant private sector ventures are also beinglaunched in the tourism sector of both islands. Farmers on both Tolsan and Chindo have madesignificant investments in machinery to increase output. For territorial incorporation to succeed inhelping economic development, it is essential that opportunities for profitable private sector investmentbe unleashed. Reviewing the likelihood of such opportunities arising should be part of the planning andappraisal exercise of such projects. This exercise would be one of trying to identify ex ante some of thepossible indirect impacts, which most development projects tend to omit.
8.5 Forward Looking Plans with Complementary Infrastructure. New prospects can induce speed ofchange that exceeds the public sector's ability to respond. The bridges fulfill a necessary but notsufficient condition for the beneficial impacts discussed in this report to occur. It is essential forcomplementary infrastructure investment to be made in access roads and utilities, for instance. From theevidence gathered by our study, the indirect impacts of the bridges were many and varied. While theactual form that these impacts take cannot always be foreseen accurately, scenarios should be drawn at
60
least of their likely thrust and general direction. The experience of these two bridges shows that forwardlooking impact plans should be part of design of projects aimed at territorial integration. As a minimum,these plans should indicate: (i) necessary complementary investment project by the public sector; and(ii) identification of opportunities for private sector investment. The lack of a plan for the "day after"from the Kwangju 1I project may have prevented some of the projects' positive indirect impacts frombeing fully realized, particularly in the case of the residential development in Tolsan noted above (para.6.23). Technical assistance to prepare and monitor a forward looking impact plan ought to be a standardfeature of projects of this kind in the future.
61
References
Amsden, Alice H. 1989. Asia's Next Giant: South Korea and Late Industrialization. Oxford UniversityPress.
Anas, Alex; Kyu Sik Lee and Michael Murray. 1996. Infrastructure Bottlenecks, Private Provision. andIndustrial Productivity: A Study of Indonesian and Thai Cities. Policy Research Working Paper No.1603. The World Bank, Washington, D.C.
Aoki, Masahiko; Kevin Murdock, and Masahiro Okuno-Fujiwara. 1995. "Beyond the East Asian Miracle:Introducing the Market Enhancing View." Center for Economic Policy Research Publication No.442,Stanford University.
Baumol, William J. 1952. Welfare Economics and the Theory of the State. Harvard University Press.
Baumol, William J. 1986. "Productivity Growth, Convergence, and Welfare: What the Long Run DataShow." The American Economic Review. 76:1072-1085.
Baumol, William J. 1990. "Entrepreneurship: Productive, Unproductive and Destructive." Joual ofPolitical Economy. 98:893-921.
Baumol, William J. and Kyu Sik Lee. 1991. "Contestable Markets, Trade and Development." The WorldBank Research Observer. 6:1-17.
Cho, Soon. 1994. The Dynamics of Korean Economic Development. Institute for International Economics,Washington, D.C.
Choe, Sang-Chuel and Byung-Nak Song. 1984. "An Evaluation of Industrial Location Policies for UrbanDeconcentration in Seoul Region." Journal of Environmental Studies. 14:73-116.
Coase, Ronald. 1960. "The Problem of Social Cost." Journal of Law and Economics. 3:1-44.
Hirschman, Albert 0. 1958. The Strategy of Economic Development. Yale University Press.
Hirschman, Albert 0. 1995. Development Projects Observed. The Brookings Institution, Washington, D.C.
Kim, Kihwan and Danny M. Leipziger. 1993. Korea: A Case of Government-Led Development (TheLessons of East Asia). The World Bank, Washington, D.C.
Korea Institute for Economics and Technology. 1995. Metropolitan Development Plan: IndustrialInfrastructure and Promotion. (Interim Report in Korean) Seoul.
Lee, Gun Young and Yong Woong Kim. 19-95. Globalization and Regional Development in Southeast Asiaand Pacific Rim. Korea Research Institute for Human Settlements.
Lee, Kyu Sik. 1985a. "Decentralization Trends of Employment Location and Spatial Policies in LDCCities." Urban Studiea. 22:151-162.
62
Lee, Kyu Sik. 1985b. An Evaluation of Decentralization Policies in Light of Changing Location Patterns ofEmployment in the Seoul Regions. Report No. UDD-60, Water Supply and Urban DevelopmentDepartment, The World Bank, Washington, D.C.
Lee, Kyu Sik. 1989. The Location of Jobs in a Developing Metropolis: Patterns of Growth in Bogota andCali. Colombia. Oxford University Press.
Lee, Kyu Sik. 1992. "Spatial Policy and Infrastructure Constraints on Industrial Growth in Thailand."Review of Urban and Regional Development Studies. 4:17-31.
Lee, Kyu Sik and Alex Anas. 1992. "Costs of Deficient Infrastructure: The Case of NigerianManufacturing." Urban Studies. 29:1071-1092.
Lee, Kyu Sik; Alex Anas and Gi-Taik Oh. 1996. Costs of Infrastructure Deficiencies in Manufacturing inIndonesia, Nigeria, and Thailand. Policy Research Working Paper 1604, The World Bank,Washington, D.C.
Lee, Kyu Sik and Sang-Chuel Choe. 1990. "Changing Location Patterns of Industries and UrbanDecentralization Policies in Korea," in Jene K. Kwon, ed. Korean Economic Development. GreenwoodPress, New York.
Monnet, Jean. 1978. Memoirs. Doubleday (translated into English by Richard Mayne).
Murray, Michael. 1988. Subsidizing Industrial Location: A Conceptual Framework with Application toKorea. Johns Hopkins University Press.
North, Douglass C. 1990. Institutions, Institutional Change. and Economic Performance. CambridgeUniversity Press.
North, Douglass C. 1994. "Economic Performance Through Time," The American Economic Review.84:359-368.
North, Douglass C. and Robert P. Thomas. 1973. The Rise of the Western World. Cambridge UniversityPress.
Picciotto, Robert and Rachel Weaving. 1994. "New Project Cycle for the World Bank?" Finance andDeyelopment. The World Bank, Washington, D.C.
SaKong, ll. 1993. Korea in the World Economy. Kim Yong Sa, Seoul, Korea.
Song, Byung-Nak. 1990. The Rise of the Korean Economy. Oxford University Press.
Stiglitz, Joseph E. 1996. "Some Lessons from the East Asian Miracle." TheWorld Bank Research Observer.11:151-177.
United States General Accounting Office. 1990. Case Study Evaluations. Program Evaluation andMethodology Division (Transfer Paper 10.1.9).
United States General Accounting Office. 1991. Designing Evaluations. Program Evaluation andMethodology Division (GAO/PEMD- 10.1.4).
63
United States General Accounting Office. 1992. The Evaluation Synthesis. Program evaluation andMethodology Division (GAO/PEMD- 10.1.2)
Wade, Robert. 1993. "The Governance of Infrastructure: Organizational Issues in the Operation andMaintenance of Irrigation Canals." Background paper for 1994 World Development Report, The WorldBank.
Williamson, Oliver E. 1995. "Transaction Cost Economics and Organization Theory." in O.E. Williamsoned., Organ*zMaon The=. Oxford University Press.
World Bank. 1993. The East Asian Miracle: Economic Growth and Public Policy. World Bank PolicyResearch Report, Oxford University Press.
World Bank. 1994. Twenty Years of Lending for Urban Development Operations. Report No. 13117.Operations Evaluation Department, Washington, D.C.
Yin, R.K., and K.A. Heald. 1975. "Using the Case Survey Method to Analyze Policy Studies."Administrative Science Quarterly. 20:371-381.
65
Annex 1. Statistical Tables
Table Al .1: Sectoral Composition of Employment, 1975 and 1990
1975 1990
Agriculture AgricultureRegion and Fishery Manufacturing Services and Fishery ManufactLiring Services
Note: (1) Data for 1993.Source: Chindo County Statistical Yearbook.
83Annex 2
Project Description and Timelines
Korea: Secondary Cities Regional Project (Loan 1070-KO)"Kwangju I Project"
Objective/costs: Components:Assist the Borrower in Part Aestablishing a regional (i) Preparation of housing sites with services in Gwangju city covering a total area ofdevelopment program about 37 ha and providing about 1370 lots of 35 py about 350 lots of 50 py andin Gwangju region about 180 lots of py (US$4.5 million - 18.0% of total)
(ii) Construction of a fishery harbor complex in the Gukdong area of Yeosu including:the construction of about 829m of landing and berthing quays, and about 240mof piers and abutments; the construction of fishery harbor buildings andinfrastructure for the harbor complex: the development of industrial sites withservices for the establishment of fish processing plants for the fishing industry;and the procurement and installation of handling equipment and navigationalaids (US$ 8.5 million -34.0% of total)
(iii) Construction of a city market in Suncheon covering an area of about 3.3 ha with abuilding space providing for retail stalls, a sheltered area for fresh produce andadditional unpaved surface for the market held every fifth day (US$0.8 million- 3.2% of total)
(iv) Construction and improvement of about 6.6 km of access roads (including fivebridges) in Yeosu and Mogpo to connect the housing sites to industrial orcommercial sites and to other centers of activity of the two cities (US$2.8million - 11.2% of total)
Estimated total cost: Part B. Provision of Consultants' servicesUS$25.0m. (inc. (i) to assist GRDU' Project Manager in the formulation and implementation of the workUS$4.6m. price and program referred to in Section 3.02 of this Agreement (US$0.3 million - 1.2%US$2.Im physical of total)contingencies) (ii) to assist MOC in the review of regional development policies at the national level ofBank Loan: US$15m. Government, the evaluation of the housing sites and services experience, the
formulation of a housing policy and training of MOC's regional planning staff(US$0.5 million - 2.0% of total);
(iii) to assist the Borrower's Office of Fisheries in the management and operation of theYeosu fishery harbor complex, including the assessment of costs and charges,the preparation of a financial plan and of a planning program for futureexpansion of the harbor complex (US$0.5 million - 2.0% of total);
(iv) for the preparation of a program to improve the operation and management of watersupply systems in Gwangju City, Mogpo, Yeosu and Suncheon, includingshort-term improvements to be financed by available resources under thebudgets of GCG, MCG, YCG and SCG respectively; and:
(v) to carry out feasibility studies and the preparation of selected projects to be identifiedunder regional physical planning studies which are being carried out by theUnited Nations Development Program and MOC, including, inter alia, thepreparation of plans for sewerage and night soil disposal in Gwangju City andMogpo (US$0.5 million -2.0% of total)
84Annex 2
Korea: Second Gwangju Regional Project (Loan 1758-KO)"Kwangju II Project"
Objective/costs: Components:
To further enhance a. Housing: nearly 3,950 serviced residential plots in Gwangju, Mogpo andthe development of Yeosu with expandable core-houses designed mostly for low-incomethe Gwangju Region families ($44.6 million - 28.8% of total))
b. Industrial Estates: about 200 ha of serviced industrial land in Gwangju andMogpo to accommodate 16,000-20,000 employees (cost: $64.7 million- 41.8% of total)
c. Water Supplv: improvements to water supply systems in Mogpo, Yeosu andNarudo including transmission, treatment, distribution and operations(cost: $13.4 million - 8.7% of total)
d. Transportation: construction of two bridges to link Dolsan and Jindo islandsto the mainland and improvements to a 1.9 km commercial road inYeosu and ferry service between Narodo and mainland ($19.5 million -12.6% of total)
e. Fisheries: an aquaculture development program aimed at enhancingfishermen's incomes and a storage facility at Imja Island for tiny saltedshrimp to prepare Kimche (national dish) ($7.0 million - 4.5% of total)
Estimated total cost: f. Technical Assistance in the areas of regional planning, including an islandUS$ 154.8 m. development study, aquaculture development, water supply systemBank Loan US$65 operation and management, and preparation of a third regional projectmillion ($5.6 million - 3.6% of total)
85Annex 2
Korea: Jeonju Regional Development Project (Loan 2388-KO)"Chonju Project"
Objectives/costs: Components:
To assist in Party A: Housing Estate (US$9.1 million - 6.4% of total)promoting economic (1) preparation of a housing site in Iri City covering an estate of about 60,000 pydevelopment and consisting of low-income, middle-income and commercial plots andcreating complete with public facilities including water, sewerage, power,employment telephones and streets.opportunities in the (2) Provision of loan facilities for purchase of, and construction on, low incomeJeonju Region, plots.particularly throughthe improvement of Part B: Industrial Estates (US$18.3 million - 12.8% of total)infrastructure and Preparation of industrial sites complete with public facilities including water,living conditions in sewerage, power, telephones and streets in (a) Iri City covering an estatemajor urban centers of about 140,000 py consisting of plots ranging in area from 400 py toand the promotion 10,000 py each, and (b) Jeonju City covering an estate of about 200,000of economic py consisting of plots ranging in area from 400 py to 10,000 py each.development in thepoorer mountain Part C: Water Supply (US$14.6 million - 10.2% of total)areas and islands Upgrading of the water supply system of Jeonju City through the construction of
the service reservoir of 7,000 cu.m capacity and about 21 km ofdistribution pipelines.
Part D: Drainage Improvement and Flood Control (included in water supplyabove)
Construction of a retention basin and a network of interceptor and drainagechannels and provision of additional lift pumps to control flood watersfrom the Mangyeong River flowing south of Iri City
86Annex 2
Part E: Tourism Development (US$ 36.0 million - 25.1% of total)(1) Development of the Mt. Jiri National Park tourist resort area through: (a)
preparation of a tourist site and construction of an access road inNamweon City to accommodate construction of about 700 rooms forlodging including basic infrastructure such as water, sewerage, power,streets, parking and landscaping and supporting tourist facilities; and (b)construction of mountain tourist roads from Yugmojeong to Deogdong(about 19 km) and from Banseon to Cheonunsa (about 25 km).
(2) Development of the Mt. Naejang National Park tourist resort area throughconstruction of a tourist access road between Naejangsa andBaegyangsa (consisting of upgrading of about 10 km of existing road &construction of about 6 km of new road).
(3) Development of the Seonyu Island tourist resort area through theconstruction of two foot bridges linking Seonyu Island with theneighboring two islands in the Seonyu Island group and extension of theexisting landing jetties on the three islands
Estimated total cost:US$ 143.3m. (inc. Part F: Transportation Development (US$26.6 million - 18.6% of total)US$27.m. price and (1) Construction of a bridge, approximately 350m. long and lOm wide, toUS$8.5 m. physical connect sections of National Road No. 27 at Woonam, inc. about 3 kmcontingencies) of approach roads.Bank Loan: (2) Upgrading of about 32 km of National Road No. 19 between Namweon andUS$60m Gurye in Jeon Nam Province.
(3) Construction of a road of about 11 km long and lOm wide to provide a linkbetween the proposed industrial estate in Iri City and National Road No.26.
Part G. Technical Assistance (US$2.2 million - 1.5% of total)Carrying out of a preparation study and training for future regional and urbandevelopment projects
87Annex 2
Project TimelinesKwangju-I (Loan 1070-KO)
Date: Process: Missions: Disbursements: Works ending: Comments1972 (06) ident. I
(11) ident. ll1973 ____ __(02) prep. I ___________ _____
1979 - CLMO changed its name to K(wangju)LMO- Chindo jurisdiction upgraded from village to district adminstration ("myun" to "eup").
1980 - General Chun seizes power in military coup. Kwangju riots begin.- Yolsan jurisdiction upgraded from village to district administration (-myun- to "cup").
1981 - KLMO closed and absorbed into MOC lri Land Dev. Office (ILDO)- Namwon was upgraded as a city ("shi") administration of Chonbuk province.
. 1986 - Kwangju city jurisdiction upgraded to become a 'direct adminstration' city (jickhamsir), with greater autonomyfrom central government, and city area extended to absorb four neighboring counties ("ku').
- Yeochon jurisdiction upgraded to a city ("shi")
I 1987 - MOC Iri ILDO coordination dept. abolished.- Students riots nationwide.- Democratization with election of Pres. Roh.
l 1988 - Kwangau city absorbed one more county (Kwangsan Ku)- Mokpo City jurisdiction upgraded through addition of one more county
1992 - MOC Iri ILDO became a Regional Development Division (RDD)
1994 - MOC Iri RDD down-sized to 2 depts/19 staff.- Yeochon County office relocated to Tolsan Is.
1995 - Dismemberment of Seo county in KwangJu creating Namgoo as Kwangju city's sixth.
2. Laws and Regulations affecting Industrial DevelopmentlDate: Event:
1971 - First National Land Development Plan (1972-1981) formulated.
1973 - National "Land and zoning arrangement' law determined urban land zoning by local govt.- Designation of green belt around Kwangju City.
1974 - Central govt. designates six industrial bases nationwide (Song 1990 p. xvi)
1975 - Kwangju City Master Plan prepared and approved by MOC.
1977 - Chonju City Master Plan prepared and approved by MOC. Indicated land for industrial use.
1978 - Hanamr area zoned for industrial use.
1981 - Set of national laws supporting: (i) private sector development; (ii) private funding; (iii) balanced regionaldevelopment; (iv) small and medium-sized businesses; and (v) industrial location.
- Chonnam Province development plan was prepared for the first time.
1982 - Second National Land Development Plan (1982-1991) formulated.
1985 - .twangju City zoned more industrial land.
1987 - New Chonju Master Plan.
1990 - National law completely delegated land use planning and zoning responsibilities from KLDC to local governments.
1991 - Kwangju City zoned land for Hi-tech IE for industrial use.- Construction Technology Quality Control Law.- Industrial Location and Development Law.
1992 - President Kim announces new policy of de-regulation for industrial development.- Kwangju City zoned land for Pyung Dong IE for industrial use.
1993 - Kwangju City zoned some 25% of former agricultural land for industrial use.- De-regulation: old law allowing only one LPG supplier per district was revoked.
1994 - Regionally Balanced Development and Small/Medium-sized Industry Development Law
1995 - Kwangju's "direct administration" status consolidated under national Autonomy Law.- Establishment and Management of Regional Development Fund Law.Kwangju city increased the "set-back" on lEs, allowing plot coverage by building to increase from 60% to 80%.
- National Environment Law (enacting provisions of Rio Earth Summit of 1992).- Attempts to update Chonju' s Master Plan.
3. Reorganization within Local Governmentl Date: Event:
1980 - MOC minister came from Kwangju.
l 1981 - Public sector development group set up within Chonnam province to promote infrastructuredevelopment in the region.
1985 - Kwangju City established a special Industrial Estate Planning Division with a staff of five.
l1986 - Kwangju City issued bonds to vale of US$49.6 million (39.7 billion won) to help finance new PyongDong E.
1987 - Hanam E Site Office opened as a "one-stop shop" with a staff of 17.
1994 - Chonbuk Province established an International Trade Office in order to attract FDI.
1995 - Chonbuk Province established Chonbuk Development Corporation.- Chonju City set up a Finance and Economic Bureau (FBB) for industrial and small businesspromotion.
- Iksan City set up a similar FBB.- Hanam IE Site Office staffing down to 9.
_~~~ -_. -____ -
94Annex 3
4. Strengthening Capabilities of Local GovernmentDate: Event:
1979 - Saemael education and training program for administrators and engineers in Chonnam province.
1980 - "Developmental administration" given for the first time to 120 local government employees.- Chonnam Province computer section opened.
1981 - Governor of Chonnam Province (until 1984) was an entrepreneur for the first time.- Chonnam Province computer room facility completed.- Kwangju City acquired its first main-ftame IBM computer.
1983 - Staffing of Kwangju City Industrial Development Division (IDD) began to decline.- Chonnam Province office room of computerization personnel opened and promoted.
1985 - Local government training course for junior high level staff given.
1987 - Local government training course for high level staff in charge of regional economic given.
______.--__________________________________________________1988 - Local government training course for "local administration in autonomy" given.
- Kwangju City collects taxes from most of Hanam IE phase I occupants as five year tax holiday ends.
1990 - Local government training courses in (i) local legislation; (ii) local economy; and (iii) foreignlanguages given.
1992 - Office automation and computers course given to local government officials for the first time.- Chonju City began selling plots in Chonju-III IE.
Note: The average represents the average percentage of the value of output or
inputs for each type of firm.Source: Impact Evaluation establishment survey, 1995.
106Annex 4
Table A4.10 Firms Very Satisfied with Present Location by Type of Firm(percentage of total in each category)
Movers within MoversAttribute of present location New Kwangju/Jeonnam from outside All
Plant capacity 6 3 0 4Cost of land for expansion 0 0 0 0Availability of skilled workers 0 3 0 1Availabliity of unskilled workers 0 3 0 1Quality of public utilities 0 3 0 1Quality of municipal services 0 0 0 0Road access 14 37 50 28Proximity to clients 8 5 17 8Proximity to suppliers 0 0 0 0Amenities of zone 0 0 0 0Number of establishments 36 38 6 80
Note: (1) Public utilities include electricity and water supply.(2) Municipal services include police and fire protection.(3) Amenities include parks, recreation facilities, and air quality.
Table A4.11 Firms Very Satisfied with Precent Location by Zone(percentage of total in each category)
Att of present location Hanam Hanam Hanam Bonchon Sochon Songam Other All1 2 3
Plant capacity 4 7 0 10 0 0 0 4Cost of land for expansion 0 0 0 0 0 0 0 0Avail of skilled workers 0 0 0 0 0 25 0 1Avail of unskilled workers 0 0 0 10 0 0 0 1Quality of public utilities 0 0 0 0 10 0 0 1Qual of municipal services 0 0 0 0 0 0 0 0Road access 30 43 43 30 10 25 8 28Proximity to clients 13 21 0 0 0 0 0 8Proximity to suppliers 0 0 0 0 0 0 0 0Amenities of zone 0 0 0 0 0 0 0 0Number of establishments 23 14 7 10 10 4 12 80
Note: (1) Public utilities include electricity and water supply.(2) Municipal services include police and fire protection.(3) Amenities include parks, recreation facilities, and air quality.
EMPLOYMENT LOCATION SURVEYFOR KOREA IMPACT EVALUATION STUDY
Name of person responding to survey:Position:
ESTABLISHMENT CHARACTERISTICS
1. Name of EstablishmentTelephone Number
2. Address of Establishment Si (Gun!, Gu.Dong (Eup, Myeon!
3. This establishment is:
(1) a single-establishment operation. [Go to question 7](2) headquarters of a multi-establishment operation.(3) a branch of a multi-establishment operation.
If (3), answer question 4. If (2) answer 5 and 6.
4. Name of parent company:Location:
(1) within this city(2) within this province(3) outside this province ( si or gun)
5. How many establishments does your firm operate?
6. Where are they located? How many?
(1) within this city(2) within this province(3) outside this province ( si or gun)
7. When was this establishment founded? 19_ year.
116
Annex 5
8. When did this establishment first operate at this location? 19_ year.
9. Which of the following three categories describes your establishment's location history?
(1) was newly founded at this location.(2) was relocated from another location within this province.(3) was relocated from another location outside this province.
If (1), do not answer questions (53) through (64).
[All questions from here on are with respect to the establishment located at the address as specifiedin Question (2) above.]
PLANT CHARACTERISTICS
10. What are the major products manufactured at this establishment? List up to three in order ofimportance (For example, women's clothes, leather shoes, automobile parts, etc.).
(1)-(2)(3)
11. Roughly, how many pyeongs is the land area of the plant site?
(I) Rent. . pyeong(2) Own _ _ pyeong
12. Roughly, how many pyeongs of total floor space does your plant have?
(1) rent _ _ pyeong(2) own _ _ pyeong
13. How much is (was) the value of your lot per pyeong?
(1) now _ _ won(2) when moved here _ _ won
14. Do you have some land space reserved for plant extension?
At present plant site:(1) substantial (2) adequate (3) not much (4) none
Next to the present plant site: -(1) substantial (2) adequate (3) not much (4) none
117
Annex 5EMPLOYMENI
15. How many full-time employees at this establishment? (persons)
male female(1) management(2) skilled workers(3) unskilled workers(4) total
16. How many full-time employees did you have when you first started operation here?persons.
17. Roughly, what will be the maximum number of employees in case of full-capacity operation
(including part-time workers)? persons.
18. Roughly, what are the average monthly wage rates (including bonus payment)?
19. On the average, how many (8-hour) shifts are run at the plant?
(1) one shift (2) two shifts (3) three shifts
20. Where do most of your employees live? Please give rough percentage estimates to thefollowing categories:
(I) dormitory at plant site %(2) immediate neighborhood (Dong) %(3) within this Gu or Gun (Si) °(4) adjacent Gu or Gun (Si) %(5) other Gu or Gun (Si) %
Total 100%21. What proportion of your employees travel to work by:
(1) dormitory or plant site %(2) foot %(3) bicycle (or motorcycle) %(4) commercial bus %(5) company bus %(6) car %
Total 100%
118
Annex 5
SHIPMENT OF OUTPUTS AND INPUTS
22. Roughly, what percentage of the value of output shipped within Korea by:
(1) truck only %(2) rail only %(3) truck-rail combination %(4) truck-water combination %(5) air (during any part of the trip) %(6) other, please specify %
Total 100%
23. Roughly, the percent of the value of raw material inputs shipped within Korea by:
(1) truck only %(2) rail only %(3) truck-rail combination %(4) truck-water combination %(5) air (during any part of the trip) %(6) other, please specify %
Total 100%
24. What percent of your products are sold in the following areas?
(1) within this city %(2) within this province %(3) outside this province, but within Korea %(4) internationally %
Total 1 00%
25. Roughly, what proportion of your products is used mainly as inputs of other industries?(1) 0% (2) 1-20% (3) 21-40% (4) 41-60% (5) 61-80% (5) 81-99%(6) 100%
26. What percent of your raw materials and/or input components are bought in the following areas?
(1) within this city %(2) within this province %(3) outside this province but within Korea %(4) intemnationally %
Total 100%/o
27. Roughly, what proportion of your inputs is outputs of other industries?
28. Do your employees have problems with commuting to this location? (Choose three in orderof importance) 1. 2. 3.
(1) There is no bus or subway route.(2) There is a route, but needs a long wait.(3) The fair is too high.(4) Too crowded.(5) Takes too much time.(6) No problems.(7) Other, please specify
PUBLIC SERVICE AND GOVERNMENT INCENTIVE SCHEMES
29. How much public service does vour plant require?
substantial= I modest=2 little=3 almost none=4
(1) electricity(2) water(3) telephone(4) police protection(5) fire protection(6) banking
30. On the average, how frequently are public utility services interrupted?
almost none= I once a month=2 once a week=3 twice a week=4more than twice a week=5
(1) electricity(2) water
31. Do you supply electricity or water with your own facilities?
Yes=l No=2
(1) electricity(2) water
32. What do you think of the following public service in this area?
excellent = I good enough = 2 not enough = 3 very poor = 4
120
Annex 5
(1) electricity(2) water(3) telephone(4) police protection(5) fire protection(6) banking
33. Who removes and treats the waste? Please estimate the percentage of waste treated by thefollowing:
(I) your firm %(2) local authority %(3) private contractor %(4) others %
Total 100%
34. In case the local authority removes the waste, what do you think of their service?
(1) excellent (2) good enough (3) not enough (4) very poor
35. How is the waste water treated? Please estimate the percentage of waste-water treated by thefollowing:
(1) self-treatment at the plant %(2) collective-treatment facility in the area %(3) local authority (Si, Gun) %(4) combination of self-treatment and local %
authority(5) other, please specify %
Total I 00%
36. What types of pollution are generated by your plant operation?
(1) air (2) water (3) noise (4) odor (5) soil(6) other, please specify
37. If your plant generates pollution, how good are your pollution control facilities?
(1) complete (2) not enough (3) none
38. Did you receive any instruction from the government because of the pollution controlproblem?
Yesl No=2
121
Annex 5
39. If yes, which of the following applies to your case?
(1) to change the production process(2) to install pollution-control facilities(3) to relocate to other location(4) to pay a fine(5) other, please specify
40. What taxes that you pay affect your business operation most seriously? List in order ofimportance.
(1)(2)(3)
SUMMARY EVALUATION OF PRESENT LOCATION
41. Please evaluate how you feel about your present location by the factors listed below:
very satisfactory: I satisfactory: 2 not satisfactory: 3 (enter in first column)very important: I important: 2 not important: 3 (enter in second column)
(1) land area:(2) building space:(3) rent payment (including building land):(4) availability of skilled workers:(5) wage of skilled workers:(6) availability of unskilled workers:(7) wage of unskilled workers:(8) cost of public utilities (electricity,water, etc):(9) quality of public utility services:(10) proximity to suppliers:(I 1) proximity to customers:(12) proximity to competitors:(13) highway access:(14) railroad access:(15) availability of nearby land for plant expansion:(16) cost of nearby land for plant expansion:(17) proximity to related services: repair, main-
tenance, banks, and other business services:(18) property tax burden:(19) local government services (fire protection,
road maintenance, etc.):(20) cost of local government services:(21) security (crimes, etc.):
122
Annex 5
(22) pleasant surroundings:(23) recreational facilities:(24) local community attitudes towards this
establishment:
PAST TRENDS AND FUTURE PROSPECTS
42. What has been the average growth rate of your establishment in terms of output (or sales) over thepast 5 years?
(1) declined: % per year(2) no growth:(3) increased: °'o per year
43. What was the value of sales in 1994? (million won)
(1) domestic:(2) export:(3) total:
44. How much do you anticipate your establishment will grow in the next five years?
(1) grow quite substantially(2) grow substantially(3) grow slightly(4) remain the same(5) decrease(6) not sure
PLANS FOR CAPACITY EXPANSION OR RELOCATION
45. Do you have any plans for expanding within the next five years?
Yes= I No=2 [Go to 49]
46. If yes: is this expansion likely to take place:
(1) here at this location:(2) another location in this city: Gu or Dong(3) another location in this province: Si (Gun), Gu(4) another location outside this province: Si (Gun) Gu
47. Roughly, how many workers will you hire as a result of this expansion?
123
Annex 5
48. How much additional floor space will you require? pyeong
49. Do you have any plans for relocating the entire operation from the present site to another location inthe next five years?
Yes= I No=2
50. If yes, is the new location likely to be:
(1) in this city: Gu or Dong(2) in this province: Si (Gun), Gu(3) outside this province: Si (Gun), Gu
51. Roughly, hiow would y our labor force change?
(I) will increase by persons.(2) will decrease by persons.
52. How much additional floor space will you require?
pyeong.
COMPARISONS WITH PREVIOUS LOCATION[Note: answer only if answered (2) or (3) in question 9.]
53. Previous location:
(I) in this city(2) in this province(3) outside this province (Si or Gun)
54. Roughly, what is the distance between the present and previous location? Km
55. How would you best describe the condition of your previous plant just prior to your move from it?
(1) in good condition, but cramped(2) in good condition, but obsolete(3) still serviceable(4) wom out
56. Compare the situation at the present location as of one year after the move with those at theprevious location for the following items:
no change=O increase=I decrease=2
124
Annex 5
(1) production (or sales)(2) land area(3) building space(4) rent payment per pyeong(5) number of skilled workers(6) monthly wages of skilled workers(7) number of unskilled workers(8) monthly wages of unskilled workers(9) commuting distance for managers(10) commuting distance for workers(I 1) output delivery distance( 12) input delivery service( 13) local tax payment(14) profits(15) public utility costs
57. Any changes in the quality of the following public services afier the relocation?
Substantially improved= somewhat improved=2 unchanged=3 became worse=4
(I) received a government relocation order(2) to receive the benefits from government incentive schemes(3) land price(4) factors related to plant operations
59. Was your relocation forced because of public action? Choose three in order of importance.1. 2. 3.
(1) highway construction expansion(2) urban renewal project(3) relocation order because of pollution(4) zoning regulation
125
Annex 5
(5) other, please specify(6) not applicable
60. List three location characteristics that you considered to be most important (excludinggovernment incentive schemes such as credit subsidies or tax exemption) when you chose thepresent location. (List in order of importance. If needed, the interviewer should assist therespondent by referring to question 41.)
(1)(2)(3)
61. Did you consider the alternative sites before you made the decision to choose the presentlocation?
yes= I no=0
62. If considered, where were the locations?
(I) in this city(2) in this province(3) outside this province (Si or Gun)
63. Roughly, what percent of your labor force stayed with you when your firm moved to the newlocation (as of about one year after the move)?
64. Did you receive credit subsidy or tax exemption for plant expansion because you moved fromprevious location?
yes= I no=0
INT1ERVlEWER!S REMARKS
Immediately after the interview, write your opinions about the reliability of responses, the extent ofcooperation, names and titles of other people who were present at the interview and their influences, theparts which were the most difficult to answer, and the parts with unclear answers.
If the interview was rejected, or was impossible to carry out, explain why (for example, busy; too manyquestions; such a firm does not exist, etc.)
127
Annex 6
LIST OF PEOPLE INTERVIEWED
The list contains the persons interviewed during the two impact evaluation missions in June 1995and February 1996. The list does not include all of the staff members of the respective agencies and firmswho were present at the meetings. (The persons marked with asterisk were visited during both missions.)
LOCAL STUDY TEAM IN KWANGJU:
Kwangju-Chonnam Development Institute. KwangjuDr. Chang-Soo Moon, President*Dr. Jong-Pyung Jeon, Senior Researcher*
Honam University. KwangjuProf. Jae-Oh Kim, Department of Business Administration*Prof. Sangho Kim, Department of Economics*
LOCAL STUDY TEAM IN IKSAN:
Wonkwang University. Iksan (formerly Iri)Prof. Yang-Jae Lee, Department of Urban PlanningProf. Dong Ho Shin, Department of Urban Engineering*
SOUTH CHOLLA PROVINCE:
Provincial GovemmentMr. Jae Goo Song, Vice Governor*; Vice Mayor of Kwangju City since 1996Mr. Ki Seung Nam, Director, Bureau of Construction*
Kwangju CityMr. Wun-Tae Kang, MayorMr. Young Shik Jeong, Vice MayorMr. Young Rok Oh, Director, Industry Division*Mr. Yong-Bong Chung, Director, Regional Economic DevelopmentMr. Jae Sook Ro, Director, Budget OfficeMr. Young Ju Shon, Director, City Planning Division
Mogpo CityMr. Jae Ho Ahn, MayorMr. Kyung Ju Koh, Vice MayorMr. Sang-Chea Seo, Director, Construction Bureau
Yeosu CityMr. Deok-Hyoung Moon, Mayor
128
Annex 6
Yeocheon County (Gun)Mr. Sang Ok Lee, County ExecutiveMr. Dai Won Cho, Director, Regional Economic Development
Jindo County (Gun)Mr. Pyung Eun Lee, County Executive
Hanam Industrial Estate. KwanuguMr. Seung Yong Lee, Director of Administration*
Chonnam National University. KwangjuProf. In-Sang Song, Department of Urban and Regional Planning
Kwangju Chamber of Commerce and IndustryMr. Hong-Soon Ahn, Secretary GeneralMr. Soon-Hyung Park, Director of Research
Kumho & Co., Inc.Mr. II Ham, President*Mr. Cha Y. Cho, Managing DirectorMr. Ahn Seok Kim, General Manger
LG Electro-Components Ltd. (Goldstar)Mr. Yoon-Shik Lim, Plant ManagerMr. Bu-Young Park, Manager, General Administration
Daewoo Electronics Co.. Ltd.Mr. Kyung Suk Seo, Manager, General Administration*
Asia Motors Co.. Inc.Mr. Jae Hoon Kim, Plant ManagerMr. Bong Seoung Kim, Manager, Public Relations
Moodeung Plastic Industrial Co.. Ltd.Mr. Woo Youn Kim, Executive Director
Daeshin Chemical Co.. Ltd.Mr. Bong Sup Kim, President
Korea Federation of Small Businesses, KwangjuMr. On-Hi Yang, Director
Korea Small Scale Industry Promotion Corp., Kwangju
129
Annex 6Mr. Eung-Hee Yoo, Director of Operations
Korea National Labor Federation. KwangjuMr. Shin Won Lee, President
Yoesu Fishery CooperativeMr. Sang Yong Joo, President
NORTH CHOLLA PROVINCE:
Ministry of Construction and TransportationMr. Young 11 Ha, Director-General, Iri Regional Construction OfficeMr. Hak-Lae Son, Director-General since 1996Mr. Su-Nam Park, Director, Iri Regional Development Bureau*.
Provincial GovernmentMr. Jong-Jeong Lim, Director General, Construction Bureau*
Iksan CitMr. Man Jong Kim, MayorMr. Byung Sik Park, Vice Mayor
Chonbug National University. ChonjuProfessor Eung-Kyo Ryu, Architecture Department
Chonju UniversityProfessor Sung-Taik Lee, Chonbug Development Institute
Iri Export Processing Zone AdministrationMr. Oh-Joon Chung, DirectorMr. Young Choon Yoon, Chief of Operations
Iksan Chamber of Commerce and IndustryMr. Hyun Kee Kim, ChairmanMr. Hong Ki Sohn, Chairman since 1996*Mr. Heun Jai Park, Secretary General*
Jeonju Chamber of Commerce and IndustryMr. Hae-Sang Lee, Director General*
Hong Ik Metal Co.. Ltd.Mr. Sang Sup Kim, Managing Director
Seoul Plant Engineering & Construction Co.. Ltd.Mr. Bang-Ho Kim, Plant Manager
130
Annex 6
Kode nshi Korea Corpr. Tae Hwa)Mr. Sung Ik Park, Senior Managing DirectorMr. Ki-Jung Lee, Director
MEETINGS IN SEOUL:
Ministry of Construction and Transportation. SeoulMr. Yoon Ho Ryu, Director, Regional Planning Division*Mr. In-Kee Shin, Director, Construction Management Division*Mr. Doyoup Kwon, Director, Industrial Site Planning Division*Mr. Yong Hwan Kim, Director, Water Resources Policy DivisionMr. Jae Chooni Lee, Director, Technical Training Division
Korea Research Institute for Human Settlements. SeoulDr. Gun Young Lee, President*Dr. Kyubang Lee, Vice PresidentDr. Young-Hwan Jin, Director, Research Coordination*Dr. Yang-Soo Yun, Director, Regional PlanningDr. Dong-ju Kim, Senior Fellow*Dr. Yong-Woong Kim, Senior Fellow
C.onstruction & Economy Research Institute of KoreaDr. Sung-Woong Hong, President
Korea Environmental Technology Research InstituteDr. Jong Gie Kim, President*
Korea Institute for Economics and TechnologyDr. Kyu Uck Lee, President
Seoul Development InstituteDr. Sae-Wook Chung, PresidentDr. Bun-Song Lee, President (since February 1995)*Dr. Yeong-Joo Hahn, Director, Planning and Coordination*
Seoul National UniversityProf. Sang-Chuel Choe, Graduate School of Environmental Studies*
125° m v 1;6 ~~~~ ~ ~~~~~~127- 4- 2-a129 124 Ss 12 7 < ;;
DEMOCRATIC PEOPLE'S S 'CHOLLA REGION ' t!z x
, ~~~REPUBLIC OF, K) ;_,,, , as EAne __,, 1 j s ., 5 ' @ ~~~~~~~~~~~~~~~~~~~~~~~~~~~~PROVINECAPTALMS J/- j ........
~~~~~~~~~~~~~~~~~~~~~~- -s - <- - - - - E a sY N G t X PRTONALCAPTA BIGS 36s-qf X$gX ,<1 \9 ) .,> F ~~~~~~~~~~~~~~~~~~~~POVINCE300NAPITAS 9itCnSe
KYONGGI>QO-nL (DHNcO RANRTHI \R-OAD,\o $ EAEK)N @ en ( KY~~~~KANGONGSN NACA ROD LSX\ *


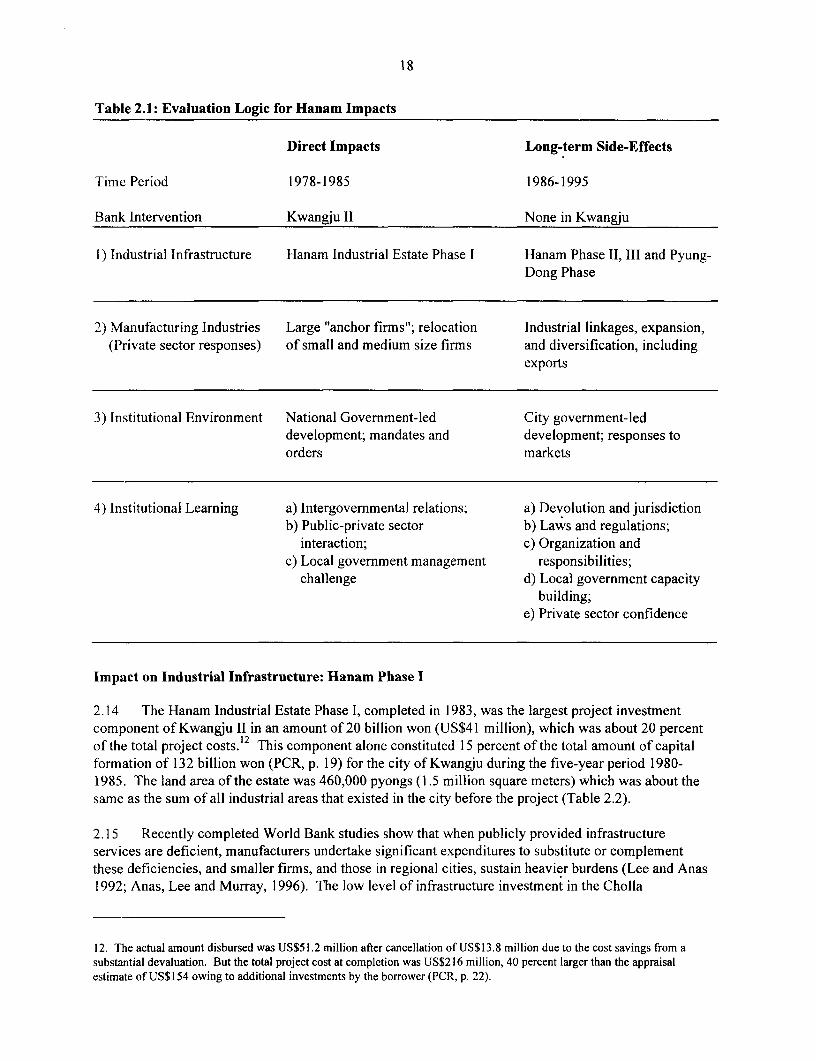
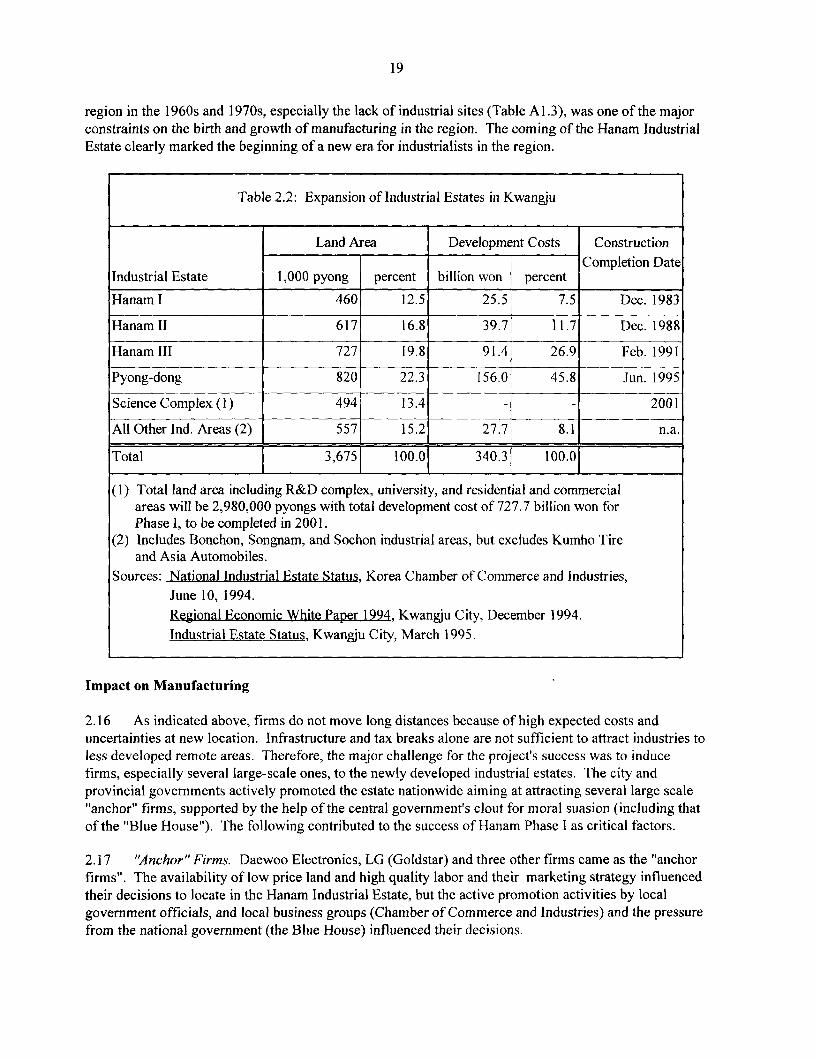
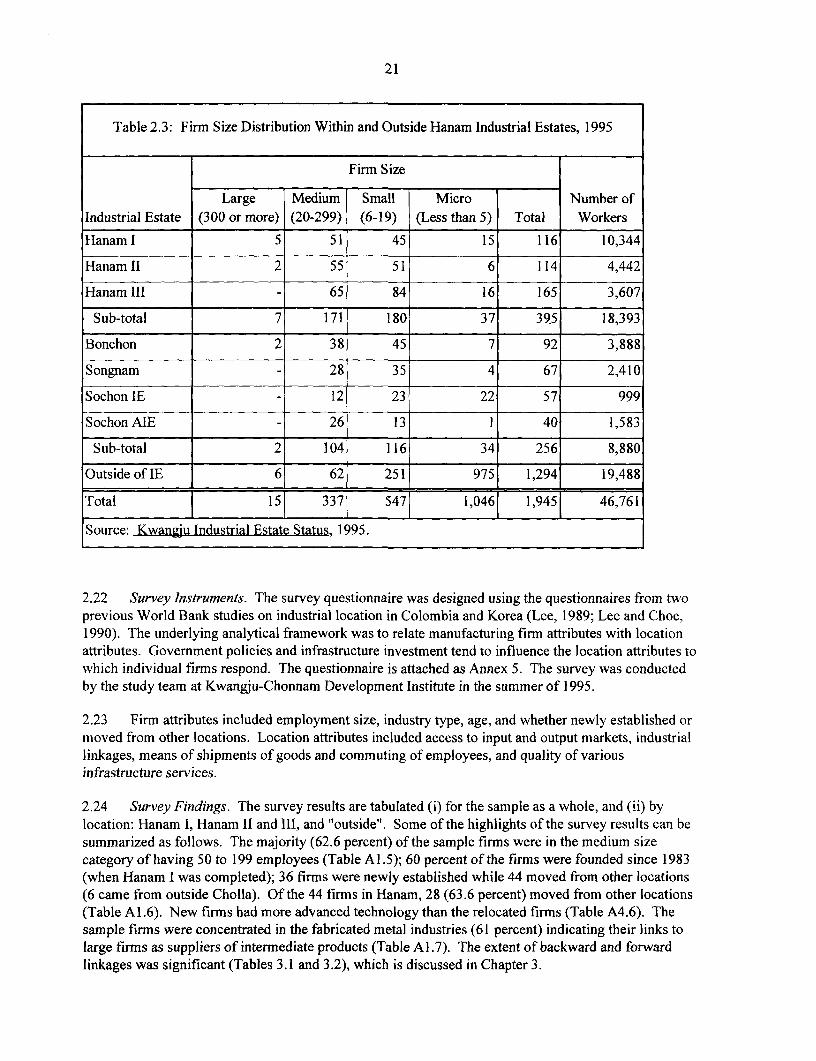
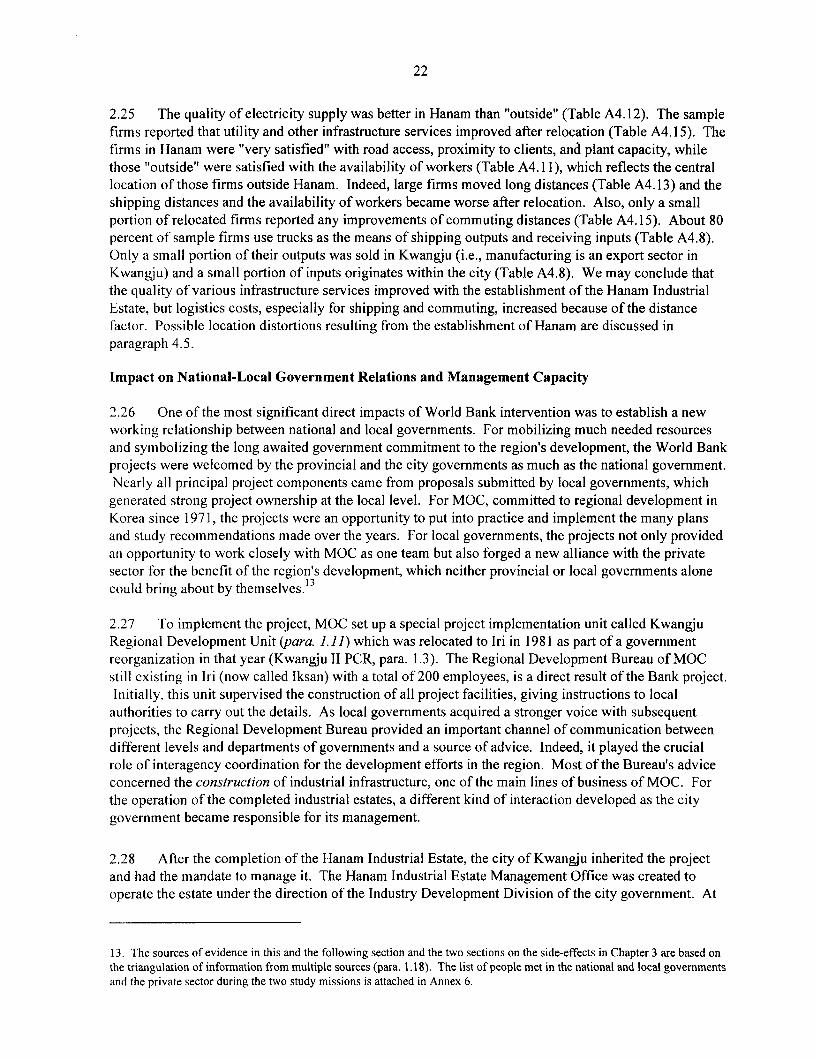
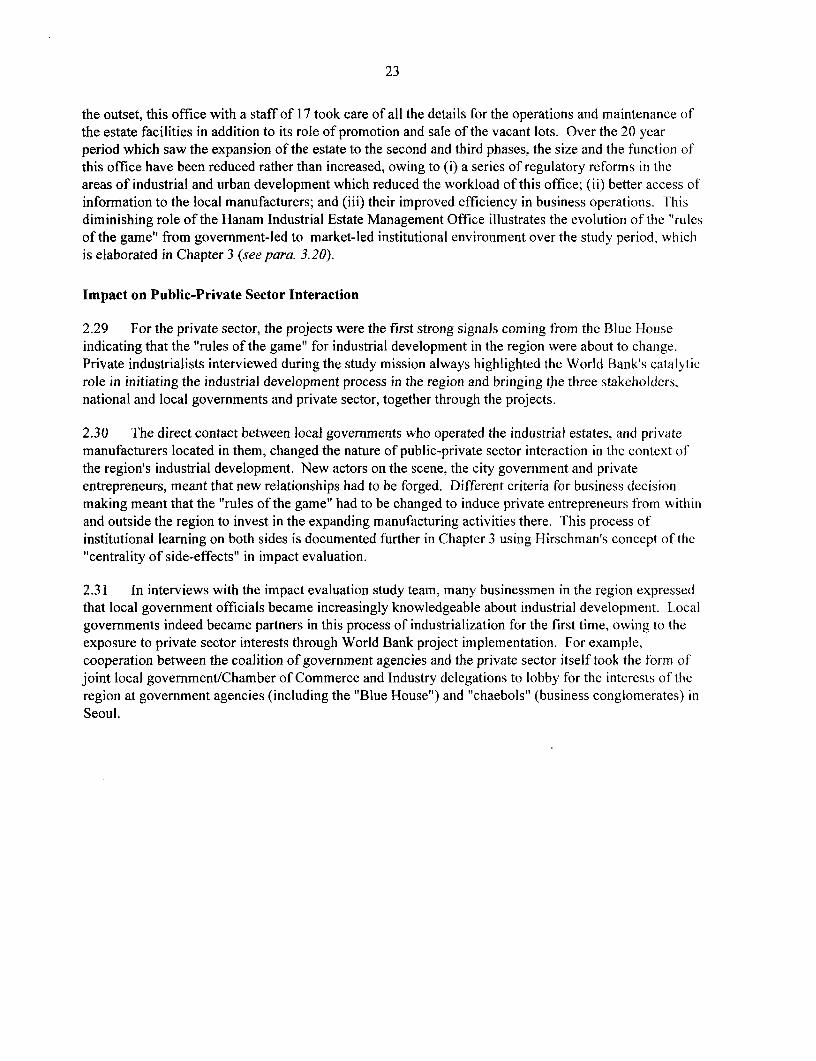

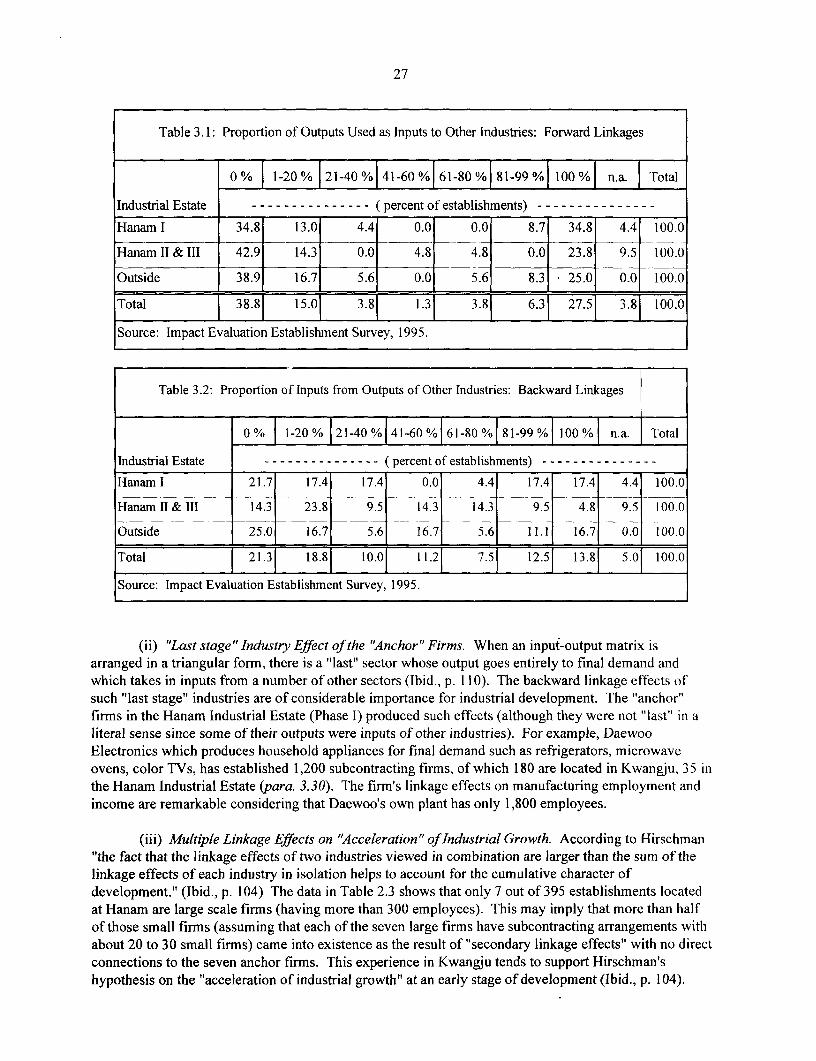
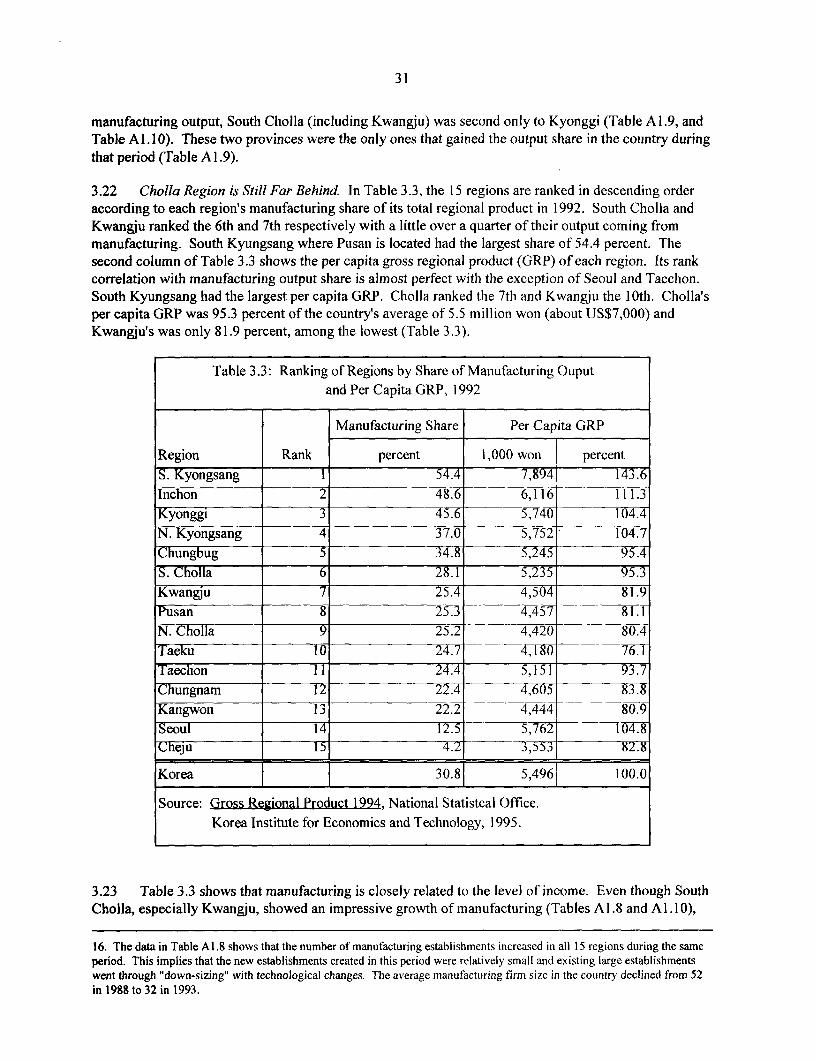


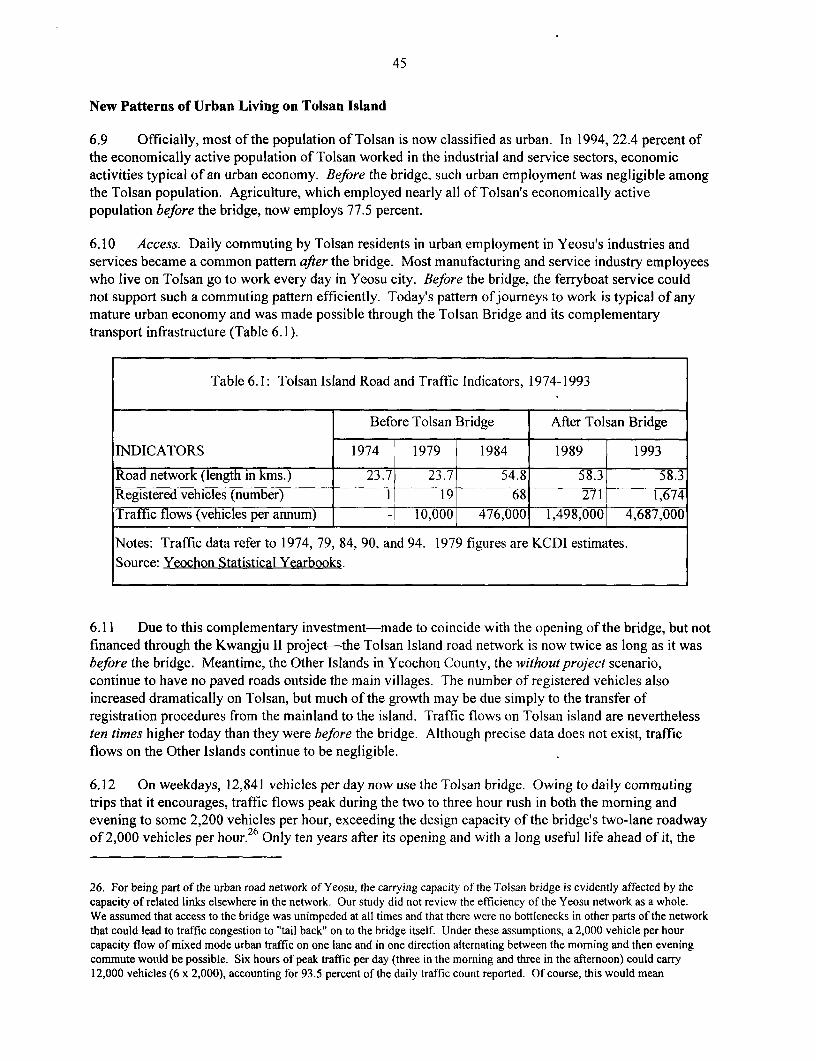
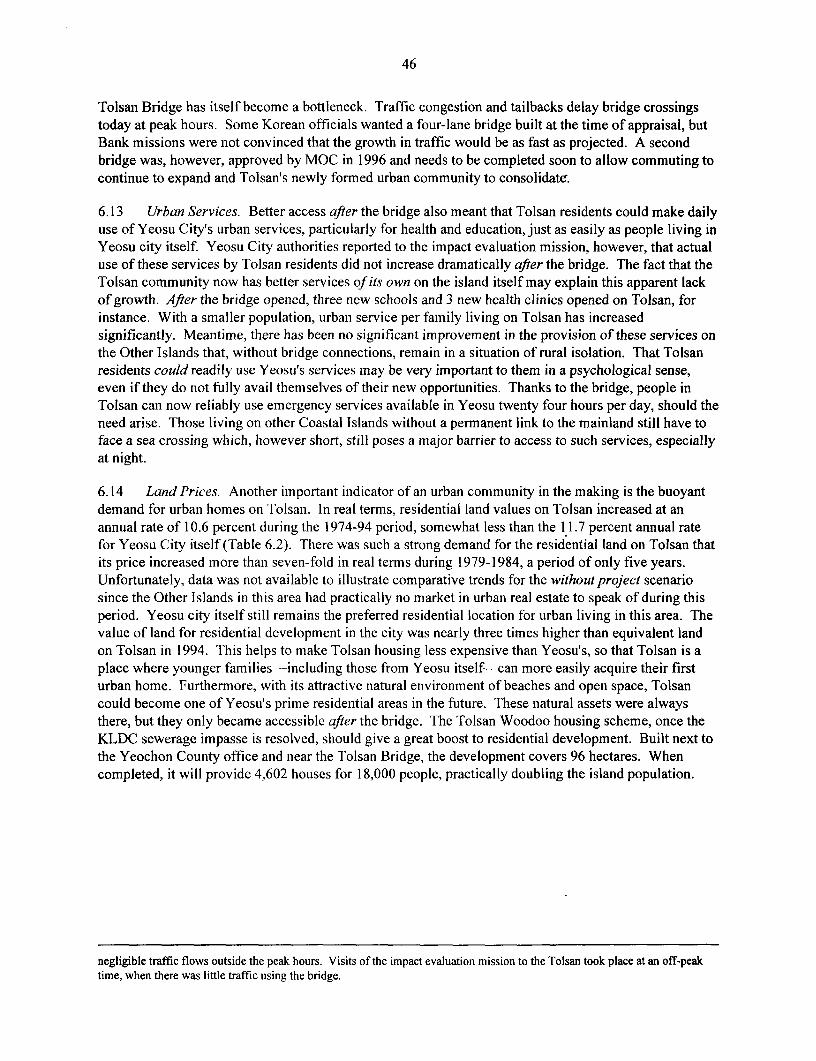
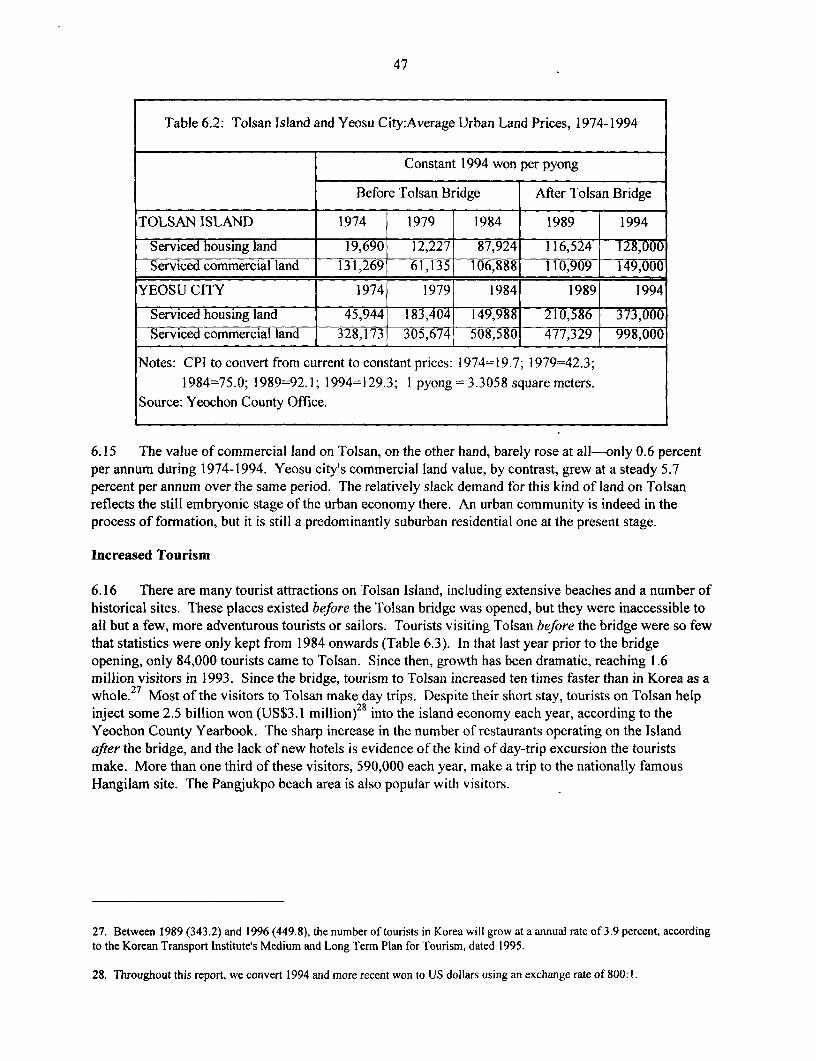
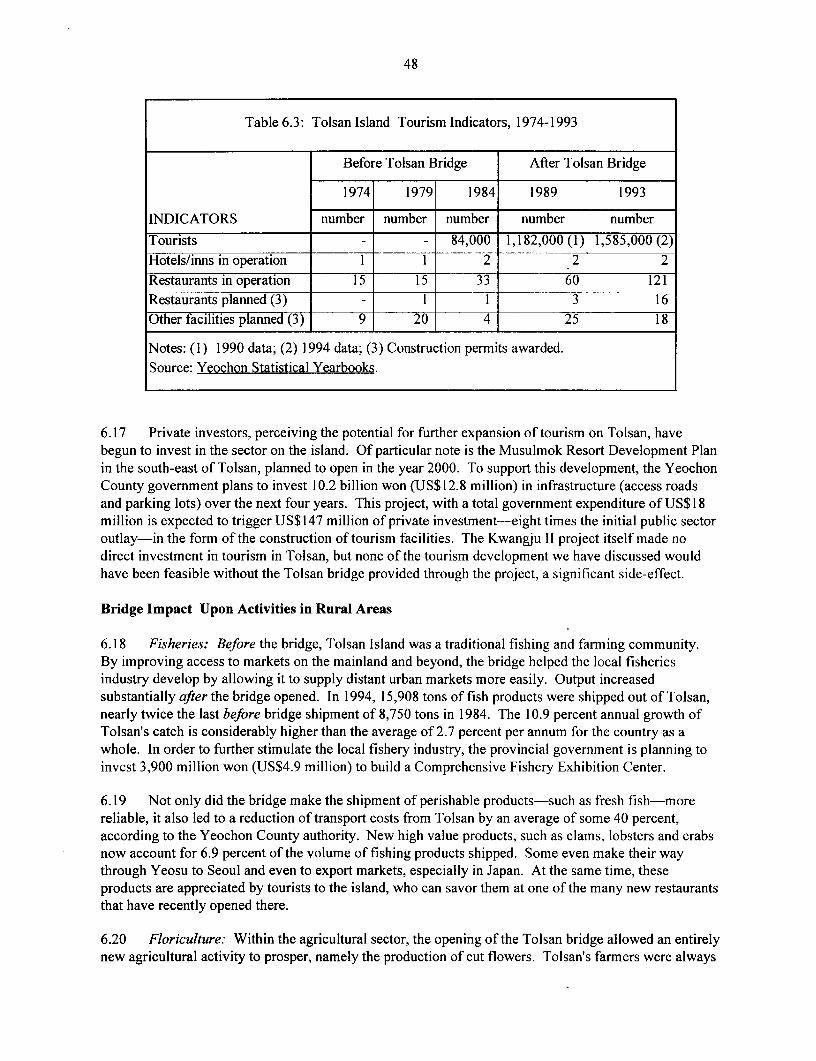
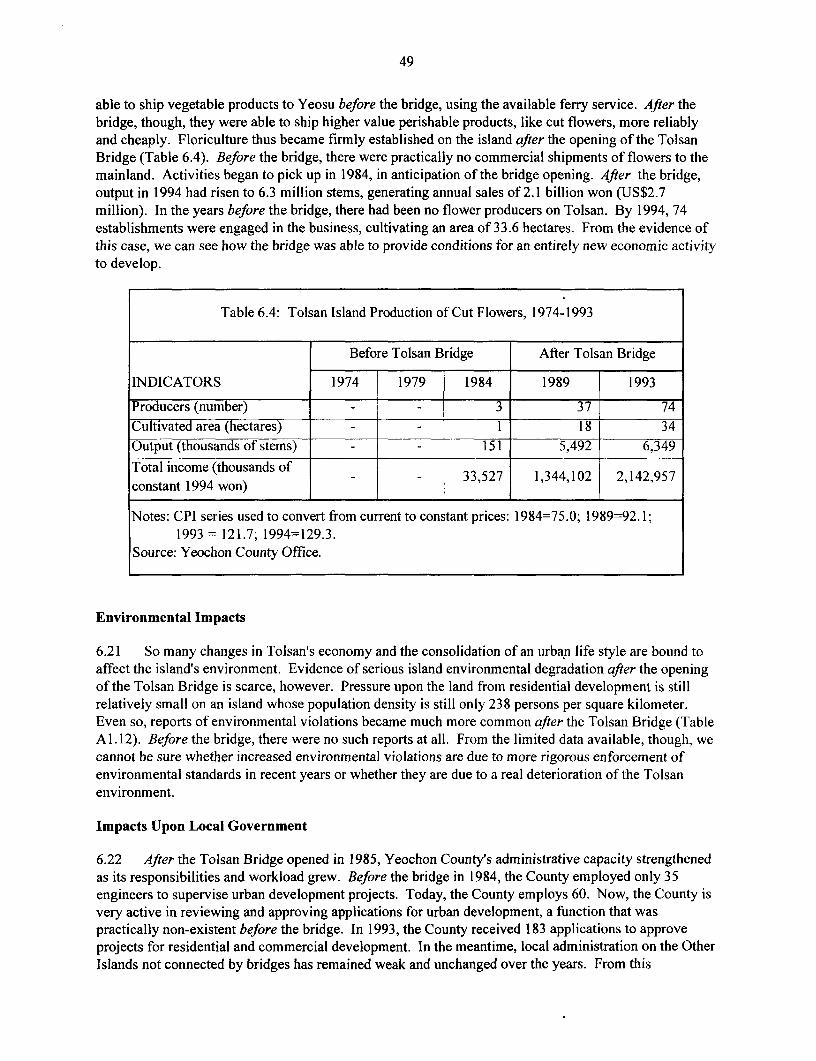
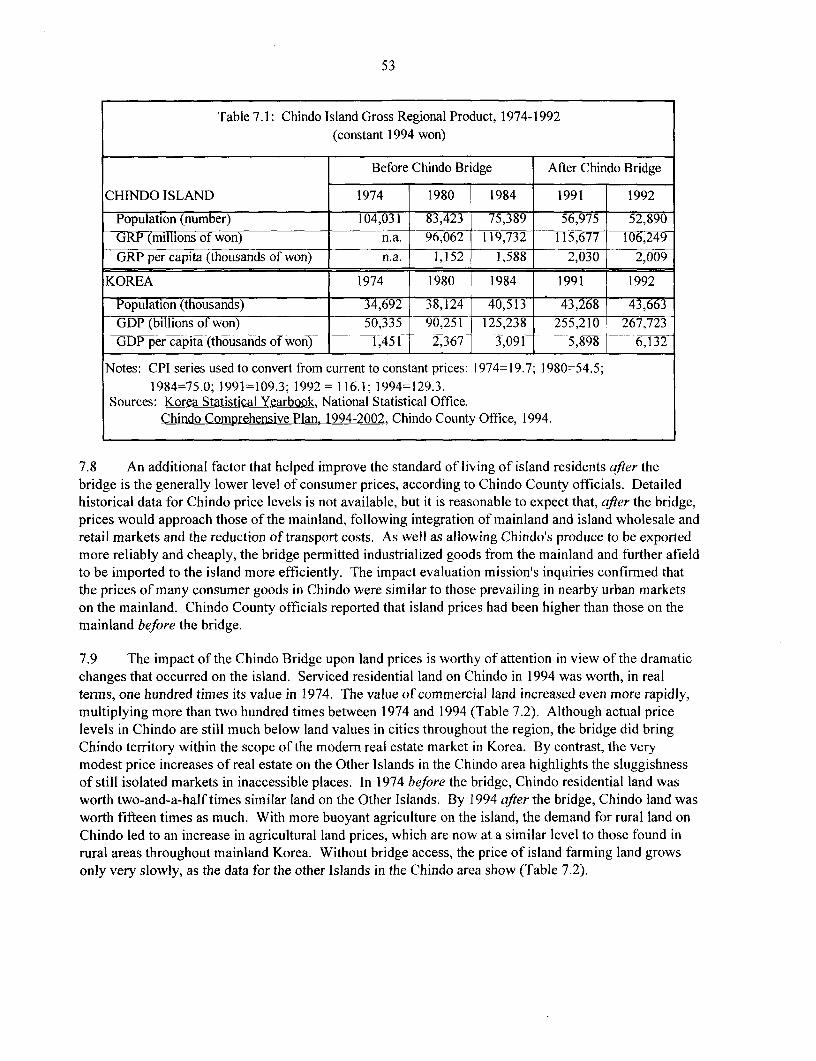
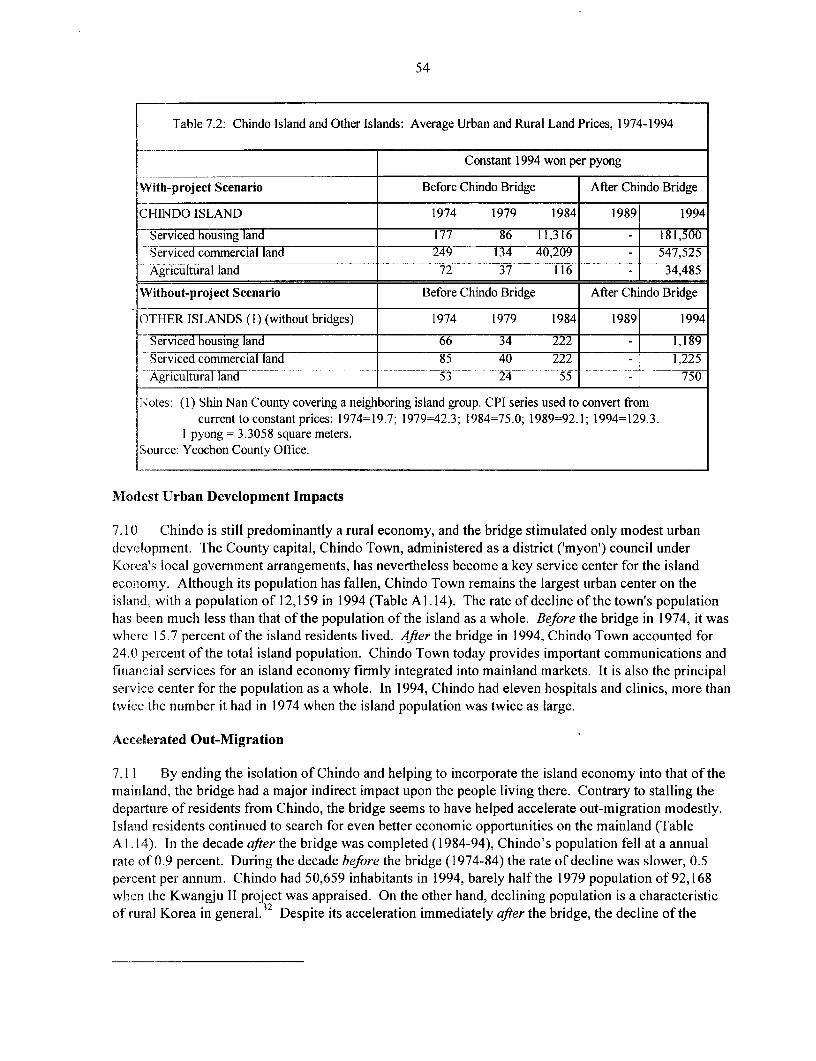
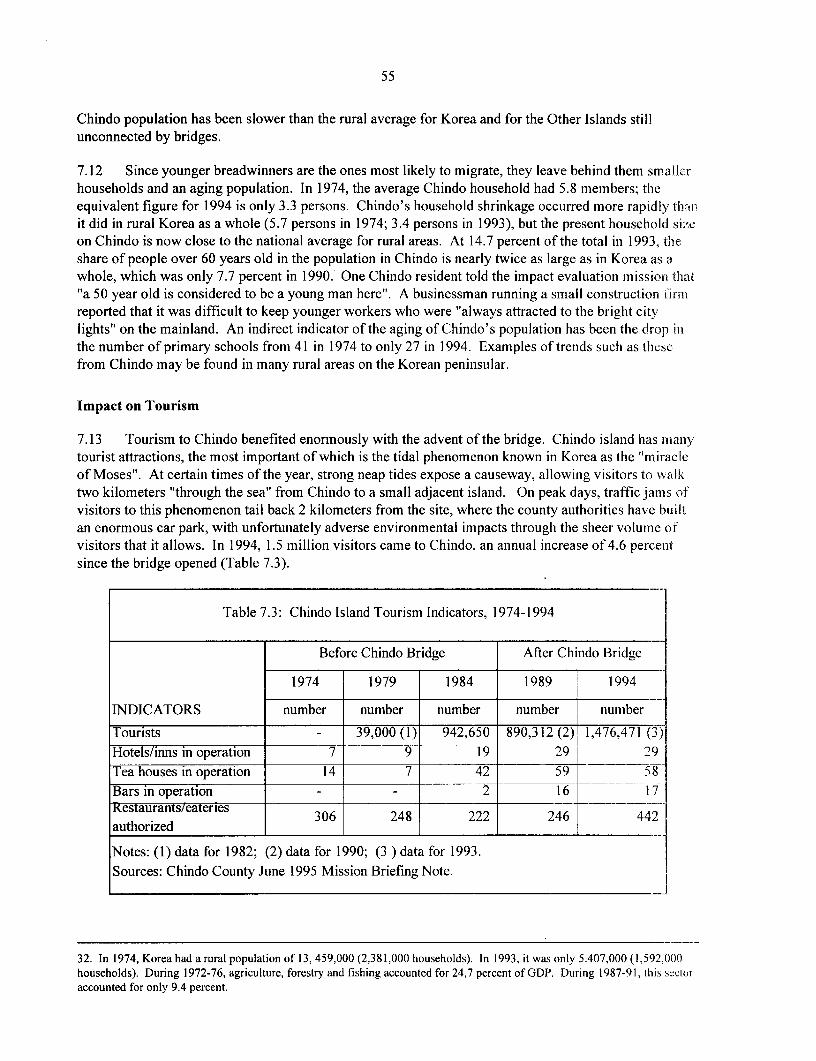


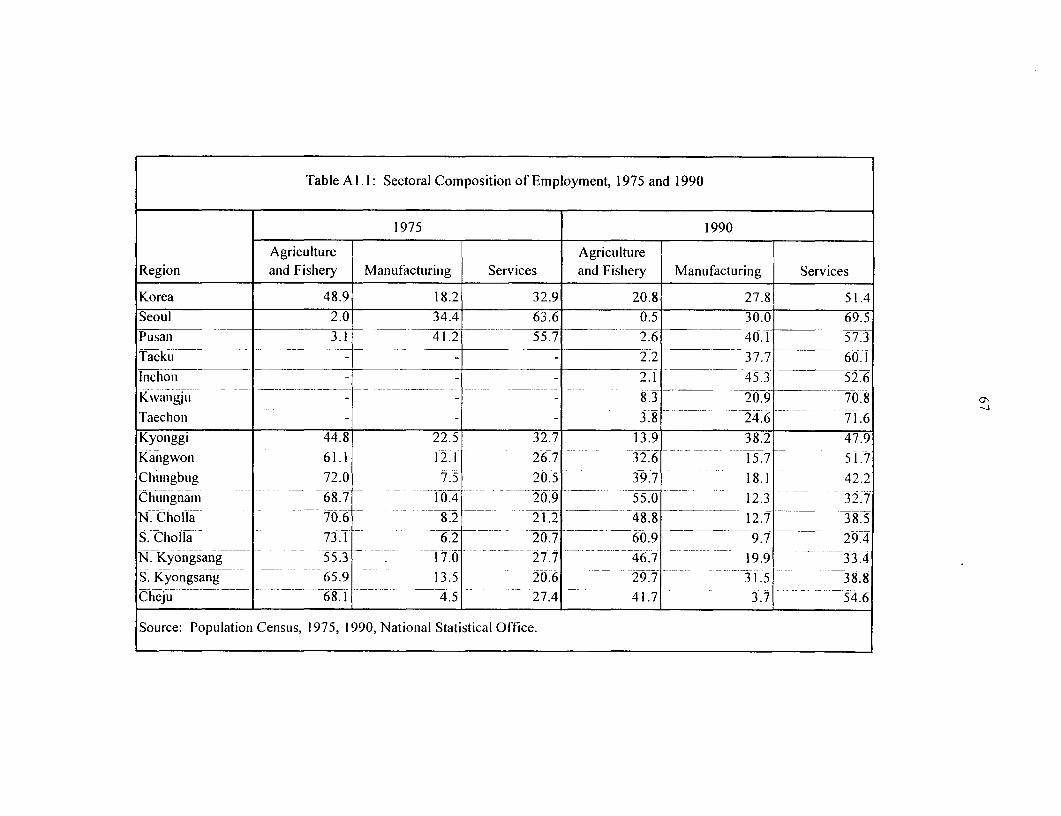
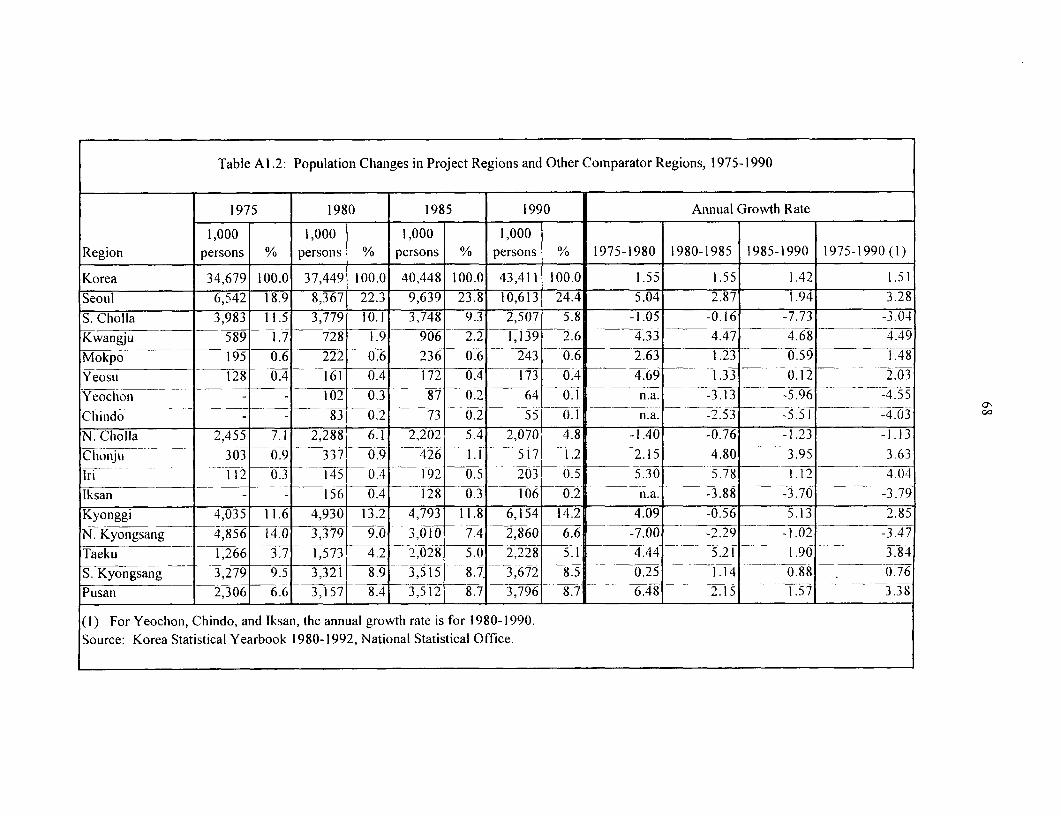
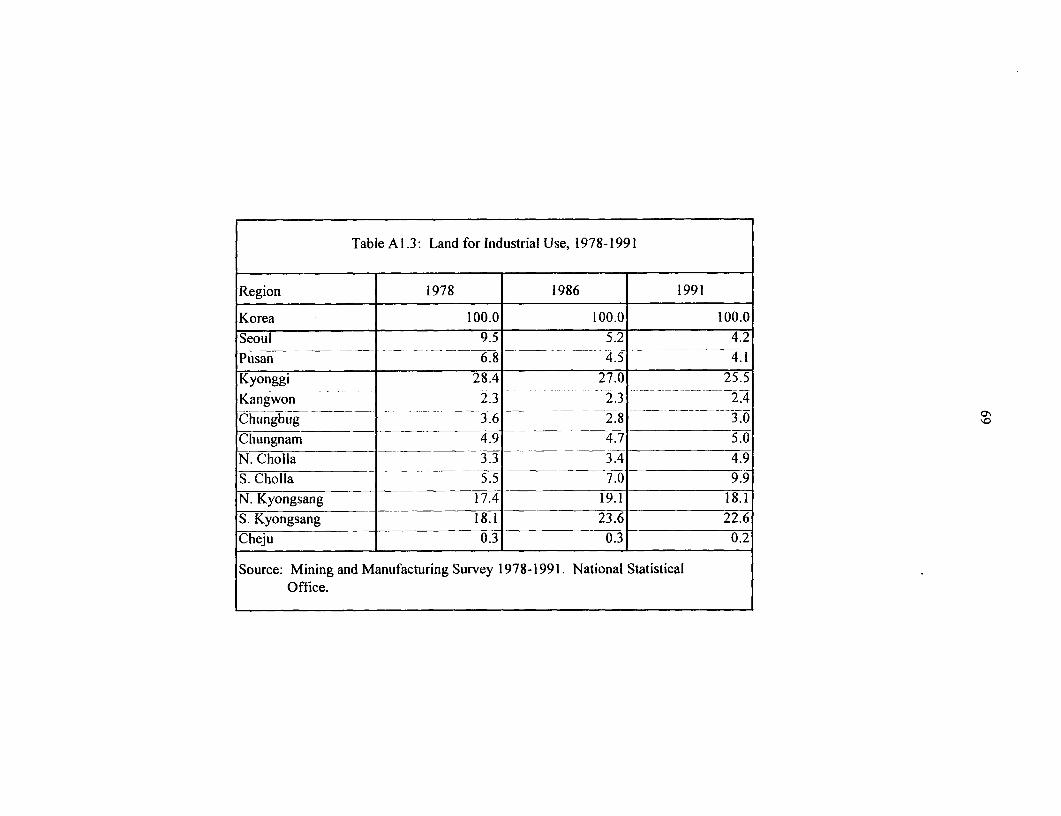
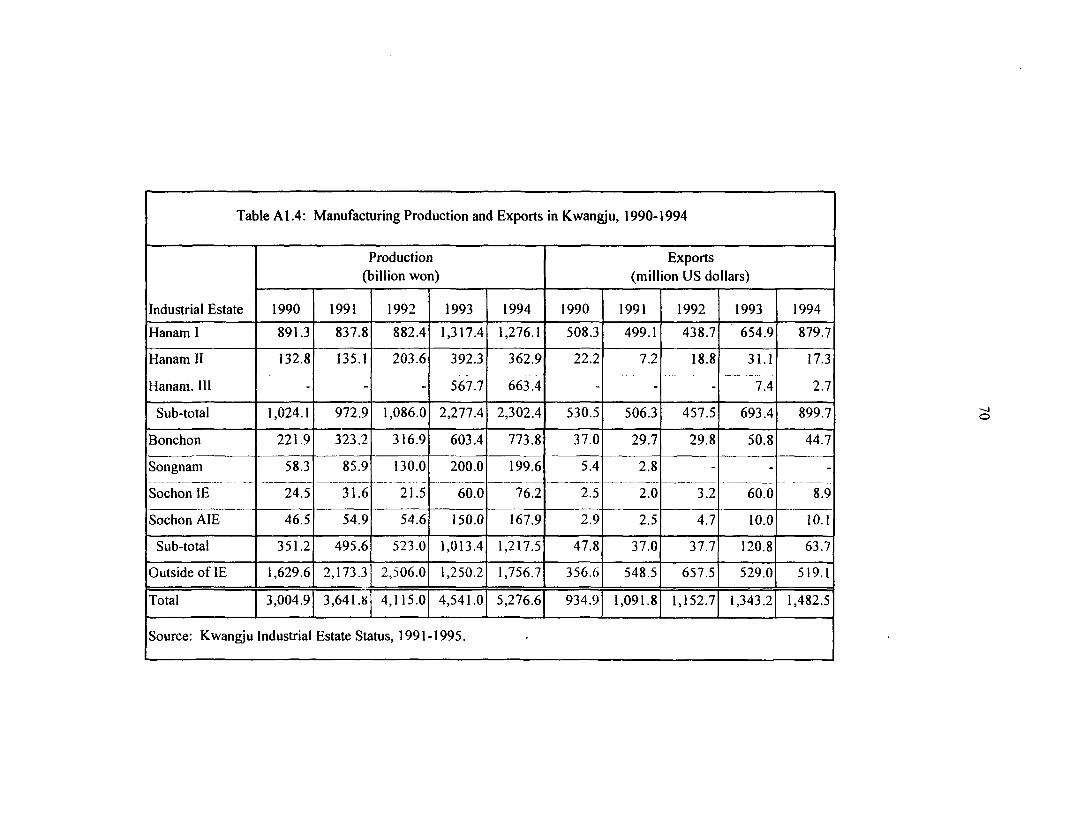
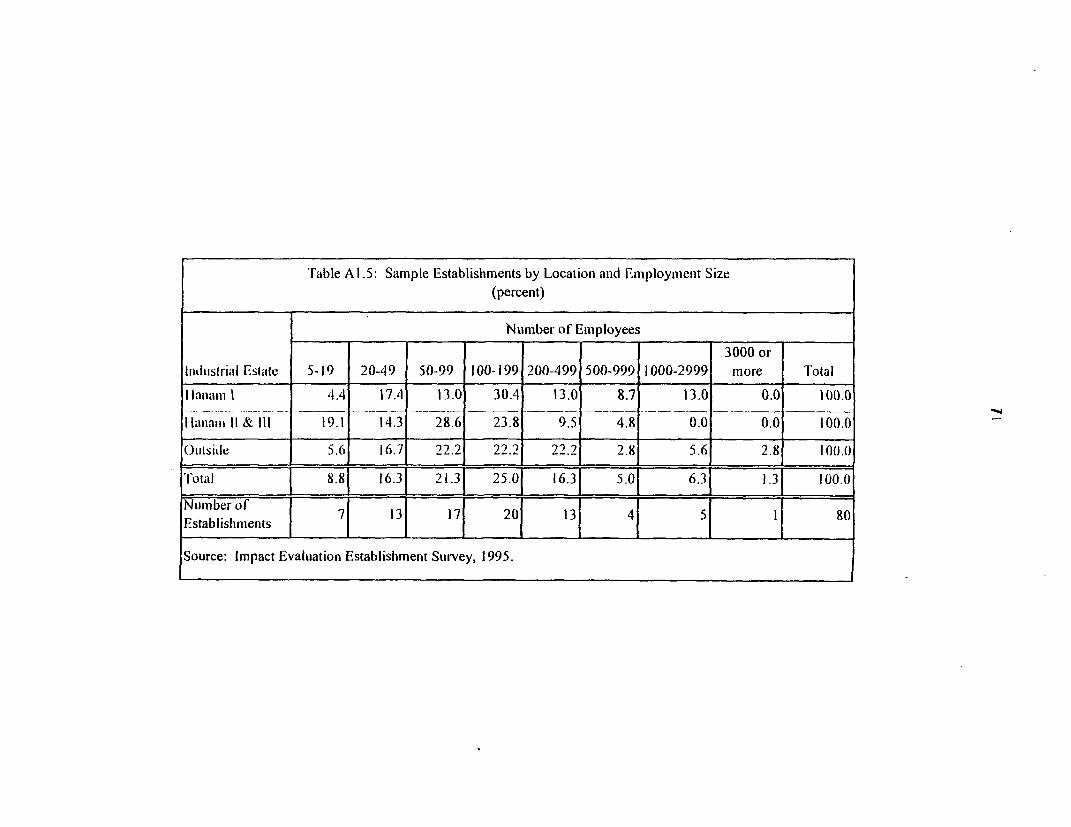
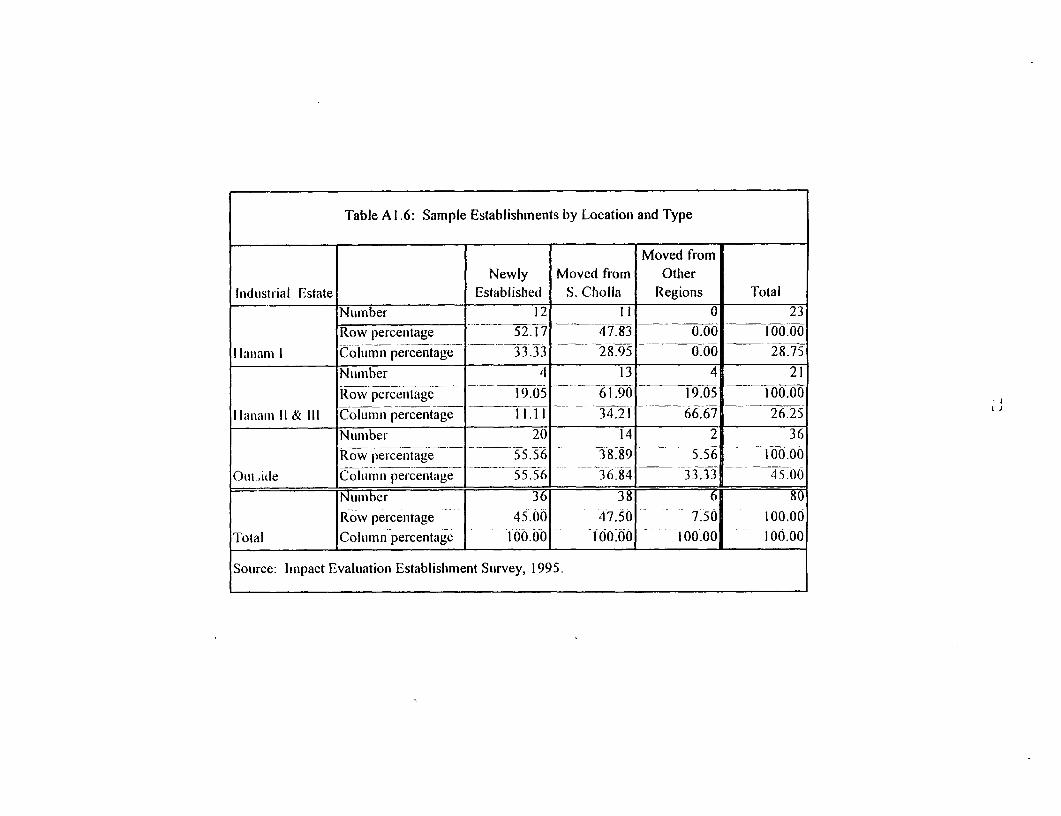
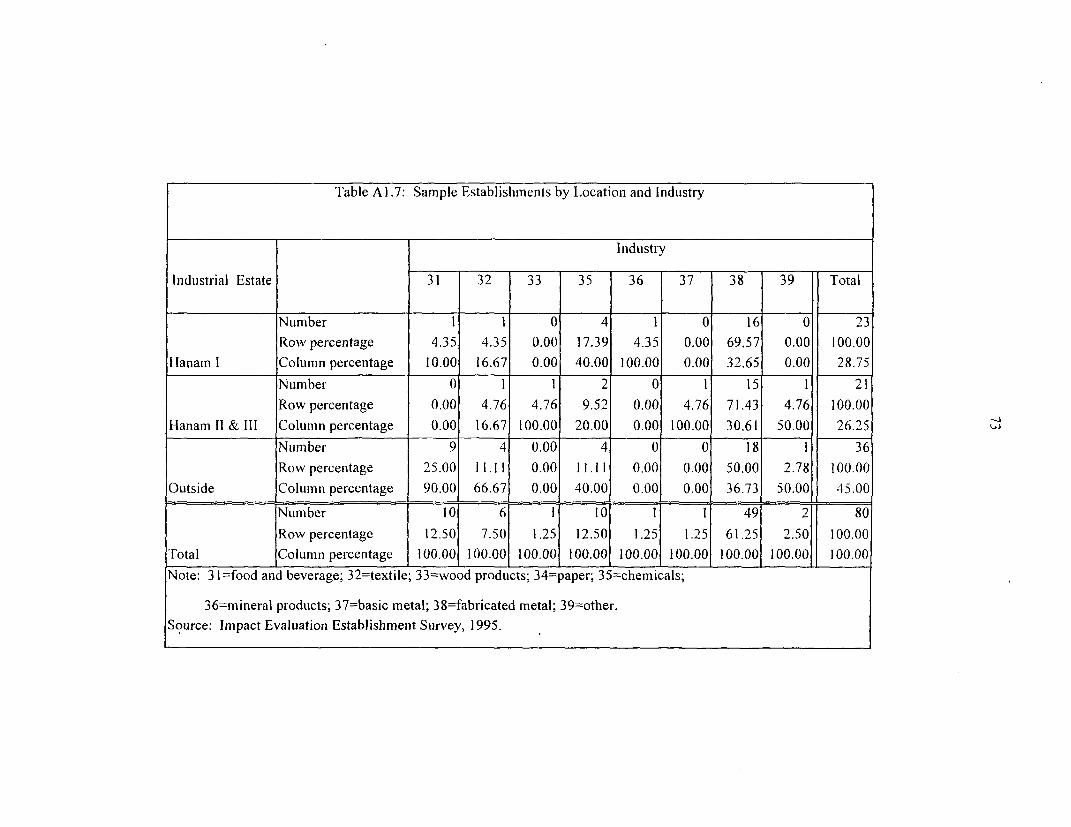
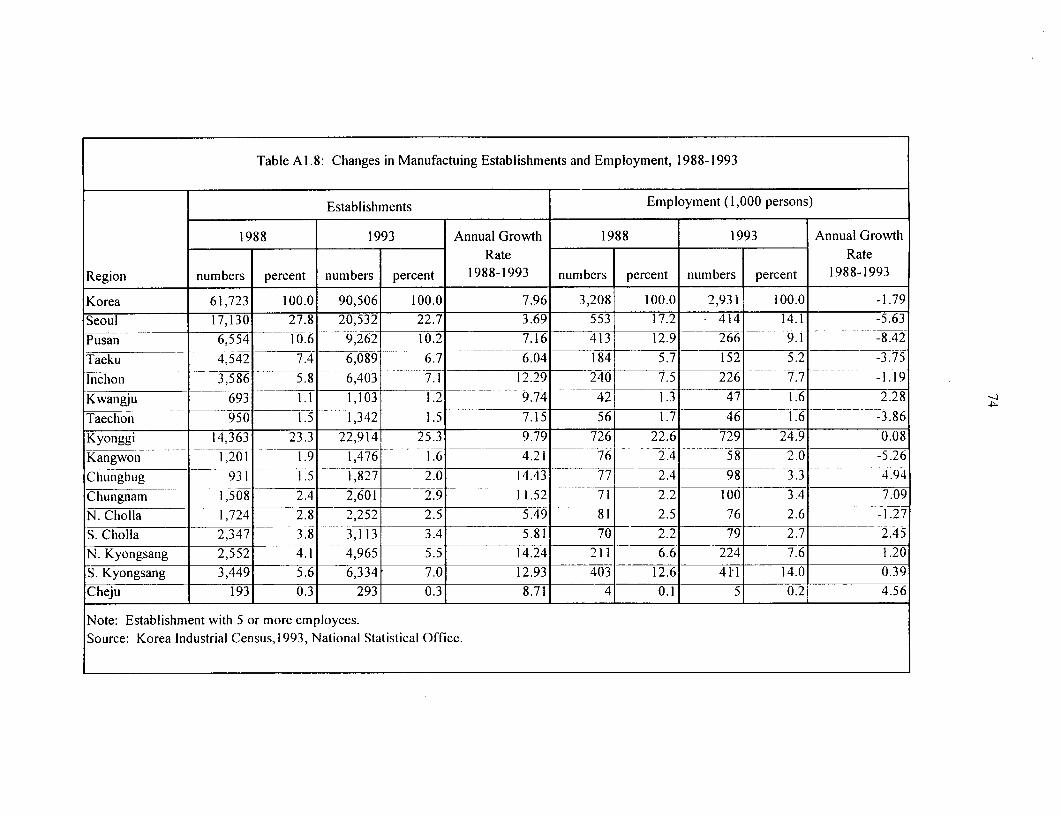
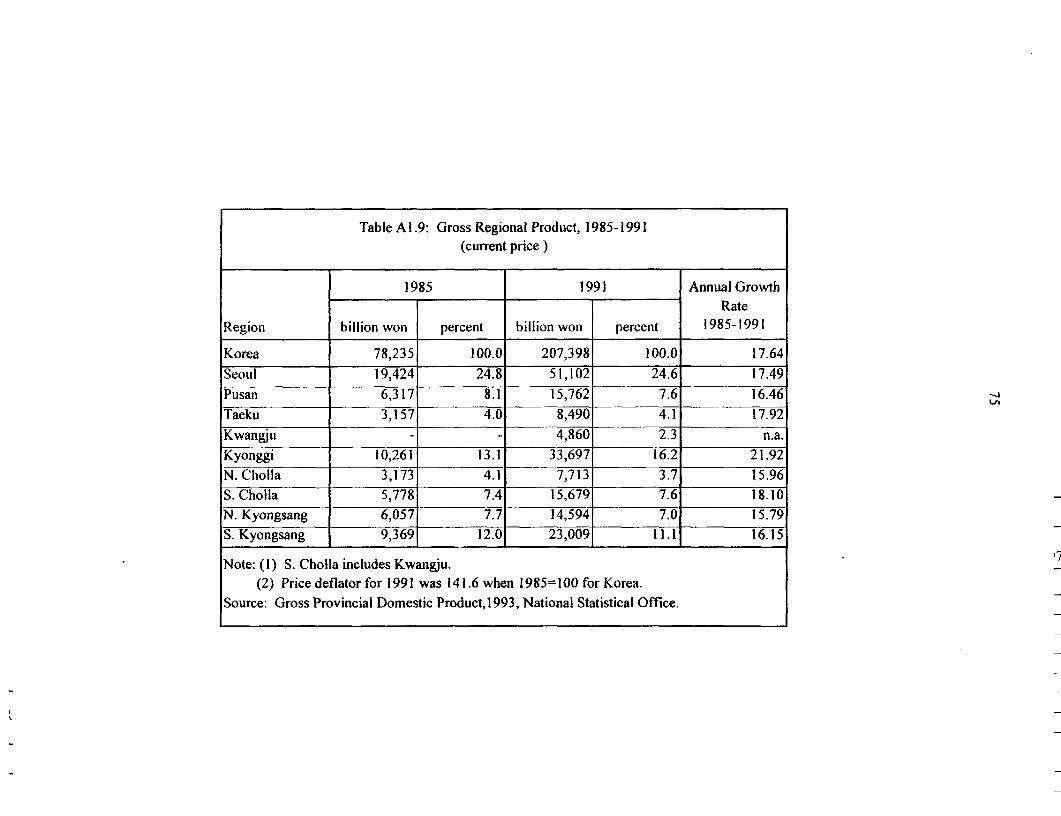
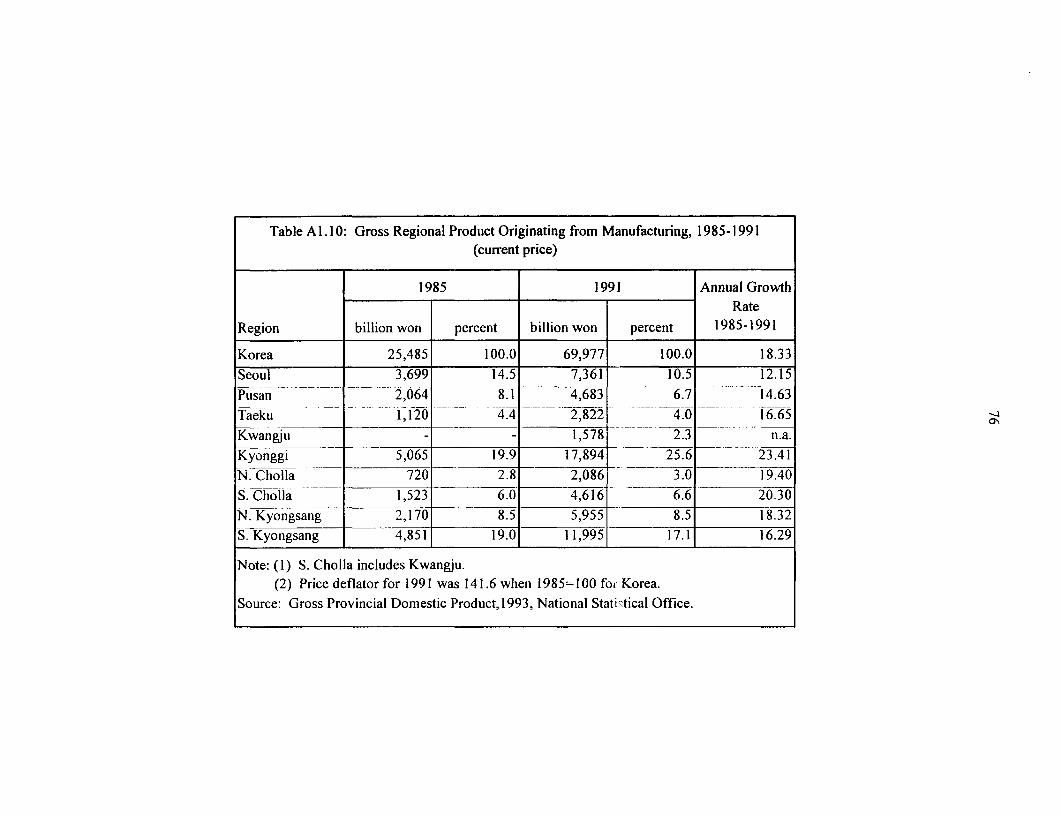
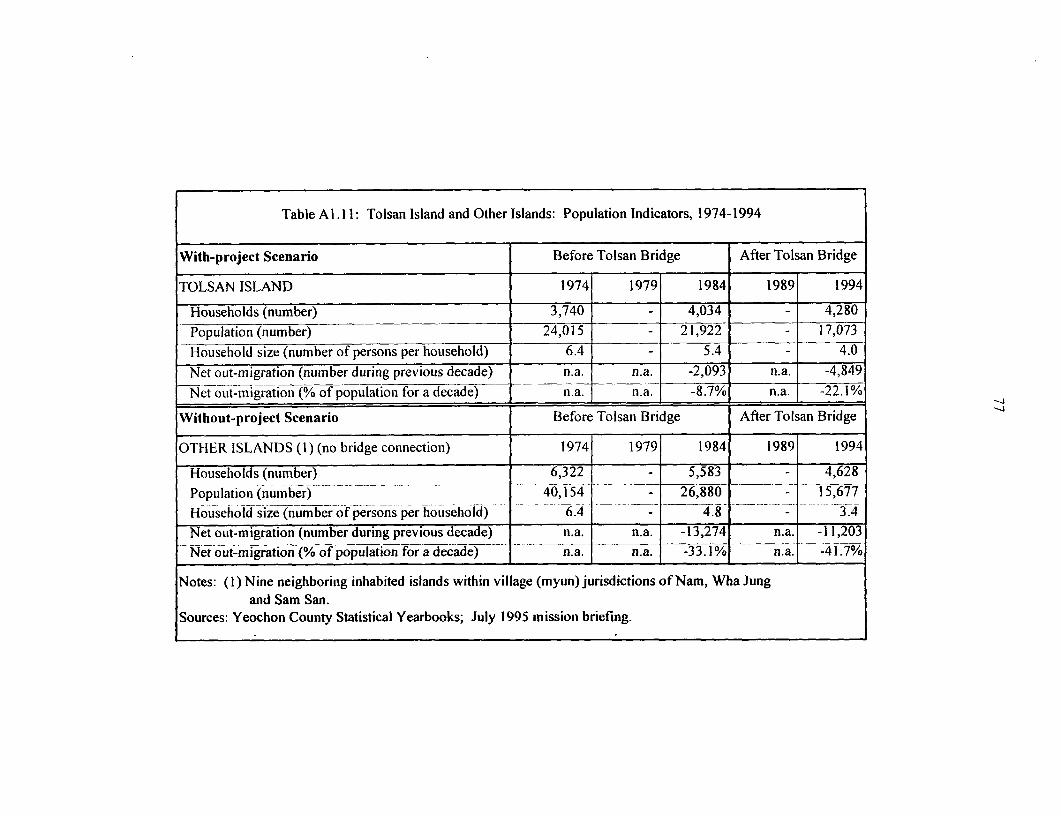
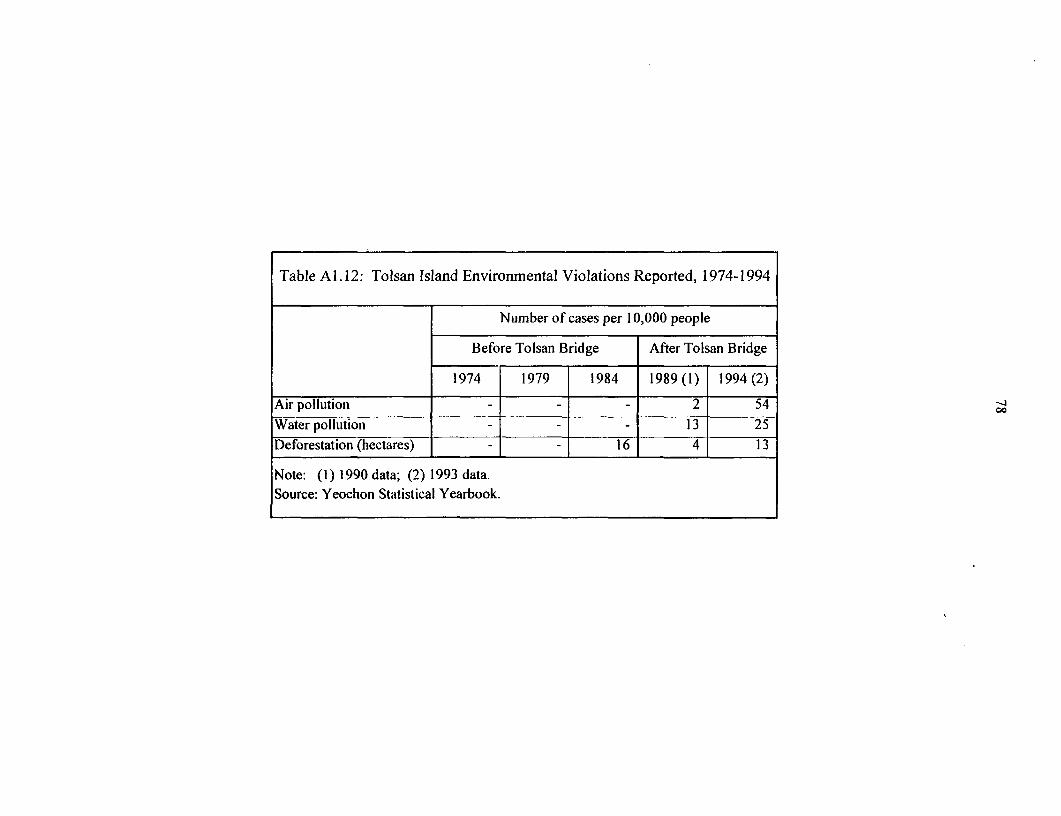
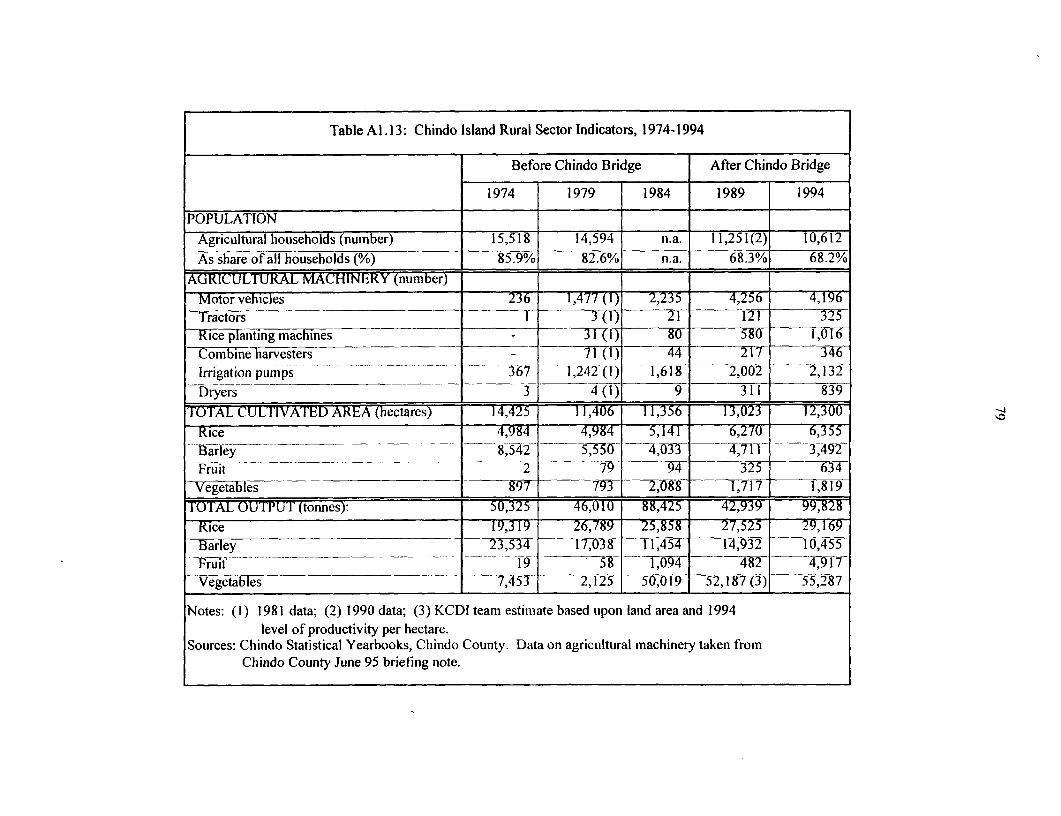
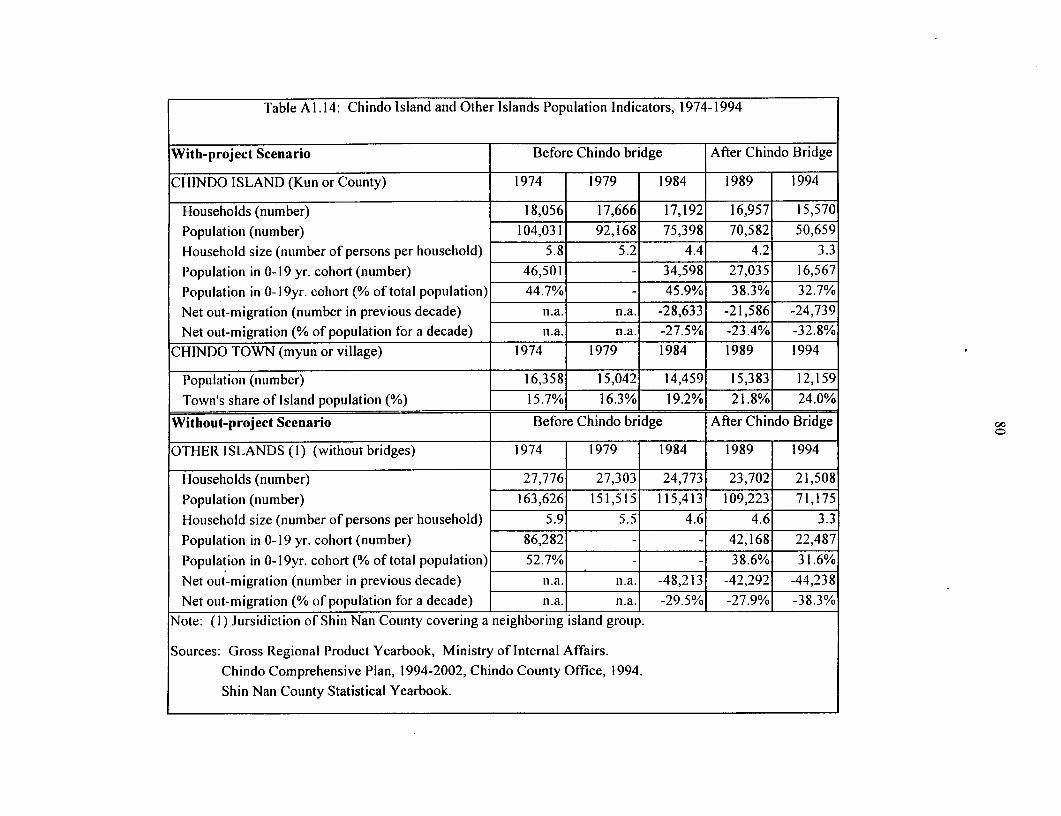
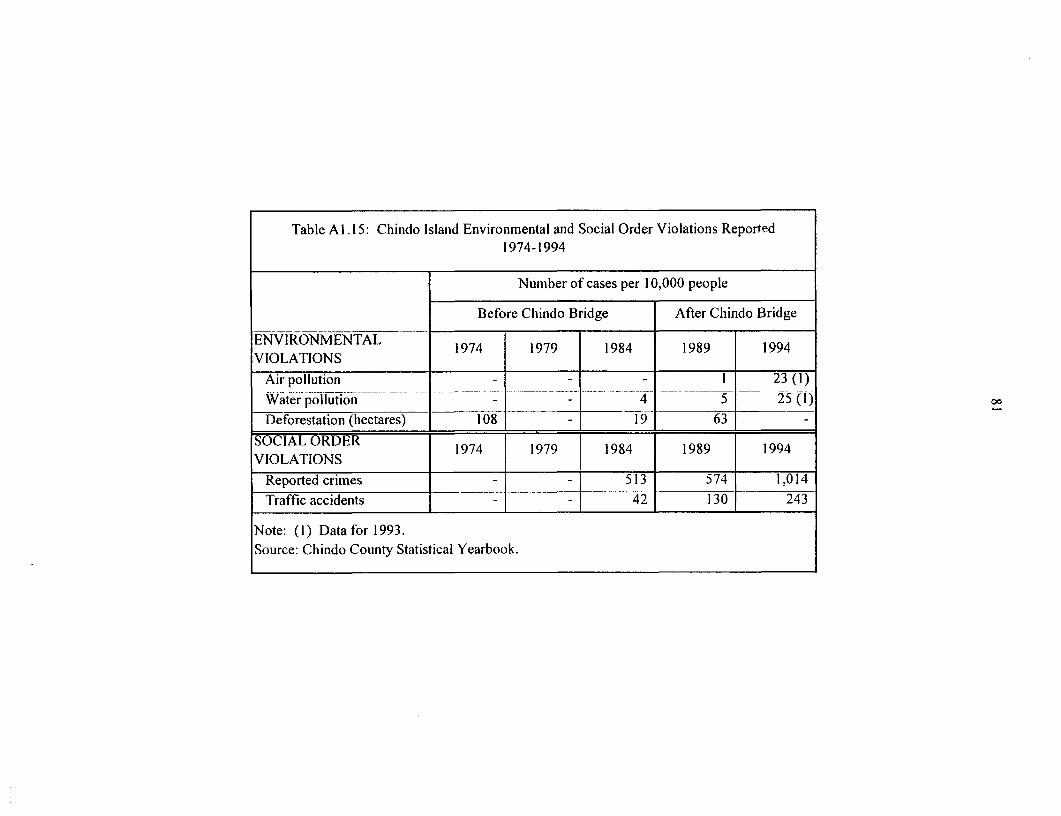

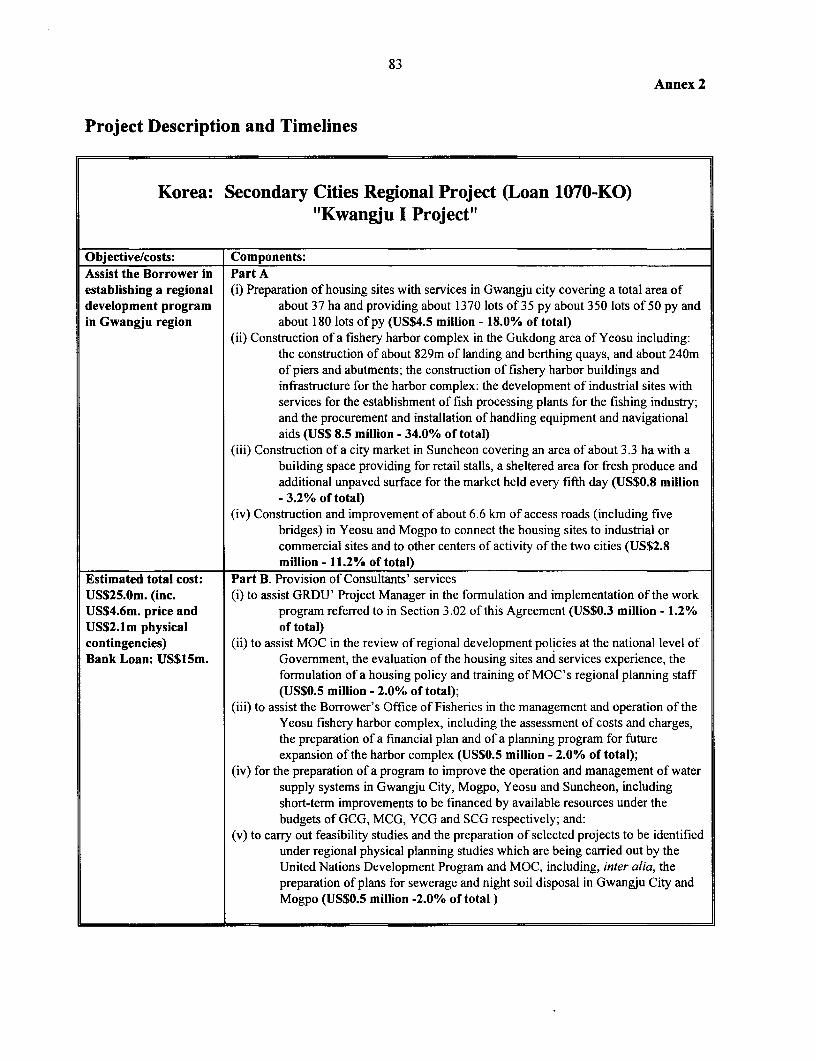
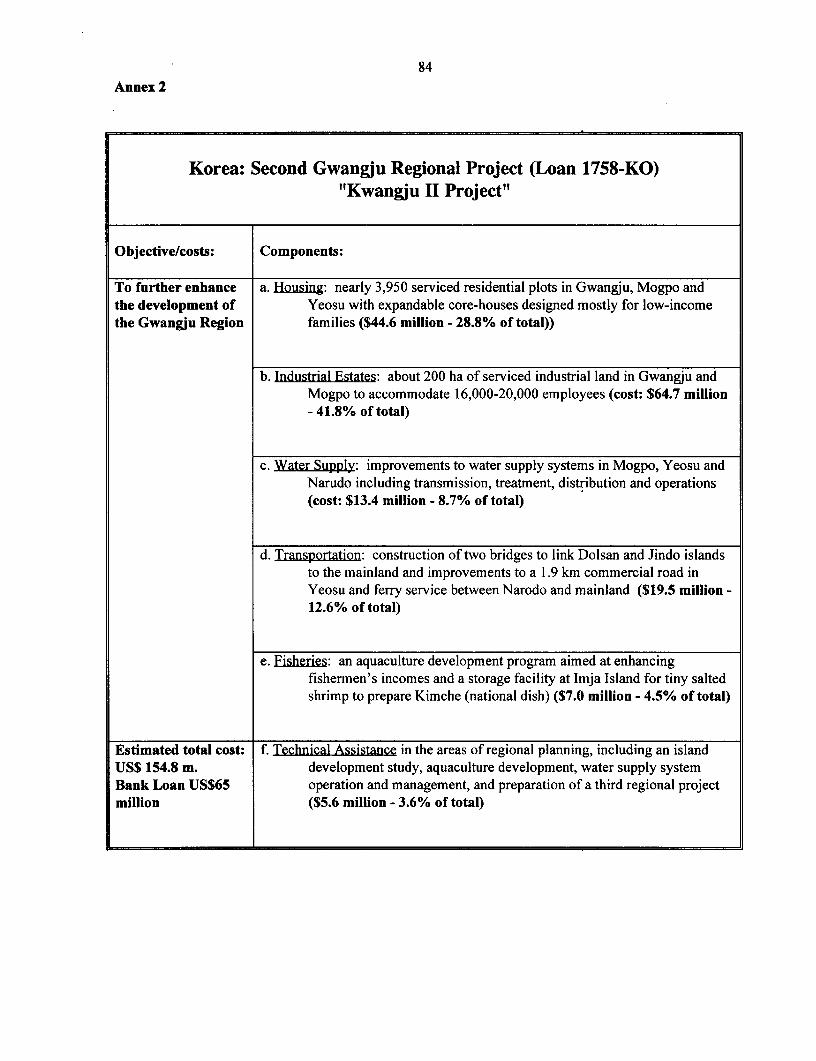
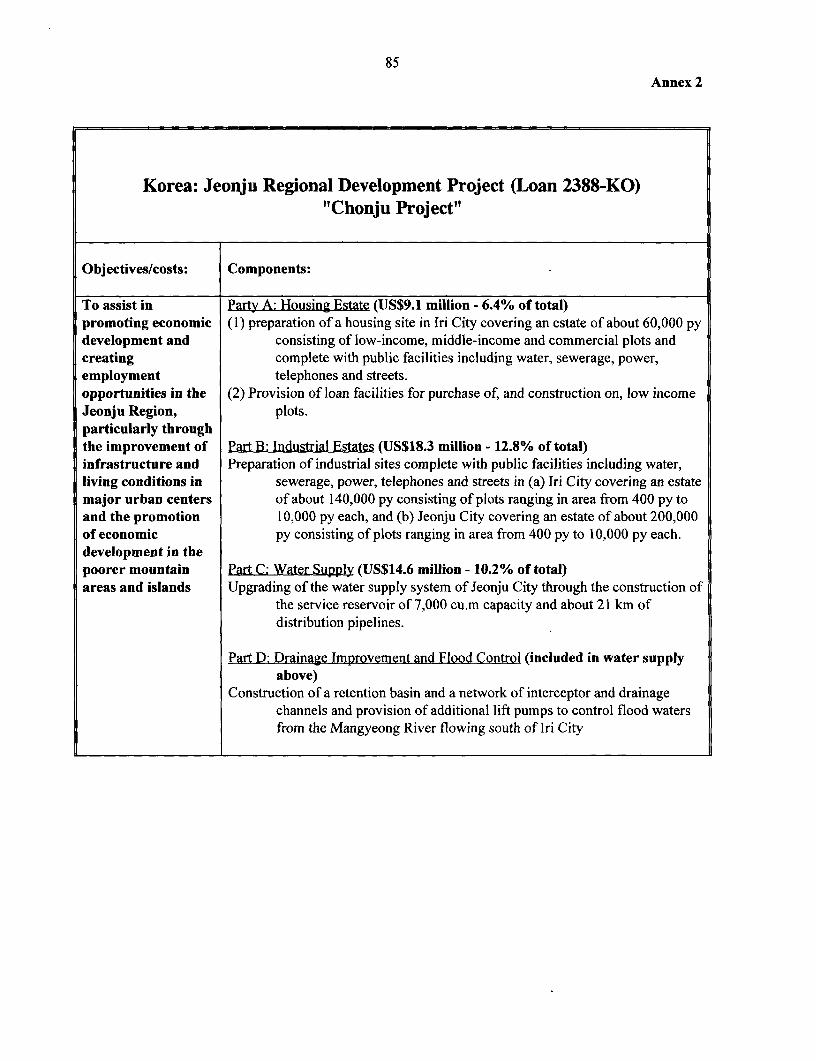
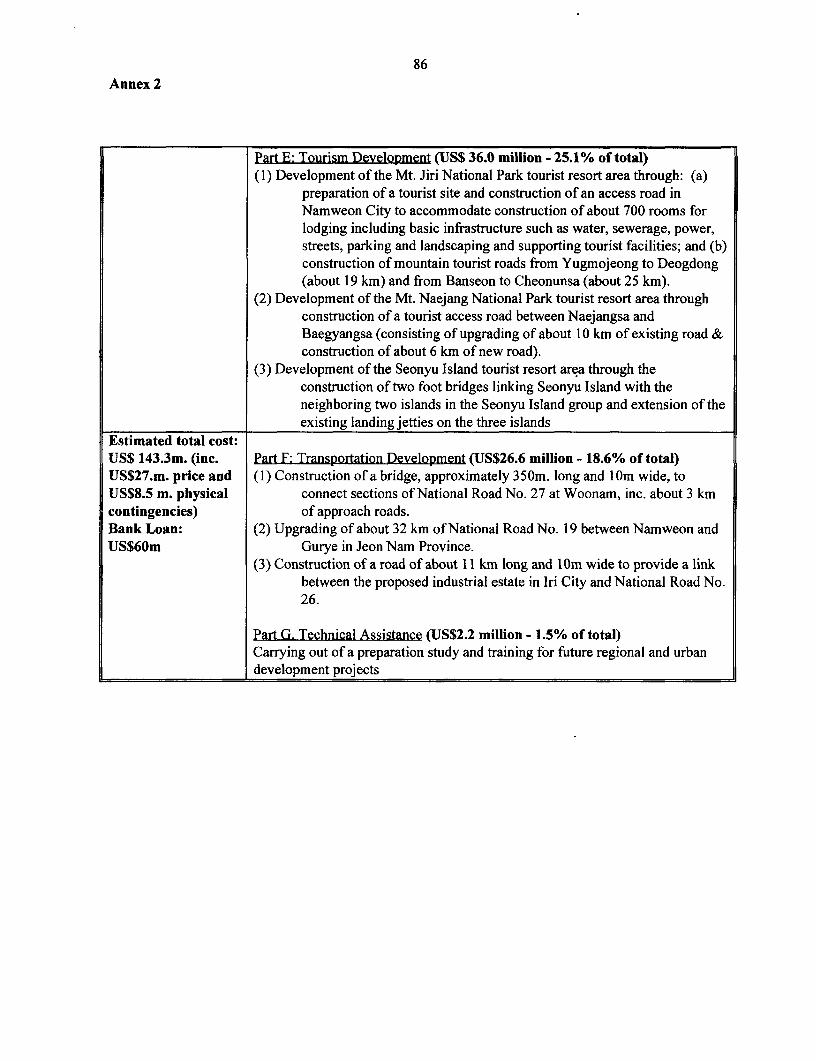
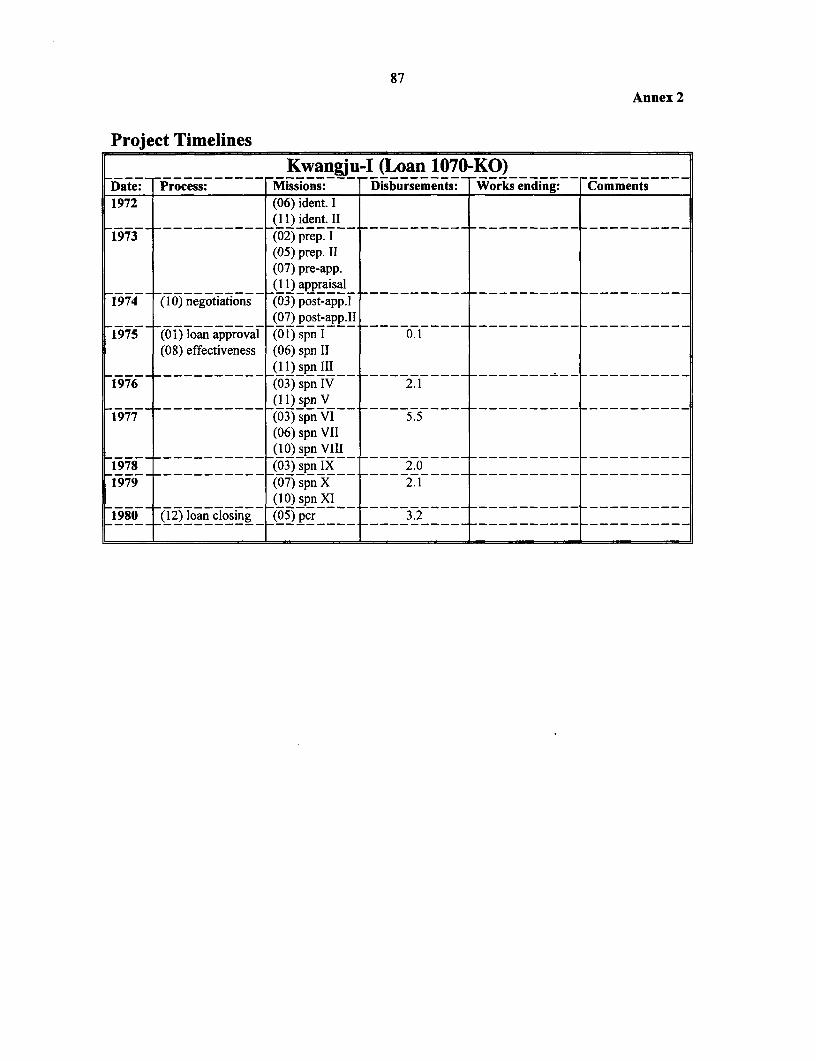
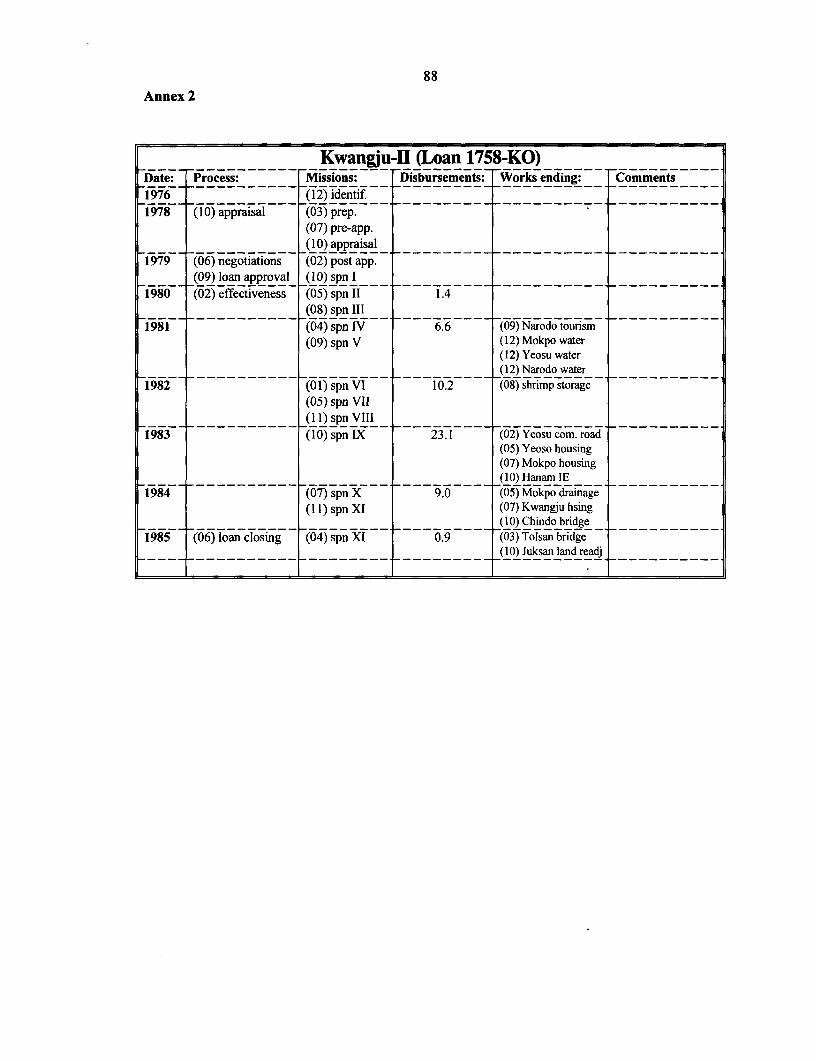
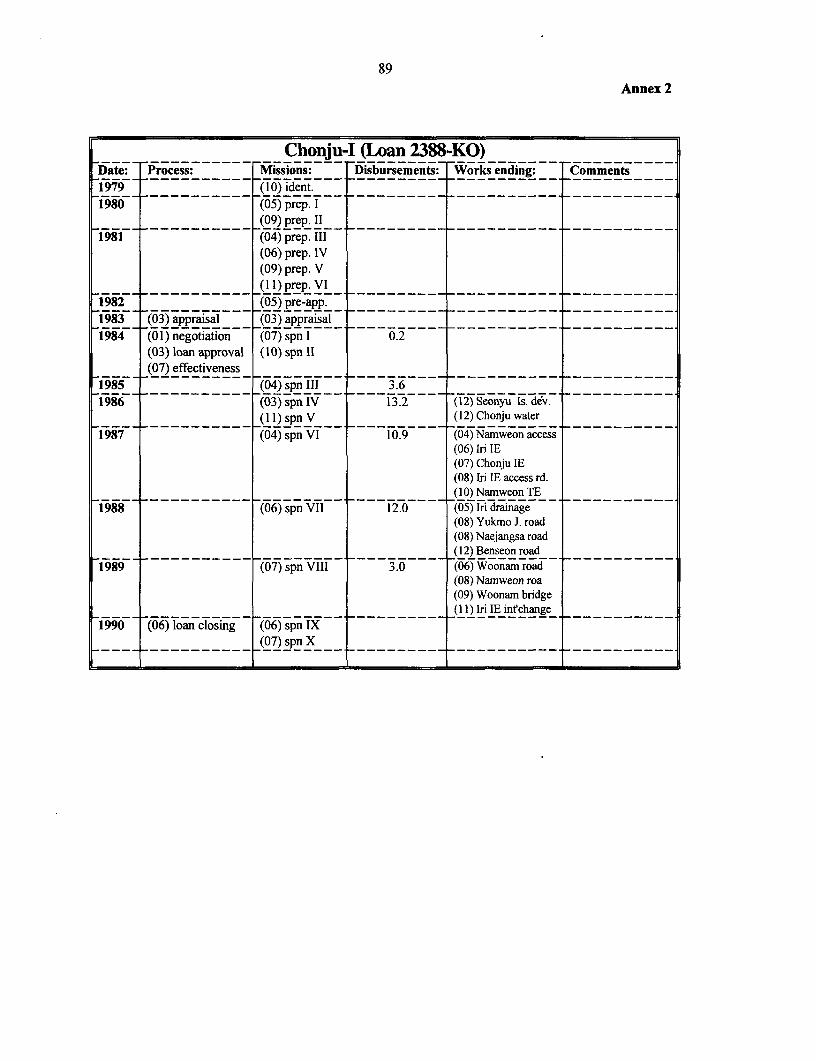

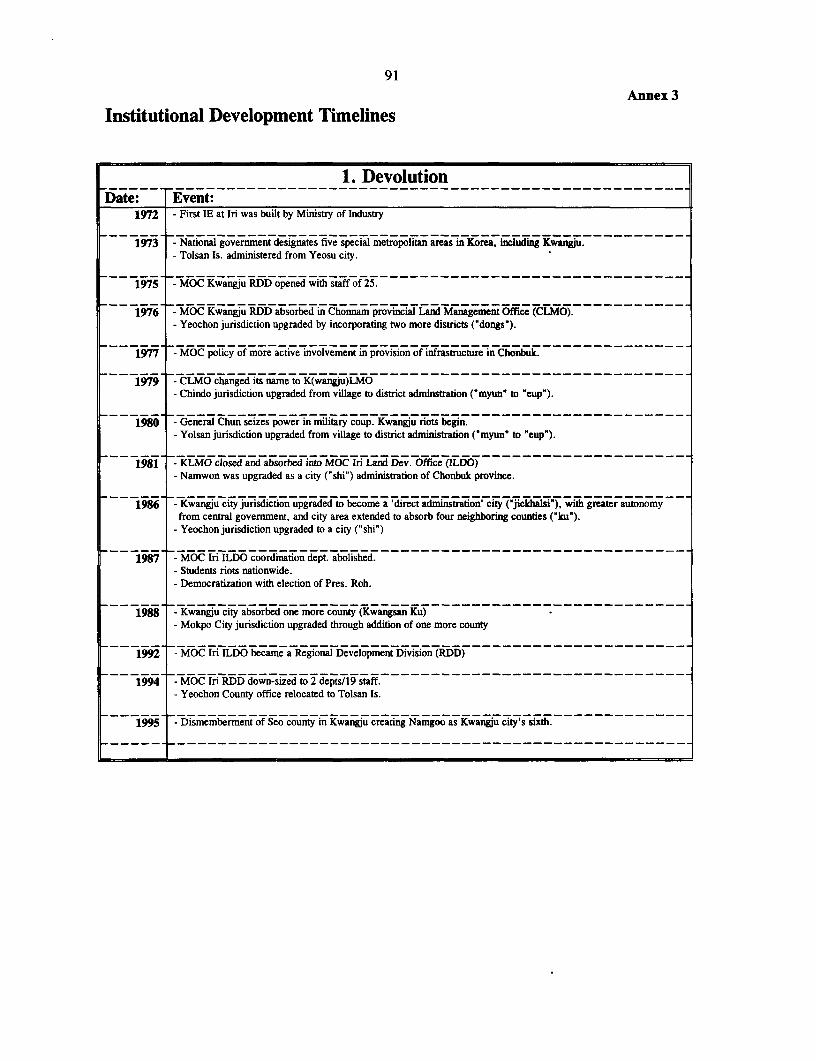
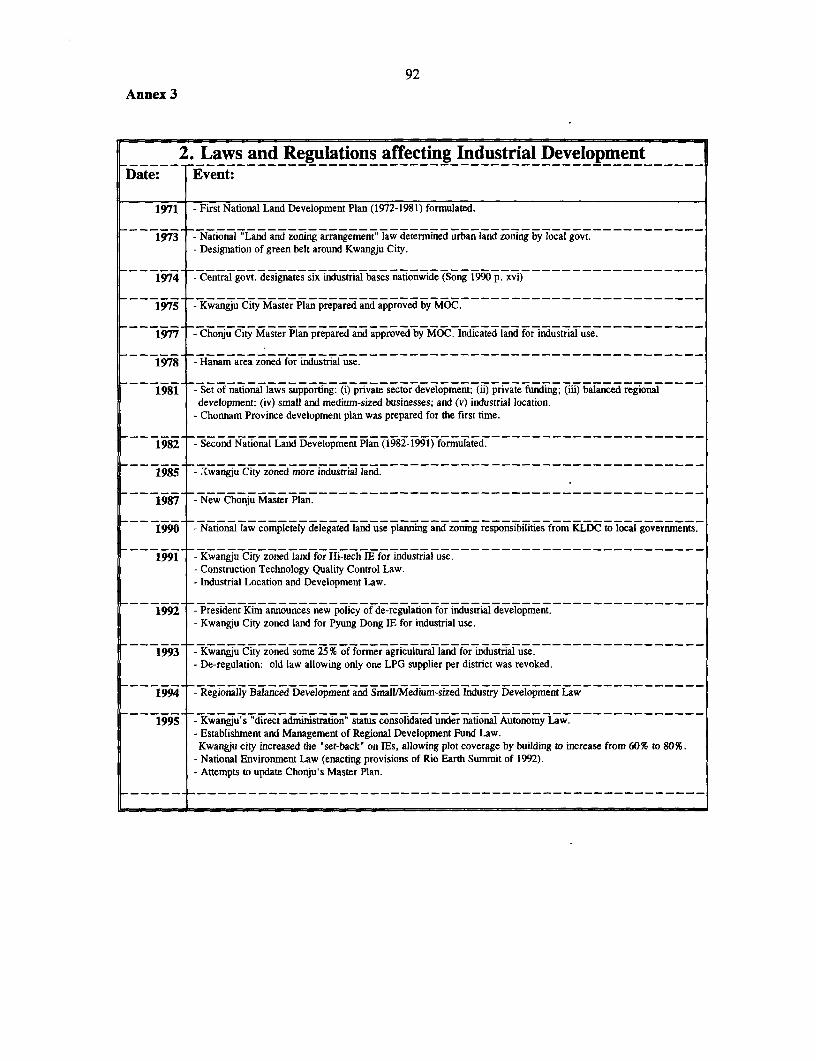
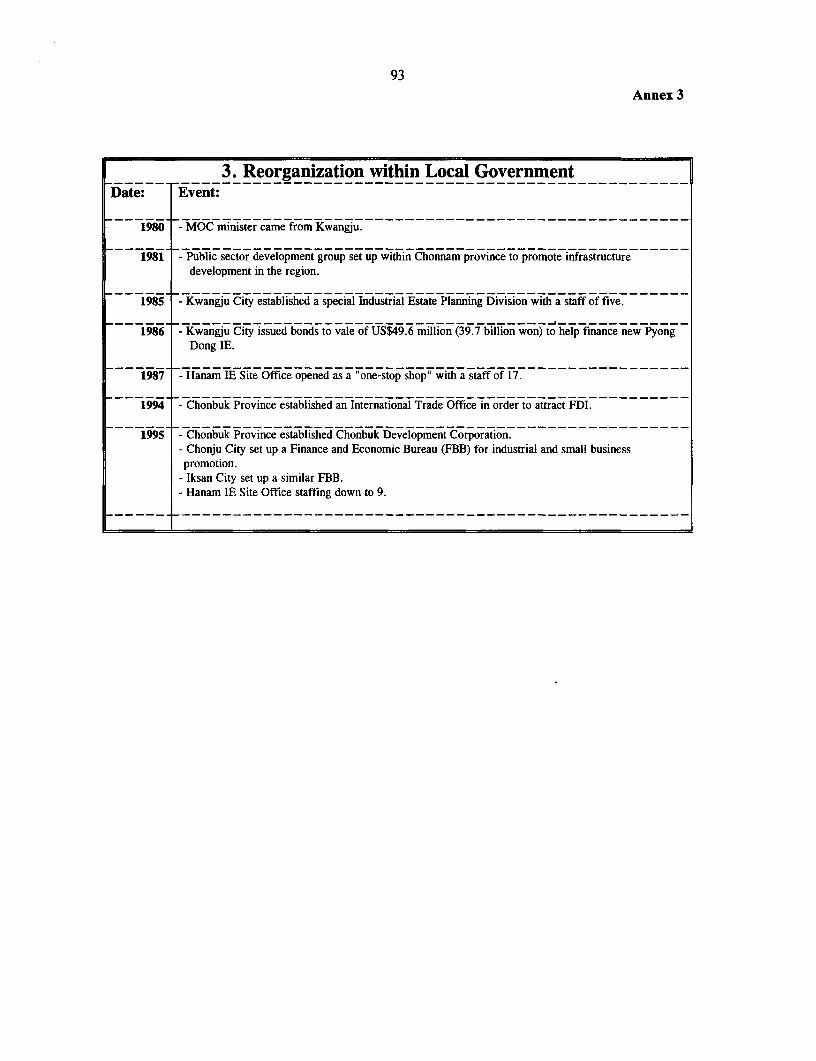
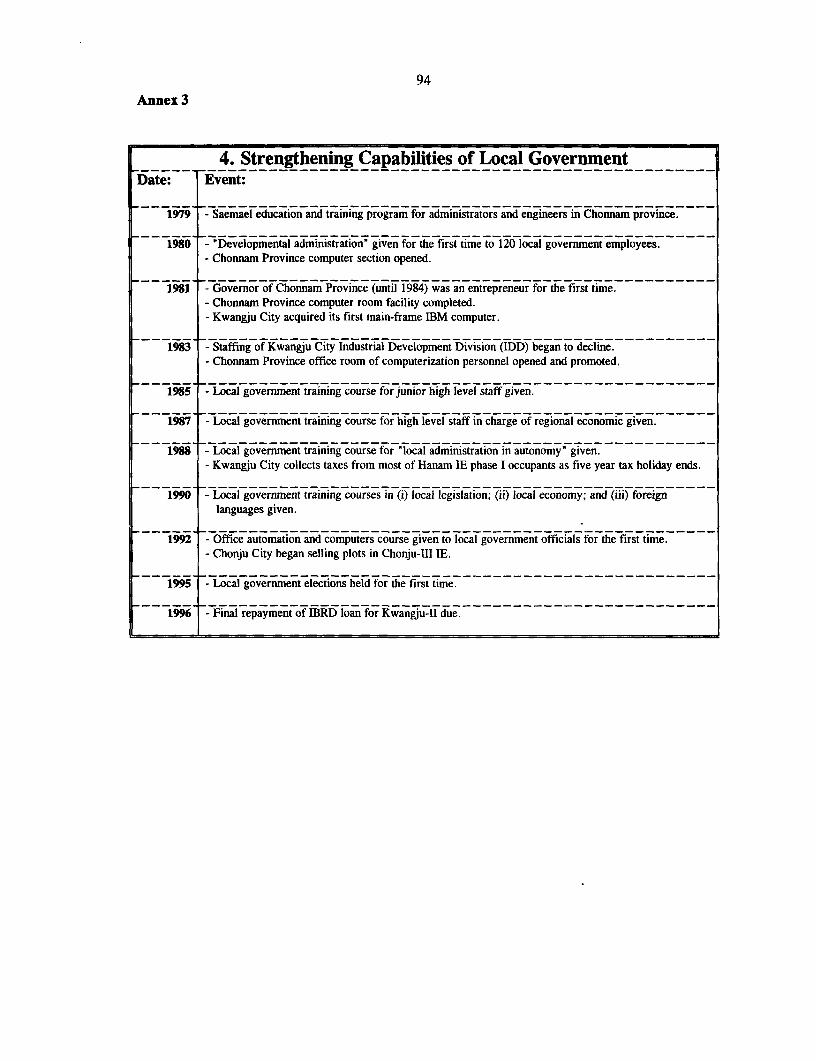

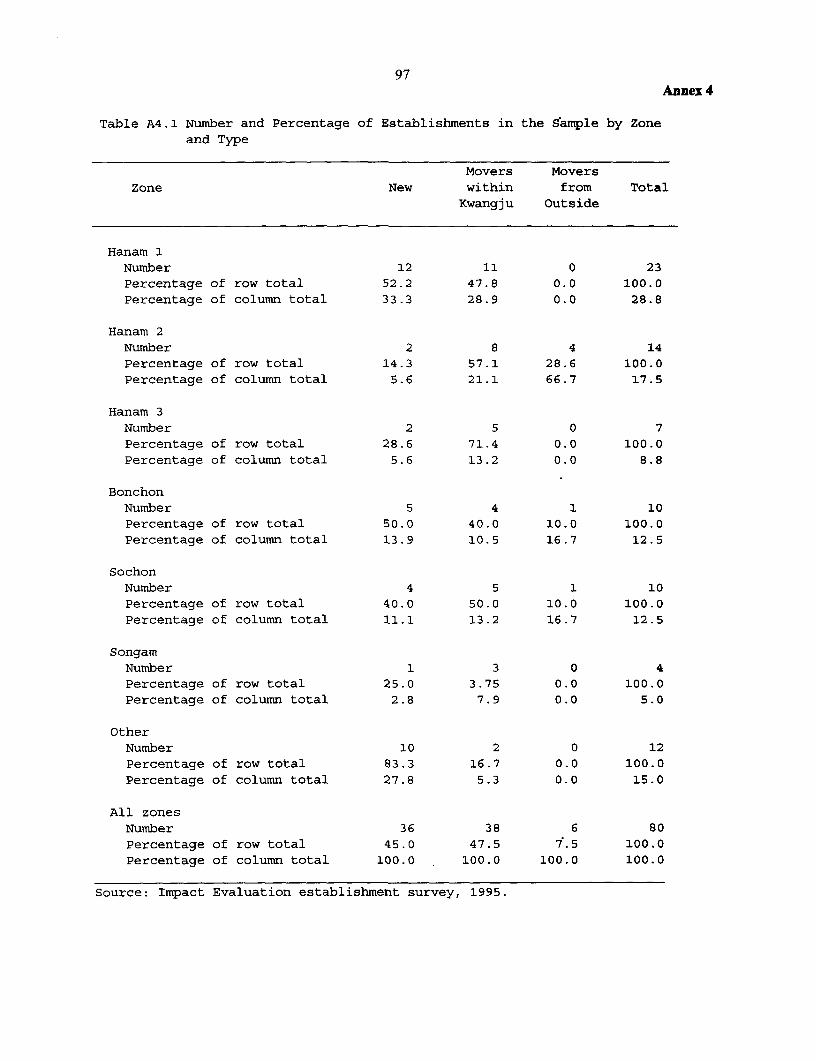
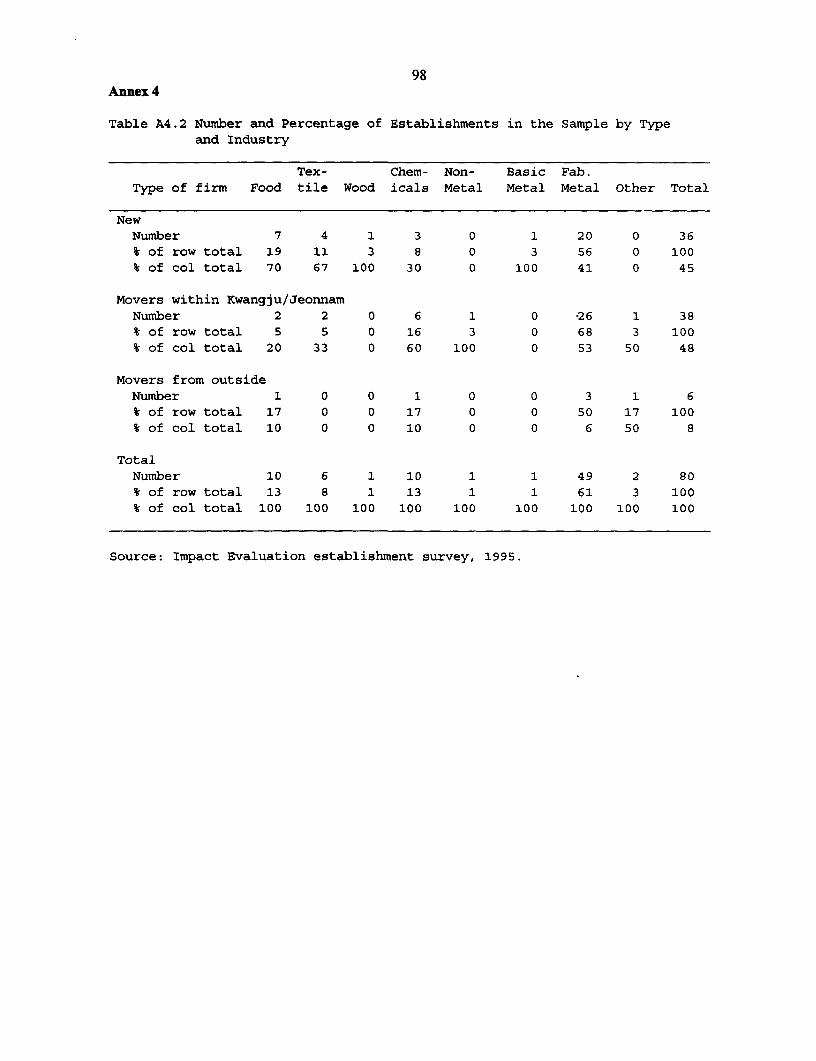
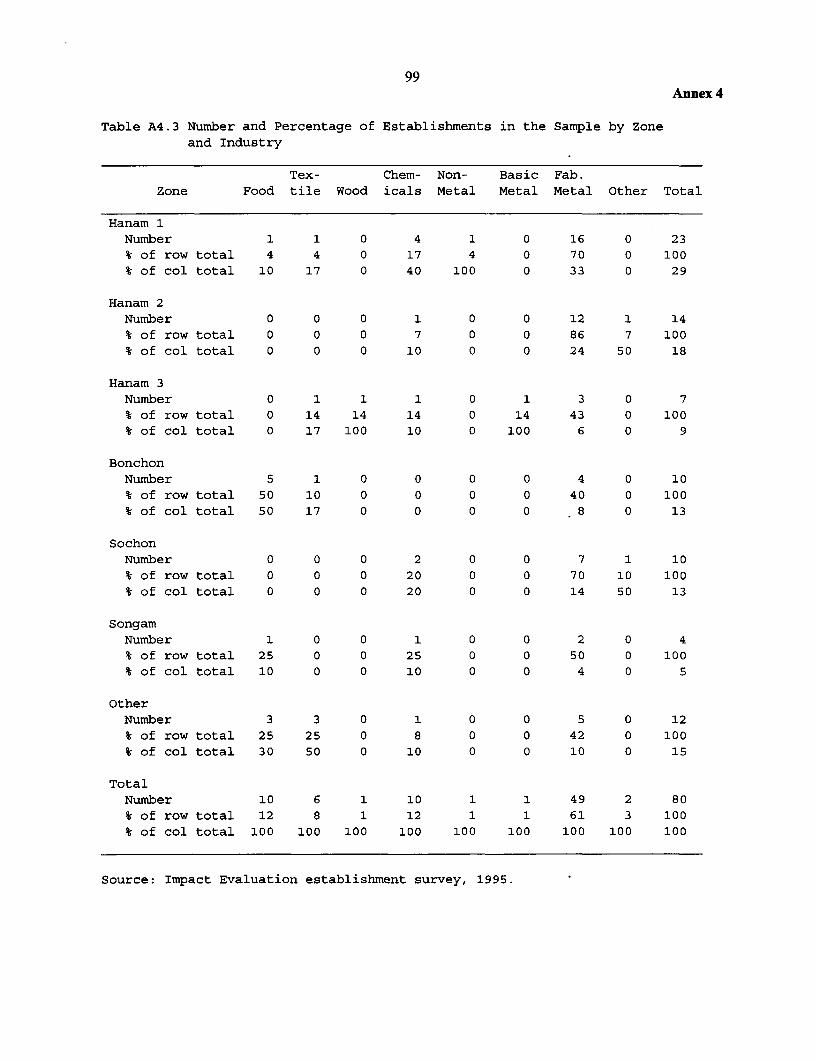
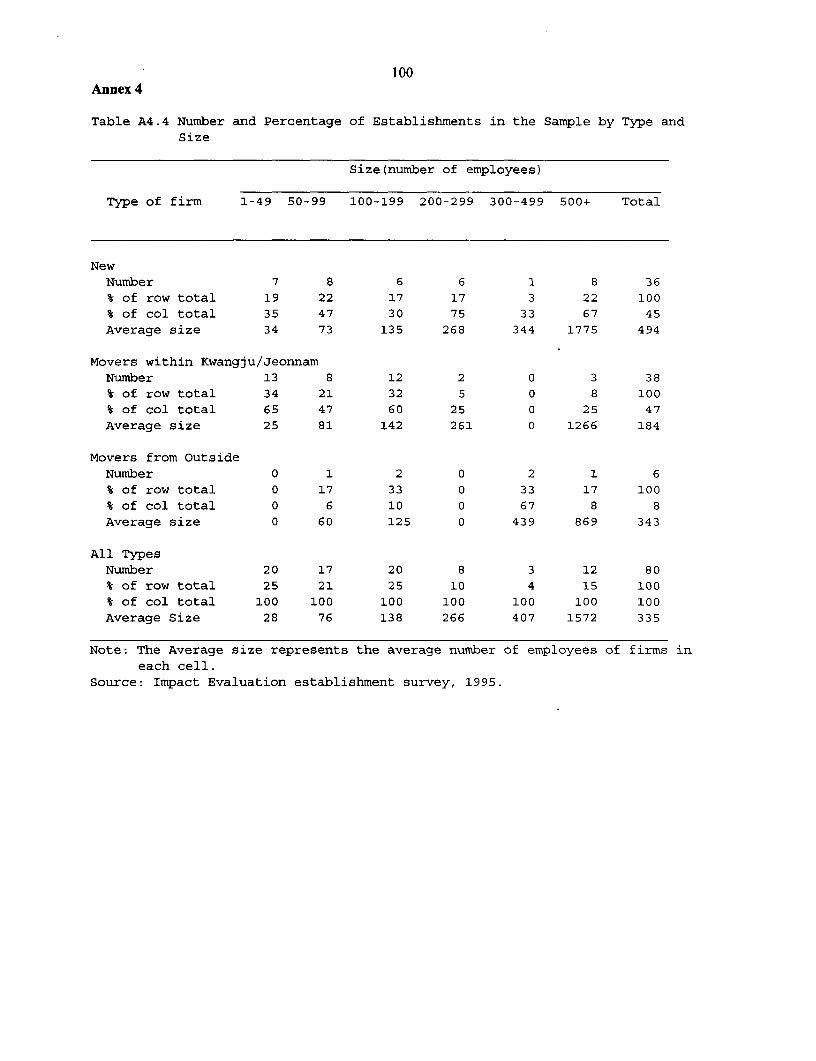
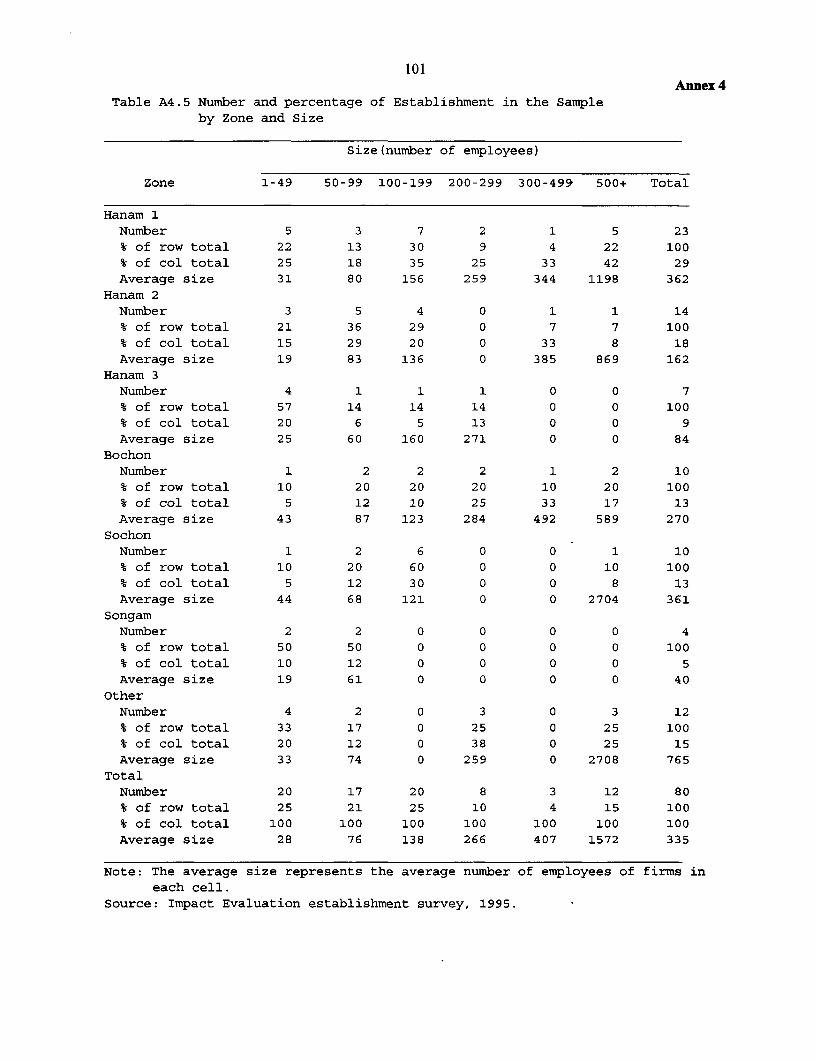
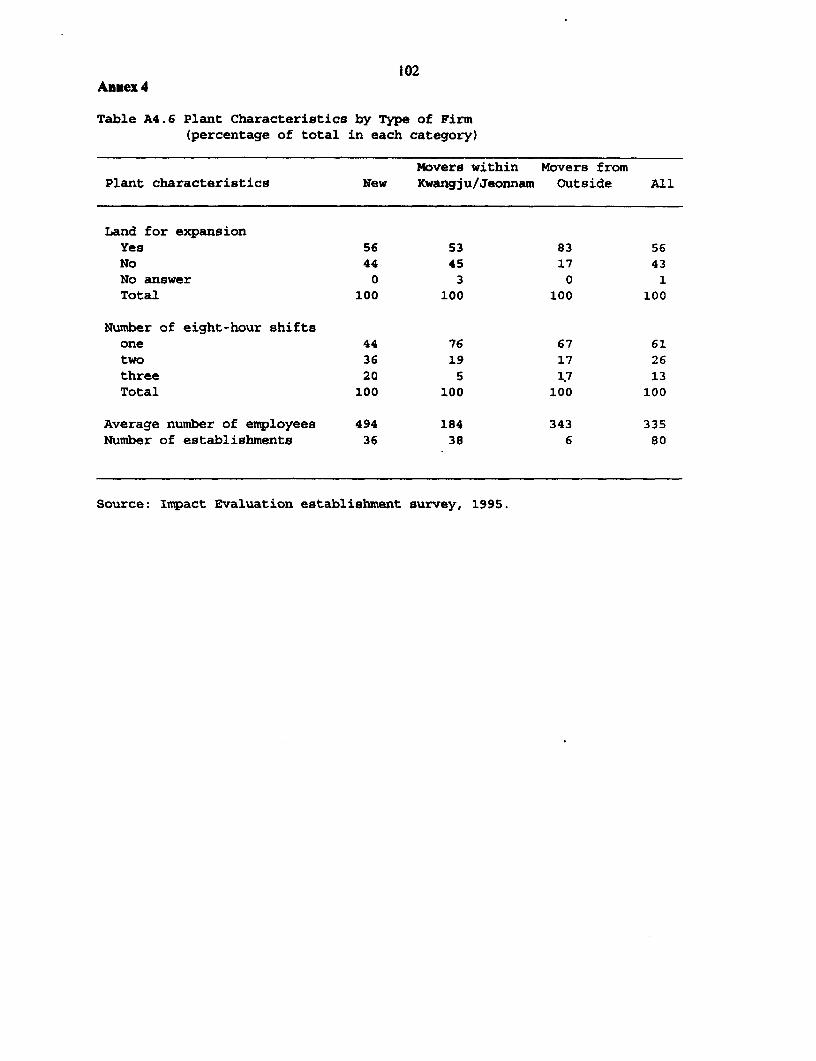
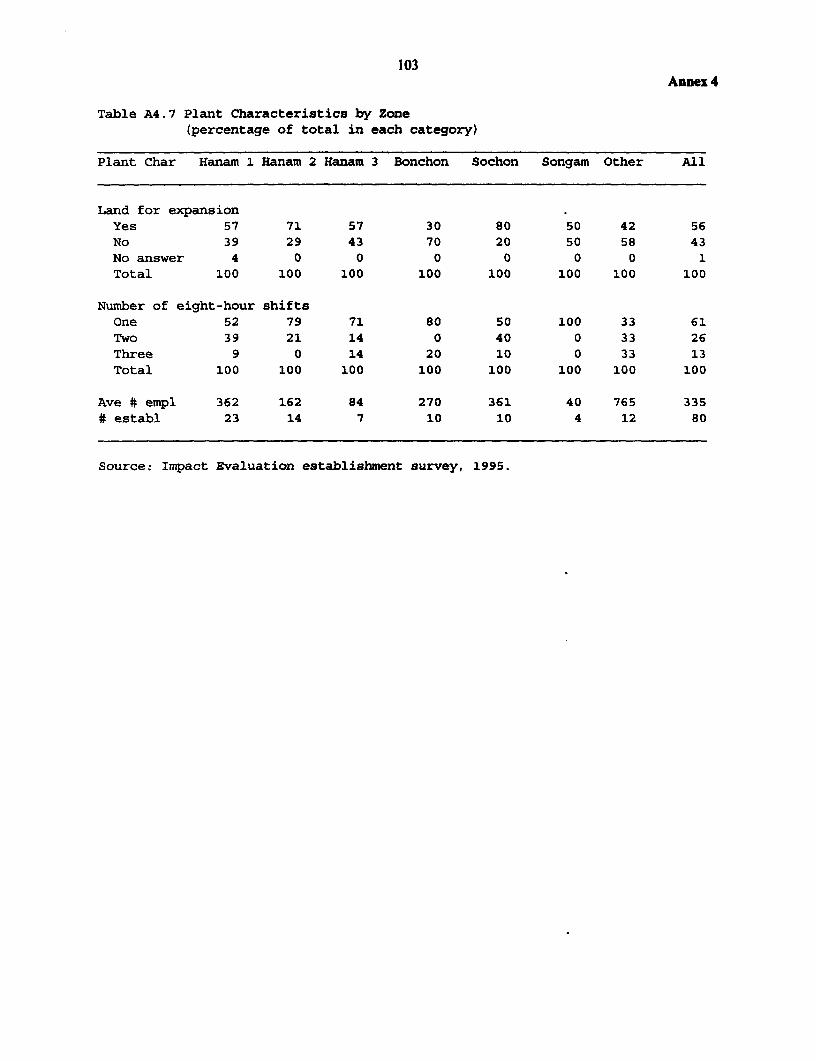
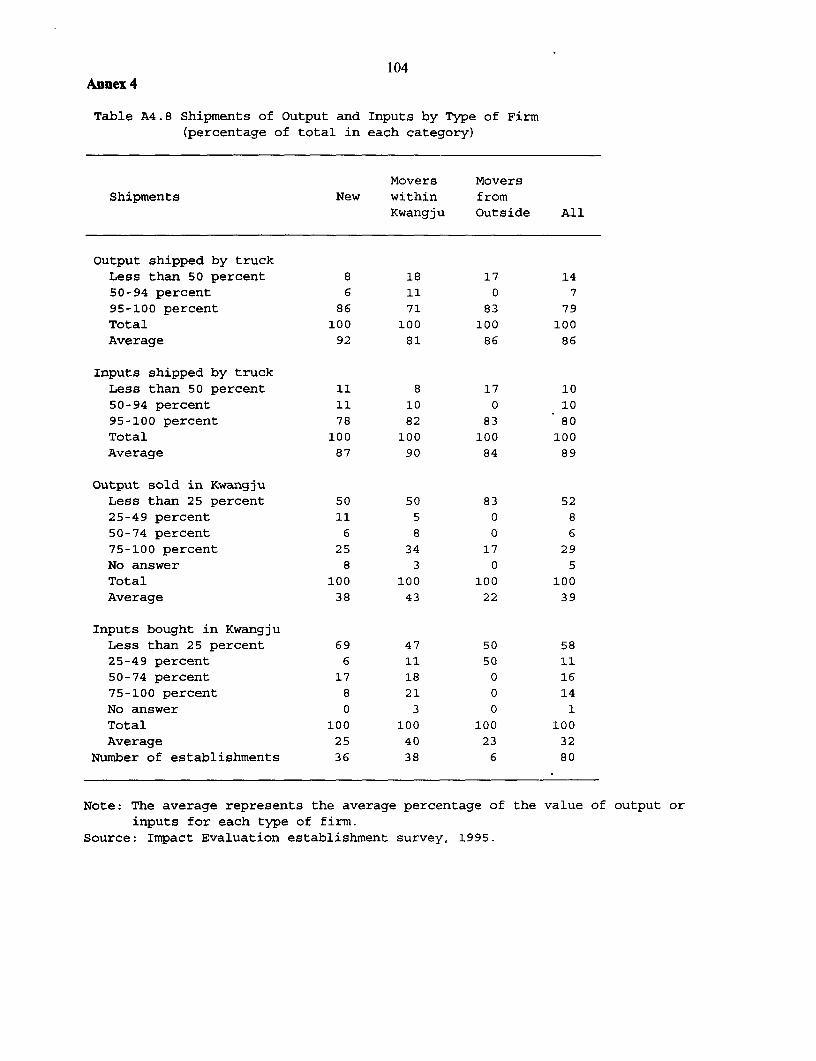
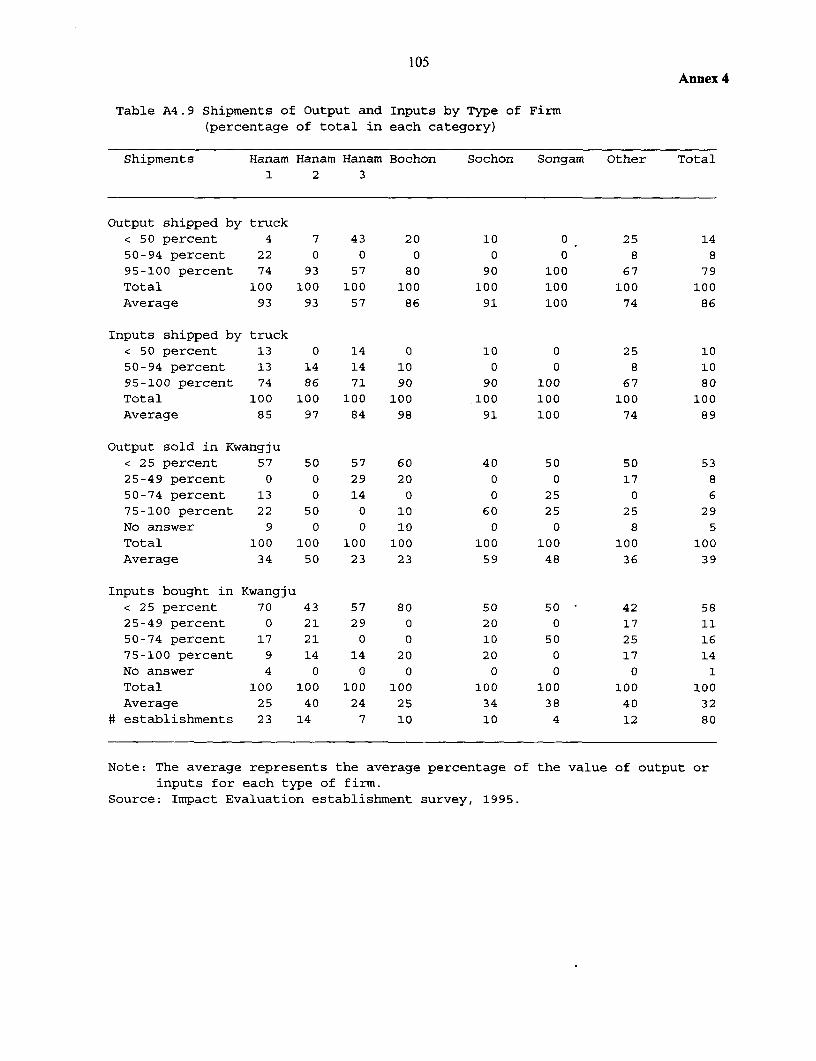
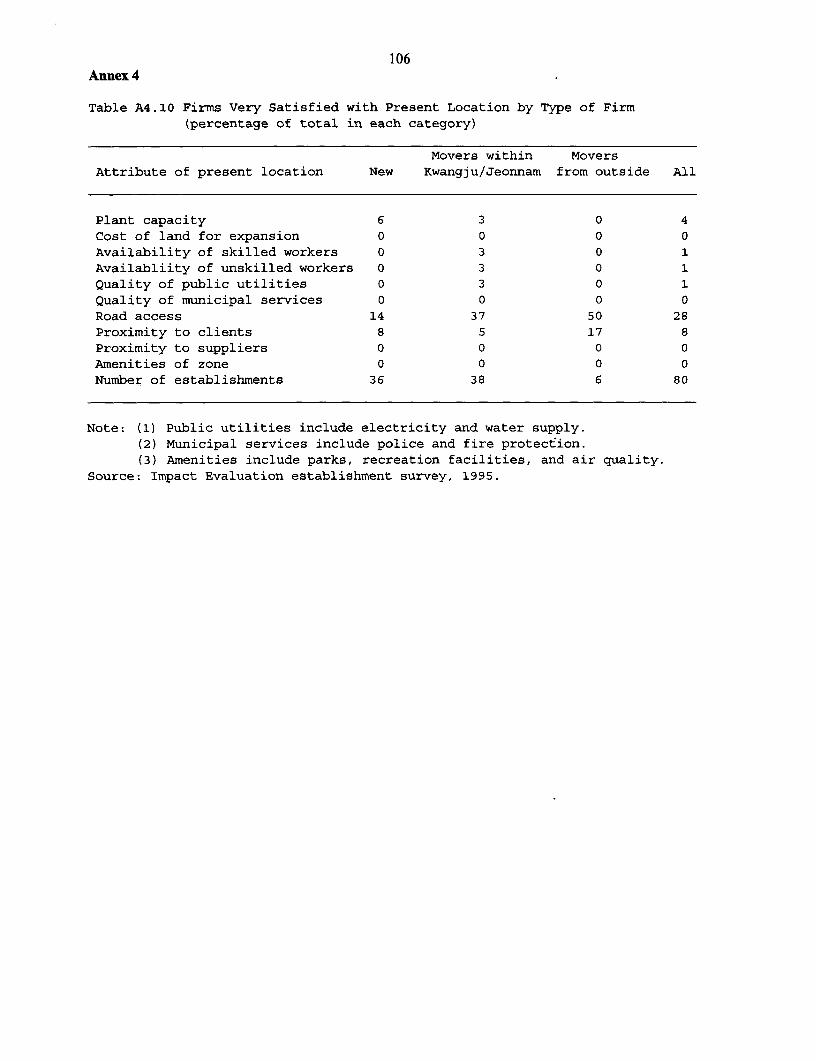
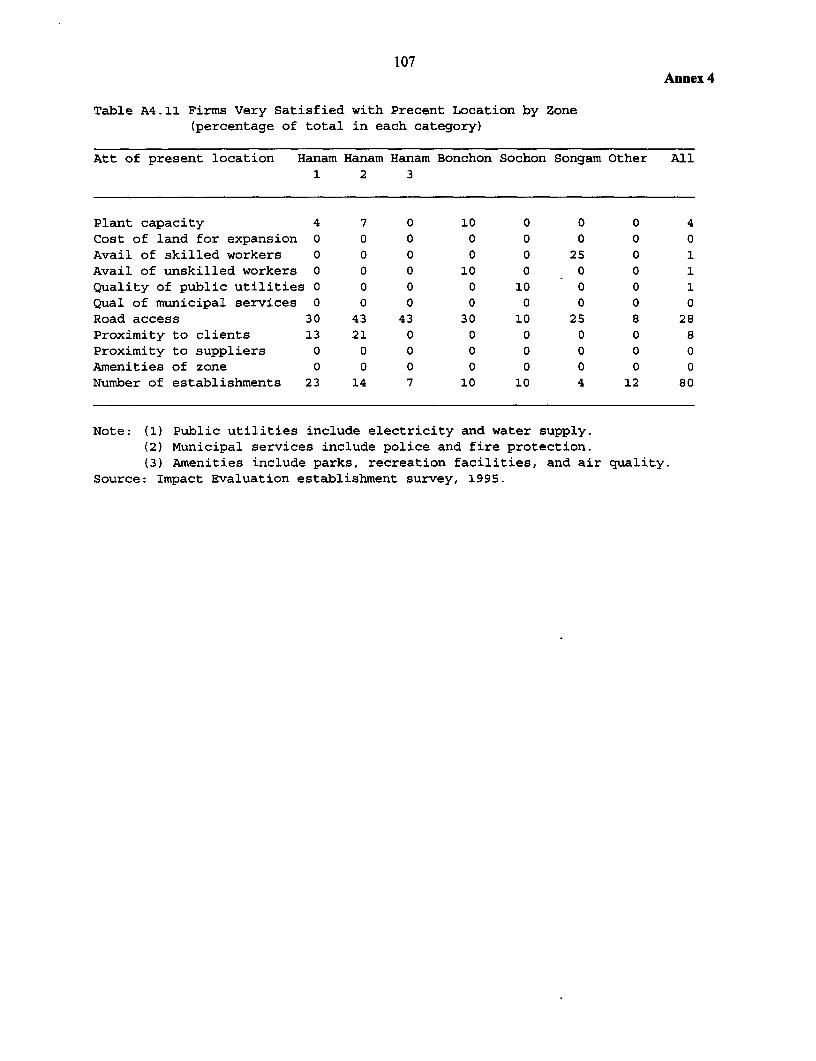
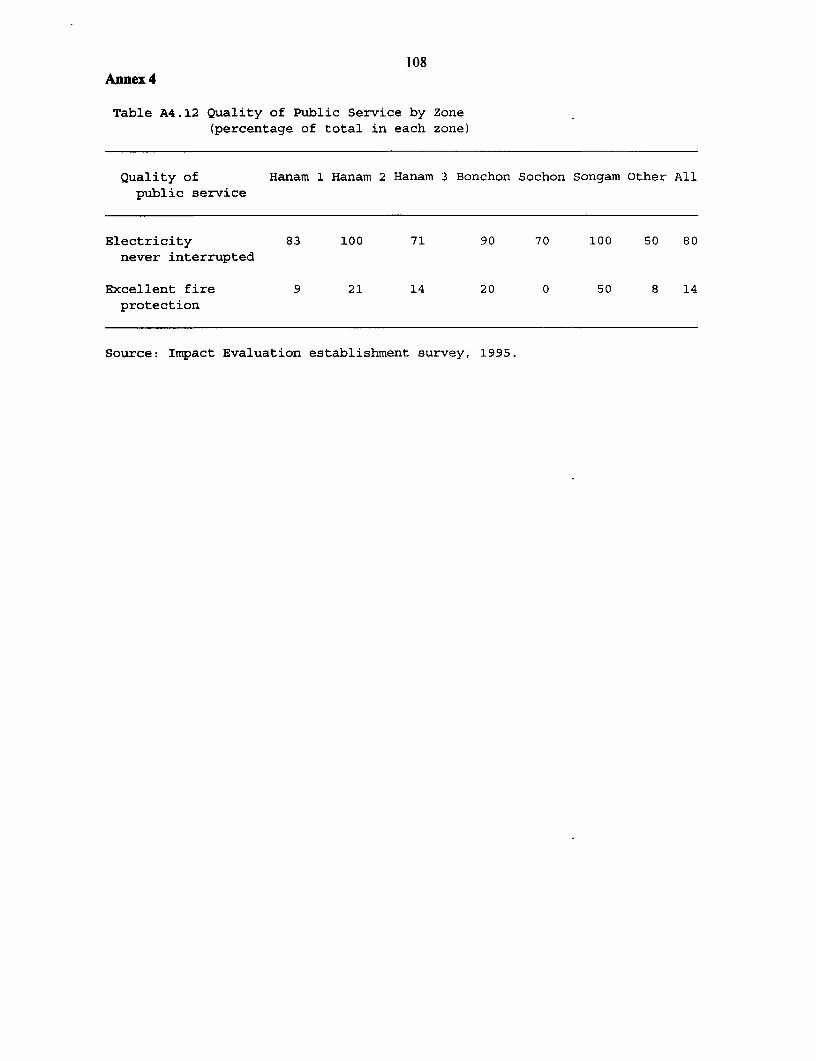
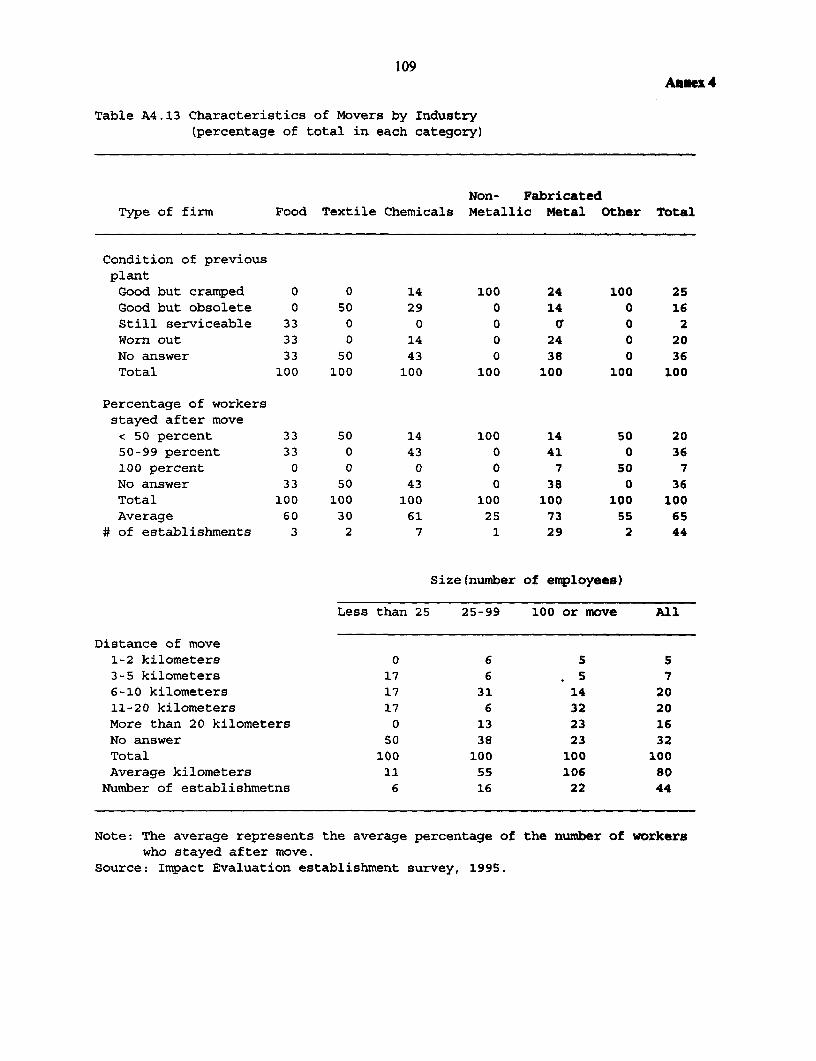
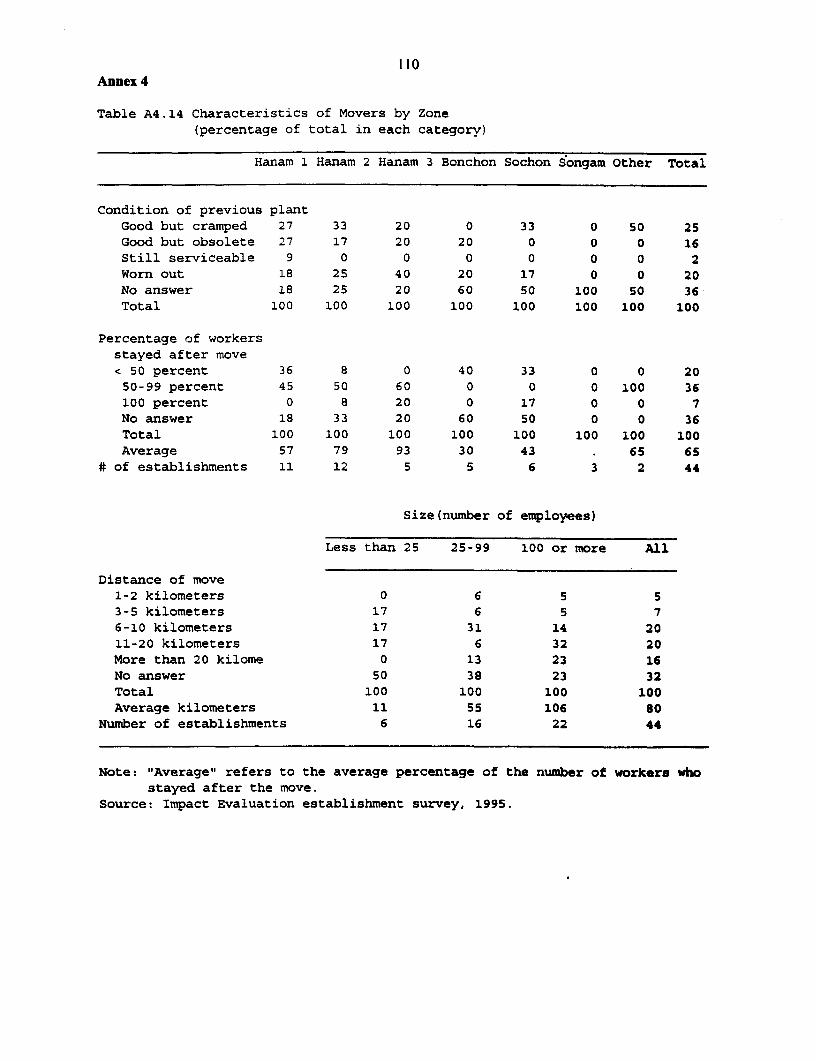
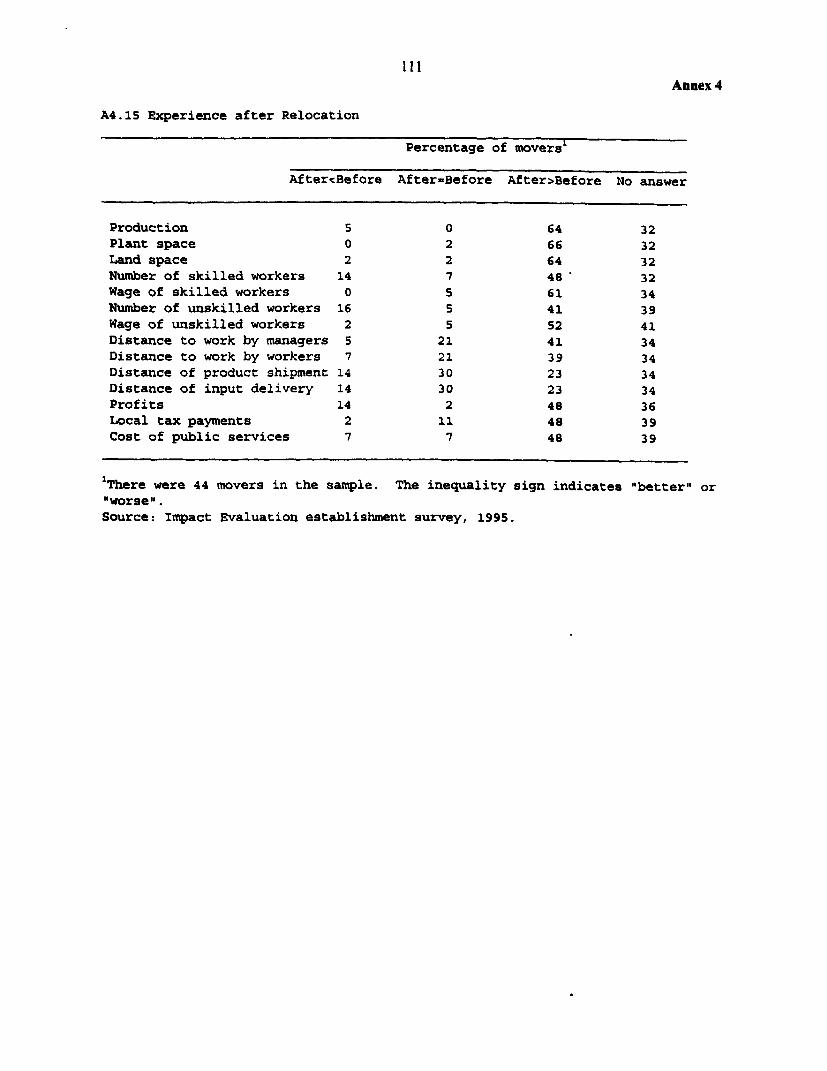
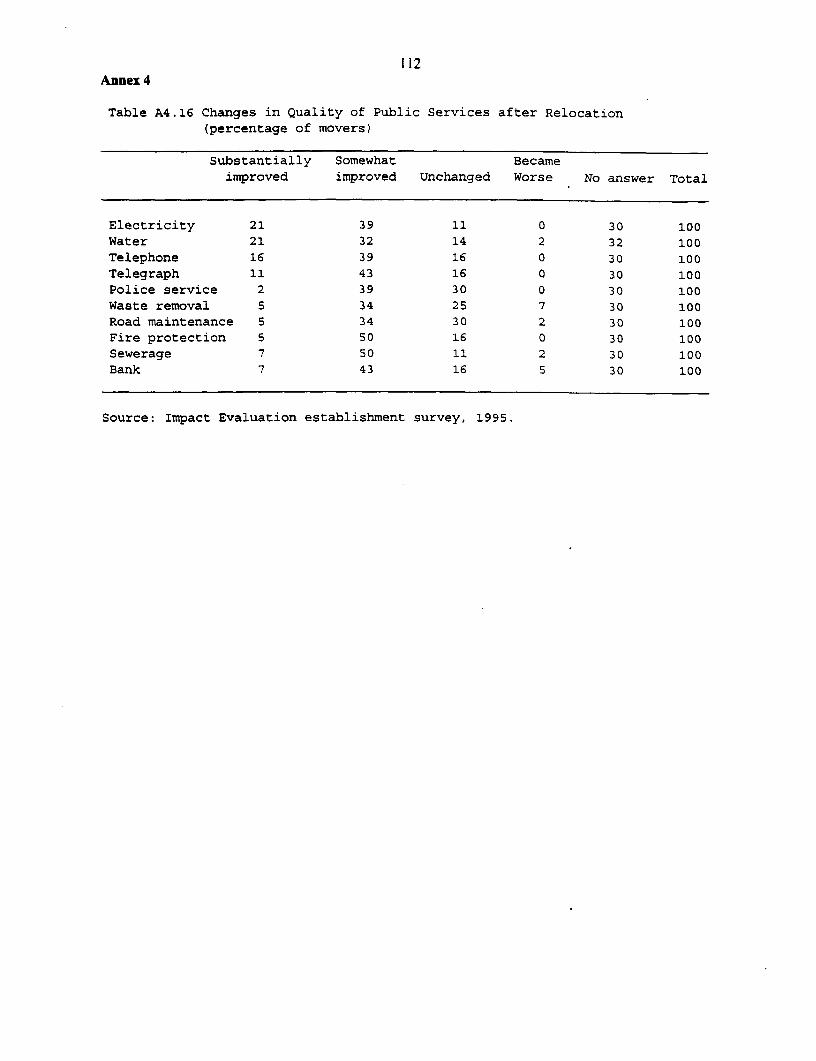
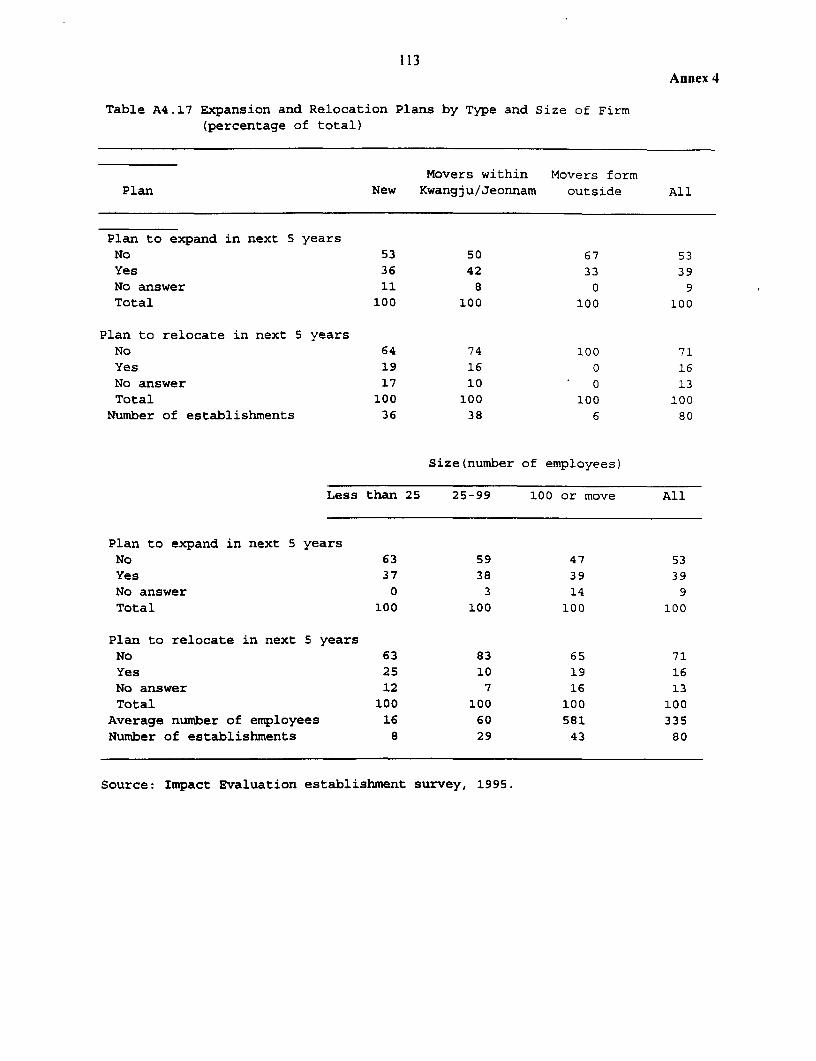
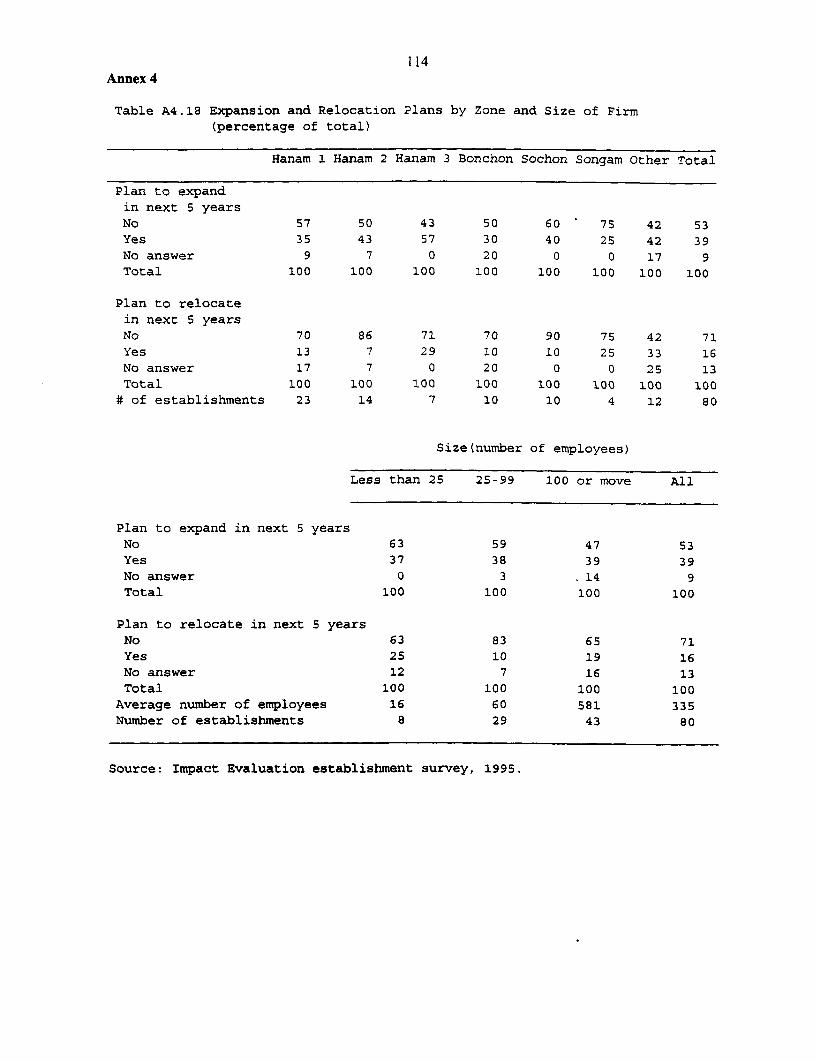


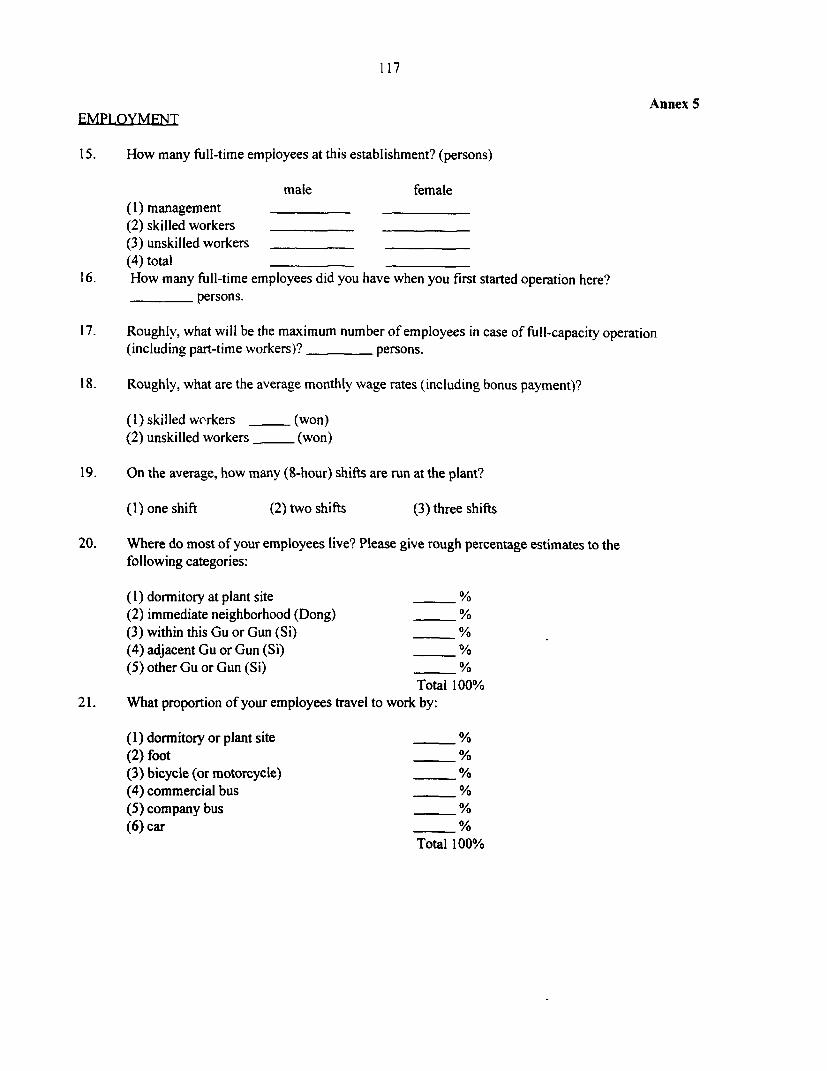
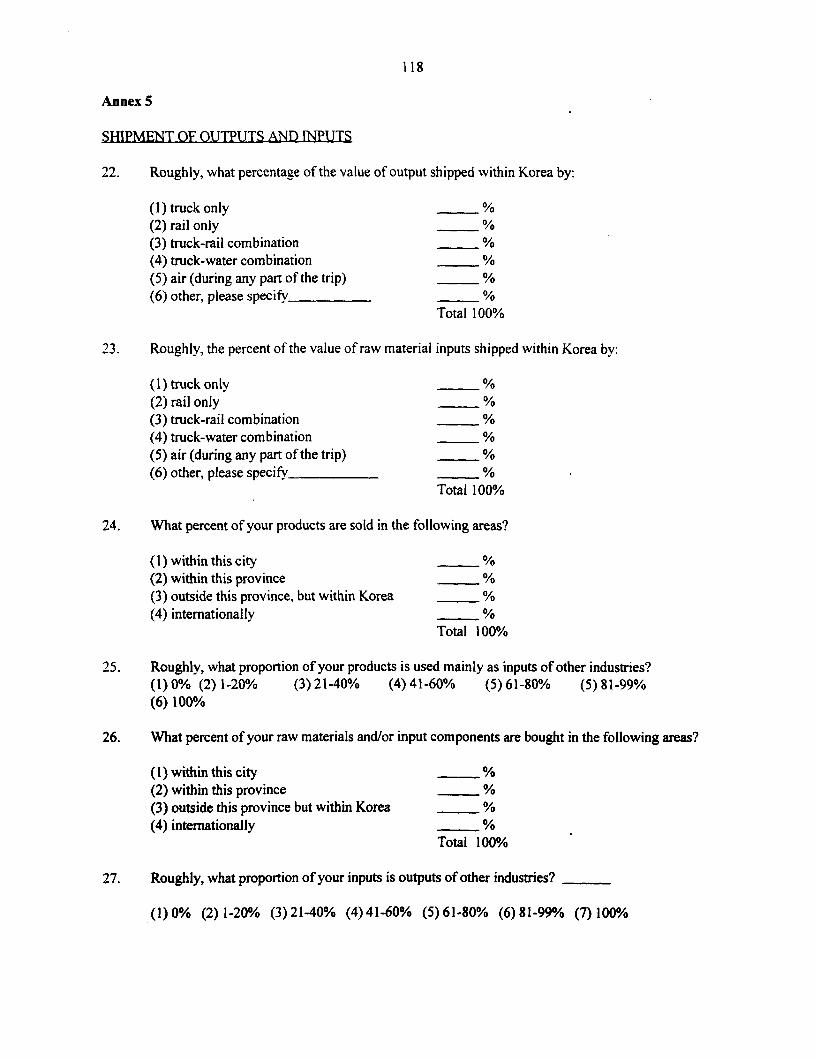
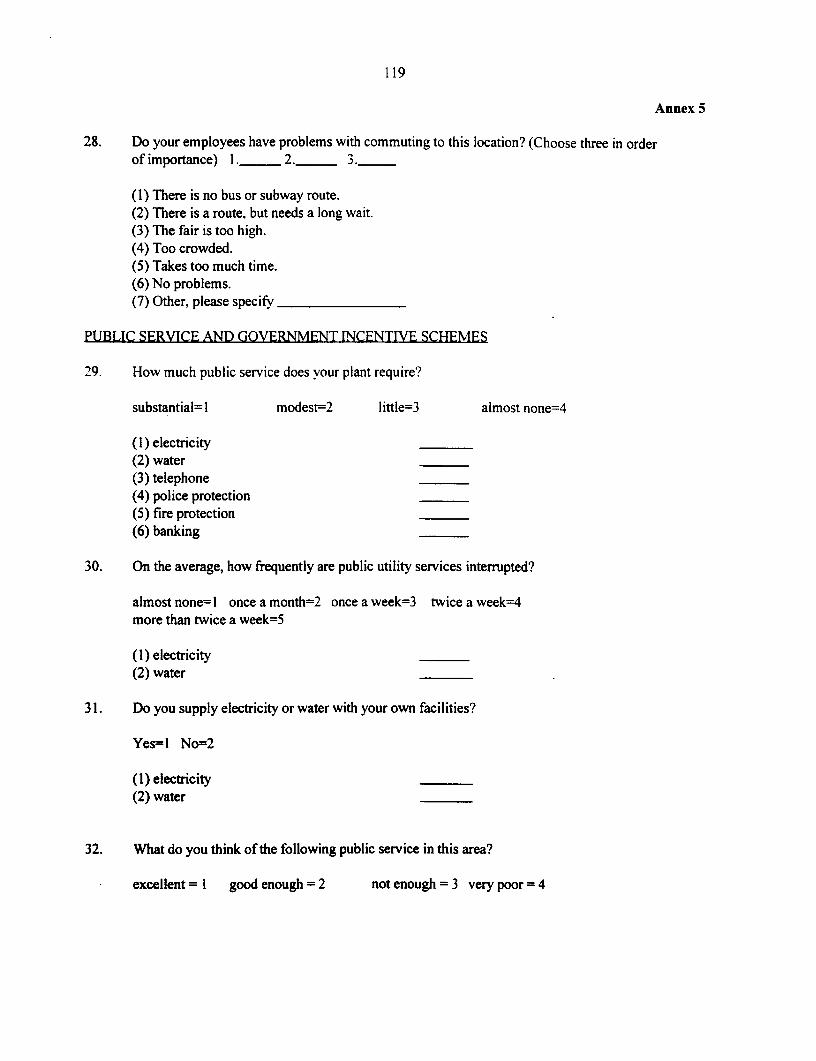
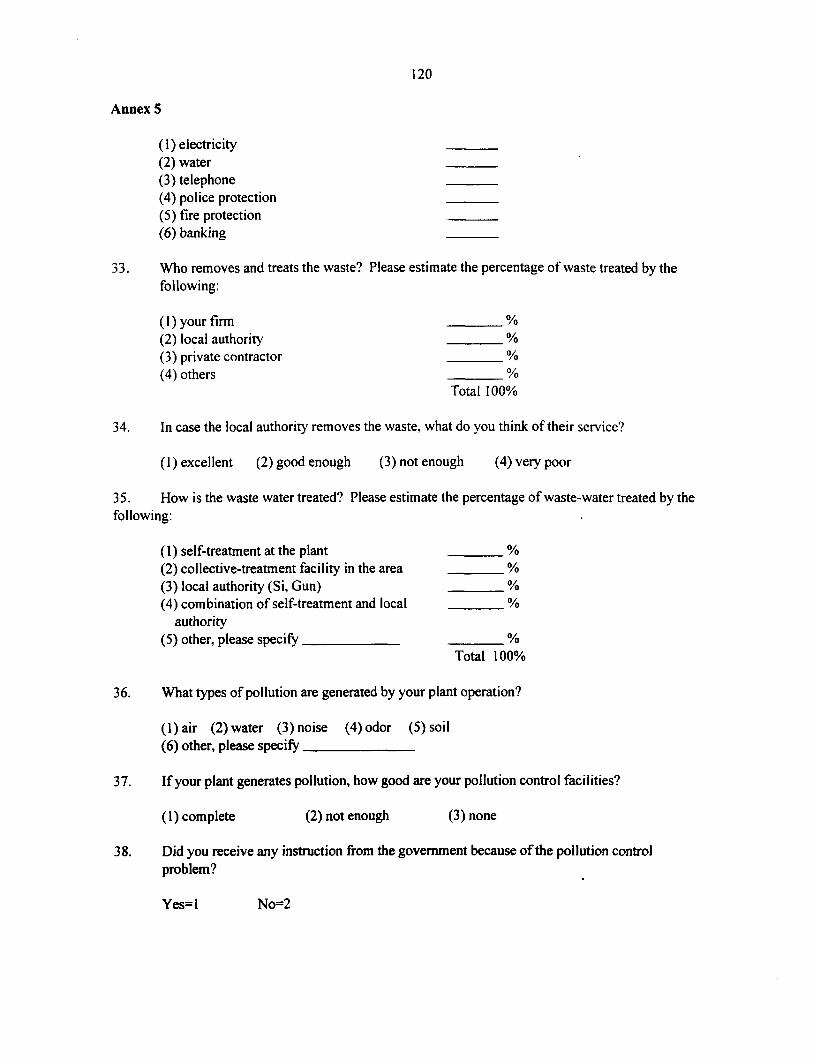


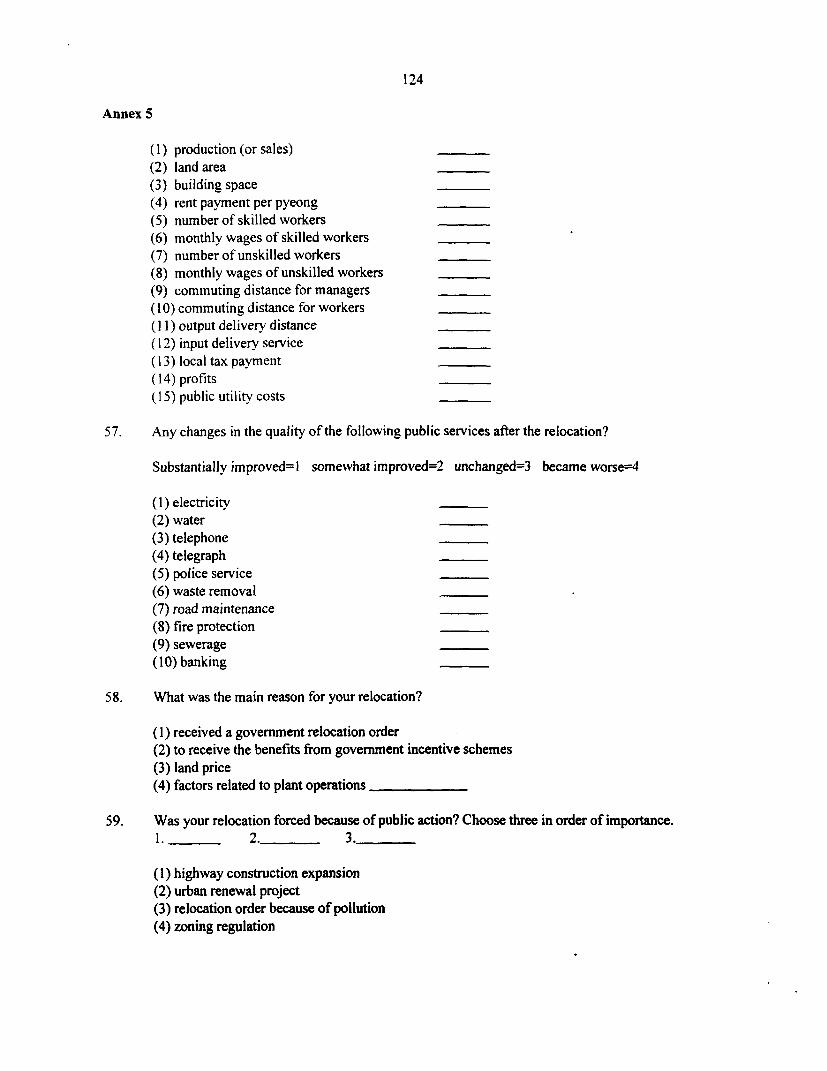

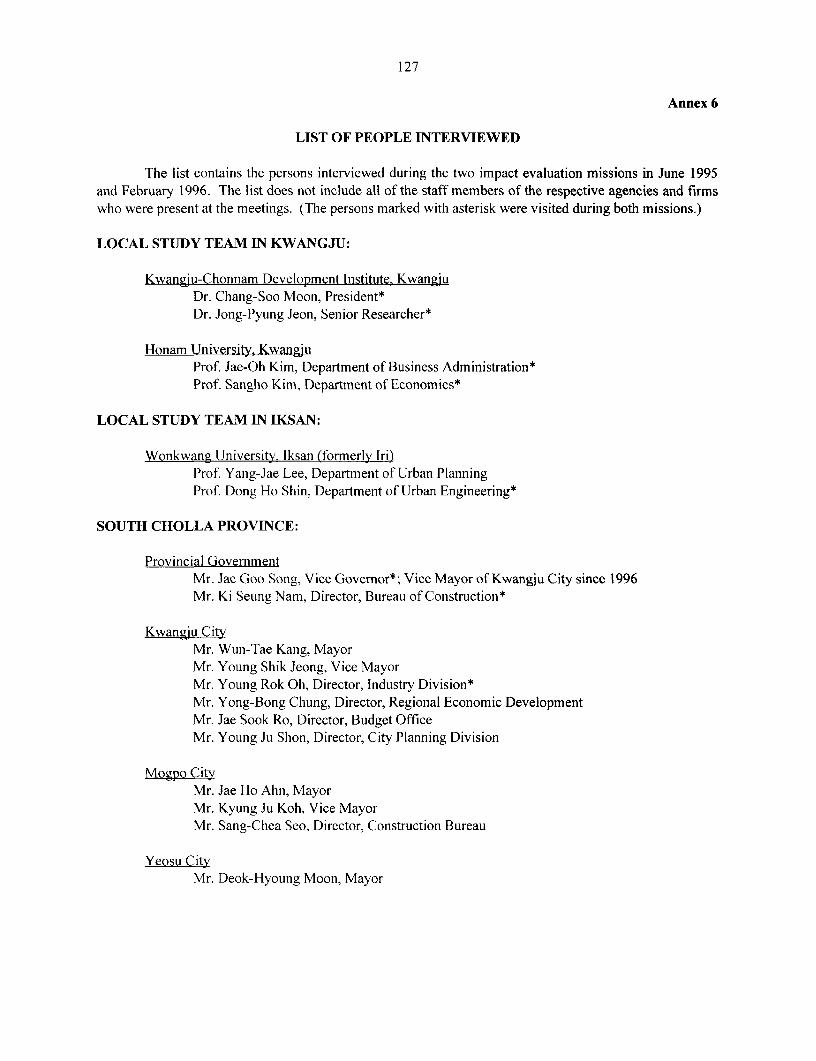

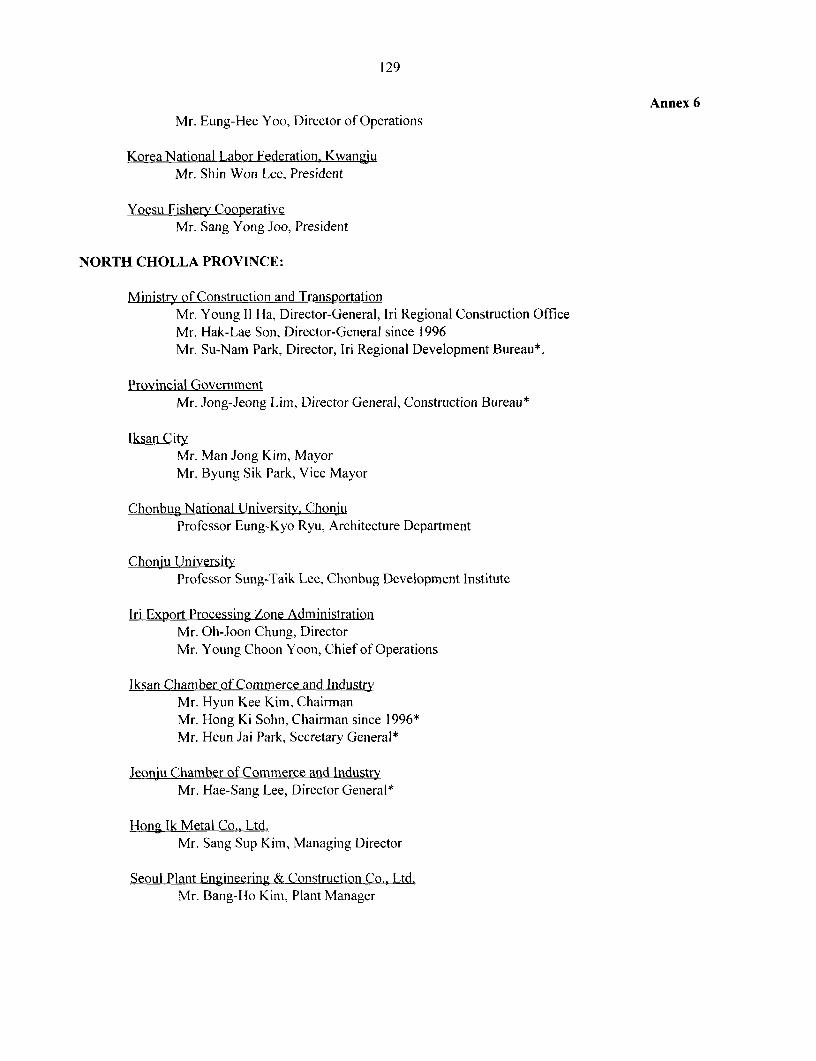
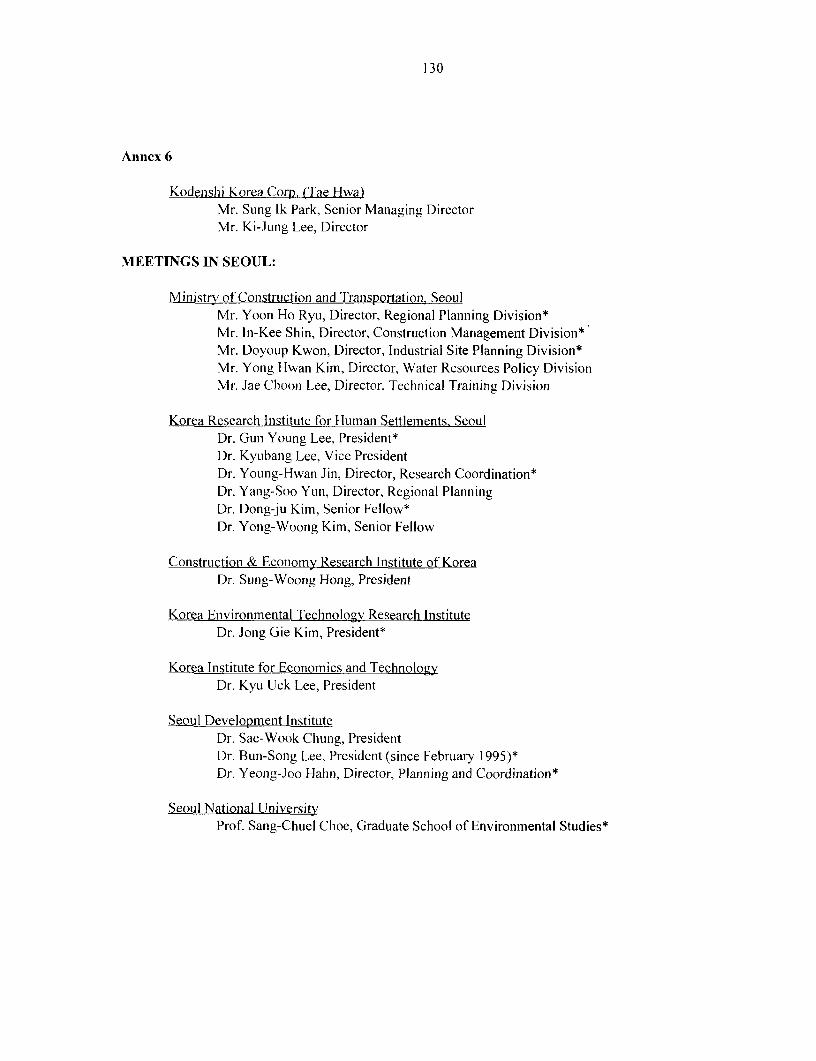
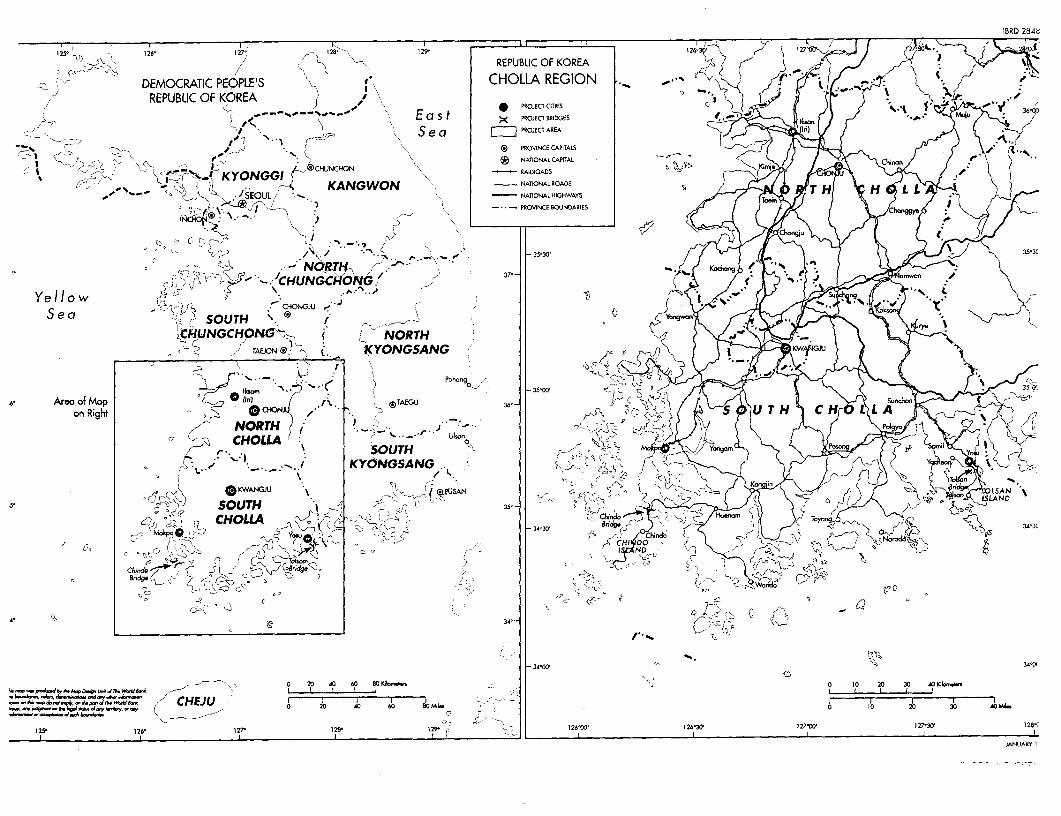


![Moct Seminar Report[1]](https://static.documents.pub/doc/80x56/577d205f1a28ab4e1e92b07a/moct-seminar-report1.jpg)


