Page 1
THIS REPORT CONTAINS ASSESSMENTS OF COMMODITY AND TRADE ISSUES MADE BY
USDA STAFF AND NOT NECESSARILY STATEMENTS OF OFFICIAL U.S. GOVERNMENT
POLICY
Required Report - public distribution
Date: 2011-02-15
GAIN Report Number: KS1108
Korea - Republic of
Retail Foods
Sector Biennial Report
Approved By:
Michael Fay, ATO Director
Prepared By:
Sangyong Oh, Marketing Specialist
Report Highlights:
The retail food sector in South Korea has evolved rapidly over the last two decades to become one of
the most advanced in the world today. Growth of the sector was mainly fueled by expansion of modern,
large-scale retail businesses, which reflect evolving tastes and increased wealth of Korean
consumers. More stream-lined supply channels coupled with strong consumer trends for better value
and wider choices was translated into growing demand for imported consumer-ready food
products. Imports of consumer-oriented foods from the United States totaled $1.8 billion in 2010, up 32
percent from the previous year.
Page 2
Post:
Seoul ATO
Author Defined:
KOREA RETAIL FOOD SECTOR REPORT
TABLE OF CONTENTS
I. Market Summary
A. South Korean Retail Sector Overview
B. Consumer Food Trends
C. Food Imports
II. Road Map for Market Entry
A. Modern Retail Businesses: Hypermarkets, Grocery Supermarkets, Convenience Stores, Department Stores,
On-line Retailers, Franchise Specialty Grocery Retailers
A-1. Entry Strategy
A-2. Market Structure and Product Flow
A-3. Sub-sector Company Profiles
A-3-1. Hypermarkets
A-3-2. Grocery Supermarkets
A-3-3. Convenience Stores
A-3-4. Department Stores
A-3-5. On-line Retailers
A-3-6. Franchise Specialty Grocery Retailers
B. Traditional Retail Businesses: Wet Markets, Mom-and-Pop Grocers
III. Competition
IV. Best Product Prospects
A. Products Present in the Market Which Have Good Sales Potential
B. Products Not Present in Significant Quantities but Which Have Good Sales Potential
C. Products Not Present Because They Face Significant Barriers
Page 3
V. Post Contact and Further Information
I. Market Summary
A. South Korean Retail Sector Overview
The retail sector in South Korea[1] has evolved dramatically ever since opening of the first hypermarket
store in 1993 (E-Mart by Shinsegae Co.) and the liberalization of large-scale retail business to foreign
ownership in 1996 (Macro, a Dutch retailer, was the first one to enter the market). Modern format,
large-scale retail businesses such as hypermarket chains, grocery supermarket chains, convenience
store chains, and on-line retailers have grown rapidly at the expense of traditional retail outlets of street
markets and family-operated small retailers over the years. Expansion of these new retail channels,
coupled with introduction of new information technologies, has significantly changed the way Korean
consumers purchase daily necessities, including food.
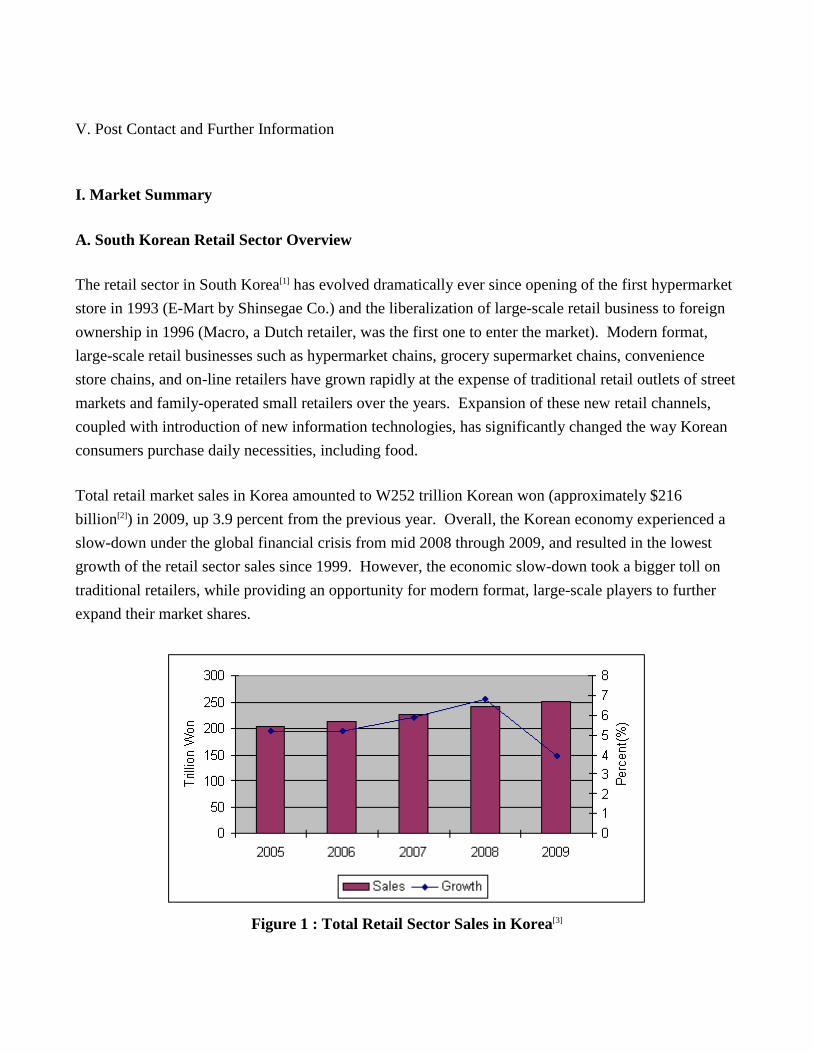
Total retail market sales in Korea amounted to W252 trillion Korean won (approximately $216
billion[2]) in 2009, up 3.9 percent from the previous year. Overall, the Korean economy experienced a
slow-down under the global financial crisis from mid 2008 through 2009, and resulted in the lowest
growth of the retail sector sales since 1999. However, the economic slow-down took a bigger toll on
traditional retailers, while providing an opportunity for modern format, large-scale players to further
expand their market shares.
Figure 1 : Total Retail Sector Sales in Korea[3]
Page 4
Hypermarkets, armed with aggressive pricing, one-stop shopping convenience, and efficient product
assortment, have stepped up to the largest retail force in Korea since 2002, replacing the former leader,
department stores. Hypermarkets accounted for 12.4 percent of overall retail sector sales, or W31.3
trillion in 2009. The sales of hypermarkets is likely to increase further in the coming years as on-going
renovation projects of old metropolitan areas as well as development of new residential areas across the
country will provide space for a significant number of new stores.
On-line retailers, including internet shopping, TV home-shopping, and catalog shopping businesses,
have stepped up to the second largest retail channel in Korea since 2007. Sales of on-line retailers
grew 29.2 percent between 2007 and 2009 to take 10.8 percent, or W27.1 trillion, of total retail sector
sales in 2009. On-line retailers, internet shopping malls in particular, are expected to remain the fastest
growing retail channel in Korea for years to come as more and more consumers are attracted to this
innovative shopping tool for convenience and price. Korea has the right mix of socio-economic
conditions, in particular high population density and high affinity toward new information technology,
that favor strong growth of on-line retail business.
Department stores and grocery supermarkets maintained a solid growth between 2007 and 2009. In
particular, department stores were one of the most successful retail channels under the recent economic
slow-down. Leading players in the segment have successfully realigned their market positions with up-
scaled store layouts and more luxury product offerings, accurately reflecting the evolving tastes of their
target consumers. Grocery supermarkets have found a new growth momentum in recent years with
„Super Supermarket(SSM)‟ business. SSM is a larger-scale grocery supermarket store that targets
neighborhood markets in congested residential areas where larger hypermarket stores can not
infiltrate. Despite the protests by independent small grocers and NGO voices, grocery supermarket
chains are likely to open more SSM stores in the coming years. Convenience stores also showed an
outstanding growth between 2007 and 2009, reflecting busier lifestyle of Korean consumers. Although
convenience stores offer very limited product assortment by nature, it is the most wide spread retail
channel in Korea today (the number of outlets under the top seven franchises were over 14,000 at the
end of 2009). Although on a decline, traditional retailers such as street markets and family-operated
small grocers still account for a significant retail force particularly in areas where modern format,
large-scale retailers have yet to penetrate.
Table 1: Breakdown of Retail Market Sales in Korea[4]
Segment 2007 2009
Sales Growth Sales M/S Sales M/S
Hypermarkets W28.4 trillion 12.5% W31.3 trillion 12.4% 10.2%
Page 5
On-line Retailers[5] W21.3 trillion 9.4% W27.1 trillion 10.8% 27.2%
Grocery Supermarkets W19.6 trillion 8.6% W22.4 trillion 8.9% 14.3%
Department Stores W19.0 trillion 8.4% W21.6 trillion 8.6% 13.7%
Convenience Stores W4.8 trillion 2.1% W6.2 trillion 2.5% 29.2%
Others[6] W134.4 trillion 58.9% W146.2 trillion 56.8% 7.1%
Total W226.6 trillion 100% W251.6 trillion 100% 11.0%
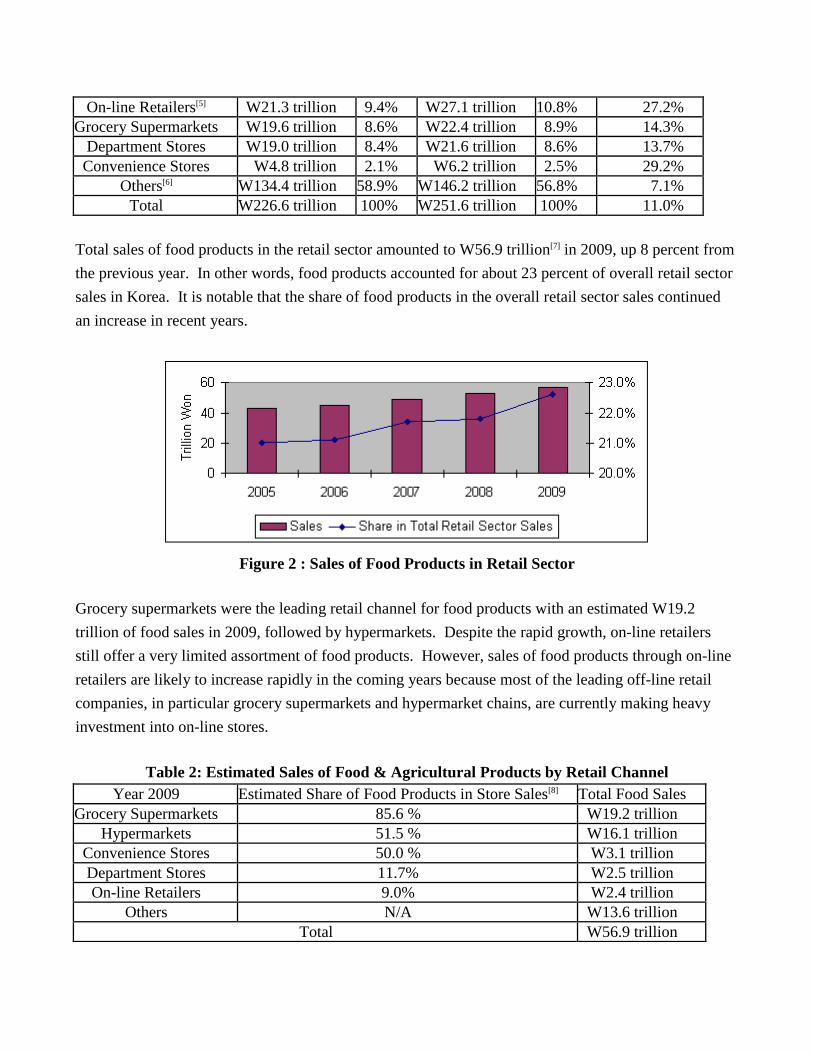
Total sales of food products in the retail sector amounted to W56.9 trillion[7] in 2009, up 8 percent from
the previous year. In other words, food products accounted for about 23 percent of overall retail sector
sales in Korea. It is notable that the share of food products in the overall retail sector sales continued
an increase in recent years.
Figure 2 : Sales of Food Products in Retail Sector
Grocery supermarkets were the leading retail channel for food products with an estimated W19.2
trillion of food sales in 2009, followed by hypermarkets. Despite the rapid growth, on-line retailers
still offer a very limited assortment of food products. However, sales of food products through on-line
retailers are likely to increase rapidly in the coming years because most of the leading off-line retail
companies, in particular grocery supermarkets and hypermarket chains, are currently making heavy
investment into on-line stores.
Table 2: Estimated Sales of Food & Agricultural Products by Retail Channel
Year 2009 Estimated Share of Food Products in Store Sales[8] Total Food Sales
Grocery Supermarkets 85.6 % W19.2 trillion
Hypermarkets 51.5 % W16.1 trillion
Convenience Stores 50.0 % W3.1 trillion
Department Stores 11.7% W2.5 trillion
On-line Retailers 9.0% W2.4 trillion
Others N/A W13.6 trillion
Total W56.9 trillion
Page 6
Rapid expansion of modern format, large-scale retailers has heightened the competition in the sector,
resulting in mergers and acquisitions (M&A) not only of small, regional retailers by larger national
retailers but also consolidations among large retailers. For example, Lotte Shopping Co. acquired 14
hypermarkets and 3 department stores from GS Mart in 2009. Lotte Shopping Co. also acquired Buy
The Way in 2009, a national convenience store chain that operated 1,231 outlets. Industry analysts
forecast that consolidation trend will continue in the industry as leading players strive to achieve
dominant control of the market. Part of the force behind consolidation trend is leading players‟
strategy to achieve a 'horizontally integrated' retail force that encompasses the whole spectrum of retail
business. For example, both Shinsegae Co. and Lotte Shopping Co., the top two retail conglomerates
in Korea, now operate almost all available formats of retail business from convenience stores to
grocery supermarkets, department stores, outlet malls, hypermarkets, and on-line shopping
businesses. Expanding into foreign markets has been another area that leading Korea retailers have
also invested heavily in recent years in an effort to find new growth opportunity. For example, Lotte
Mart, which currently operates 88 hypermarket stores in Korea, has increased its stores in foreign
markets to 105 as of January 2011, including 81 in China.
Korean retailers in general rely heavily on independent importers for imported food and agricultural
products. Although leading players are currently seeking ways to increase direct importing for lower
cost and improved product assortment, their attention is mainly targeted on a limited number of large
volume products such as fresh oranges and walnut because of lack of experience and expertise. On the
other hand, retailers of international origin, Costco Wholesale Korea in particular, procure a larger part
of the imported products that they sell directly through their international sourcing networks. Leading
retailers maintain heavy efforts to expand private label brand (PB) business on both local and imported
food and agricultural products for higher profit and customer loyalty.
Growth of modern retail business in Korea has coincided with development of modern large-scale
logistics service industry. Leading retailers are equipped with temperature controlled distribution
network of trucks and warehouses that cover the entire market. On the other hand, small to medium
size retailers in general rely on third party logistics service providers. Logistics service industry is
likely to continue a rapid growth in the coming years particularly due to rapid rise in demand for home
delivery service, which is now widely offered not only by on-line retailers but also by conventional
retail stores.
B. Consumer Food Trends
Each Korean household spent on average W306,610 or 14.2 percent of its total monthly expenditure on
Page 7
grocery food purchase in 2009. Compared to 2007, spending on processed grains, bakery products,
meat, dairy products, confectioneries, and coffee/tea showed a significant increase. On the other hand,
spending on grains, fresh seafood, and vegetables showed a noticeable decline.
Table 3: Breakdown of Monthly Household Expenditure on Grocery Foods[9]
Year 2007 2009
Number of Household Members 3.27 3.34
Item Amount Share Amount Share
Grains W23,434 8.2% W21,971 7.2%
Processed Grains W11,875 4.2% W14,774 4.8%
Bakery & Rice Cakes W14,361 5.0% W18,019 5.9%
Meat W37,859 13.3% W43,938 14.3%
Processed Meat W7,250 2.5% W7,922 2.6%
Fresh Seafood W21,905 7.7% W21,542 7.0%
Salted Seafood W6,371 2.2% W6,432 2.1%
Other Processed Seafood W5,433 1.9% W6,104 2.0%
Dairy & Eggs W23,267 8.2% W28,651 9.3%
Oils & Fats W2,277 0.8% W2,810 0.9%
Fresh & Processed Fruits W33,378 11.7% W35,377 11.5%
Fresh & Processed Vegetables W33,387 11.7% W31,310 10.2%
Fresh & Processed Seaweeds W6,441 2.3% W3,885 1.3%
Confectioneries & Snacks W16,496 5.8% W19,891 6.5%
Spices & Seasonings W10,300 3.6% W11,024 3.6%
Other Processed Foods W8,584 3.0% W8,676 2.8%
Coffee & Tea W5,174 1.8% W6,109 2.0%
Juice & Beverages W9,776 3.4% W9,828 3.2%
Alcohol Beverages W7,342 2.6% W8,347 2.7%
Total W284,910 100% W306,610 100%
Like consumers everywhere, Korean consumers are looking for better value, convenience, new tastes,
and healthier products in their trips to the grocery stores.
Due in part to the aging population, there is a heavy emphasis among the general public on healthy
eating. Organic and functional foods, among many others, are gaining popularity among health-
conscious elderly consumers and young professionals. In particular, 'Well-being', a theme that has
evoked new consumer movement of seeking both physical and psychological health by adopting more
wholesome approaches in every aspect of lifestyle, remains one of the most influential ideas in the
market. As an old Korean proverb says, "food and medicine are from the same source", Korean's long-
held belief in health-improving efficacy of foods still prevails and contributes to the on-going trend of
seeking functional effects in almost every food they encounter in the market. As a result, sales of
Page 8
functional foods as well as regular foods that target specific health concerns remain
strong. Glucosamine, chlorella, vitamins, anti-oxidants, lactic bacteria, antlers, pollen, green tea, fish
oil, ginseng and other Asian herbs are some of the popular functional ingredients heavily marketed in
Korea.
Table 4: Aging Korean Population (unit: 1,000 people)
Age Group 1995 2000 2010 (Estimate)
Growth Number[10] Share Number Share Number Share
0-14 10,236 23.0 % 9,639 21.0 % 7,907 16.2% -22.7 %
15-64 31,678 71.1 % 32,973 71.7 % 35,611 72.9% 12.4 %
65 + 2,640 5.9 % 3,372 7.3 % 5,357 11.0% 102.9 %
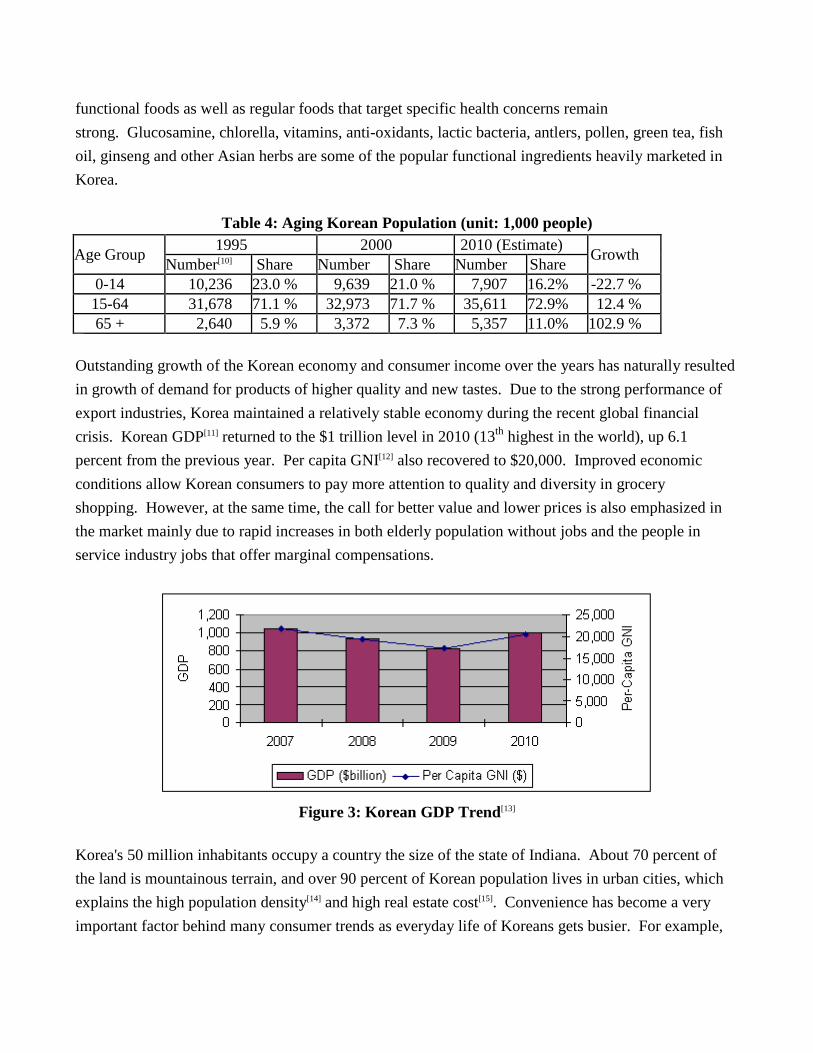
Outstanding growth of the Korean economy and consumer income over the years has naturally resulted
in growth of demand for products of higher quality and new tastes. Due to the strong performance of
export industries, Korea maintained a relatively stable economy during the recent global financial
crisis. Korean GDP[11] returned to the $1 trillion level in 2010 (13th
highest in the world), up 6.1
percent from the previous year. Per capita GNI[12] also recovered to $20,000. Improved economic
conditions allow Korean consumers to pay more attention to quality and diversity in grocery
shopping. However, at the same time, the call for better value and lower prices is also emphasized in
the market mainly due to rapid increases in both elderly population without jobs and the people in
service industry jobs that offer marginal compensations.
Figure 3: Korean GDP Trend[13]
Korea's 50 million inhabitants occupy a country the size of the state of Indiana. About 70 percent of
the land is mountainous terrain, and over 90 percent of Korean population lives in urban cities, which
explains the high population density[14] and high real estate cost[15]. Convenience has become a very
important factor behind many consumer trends as everyday life of Koreans gets busier. For example,
Page 9
increase of dual-income families and single parent households have led to a growing demand for Home
Meal Replacement (HMR) products in retail stores. Large-scale retailers have actively responded by
introducing in-store fast food/deli outlets, prepared food sections, and more microwavable processed
foods. Delivery service is extremely well developed in Korea as people do not want to waste time on
the traffic-jammed roads. Rapid growth of on-line shopping is also rooted partly in the demand for
convenience (of course, high real estate cost is another factor that drives stores to go into „cyber
space‟).
C. Food Imports
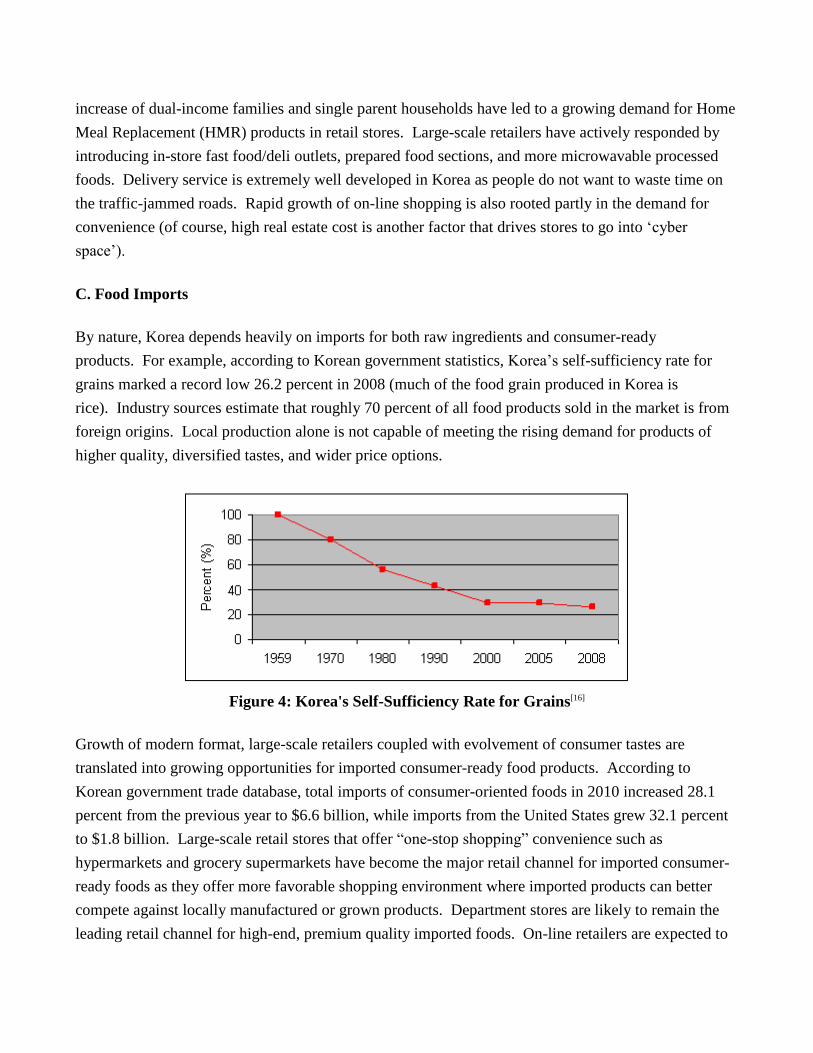
By nature, Korea depends heavily on imports for both raw ingredients and consumer-ready
products. For example, according to Korean government statistics, Korea‟s self-sufficiency rate for
grains marked a record low 26.2 percent in 2008 (much of the food grain produced in Korea is
rice). Industry sources estimate that roughly 70 percent of all food products sold in the market is from
foreign origins. Local production alone is not capable of meeting the rising demand for products of
higher quality, diversified tastes, and wider price options.
Figure 4: Korea's Self-Sufficiency Rate for Grains[16]
Growth of modern format, large-scale retailers coupled with evolvement of consumer tastes are
translated into growing opportunities for imported consumer-ready food products. According to
Korean government trade database, total imports of consumer-oriented foods in 2010 increased 28.1
percent from the previous year to $6.6 billion, while imports from the United States grew 32.1 percent
to $1.8 billion. Large-scale retail stores that offer “one-stop shopping” convenience such as
hypermarkets and grocery supermarkets have become the major retail channel for imported consumer-
ready foods as they offer more favorable shopping environment where imported products can better
compete against locally manufactured or grown products. Department stores are likely to remain the
leading retail channel for high-end, premium quality imported foods. On-line retailers are expected to
Page 10
play a bigger role in distributing imported consumer-ready foods. In particular, on-line retailing should
be an efficient sales channel for specialty imported products that has limited but diversified demand
such as processed vegan foods.
Table 5: Korean Imports of Agricultural, Forestry, and Fishery Products
(Year 2010, CIF value)[17]
Category From the World Total From the U.S.
Value Growth Value Growth
Basic Commodity $5.1 Billion 13.5% $2.7 Billion 29.9%
Intermediary $6.8 Billion 22.8% $1.3 Billion 47.3%
Consumer-Oriented $6.6 Billion 28.1% $1.8 Billion 32.1%
Forestry $2.2 Billion 15.8% $0.2 Billion 2.6%
Fishery $3.1 Billion 18.7% $0.1 Billion -0.3%
Total $23.8 Billion 20.9% $6.1 Billion 31.9%
The outlook for U.S. food exports to the Korean retail sector is excellent for beef[18] , pork, poultry,
seafood, processed vegetables, fresh and processed fruits, nuts, dairies, juices, alcohol beverages,
condiments and sauces, processed organic foods, coffee, bakery goods, snacks, and confectioneries. In
addition, on-going trade liberalization will create new opportunities for those products that are
currently under restrictive import barriers in the form of high tariffs and volume quotas. In particular,
Korea-United States Free Trade Agreement will generate significant new export opportunities for U.S.
products once the agreement is ratified.
Table 6: Advantages and Challenges Facing U.S. Products in Korea
Advantages Challenges
Korea is an emerging market where new ideas
and trends are eagerly tried and accepted, leading
to greater opportunities for new-to-market
products. Consumers are looking for new and
international tastes as the income level continues
to rise.
Consumers are generally biased toward locally
produced products. Many consumers still
maintain a negative view on the quality and
safety of imported foods. Imported foods are
often associated with contaminations and
potential food-born diseases. In addition, food
safety issues are increasingly becoming means
to restrict imports.
Page 11
Korea, by nature, depends heavily on imports for
its food and agricultural needs. On-going
elimination of import barriers will improve
market accessibility and price competitiveness of
imported products. In particular, Korea-United
States Free Trade Agreement will generate
significant new export opportunities for U.S.
products once the agreement is ratified.
Imports of many products still face restrictive
trade barriers, including high tariffs, volume
quotas, and food safety/labeling
regulations. Certain food additives approved
for use in the United States may not be
approved in Korea. Korean government makes
frequent changes into its food safety/labeling
standards, which adds extra cost and burden to
the suppliers.
A series of public food safety scandals associated
with imported products from China in recent
years has led the general public and traders to be
more concerned about the quality of imported
product that they buy. Traders are likely to
switch procurement sources to developed
countries, including the United States, in an
effort to regain consumer confidence.
Local retailers in general lack experience and
expertise on international sourcing. As a result,
the flow of imported products to the retailer is
often participated by multiple layers of
middlemen, which adds cost and inefficiency to
the supply chain. Retailers are reluctant to carry
imported products of short shelf life.
Growth of the retail sector is led by modern
format, large-scale retail businesses, which offer
better environment for imported products to
compete against locally grown or manufactured
products. Large-scale retailers are actively
seeking ways to increase the assortment of
imported products.
Korea maintains a strong food processing
industry, which presents tough competition to
imported consumer-ready products. High
markups due to inefficient supply chain coupled
with import tariffs deteriorate price
competitiveness of many imported products
against locally processed products.
Due to the long history of economic and political
tie between Korea and the United States, Korean
consumers are more familiar with American
products and food trends. Consumers maintain a
positive view on the quality and value of
American products. English is the most popular
foreign language in Korea, and many Koreans
can read English.
Consumers maintain negative perceptions about
GMO products. Retailers fear reprisal from
anti-GMO activists and, consequently, refuse to
stock any product that would have to be labeled
"Contains GMO". Many U.S. products would
be required to have "Contains GMO" labeling
under Korean regulations.
II. Road Map for Market Entry
A. Modern Retail Businesses - Hypermarkets, Grocery Supermarkets, Convenience Stores,
Department Stores, On-line Retailers, Franchise Specialty Grocery Retailers
A-1. Entry Strategy
Establishing Korean Partner:
There are many variables involved and no single best way for a successful entry into the Korean
market. Success is unlikely, however, without catered support of local partners. Korea has well
Page 12
established regulations and procedures on food imports, as well as complex tariff and tax codes, which
often make the entry of new-to-market product a time and resource consuming process. Working with
reputable importers is the approach that has been proven most efficient to overcome these
challenges. Established importers are well aware of market demand/supply intelligence, local business
laws and practices, supply chain, and most of all are the best information source for up-to-date
government regulations on imported foods.
The type of business relationship agreed between the U.S. exporter and the Korean importer may vary
from joint investment partnership to exclusive agent to non-binding broker contract mainly depending
on how the exporter sees the role of the import partner in market development. The most common
practice is maintaining a non-binding seller-buyer relationship during the test-market period and then
upgrading to a more binding option if the partner shows bigger potential.
The Korean government maintains strict regulations on food imports and requires various
certificates/documents as well as product information before approving importation of a new-to-market
product. Therefore, the exporter must work closely with the importer and provide necessary
documents and information to meet the regulations. More detailed information on the Korean food
safety and labeling regulations can be found in the FAS report #KS9039, (FAIRS Country Report,
Seoul, August 17, 2009, www.fas.usda.gov).
The Agricultural Trade Office (ATO) in Seoul maintains listings of established Korean importers by
products, which are available at no cost to U.S. exporters upon request. ATO Seoul also feeds trade
lead (purchase intention) inquiries collected from Korean importers to State Regional Trade Groups
(SRTGs), which are disseminated to U.S. exporters through the network of the state departments of
agriculture and trade promotion agencies. ATO Seoul regularly organizes Korean buyer missions in
cooperation with SRTGs and USDA cooperators to major food trade shows in the United States, such
as the Boston Seafood Show and the National Restaurant Association Show/American Food Fair, for
matchmaking with U.S. exporters.
Exhibiting in local Korean food trade shows can be a cost-effective way to meet with a large number of
key Korean importers/traders over a short period of time. Currently, the Seoul Food & Hotel (SFH)[19]
is the only show in Korea endorsed and supported by the U.S. Department of Agriculture/Foreign
Agricultural Service (FAS). Exporters who are considering exhibiting at any Korean show may contact
ATO Seoul for guidance and information because most local shows are consumer-oriented and are not
particularly effective for promoting new-to-market products.
Brokers or export middlemen based in the United States may get involved in the entry of a new-to-
Page 13
market product into Korea especially when the original American supplier (manufacturer or producer)
is not interested in direct export business or when the volume of business is small. Although Korean
importers in general prefer to work directly with the original supplier, using experienced brokers or
middlemen can be an efficient way to find right trading partner in Korea.
New-to-market U.S. exporters should pay attention to protecting the company/product trademark and
patents, which can be easily handled by working with the Korean partner or through local
attorneys. For more information, see the Korea Industrial Property Rights Information Service website
(http://eng.kipris.or.kr).
Meeting Local Tastes:
One of the mistakes that new-to-market American suppliers often make is viewing Koreans as the same
category of consumers in the neighboring countries, Japan and China. Although it is true that people in
these three far eastern Asian countries share some parts of their histories and cultures, Koreans‟ tastes
for foods are different in many ways from their neighbors. Consequently, products that are catered to
the taste of Korean consumers will have higher chance of making a successful entry into
Korea. Personal visits to Korea should be the best way to develop understanding about the local
taste. Information gathering through Internet or associating with Korean Americans could also be an
efficient tool. One noticeable observation is that Korea has followed Japan for the last 30 years when it
comes to adopting new western style dietary culture. A new western-themed food trend taking place in
Japan today is likely to repeat in Korea down the road. However, the time gap between the two
countries is getting narrower. In addition, Korean consumers are now also monitoring a number of
reference markets, including European countries and the United States, for new product ideas and
trends.
Meeting local tastes could mean anything from modifying packaging material and design to reducing
packaging size to reformulating the recipes. Package design, in particular, is a very important factor in
Korea, and exporters should consider developing a new design that can better attract Korean
consumers. Although many Koreans can read English, adding Korean language on the label can
significantly improve the level of exposure on the shelf. Another noteworthy issue in packaging is the
separate Korean language label required on imported products. This added stick-on label can detract
from the appearance of the product. Exporters should discuss the design of the Korean language label
with the importer for better look. Korean language labels are in general designed and printed by the
importer and hand-attached to the products in the duty free warehouse at the port of entry before the
customs inspection.
New-to-market suppliers should also have a thorough plan for promotional activities and
Page 14
advertisements to develop consumer awareness. Korean retailers in general require in-store promotions
at the cost of the supplier when accepting new products. Some of the most widely offered programs
include in-store advertisements, free sampling events, and point of purchase (POP) sales promotions
such as sweepstakes and coupons.
A-2. Market Structure and Product Flow
Korean retailers in general rely largely on independent importers for imported food products. Although
leading retailers are currently putting increased efforts to expand direct imports, their attention is
focused on a limited number of large volume products. Purchasing managers in local retail companies
tend to be risk averse, and few have the expertise and experience needed to carry out direct
international sourcing.
Participation of independent importers and distributor middlemen in the supply chain is part of the
reason behind high consumer price of many imported products in Korea. The independent importers
are required to bear greater amount of the risk than the retailers when placing a new product on the
shelf, which encourages the importers to add high markup on new products to cover potential loss. In
contrast, products brought in directly by retailers can be sold at much lower price due to less
distribution cost and markup. In addition, scale of economy under direct importing by the retailer
allows the foreign supplier to eliminate the potential service of export middlemen, which further
reduces the product cost and helps the retailer exert more aggressive promotional push on the product.
It takes at least two weeks for a container ship from a western American port, and four weeks from an
eastern port, to arrive in a port in Korea. In general, most imported consumer ready products enter the
country through the port of Busan, the second largest city in Korea at the southeastern tip of the
peninsula. Port of Inchon, which is much closer to the Seoul metropolitan market, is another important
entry point. In rare occasions, small-volume-high-value products, such as premium wine and chilled
beef, are brought via air cargos through Inchon International Airport (ICN).
The amount of time that the product sits in the port of entry for food safety inspection and Customs
clearance process varies from one day to a few weeks largely depending on the kind of inspection the
product is subject to. The detailed laboratory inspection that all new-to-market products and randomly
selected returning[20] products are subject to may take as long as ten working days. In case of live
animals, the quarantine sanitary inspection can take more than a couple of months. The documentary
inspection, which is allowed on products with previous import records, may be completed within a day
or two.
Page 15
Figure 5: Flow of Imported Products to Retail Sector
Once the products are cleared from the customs office, they are transported to the importer‟s warehouse
for storage. Importers may have warehouses in more than one location. The importer usually supplies
directly to the large-scale retailer‟s warehouse but may use wholesalers or brokers when supplying to
small retailers or to regional markets. Large-scale retailers in general operate a network of
"distribution-hubs" across the country, each of which services all the stores in a given province or
regional market. Most importers are using third party logistics service providers for warehousing and
trucking because of the high overhead cost.
The city of Seoul (capital city of Korea) and its surrounding area within 60 miles radius account for
over 50 percent of the Korean population and 70 percent of total retail sales in Korea. Although the
government maintains a strong policy initiative to develop other parts of the country for balanced
growth, Seoul metropolitan area is expected to take bigger share of the retail market sales in Korea in
the coming years because it continues to draw people with more job and education
opportunities. Other markets that are likely to see strong growth of retail industry include Busan,
Inchon, and Daejun (this city, located in the middle section of the peninsula, has been designated as the
new home of the Korean government offices).
A-3. Sub-Sector Company Profiles
A-3-1. Hypermarkets
The sales of hypermarkets amounted to W31.3 trillion in 2009, up 3.9 percent from the previous
year. Total number of hypermarket stores reached 409 at the end of 2009 with opening of 17 new
stores through the year. Although hypermarkets are likely to remain the leading retail channel in Korea
for many years to come, it is notable that the growth of the segment is expected to further slow down
because there remains less room in the market for new stores.
Page 16
Figure 6: Sales of Hypermarket Segment[21]
As a result, leading players are actively pursuing consolidation opportunities. For example, Lotte Mart
acquired the hypermarket division (14 stores) of GS Mart in 2009. Samsung Tesco acquired 31
hypermarket stores from E. Land Retail in 2008. Leading players are also investing heavily into
foreign markets. Lotte Mart acquired Macro‟s (a Holland retailer) entire China business (total 8 stores)
in 2008. The number of stores that Lotte Mart operates in foreign countries (104) was larger than what
it operated in Korea (88) at the end of year 2010. The growth of the segment has been mainly driven
by the top three players as evidenced by the fact that the top three players accounted for 15 out of the
17 new stores opened in the segment in 2009. The top three chains took 80 percent of total
hypermarket segment sales in 2009, up 7 percent point from two years ago.
Hypermarkets, just like all other off-line retailers, are facing strong competition from on-line
retailers. To maintain its position in the market as price leader, hypermarkets have returned to Every
Day Low Price (EDLP) strategy in 2009. To draw consumer attention back from the on-line retailers,
leading players have staged a series of marketing campaigns through 2009 and 2010, in which they
engaged in “price wars” on selected key consumer products such as pork belly cut meat and instant
noodles. All major hypermarket chains have also launched on-line stores in recent years to join the
rapid expansion of on-line market.
One of the areas that leading players are making heavy efforts is direct import business, a tool to
improve competitiveness in price and product assortment. Furthermore, the capacity of international
sourcing is deemed as a core competence required to leading players who are now operating stores in
foreign markets where they face direct competition against leading international retail companies such
as Wal-Mart.
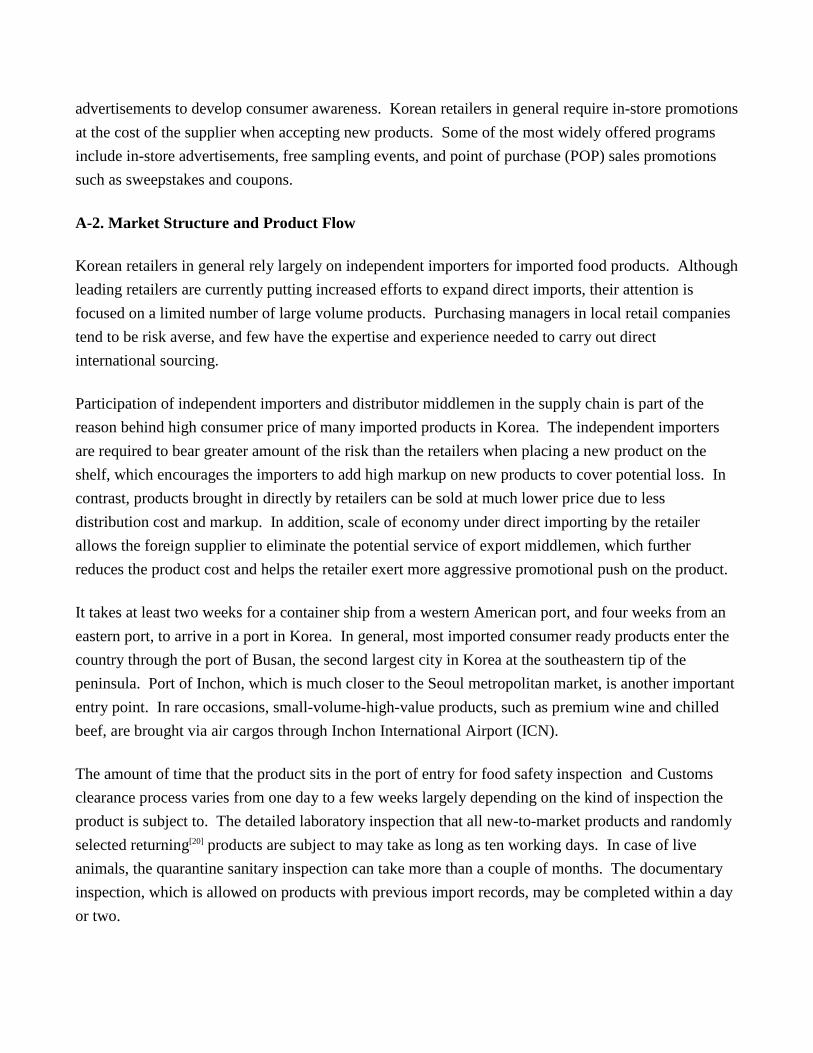
Table 7: Description of a Typical Hypermarket Store in Korea (2009)[22]
Daily Sales W230 million
Page 17
Share of Food & Agricultural Products in Total
Sales
Fresh Agricultural Products: 10.9% Livestock Products: 5.8% Seafood: 3.5% Processed Foods: 20.4% Dairy & In-store Prepared Foods: 13.1%
Size of Store 39,427 square meter
Number of Employees 88 full-timers, 79 part-timers
Number of Items in Inventory 50,000 - 100,000 SKUs (stock keeping
units)
Number of Daily Customers 6,290
Per Customer Purchase Amount W38,614
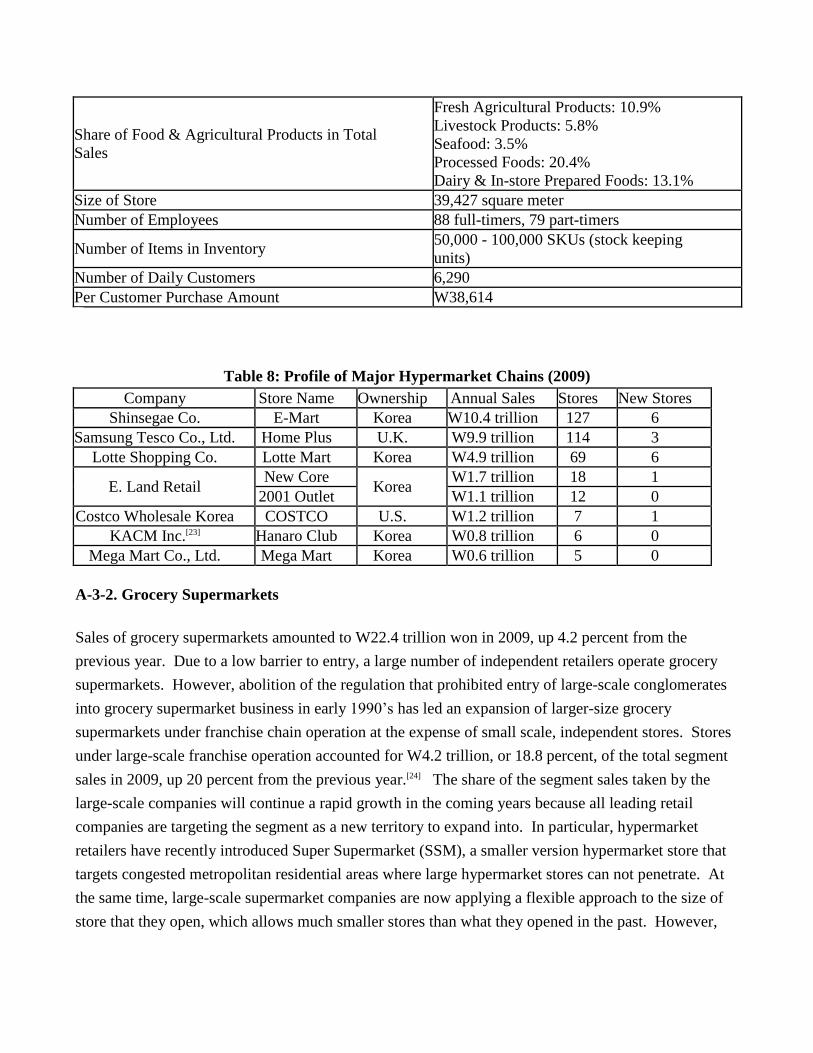
Table 8: Profile of Major Hypermarket Chains (2009)
Company Store Name Ownership Annual Sales Stores New Stores
Shinsegae Co. E-Mart Korea W10.4 trillion 127 6
Samsung Tesco Co., Ltd. Home Plus U.K. W9.9 trillion 114 3
Lotte Shopping Co. Lotte Mart Korea W4.9 trillion 69 6
E. Land Retail New Core
Korea W1.7 trillion 18 1
2001 Outlet W1.1 trillion 12 0
Costco Wholesale Korea COSTCO U.S. W1.2 trillion 7 1
KACM Inc.[23] Hanaro Club Korea W0.8 trillion 6 0
Mega Mart Co., Ltd. Mega Mart Korea W0.6 trillion 5 0
A-3-2. Grocery Supermarkets
Sales of grocery supermarkets amounted to W22.4 trillion won in 2009, up 4.2 percent from the
previous year. Due to a low barrier to entry, a large number of independent retailers operate grocery
supermarkets. However, abolition of the regulation that prohibited entry of large-scale conglomerates
into grocery supermarket business in early 1990‟s has led an expansion of larger-size grocery
supermarkets under franchise chain operation at the expense of small scale, independent stores. Stores
under large-scale franchise operation accounted for W4.2 trillion, or 18.8 percent, of the total segment
sales in 2009, up 20 percent from the previous year.[24] The share of the segment sales taken by the
large-scale companies will continue a rapid growth in the coming years because all leading retail
companies are targeting the segment as a new territory to expand into. In particular, hypermarket
retailers have recently introduced Super Supermarket (SSM), a smaller version hypermarket store that
targets congested metropolitan residential areas where large hypermarket stores can not penetrate. At
the same time, large-scale supermarket companies are now applying a flexible approach to the size of
store that they open, which allows much smaller stores than what they opened in the past. However,
Page 18
large-scale retailers‟ expansion into the grocery supermarket segment has met a strong opposition by
the small, independent retailers and NGO consumer groups. The government introduced a regulation
in January 2011 that prohibits opening of new stores by large-scale retailers within 500 meters from
designated “traditional market zones” in support of the small-scale retailers. But market analysts in
general forecast that the zoning regulation will only affect a small portion of the total retail market in
Korea.
Some of the leading trends in the grocery supermarket segment include improvement in product
assortment (Home Meal Replacement products, fresh products, portion-packaged products, and private-
label products), efficient promotion (on-line coupons, membership programs), and customer service
(internet shopping, home delivery, in-store service outlets such as pharmacy, laundry shop, and post
office).
Table 9: Description of a Typical Grocery Supermarket in Korea (2009)
Daily Sales W20 million
Share of Food & Agricultural Products in Total Sales
Fresh Agricultural Products: 22.2% Livestock Products: 10.4% Seafood: 5.8% Dairy & Processed Foods: 38.4% Home Meal Replacement Foods: 4.5%
Size of Store 950 square meters
Number of Employees 10 full-timers, 20 part-timers
Number of Items in Inventory 5,000 - 25,000 SKU
Number of Consumers Daily 1,500
Per Consumer Purchase Amount W16,000
Table 10: Profile of Major Supermarket Chains (2009)
Company Name Store Name Annual Sales Total Stores New Stores
Lotte Shopping Co. Lotte Super W1.1 trillion 190 70
GS Retail Co., Ltd. GS Supermarket W1.0 trillion 138 23
Seowon Utong Co., Ltd. Top Mart W800 billion 70 14
Samsung Tesco Co., Ltd. HomePlus Express W580 billion 168 58
CS Utong Co., Ltd. Goodmorning Mart W290 billion 28 2
E. Land Retail Co., Ltd. Kims Mart W259 billion 43 6
A-3-3. Convenience Stores
Total number of convenience stores in Korea reached 14,130 at the end of 2009 with opening of a
record high 2,505 new stores. Total sales of the segment amounted to W6.2 trillion, up 12.6 percent
Page 19
from the previous year. Convenience stores are likely to further thrive in metropolitan areas where
office workers and young consumers with busy lifestyle demand an easy shopping channel for small
food purchases. Rapid increase in the number of single household and duel-income families is also
contributing to the increased traffic to the segment. In addition, due to the low entry barrier,
convenience store remains one of the most popular retirement businesses for people who depart from
their corporate jobs.
Figure 7: Number of Convenience Stores
The top two players in the segment, Family Mart and GS25, continued an aggressive expansion in
2009, as evidenced by the fact that the two companies accounted for 61 percent of the new stores added
to the segment. Seven Eleven, the third largest player in the segment, drastically narrowed the gap to
the leading players by acquiring Buy The Way chain (1,501 stores) in 2010. All the players are
striving to benefit from economies of scale, and consequently competition and consolidation pressure
are expected to remain high in the segment.
Introduction of more home meal replacement (HMR) products and private label brand (PB) products
have been heavily emphasized in the segment in recent years for higher profit and customer
loyalty. Another area of emphasis has been offering more service products, including postal service,
quick delivery, banking, and photo processing, to increase consumer traffic to the stores. It is notable
that convenience stores maintain a very aggressive product assortment policy in that new products are
eagerly tried while under-performing products are quickly dropped, a strategy to keep abreast with the
fast changing consumption trends of its target consumers. Among the 3,265 products sold in
convenience stores as of year end 2007, 1,346 products, or 41 percent, were something newly
introduced during the year.
Table 11: Description of a Typical Convenience Store in Korea (2009)
Daily Sales W1.5 million
Page 20
Share of Food & Agricultural Products in Total Sales
Beverages: 10.4% Liquors: 8.0% Snacks: 6.6% Daily Delivery Fresh & Chilled Foods: 9.8% Dry Processed Foods: 9.5% Fast Foods: 4.7% Tobacco: 40.7%
Size of Store 66 square meters
Number of Employees 2 Full-timers, 4 Part-timers
Number of Items in Inventory 4,000 SKU
Number of Consumers Daily 429
Per Consumer Purchase Amount W3,486
Table 12: Profile of Major Convenience Store Chains (2009)
Company Name Store Name Annual Sales Total Stores New Stores
Bokwang Familymart Co., Ltd. Familymart W2.0 trillion 4,684 809
GS Retail Co., Ltd. GS25 W3.7 trillion 3,915 679
Korea Seven Co., Ltd. Seven Eleven W659 billion 2,186 376
Buy The Way, Inc. Buy The Way W705 billion 1,501 355
Ministop Korea Co., Ltd. Ministop W520 billion 1,201 194
A-3-4. Department Stores
Despite the rapid expansion of hypermarkets and on-line retailers, department stores remain the leading
retail channel for premium quality consumer goods, including imported foods. Total sales of
department store segment amounted to W21.6 trillion in 2009, up 9 percent from the previous year. It
is notable that the segment made a record high annual sales growth even during the global economic
crisis. Leading players in the segment have made heavy investments into business restructuring
projects, including renovations of old stores and taking more up-scale store layout, during the last
several years as part of their strategic move to strengthen their market position as luxury goods
retailer. To better attract their target consumers, high income families and young professionals, leading
players have significantly expanded the space allocated to luxury brand shops and specialty products.
Page 21
Figure 8: Sales of Department Store Segment
Food and agricultural products still account for a significant part of sales in department stores in
Korea. The share of department store sales taken by food and agricultural products has been on a
decline over the years because the stores intended to expand non-food sections for higher sales volume
and profits. However, department stores are once again paying increased attention to food business
with a realization that food is a key vehicle to draw consumer traffic, which is evidenced by a
significant rise of the share of food products in department store sales in 2009.
Figure 9: Share of Food & Agricultural Products in Department Store Sales
Currently, there is a heavy emphasis in the segment to offer more specialty food products such as
functional nutritional supplements, organic foods, and premium specialty fruits. In addition,
department stores are paying additional attention to the food court section to offer wider variety of
premium quality home meal replacement products, targeting busy housewives and office workers.
The grocery section in the department store, including the food court, is in general operated by a
collection of individual food retail tenants who pay the store pre-agreed percentage of the monthly
sales as rent, on top of a sizable amount of key money paid upon contract. While sales and
promotional activity of the tenant retail outlet is closely monitored and regulated by the store, each
Page 22
tenant is responsible for its own operation, including product supply and labor management. The
department store usually reserves the right to extend or terminate the contract every two to four years
based on the sales performance.
Table 13: Description of a Typical Department Store in Korea (2009)
Daily Sales W1 billion won
Share of Foods in Total Sales 10 - 14% (including the food court sales)
Size of Store 30,636 square meter
Number of Employees 251 full-timers, 66 part-timers, 842 sales promoters paid by
suppliers (2005)
Number of Products in
Inventory 220,000 SKU (2005)
Number of Consumers Daily 98,879 (number of purchases)
Per Consumer Purchase
Amount W67,000
Table 14: Profile of Major Department Store Chains (2009)
Company Name Store Name Annual Sales Stores New Stores
Lotte Shopping Co. Lotte Department Store W9.2 trillion 29 0
Shinsegae Co. Shinsegae Department Store W3.6 trillion 8 0
Hyundai Dept. Co., Ltd. Hyundai Department Store W1.5 trillion 7 0
Hanwha Galleria Galleria Department Store W1.5 trillion 7 0
A-3-5 On-line Retailers
Korea has become one of the most advanced markets in the world for on-line retail industry. Changes
in consumer lifestyle, which favor more efficient shopping environment, coupled with development of
information technology have fueled a rapid growth of on-line retail business, including internet
shopping malls, internet open markets[25] , and TV home shopping over the last ten years. On-line retail
segment has stepped up to the second largest retail channel in Korea since 2005. Total sales of on-line
retail segment amounted to 27.1 trillion won in 2009, up 13.3 percent from the previous year. Internet
shopping malls, the main driving force of the segment, generated W12.3 trillion of sales, up 18.8
percent from the previous year. Internet open markets generated an estimated W9.5 trillion of
transactions, up 8 percent from the previous year. TV home shopping, another important player of the
segment, generated W4.6 trillion of sales, up 15 percent from the previous year. It is expected that on-
line segment will become the largest retail channel in Korea within the next 5 years.
Page 23
Figure 10: Sales of On-Line Retail Segment in Korea[26]
Korean government statistics indicate that 82 percent of Korean households had computer/internet
connection at home, and over 78 percent of Koreans over 3 years old were using internet on a regular
basis in 2010. The number of subscribers to high-speed internet services, which is a key infrastructure
for internet shopping industry, reached 16.9 million in 2010. Among the internet users over 12 years
old, 64.3 percent of people were also regular internet shoppers in 2010, up 7 percent point from
2007. Average internet shoppers made two purchases per month in 2010, and average monthly
spending on internet shopping was W48,600. The share of the internet shopping sales taken by food
and agricultural products marked 9.5 percent in 2009, sharply up from 4.6 percent in 2007.
Figure 11: Number of High-Speed Internet Service Subscribers
Table 15: Ratio of Internet Shoppers among Internet Users[27]
Age Group 2007 2010
12 - 19 Years Old 54.8% 70.5%
20‟s 82.2% 90.1%
30‟s 68.8% 77.4%
Page 24
40‟s 38.8% 48.0%
50‟s 25.1% 32.7%
60‟s 11.6% 17.7%
Male 51.2% 57.5%
Female 64.4% 72.3%
Total 57.3% 64.3%
Table 16: Breakdown of Internet Shoppers by Monthly Expenditure (2010)
Spending Amount Ratio
Less than W10,000 5.2%
W10,000 - W50,000 54.6%
W50,000 - W100,000 23.9%
Over W100,000 16.3%
Average Monthly Spending W48,600
It is expected that leading players of conventional retail industry will also become important players of
on-line retail segment particularly for food and agricultural products. For example, Shinsegae E-Mart,
the leading hypermarket store chain, launched its upgraded version internet store (www.emart.co.kr) in
2010. Internet grocery stores run by conventional large-scale retailers are likely to maintain
competitive edge over on-line only retailers in terms of price, size of product assortment, and efficiency
in product distribution/delivery. For example, the internet E-Mart store utilizes the same distribution
network that services all conventional E-Mart stores. Orders made through the internet store can be
picked up at any of the E-Mart stores, or can be delivered to any place (at no cost for purchases over
certain amount) within the day (for orders made by certain time of the day). While many consumers
still maintain a conservative idea and feel reluctant to buy food and agricultural products in cyber
space, on-line grocery stores run by reputable conventional grocery store chain should have better
appeal to the consumers than on-line only retailers. Housewives with young children and women with
jobs are currently the main user group of the internet grocery stores, but it is likely that this time saving
shopping tool will also be increasingly used by elderly population.
While scale of economy also remains a key component of on-line retail business, unique characteristics
of on-line business, in particular the fact that it can reach out to every target consumer in the market,
lends more room for smaller players to find niche areas to service. For example, internet stores could
be an efficient vehicle to deal with small-volume, wide-variety specialty products that conventional
retailers would not be able to handle, such as vegetarian products or imported premium pet food
products.
Another important trend that will further expand the boundary of on-line retailing is a rapid expansion
of advanced mobile internet devices such as smart phones (e.g., i-Phones) and tablet PCs (e.g., i-
Page 25
Pads). These advanced mobile devices will eventually allow Korean consumers to buy anything at
anytime at anyplace, overcoming all the physical limitations that conventional retail stores are subject
to. Social Network Services (SNS), such as Blogs, Internet Communities, and Twitters, are also
expected to have a bigger influence on the Korean retail market as more and more consumers are
adopting these on-line communication tools to exchange ideas and opinions. In particular, SNS could
be a trusted source of information when consumers are trying to make a purchase decision on new
products that they are not familiar with. In addition, more of the sales and marketing programs of
suppliers and retailers are targeted to the SNS communication channel. According to a government
statistics, 66 percent of the internet users were also SNS users in 2010.
The flow of imported food products in the on-line retail channel differs widely from conventional
distribution channel. In general, once orders are received by the on-line retailer, products from
importers (often via wholesalers) are consolidated in the designated warehouse operated by third party
logistics service company (large-scale on-line retailers may have their own consolidation warehouses)
for final delivery to consumers. Many logistics service companies that provide nationwide
warehousing and delivery service have sprouted in Korea since late 1990s along with the fast growing
on-line retail industry. Importers and wholesalers of food and agricultural products may also sell on-
line directly to consumers under separate retail licenses.
Table 17: Breakdown of Spending on Internet Shopping by Product[28]
Product Category 2007 2009
Computer Hardware 11.4% 9.9%
Computer Software 0.7% 0.6%
Electronics 22.7% 13.0%
Books 0.7% 5.0%
Audio Visual Disks 1.4% 0.7%
Tourism 1.0% 12.9%
Child & Baby Products 5.6% 6.0%
Food & Agricultural Products 4.6% 9.5% Flowers 0.4% 0.3%
Sport Leisure Goods 5.5% 4.1%
Home & Garden, Automobile 14.2% 9.5%
Clothing & Fashion 19.7% 17.1%
Cosmetics 7.9% 5.4%
Office Supplies 0.9% 1.5%
Services 3.2% 0.3%
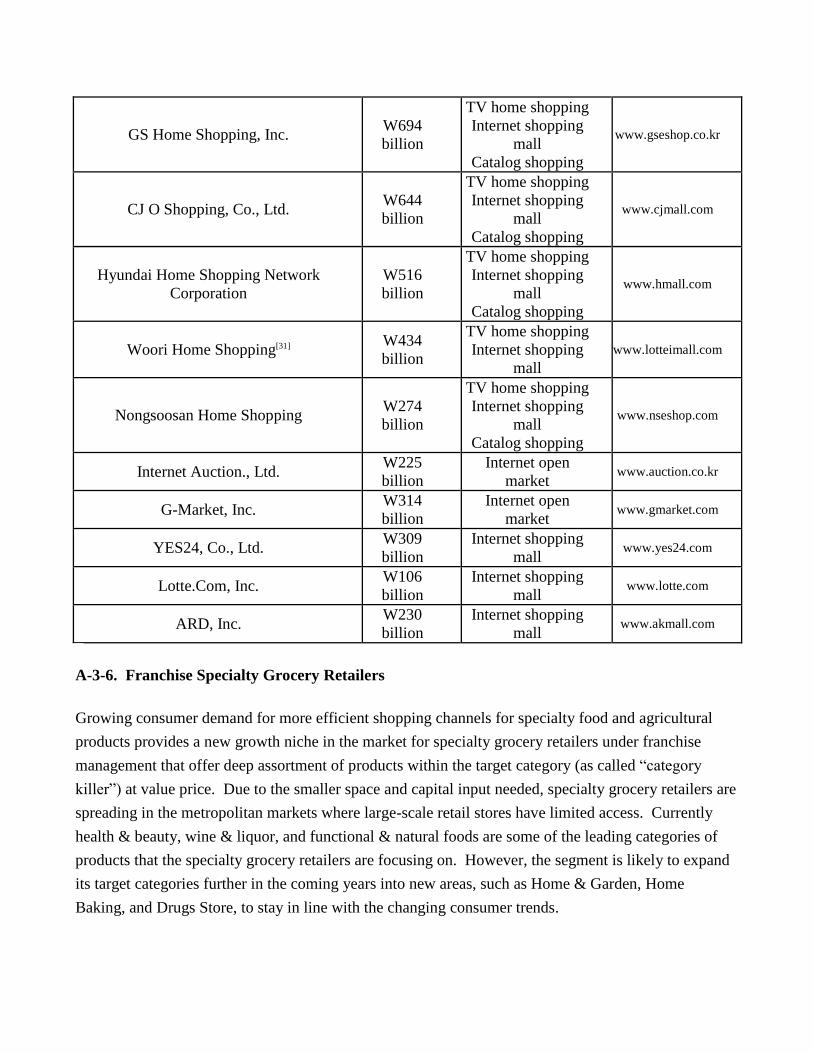
Table 18: Profile of Major On-line Retailers (2009)[29]
Retailer Name Sales[30] Business Type Internet Site
Page 26
GS Home Shopping, Inc. W694
billion
TV home shopping Internet shopping
mall Catalog shopping
www.gseshop.co.kr
CJ O Shopping, Co., Ltd. W644
billion
TV home shopping Internet shopping
mall Catalog shopping
www.cjmall.com
Hyundai Home Shopping Network
Corporation W516
billion
TV home shopping Internet shopping
mall Catalog shopping
www.hmall.com
Woori Home Shopping[31] W434
billion
TV home shopping Internet shopping
mall www.lotteimall.com
Nongsoosan Home Shopping W274
billion
TV home shopping Internet shopping
mall Catalog shopping
www.nseshop.com
Internet Auction., Ltd. W225
billion Internet open
market www.auction.co.kr
G-Market, Inc. W314
billion Internet open
market www.gmarket.com
YES24, Co., Ltd. W309
billion Internet shopping
mall www.yes24.com
Lotte.Com, Inc. W106
billion Internet shopping
mall www.lotte.com
ARD, Inc. W230
billion Internet shopping
mall www.akmall.com
A-3-6. Franchise Specialty Grocery Retailers
Growing consumer demand for more efficient shopping channels for specialty food and agricultural
products provides a new growth niche in the market for specialty grocery retailers under franchise
management that offer deep assortment of products within the target category (as called “category
killer”) at value price. Due to the smaller space and capital input needed, specialty grocery retailers are
spreading in the metropolitan markets where large-scale retail stores have limited access. Currently
health & beauty, wine & liquor, and functional & natural foods are some of the leading categories of
products that the specialty grocery retailers are focusing on. However, the segment is likely to expand
its target categories further in the coming years into new areas, such as Home & Garden, Home
Baking, and Drugs Store, to stay in line with the changing consumer trends.
Page 27
Table 19. Profile of Major Franchise Specialty Grocery Retailers (2009)[32]
Company Store Name Sales Products Stores Food
Share
CJ Oliveyoung Olive Young W100
billion Health & Beauty 70 12.6%
GS Retail Watsons W30
billion Health & Beauty 26 N/A
Hansalim Hansalim W170
billion Organic & Natural
Foods 79 Over 90%
Chorokmaeul Co.,
Ltd. Chorok
Maeul W115
billion Organic & Natural
Foods 220 Over 90%
ORGA Whole Foods ORGA W58
billion Organic & Natural
Foods 39 Over 90%
iCOOP Jayun Dream W205
billion Organic & Natural
Foods 65 Over 90%
B. Traditional Retail Businesses - Wet Markets and Mom-and-Pop Grocers
Despite the rapid expansion of the modern format large-scale retail segments, traditional retailers,
mainly regional wet markets and family-operated small grocers, remain active in old metropolitan areas
as well as in rural areas where traffic and real estate environment does not allow entry of large-scale
hypermarkets or grocery supermarkets. In addition, policy makers, under the pressure of a strong
social initiative of protecting small businesses, have introduced a series of regulations over the years
that intended to regulate expansion of large-scale retailers. For example, large-scale retailers have been
banned from operating shuttle buses provided to the shoppers since 2001. A new regulation introduced
in 2011 prohibits opening of new stores by large-scale retailers within the vicinity of designated
“traditional market zones”. However, market analysts in general agree that these policy measures
should have a limited effect only because consumers in general prefer to shop in modern retail channels
for price and convenience. The new access barrier to designated traditional market zones should also
be removed eventually due to on-going development projects targeting old metropolitan areas.
There is no official government data available that tracks the exact size of the traditional retail industry
in Korea. A government statistics indicates that there were a total of 978,000 retail stores that hired
less than five employees in 2009, which generated a total of W84 trillion of sales. Among these small
retail stores, 177,000 were food and beverage oriented retailers (total sales were W13 trillion). Another
industry data figures that there were 1,550 traditional markets in Korea at the end of 2009, which
generated a total of W23 trillion of sales. Traditional markets tend to focus on a limited assortment of
fresh products, including grains, produce, seafood, and meats, and carry less variety of processed
foods. Imported products that are distributed in significant volume through traditional markets include
Page 28
fresh fruits and vegetables, processed fruits, dried vegetables, seafood, meat, spices, cereals, and
cooking oils. Regional wholesale markets run by provincial governments serve as a key distribution
channel of fresh agricultural and fishery products to the traditional retailers. Independent wholesalers,
most of them specialized in a limited category of products, are the major distributor of processed foods
to the traditional retailers.
III. Competition
Locally grown or manufactured products present a significant competition to many American
products. Although limited in volume, Korean agriculture produces a considerable variety of raw
agricultural products, including rice, fresh vegetables (cabbage, radish, cucumber, pumpkin, onion,
potato, sweet potato, green onion, mushroom, garlic, etc.), fruits (apple, pear, tangerine orange, grape,
persimmon, water melon, strawberry, kiwi, etc.), seafood, beef, pork, chicken, eggs, and fluid milk. In
addition, Korea has a strong food processing industry that manufactures a wide variety of processed
products, including processed meat, seafood, vegetables, fruits, noodles, sauces, oils, grain flour,
beverages, snacks, confectioneries, dairies, and liquors. Domestically produced products should better
reflect the tastes and consumption trends of local consumers than imported products. Furthermore,
Korean consumers are generally biased toward locally grown and manufactured products and willingly
pay a premium on domestic products.
Table 20: Korea’s Self-Sufficiency Rate for Agricultural and Fishery Products[33]
Product 1990 2000 2007
Grains Total 43.8% 30.8% 27.9%
Rice 108.3% 102.9% 92.5%
Wheat 0.1% 0.1% 0.2%
Corn 1.9% 0.9% 0.7%
Beans 20.1% 6.8% 11.2%
Vegetables 98.9% 97.7% 90.2%
Fruits 102.5% 88.7% 83.5%
Beef 53.6% 53.2% 46.4%
Pork 100.3% 91.6% 75.8%
Chicken Meat 100% 79.9% 87.7%
Eggs 100% 100% 99.4%
Milk 92.8% 81.2% 70.8%
Fish & Clams 121.7% 132.6% 110.7%
Fat & Oil 8.0% 3.2% 1.7%
For both input ingredients for the local processing industry and consumer-oriented products for the
Page 29
retail industry that are not grown or manufactured enough in Korea, U.S. products face rising
competition from products from export oriented countries, including China, Australia, Chile, EU, and
Thailand. Many of the products from competitor countries offer either lower price or higher quality
than U.S. products and have built up significant market shares in Korea. China, for example, has
become the leading supplier of fresh and processed vegetables, seafood, sauces, and spices to
Korea. EU has become the leading supplier of premium whiskies, wine, specialty cheeses, chocolate
confectioneries, pasta, and olive oil to Korea. Increased consumer demand for more diverse
international tastes will further generate competitive pressure on American products in Korea.
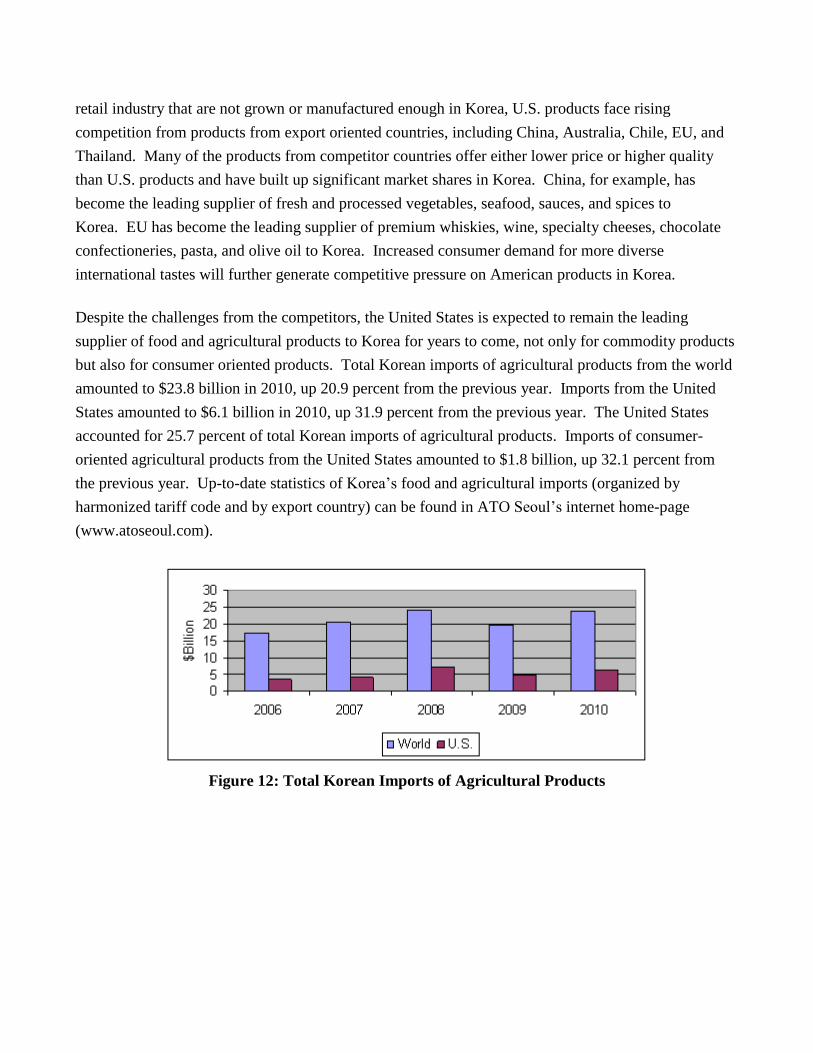
Despite the challenges from the competitors, the United States is expected to remain the leading
supplier of food and agricultural products to Korea for years to come, not only for commodity products
but also for consumer oriented products. Total Korean imports of agricultural products from the world
amounted to $23.8 billion in 2010, up 20.9 percent from the previous year. Imports from the United
States amounted to $6.1 billion in 2010, up 31.9 percent from the previous year. The United States
accounted for 25.7 percent of total Korean imports of agricultural products. Imports of consumer-
oriented agricultural products from the United States amounted to $1.8 billion, up 32.1 percent from
the previous year. Up-to-date statistics of Korea‟s food and agricultural imports (organized by
harmonized tariff code and by export country) can be found in ATO Seoul‟s internet home-page
(www.atoseoul.com).
Figure 12: Total Korean Imports of Agricultural Products
Page 30
Figure 13: Korean Agricultural Imports from the U.S. by Category
Lifting of import barriers such as high import tariff, import volume quota, and bilateral phytosanitary
agreement, directly affects competition structure in the market. Many local products can not compete
on price against imported products when protective import barriers were removed, which is expected to
happen continuously in the coming years with the progress of WTO negotiations and bi-lateral trade
agreements. For example, as a result of the implementation of the Korea-Chile Free Trade Agreement
in April 2004, Chile has become a major supplier of fresh grape, wine, and pork meat to Korea. Korea
has also concluded additional FTAs with Singapore, EFTA, and EU, and is currently engaged in
preliminary FTA talks with several other countries, including Japan and China. The Korea-United
States Free Trade Agreement (KORUS FTA), which was concluded in December 2010 and is currently
pending in the national assemblies of both countries for ratification, is expected to create new
opportunities for American suppliers. The USTR web-site details the agreed effects of KORUS FTA
by harmonized tariff code[34] :
http://www.ustr.gov/trade-agreements/free-trade-agreements/korus-fta/final-text
http://www.ustr.gov/sites/default/files/uploads/agreements/fta/korus/asset_upload_file786_12756.pdf
As tariff and volume quota barriers decline, food safety issues often arise and restrict
imports. Restriction of imports from one country due to a food safety issue results in replacement
imports from competing countries, as seen in the case of import ban held on U.S. beef during 2004 -
2007. Consequently, in an effort to maintain a stable supply, local importers in general prefer to
transact with more than two countries especially for potentially risky items, such as fresh fruits,
chicken, pork, and beef.
The change of exchange rate between the Korean won and the currency of export countries is another
important factor that affects market competition significantly. For example, the value of Korean won
maintained a steady rise against the U.S. Dollar between 2004 through 2007, making American
Page 31
products more affordable to Korean importers. However, the value of Korean won plunged against
major international currencies, including the U.S. Dollar and the Euro, between mid 2008 through mid
2009 due to the global financial crisis. This sudden change of exchange rate, coupled with wide spread
worries about the local economy in the coming year, resulted in a drastic decline in imports of
agricultural products in 2009. The value of the U.S. dollar has been once again on a decline against
other currencies, including the Korean won, since mid 2009, which makes American products more
price competitive in Korea.
Figure 14:
Change of Exchange Rate of Korean Won
IV. Best Product Prospects
A. Products Present in the Market Which Have Good Sales Potential[35]
1. Beef: Partial lifting of import restriction on U.S. beef implemented in 2008 has allowed boneless
meat and bone-in meat with no specified risk material (SRM) from cattle under 30 months of age from
preapproved packing houses to enter the Korean market. As a result, imports of U.S. beef continued a
sharp increase in 2010 to reach $395 million, up 45 percent from the previous year. Although majority
of U.S. beef imported was in frozen form, chilled beef showed a much higher import growth rate (89
percent) compared to frozen beef (40 percent), indicating rising demand for higher quality American
beef from the retail sector. Premium products such as prime grade beef or quality assured branded
products such as Angus beef should see growing sales in Korea.
2. Pork (belly cut meat): Although Korea has a large domestic supply of pork meat, local supply alone
can not satisfy the highly skewed demand on the belly cut meat. Imports of pork meat from the United
States amounted to $162 million in 2010. The nationwide outbreak of Foot and Mouth Disease (FMD)
Page 32
in Korea in late 2010 has destroyed over 3 million head of local cattle, 90 percent of which was swine,
will likely result in surging imports of pork meat through 2011.
3. Processed meats (sausages, hams): Due to easy application, Korean consumers incorporate more
processed meat products in their diet. Imports of sausages and other types of preserved meats from the
United States amounted to $28 million in 2010, up 14 percent from the previous year.
4. Poultry meats (mainly chicken): Despite the strong competition from local farms and price
competitive Thailand suppliers, Korea remains an excellent market for American chicken
products. Poultry meat imports from the United States amounted to $72 million in 2010, up 72 percent
from the previous year. Frequent outbreaks of Avian Influenza in Korea also provide American
suppliers with additional export opportunities.
5. Dairy products (mainly cheese): Cheese is becoming an important part of Koreans‟ diet. Total
cheese imports from the United States amounted to $76 million in 2010, up 102 percent from the
previous year. Korean importers are paying more attention to American suppliers as supplies from EU
and Australia face challenge for rising price and lower production.
6. Seafood: Korea is an outstanding seafood market with good growth potential for a wide variety of
imported products. The domestic supply is decreasing due to the depletion of near sea fishery
resources and increased restrictions on international deep-sea fishing. Imports from the United States
amounted to $5.6 million for live fish, $60 million for frozen fish (not fillet), $40 million for fish
fillets, $4 million for crustaceans and mollusks, and $1.6 million for preserved crustaceans in
2010. Major species currently imported from the United States include Alaska Pollack, Pollack surimi,
Pollack roes, tuna, skate, mackerel, hagfish, halibut, scallop, cod, salmon, angler fish, rock fish, lobster,
crabs, and sea cucumber.
7. Vegetables (mainly processed and frozen products): Although Korea is self-sufficient in many
varieties of fresh vegetables, seasonal fluctuations in the local supply and unfavorable growing
condition for foreign varieties are resulting in an increased demand for imports. China has emerged as
the leading supplier of vegetables to Korea in both fresh and processed category; however, there
remains a solid demand for a limited variety of high quality U.S. products. Major products imported
from the United States in 2010 include processed/preserved vegetables ($80 million), processed
tomatoes ($14 million), frozen vegetables ($2.3 million), and fresh vegetables ($10 million - mostly
potatoes and lettuce). A majority of the vegetable products imported from the United States are for
local processing in Korea. A limited amount of American fresh vegetables, including lettuce, cabbage,
potato, onion, and carrot, are sold through the retail stores especially during the months when the
Page 33
supply of local products are low.
8. Fresh fruits: Korean imports of fresh fruits from the United States amounted to $205 million in 2010,
up 56 percent from the previous year. Major American fresh fruits imported include: citrus ($140
million), grapes ($17 million), and cherries ($15 million).
9. Tree nuts: Consumption of tree nuts are increasing rapidly in Korea as consumers are well aware of
health benefits of eating tree nuts (in particular almond, walnut, and macadamia). Korea relies almost
entirely on imports for the tree nut demand. Total imports of tree nuts from the United States
amounted to $136 million in 2010, up 38 percent from the previous year.
10. Processed fruits and nuts: Processed fruits and nuts products are gaining consumer popularity due
to their natural and healthy image. Products currently imported from the United States include: dried,
frozen, or preserved prunes, cranberries, cherries, strawberries, grapes, figs, blueberries, and various
types of processed tree nuts. Imports from the United States amounted to $49 million for processed
fruits and nuts, $4.6 million for dried fruits, and $2.6 million for jams.
11. Fruit juices: Increased attention on healthy eating expands consumption of fruit juices in Korea. In
particular, more consumers are switching to higher quality products such as „Not from concentrate‟ or
„No artificial ingredient added‟ products. Korea imported a total of $45 million of fruit juices from the
United States in 2010, up 23 percent from the previous year. Major American products imported were
apple juice, grape juice, and orange juice. Much of the imported fruit juices are blended and rebottled
in Korea.
12. Coffee: As more Korea consumers are switching to espresso coffee from instant coffee, imports of
coffee beans and powder in both bulk and retail package are on a rapid increase. Imports of coffee
products from the United States amounted to $25 million in 2010, up 12 percent from the previous
year.
13. Specialty confectionery products: Consumption of imported specialty confectionery products is on
an increase. Imports of chocolate based confectionary products from the United States amounted to
$65 million in 2010, up 50 percent from the previous year. Imports of sugar based confectionery
products from the United States amounted to $11 million in 2010, up 24 percent from the previous
year.
14. Bread, cakes, pastry: Diversification and westernization of Korean diet results in increased demand
on imported bread, pastry, and cake products. Imports from the United States amounted to $38 million
Page 34
in 2010.
15. Prepared Sauces: With introduction of more diverse foreign recipes, demand for imported sauces
continues to rise. Imports from the United States amounted to $21 million in 2010, up 14 percent from
the previous year.
16. Soybean oil: Although Korea has a strong cooking oil processing industry, there is a growing
demand in the market for imported products for lower price and diversity. Imports of soybean oil from
the United States amounted to $48 million in 2010, up 64 percent from the previous year. Other
cooking oils imported from the United States include palm oil ($1.1 million) and corn oil ($8 million).
17. Alcohol Beverages: Korea is one of the largest markets in the world for alcohol beverages. Imports
from the United States amounted to $11 million for wine, $6 million for beer and $8 million for hard
liquors in 2010.
18. Flavored mineral water: More consumers are looking for higher quality alternatives for tab water
and soft drinks. As a result, imports of bottled mineral water are on a rapid increase. Imports of
flavored mineral water from the United States amounted to $22 million in 2010, up 31 percent from the
previous year.
B. Products Not Present in Significant Quantities But Which Have Good Sales Potential
1. Rice: Imports of rice is under Minimum Market Access (MMA) volume quota regulation, and
distribution of imported rice is controlled by a state trading company. Although the rice trade
agreement that Korea signed in early 2006 with exporting countries allows imported rice to be sold at
retail stores, little of the imported rice is sold in the retail sector partly due to the monopoly distribution
system. In addition, large-scale retailers are reluctant to sell imported rice for potential backlash from
the NGO consumer groups. As a result, most of the imported rice, including American rice, is
currently used by food processors. Korea imported a total of $78 million of American rice in 2010.
2. Pasta: Italian cuisine is gaining popularity among the general public, resulting in an increased
demand for related products, including pasta noodles. Among the $100 million of pasta products
imported in 2010, imports from the United States amounted to less than $1 million. However,
importers should be more interested in American products as the value of dollar is expected to continue
a decline. In addition, the 8 percent import duty currently applied to American spaghetti and macaroni
products will be phased out over 5 years once the Korea-United States Free Trade Agreement goes into
effect.
Page 35
3. Wheat flour: There is a growing demand for imported wheat flour as the price of locally processed
products continues to rise. Among $35 million of wheat flour imported into Korea in 2010, imports
from the United States amounted to less than $1 million.
4. Olive oil: Consumption of olive oil is on a rapid increase as more consumers are seeking healthier
alternatives for conventional cooking oils. However, among the $37 million of olive oil imported in
2010, imports from the United States amounted to less than $1 million. Competitors are also
dominating other specialty cooking oil markets in Korea, including sunflower oil and grape seed oil.
5. Butter: Among $24 million of butter imported into Korea in 2010, imports from the United States
were less than $1 million. However, Korean importers should be more interested in American products
as competitors face rising price and reduced supply.
6. Processed turkey meat: Many Korean consumers still maintain a negative image on turkey
meat. However, processed turkey products (hams in particular) are likely to gain more local followers,
especially among young consumers who have traveled to the United States and have developed tastes
for related dishes. Another important trend that should help improve the image of turkey meat is a low
fat diet followed by a significant number of Koreans.
7. Premium seafood: There is a growing potential for premium American seafood products such as
lobster, crabs (King, Snow, and Dungeness), black cod, halibut, scallop, and wild caught salmon in
Korea as affluent consumers are looking for premium, healthier alternatives for beef and
pork. However few Korean consumers have understanding about the quality of premium seafood from
the United States. For example, few local consumers are aware of the quality difference between the
farmed Norwegian salmon and wild-caught Alaskan salmon.
8. Meal replacement prepared food: Demand for Home Meal Replacement (HMR) products is on a
rapid increase, reflecting busier lifestyle of Korean consumers. Ready-to-serve meals or microwavable
processed foods are likely to have bigger sales potential in the coming years. However, many
consumers maintain a negative view on the nutritional or food safety aspect of imported meal
replacement prepared food. American suppliers should pay more attention to promoting the nutritional
benefits of their products to overcome this challenge.
9. Processed organic food: As retailers strive to expand their organic product offerings, there is
growing demand for imported processed organic products. Currently imported processed organic food
certified under American National Organic Program (NOP) standards are allowed to be labeled and
Page 36
sold as organic products in Korea. However, Korean government has introduced its own organic
certification standards, which is also applied to imported products. As a transition measure, Korean
government has extended its existing regulation (accepting American NOP certificates) until December
31, 2012. American suppliers should contact ATO Seoul or Organic Trade Association
(www.ota.com) for updated information about Korean regulations.
10. Specialty fruits: There is a growing demand for imported specialty fruits, including lemon,
grapefruits, avocado, and pomegranate.
11. Many imported agricultural products, including honey, fresh onions, and popcorn, are subject to
high tariffs and volume quotas (TRQs) that restrict open market access. However, on-going trade
negotiations are likely to reduce these barriers in the coming years.
C. Products Not Present Because They Face Significant Barriers
1. Korea utilizes a “positive list” system for importing fresh agricultural products meaning imports of
any product that is not pre-approved in the Korean government regulation is prohibited. Because of the
risk of transferring pests, trade of fresh fruits and vegetables are only possible when Korea approves
phytosanitary standards of the United States through a pest risk assessment, which takes a considerable
amount of time as it involves extensive amount of both laboratory and field studies. Many fresh fruits
from the United States, including apple, pear, peach, and berries, are currently banned for imports as
there are no phytosanitary import agreements made on these products between Korea and the United
States.
2. Imports of approved fresh fruits and vegetables are frequently restricted for phytosanitary reasons
(such as outbreaks of fruit flies). The internet home-page of the Korean National Plant Quarantine
Service has up-to-date information on plant (including fresh fruits and vegetables) import restrictions
and regulations in English (www.npqs.go.kr.). Outbreaks of animal diseases, such as swine cholera,
avian-flu virus, and mad-cow-disease (BSE), also restrict imports of related animal products into
Korea. U.S. suppliers should contact established Korean importers or ATO Seoul for up-to-date
information on regulatory issues that restrict imports. Restrictions currently in place include:
(1) Korean government still maintains import restrictions on American beef as of February 2010. Meat
from cattle over 30 months of age regardless of the presence of Specified Risk Material (SRM) is still
prohibited. Furthermore, American-origin processed products, including beef jerky and pet food, that
contain beef ingredients are banned for imports into Korea.
Page 37
(2) Lamb meat: Imports of products from all ruminant animals, except beef, are still banned for
potential BSE risk.
(3) Korea maintains an import ban on elk antlers from the United States due to the Chronic Waste
Disease. Consequently, American elk antler industry currently has no access to the Korean market,
which exported $24 million to Korea in 2006.
(4) Korea maintains an import ban on fresh potatoes from many American states, including Wisconsin
and some counties in Idaho, due to nematode risk.
3. Fresh organic agricultural produce including vegetables and fruits: there are technical barriers that
prohibit imports of fresh organic produce. Korean regulation does not accept USDA organic
certificates for fresh produce but requires certification form Korea‟s accredited certifying agents to sell
organic agricultural produce in Korea. In addition, there is a high chance for imported fresh vegetables
and fruits to be fumigated with chemical agents to prevent potential pest risk during the plant
quarantine inspection process, which will disqualify the product from “organic” status. This
fumigation can also damage the quality of products and shorten the shelf life.
4. The Korean Food Additive Code defines specifications and usage standards for individual food
additives. Korea utilizes a “positive list” system for food additives meaning any food additive not
listed in the code is prohibited. The Korean standard differs from the CODEX standard in some cases
and consequently may prohibit entry of American products manufactured solely under the CODEX or
American standard. The home-page of Korea Food & Drug Administration
(http://fa.kfda.go.kr/foodadditivescode.html) provides detailed information about the Korean food
additive code in English. Or, an established importer should be a reliable source for the Korean
standard.
V. Key FAS/USDA Contacts and Further Information
For further information about the Korean agricultural market, please contact:
U.S. Agricultural Trade Office Seoul
Korean Address: Room 303, Leema Building, 146-1, Susong-dong, Jongro-gu, Seoul, Korea
U.S. Mailing Address: U.S. Embassy Seoul, Unit 15550-ATO, APO, AP 96205-5550
Telephone: 82-2 397-4188 Fax: 82-2 720-7921
E-mail: [email protected]
Internet homepage: www.atoseoul.com
Page 38
Agricultural Affairs Office, U.S. Embassy Seoul
Korean Address: U.S. Embassy, 82, Sejong-ro, Jongro-gu, Seoul, Korea
U.S. Mailing Address: U.S. Embassy Seoul, Unit 15550-AgAff, APO, AP 96205-5550
Telephone: 82-2 397-4297 Fax: 82-2 738-7147
E-mail: [email protected]
For more information on how you can register for USDA/FAS’ Supplier List:
The United States Department of Agriculture‟s Foreign Agricultural Service (USDA/FAS) offers
information and services that can be beneficial to both new and experienced exporters. For example,
the U.S. Suppliers Service is a searchable database of over 5,000 U.S. exporters and their products,
which is used by USDA/FAS to help facilitate connecting potential buyers with U.S. suppliers. This
database is used by more than 85 USDA FAS Overseas offices to help export agents, trading
companies, importers and foreign market buyers locate U.S. suppliers. It is also used to recruit U.S.
exporters to participate in market development activities sponsored by USDA and federal export
programs.
You can register online for this service at
http://www.fas.usda.gov/agx/partners_trade_leads/us_suppliers_list.asp
For further information about sanitary and phytosanitary requirements, please contact:
U.S. Animal Plant and Health Inspection Service Seoul (APHIS)
Korean Address: Room 303, Leema Building, 146-1, Susong-dong, Jongro-gu, Seoul, Korea
U.S. Mailing Address: U.S. Embassy Seoul, Unit 15550-APHIS, APO, AP 96205-5550
Telephone: 82-2 725-5495 Fax: 82-2 725-5496
E-mail: [email protected]
Internet Homepage: www.aphis.usda.gov
For information about financial supports and export aid programs offered by Strategic Trade
Regional Groups, please contact:
Food Export Association of the Midwest USA
309 W. Washington St., Suite 600
Chicago, Illinois 60606
Telephone: 312-334-9200 Fax: 312 334-9230
E-mail: [email protected]
Website: www.foodexport.org
Page 39
Western United States Agricultural Trade Association (WUSATA)
2500 Main Street, Suite 110, Vancouver, WA 98660-2697, USA
Telephone: 360-693-3373 Fax: 360-693-3464
E-mail: [email protected]
Website: www.wusata.org
Food Export USA - Northeast Region of the United States
150 S. Independence Mall West, 1036 Public Ledger Building
Philadelphia, PA 19106, USA
Telephone: 215-829-9111 Fax: 215-829-9777
E-mail: [email protected]
Website: www.foodexportusa.org
Southern United States Agricultural Trade Association (SUSTA)
2 Canal Street Suite 2515, New Orleans, LA 70130, USA
Telephone: 504-568-5986 Fax: 504-568-6010
E-mail: [email protected]
Website: www.susta.org
For information on the non-agricultural commercial and industrial products in Korea, please
contact:
U.S. Commercial Service
Korean Address: U.S. Embassy, 82, Sejong-ro, Jongro-gu, Seoul, Korea
U.S. Mailing Address: U.S. Embassy Seoul, Unit 15550-USCS, APO, AP 96205-5550
Telephone: 82-2 397-4535 Fax: 82-2 739-1628
E-mail: [email protected]
Homepage: www.buyusa.gov/korea
Footnotes:
[1]
Korea refers to the Republic of Korea (South Korea) in this report. [2]
Exchange rate: $1 = W1,167 (Jan. 1, 2010) [3]
Source: Retail Industry Sales Statistics, Korea National Statistics Information Service (Year 2010 data) [4]
Source: Retail Industry Sales Statistics, Korea National Statistics Information Service (Year 2010 data)
Page 40
[5] On-line shopping in this report refers to Internet shopping, TV home-shopping, catalog shopping, and other types of
retailing over communication tools that replace physical stores. [6] „Others‟ includes specialty retailers such as automobiles and furniture as well as traditional retailers such as family-
operated small grocers and paddlers in the street markets. [7]
Source: Retail Sales Statistics by Category, Korea National Statistics Information Service (Year 2010 data) [8]
Source: The Yearbook of Retail Industry 2010, Korea Chain Store Association. Share estimates were calculated based on
annual fiscal data of major companies in each segment. [9]
Source: Monthly Household Spending, Korea Statistics Information Service (Year 2010 data) [10]
Unit: 1,000 people (Source: Korea Statistics Office) [11]
Gross Domestic Production Annual, GDP [12]
Gross National Income Annual, GNI [13]
Source: Bank of Korea [14]
483 people per square kilometer (3rd
highest level in the world), Korea Statistics Office 2005 Data [15]
A Bloomberg report 2006 indicated that Seoul was the 9th
most expensive city in the world in office rent. [16]
Source: Korea Ministry of Agriculture, Forestry, Fishery, and Food [17]
Source: Korean government KOTIS database [18]
Current regulation allows imports of deboned skeletal muscle meat and bone-in meat with no Specified Risk Material
(SRM) from cattle under 30 months of age from pre-approved slaughter houses only. [19]
April 26-29, 2011 (www.seoulfoodnhotel.co.kr). For more information, contact the show organizing partner, Oak
Overseas, Ltd. ([email protected] ) [20]
'Same Product from Same Origin' rule allows time saving "documentary inspection" on products that have been imported
regularly in the past without any problem. [21]
Source: The Yearbook of Retail Industry 2010, The Korea Chainstore Association [22]
Source: Company IR Information, The Yearbook of Retail Industry 2010, Korea Superchain Association [23]
KACM: Korea Agricultural Cooperative Marketing Inc., a retail arm of Korea Agricultural Cooperatives Federation, a
quasi government agency. [24]
Source: The Yearbook of Retail Industry 2010, Korea Superchain Association [25]
Internet open markets denote marketplaces in the cyberspace where individual sellers and buyers transact products and
services freely. Providers of internet open markets collect a pre-agreed percentage of sales from the sellers as transaction
fee. The leading players are G-Market (www.gmarket.co.kr, W4.6 trillion of transactions in 2009) and Auction
(www.auction.co.kr, W3.4 trillion of transactions in 2009), both owned by e-Bay, the leading internet open market provider
in the U.S. [26]
Source: Retail Industry Sales Statistics, Korea National Statistics Information Service (Year 2010 data) / The Yearbook
of Retail Industry 2010, Korea Chainstore Association. [27]
Source: Korea Internet & Security Agency database (http://isis.kisa.or.kr/) [28]
Source: The Yearbook of Retail Industry 2008 & 2010, Korea Chainstore Association [29]
Source: The Yearbook of Retail Industry 2010, Korea Superchain Association / Company IR Information [30]
Korean accounting regulation defines the sales of on-line retail company as the amount of transaction fee that the on-line
retailer collects from transactions, unless the product or service provided was owned by the on-line retail company, since
the on-line retailer works as intermediary between the supplier and the buyer. Therefore, the actual total annual value of
products transacted through the on-line retailer should be much bigger than the sales figure in this table. For example, total
Page 41
value of products and services transacted through G-Market amounted to W4.6 trillion in 2009, but only W314 billion was
recorded as the sales of the company. [31]
Acquired by Lotte Shopping Co. in 2006 [32]
Source: The Yearbook of Retail Industry 2010, Korea Superchain Association / Company IR Information [33]
Source: Korea Rural Economic Institute (www.krei.re.kr) [34]
The document specifies the base tariff rate and the phase-out category for all agricultural products. Phase-out categories
include:
A: Immediate tariff elimination; B: 2 year phase-out; C: 3 year; D: 5 year; E: 6 year; F: 7 year; G: 10 year; H: 15 year [35]
All import value figures in this section is from Korea Trade Information Service (KOTIS) database.