Page 1
Please note:
Copyright © 2001 by the Trustees of the University of Virginia Darden School Foundation.
This spreadsheet supports INSTRUCTOR analysis of the case, "Kota Fibres, Ltd." (UVA -F-1359 v. 1.1).
1) This is a working model. Assumptions / Inputs presented can be changed to vary the results.
2) This model intentionally incorporates a circular reference. To resolve this circularity, please instruct Excel to iterate 20-30 times in recalculating the model. Click on Tools/Options/Calculation, and the Iteration button.
3) As long as the default spreadsheet calculation is set as "automatic", the impact of changing assumptions will be computed in real time. Alternatively, the F9 function key may need to be invoked to recalculate results. To set numerical calculation settings to automatic, look under tools, options, calculations menu.
Page 2
Copyright © 2001 by the Trustees of the University of Virginia Darden School Foundation.
Page 3
BASE CASE PONDICHERRY
Comparative Overview of Financial Results Associated with Various Proposals
Base CaseDebt Balance Summary Debt Balance Summary
Jan 01 1,146,269 Jan 01June 01 32,950,665 June 01Dec 01 3,463,702 Dec 01
Gross Sales 90,900,108 Excise Taxes 13,635,016 Net Sales 77,265,092 Cost of Goods Sold 66,993,380 Gross Profit 10,271,712 Operating Expenses 5,454,006 Depreciation 1,073,731 Interest Expense (Income) 1,835,620 Profit Before Taxes 1,908,354 Income Taxes 572,506 Net Profit 1,335,848 Net Profit vs. Base Case
Page 4
PONDICHERRY 30 DAY INVENTORY HIBACHI JIT
Comparative Overview of Financial Results Associated with Various Proposals
Pondicherry Inventory Hibachi JITDebt Balance Summary Debt Balance Summary Debt Balance Summary
1,344,093 Jan 01 1,200,185 Jan 01 1,353,298 35,809,122 June 01 25,435,575 June 01 24,728,089 3,897,616 Dec 01 2,957,147 Dec 01 1,844,640
96,900,108 90,900,108 90,900,108 14,535,016 13,635,016 13,635,016 82,365,092 77,265,092 77,265,092 71,415,380 66,993,380 66,993,380 10,949,712 10,271,712 10,271,712 5,814,006 5,454,006 5,454,006 1,073,731 1,073,731 1,073,731 2,024,489 1,442,475 11,145 2,037,485 2,301,500 2,407,054
611,246 690,450 722,116 1,426,240 1,611,050 1,684,938
90,392 275,202 258,698
Page 5
PONDICHERRY SALES OPTION
Summary of Sales and Credit ResultsSales 6,000,000
January FebruaryNormal Cycle 2.88% 3.18%Pondicherry Sales 172,681 190,945 Credit Outstanding 172,681 363,626
Avg Credit 1,296,566 Additional Profit 90,392 Return 6.97%
Below are the basic forecast exhibits of the model, adjusted to reflect the Pondicherry proposal.
Exhibit LocationExhibit 8 Forecast of Income Statements A25Exh. 8 contd Forecast of Balance Sheets A44Exhibit 9 Schedule of Cash Receipts and Disb A65Exhibit 10 Forecasted T-ACCOUNTS A96
EXHIBIT 8KOTA FIBRES, LTD.
Monthly Forecast of Income Statements(In Rupees)
January February
Gross Sales 2,788,801 3,083,770 Excise Taxes 418,320 462,566 Net Sales 2,370,481 2,621,205 Cost of Goods Sold 2,055,346 2,272,739 Gross Profit 315,135 348,466 Operating Expenses 484,501 484,501 Depreciation 84,130 84,130 Interest Expense (Income) (1) 12,254 28,901 Profit Before Taxes (265,750) (249,066)Income Taxes (79,725) (74,720)Net Profit (186,025) (174,346)
Page 6
(1) Interest expense = Notes Payable * 145%/12 months.
EXHIBIT 8 -contd-KOTA FIBRES, LTD.
Forecasted Monthly Balance Sheets for 1990(In Rupees)
January FebruaryAssetsCash (1) 750,000 750,000 Accounts Receivable (2) 2,946,030 3,655,168 Inventories (3) 2,378,033 6,153,817 Total Current Assets 6,074,063 10,558,985 Net Prop. Plant & Equip. (4) 8,527,238 8,443,107 Total Assets 14,601,300 19,002,093
Liabilities and Owners' EquityAccounts Payable (5) 1,670,990 4,225,425 Note Payable- Bank (6) 1,344,093 3,439,517 Accrued Taxes (7) (79,725) (154,445) Total Current Liabilities 2,935,358 7,510,497 Shareholders' Equity (8) 11,665,942 11,491,596 Total Liabilities & Equity 14,601,300 19,002,093
EXHIBIT 9KOTA FIBRES, LTD.
Schedule of Cash Receipts and Disbursements(In Rupees)
January February
Assume: Sales 2,788,801 3,083,770 Purchases (1) ### 2,607,529 5,161,963 Debt Outstanding 684,102 1,344,093 3,439,517
Receipts: Accts Rcvble Collected 2,515,500 2,374,632 New Borrowings (Repayments) 659,990 2,095,424
Disburs.: Accounts Paid (2) 1,696,074 2,607,529 Capital Expenditures 0 0 Interest Payments 12,254 28,901 Excise Tax Paid 418,320 462,566 Operating Expenses 484,501 484,501
Page 7
Accrued Income Tax Paid 0 0 Wages 576,665 886,560 Dividends 0 0 Subtotal: Disbursements 3,187,813 4,470,056
Receipts - Disbursements (12,323) 0
BOP Cash Balance 762,323 750,000 EOP Cash Balance 762,323 750,000 750,000 (1) Equal to 55 percent of sales in period (T+2).
(2) Equal to purchases in period (T-1).
Exhibit 10KOTA FIBRES, LTD.
Forecasted T-Accounts Supporting Financial Statements(In Rupees)
January February1. Schedule of Accounts ReceivableBeginning of Period 2,672,729 2,946,030 Plus Sales 2,788,801 3,083,770 Less Collections, Last Month (1) 885,456 1,046,448 Less Collections, Month before Last (2) 1,630,044 1,328,184 Less Collections PondicherryEnd of Period 2,946,030 3,655,168 (1) 40% of sales in period (T-1).
(2) 60% of sales in period (T-2).
2. Schedule of InventoriesBeginning of Period 1,249,185 2,378,033 Plus Purchases (1) ### 2,607,529 5,161,963 Plus Labor 576,665 886,560 Less Shipments (COGS) 2,055,346 2,272,739 End of Period 2,378,033 6,153,817
3. Schedule of Accounts PayableBeginning of Period 759,535 1,670,990 + Purchases (1) 2,607,529 5,161,963 - Payments (2) 1,696,074 2,607,529 End of Period 1,670,990 4,225,425
Page 8
(1) Equal to 55 percent of sales in period (T+1).
(2) Equal to purchases in period (T-1).
4. Schedule of Shareholder's EquityBeginning of Period 11,851,967 11,665,942 Plus Net Profit (186,025) (174,346) Less Dividends 0 0 End of Period 11,665,942 11,491,596
5. Schedule of Accrued TaxesBeginning of Period 0 (79,725) Plus Monthly Tax Expense (@ 30%) (79,725) (74,720) Less Quarterly Tax Payments 0 0 End of Period (79,725) (154,445)
6. Schedule of Property, Plant and EquipmentBeginning Gross PP&E 10,095,646 10,095,646 Plus Capital Expenditures 0 0 Ending Gross PP&E 10,095,646 10,095,646 Monthly Depreciation Expense 84,130 84,130 Less Cumulative Depr'n. 1,568,408 1,652,539 Ending Net PP&E 8,527,238 8,443,107
From Balance Sheet 1,344,093 3,439,517 From CR&D 1,344,093 3,439,517 DIFFERENCE 0 0
Page 9
March April May June July August4.89% 9.69% 15.28% 19.35% 17.95% 9.43%
293,558 581,138 916,538 1,160,948 1,076,932 565,862 600,199 1,002,629 1,694,359 2,466,847 2,851,959 2,420,629
Below are the basic forecast exhibits of the model, adjusted to reflect the Pondicherry proposal.
Pro Forma
March April May June July August
4,740,962 9,385,388 14,802,098 18,749,324 17,392,465 9,138,686 711,144 1,407,808 2,220,315 2,812,399 2,608,870 1,370,803
4,029,817 7,977,580 12,581,783 15,936,925 14,783,595 7,767,883 3,494,089 6,917,031 10,909,146 13,818,251 12,818,246 6,735,212
535,729 1,060,549 1,672,637 2,118,674 1,965,348 1,032,672 484,501 484,501 484,501 484,501 484,501 484,501 87,047 87,047 87,047 89,964 89,964 89,964 79,018 172,508 291,161 393,238 396,769 287,965
(114,837) 316,493 809,928 1,150,972 994,115 170,242 (34,451) 94,948 242,978 345,292 298,234 51,073 (80,386) 221,545 566,950 805,680 695,880 119,169
Page 10
March April May June July August
750,000 750,000 750,000 750,000 750,000 750,000 5,554,207 11,240,081 19,592,683 27,019,955 28,240,995 19,220,965
12,555,950 18,719,039 20,881,872 15,342,289 7,182,670 4,057,883 18,860,157 30,709,120 41,224,555 43,112,244 36,173,665 24,028,848 8,706,060 8,619,013 8,531,966 8,792,002 8,702,039 8,612,075
27,566,217 39,328,133 49,756,521 51,904,246 44,875,704 32,640,923
7,204,615 9,375,589 8,629,317 4,089,739 2,013,155 1,670,990 9,639,288 18,913,736 29,278,468 35,809,122 29,863,049 17,800,191 (188,896) (93,948) 149,031 0 298,234 349,307
16,655,007 28,195,378 38,056,816 39,898,860 32,174,438 19,820,488 10,911,210 11,132,756 11,699,705 12,005,386 12,701,266 12,820,435 27,566,217 39,328,133 49,756,521 51,904,246 44,875,704 32,640,923
March April May June July August
4,740,962 9,385,388 14,802,098 18,749,324 17,392,465 9,138,686 8,141,154 10,312,128 9,565,856 5,026,277 2,949,693 2,607,529 9,639,288 18,913,736 29,278,468 35,809,122 29,863,049 17,800,191
2,841,923 3,699,514 6,449,496 11,322,052 16,171,424 18,158,716 5,699,771 9,274,449 10,364,732 6,530,653 (5,946,073) (12,062,858)
5,161,963 8,141,154 10,312,128 9,565,856 5,026,277 2,949,693 350,000 0 0 350,000 0 0 79,018 172,508 291,161 393,238 396,769 287,965
711,144 1,407,808 2,220,315 2,812,399 2,608,870 1,370,803 484,501 484,501 484,501 484,501 484,501 484,501
Page 11
0 0 0 494,322 0 0 1,755,068 2,767,992 3,506,124 3,252,391 1,708,934 1,002,896
500,000 0 0 500,000 0 0 8,541,693 12,973,962 16,814,228 17,852,705 10,225,351 6,095,858
0 0 0 0 0 0
750,000 750,000 750,000 750,000 750,000 750,000 750,000 750,000 750,000 750,000 750,000 750,000
March April May June July August
3,655,168 5,554,207 11,240,081 19,592,683 27,019,955 28,240,995 4,740,962 9,385,388 14,802,098 18,749,324 17,392,465 9,138,686 1,157,130 1,778,962 3,521,700 5,554,224 7,035,350 6,526,213 1,569,672 1,735,695 2,668,442 5,282,550 8,331,336 10,553,026
115,121 184,857 259,354 485,278 804,738 1,079,478 5,554,207 11,240,081 19,592,683 27,019,955 28,240,995 19,220,965
6,153,817 12,555,950 18,719,039 20,881,872 15,342,289 7,182,670 8,141,154 10,312,128 9,565,856 5,026,277 2,949,693 2,607,529 1,755,068 2,767,992 3,506,124 3,252,391 1,708,934 1,002,896 3,494,089 6,917,031 10,909,146 13,818,251 12,818,246 6,735,212
12,555,950 18,719,039 20,881,872 15,342,289 7,182,670 4,057,883
4,225,425 7,204,615 9,375,589 8,629,317 4,089,739 2,013,155 8,141,154 10,312,128 9,565,856 5,026,277 2,949,693 2,607,529 5,161,963 8,141,154 10,312,128 9,565,856 5,026,277 2,949,693 7,204,615 9,375,589 8,629,317 4,089,739 2,013,155 1,670,990
Page 12
11,491,596 10,911,210 11,132,756 11,699,705 12,005,386 12,701,266 (80,386) 221,545 566,950 805,680 695,880 119,169 500,000 0 0 500,000 0 0
10,911,210 11,132,756 11,699,705 12,005,386 12,701,266 12,820,435
(154,445) (188,896) (93,948) 149,031 0 298,234 (34,451) 94,948 242,978 345,292 298,234 51,073
0 0 0 494,322 0 0 (188,896) (93,948) 149,031 0 298,234 349,307
10,095,646 10,445,646 10,445,646 10,445,646 10,795,646 10,795,646 350,000 0 0 350,000 0 0
10,445,646 10,445,646 10,445,646 10,795,646 10,795,646 10,795,646 87,047 87,047 87,047 89,964 89,964 89,964
1,739,586 1,826,633 1,913,680 2,003,644 2,093,607 2,183,571 8,706,060 8,619,013 8,531,966 8,792,002 8,702,039 8,612,075
9,639,288 18,913,736 29,278,468 35,809,122 29,863,049 17,800,191 9,639,288 18,913,736 29,278,468 35,809,122 29,863,049 17,800,191
0 0 0 0 0 0
Page 13
September October November December5.53% 4.89% 3.89% 3.04%
332,079 293,558 233,119 182,643 1,619,485 1,004,764 749,170 612,446
September October November December The Year
5,363,079 4,740,962 ### ### 96,900,108 804,462 711,144 564,732 442,454 14,535,016
4,558,617 4,029,817 ### ### 82,365,092 3,952,589 3,494,089 ### ### 71,415,380
606,028 535,729 425,432 333,315 10,949,712 484,501 484,501 484,501 484,501 5,814,006 92,880 92,880 92,880 95,797 1,073,731
165,444 92,666 57,892 46,674 2,024,489 (136,797) (134,318) (209,841) (293,656) 2,037,485 (41,039) (40,296) (62,952) (88,097) 611,246 (95,758) (94,023) (146,889) (205,559) 1,426,240
Page 14
September October November December
750,000 750,000 750,000 750,000 10,260,658 7,109,306 ### ###3,062,538 1,894,814 ### ###
14,073,196 9,754,120 ### ###8,869,195 8,776,314 ### ###
22,942,391 ### ### ###
1,134,146 685,793 ### ###9,583,567 5,754,282 ### ###
0 (40,296) (103,248) (191,345)10,717,713 6,399,780 ### ###12,224,678 ### ### ###22,942,391 ### ### ###
September October November December January February
5,363,079 4,740,962 ### ### 3,573,637 ###2,070,685 1,622,331 ### ###9,583,567 5,754,282 ### ###
14,323,386 7,892,313 ### ###(8,216,624) ### ### 69,854
2,607,529 2,070,685 ### ###350,000 0 0 350,000 165,444 92,666 57,892 46,674 804,462 711,144 564,732 442,454 484,501 484,501 484,501 484,501
Page 15
308,268 0 0 0 886,560 704,033 551,593 668,270 500,000 0 0 500,000
6,106,763 4,063,029 ### ###
0 0 0 0
750,000 750,000 750,000 750,000 750,000 750,000 750,000 750,000
September October November December
19,220,965 ### ### ###5,363,079 4,740,962 ### ###3,429,130 2,012,400 ### ###9,789,320 5,143,694 ### ###1,104,937 736,219 410,007 306,398
10,260,658 7,109,306 ### ###
4,057,883 3,062,538 ### ###2,070,685 1,622,331 ### ###
886,560 704,033 551,593 668,270 3,952,589 3,494,089 ### ###3,062,538 1,894,814 ### ###
1,670,990 1,134,146 685,793 ###2,070,685 1,622,331 ### ###2,607,529 2,070,685 ### ###1,134,146 685,793 ### ###
Page 16
12,820,435 ### ### ###(95,758) (94,023) (146,889) (205,559)500,000 0 0 500,000
12,224,678 ### ### ###
349,307 0 (40,296) (103,248)(41,039) (40,296) (62,952) (88,097)308,268 0 0 0
0 (40,296) (103,248) (191,345)
10,795,646 ### ### ### ###350,000 0 0 350,000 ###
11,145,646 ### ### ### ###92,880 92,880 92,880 95,797 ###
2,276,451 2,369,332 ### ### ###8,869,195 8,776,314 ### ### ###
9,583,567 5,754,282 ### ###9,583,567 5,754,282 ### ###
0 0 0 0
Page 17
January February MarchSales ### ### ###A/R ### ### ###Inv ### ### ###A/P ### ### ###n/p ### ### ###
Page 21
April###############
Page 22
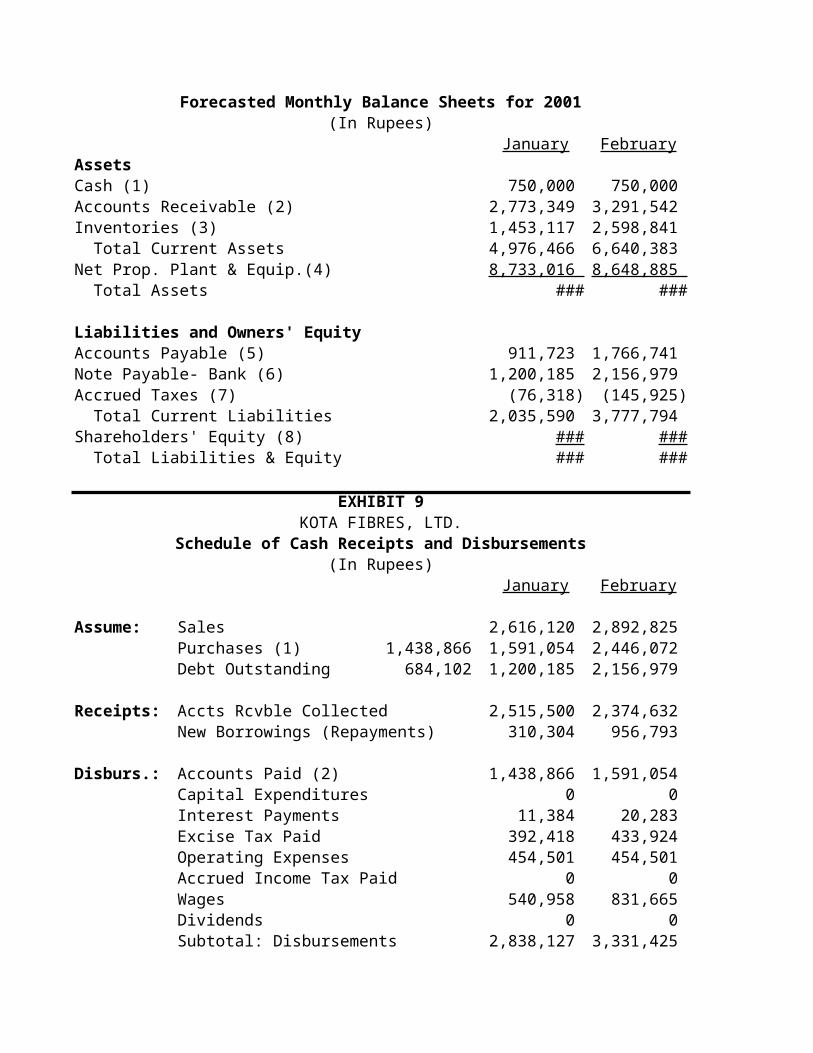
INVENTORY REDUCTION TO 30 DAYS
Summary of Sales, Inventory and Credit ResultsJanuary February
Gross Sales 2,616,120 2,892,825 Inventories (3) 1,453,117 2,598,841 Note Payable- Bank (6) 1,200,185 2,156,979
Below are the basic forecast exhibits, adjusted to reflect the inventory policy proposal.Exhibit Location
Exhibit 8 Forecast of Income Statements A20Exh. 8 contd Forecast of Balance Sheets A40Exhibit 9 Schedule of Cash Receipts and DisbursementA61Exhibit 10 Forecasted T-ACCOUNTS A92
EXHIBIT 8KOTA FIBRES, LTD.
Monthly Forecast of Income Statements(In Rupees)
January February
Gross Sales 2,616,120 2,892,825 Excise Taxes 392,418 433,924 Net Sales 2,223,702 2,458,901 Cost of Goods Sold 1,928,080 2,132,012 Gross Profit 295,622 326,889 Operating Expenses 454,501 454,501 Depreciation 84,130 84,130 Interest Expense (Income) (1) 11,384 20,283 Profit Before Taxes (254,394) (232,025)Income Taxes (76,318) (69,607)Net Profit (178,076) (162,417)
(1) Interest expense = Notes Payable * 14.5%/12 months.
EXHIBIT 8 -contd-KOTA FIBRES, LTD.
Page 23
Forecasted Monthly Balance Sheets for 2001(In Rupees)
January FebruaryAssetsCash (1) 750,000 750,000 Accounts Receivable (2) 2,773,349 3,291,542 Inventories (3) 1,453,117 2,598,841 Total Current Assets 4,976,466 6,640,383 Net Prop. Plant & Equip.(4) 8,733,016 8,648,885 Total Assets 13,709,481 15,289,269
Liabilities and Owners' EquityAccounts Payable (5) 911,723 1,766,741 Note Payable- Bank (6) 1,200,185 2,156,979 Accrued Taxes (7) (76,318) (145,925) Total Current Liabilities 2,035,590 3,777,794 Shareholders' Equity (8) 11,673,891 11,511,474 Total Liabilities & Equity 13,709,481 15,289,269
EXHIBIT 9KOTA FIBRES, LTD.
Schedule of Cash Receipts and Disbursements(In Rupees)
January February
Assume: Sales 2,616,120 2,892,825 Purchases (1) 1,438,866 1,591,054 2,446,072 Debt Outstanding 684,102 1,200,185 2,156,979
Receipts: Accts Rcvble Collected 2,515,500 2,374,632 New Borrowings (Repayments) 310,304 956,793
Disburs.: Accounts Paid (2) 1,438,866 1,591,054 Capital Expenditures 0 0 Interest Payments 11,384 20,283 Excise Tax Paid 392,418 433,924 Operating Expenses 454,501 454,501 Accrued Income Tax Paid 0 0 Wages 540,958 831,665 Dividends 0 0 Subtotal: Disbursements 2,838,127 3,331,425
Page 24
Receipts - Disbursements (12,323) 0
BOP Cash Balance 762,323 750,000 EOP Cash Balance 762,323 750,000 750,000 (1) Equal to 55 percent of sales in period (T+1).
(2) Equal to purchases in period (T-1).
Exhibit 10KOTA FIBRES, LTD.
Forecasted T-Accounts Supporting Financial Statements(In Rupees)
January February1. Schedule of Accounts ReceivableBeginning of Period 2,672,729 2,773,349 Plus Sales 2,616,120 2,892,825 Less Collections, Last Month (1) 885,456 1,046,448 Less Collections, Month before Last (2) 1,630,044 1,328,184 End of Period 2,773,349 3,291,542 (1) 40% of sales in period (T-1).
(2) 60% of sales in period (T-2).
2. Schedule of InventoriesBeginning of Period 1,249,185 1,453,117 Plus Purchases (1) 1,438,866 1,591,054 2,446,072 Plus Labor 540,958 831,665 Less Shipments (COGS) 1,928,080 2,132,012 End of Period 1,453,117 2,598,841
3. Schedule of Accounts PayableBeginning of Period 759,535 911,723 + Purchases (1) 1,591,054 2,446,072 - Payments (2) 1,438,866 1,591,054 End of Period 911,723 1,766,741 (1) Equal to 55 percent of sales in period (T+1).
(2) Equal to purchases in period (T-1).
4. Schedule of Shareholder's EquityBeginning of Period 11,851,967 11,673,891
To adjust the spreadsheet for the new inventory policy, simply change the purchasing from two months ahead to one month ahead.
In addition, adjust the formula for wages so that wages are driven by this month's purchases rather than last month's purchases.
B108
To adjust the spreadsheet for the new inventory policy, simply change the purchasing from two months ahead to one month ahead.
A109
In addition, adjust the formula for wages so that wages are driven by this month's purchases rather than last month's purchases.
Page 25
Plus Net Profit (178,076) (162,417) Less Dividends 0 0 End of Period 11,673,891 11,511,474
5. Schedule of Accrued TaxesBeginning of Period 0 (76,318) Plus Monthly Tax Expense (@ 30%) (76,318) (69,607) Less Quarterly Tax Payments 0 0 End of Period (76,318) (145,925)
6. Schedule of Property, Plant and EquipmentBeginning Gross PP&E 10,095,646 10,095,646 Plus Capital Expenditures 0 0 Ending Gross PP&E 10,095,646 10,095,646 10,095,646 Monthly Depreciation Expense 84,130 84,130 Less Cumulative Depr'n. 1,278,500 1,362,630 1,446,761 Ending Net PP&E 8,817,146 8,733,016 8,648,885
From Balance Sheet 1,200,185 2,156,979 From CR&D 1,200,185 2,156,979 DIFFERENCE 0 0
Exhibit TN3
January February MarchGross sales 2,616,120 2,892,825 4,447,404 Net profit (178,076) (162,417) (59,849)
AssetsCash (1) 750,000 750,000 750,000 Accounts Receivable (2) 2,773,349 3,291,542 5,012,144 Inventories (3) 1,453,117 2,598,841 5,809,837 Total Current Assets 4,976,466 6,640,383 11,571,981 Net Prop. Plant & Equip.(4) 8,733,016 8,648,885 8,911,838 Total Assets 13,709,481 15,289,269 20,483,819 Liabilities and Owners' Equity
Page 26
Accounts Payable (5) 911,723 1,766,741 4,163,007 Note Payable- Bank (6) 1,200,185 2,156,979 5,540,762 Accrued Taxes (7) (76,318) (145,925) (171,575) Total Current Liabilities 2,035,590 3,777,794 9,532,193 Shareholders' Equity (8) 11,673,891 11,511,474 10,951,626 Total Liabilities & Equity 13,709,481 15,289,269 20,483,819 Schedule of InventoriesBeginning of Period 1,249,185 1,453,117 2,598,841 Plus Purchases (1) 1,591,054 2,446,072 4,842,338 Plus Labor 540,958 831,665 1,646,395 Less Shipments (COGS) 1,928,080 2,132,012 3,277,737 End of Period 1,453,117 2,598,841 5,809,837
Page 27
March April May June July August4,447,404 8,804,250 13,885,560 17,588,376 16,315,533 8,572,824 5,809,837 9,554,762 12,283,738 11,345,652 5,639,276 3,028,952 5,540,762 11,342,182 18,797,552 25,435,575 23,845,118 14,393,177
Below are the basic forecast exhibits, adjusted to reflect the inventory policy proposal.
Pro Forma
March April May June July August
4,447,404 8,804,250 13,885,560 17,588,376 16,315,533 8,572,824 667,111 1,320,638 2,082,834 2,638,256 2,447,330 1,285,924
3,780,293 7,483,613 11,802,726 14,950,120 13,868,203 7,286,900 3,277,737 6,488,732 10,233,658 12,962,633 12,024,548 6,318,171
502,557 994,880 1,569,068 1,987,486 1,843,655 968,729 454,501 454,501 454,501 454,501 454,501 454,501 87,047 87,047 87,047 89,964 89,964 89,964 46,507 102,001 182,094 267,242 297,738 231,023
(85,498) 351,332 845,426 1,175,780 1,001,453 193,242 (25,649) 105,399 253,628 352,734 300,436 57,973 (59,849) 245,932 591,799 823,046 701,017 135,269
Page 28
March April May June July August
750,000 750,000 750,000 750,000 750,000 750,000 5,012,144 10,301,737 17,997,155 24,748,757 25,697,604 17,191,189 5,809,837 9,554,762 12,283,738 11,345,652 5,639,276 3,028,952
11,571,981 20,606,500 31,030,893 36,844,409 32,086,879 20,970,140 8,911,838 8,824,791 8,737,744 8,997,780 8,907,817 8,817,853
20,483,819 29,431,291 39,768,637 45,842,190 40,994,696 29,787,993
4,163,007 6,957,727 8,994,276 8,294,212 4,035,722 2,087,719 5,540,762 11,342,182 18,797,552 25,435,575 23,845,118 14,393,177 (171,575) (66,175) 187,453 0 300,436 358,409
9,532,193 18,233,733 27,979,281 33,729,787 28,181,276 16,839,304 10,951,626 11,197,558 11,789,356 12,112,403 12,813,420 12,948,689 20,483,819 29,431,291 39,768,637 45,842,190 40,994,696 29,787,993
March April May June July August
4,447,404 8,804,250 13,885,560 17,588,376 16,315,533 8,572,824 4,842,338 7,637,058 9,673,607 8,973,543 4,715,053 2,767,050 5,540,762 11,342,182 18,797,552 25,435,575 23,845,118 14,393,177
2,726,802 3,514,657 6,190,142 10,836,774 15,366,686 17,079,239 3,383,783 5,801,420 7,455,371 6,638,023 (1,590,457) (9,451,941)
2,446,072 4,842,338 7,637,058 9,673,607 8,973,543 4,715,053 350,000 0 0 350,000 0 0 46,507 102,001 182,094 267,242 297,738 231,023
667,111 1,320,638 2,082,834 2,638,256 2,447,330 1,285,924 454,501 454,501 454,501 454,501 454,501 454,501
0 0 0 540,187 0 0 1,646,395 2,596,600 3,289,026 3,051,005 1,603,118 940,797
500,000 0 0 500,000 0 0 6,110,585 9,316,076 13,645,513 17,474,797 13,776,229 7,627,297
Page 29
0 0 0 0 0 0
750,000 750,000 750,000 750,000 750,000 750,000 750,000 750,000 750,000 750,000 750,000 750,000
March April May June July August
3,291,542 5,012,144 10,301,737 17,997,155 24,748,757 25,697,604 4,447,404 8,804,250 13,885,560 17,588,376 16,315,533 8,572,824 1,157,130 1,778,962 3,521,700 5,554,224 7,035,350 6,526,213 1,569,672 1,735,695 2,668,442 5,282,550 8,331,336 10,553,026 5,012,144 10,301,737 17,997,155 24,748,757 25,697,604 17,191,189
2,598,841 5,809,837 9,554,762 12,283,738 11,345,652 5,639,276 4,842,338 7,637,058 9,673,607 8,973,543 4,715,053 2,767,050 1,646,395 2,596,600 3,289,026 3,051,005 1,603,118 940,797 3,277,737 6,488,732 10,233,658 12,962,633 12,024,548 6,318,171 5,809,837 9,554,762 12,283,738 11,345,652 5,639,276 3,028,952
1,766,741 4,163,007 6,957,727 8,994,276 8,294,212 4,035,722 4,842,338 7,637,058 9,673,607 8,973,543 4,715,053 2,767,050 2,446,072 4,842,338 7,637,058 9,673,607 8,973,543 4,715,053 4,163,007 6,957,727 8,994,276 8,294,212 4,035,722 2,087,719
11,511,474 10,951,626 11,197,558 11,789,356 12,112,403 12,813,420
In addition, adjust the formula for wages so that wages are driven by this month's purchases rather than last month's purchases.
Page 30
(59,849) 245,932 591,799 823,046 701,017 135,269 500,000 0 0 500,000 0 0
10,951,626 11,197,558 11,789,356 12,112,403 12,813,420 12,948,689
(145,925) (171,575) (66,175) 187,453 0 300,436 (25,649) 105,399 253,628 352,734 300,436 57,973
0 0 0 540,187 0 0 (171,575) (66,175) 187,453 0 300,436 358,409
10,095,646 10,445,646 10,445,646 10,445,646 10,795,646 10,795,646 350,000 0 0 350,000 0 0
10,445,646 10,445,646 10,445,646 10,795,646 10,795,646 10,795,646 87,047 87,047 87,047 89,964 89,964 89,964
1,533,808 1,620,855 1,707,902 1,797,866 1,887,829 1,977,793 8,911,838 8,824,791 8,737,744 8,997,780 8,907,817 8,817,853
5,540,762 11,342,182 18,797,552 25,435,575 23,845,118 14,393,177 5,540,762 11,342,182 18,797,552 25,435,575 23,845,118 14,393,177
0 0 0 0 0 0
April May June July August September8,804,250 13,885,560 17,588,376 16,315,533 8,572,824 5,031,000
245,932 591,799 823,046 701,017 135,269 (76,912)
750,000 750,000 750,000 750,000 750,000 750,000 10,301,737 17,997,155 24,748,757 25,697,604 17,191,189 9,003,739 9,554,762 12,283,738 11,345,652 5,639,276 3,028,952 2,598,841
20,606,500 31,030,893 36,844,409 32,086,879 20,970,140 12,352,581 8,824,791 8,737,744 8,997,780 8,907,817 8,817,853 9,074,973
29,431,291 39,768,637 45,842,190 40,994,696 29,787,993 21,427,553
Page 31
6,957,727 8,994,276 8,294,212 4,035,722 2,087,719 1,766,741 11,342,182 18,797,552 25,435,575 23,845,118 14,393,177 7,289,035
(66,175) 187,453 0 300,436 358,409 0 18,233,733 27,979,281 33,729,787 28,181,276 16,839,304 9,055,776 11,197,558 11,789,356 12,112,403 12,813,420 12,948,689 12,371,777 29,431,291 39,768,637 45,842,190 40,994,696 29,787,993 21,427,553
5,809,837 9,554,762 12,283,738 11,345,652 5,639,276 3,028,952 7,637,058 9,673,607 8,973,543 4,715,053 2,767,050 2,446,072 2,596,600 3,289,026 3,051,005 1,603,118 940,797 831,665 6,488,732 10,233,658 12,962,633 12,024,548 6,318,171 3,707,847 9,554,762 12,283,738 11,345,652 5,639,276 3,028,952 2,598,841
Page 32
September October November December The Year5,031,000 4,447,404 3,531,762 2,767,050 90,900,108 2,598,841 1,924,013 1,360,420 1,827,609 7,289,035 4,431,877 3,124,139 2,957,147
September October November December The Year
5,031,000 4,447,404 3,531,762 2,767,050 90,900,108 754,650 667,111 529,764 415,058 13,635,016
4,276,350 3,780,293 3,001,998 2,351,993 77,265,092 3,707,847 3,277,737 2,602,909 2,039,316 66,993,380
568,503 502,557 399,089 312,677 10,271,712 454,501 454,501 454,501 454,501 5,454,006 92,880 92,880 92,880 95,797 1,073,731
130,997 70,814 45,651 36,741 1,442,475 (109,875) (115,638) (193,943) (274,362) 2,301,500 (32,962) (34,691) (58,183) (82,309) 690,450 (76,912) (80,947) (135,760) (192,053) 1,611,050
======= =======
Page 33
September October November December
750,000 750,000 750,000 750,000 9,003,739 6,295,049 5,029,249 3,715,152 2,598,841 1,924,013 1,360,420 1,827,609
12,352,581 8,969,062 7,139,670 6,292,761 9,074,973 8,982,092 8,889,212 9,143,415
21,427,553 17,951,154 16,028,882 15,436,176
1,766,741 1,263,138 842,547 1,191,195 7,289,035 4,431,877 3,124,139 2,957,147
0 (34,691) (92,874) (175,183)9,055,776 5,660,324 3,873,811 3,973,159
12,371,777 12,290,830 12,155,070 11,463,017 21,427,553 17,951,154 16,028,882 15,436,176
September October November December January February
5,031,000 4,447,404 3,531,762 2,767,050 3,400,956 3,616,031 2,446,072 1,942,469 1,521,878 1,870,526 7,289,035 4,431,877 3,124,139 2,957,147
13,218,449 7,156,094 4,797,562 4,081,147 (7,104,141) (2,857,158) (1,307,738) (166,992)
2,767,050 2,446,072 1,942,469 1,521,878 350,000 0 0 350,000 130,997 70,814 45,651 36,741 754,650 667,111 529,764 415,058 454,501 454,501 454,501 454,501 325,446 0 0 0 831,665 660,439 517,438 635,979 500,000 0 0 500,000
6,114,308 4,298,937 3,489,823 3,914,155
Page 34
0 0 0 0
750,000 750,000 750,000 750,000 750,000 750,000 750,000 750,000
September October November December
17,191,189 9,003,739 6,295,049 5,029,249 5,031,000 4,447,404 3,531,762 2,767,050 3,429,130 2,012,400 1,778,962 1,412,705 9,789,320 5,143,694 3,018,600 2,668,442 9,003,739 6,295,049 5,029,249 3,715,152
3,028,952 2,598,841 1,924,013 1,360,420 2,446,072 1,942,469 1,521,878 1,870,526
831,665 660,439 517,438 635,979 3,707,847 3,277,737 2,602,909 2,039,316 2,598,841 1,924,013 1,360,420 1,827,609
2,087,719 1,766,741 1,263,138 842,547 2,446,072 1,942,469 1,521,878 1,870,526 2,767,050 2,446,072 1,942,469 1,521,878 1,766,741 1,263,138 842,547 1,191,195
12,948,689 12,371,777 12,290,830 12,155,070
Page 35
(76,912) (80,947) (135,760) (192,053)500,000 0 0 500,000
12,371,777 12,290,830 12,155,070 11,463,017
358,409 0 (34,691) (92,874)(32,962) (34,691) (58,183) (82,309)325,446 0 0 0
0 (34,691) (92,874) (175,183)
10,795,646 11,145,646 11,145,646 11,145,646 ###350,000 0 0 350,000 1,400,000
11,145,646 11,145,646 11,145,646 11,495,646 ###92,880 92,880 92,880 95,797 1,073,731
2,070,673 2,163,554 2,256,434 2,352,231 23,456,837 9,074,973 8,982,092 8,889,212 9,143,415 ###
7,289,035 4,431,877 3,124,139 2,957,147 7,289,035 4,431,877 3,124,139 2,957,147
0 0 0 0
October November December4,447,404 3,531,762 2,767,050
(80,947) (135,760) (192,053)
750,000 750,000 750,000 6,295,049 5,029,249 3,715,152 1,924,013 1,360,420 1,827,609 8,969,062 7,139,670 6,292,761 8,982,092 8,889,212 9,143,415
17,951,154 16,028,882 15,436,176
Page 36
1,263,138 842,547 1,191,195 4,431,877 3,124,139 2,957,147
(34,691) (92,874) (175,183)5,660,324 3,873,811 3,973,159
12,290,830 12,155,070 11,463,017 17,951,154 16,028,882 15,436,176
2,598,841 1,924,013 1,360,420 1,942,469 1,521,878 1,870,526
660,439 517,438 635,979 3,277,737 2,602,909 2,039,316 1,924,013 1,360,420 1,827,609
Page 38
Hibachi's Just in Time proposal
Summary of Sales, Inventory and Debt ResultsJanuary
Gross Sales 2,616,120 Inventories (3) 1,452,010 Note Payable- Bank (6) 1,353,298
Below are the base case forecast exhibits adjusted to reflect the Hibachi proposal.Exhibit Location
Exhibit 8 Forecast of Income Statements A549..Q567Exh. 8 contd Forecast of Balance Sheets A569..Q588Exhibit 9 Schedule of Cash Receipts and Disbursements A590..Q619Exhibit 10 Forecasted T-ACCOUNTS A621..Q669Graph V562..AD580
EXHIBIT 8KOTA FIBRES, LTD.
Monthly Forecast of Income Statements(In Rupees)
January
Gross Sales 2,616,120 Excise Taxes 392,418 Net Sales 2,223,702 Cost of Goods Sold 1,928,080 Gross Profit 295,622 Operating Expenses 454,501 Depreciation 84,130 Interest Expense (Income) (1) 12,309 Profit Before Taxes (255,319)Income Taxes (76,596)Net Profit (178,723)
(1) Interest expense = Notes Payable * 14.5%/12 months.
EXHIBIT 8 -contd-KOTA FIBRES, LTD.
Page 39
Forecasted Monthly Balance Sheets for 1990(In Rupees)
JanuaryAssetsCash (1) 750,000 Accounts Receivable (2) 2,773,349 Inventories (3) 1,452,010 Total Current Assets 4,975,359 Net Prop. Plant & Equip. (4) 8,733,016 Total Assets 13,708,374
Liabilities and Owners' EquityAccounts Payable (5) 758,428 Note Payable- Bank (6) 1,353,298 Accrued Taxes (7) (76,596) Total Current Liabilities 2,035,130 Shareholders' Equity (8) 11,673,244 Total Liabilities & Equity 13,708,374
EXHIBIT 9KOTA FIBRES, LTD.
Schedule of Cash Receipts and Disbursements(In Rupees)
January
Assume: Sales 2,616,120 Purchases 1,591,054 1,589,947 Debt Outstanding 684,102 1,353,298
Receipts: Accts Rcvble Collected 2,515,500 New Borrowings (Repayments) 463,417
Disburs.: Accounts Paid 1,591,054 Capital Expenditures 0 Interest Payments 12,309 Excise Tax Paid 392,418 Operating Expenses 454,501 Accrued Income Tax Paid 0 Wages 540,958 Dividends 0 Subtotal: Disbursements 2,991,240
Page 40
Receipts - Disbursements (12,323)
BOP Cash Balance 762,323 EOP Cash Balance 762,323 750,000
Exhibit 10KOTA FIBRES, LTD.
Forecasted T-Accounts Supporting Financial Statements(In Rupees)
January1. Schedule of Accounts ReceivableBeginning of Period 2,672,729 Plus Sales 2,616,120 Less Collections, Last Month (1) 885,456 Less Collections, Month before Last (2) 1,630,044 End of Period 2,773,349 (1) 40% of sales in period (T-1).
(2) 60% of sales in period (T-2).
2. Schedule of InventoriesBeginning of Period 1,249,185 Plus Purchases (1) 1,591,054 1,589,947 Plus Labor 540,958 Less Shipments (COGS) 1,928,080 End of Period 1,452,010
3. Schedule of Accounts PayableBeginning of Period 759,535 + Purchases (1) 1,589,947 - Payments (2) 1,591,054 End of Period 758,428 (1) Equal to 55 percent of sales in period (T+1).
(2) Equal to purchases in period (T-1).
4. Schedule of Shareholder's EquityBeginning of Period 11,851,967
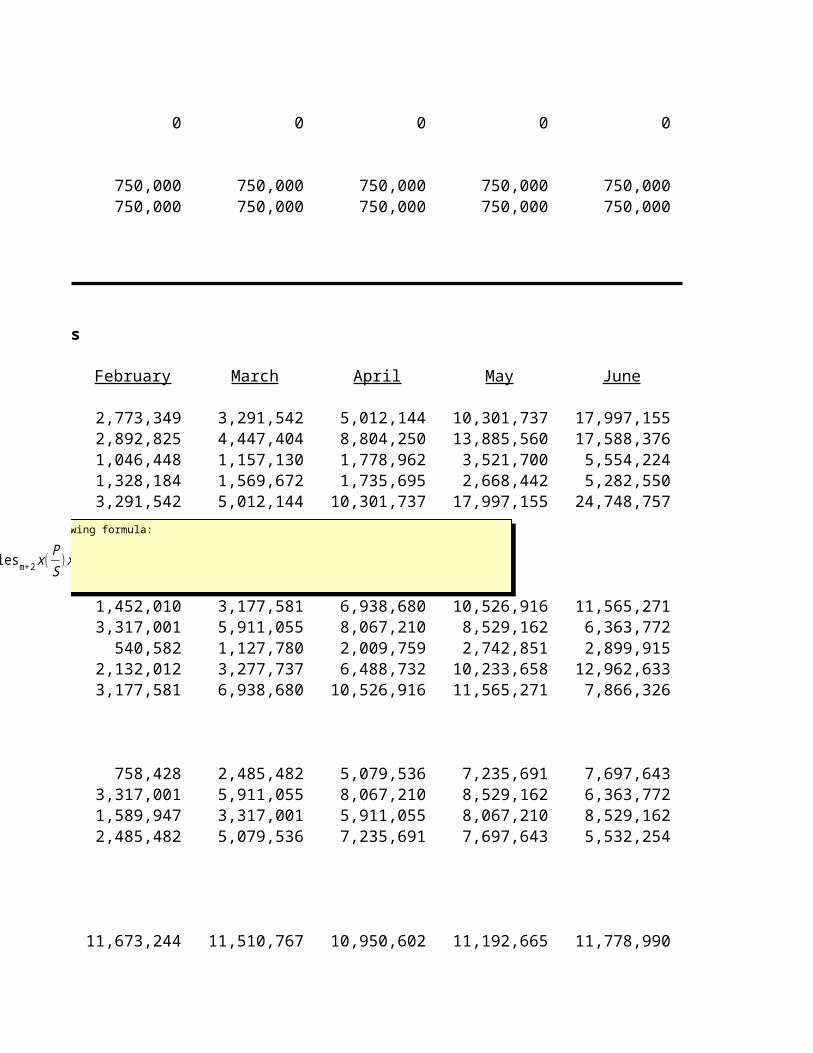
Purchasesm = (Salesm+ 2 x(PS
) x . 65) + (Salesm+ 2 x(PS
) x . 35 x . 05) + (Salesm x (PS
)x .35 x . 95 )
Adjust purchases using the following formula:
A108
Adjust purchases using the following formula:
Page 41
Plus Net Profit (178,723) Less Dividends 0 End of Period 11,673,244
5. Schedule of Accrued TaxesBeginning of Period 0 Plus Monthly Tax Expense (@ 30%) (76,596) Less Quarterly Tax Payments 0 End of Period (76,596)
6. Schedule of Property, Plant and EquipmentBeginning Gross PP&E 10,095,646 Plus Capital Expenditures 0 Ending Gross PP&E 10,095,646 10,095,646 Monthly Depreciation Expense 84,130 Less Cumulative Depr'n. 1,278,500 1,362,630 Ending Net PP&E 8,817,146 8,733,016
From Balance Sheet 1,353,298 From CR&D 1,353,298 DIFFERENCE 0
Exhibit TN2January February March
Gross sales 2,616,120 2,892,825 4,447,404 Net profit (178,723) (162,477) (60,165)
AssetsCash (1) 750,000 750,000 750,000 Accounts Receivable (2) 2,773,349 3,291,542 5,012,144 Inventories (3) 1,452,010 3,177,581 6,938,680 Total Current Assets 4,975,359 7,219,123 12,700,824 Net Prop. Plant & Equip. (4) 8,733,016 8,648,885 8,911,838 Total Assets 13,708,374 15,868,008 21,612,662
Page 42
Liabilities and Owners' Equit Accounts Payable (5) 758,428 2,485,482 5,079,536 Note Payable- Bank (6) 1,353,298 2,017,987 5,754,537 Accrued Taxes (7) (76,596) (146,229) (172,014) Total Current Liabilities 2,035,130 4,357,241 10,662,060 Shareholders' Equity (8) 11,673,244 11,510,767 10,950,602 Total Liabilities & Equity 13,708,374 15,868,008 21,612,662
Schedule of InventoriesBeginning of Period 1,249,185 1,452,010 3,177,581 Plus Purchases (1) 1,589,947 3,317,001 5,911,055 Plus Labor 540,958 540,582 1,127,780 Less Shipments (COGS) 1,928,080 2,132,012 3,277,737 End of Period 1,452,010 3,177,581 6,938,680
Page 43
Summary of Sales, Inventory and Debt ResultsFebruary March April May June
2,892,825 4,447,404 8,804,250 13,885,560 17,588,376 3,177,581 6,938,680 10,526,916 11,565,271 7,866,326 2,017,987 5,754,537 12,043,361 19,390,528 24,728,089
Below are the base case forecast exhibits adjusted to reflect the Hibachi proposal.
EXHIBIT 8KOTA FIBRES, LTD.
Monthly Forecast of Income Statements Pro Forma(In Rupees)
February March April May June
2,892,825 4,447,404 8,804,250 13,885,560 17,588,376 433,924 667,111 1,320,638 2,082,834 2,638,256
2,458,901 3,780,293 7,483,613 11,802,726 14,950,120 2,132,012 3,277,737 6,488,732 10,233,658 12,962,633
326,889 502,557 994,880 1,569,068 1,987,486 454,501 454,501 454,501 454,501 454,501 84,130 87,047 87,047 87,047 89,964 20,368 46,959 107,529 189,913 266,550
(232,110) (85,950) 345,804 837,608 1,176,472 (69,633) (25,785) 103,741 251,282 352,942
(162,477) (60,165) 242,063 586,325 823,531
EXHIBIT 8 -contd-KOTA FIBRES, LTD.
Page 44
Forecasted Monthly Balance Sheets for 1990(In Rupees)
February March April May June
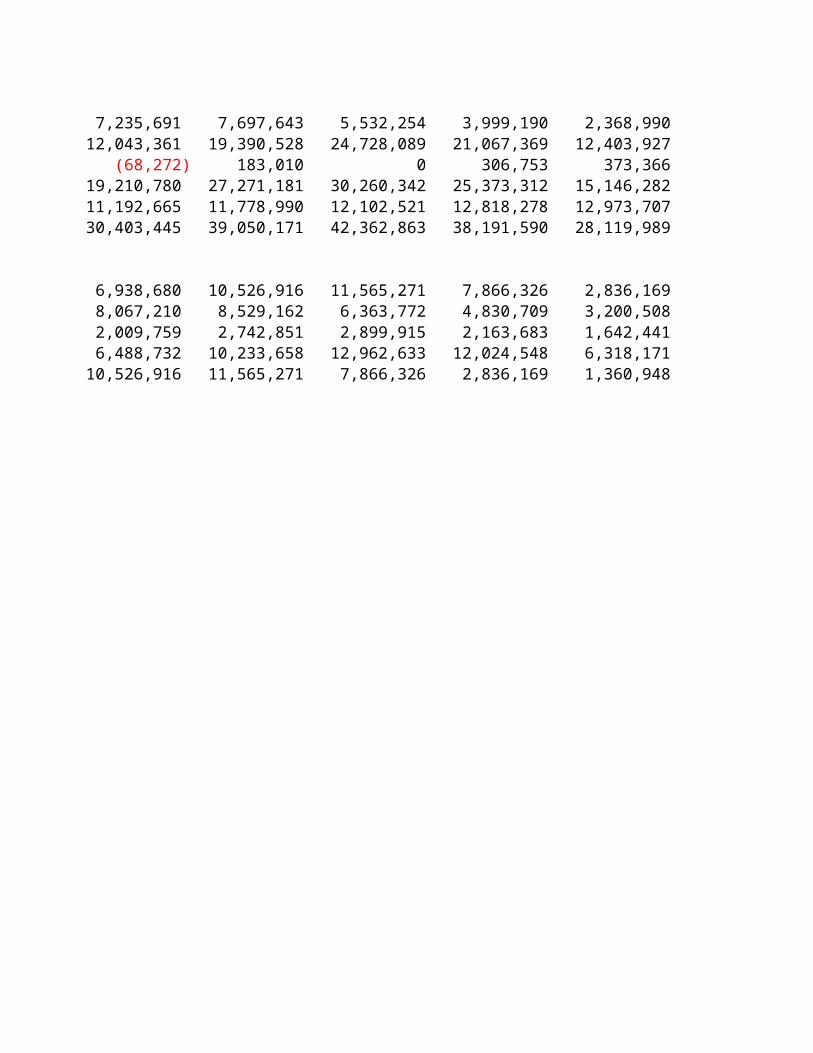
750,000 750,000 750,000 750,000 750,000 3,291,542 5,012,144 10,301,737 17,997,155 24,748,757 3,177,581 6,938,680 10,526,916 11,565,271 7,866,326 7,219,123 12,700,824 21,578,653 30,312,426 33,365,083 8,648,885 8,911,838 8,824,791 8,737,744 8,997,780
15,868,008 21,612,662 30,403,445 39,050,171 42,362,863
2,485,482 5,079,536 7,235,691 7,697,643 5,532,254 2,017,987 5,754,537 12,043,361 19,390,528 24,728,089 (146,229) (172,014) (68,272) 183,010 0
4,357,241 10,662,060 19,210,780 27,271,181 30,260,342 11,510,767 10,950,602 11,192,665 11,778,990 12,102,521 15,868,008 21,612,662 30,403,445 39,050,171 42,362,863
EXHIBIT 9KOTA FIBRES, LTD.
Schedule of Cash Receipts and Disbursements(In Rupees)
February March April May June
2,892,825 4,447,404 8,804,250 13,885,560 17,588,376 3,317,001 5,911,055 8,067,210 8,529,162 6,363,772 2,017,987 5,754,537 12,043,361 19,390,528 24,728,089
2,374,632 2,726,802 3,514,657 6,190,142 10,836,774 664,689 3,736,550 6,288,824 7,347,166 5,337,561
1,589,947 3,317,001 5,911,055 8,067,210 8,529,162 0 350,000 0 0 350,000
20,368 46,959 107,529 189,913 266,550 433,924 667,111 1,320,638 2,082,834 2,638,256 454,501 454,501 454,501 454,501 454,501
0 0 0 0 535,952 540,582 1,127,780 2,009,759 2,742,851 2,899,915
0 500,000 0 0 500,000 3,039,321 6,463,352 9,803,481 13,537,309 16,174,335
Page 45
0 0 0 0 0
750,000 750,000 750,000 750,000 750,000 750,000 750,000 750,000 750,000 750,000
Exhibit 10KOTA FIBRES, LTD.
Forecasted T-Accounts Supporting Financial Statements(In Rupees)
February March April May June
2,773,349 3,291,542 5,012,144 10,301,737 17,997,155 2,892,825 4,447,404 8,804,250 13,885,560 17,588,376 1,046,448 1,157,130 1,778,962 3,521,700 5,554,224 1,328,184 1,569,672 1,735,695 2,668,442 5,282,550 3,291,542 5,012,144 10,301,737 17,997,155 24,748,757
1,452,010 3,177,581 6,938,680 10,526,916 11,565,271 3,317,001 5,911,055 8,067,210 8,529,162 6,363,772
540,582 1,127,780 2,009,759 2,742,851 2,899,915 2,132,012 3,277,737 6,488,732 10,233,658 12,962,633 3,177,581 6,938,680 10,526,916 11,565,271 7,866,326
758,428 2,485,482 5,079,536 7,235,691 7,697,643 3,317,001 5,911,055 8,067,210 8,529,162 6,363,772 1,589,947 3,317,001 5,911,055 8,067,210 8,529,162 2,485,482 5,079,536 7,235,691 7,697,643 5,532,254
11,673,244 11,510,767 10,950,602 11,192,665 11,778,990
Purchasesm = (Salesm+ 2 x(PS
) x . 65) + (Salesm+ 2 x(PS
) x . 35 x . 05) + (Salesm x (PS
)x .35 x . 95 )
Adjust purchases using the following formula:
Page 46
(162,477) (60,165) 242,063 586,325 823,531 0 500,000 0 0 500,000
11,510,767 10,950,602 11,192,665 11,778,990 12,102,521
(76,596) (146,229) (172,014) (68,272) 183,010 (69,633) (25,785) 103,741 251,282 352,942
0 0 0 0 535,952 (146,229) (172,014) (68,272) 183,010 0
10,095,646 10,095,646 10,445,646 10,445,646 10,445,646 0 350,000 0 0 350,000
10,095,646 10,445,646 10,445,646 10,445,646 10,795,646 84,130 87,047 87,047 87,047 89,964
1,446,761 1,533,808 1,620,855 1,707,902 1,797,866 8,648,885 8,911,838 8,824,791 8,737,744 8,997,780
2,017,987 5,754,537 12,043,361 19,390,528 24,728,089 2,017,987 5,754,537 12,043,361 19,390,528 24,728,089
0 0 0 0 0
April May June July August8,804,250 13,885,560 17,588,376 16,315,533 8,572,824
242,063 586,325 823,531 715,757 155,430
750,000 750,000 750,000 750,000 750,000 10,301,737 17,997,155 24,748,757 25,697,604 17,191,189 10,526,916 11,565,271 7,866,326 2,836,169 1,360,948 21,578,653 30,312,426 33,365,083 29,283,773 19,302,136 8,824,791 8,737,744 8,997,780 8,907,817 8,817,853
30,403,445 39,050,171 42,362,863 38,191,590 28,119,989
Page 47
7,235,691 7,697,643 5,532,254 3,999,190 2,368,990
12,043,361 19,390,528 24,728,089 21,067,369 12,403,927 (68,272) 183,010 0 306,753 373,366
19,210,780 27,271,181 30,260,342 25,373,312 15,146,282 11,192,665 11,778,990 12,102,521 12,818,278 12,973,707 30,403,445 39,050,171 42,362,863 38,191,590 28,119,989
6,938,680 10,526,916 11,565,271 7,866,326 2,836,169 8,067,210 8,529,162 6,363,772 4,830,709 3,200,508 2,009,759 2,742,851 2,899,915 2,163,683 1,642,441 6,488,732 10,233,658 12,962,633 12,024,548 6,318,171
10,526,916 11,565,271 7,866,326 2,836,169 1,360,948
Page 48
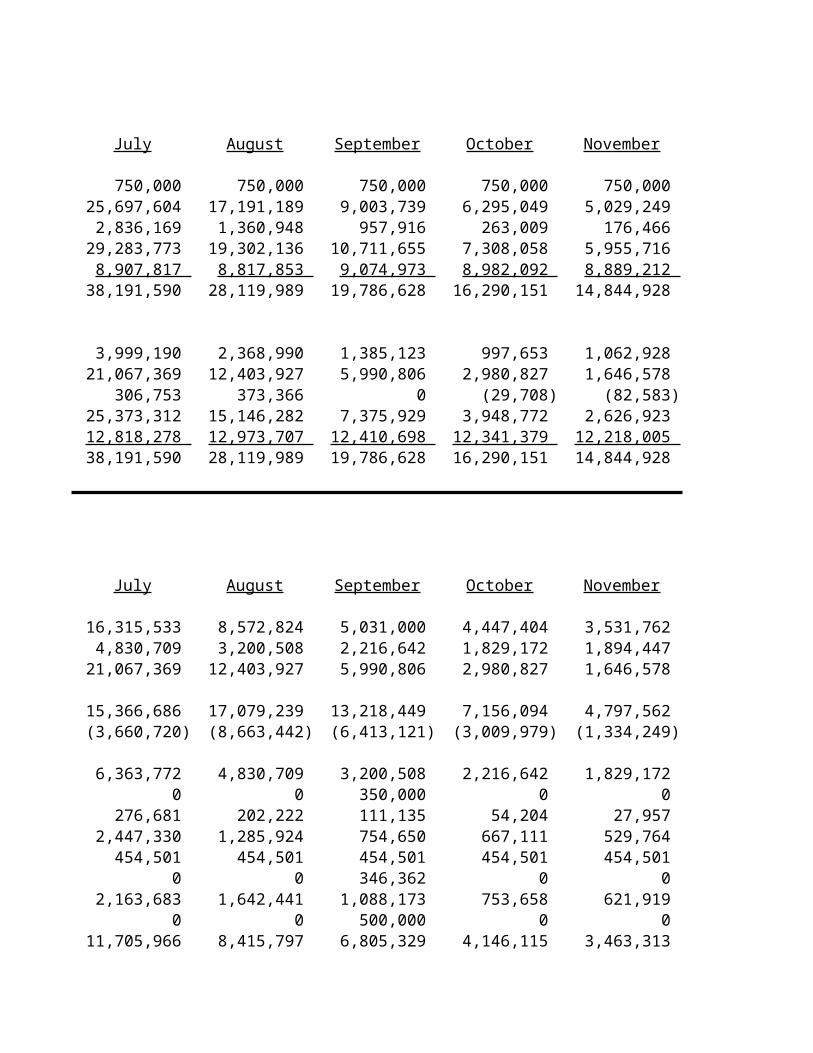
July August September October November16,315,533 8,572,824 5,031,000 4,447,404 3,531,762 2,836,169 1,360,948 957,916 263,009 176,466
21,067,369 12,403,927 5,990,806 2,980,827 1,646,578
July August September October November
16,315,533 8,572,824 5,031,000 4,447,404 3,531,762 2,447,330 1,285,924 754,650 667,111 529,764
13,868,203 7,286,900 4,276,350 3,780,293 3,001,998 12,024,548 6,318,171 3,707,847 3,277,737 2,602,909 1,843,655 968,729 568,503 502,557 399,089
454,501 454,501 454,501 454,501 454,501 89,964 89,964 92,880 92,880 92,880
276,681 202,222 111,135 54,204 27,957 1,022,510 222,042 (90,013) (99,028) (176,249)
306,753 66,613 (27,004) (29,708) (52,875)715,757 155,430 (63,009) (69,320) (123,374)
Page 49
July August September October November
750,000 750,000 750,000 750,000 750,000 25,697,604 17,191,189 9,003,739 6,295,049 5,029,249 2,836,169 1,360,948 957,916 263,009 176,466
29,283,773 19,302,136 10,711,655 7,308,058 5,955,716 8,907,817 8,817,853 9,074,973 8,982,092 8,889,212
38,191,590 28,119,989 19,786,628 16,290,151 14,844,928
3,999,190 2,368,990 1,385,123 997,653 1,062,928 21,067,369 12,403,927 5,990,806 2,980,827 1,646,578
306,753 373,366 0 (29,708) (82,583)25,373,312 15,146,282 7,375,929 3,948,772 2,626,923 12,818,278 12,973,707 12,410,698 12,341,379 12,218,005 38,191,590 28,119,989 19,786,628 16,290,151 14,844,928
July August September October November
16,315,533 8,572,824 5,031,000 4,447,404 3,531,762 4,830,709 3,200,508 2,216,642 1,829,172 1,894,447
21,067,369 12,403,927 5,990,806 2,980,827 1,646,578
15,366,686 17,079,239 13,218,449 7,156,094 4,797,562 (3,660,720) (8,663,442) (6,413,121) (3,009,979) (1,334,249)
6,363,772 4,830,709 3,200,508 2,216,642 1,829,172 0 0 350,000 0 0
276,681 202,222 111,135 54,204 27,957 2,447,330 1,285,924 754,650 667,111 529,764
454,501 454,501 454,501 454,501 454,501 0 0 346,362 0 0
2,163,683 1,642,441 1,088,173 753,658 621,919 0 0 500,000 0 0
11,705,966 8,415,797 6,805,329 4,146,115 3,463,313
Page 50
0 0 0 0 0
750,000 750,000 750,000 750,000 750,000 750,000 750,000 750,000 750,000 750,000
July August September October November
24,748,757 25,697,604 17,191,189 9,003,739 6,295,049 16,315,533 8,572,824 5,031,000 4,447,404 3,531,762 7,035,350 6,526,213 3,429,130 2,012,400 1,778,962 8,331,336 10,553,026 9,789,320 5,143,694 3,018,600
25,697,604 17,191,189 9,003,739 6,295,049 5,029,249
7,866,326 2,836,169 1,360,948 957,916 263,009 4,830,709 3,200,508 2,216,642 1,829,172 1,894,447 2,163,683 1,642,441 1,088,173 753,658 621,919
12,024,548 6,318,171 3,707,847 3,277,737 2,602,909 2,836,169 1,360,948 957,916 263,009 176,466
5,532,254 3,999,190 2,368,990 1,385,123 997,653 4,830,709 3,200,508 2,216,642 1,829,172 1,894,447 6,363,772 4,830,709 3,200,508 2,216,642 1,829,172 3,999,190 2,368,990 1,385,123 997,653 1,062,928
12,102,521 12,818,278 12,973,707 12,410,698 12,341,379
Page 51
715,757 155,430 (63,009) (69,320) (123,374)0 0 500,000 0 0
12,818,278 12,973,707 12,410,698 12,341,379 12,218,005
0 306,753 373,366 0 (29,708)306,753 66,613 (27,004) (29,708) (52,875)
0 0 346,362 0 0 306,753 373,366 0 (29,708) (82,583)
10,795,646 10,795,646 10,795,646 11,145,646 11,145,646 0 0 350,000 0 0
10,795,646 10,795,646 11,145,646 11,145,646 11,145,646 89,964 89,964 92,880 92,880 92,880
1,887,829 1,977,793 2,070,673 2,163,554 2,256,434 8,907,817 8,817,853 9,074,973 8,982,092 8,889,212
21,067,369 12,403,927 5,990,806 2,980,827 1,646,578 21,067,369 12,403,927 5,990,806 2,980,827 1,646,578
0 0 0 0 0
September October November December 5,031,000 4,447,404 3,531,762 2,767,050
(63,009) (69,320) (123,374) (181,100)
750,000 750,000 750,000 750,000 9,003,739 6,295,049 5,029,249 3,715,152
957,916 263,009 176,466 614,822 10,711,655 7,308,058 5,955,716 5,079,974 9,074,973 8,982,092 8,889,212 9,143,415
19,786,628 16,290,151 14,844,928 14,223,389
Page 52
1,385,123 997,653 1,062,928 1,002,041 5,990,806 2,980,827 1,646,578 1,844,640
0 (29,708) (82,583) (160,197)7,375,929 3,948,772 2,626,923 2,686,484
12,410,698 12,341,379 12,218,005 11,536,905 19,786,628 16,290,151 14,844,928 14,223,389
1,360,948 957,916 263,009 176,466 2,216,642 1,829,172 1,894,447 1,833,560 1,088,173 753,658 621,919 644,112 3,707,847 3,277,737 2,602,909 2,039,316
957,916 263,009 176,466 614,822
Page 53
December The Year2,767,050 90,900,108
614,822 1,844,640
December The Year
2,767,050 90,900,108 415,058 13,635,016
2,351,993 77,265,092 2,039,316 66,993,380
312,677 10,271,712 454,501 5,454,006 95,797 1,073,731 21,093 11,145
(258,714) 2,407,054 (77,614) 722,116
(181,100) 1,684,938
========= =========
Page 54
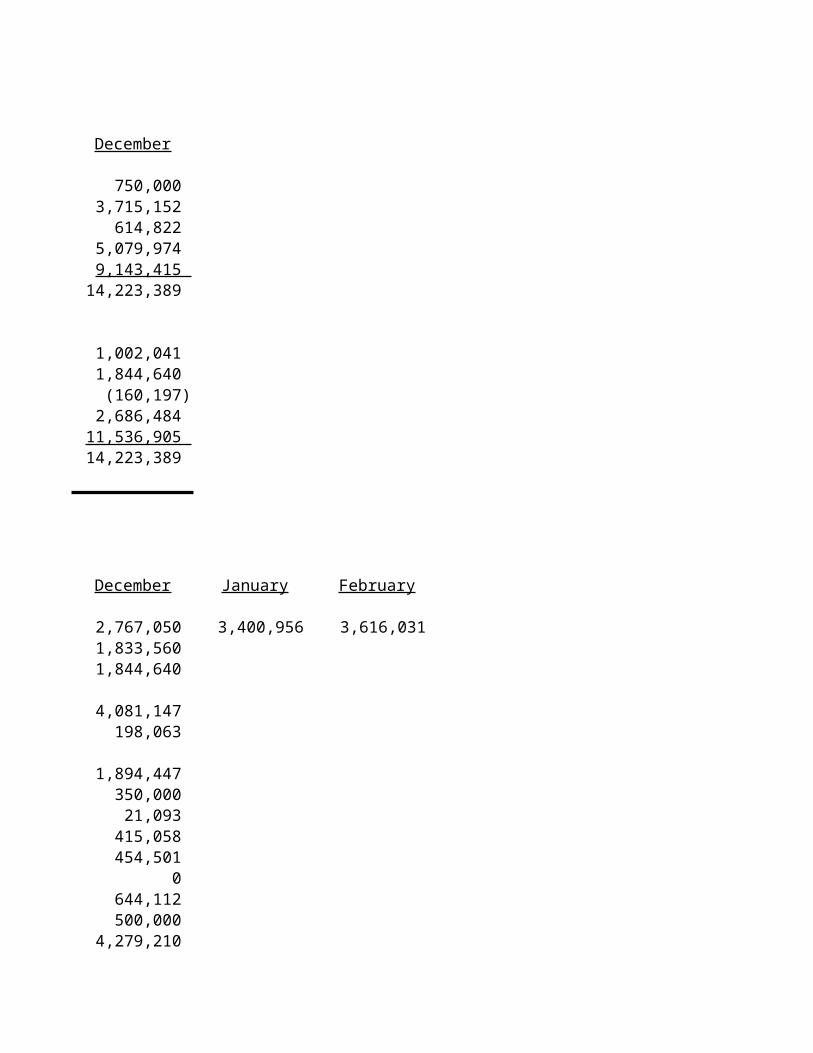
December
750,000 3,715,152
614,822 5,079,974 9,143,415
14,223,389
1,002,041 1,844,640 (160,197)
2,686,484 11,536,905 14,223,389
December January February
2,767,050 3,400,956 3,616,031 1,833,560 1,844,640
4,081,147 198,063
1,894,447 350,000 21,093
415,058 454,501
0 644,112 500,000
4,279,210
Page 55
0
750,000 750,000
December
5,029,249 2,767,050 1,412,705 2,668,442 3,715,152
176,466 1,833,560
644,112 2,039,316
614,822
1,062,928 1,833,560 1,894,447 1,002,041
12,218,005
Page 56
(181,100)500,000
11,536,905
(82,583)(77,614)
0 (160,197)
11,145,646 127,447,752 350,000 1,400,000
11,495,646 128,847,752 95,797 1,073,731
2,352,231 23,456,837 9,143,415 106,669,415
1,844,640 1,844,640
0
Page 57
LEVEL PRODUCTION PLAN
January February March
Sales as percentage of year 2.88% 3.18% 4.89%Production as percentage of year 8.33% 8.33% 8.33%
Total sales through July 73.21%Total production through July 58.33%
Page 58
April May June July August September October
9.69% 15.28% 19.35% 17.95% 9.43% 5.53% 4.89%8.33% 8.33% 8.33% 8.33% 8.33% 8.33% 8.33%
Page 59
November December
3.89% 3.04%8.33% 8.33%
Page 60
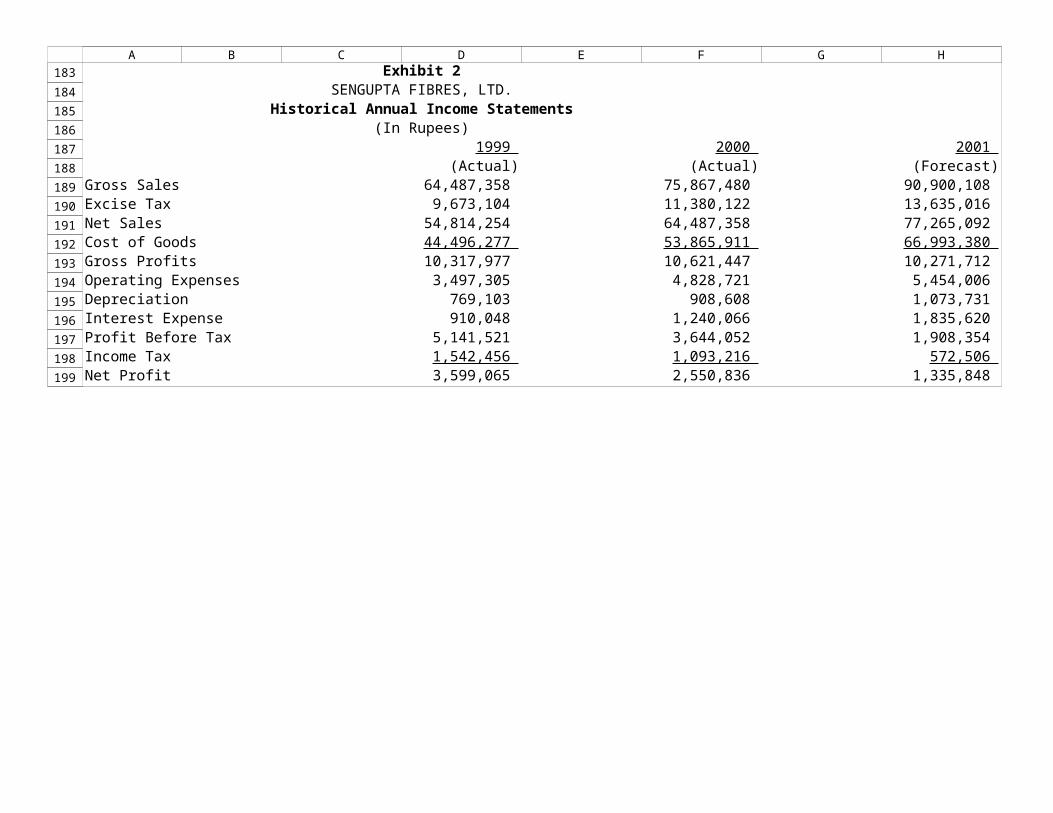
Exhibit 2SENGUPTA FIBRES, LTD.
Historical Annual Income Statements(In Rupees)
1999 2000 2001 (Actual) (Actual) (Forecast)
Gross Sales 64,487,358 75,867,480 90,900,108 Excise Tax 9,673,104 11,380,122 13,635,016 Net Sales 54,814,254 64,487,358 77,265,092 Cost of Goods 44,496,277 53,865,911 66,993,380 Gross Profits 10,317,977 10,621,447 10,271,712 Operating Expenses 3,497,305 4,828,721 5,454,006 Depreciation 769,103 908,608 1,073,731 Interest Expense 910,048 1,240,066 1,835,620 Profit Before Tax 5,141,521 3,644,052 1,908,354 Income Tax 1,542,456 1,093,216 572,506 Net Profit 3,599,065 2,550,836 1,335,848
A B C D E F G H
183
184
185
186
187
188
189
190
191
192
193
194
195
196
197
198
199
Page 61
Exhibit TN 5Sensitivity Analysis of Peak and Ending Debt to Variations in Sales and COGS
Sales as % of base case Peak Debt End Debt
100 32,950,665 3,463,701 95 31,216,310 3,280,920 90 29,481,954 3,098,139 85 27,747,599 2,915,358 80 26,013,244 2,732,577 75 24,278,889 2,549,796
Operating expenses as
a % of sales Peak Debt End Debt
6.0% 32,950,665 3,463,701 5.0% 32,621,294 2,714,270 4.0% 32,291,923 1,964,839 3.0% 31,963,281 1,260,586 2.0% 31,635,709 588,325 1.0% 31,308,137 (83,937)
Wages as a percentage
of purchases Peak Debt End Debt
34.0% 32,950,665 3,463,701 33.0% 32,675,829 3,063,969 32.0% 32,400,993 2,664,236 31.0% 32,126,157 2,264,503 30.0% 31,851,322 1,864,771 29.0% 31,576,486 1,465,038 28.0% 31,301,650 1,065,305 27.0% 31,026,814 665,573 26.0% 30,751,978 265,840
Page 62
Sensitivity Analysis of Peak and Ending Debt to Variations in Sales and COGS