29
KPI Annual Report 2018
KAnnual Report 2018
PI

German Harmonisation Annual KPI Report 2018
Annual KPI Report Page 2 of 29
Version History:
Version Date Remark Author
0.1 07.02.19 Initial Draft Barboff
0.2 27.02.19 Data analysis, first conclusions added Editorial Board
0.3 22.03.19 Data added, charts completed Barboff
0.4 25.03.19 Data analysis, conclusions added Editorial Board
0.9 17.04.19 Final edits, final review Editorial Board
1.0 30.04.19 Final version for publication Editorial Board
German Harmonisation Annual KPI Report 2018
Annual KPI Report Page 3 of 29
Imprint
Publisher: DFS Deutsche Flugsicherung GmbH on behalf of German Harmonisation Initiative A-CDM GermanyAm DFS-Campus 10 D-63225 Langen GERMANY
Contacts: Erik Sinz & Sebastian Barboff, TWR/M Tower Management Services
Editorial Board: Sebastian Barboff DFS Deutsche Flugsicherung GmbH Am DFS-Campus 10 D-63225 Langen GERMANY
Boris Breug Flughafen München GmbH D-85326 München-Flughafen GERMANY
Stefan Hilger Fraport AG Frankfurt Airport Services Worldwide D-60547 Frankfurt am Main GERMANY
Nico Ruwe Flughafen Stuttgart GmbH Flughafenstraße 32 D-70629 Stuttgart GERMANY
Date: 30 April 2019
Pages: 29
All rights reserved. Any use outside of the limits set by the German Urheberrechtsgesetz requires written permission of the publisher. Violations will be prosecuted in civil and criminal court. This includes copying, translating, microfiching, and storing and processing in electronic systems.
DFS Deutsche Flugsicherung GmbH 2019
German Harmonisation Annual KPI Report 2018
Annual KPI Report Page 4 of 29
Content
1 MANAGEMENT SUMMARY 5
2 GERMAN HARMONISATION INITIATIVE A-CDM GERMANY 6
3 PURPOSE OF THE REPORT 8
4 RESULTATE 9
4.1 GENERIC 104.1.1 NUMBER OF IFR DEPARTURES 10 4.1.2 SHARE OF REGULATED IFR DEPARTURES 12 4.1.3 SHARE OF IFR DEPARTURES REQUIRING DE-ICING 14 4.2 PROCEDURE ADHERENCE 154.2.1 ASAT QUALITY 15 4.2.2 AORT QUALITY 17 4.3 PROCEDURE PLANNING 194.3.1 TSAT QUALITY AND DEVIATION 19 4.3.2 EDIT QUALITY AND DEVIATION 22 4.4 CONNECTION TO NETWORK MANAGEMENT 244.4.1 ATFM SLOT ADHERENCE AND DEVIATION 24 4.4.2 CTOT STABILITY 26 4.4.3 AVERAGE ATFM DELAY 27
5 OUTLOOK 28
LIST OF SOURCES 29
German Harmonisation Annual KPI Report 2018
Annual KPI Report Page 5 of 29
1 Management Summary
Introduction
This report covers a set of general Key Performance Indicators (KPIs) that were deemed by the Editorial Board to be comparable among the A-CDM airports Munich, Frankfurt, Düsseldorf, Berlin-Schönefeld, Stuttgart, and Hamburg.
The KPIs contained within this report serve to continuously monitor the A-CDM process and usually portray only individual parts of the overall process.
The KPIs allow a measurement of A-CDM effects and steering of the process. They are the basis for local reporting at the individual airports. The KPIs were defined using input from EUROCONTROL‘s A-CDM Imple-mentation Manual, experiences of the local German Airport CDM airports, as well as local and future neces-sities.
The report is intended to provide a general overview of KPI trends at the A-CDM airports, as well as serve as basis for decisions regarding adjustments to or steering of the A-CDM process.
This report describes the experiences, measurements and results of the calendar year 2018. It utilises reg-ular evaluations and measurements on a monthly basis, the conclusions that are drawn address points that were mutually agreed by ACDM Germany which are reflected in the KPI Concept.
Summary of Results and Tendencies
The summer period of 2018 has brought yet another increase in the number of flight movements compared to 2017, while at the same time showing a markedly larger share of regulated flights as well. The associ-ated technical and operational interdependencies caused a disproportionate number of CTOT updates per departure compared to the same period in the preceding year.
The high volatility in regulations led to very dynamic target times at the German A-CDM airports which made the proper planning of turnaround operations exceedingly difficult. This situation was seen as obstructing ground operations and therefore criticised by the affected Ground Handling Agencies and other partners.
Nevertheless, the KPIs still show a high degree of procedure adherence among the main A-CDM partners, which can be seen most clearly in the consistently good ATFM slot adherence even under the unstable con-ditions outlined above. TSAT Quality and Deviation are worse than in the preceding year which can mainly be attributed to the higher ATFM Delay.
German Harmonisation Annual KPI Report 2018
Annual KPI Report Page 6 of 29
2 German Harmonisation Initiative A-CDM Germany
2.1 European A-CDM Concept
Airport Collaborative Decision Making (A-CDM) is the operational approach (idea/concept/process) to achieving an optimal turnaround process at airports. A-CDM covers the period from EOBT -3 h until take-off. It is a continuous process beginning with processing of the ATC flight plan, via landing of the inbound flight, the turnaround process on the ground, to departure.
By exchanging estimated landing and take-off times between the A-CDM airports and Network Management Operations Centre (NMOC), airports can be further integrated into the European ATM Network EATMN.
A-CDM improves operational collaboration between the partners: Airport Operator, Aircraft Operators, Handling Agencies, Ground Handling Agencies, Air Navigation Service Provider, and European Air Traffic Flow Management (NMOC).
A-CDM in Germany is based upon the European A-CDM spirit, the Community Specification of A-CDM, as well as recommendations by the German Harmonisation Initiative A-CDM Germany.
A-CDM aims to optimise utilisation of available capacity and operational resources at airports and within Eu-ropean airspace through high-quality target times and efficiency increases in the individual steps of the turn-around process.
2.2 German Harmonisation Initiative for A-CDM
European A-CDM fundamentally relies on Community Specification EN 303212. However, development of A-CDM in Germany has shown a need of harmonisation to a level of detail that is beyond the Specification’s scope. The A-CDM partners recognised this need and founded the German Harmonisation Initiative A-CDM Ger-many. Collaboration within the Initiative is determined by a Letter of Intent that was signed by all partners.
Partners within A-CDM Germany are currently:
Deutsche Flugsicherung GmbH (DFS) Munich Airport (FMG) Frankfurt Airport (Fraport) Berlin Airports (FBB) Düsseldorf Airport (FDG) Stuttgart Airport (FSG) Hamburg Airport (FHG)

German Harmonisation Annual KPI Report 2018
Annual KPI Report Page 7 of 29
A-CDM Germany’s goals are, among others:
Exchange of information and best practices between the various A-CDM airports, Common understanding of A-CDM in Germany and common representation towards international
partners (Eurocontrol, EU, ICAO, IATA) Harmonisation in the interest of partners and customers (“one face to the customer”) Best Practices developed within A-CDM Germany can be provided to other European A-CDM pro-
jects and working groups to advance harmonisation.
Creation and coordination of harmonised procedures and documentations are achieved within A-CDM Ger-many’s working groups and regular harmonisation meetings.
German Harmonisation Annual KPI Report 2018
Annual KPI Report Page 8 of 29
3 Purpose of the Report
This document shows A-CDM KPIs that are generally comparable across A-CDM airports in Germany. KPIs fit for inclusion in this report were selected by a working group with participation of all A-CDM airports as well as DFS. The group also defined required data to be gathered and calculation rules.
This report is not intended to replace local KPIs, nor does it pre-empt local KPI reporting routines. It is de-signed as a baseline to which local KPI concepts and reports can add additional indicators or even measure the same KPIs using different criteria.
The common reporting that serves as basis for the KPIs contained within this report provide A-CDM airports with the opportunity of highlighting changes and developments, recognising potential for improvements, and developing harmonised A-CDM subprocesses.
Further details regarding the A-CDM process and its specifics at the individual airports are described within the local A-CDM procedure descriptions and publications.
German Harmonisation Annual KPI Report 2018
Annual KPI Report Page 9 of 29
4 Results
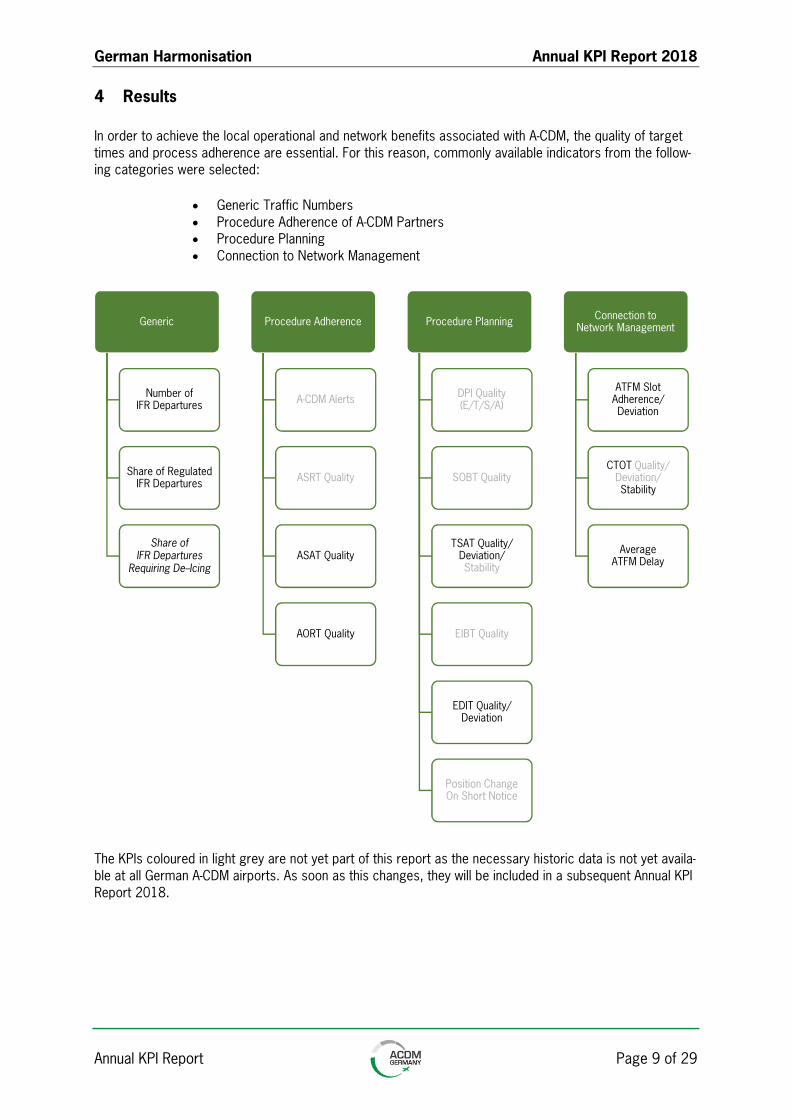
In order to achieve the local operational and network benefits associated with A-CDM, the quality of target times and process adherence are essential. For this reason, commonly available indicators from the follow-ing categories were selected:
Generic Traffic Numbers Procedure Adherence of A-CDM Partners Procedure Planning Connection to Network Management
The KPIs coloured in light grey are not yet part of this report as the necessary historic data is not yet availa-ble at all German A-CDM airports. As soon as this changes, they will be included in a subsequent Annual KPI Report 2018.
Generic
Number ofIFR Departures
Share of Regulated IFR Departures
Share ofIFR Departures
Requiring De--Icing
Procedure Adherence
A-CDM Alerts
ASRT Quality
ASAT Quality
AORT Quality
Procedure Planning
DPI Quality (E/T/S/A)
SOBT Quality
TSAT Quality/Deviation/Stability
EIBT Quality
EDIT Quality/Deviation
Position ChangeOn Short Notice
Connection toNetwork Management
ATFM Slot Adherence/Deviation
CTOT Quality/ Deviation/Stability
AverageATFM Delay
German Harmonisation Annual KPI Report 2018
Annual KPI Report Page 10 of 29
4.1 Generic
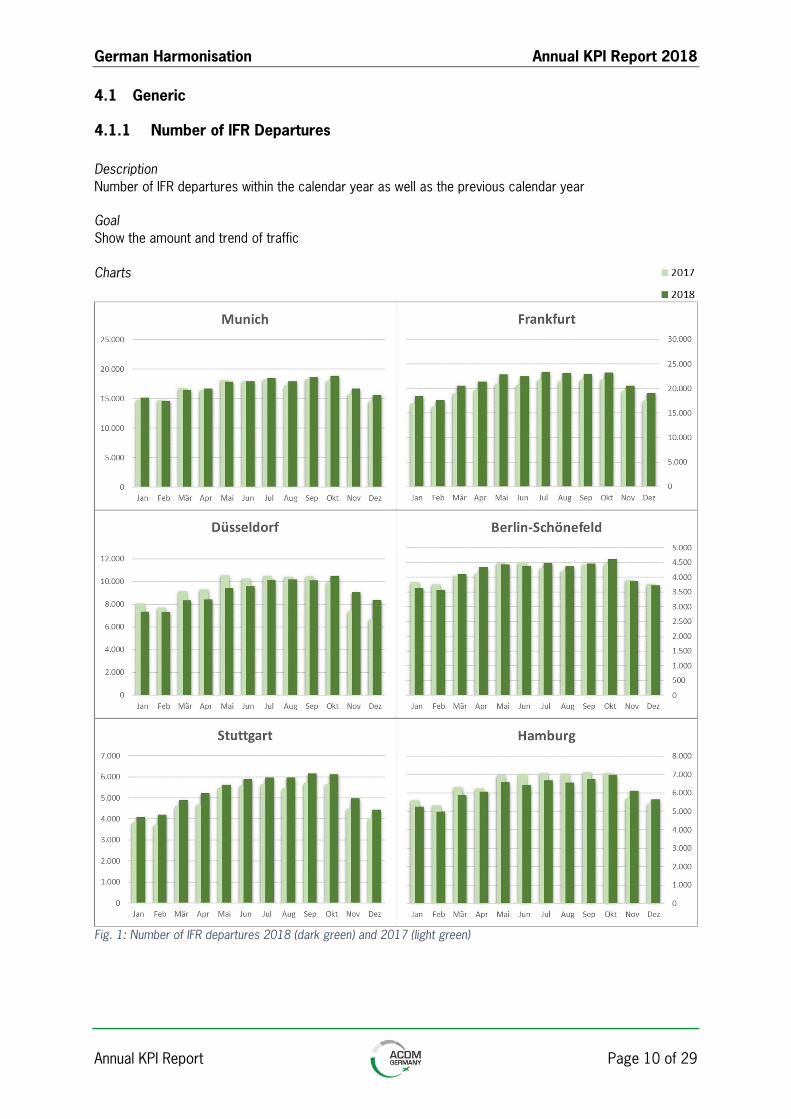
4.1.1 Number of IFR Departures
Description Number of IFR departures within the calendar year as well as the previous calendar year
Goal Show the amount and trend of traffic
Charts
Fig. 1: Number of IFR departures 2018 (dark green) and 2017 (light green)
German Harmonisation Annual KPI Report 2018
A
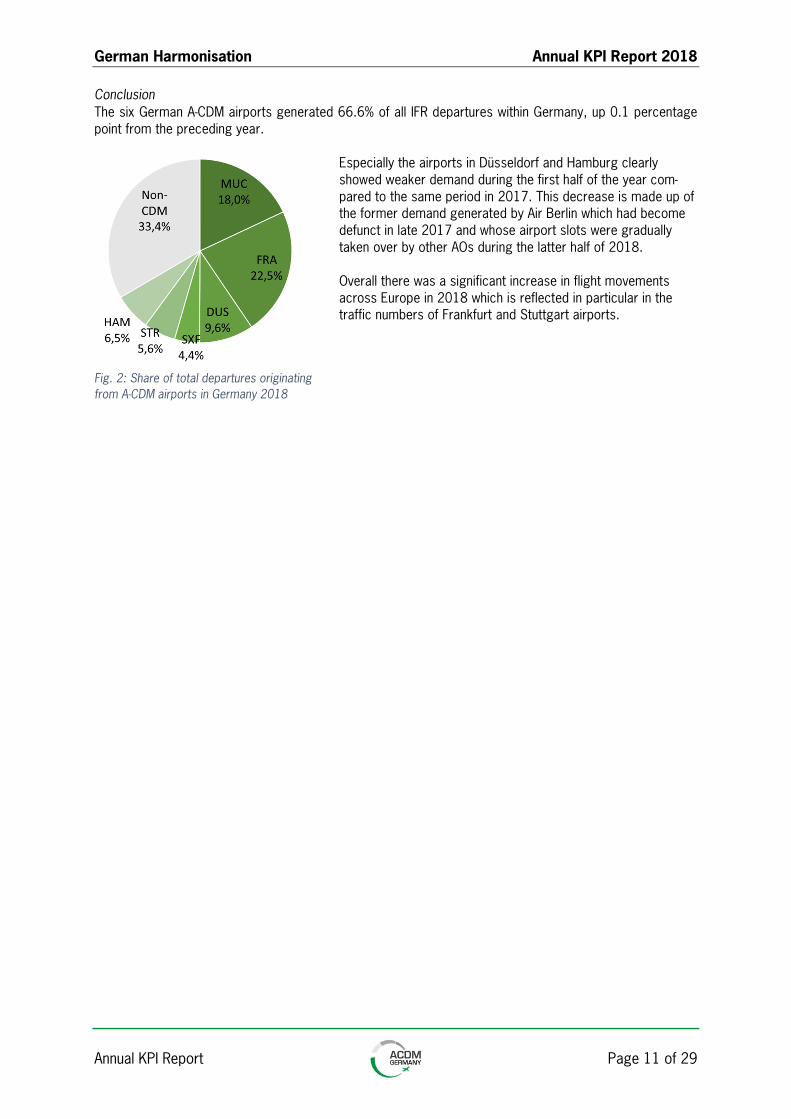
Conclusion The six German A-CDM airports generated 66.6% of all IFR departures within Germany, up 0.1 percentage point from the preceding year.
Especially the airports in Düsseldorf and Hamburg clearly showed weaker demand during the first half of the year com-pared to the same period in 2017. This decrease is made up of the former demand generated by Air Berlin which had become defunct in late 2017 and whose airport slots were gradually taken over by other AOs during the latter half of 2018.
Overall there was a significant increase in flight movements across Europe in 2018 which is reflected in particular in the traffic numbers of Frankfurt and Stuttgart airports.
Ff
ig. 2: Share of total departures originatingnnual KPI Report Page 11 of 29
rom A-CDM airports in Germany 2018
German Harmonisation Annual KPI Report 2018
Annual KPI Report Page 12 of 29
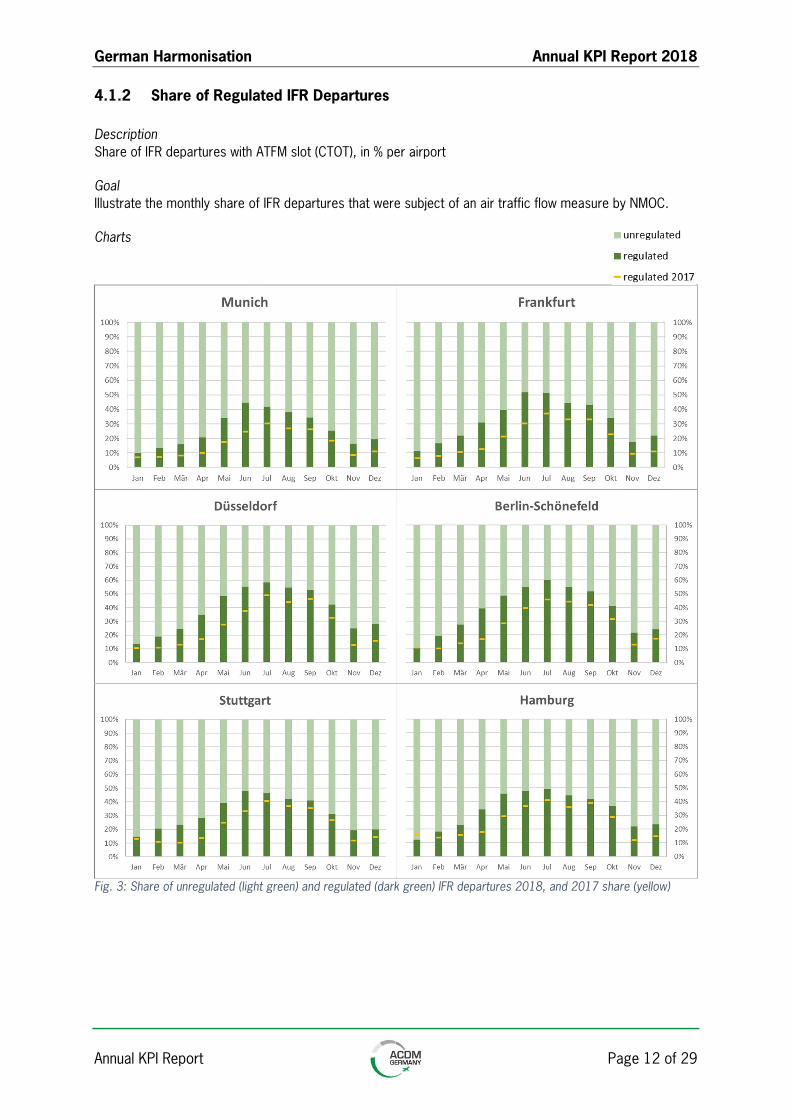
4.1.2 Share of Regulated IFR Departures
Description Share of IFR departures with ATFM slot (CTOT), in % per airport
Goal Illustrate the monthly share of IFR departures that were subject of an air traffic flow measure by NMOC.
Charts
Fig. 3: Share of unregulated (light green) and regulated (dark green) IFR departures 2018, and 2017 share (yellow)
German Harmonisation Annual KPI Report 2018
Annual KPI Report Page 13 of 29
Conclusion The number and share of regulated flights has once again increased when compared to the previ-ous year. Especially the spring months show relative increases of more than 100% when com-pared to the same months of 2017. Most airports also show a significant increase of regulated departures during the summer months, in fact during this period the average share of regulated departures was 50% or more.
The number of regulated departures is higher because there was also an increase in the number of regulations, their duration, or the degree of their limitation. The corresponding technical and operational interdependency also caused a disproportionate increase in the number of CTOT up-dates per regulated departure when compared to the previous year (see chapter 4.4.2).
The high volatility in regulations led to very dynamic target time calculations at German A-CDM air-ports which adversely affected ground processes. This observation was criticised by ground han-dling agents and other partners as handicapping operations.
With these massive adverse impacts on operations during the summer period of 2018 in mind, A-CDM Germany contacted the Network Manager and asked for measures to stabilize CTOT alloca-tion. Additionally, A-CDM Germany developed a set of technical and operational measures to opti-mise the data exchange with the Network Manager ahead of the summer season 2019 which is expected to bring yet another increase in the number of regulations and regulated flights. These measures are intended to reduce the part of CTOT dynamicity directly caused by DPI exchange which should stabilise the overall A-CDM process.
German Harmonisation Annual KPI Report 2018
Annual KPI Report Page 14 of 29
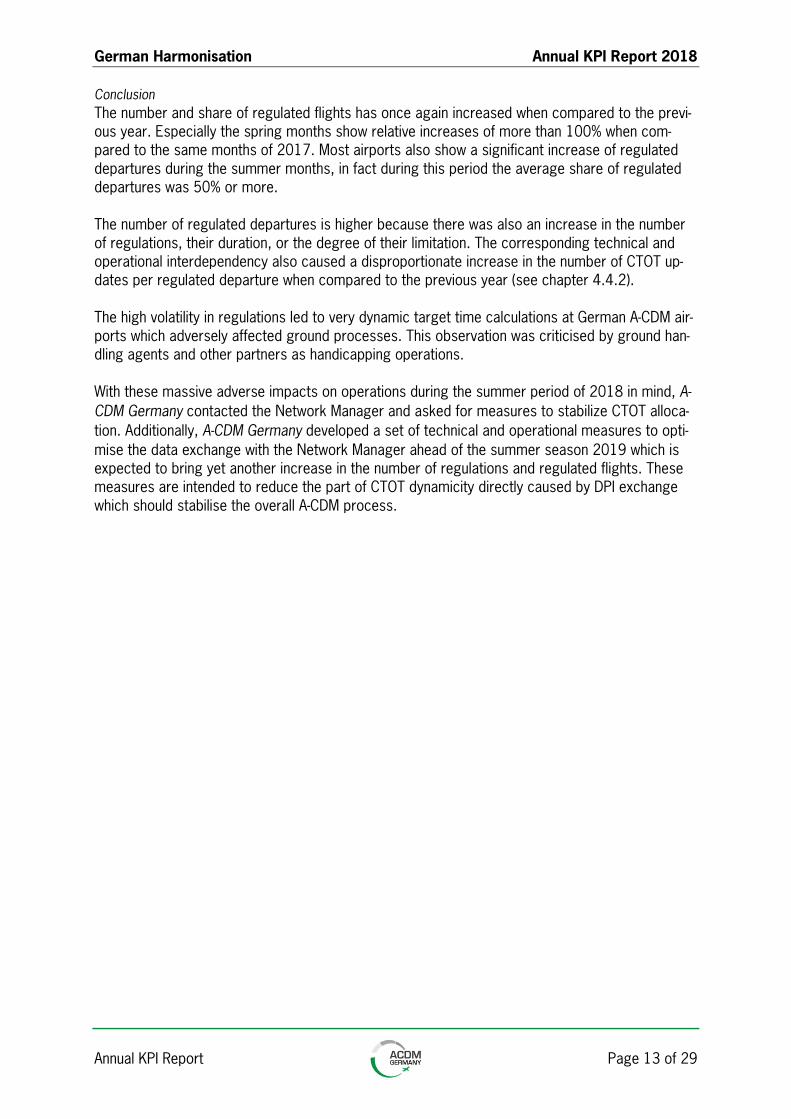
4.1.3 Share of IFR Departures Requiring De-Icing
Description Share of IFR departures that required aircraft de-icing, in % per airport
Goal Show the monthly share of IFR departures whose turnaround process was prolonged by de-icing.
Charts
Fig. 4: Share of IFR departures 2017 requiring aircraft de-icing on stand (dark green) and remotely (light green)
Conclusion This KPI provides context for further KPIs below (e.g. TSAT Quality). Most airports only do remote de-icing, i.e. on designated de-icing areas. In this case, de-icing takes place after TSAT. In the case of on-stand de-icing the flight are de-iced on their parking stands, i.e. after TOBT, but before TSAT. Planned de-icing begin and duration are included in the TSAT calculation.
German Harmonisation Annual KPI Report 2018
Annual KPI Report Page 15 of 29
4.2 Procedure Adherence
4.2.1 ASAT Quality
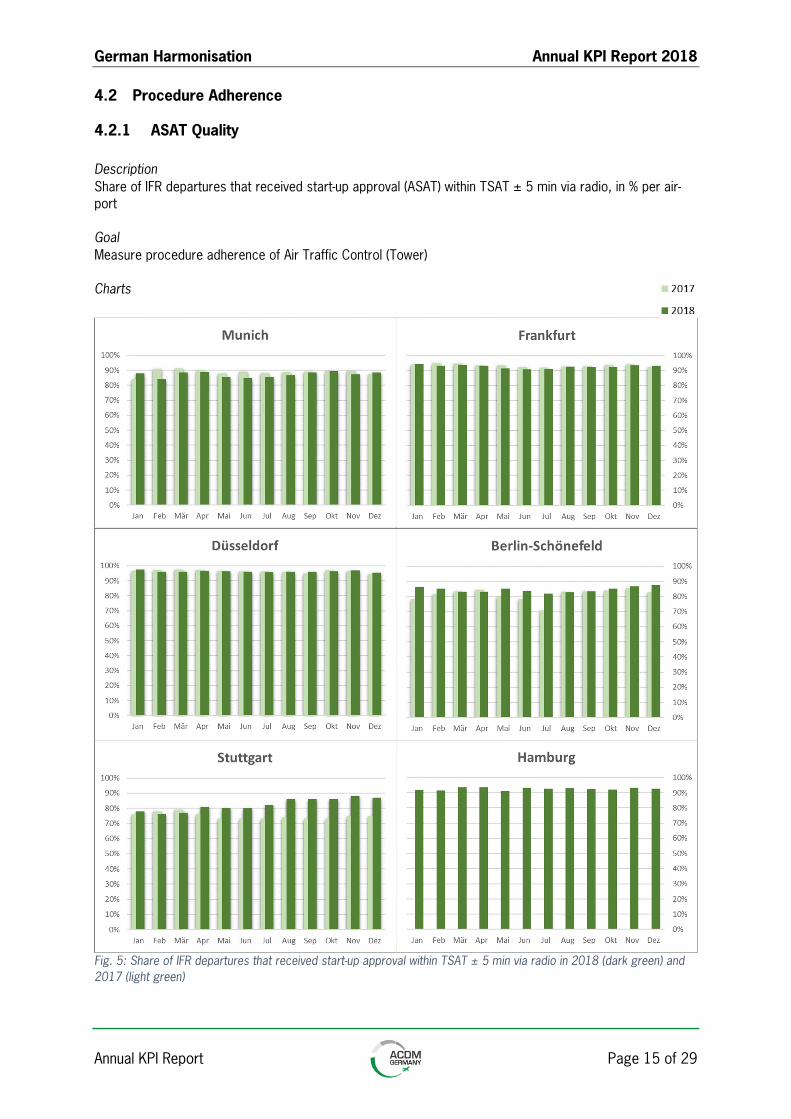
Description Share of IFR departures that received start-up approval (ASAT) within TSAT ± 5 min via radio, in % per air-port
Goal Measure procedure adherence of Air Traffic Control (Tower)
Charts
Fig. 5: Share of IFR departures that received start-up approval within TSAT ± 5 min via radio in 2018 (dark green) and 2017 (light green)
German Harmonisation Annual KPI Report 2018
Annual KPI Report Page 16 of 29
Conclusion Stuttgart airport showed a significantly increased procedure adherence due to the above-average traffic growth at Stuttgart Airport in conjunction with the high number of regulations. These factors raised aware-ness that procedure adherence should be high in order to achieve a fluent traffic flow within the single-run-way system.
Note o For Hamburg Airport no historical data is available regarding start-ups in 2017.
German Harmonisation Annual KPI Report 2018
Annual KPI Report Page 17 of 29
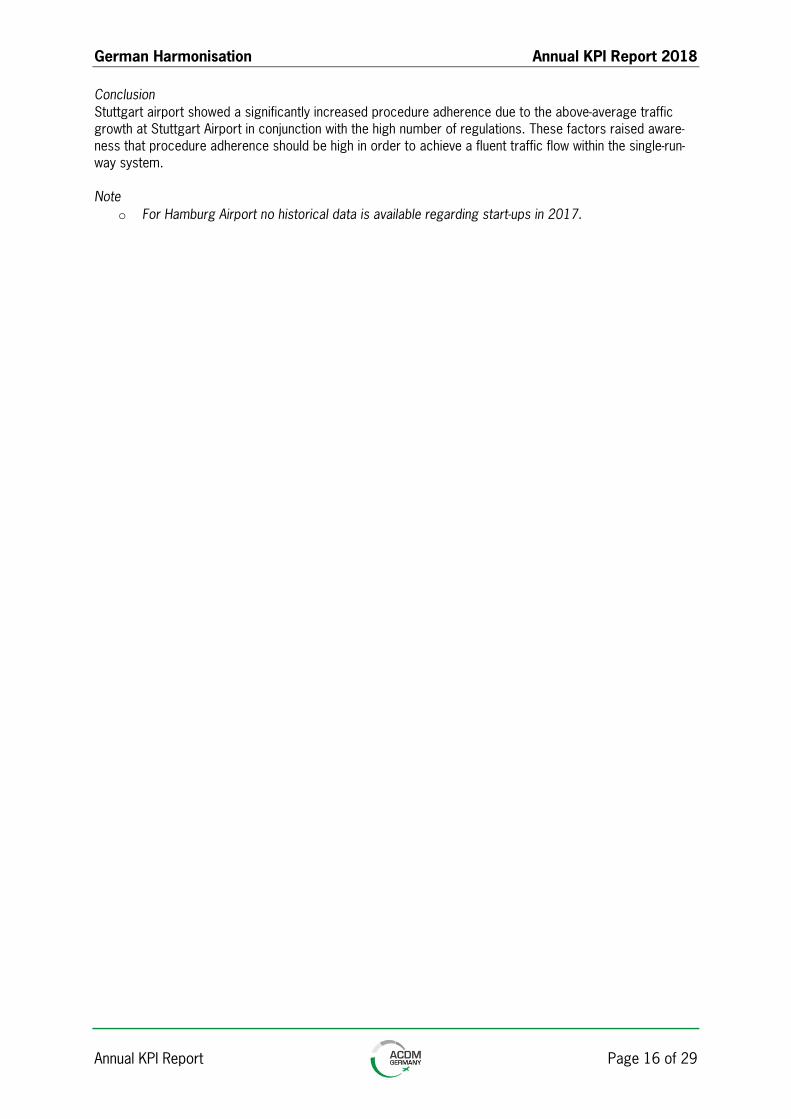
4.2.2 AORT Quality
Description Share of IFR departures that asked for their off-block clearance (AORT) within the window of
1. ASAT + 5 min (start-up via radio) 2. TSAT ± 5 min (start-up via datalink)
in % per airport
Goal Measure procedure adherence of the Flight Crew
Charts
Fig. 6: Share of IFR departures 2018 with conformant AORT (green) compared to 2017 (grey)

German Harmonisation Annual KPI Report 2018
Annual KPI Report Page 18 of 29
Conclusion AORT quality after start-up approvals via datalink is much lower in Frankfurt, Düsseldorf and Berlin-Schöne-feld than for start-up approvals via radio. Datalink clearances are often requested long before ground han-dling is actually finished, which makes later adherence to the TSAT tolerance less reliable as TSAT seems not immediately relevant. Requests via radio, however, mostly take place after ground handling is complete, which makes it more likely that off-block clearance is also requested soon thereafter. Excessively early start-up requests via radio are usually rejected which also positively impacts procedure adherence.
Notes o For Berlin-Schönefeld Airport no data is available regarding start-up using DCL. o For Hamburg Airport no historical data is available regarding start-ups in 2017.
German Harmonisation Annual KPI Report 2018
Annual KPI Report Page 19 of 29
4.3 Procedure Planning
4.3.1 TSAT Quality and Deviation
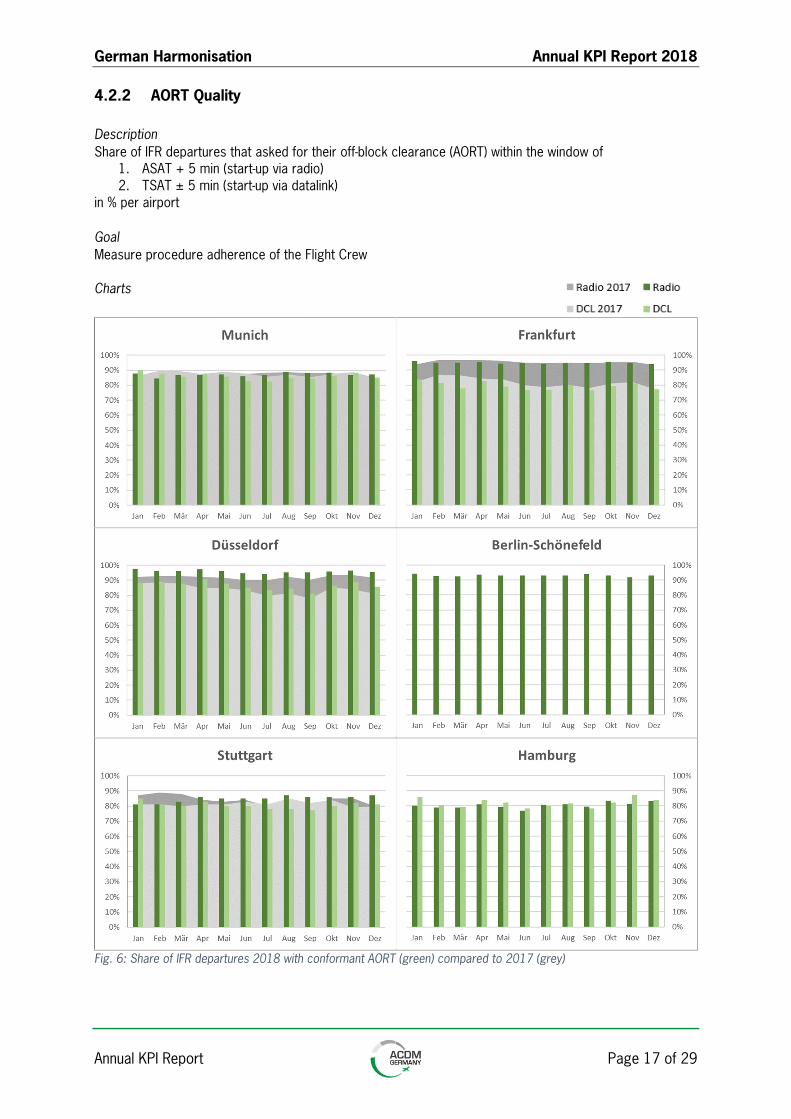
TSAT Quality
Description Monthly share of last TSATs that were equal to TOBT, in % per airport
Goal Operational adherence to planning on the day of operations.
Charts
Fig. 7: Share of regulated and unregulated IFR departures 2018 (green) and 2017 (grey) where last TSAT = TOBT
German Harmonisation Annual KPI Report 2018
Annual KPI Report Page 20 of 29
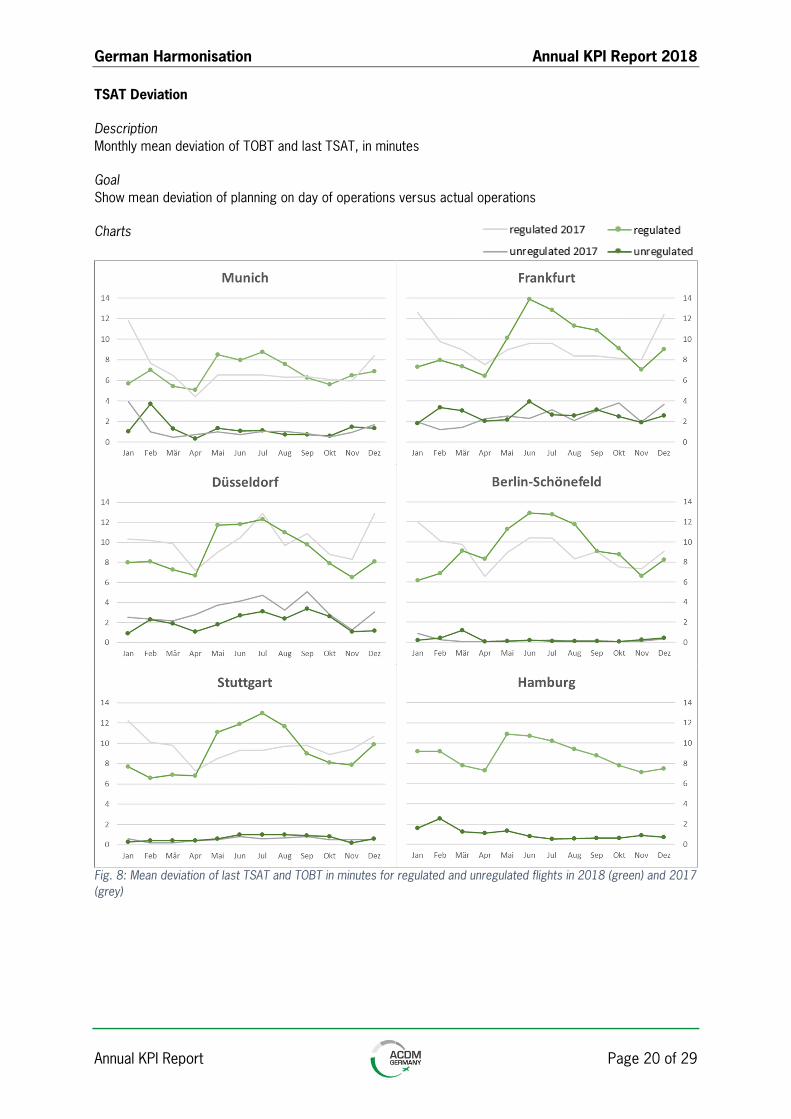
TSAT Deviation
Description Monthly mean deviation of TOBT and last TSAT, in minutes
Goal Show mean deviation of planning on day of operations versus actual operations
Charts
Fig. 8: Mean deviation of last TSAT and TOBT in minutes for regulated and unregulated flights in 2018 (green) and 2017 (grey)
German Harmonisation Annual KPI Report 2018
Annual KPI Report Page 21 of 29
Conclusion A low TSAT quality for unregulated flights indicates delays due to local capacity limitations at the airport. The TSAT of regulated flights is generally calculated based on CTOT, therefore TSAT quality correlates strongly with ATFM delay for these flights. Comparing TSAT deviation to ATFM delay, however, it becomes apparent that the latter value is slightly lower on average. Occasionally, TTOTs within T-DPI-target message updates are adjusted so they are not less than the clock time when the update is triggered. These adjust-ments affect the Network Manager’s ATFM delay calculation, slightly lowering the ATFM delay for that flight.
The numbers for Düsseldorf Airport display an improvement in both TSAT quality and deviation for unregu-lated flights compared to 2017, which can be explained by the lower number of flight movements in 2018. Saturated airports like Frankfurt show that high ATFM delays can also have an impact on the TSAT deviation of unregulated flights. In fact, a major share of TSAT deviations can either directly or indirectly be attributed to ATFM regulations.
German Harmonisation Annual KPI Report 2018
Annual KPI Report Page 22 of 29
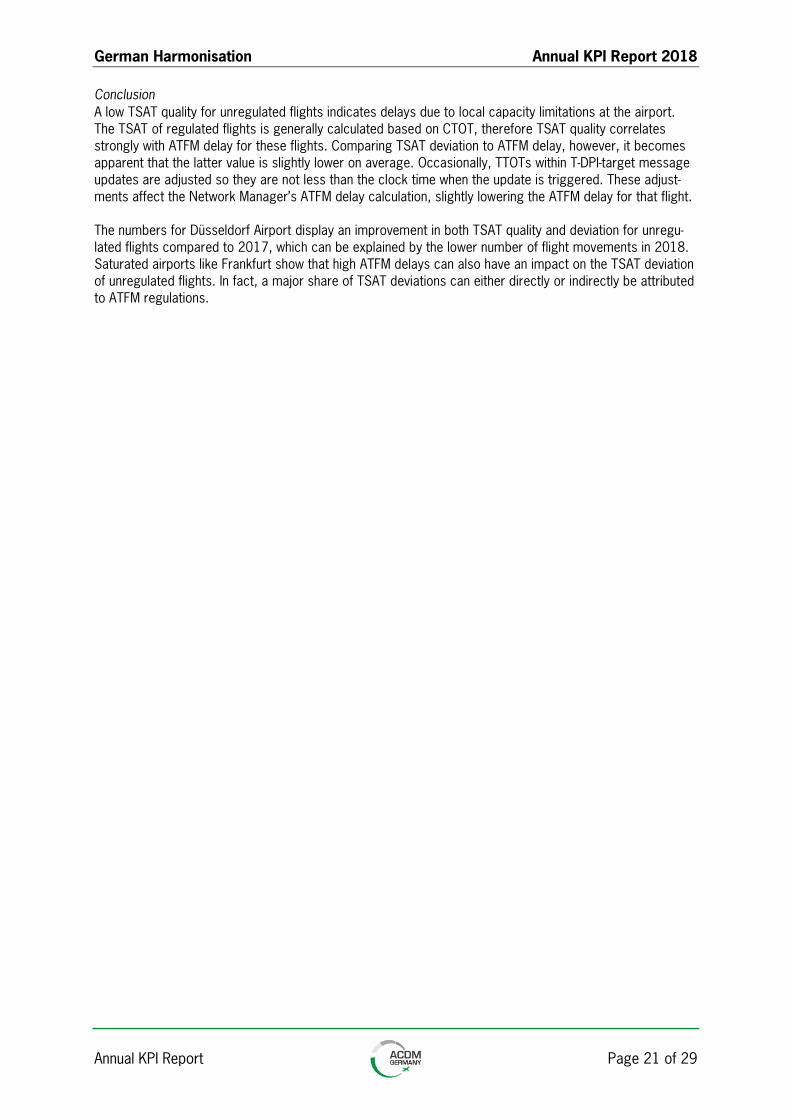
4.3.2 EDIT Quality and Deviation
EDIT Quality
Description Monthly share of IFR departures
1. with on-stand de-icing 2. with remote de-icing
whose EDIT was within ADIT ±3 min, in % per airport
Goal Verify the reliability of estimated de-icing duration as input parameter for A-CDM
Charts
Fig. 9: Percentage of flights with remote (light green) and on-stand de-icing (dark green) where EDIT = ADIT±3 min
German Harmonisation Annual KPI Report 2018
Annual KPI Report Page 23 of 29
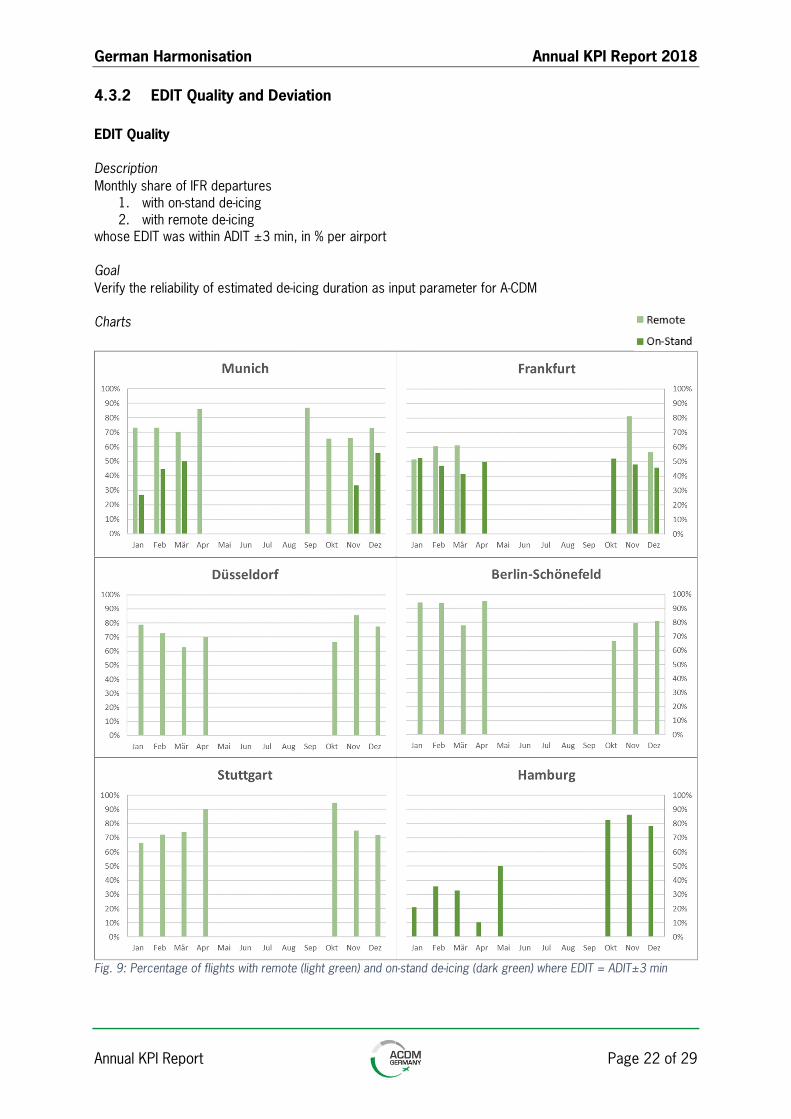
EDIT Deviation
Description Monthly mean deviation of ADIT and EDIT for IFR departures
1. with on-stand de-icing 2. with remote de-icing
in minutes per de-iced flight and airport
Goal Verify the accuracy of estimated de-icing duration as input parameter for A-CDM
Charts
Fig. 10: Mean deviation in minutes of EDIT and ADIT for on-stand (dark green) and remote de-icing (light green)
Conclusion EDIT quality for remote de-icing is generally higher as the process itself is less prone to disturbances and therefore easier to plan. On-stand de-icing performance depends on the location of the parking stand and activities on neighbouring areas which makes accurate EDIT predictions more difficult.
German Harmonisation Annual KPI Report 2018
Annual KPI Report Page 24 of 29
4.4 Connection to Network Management
4.4.1 ATFM Slot Adherence and Deviation
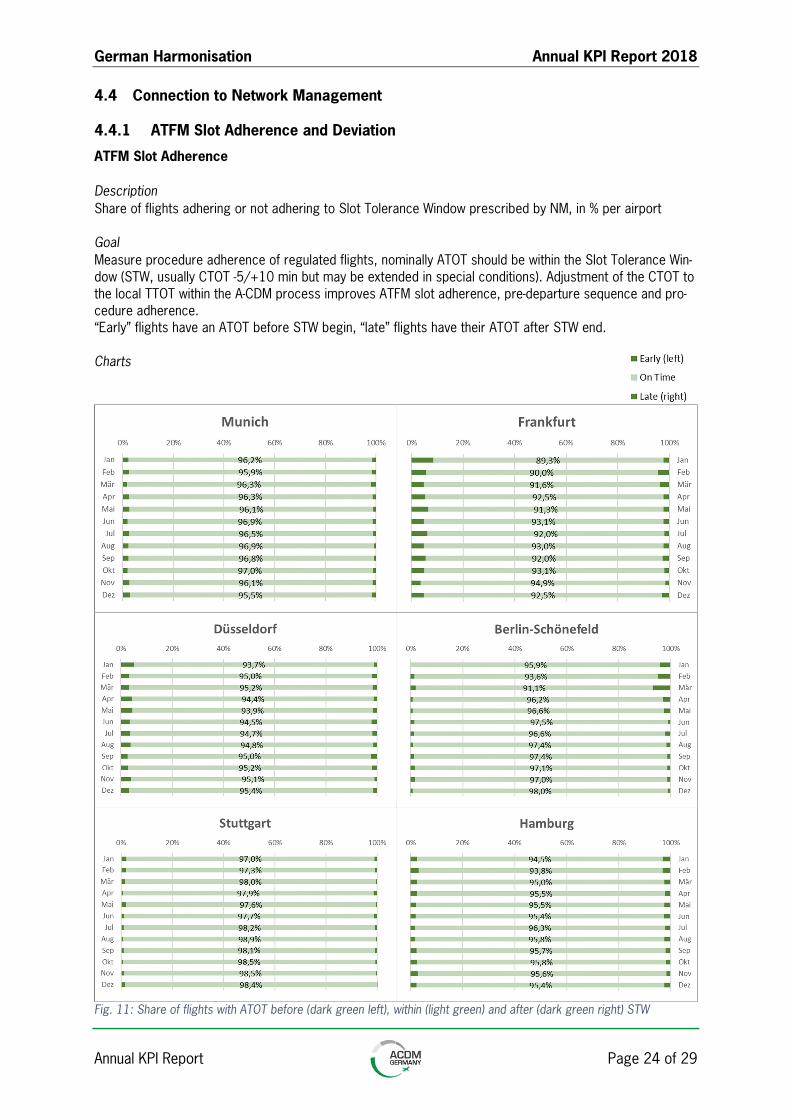
ATFM Slot Adherence
Description Share of flights adhering or not adhering to Slot Tolerance Window prescribed by NM, in % per airport
Goal Measure procedure adherence of regulated flights, nominally ATOT should be within the Slot Tolerance Win-dow (STW, usually CTOT -5/+10 min but may be extended in special conditions). Adjustment of the CTOT to the local TTOT within the A-CDM process improves ATFM slot adherence, pre-departure sequence and pro-cedure adherence. “Early” flights have an ATOT before STW begin, “late” flights have their ATOT after STW end.
Charts
Fig. 11: Share of flights with ATOT before (dark green left), within (light green) and after (dark green right) STW
German Harmonisation Annual KPI Report 2018
Annual KPI Report Page 25 of 29
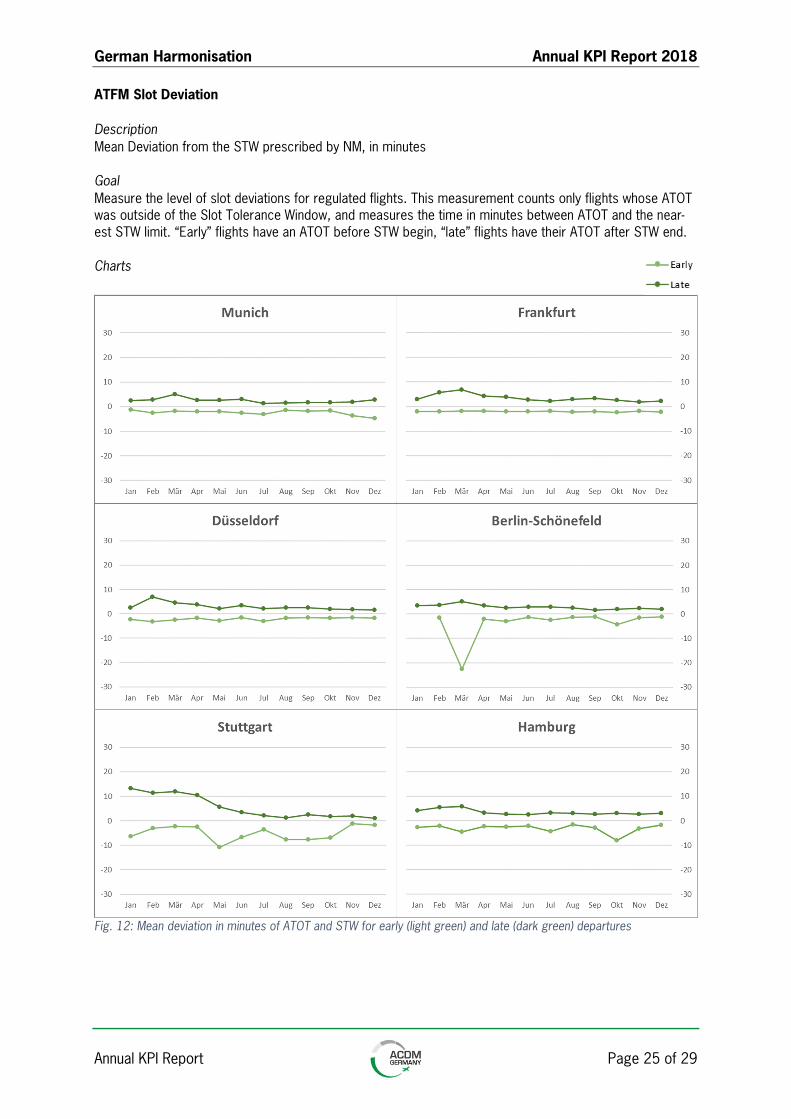
ATFM Slot Deviation
Description Mean Deviation from the STW prescribed by NM, in minutes
Goal Measure the level of slot deviations for regulated flights. This measurement counts only flights whose ATOT was outside of the Slot Tolerance Window, and measures the time in minutes between ATOT and the near-est STW limit. “Early” flights have an ATOT before STW begin, “late” flights have their ATOT after STW end.
Charts
Fig. 12: Mean deviation in minutes of ATOT and STW for early (light green) and late (dark green) departures
German Harmonisation Annual KPI Report 2018
Annual KPI Report Page 26 of 29
Conclusion ATFM slot adherence at German A-CDM airports is significantly above the European average. Despite the significant increase in the share of regulated departures ATFM slot adherence remains on a high level, espe-cially during the summer months it is even better than during the summer of the preceding year.
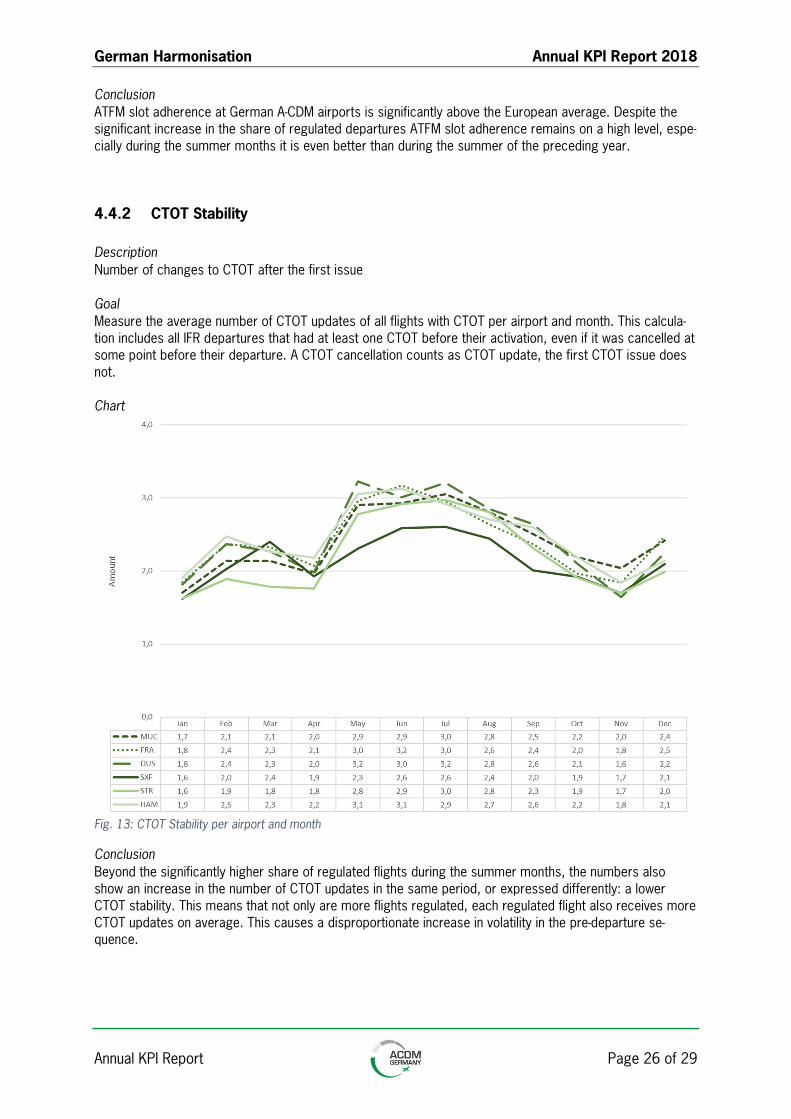
4.4.2 CTOT Stability
Description Number of changes to CTOT after the first issue
Goal Measure the average number of CTOT updates of all flights with CTOT per airport and month. This calcula-tion includes all IFR departures that had at least one CTOT before their activation, even if it was cancelled at some point before their departure. A CTOT cancellation counts as CTOT update, the first CTOT issue does not.
Chart
Fig. 13: CTOT Stability per airport and month
Conclusion Beyond the significantly higher share of regulated flights during the summer months, the numbers also show an increase in the number of CTOT updates in the same period, or expressed differently: a lower CTOT stability. This means that not only are more flights regulated, each regulated flight also receives more CTOT updates on average. This causes a disproportionate increase in volatility in the pre-departure se-quence.
German Harmonisation Annual KPI Report 2018
Annual KPI Report Page 27 of 29
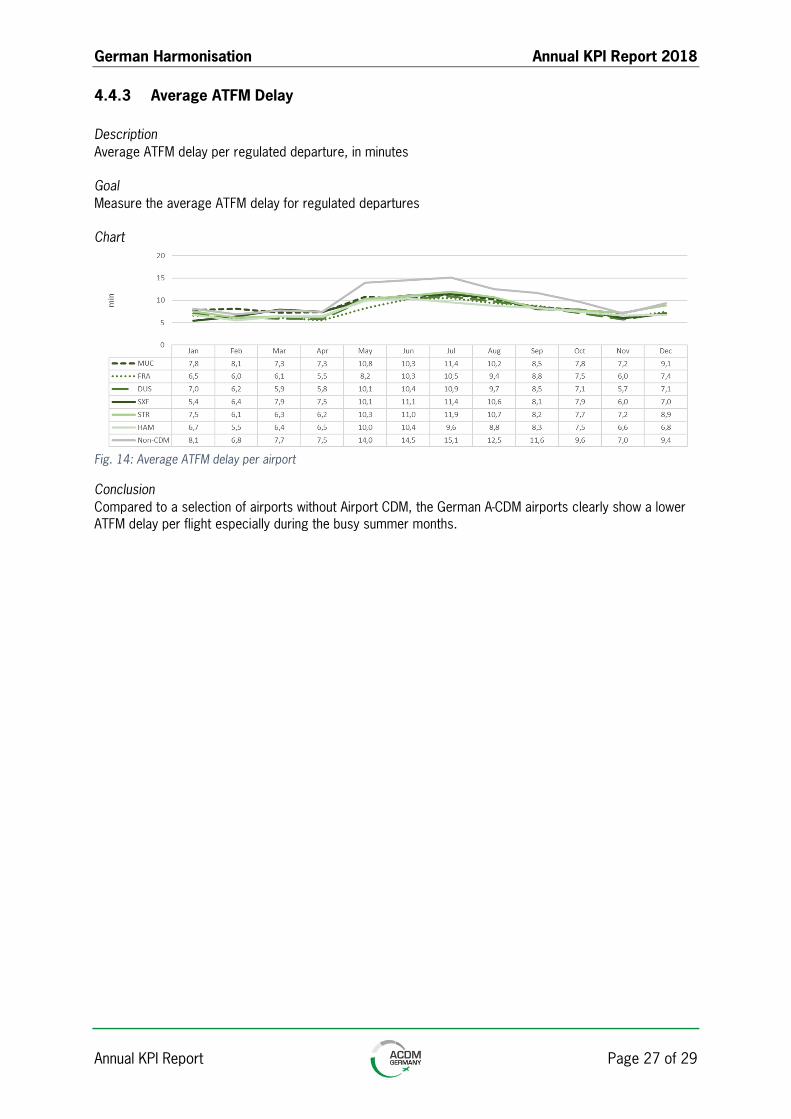
4.4.3 Average ATFM Delay
Description Average ATFM delay per regulated departure, in minutes
Goal Measure the average ATFM delay for regulated departures
Chart
Fig. 14: Average ATFM delay per airport
Conclusion Compared to a selection of airports without Airport CDM, the German A-CDM airports clearly show a lower ATFM delay per flight especially during the busy summer months.
German Harmonisation Annual KPI Report 2018
Annual KPI Report Page 28 of 29
5 Outlook
During the reporting year 2018, a higher traffic demand both locally and within the ATM Network has influ-enced the dynamics of target time calculation. Based on the available forecasts, this tendency will likely continue in the coming years.
To increase predictability within the Airport CDM process for all process partners, A-CDM Germany in 2018 developed harmonised approaches to dampen the dynamicity of target times within airport planning sys-tems. These will successively be implemented at the individual airports during 2019.
Due to strong interdependencies between the Network Manager’s systems and the applications at airports, local adjustments only have a limited effect. In order to effectively meet the growing imbalance between traffic demand and capacity, procedures and planning systems on both sides need to be developed further in collaboration. A-CDM Germany will develop concepts and measures and introduce them in the Network Manager’s international working groups.
This report shall be extended with further stability indicators in order to be able to judge the effectiveness of these measures. In particular, this applies to TSAT stability as well as other aspects of CTOT stability.
Regarding ASRT quality, DFS intends to release an updated version of its Tower Flight Plan Data Processing System that will allow a valid calculation of this indicator. The software update will successively be rolled out at all A-CDM airports. Once it is implemented, this indicator will then be added for the respective airport in this report.
German Harmonisation Annual KPI Report 2018
Annual KPI Report Page 29 of 29
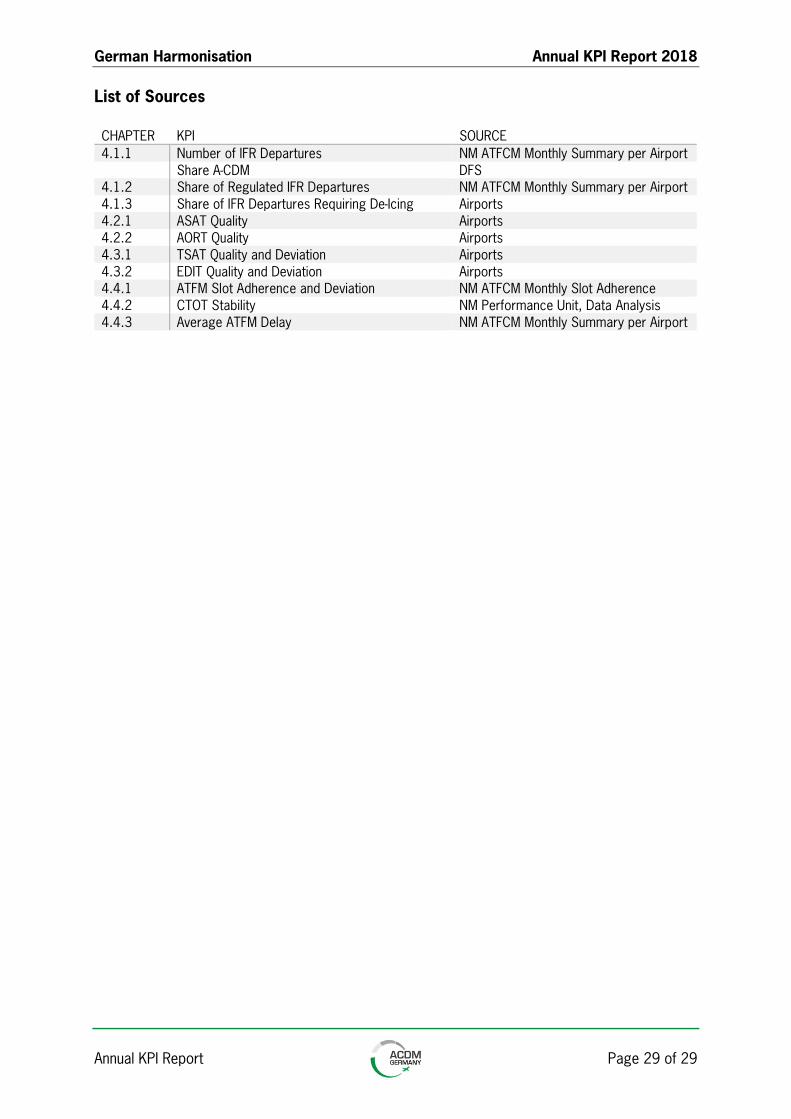
List of Sources
CHAPTER KPI SOURCE 4.1.1 Number of IFR Departures NM ATFCM Monthly Summary per Airport
Share A-CDM DFS 4.1.2 Share of Regulated IFR Departures NM ATFCM Monthly Summary per Airport 4.1.3 Share of IFR Departures Requiring De-Icing Airports 4.2.1 ASAT Quality Airports 4.2.2 AORT Quality Airports 4.3.1 TSAT Quality and Deviation Airports 4.3.2 EDIT Quality and Deviation Airports 4.4.1 ATFM Slot Adherence and Deviation NM ATFCM Monthly Slot Adherence 4.4.2 CTOT Stability NM Performance Unit, Data Analysis 4.4.3 Average ATFM Delay NM ATFCM Monthly Summary per Airport


