275


Business Case Study Executive Summary
Final ReportPage ES-1 kpmg
Executive SummaryThe State of Florida engaged KPMG to conduct the Modernization of State Government Financial
Management Business Practices Study (hereafter referred to as the “Business Case Study” or the
“Study”), which considered contemplated changes to the subsystems it refers to collectively as the
Florida Financial Management Information System (FFMIS). KPMG assessed the costs and risks as well
as the financial and other benefits that the State can expect from a new or enhanced financial
management system. The Study began August 2, 1999, and the final report was submitted February 15,
2000.
Background
For the past two decades, the State of Florida has accomplished its budgeting, cash management,
accounting, purchasing, payroll, and human resource functions using five stand-alone, stovepipe, legacy
management information systems. Although these FFMIS subsystems have been maintained and
incrementally upgraded, the State of Florida has neither modernized nor replaced the subsystems in a
structured and coordinated manner to meet its changing and growing needs. The five functional FFMIS
subsystems and their agency “owners” are identified in Exhibit ES-1:
Exhibit ES-1FFMIS Subsystem Owners
Function Name Owner
Accounting Florida Accounting Information Resource (FLAIR)Subsystem
Department of Banking and Finance
Human Resources Cooperative Personnel Employment Subsystem(COPES)
Department of Management Services
Purchasing Statewide Purchasing Subsystem (SPURS) Department of Management Services
Budgeting Legislative Appropriation System - Planning andBudgeting Subsystem (LAS/PBS)
Executive Office of the Governor
Cash Management Cash Management Subsystem (CMS) Department of Insurance, Treasuryand State Fire Marshal
Issues and concerns with the FFMIS subsystems, including the lack of integration and incomplete
reporting capabilities, have developed over the years since the system was implemented. After several
years of research and assessment, the State decided to pursue implementation of a commercial off-the-
shelf (COTS), Enterprise Resource Planning (ERP) system to support its core business functions. The
implementation of a purchased ERP system anticipated extensive reengineering of State agencies’
business processes to ensure that the benefits of the system would be realized.

Executive Summary Business Case Study
Final ReportPage ES-2 kpmg
In 1997, a pilot project was initiated to replace the State’s COPES and payroll portions of FLAIR with a
COTS solution. In 1998, SAP R/3 was selected as the ERP package for the State. After completing the
scoping and planning phases, the State discontinued the project in March 1999. The State was concerned
about escalating cost estimates and the ability of the system to meet the State’s functional and technical
requirements. The State was also concerned about the magnitude of the projected benefits associated
with continuing its ERP implementation.
Although the pilot project was discontinued, the need to enhance or replace the FFMIS subsystems was
still apparent. With the support of newly elected Governor Jeb Bush, the Florida Legislature passed
legislation in 1999 to carry out the Business Case Study.
Vision for FFMIS
A clearly defined vision is critical for making an important decision such as the one contemplated by the
Business Case Study. One of the first steps taken by KPMG in the Study was to understand the vision
that the State of Florida has for FFMIS. KPMG interviewed stakeholders of FFMIS in senior leadership
positions at the project inception and found that the State has a clear vision for its financial management
systems. The recurring themes that together constitute the State’s vision are summarized in Exhibit ES-2.
Exhibit ES–2Vision for FFMIS
Existing FFMIS
Departmental Focus
Stovepipe System Architecture
Extensive “Dumb Terminals” and “Green Screens”
Inconsistent Chart of Accounts
Limited Integrated Performance Data
Limited Contract Management and Tracking
No CFO Drives Financial Management
No Single Source Drives FFMIS Policy
Excessive Ad Hoc Reporting
Extensive Manual Reconciliations
Four Data Centers
Limited e-commerce
Rigid Financial Policies Embedded in Statute
Focus on Expensive Preventive Controls
Future FFMIS
Statewide Enterprise Focus
Integrated System Structure
Enhanced Desktop Capabilities
Consistent and Integrated Chart of Accounts
Enhanced Integrated Performance Data
Enhanced Contract Management Support System
CFO Drives Financial Management
CFO and Governor Drive FFMIS
Standard Management and Financial Reporting
Automated Reconciliations
Consolidated Data Center Support Structure
Fully Integrated e-commerce
Flexible Financial Policies Set by Administrative Rule
Focus on Employee Efficiency with Cost-Effective Detective Controls

Business Case Study Executive Summary
Final ReportPage ES-3 kpmg
Objectives
The Study focused on providing answers to three questions critical to making the State’s vision for
FFMIS a reality:
! What should the State do to modernize its financial management systems?
! How much will it cost?
! What benefits will the State receive?
KPMG worked closely with the State to meet its objectives while ensuring the integrity and objectivity of
the analysis. The State’s Project Management Team and State’s Study Advisory Council met regularly
with KPMG to promote open, ongoing communications and Study management.
Approach
KPMG organized the Study into three major tasks:
! Business Process Reengineering (BPR)
! Information Technology (IT) Assessment and Evaluation
! Evaluation of Options
Business Processing Reengineering Task
The Business Process Reengineering task focused on assessing the benefits the State could achieve by
changing its business processes. The benefits were primarily with technology but some non-technology-
dependent opportunities were also identified. A review of every business process in State government
was not feasible within the time constraints of the Study. With the help of the State Study Team and
Study Advisory Council, KPMG selected 16 processes for analysis. These processes are listed in Exhibit
ES-3. KPMG completed high-level documentation of current activities and processes, developed
recommendations for improving these processes, and determined the impacts of the recommendations on
the five system options described below in the IT Assessment and Evaluation Task.

Executive Summary Business Case Study
Final ReportPage ES-4 kpmg
Exhibit ES-3Processes Selected for Analysis
Management Reporting Purchasing Commodities and Services
Financial Reporting Payment for Goods and Services
Accounting Reconciliation Budgeting
Accounting for Payments from Multiple Accounts Rate and Position Administration
Allocation of Common Costs Certified Forward
Flow of Federal Funds Cash Receipts and Cash Management
Payroll Accounts Receivable
Travel Reimbursement Asset Management
KPMG also worked with the State Study Team and Study Advisory Council to identify and select a
representative sample of State agencies to participate in high-level process reengineering. The five
agencies selected were:
! Department of Transportation
! University of Florida
! Department of Highway Safety and Motor Vehicles
! Department of Children and Families
! Department of Insurance, Treasury and State Fire Marshal
The results of this high-level reengineering were extrapolated to the 49 Governor, Cabinet, Legislative,
and Judicial agencies in the State of Florida. The opportunities that KPMG identified included both
technology-dependent improvements as well as improvements that the State can implement without new
technology. Our recommendations included “hard” savings (budgetary) resulting from reduced operating
costs and “soft” savings (increased efficiency) resulting from reduced staff efforts that make time
available for other higher value activities.
IT Assessment and Evaluation Task
For the IT Assessment and Evaluation Task, KPMG performed the following:
! Assessed the existing system used by the State of Florida
! Defined the five system options identified by the State for evaluation in the Business Case Study.The five options are shown in Exhibit ES-4
! Developed system requirements for existing and future technologies to use in analyzing the fivesystem options
! Evaluated the five system options

Business Case Study Executive Summary
Final ReportPage ES-5 kpmg
Exhibit ES–4Financial System Options
Option 1 As-Is Maintain the current legacy systems as-is with no major modifications or upgrades
Option 2 Enhanced Enhance current systems by adding new tools and functionality
Option 3 Custom Develop a new custom integrated information management system
Option 4 COTS Implement a commercial off-the-shelf Enterprise Resource Planning package
Option 5 Best of Breed Use some combination of the other four options
KPMG analyzed the strategic, operational, technical, and financial impact of each alternative. The
evaluation included the advantages and disadvantages associated with each system option.
Evaluation of Options Task
For the Evaluation of Options Task, KPMG prepared a Total Cost of Ownership (TCO) estimate and a
Return on Investment (ROI) analysis for a period of 15 years. The financial analysis included cost
savings identified in the BPR Task and investments required as a result of the IT Assessment and
Evaluation Task. The ROI consisted of quantitative operational improvements for the State. KPMG
analyzed various financial metrics including net present value (NPV), internal rate of return (IRR), and
payback period.
Findings—BPR Analysis and IT Assessment and Evaluation
KPMG’s BPR analysis and IT assessment and evaluation resulted in a number of findings and
recommendations for both the State’s financial management practices and for the operational support
from the respective IT staffs.
Business Process Reengineering Findings
Our analysis of the processes selected for review in the Business Case Study revealed many opportunities
for budgetary savings and increased efficiency. Some of these opportunities are a result of the State not
having taken full advantage of technology to improve its processes. Other opportunities are not
technology driven.
In total, KPMG made 46 separate recommendations, which address major weaknesses with current
processes. Among the goals are improving customer service, reducing costs, and reducing cycle times.
The recommendations cluster around several themes as follows:
! Develop an enterprisewide perspective on State government financial operations
! Expand the functionality of the financial management system

Executive Summary Business Case Study
Final ReportPage ES-6 kpmg
! Automate manual steps and reduce excess paper
! Provide better financial management information for more cost-effective decisions
! Increase the use of e-commerce
! Update and modernize policies and procedures
A sample of BPR recommendations from the Study is shown in Exhibit ES-5.
Exhibit ES-5Sample BPR Recommendations
Payroll (BPR–18) Move to a shared services concept by having severalagencies served by a single payroll unit $2,016,000
Purchasing (BPR–31) Enhance the central purchasing function at Stateagencies and DMS to focus on strategic sourcing
10,700,000
Cash Receipts andCash Management(BPR-39)
Terminate the certificate of deposit program aimed atFlorida banks and S&Ls and transfer funds to theexternally managed program
11,679,000
Cash Receipts andCash Management(BPR-40)
Reduce funds in the internal investment liquidity pooland transfer them to the externally managed funds
10,000,000
The estimated annual fiscal impact of all BPR recommendations is presented by option in Exhibit ES-6.
Exhibit ES-6Summary of Fiscal Impacts by Option
OptionsBudgetary
SavingsIncreasedEfficiency Total BPR savings
Option 1 $23,691,000 $1,707,000 $25,398,000
Option 2 60,219,000 3,159,000 63,378,000
Option 3 90,776,000 6,193,000 96,969,000
Option 4 90,776,000 6,193,000 96,969,000
Option 5 90,776,000 6,193,000 96,969,000

Business Case Study Executive Summary
Final ReportPage ES-7 kpmg
IT Assessment and Evaluation Findings
KPMG found that the current FFMIS subsystems will not support the vision that the State has for its
financial management systems. The overarching concerns about Florida’s existing subsystems are shown
in Exhibit ES–7.
Exhibit ES–7Findings on Existing FFMIS Subsystems
1 Florida has created stovepipe data and technical architectural models.
2 FFMIS subsystems do not provide adequate decision-support information and functionality, resulting innumerous shadow and feeder systems.
3 Significant staffing resources are dedicated to ensuring consistency among the five FFMIS subsystems inthe form of duplicate data entry, data redundancy, and data reconciliations.
4 FFMIS processing, application, and help desk support occurs in four distinct IT organizations.
5 The lack of a unified, standard Chart of Accounts makes aggregating information across agencies extremelydifficult without extensive manual effort.
6 FFMIS subsystems are difficult, time consuming, and expensive to modify.
7 Existing State personnel policies and funding processes inhibit the recruitment and retention of skilledemployees required to support FFMIS technology.
8 FFMIS makes limited use of e-commerce.
Surveys conducted during the Study indicated that most users do not believe FFMIS can support the
future business needs of the State of Florida. Users also expressed dissatisfaction with the current
functionality in FFMIS. Targeted improvement areas from the users’ perspective focused on:
! Integration
! System flexibility
! Ad hoc reporting capabilities
! Ease of use
! Training
! Help facilities

Executive Summary Business Case Study
Final ReportPage ES-8 kpmg
Findings—Evaluation of Options
KPMG’s evaluation of the five FFMIS options covered three key areas: ability to satisfy requirements,
risks, and financial considerations.
Requirements Assessment
KPMG considered the ability of each option to meet approximately 1,500 functional and technical
requirements, which were defined for FFMIS by KPMG and State personnel. Exhibit ES-8 summarizes
the results of our requirements assessment for each option. The maximum score available was five
points. Higher scores indicate that the option is better able to meet the State’s functional and technical
requirements.
Exhibit ES-8Summary of Requirements Assessment
Category Wei
gh
tP
erce
nta
ge
As-
Is
En
han
ced
Cu
sto
m
CO
TS
Bes
t o
f B
reed
Total Functional Score 70% 1.5 2.3 3.5 2.9 3.4
Total Technical Score 30% 0.5 0.8 1.4 1.4 1.3
TOTAL SCORE 100% 2.0 3.1 4.9 4.3 4.7
As the scores indicate, a Custom solution will best meet the State’s functional and technical requirements
because it is possible with the right amount of resources and time to build exactly what the State needs.
The COTS and Best of Breed solutions can satisfy most of the State’s requirements while the As-Is and
Enhanced options fall short of meeting many of the State’s requirements.
Risk Assessment
KPMG considered the strategic, project, and continuation risk to the State for each of the options.
Exhibit ES-9 summarizes our assessment of each risk category. (Note: Lower scores indicate less risk.)

Business Case Study Executive Summary
Final ReportPage ES-9 kpmg
Exhibit ES-9Summary of Risk Assessment
Category Wei
gh
tP
erce
nta
ge
As-
Is
En
han
ced
Cu
sto
m
CO
TS
Bes
t o
f B
reed
Total Strategic Risk/Weighted Average 100% 4.8 2.8 1.3 1.2 1.3
Total Project Risk/Weighted Average 100% 0.0 2.1 4.5 3.2 3.3
Total Continuation Risk/Weighted Average 100% 3.8 3.6 3.1 2.3 2.8
Total All Risk Categories/Weighted Average 2.9 2.8 3.0 2.2 2.5
The risk analysis indicates that a Custom solution exposes the State to the greatest degree of risk. The
COTS and Best of Breed options provide the least exposure to risk.
Financial Assessment
KPMG considered the BPR savings net of the risk-adjusted implementation and ongoing operational
costs over a 15-year period for each option. In addition, financial metrics such as NPV (based on a
discount rate of 6 percent), IRR, and payback period were considered. Exhibit ES-10 summarizes the
financial impact of each option.

Executive Summary Business Case Study
Final ReportPage ES-10 kpmg
Exhibit ES-10Summary of Financial Assessment(dollar amounts are in thousands)
Options As-Is Enhanced Custom COTSBest ofBreed
Implementation Costs $ 0 $(119,222) $(563,745) $(257,960) $(281,327)
Operations Costs $(396,328) (402,065) (216,392) (277,548) (316,317)
Technology-related BPR
Savings 0 478,471 798,797 956,113 956,113
Net Fiscal Impact (Technology
Savings Only) (396,328) (42,816) 18,660 420,605 358,469
NPV on Net Savings
(Technology Savings Only) (250,806) (96,638) (166,387) 133,770 92,965
Internal Rate of Return N/A (2%) (1%) 12% 10%
Years to Payback N/A N/A 15 Years 10 Years 11 Years
Nontechnology-Related
BPR Savings 467,922 467,922 467,922 467,922 467,922
Net Fiscal Impact
(All Recommendations) $71,594 $425,106 $486,582 $888,527 $826,391
Recommendation
After comparing the five system options to the State’s vision and functional and technical requirements,
and after assessing the risk and financial impacts, KPMG believes, as shown in Exhibit ES-11, that the
Best of Breed option is the optimum choice for the State’s financial management information system.
Exhibit ES-11Minimum Requirements Analysis Ratings
(dollar amounts are in thousands)
Functionality Financial
RawScore
WeightedScore
Raw Savings(Cost)
WeightedScore Total
Option A B A + B
As-Is 2.00 40 $(396,328) - 40
Enhanced 3.10 62 (42,816) 24 86
Custom 4.90 98 18,660 28 126
COTS 4.30 86 420,606 50 136
Best of Breed 4.70 94 358,469 46 140

Business Case Study Executive Summary
Final ReportPage ES-11 kpmg
The Best of Breed option KPMG recommends would:
! Use an ERP system to replace the State’s accounting and personnel systems
! Use an ERP system to partially replace the budgeting, cash management, and purchasingsubsystems
! Allow dual-tracks for the SUS and the remainder of State government
As documented in our analysis, ERP packages (at the time of evaluation) are generally weak in certain
key areas, such as supporting the legislative approval of budget issues, supporting a web-enabled vendor
bid management system, and complying with Florida’s unique cash management practices. Accordingly,
the portions of those subsystems not replaced with an ERP system would continue to be supported by
State-developed software that would interface with the ERP solution.
In addition, the student administration systems used by the State University System (SUS) are
sufficiently self-contained and have unique requirements that must be met by the SUS Financial
Management System. If the student administration system drove the selection of an ERP package, it
could lead to selecting an ERP vendor that may not be best for the rest of State government and vice
versa. Recognizing the important differences between general government and Florida’s higher education
system, the recommendation enables a dual track software selection and implementation strategy to
accommodate, but not require, separate software packages for the State University System and the
remainder of State government. If this approach is taken, the systems would need to interface to provide
statewide management information.
KPMG believes that the Best of Breed option is the optimum practical solution to meet the functionality
required by the State of Florida. With this option, the State would be able to blend the best practices of
the industry with that of the State wherever the off-the-shelf solution does not meet a requirement.
Although KPMG recommends enhancements to the ERP solution in some specific areas, we suggest that
the State exercise care when evaluating enhancements and consider the effect that those enhancements
have on future upgrades.
To reduce the project risk of this effort, KPMG recommends that a dedicated project management office
be established—one that is consistent with the State's vision, focuses on delivering a quality product, and
is sensitive to producing a timely solution. KPMG also recommends that the Executive Office of the
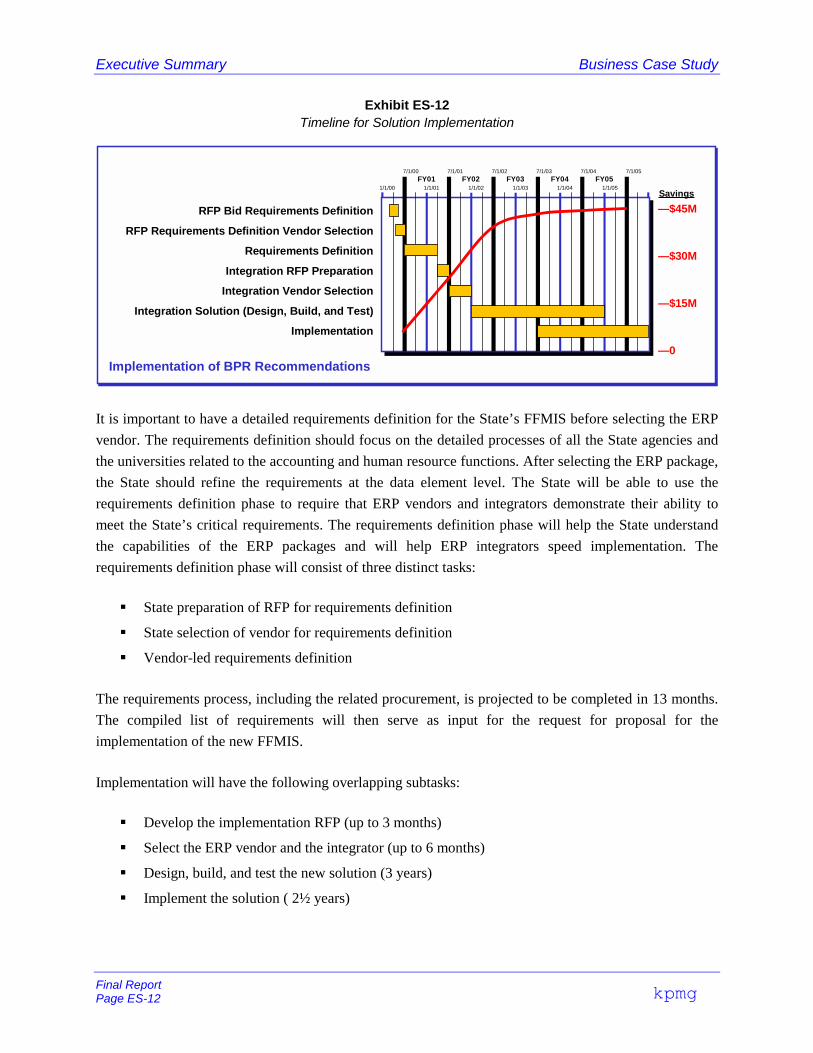
Governor take ownership of the project. Exhibit ES-12 illustrates a timeline for the implementation of the
integrated solution. We have overlaid a line on the chart to graphically represent the estimated savings
from the State’s implementation of recommendations prior to the full system implementation.
Executive Summary Business Case Study
Final ReportPage ES-12 kpmg
Exhibit ES-12Timeline for Solution Implementation
RFP Bid Requirements Definition
RFP Requirements Definition Vendor Selection
Requirements Definition
Integration RFP Preparation
Integration Vendor Selection
Integration Solution (Design, Build, and Test)
Implementation
Implementation of BPR Recommendations
1/1/00 1/1/01 1/1/02 1/1/03 1/1/04 1/1/05
7/1/00 7/1/01 7/1/02 7/1/03 7/1/04 7/1/05
FY01 FY02 FY03 FY04 FY05
Savings
—$45M
—$30M
—$15M
—0
It is important to have a detailed requirements definition for the State’s FFMIS before selecting the ERP
vendor. The requirements definition should focus on the detailed processes of all the State agencies and
the universities related to the accounting and human resource functions. After selecting the ERP package,
the State should refine the requirements at the data element level. The State will be able to use the
requirements definition phase to require that ERP vendors and integrators demonstrate their ability to
meet the State’s critical requirements. The requirements definition phase will help the State understand
the capabilities of the ERP packages and will help ERP integrators speed implementation. The
requirements definition phase will consist of three distinct tasks:
! State preparation of RFP for requirements definition
! State selection of vendor for requirements definition
! Vendor-led requirements definition
The requirements process, including the related procurement, is projected to be completed in 13 months.
The compiled list of requirements will then serve as input for the request for proposal for the
implementation of the new FFMIS.
Implementation will have the following overlapping subtasks:
! Develop the implementation RFP (up to 3 months)
! Select the ERP vendor and the integrator (up to 6 months)
! Design, build, and test the new solution (3 years)
! Implement the solution ( 2½ years)

Business Case Study Executive Summary
Final ReportPage ES-13 kpmg
The implementation process is projected to require approximately 4 years to complete. For simplicity, we
assumed that accounting and human resource modules of the chosen ERP vendor will be built once and
will be implemented in phases. With this approach, implementation for the initial phase of agencies will
begin in 3½ years. With proper planning, control, and approval, the State could begin implementing the
solution in selected agencies 6 to 9 months earlier than presented in our timeline. Thus, implementation
in the first agencies could be completed in less than 3 years.

Executive Summary Business Case Study
Final ReportPage ES-14 kpmg
This page intentionally left blank

Business Case Study 1—Objectives and Approach
Final ReportPage 1-1 kpmg
1. Objectives and Approach1.1 Objectives
The State of Florida’s objectives in the Modernization of State Government Financial Management
Business Practices Study are:
To develop a business case study for enhancing or replacing the State’s current financial
management systems while simultaneously changing the State’s associated financial
management business practices.
The decisions that Florida must make based on this Study are both significant (in dollars and time to
implement) and complex (in the number of agencies and processes it impacts). Furthermore, these
decisions will receive extensive scrutiny by both internal and external stakeholders of the State. The
underlying analysis governing this Study must be widely viewed as independent and objective. In reality,
the future of the Florida Financial Management Information System (FFMIS) modernization rests on this
Study’s credibility.
KPMG worked closely with the State’s leaders to meet their objectives while ensuring the integrity and
objectivity of this analysis:
! The State and KPMG agreed up front on the Study’s approaches and methodologies
! The State’s Project Management Team and Advisory Council met regularly with the KPMGStudy Team to promote open, ongoing communications and study management
! The Study effort was organized to provide decision-useful results
1.2 Business Case Study Approach
To achieve the State’s objectives, KPMG conducted a Business Case Study to provide a recommendation
for reengineering selected State business processes in tandem with enhancing or replacing the State’s
current financial management systems. Our recommendations are based on a comprehensive assessment
of costs and benefits and include a strategy for rollout and funding, an estimate for the time to implement,
and direction on system ownership.

1—Objectives and Approach Business Case Study
Final ReportPage 1-2 kpmg
The Study compares five options identified by the State as shown in Exhibit 1-1.
Exhibit 1-1Options
Option 1 As-Is Maintain the current systems as-is with no major modifications or upgrades
Option 2 Enhanced Enhance current systems by adding new tools and functionality
Option 3 Custom Develop a new custom integrated information management system
Option 4 COTS Implement a commercial off-the-shelf Enterprise Resource Planning package
Option 5 Best of Breed Use some combination of the other four options
KPMG considered the strategic, operational, technical, and financial impacts of the five options and
prepared a 15-year total cost of ownership (TCO) estimate and a return on investment (ROI) analysis.
We organized the Study into seven tasks as shown in Exhibit 1-2.
Exhibit 1-2KPMG Approach
BusinessProcess
ReengineeringTask 3
IT Assessmentand
EvaluationTask 4
Evaluationof
OptionsTask 5
FinalizeBCS
MethodologyTask 2
InitiateStudy
Task 1
PrepareFinal
ReportTask 8
Finalize BCSand Prepare
RecommendationTask 7
DraftInterimReportTask 6
Our amended timeline for the Study is presented in Exhibit 1-3.

Business Case Study 1—Objectives and Approach
Final ReportPage 1-3 kpmg
Exhibit 1-3Amended Timeline
1. Initiate Study
2. Finalize Business Case Study Methodology
3. Conduct BPR Assessment
4. Evaluate System Options
5. Conduct Business Case Study
6. Brief Steering Committee
7. Finalize BCS and Prepare Recommendations
8. Prepare Final Report
BIWEEKLY STATUS REPORTS
Kick Off Meeting August 2, 1999
Report on PreliminaryAnalysis and Results
October 15, 1999
Draft Final ReportJanuary 21, 2000
Final Report withRecommendationsFebruary 15, 2000
Up to 3 Briefingsas requested
Presentation to Senior State Officials
December 15, 1999
To evaluate the five options, we organized the Study into three major components grouped in the center
of Exhibit 1-2:
! Business Process Reengineering (BPR)
! Information Technology (IT) Assessment and Evaluation
! Evaluation of Options
After initiating the Study, KPMG met with the State management representatives to finalize the Study
methodology and assumptions. Our experience has shown that it is critical for KPMG and the State’s
Study Management Team to reach consensus on key issues that will influence the success of this project.
During the Finalize BCS Methodology Task, we reached consensus on the methodologies and approaches
for the BPR, IT Assessment and Evaluation, and Evaluation of Options tasks. This included determining
the processes to be modeled, specific agencies to be evaluated, and agreements on various financial and
operational criteria and assumptions. This task provided the basis for the activities to be performed in
Tasks 3, 4, and 5. We made numerous data and record requests on which to base our analysis. A list of the
documents and key information reviewed is included in Appendix E.

1—Objectives and Approach Business Case Study
Final ReportPage 1-4 kpmg
For the BPR Task, KPMG:
! Reviewed the State’s goals and underlying business strategies
! Developed a high-level process flow model of 15 selected business processes
! Identified opportunities for improvements in the current performance of selected businessfunctions, processes, overall business process integration, and the Chart of Accounts used by thefive FFMIS subsystems
! Quantified the current performance of selected business processes and compared them to thereengineering improvements
! Made recommendations for business process reengineering
! Determined the strategic impact and economic benefits of selected business processimprovements
! Coordinated the business process reengineering with the evaluation of system options
For the IT Assessment and Evaluation Task, KPMG evaluated the five options, in three steps:
! Assessed the existing FFMIS
! Developed system requirements including existing and future technologies for our analysis of thefive system options
! Defined the five options for which we prepared implementation cost estimates and operationalcost estimates
For the Evaluation of Options Task, KPMG prepared a TCO estimate and a ROI analysis for an average
5-year implementation period and an average 10-year operational period. The TCO estimate for each
option included the following cost factors:
! Required hardware (that is, production, testing, training, and user “sandbox”)
! Software (system software and utilities, core application software, and applicable third-partysoftware)
! Database
! Network and connectivity requirements
! Desktop
! Peripherals
! Interfaces
! Hardware and software maintenance
! State staff (that is, project management team, core project team, technical team, and users)

Business Case Study 1—Objectives and Approach
Final ReportPage 1-5 kpmg
! Consultants (that is, process reengineering, common data conversion, system configuration, andimplementation)
! Training
! Operations support (that is, technical and help desk support)
! Overhead allocations
KPMG analyzed the TCO during the following stages, as applicable to each option:
! Planning—Costs to develop the To-Be vision and detailed requirements
! Evaluation—Costs incurred in the selection process for the application software, hardware, andconsultants, and during the contract negotiation process
! Implementation—Costs incurred for sizing and placement of technology infrastructure, data andprocess design, data cleansing, migration and reconciliation, integration with legacy and third-party applications, customizations, testing, development of new processes and relateddocumentation, and change management
! Operation—Costs to support the application software and hardware after they have beenimplemented and for supporting existing hardware and software during any transition period
! Upgrades—Cost to upgrade (that is, resizing infrastructure, customizations, testing new releases,and retraining)
The financial analysis included cost savings identified in the BPR Task and investments required from the
IT Assessment and Evaluation Task. ROI analysis consists of those benefits that support the State’s
strategy, vision, and direction such as:
! Reducing waste, fraud, and abuse in State government
! Supporting the ability to move to improved performance-based budgeting
! Improving the sharing of information between government agencies and between the governmentand the public
! Realizing e-commerce savings to the government and public
KPMG analyzed various tangible ROI metrics including net present value, internal rate of return, and
payback period. KPMG then prepared a summarized analysis of the strategic, operational, technical, and
financial impacts of each alternative. The evaluation included the advantages and disadvantages
associated with each system option. KPMG considered the functional and technical requirements;
strategic, project, and continuation risks; the costs of operations and implementation; and other BPR
savings for each option. We have recommended one option for the State of Florida to pursue, which is
presented in Section 7 of this report.
1—Objectives and Approach Business Case Study
Final ReportPage 1-6 kpmg
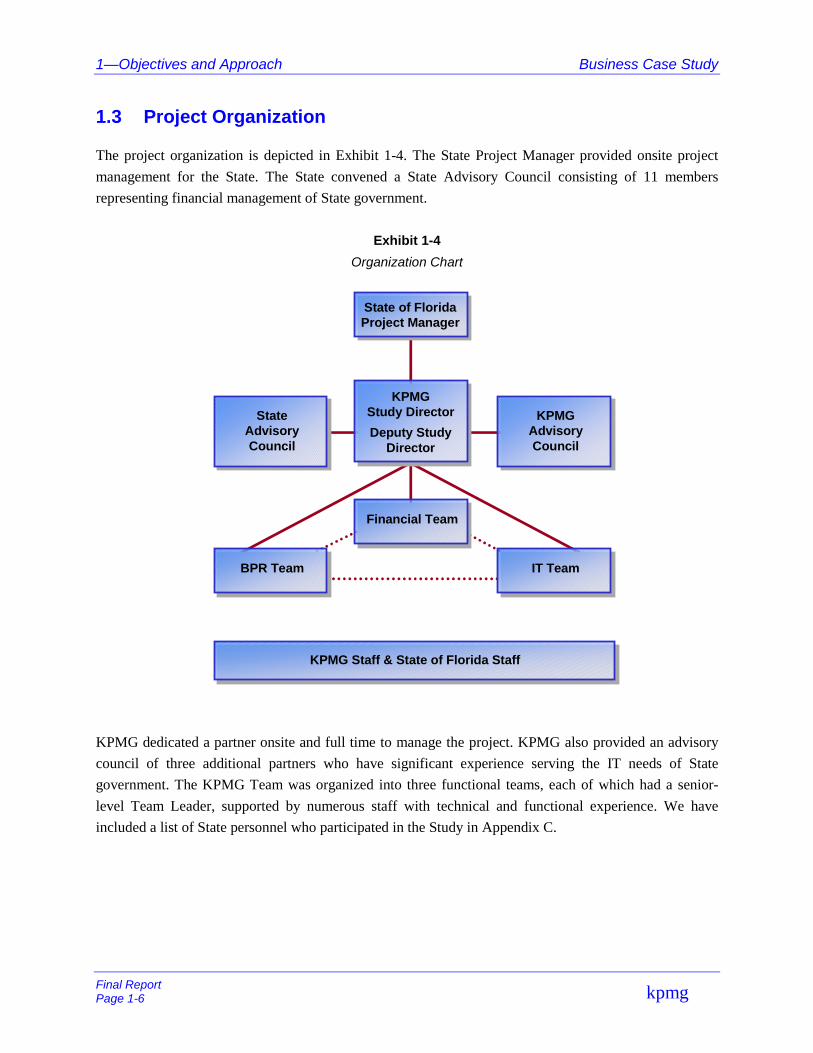
1.3 Project Organization
The project organization is depicted in Exhibit 1-4. The State Project Manager provided onsite project
management for the State. The State convened a State Advisory Council consisting of 11 members
representing financial management of State government.
Exhibit 1-4
Organization Chart
KPMG dedicated a partner onsite and full time to manage the project. KPMG also provided an advisory
council of three additional partners who have significant experience serving the IT needs of State
government. The KPMG Team was organized into three functional teams, each of which had a senior-
level Team Leader, supported by numerous staff with technical and functional experience. We have
included a list of State personnel who participated in the Study in Appendix C.
State of FloridaProject Manager
KPMGStudy Director
Deputy StudyDirector
Financial Team
StateAdvisoryCouncil
KPMGAdvisoryCouncil
BPR Team IT Team
KPMG Staff & State of Florida Staff

Business Case Study 1—Objectives and Approach
Final ReportPage 1-7 kpmg
1.4 Communication
Both KPMG and the State’s Study Management Team recognized that effective lines of communication
are essential to the success of the Study. To ensure effective communications, an official Communications
Plan for the Study was developed. The purpose of this Plan was to summarize the process for creating
effective lines of communication both to and from the Study team. Ultimately, the goal was to enlist the
support and commitment necessary for the success of the Study, as well as the acceptance and adoption of
the Study’s recommendations. The Plan identified more than 500 stakeholders in the Study. The
stakeholders were informed of the Study’s purpose and have received regular updates on the Study’s
progress.
1.5 Report Organization
The Business Case Study final report is organized as follows:
! Section 1, Objectives and Approach, identifies the State of Florida’s objective in undertaking theModernization of State Government Financial Management Business Practices Study. ThisSection also outlines the approach that the State and KPMG adopted to achieve the objective
! Section 2, Current Environment, describes the existing management information system and itsfive subsystems
! Section 3, Business Process Reengineering, lists the 16 major financial processes analyzed anddescribes the current process and our recommendations for reengineering them
! Section 4, IT Assessment, identifies the elements analyzed to gain an understanding of and todocument the FFMIS subsystems
! Section 5, System Requirements, delineates the key technical and business requirements
! Section 6, Options Analysis, provides KPMG’s in-depth analysis of the five options, includinggeneral assumptions and criteria
! Section 7, Recommendation, presents KPMG’s evaluation of the five options. This Sectiondescribes a vision for the State’s technology infrastructure; compares the functionality, risk, andfinancial impact of each option; and presents its recommendation
The appendices contain the following information:
! Appendix A, Innovative Practices, details the results of research conducted on key processimprovement strategies successfully used by companies and government agencies
! Appendix B, Risk Multiplier, presents the risk-adjusted contingency rate used to account forperceived risk of additional project expense for each of the five options analyzed

1—Objectives and Approach Business Case Study
Final ReportPage 1-8 kpmg
! Appendix C, List of Participants, identifies the personnel and organizations that participated inthe Study
! Appendix D, Cost Detail, presents the BPR savings associated with each of the five options, aswell as the total costs of operation for each option
! Appendix E, Research Documents, lists the documentation used during the Study
! Appendix F, Preliminary Implementation Plan, provides a sample high-level project plan for therecommended option
! Appendix G, High Level Infrastructure Schematic, depicts the infrastructure for four of theoptions analyzed

Business Case Study 2—Current Environment
Final ReportPage 2-1kpmg
2. Current Environment2.1 Overview
In 1980, the Florida Legislature enacted the Florida Fiscal Accounting Management Information System
(FFAMIS) Act (Chapters 215.90-215.96, Florida Statutes). The Act’s purpose was to design and
implement a management information system through a unified approach with the following goals:
! Strengthening and standardizing management and accounting procedures
! Strengthening internal controls
! Enabling the preparation of objective, accurate, and timely fiscal reports
! Reporting on the stewardship of officials who are responsible for public funds or property
! Providing timely and accurate information for decision making
Since its enactment in 1980, the FFAMIS Act has been modified 12 times. In 1997, the name of the Act
(Chapter 215.93, Florida Statutes) changed to the Florida Financial Management Information System
(FFMIS) Act. Exhibit 2-1 shows the five functional subsystems of FFMIS.
Exhibit 2-1Five Functional Subsystems of FFMIS
System Function System Name System Owner
Accounting Florida Accounting InformationResource Subsystem
FLAIR Department of Banking and Finance
Human Resources Cooperative PersonnelEmployment Subsystem
COPES Department of ManagementServices
Purchasing Statewide PurchasingSubsystem
SPURS Department of ManagementServices
Budgeting Legislative AppropriationSystem—Planning andBudgeting Subsystem
LAS/PBS Executive Office of the Governor
Cash Management Cash Management Subsystem CMS Department of Insurance, Treasuryand State Fire Marshal
The subsystems of FFMIS underwent extensive modifications between their respective development,
pilot, and implementation dates. Exhibit 2-2 reflects those dates.

2—Current Environment Business Case Study
Final ReportPage 2-2
kpmg
Exhibit 2-2FFMIS Development, Pilot, and Implementation Dates
Subsystem
InitialDevelopmentDate
PilotImplementationDate
ImplementationDate
FLAIR July 1980 July 1982 July 1986
COPES July 1980 July 1981 July 1982
SPURS October 1985 May 1988 May 1988
LAS/PBS July 1982 July 1983 July 1983
CMS July 1982 July 1982 July 1982
The FFMIS subsystems have many users statewide. Exhibit 2-3 summarizes the approximate number of
current subsystem users.
Exhibit 2-3Approximate Number of FFMIS Subsystem Users
Subsystem Number of Users (approximate)
FLAIR 14,300
COPES 4,000
SPURS 6,400
LAS/PBS 486
CMS 30

Business Case Study 2—Current Environment
Final ReportPage 2-3kpmg
2.2 FLAIR
FLAIR is a double-entry, computer-based general ledger accounting subsystem consisting of four
components:
! Departmental Accounting System—Maintains agency accounting records and is used at the endof each fiscal year to prepare financial statements in accordance with Generally AcceptedAccounting Principles
! Central Accounting System—Maintains cash basis records and is used by the Comptroller toensure that expenditures are made in accordance with the legislative appropriations
! Payroll Accounting—Processes the State’s payroll
! Information Warehouse—A reporting system that allows users to access the Central AccountingSystem information and limited Departmental Accounting System information from FLAIR
The Department of Banking and Finance is the functional owner of FLAIR. While all agencies and
universities use FLAIR for their primary accounting functions, numerous other specialized accounting
systems are used by State agencies in addition to FLAIR.
FLAIR has been expanded and enhanced many times during the past 17 years. The most recent
expansions were the implementation of the Purchasing Card (PCard) in July 1997 and Electronic Data
Interchange (EDI) of invoices in July 1998. During Fiscal Year 2000, the Department of Banking and
Finance will focus on short-term enhancements that emphasize electronic commerce.
The State has the following projects planned or currently underway for FLAIR:
! Vendor History on the Web—Vendors will be able to access their payment history directly fromthe web site thus reducing vendor interaction and encouraging electronic fund transfer (EFT)
! Electronic Invoicing Through the Internet—This application allows invoices to be input via theInternet and processed through the invoice tracking system. Ideally, this application will allowvendors to query the statuses of their invoices through the Internet
! Electronic Routing of Earnings Statements to Department of Banking and Finance Employees—This project provides the earning statements of employees on the Internet
! EFT to Miscellaneous Deduction Vendors—This application provides the capability to transfermiscellaneous payroll deductions to vendors electronically

2—Current Environment Business Case Study
Final ReportPage 2-4
kpmg
2.3 COPES
COPES is the statewide online personnel subsystem used by all State agencies (excluding the State
University System, Auditor General, Legislature, and the Board of Regents) to maintain human resource
records for approximately 140,000 employees. This subsystem includes functions for maintenance of
employee and position data, including funding sources and percentages and salary lapse; recruitment and
examination; time reporting; and collective bargaining. The Department of Management Services is the
functional owner of COPES.
COPESView provides a snapshot of COPES and is updated daily with downloads from COPES. Users
can create and run reports using tools such as Impromptu. COPESView can be accessed via the State’s
intranet.
During the past 10 years, significant modifications to COPES occurred when more than 40,000
employees of the Department of Children and Families and the Department of Health agencies were
added to COPES. During the past 3 years, enhancements to COPES have been on hold because the
Human Resources and Payroll project that was piloting a replacement to the current Human Resources
and Payroll subsystems.
The State has the following projects planned or currently underway for COPES:
! COPES DIRECT—A web site is under development to make COPES information available viathe State’s intranet to aid in paper reduction, training, and better communication to COPES users.Browser-based transactions and reports are also being developed. Most of these transactionsprovide functionality that does not exist in the mainframe environment
! Employee DIRECT—This web site links areas of interest to employees in one location. Theemployees’ personal and leave information will be available for them to review. Whereappropriate, employees will be provided the capability to update their personal information suchas telephone numbers and emergency contact information. Various statewide forms will beavailable electronically. A solution will also be developed to provide employees’ earningsstatements electronically
! COPES Security System—The COPES security system was developed with physical securityfeatures (that is, the actual workstation on which the user enters data must be known to thesecurity system and is validated when the user signs on). Today’s mobile workforce would bebetter served by changing the security system to one that requires user IDs and passwords forauthenticating a user

Business Case Study 2—Current Environment
Final ReportPage 2-5kpmg
2.4 SPURS
SPURS is the automated commodity procurement (purchasing) subsystem for the State of Florida.
SPURS provides purchasing information for decision making by customers, management, and legislators,
and provides operational systems for effective and efficient purchasing operations by State agencies. The
subsystem is used by the Executive Branch agencies of State government for the creation of requisitions,
purchase orders, vendor bid lists and mailing labels, and a variety of other standard purchasing functions.
The Department of Management Services is the functional owner of SPURS.
SPURSView provides a “snapshot” copy of SPURS. Users perform queries and reporting from the
Internet and intranet.
The Vendor Bid System (VBS) allows an agency user to advertise its bids and requests for proposals on
the Internet and publish the documents on the Internet. VBS notifies registered vendors of the bids via
e-mail.
Over the last decade, a number of important modifications and enhancements were made to SPURS
including:
! System Security—A new security system was developed and implemented in the CommodityProcurement component of SPURS
! FLAIR/SPURS Financial Interface—SPURS interfaces online in real time with FLAIR forvendor updates, account code validation, and fund encumbrance additions, updates, and deletions.In addition, users can inquire on fund encumbrances and account balances
The State has the following projects planned or currently underway for SPURS:
! Electronic Commerce—This initiative includes a web-based electronic requisition component,EDI of purchase orders from the mainframe to approved trading partners, and VBS enhancements
! Other SPURS Mainframe Applications Development—Modifications will be made to theStatewide Vendor File to provide additional Certified Minority Vendor information
! Agency Implementations—Tentative plans call for the addition of two agencies during FiscalYear 2000: the Office of the Auditor General, and Office of Program, Policy Analysis, andGovernment Accountability

2—Current Environment Business Case Study
Final ReportPage 2-6
kpmg
2.5 LAS/PBS
LAS/PBS is the State’s automated budgeting and appropriation subsystem. This subsystem is used by all
branches of State government for developing, preparing, analyzing, and evaluating State agency budget
requests. The Executive Office of the Governor and the Office of Policy and Budgeting use LAS/PBS to
develop the Governor’s budget recommendations and to allocate and control the appropriations. The
legislative appropriations committees use the subsystem to create the appropriations bills, including the
proviso and other controlling language used to document the legislative intent and create a basis to enable
the agencies to manage their agencies consistent with such legislative intent. The budgeting and
appropriating process produces the General Appropriations Act and its supplements. The Executive
Office of the Governor is the functional owner of LAS/PBS.
During the mid- to late-1980s, modifications and enhancements were made to LAS/PBS including the
following:
! LAS merged with PBS to form the current LAS/PBS
! The Virtual Storage Access Method files were replaced with Software AG’s ADABAS databasemanagement system, and its fourth-generation language, Natural, became the primaryprogramming language
During the last decade, a number of important enhancements were made to LAS/PBS including the
following:
! The Systems Design and Development section enhanced LAS/PBS by developing auxiliarysystems in Lotus Notes and Visual Basic that increase functionality
! Heavily used modules in LAS/PBS have been rewritten to operate as much like a personalcomputer as possible. Pop-up windows and hierarchical help are provided. Both application-leveland field-level help have been added
! LAS/PBS is mission critical and therefore provides for Direct Access Storage Device mirroring,hot-site backup, 24x7 vendor and staff support, and disaster recovery
The State has the following projects planned or currently underway for LAS/PBS:
! Multitier client/server
! Relational database management systems
! Network-based computing
! Graphical user interfaces
! Local area networks, Internet/intranet, Groupware, and e-mail

Business Case Study 2—Current Environment
Final ReportPage 2-7kpmg
2.6 CMS
Owned by the Department of Insurance, Treasury, and Fire Marshal, CMS is a collection of 13 systems.
These systems facilitate the Treasurer’s responsibilities for monitoring cash levels and activities in State
bank accounts, receipt and disbursements of funds, investment of available balances, performance of
related accounting functions, and cash management operations and consultations.
During the last decade, a number of important enhancements and modifications were made to CMS
including the following:
! The Treasurer purchased an IBM AS/400 mid-range computer
! A client/server-based front end was developed for the interactive portions of the applications
! The original COBOL programs were migrated to the AS/400 and they continued to be used forovernight processing
! The Treasurer updated its PC operating system to Windows 95
! Seventy percent of the Treasurer’s processing is now in an interactive mode, while 30 percent isbatch processing using COBOL
The State has the following projects planned or currently underway for CMS:
! During Fiscal Year 2000, the Treasurer will establish an interactive web site on an AS/400 server.The web site will include interactive capabilities for general and administrative functions relativeto activities of the Treasurer
! Automation of the receipt and verification of incoming Automated Clearing House (ACH)Payments will replace the use of telephone and facsimile with electronic means to notify agenciesof incoming ACH payments, automate FLAIR verification, and pass on other income, such asaddenda data that is received with payments
Other current initiatives include the development of electronic data exchange, enhancement of
communications and functionality, a return items application, and consolidation of revolving accounts
transactions and statements.

2—Current Environment Business Case Study
Final ReportPage 2-8
kpmg
This page intentionally left blank.

Business Case Study 3—Business Process ReengineeringOverview
Final ReportPage 3-1
kpmg
3. Business Process Reengineering3.1 Overview
The BPR analysis of the State of Florida’s financial management processes identified several
recommendations for improvement. If implemented, these recommendations would increase the
availability of financial management information through more user-friendly processes, reduce the time
needed to carry out financial management processes, and increase efficiency. When the estimated fiscal
impacts of all the recommendations are taken together, the estimated annual savings totals $97 million.
This includes $91 million in anticipated budgetary reductions and $6 million in increased efficiencies.
The BPR analysis was undertaken in the context of assessing five options for addressing the State of
Florida’s need for an automated financial management system. The five options are shown in Exhibit 3-1.
Exhibit 3-1Options
Option 1 As-Is Maintain the current legacy systems as-is with no major modifications or upgrades
Option 2 Enhanced Enhance current systems by adding new tools and functionality
Option 3 Custom Develop a new custom integrated information management system
Option 4 COTS Implement a commercial off-the-shelf Enterprise Resource Planning package
Option 5 Best of Breed Use some combination of the other four options
Although some of the recommendations for reengineering the State’s financial management processes can
be implemented with the current automated system (Option 1), most of the recommendations require
either a significant upgrade of the current system or its replacement. Of the $91 million in annual
budgetary savings, only $24 million can be achieved if no change in the automated system is undertaken.
An additional $36 million in annual savings can be achieved with Option 2, but only with Options 3, 4,
and 5 can all $91 million in budgetary savings be achieved.
The remainder of this section includes a discussion of the background, assessment of current processes,
reengineering themes, and fiscal impact that resulted from the BPR analysis.
Background
The purpose of a financial management system is to automate an organization’s financial management
processes. Maximum benefit is derived from the automated system if the processes are efficient and if
they make use of the automated system’s fullest capabilities. To understand the customer service and
Business Case Study 3—Business Process ReengineeringOverview
Final ReportPage 3-2
kpmg
fiscal impact of a decision to keep, upgrade, or replace the State of Florida’s financial management
system, we have undertaken a BPR analysis of selected financial management processes. The purpose of
this analysis is to identify better ways to carry out financial management processes and to document the
expected impacts on quality, service, and costs.
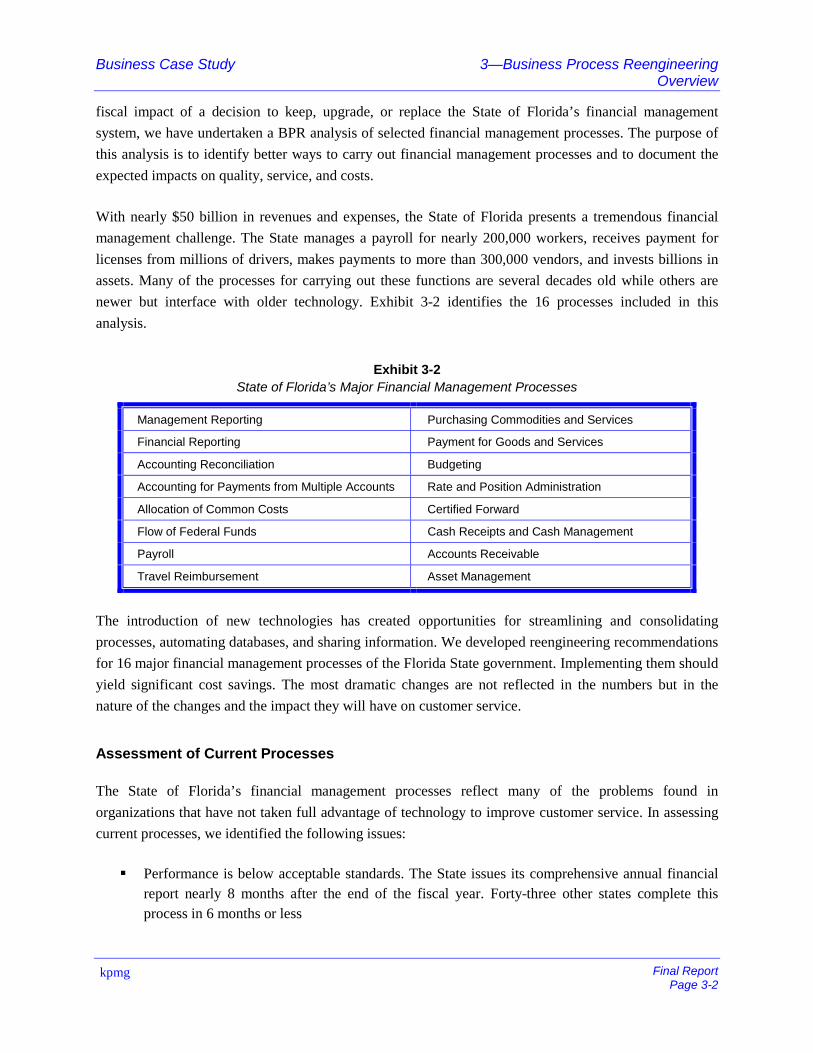
With nearly $50 billion in revenues and expenses, the State of Florida presents a tremendous financial
management challenge. The State manages a payroll for nearly 200,000 workers, receives payment for
licenses from millions of drivers, makes payments to more than 300,000 vendors, and invests billions in
assets. Many of the processes for carrying out these functions are several decades old while others are
newer but interface with older technology. Exhibit 3-2 identifies the 16 processes included in this
analysis.
Exhibit 3-2State of Florida’s Major Financial Management Processes
Management Reporting Purchasing Commodities and Services
Financial Reporting Payment for Goods and Services
Accounting Reconciliation Budgeting
Accounting for Payments from Multiple Accounts Rate and Position Administration
Allocation of Common Costs Certified Forward
Flow of Federal Funds Cash Receipts and Cash Management
Payroll Accounts Receivable
Travel Reimbursement Asset Management
The introduction of new technologies has created opportunities for streamlining and consolidating
processes, automating databases, and sharing information. We developed reengineering recommendations
for 16 major financial management processes of the Florida State government. Implementing them should
yield significant cost savings. The most dramatic changes are not reflected in the numbers but in the
nature of the changes and the impact they will have on customer service.
Assessment of Current Processes
The State of Florida’s financial management processes reflect many of the problems found in
organizations that have not taken full advantage of technology to improve customer service. In assessing
current processes, we identified the following issues:
! Performance is below acceptable standards. The State issues its comprehensive annual financialreport nearly 8 months after the end of the fiscal year. Forty-three other states complete thisprocess in 6 months or less

Business Case Study 3—Business Process ReengineeringOverview
Final ReportPage 3-3
kpmg
! System capabilities do not meet customer needs. The clearest evidence is that agencies havepurchased or developed numerous supplemental systems to overcome limitations in systemfunctionality. An agency may have one or more of the following modules supplementing thestatewide accounting systems: grants management, accounts receivable, cash receipts, journaltransfer, project cost, position control, reconciliation, leave and attendance, payroll tracking, andcertified forward. In many cases, agencies download data from the Florida AccountingInformation Resource (FLAIR) subsystem to PC-based spreadsheets and databases to analyze andreport financial information
! Key steps in the process are not automated. Entry of travel vouchers and positive pay timekeeping, purchasing, and vendor payments are initiated using paper processes. The centralizeddata entry is redundant in the preparation of manual forms
! Selected policies place a tremendous burden on staffing resources with little added value. Assetmanagement, certified forward, financial reporting, and rate and position administration require alarge staff. The experiences of other states and large corporations show that the goals of theseprocesses can be achieved using more streamlined and efficient processes
! Key building blocks of the financial management system impede efficient operations. FLAIRincludes two ledger systems: Central Accounting System (Comptroller Records/Cash Basis) andDepartmental Accounting System (Agency Record/Accrual Basis). This fact by itself creates theneed for a reconciliation process. In addition, a significant amount of work—checking,reconciling, verifying, and ad hoc reporting—is caused by variations among agencies in the Chartof Accounts
The impact of these shortcomings in the current processes is manifested through an unacceptably high
cost for managing the State’s financial resources.
Reengineering Themes
The reengineered processes address major weaknesses with current processes. Among the goals are
improving customer service, reducing costs, and reducing cycle times. The recommendations cluster
around several themes. These themes and the reengineering recommendations associated with them are
summarized as follows:
! Develop an enterprisewide perspective on State government financial operations
– Establish a statewide single Chart of Accounts
– Consolidate central and department accounting into one enterprisewide accounting system
– Establish an enterprisewide policy for accounts receivable and a database capable ofenforcing a “clean hands” law
– Establish a semi-monthly payroll statewide

Business Case Study 3—Business Process ReengineeringOverview
Final ReportPage 3-4
kpmg
– Consolidate payroll support functions into five shared service cluster units
! Expand the functionality of the financial management system
– Modify the system to enable disbursements against more than one account
– Automate the process of calculating and reporting indirect (common) costs
– Develop a grants management system and automate the process of matching federal fundsreceipts
! Automate manual steps and reduce excess paper
– Introduce electronic auditing of invoices and exception reporting for in-depth audits
– Fold most supplemental warrants into the regular payroll warrant and issue only one pay stub
– Decentralize data entry for employees entering time and travelers seeking reimbursement
– Automate the interface between the accounting system and the budget system
! Provide better financial management information for more cost-effective decisions
– Use better financial management information, shift up to $1 billion in assets from the internalprogram to the higher yielding external program
– Create a statewide financial information data warehouse for the collection and reporting offinancial management information
! Increase the use of e-commerce
– Decentralize purchasing and verification of receipt of goods and services to the lowestpossible level within service delivery units
– Decentralize and automate the payment process
– Require that all vendors doing business with the State have e-commerce capabilities (onlineinvoicing and payment) by 2002
– Establish online automated reconciliation with banks
– Require that all travel reimbursement be remitted through electronic funds transfer
! Update and modernize policies and procedures
– Raise the definition of a capital asset to $5,000 for tracking purposes and reduce thefrequency of physical inventory
– Make the acceptance of debit cards a statewide standard
– Terminate the certificate of deposit program aimed at Florida banking institutions
– Eliminate the detailed certified forward process—review obligations by exception rather thancomprehensively and estimate year-end obligations

Business Case Study 3—Business Process ReengineeringOverview
Final ReportPage 3-5
kpmg
– Make salary rate a direct function of salary appropriations to simply calculation of ratethroughout the year
– Remove travel parameters from the Florida Statutes and place them in administrative rules
Except for the last set of recommendations under the theme “Update and modernize policies and
procedures,” most of the recommendations do not require legislative action beyond the authorization for
funds to replace or upgrade the Florida Financial Management Information System (FFMIS).
Fiscal Impact
Taken together, the fiscal impact of all the reengineering recommendations is significant. Fiscal impacts
are labeled in two ways—budgetary savings and increased efficiency. Budgetary savings reflect the
potential for reductions in full-time equivalent (FTE) positions and consequently reductions or redirection
of budgetary resources. Increased efficiency reflects a reduction in the labor necessary to carry out a
process, but that reduction is either too small or spread across so many staffs that FTE reductions are not
expected to result. Exhibit 3-3 presents the total fiscal impact of all the Business Case Study
recommendations. The fiscal impact of the recommendations has been presented separately for Option 1
and Option 2. The fiscal impact of the recommendations is the same for Option 3, 4 and 5 and is
presented once at the end of Exhibit 3-3.

Business Case Study 3—Business Process ReengineeringOverview
Final ReportPage 3-6
kpmg
Exhibit 3-3Summary of Business Process Reengineering Savings by Process
Net Budgetary Savings Net Increased Efficiency
ProcessTechnologyDependent Other
TechnologyDependent Other Total Savings
Option 1: As-Is
Management Reporting $0 $0 $0 $0 $0
Financial Reporting 0 (100,000) 0 0 (100,000)
Reconciliation 0 0 0 0 0
Accounting Payments for Multiple Accounts 0 0 0 0 0
Allocation of Common Costs 0 0 0 0 0
Flow of Federal Funds 0 0 0 0 0
Payroll 0 0 0 0 0
Travel Reimbursement 0 3,482,000 0 0 3,482,000
Purchasing Commodities and Services 0 0 0 0 0
Payment for Goods and Services 0 0 0 0 0
Budgeting 0 0 0 0 0
Rate and Position Administration 0 0 0 0 0
Certified Forward 0 3,125,000 0 3,125,000
Cash Receipts and Cash Management 0 14,656,000 0 0 14,656,000
Accounts Receivable 0 0 0 193,000 193,000
Asset Management 0 2,528,000 0 1,514,000 4,042,000
Option 1: As-Is Total $0 $23,691,000 $0 $1,707,000 $25,398,000
Option 2: Enhanced
Management Reporting $0 $0 $0 $0 $0
Financial Reporting 56,000 (100,000) 90,000 0 46,000
Reconciliation 0 0 145,000 0 145,000
Accounting Payments for Multiple Accounts 0 0 0 0 0
Allocation of Common Costs 0 0 0 0 0
Flow of Federal Funds 0 0 0 0 0
Payroll 6,038,000 0 0 0 6,038,000
Travel Reimbursement 0 3,482,000 0 0 3,482,000
Purchasing Commodities and Services 16,910,000 0 0 0 16,910,000
Payment for Goods and Services 1,500,000 0 0 0 1,500,000
Budgeting 0 0 1,217,000 0 1,217,000
Rate and Position Administration 0 0 0 0 0
Certified Forward 0 3,125,000 0 3,125,000
Cash Receipts and Cash Management 10,000,000 14,656,000 0 0 24,656,000
Accounts Receivable 0 0 0 193,000 193,000
Asset Management 0 2,528,000 0 1,514,000 4,042,000
Option 2: Enhanced Total $34,504,000 $23,691,000 $1,452,000 $1,707,000 $61,354,000

Business Case Study 3—Business Process ReengineeringOverview
Final ReportPage 3-7
kpmg
Exhibit 3-3 (continued)Summary of Business Process Reengineering Savings by Process
Net Budgetary Savings Net Increased Efficiency
ProcessTechnologyDependent Other
TechnologyDependent Other Total Savings
Option 3: Custom, Option 4: COTS, andOption 5: Best of Breed
Management Reporting $0 $0 $0 $0 $0
Financial Reporting 56,000 (100,000) 90,000 0 46,000
Reconciliation 2,848,000 0 145,000 0 2,993,000
Accounting Payments for Multiple Accounts 0 0 2,783,000 0 2,783,000
Allocation of Common Costs 2,324,000 0 0 0 2,324,000
Flow of Federal Funds 303,000 0 0 0 303,000
Payroll 8,054,000 0 0 0 8,054,000
Travel Reimbursement 3,260,000 3,482,000 0 0 6,742,000
Purchasing Commodities and Services 22,335,000 0 0 0 22,335,000
Payment for Goods and Services 17,905,000 0 0 0 17,905,000
Budgeting 0 0 1,217,000 0 1,217,000
Rate and Position Administration 0 0 73,000 0 73,000
Certified Forward 0 3,125,000 0 3,125,000
Cash Receipts and Cash Management 10,000,000 14,656,000 0 0 24,656,000
Accounts Receivable 0 0 0 193,000 193,000
Asset Management 0 2,528,000 178,000 1,514,000 4,220,000
Option 3: Custom, Option 4: COTS, andOption 5: Best of Breed Total
$67,085,000 $23,691,000 $4,486,000 $1,707,000 $96,969,000
A summary by option of the fiscal impact of the BPR recommendations is shown in Exhibit 3-4.
Exhibit 3-4Summary of Fiscal Impacts by Option
Net Budgetary Savings Net Increased Efficiency
OptionsTechnologyDependent Other
TechnologyDependent Other
TotalSavings
Option 1 – As Is $ 0 $ 23,691,000 $ 0 $ 1,707,000 $ 25,398,000
Option 2 – Enhance 34,504,000 23,691,000 1,452,000 1,707,000 61,354,000
Option 3 – Custom 67,085,000 23,691,000 4,486,000 1,707,000 96,969,000
Option 4 – COTS 67,085,000 23,691,000 4,486,000 1,707,000 96,969,000
Option 5 – Best of Breed 67,085,000 23,691,000 4,486,000 1,707,000 96,969,000

Business Case Study 3—Business Process ReengineeringOverview
Final ReportPage 3-8
kpmg
Savings can be achieved through reengineering the State’s financial management processes. The largest
saving, however, is expected to result from implementing Options 3, 4, and 5. These options represent a
comprehensive change in the underlying automated system that supports financial management in the
State of Florida.

Business Case Study 3—Business Process ReengineeringMethodology
3.2 Methodology
This section presents the methodology used for designing reengineered financial management processes
for the State of Florida. The methodology consisted of three components:
! Process identification
! Process analysis
! Extrapolation
Process is defined as a series of steps or activities that enable an organization to meet a customer need.
These steps may cross organizational boundaries and usually involve the customer as well. To conduct the
process analysis, we assess the current process, which is sometimes called the As-Is process. Current
processes are usually defined from the organizational perspective and limited by organizational
boundaries. The result of the process analysis is the development of a reengineered process, which is also
known as the To-Be process. Reengineered processes are usually defined from the customer’s
perspective.
Processes begin with a customer request or need and end when that request or need is fulfilled. Customers
of Florida’s financial management processes include customers internal to State government as well as
external individuals and businesses.
Process Identification
Florida State government has numerous financial management processes. Some processes such as the
certified forward process require a small amount of time from a large number of people, while other
processes such as payroll and purchasing require a large amount of time from a centralized staff dedicated
to the process. For this analysis, we focused on the major processes that have a significant impact on costs
or decision making. Furthermore, the analysis focuses on processes that require the use of an automated
financial management system. The three major steps used in identifying the processes included the
following:
! Identify what customers need and request
! Identify the customers
! Identify the roll played in the process by FFMIS
For the first step, KPMG identified customer needs that are fulfilled by financial management processes.
Although customers want different kinds of financial and program performance information, the process
of obtaining that information is still the same from the customer’s point of view. The customer makes a

Business Case Study 3—Business Process ReengineeringMethodology
request; then, someone in the organization queries one or more databases, manipulates numbers, and
produces a report. Although the actual steps that the agency staff follow may differ according to the
agency or nature of the information request, all of these steps can be seen as one process. A summary of
customer-oriented financial management needs is provided in Exhibit 3-5.
Next, we identified the customers. The customers are the internal employees or organizational units or
external individuals or businesses that rely upon a financial management process to meet a particular
need. Most of the processes that we identified have multiple customers. Column 2 of Exhibit 3-5 provides
a listing of the customers by category of need.
Finally, we note the role that FFMIS plays in supporting the process. The level of support for financial
management processes can vary. Some processes such as those for reporting management information,
rely almost exclusively on FFMIS; others such as budget formulation include many steps that may not
interface with FFMIS or any of its subsystems.
Exhibit 3-5Summary of Customer Needs
Needs Fulfilled Through FFMIS Who Needs It?
To know how money is spent Citizens, Legislators, Governor, CabinetAgencies, Department Heads, Unit Managers,Grantors, Creditors
To know the status of their investments Citizens, Legislators, Governor, CabinetAgencies, Department Heads, Unit Managers,Grantors, Creditors
To obtain/make appropriations for the next year Legislators, Governor, Cabinet Agencies,Department Heads
To manage end of year spending Governor, Cabinet Agencies, Department Heads
To receive non-tax revenue and to make it available forexpenditure
Governor, Unit Managers, Cabinet Agencies,Department Heads
To monitor the deployment of human resources Governor, Unit Managers, Cabinet Agencies,Department Heads
To monitor and record purchases of commodities andservices
Legislature, Governor, Unit Managers, CabinetAgencies, Department Heads
To collect on overdue receivables Legislature, Governor, Cabinet Agencies,Department Heads, Unit Managers
To receive reimbursement, salary and benefits andrelated information
Employees
To pay an amount owed to a vendor Legislature, Governor, Cabinet Agencies,Department Heads, Unit Managers

Business Case Study 3—Business Process ReengineeringMethodology
Through the process described above, we identified the following processes for analysis:
! Management reporting: Reporting of a wide range of financial management information primarilyto State managers
! Financial reporting: Developing the annual Comprehensive Financial Management Report(CAFR)
! Accounting reconciliation: Reconciling central accounts with agency accounts
! Accounting for payments from multiple accounts: Recording disbursements that should be paidagainst more than one account
! Allocation of common costs: Calculating and reporting of indirect costs to federal grantingagencies
! Flow of federal funds: Managing federal grant funds
! Payroll: Recording employee time and paying salaries
! Travel reimbursement: Reimbursing employees for expenses covered by the travel policy
! Purchasing commodities and services: Procuring commodities from vendors
! Payment for goods and services: Paying vendors for commodities purchased
! Budgeting: Tracking budgetary decision making and monitoring compliance
! Rate and position administration: Monitoring personnel expenditures
! Certified forward: Managing end-of-year spending
! Cash receipts and cash management: Receiving funds and making them available
! Accounts receivable: Collecting on overdue receivables
! Asset management
Through the process identification, two processes were not included and two were combined. We did not
include the administration of training because of the low impact that a new financial management system
would have on it. We also eliminated recruitment and hiring because FFMIS plays a small part in that
process. Receiving and purchasing were combined into one process—purchasing.
The process analysis consisted of two parts: the analysis of the current process and the development of a
prototype reengineered process.
Business Case Study 3—Business Process ReengineeringMethodology
Current Process Analysis
Analysis of current processes included the following steps:
! Develop high-level process maps
! Identify technology required to carry out the process
! Gather process metrics
! Identify cost components
! Identify strengths and weaknesses
The high-level process maps illustrate the major steps in a process and identify the organizational entities
that participate in the process. These maps usually include the customer to ensure that the customer’s
relationship to the process is documented. The maps also indicate where technology plays a role in
facilitating the process.
Different process metrics or measures of process performance are used in the process analysis. Among the
process metrics used is cycle time—the time that lapses from the point that the customer need is identified
or a request is made to the time that the need or request is fulfilled. Another common metric is process
time—the actual time it takes to carry out the process excluding waiting time between steps. Other key
process metrics are accuracy or error rates and customer satisfaction.
Cost is an important component of any process analysis. The cost analysis focuses on costs at three
levels—customer costs, agency costs, and centralized costs. The customer costs are costs associated with
initiating a process, such as completing a travel reimbursement voucher or recording time worked. Based
on this definition not all processes have customer costs.
Agency and centralized costs refer to the labor cost required to carry out the process. In the purchasing
process, for example, agency costs reflect the salaries of staff dedicated to processing purchase orders at
the agency level. Centralized costs are labor costs as well, but refer to costs incurred by agencies that have
a statewide responsibility for a process. For example, the Office of Policy and Budget has statewide
responsibility related to the budget process, but its costs are in addition to what it costs agencies to carry
out the budget process.
After gathering relevant data on the process, we identified the strengths and weaknesses of the process.
The weaknesses, also known as findings, provide insight into what needs to change in the process to
improve its performance.

Business Case Study 3—Business Process ReengineeringMethodology
Reengineered Process
To develop the reengineered process, we performed the following:
! Identified innovative practices
! Developed specific recommendations
! Developed a conceptual model
! Conducted an implementation analysis
To assist in the identification of reengineered processes, we conducted research on the Internet, in
publications, and through interviews with other State governments to identify innovative practices used
for the financial management processes. The innovative practices that we identified are provided in
Appendix A and are organized by process.
After identifying the weaknesses during the process analysis, we developed a series of recommendations.
The recommendations form the basis for developing a conceptual model of the reengineered process.
Finally, we conducted an implementation analysis. For this portion of the methodology, we assessed the
fiscal impact of implementing the recommendations. Fiscal impacts are measured either by budgetary
savings—actual reductions in expenditures—or increased efficiency in which staff time is made available
and can be redirected to higher valued activities. The analysis includes an assessment of implementation
issues such as regulations, statutes, or significant resistance to change.
Extrapolation
The goal of the extrapolation process is to determine the quantitative effects of reengineering agency
financial management processes statewide. The following five agencies were selected for in-depth
analysis in order to extrapolate the potential reengineering savings across State government:
! Department of Transportation (DOT)
! Department of Children and Families (DCF)
! Department of Highway Safety and Motor Vehicles (DHSMV)
! Department of Insurance, Treasury and State Fire Marshal (DOI)
! University of Florida (UF)
Working with representatives from several State of Florida agencies, we selected these five agencies to
ensure that a breadth of financial management processes was included in the in-depth analysis. These five
agencies are representative of State government.

Business Case Study 3—Business Process ReengineeringMethodology
The representative processes within the five agencies were analyzed and modeled. These processes
provide the basis for the extrapolation to determine the impact across all State agencies. Generally, the
cost of carrying out a process statewide is based on the number of FTEs it takes to carry out the process in
the five agencies divided by the percentage of the entire Statewide workload that the five agencies
perform. This calculation yields an FTE number that applies to the entire State. For each of the processes,
the five study agencies are more or less representative of the rest of State government. We worked with
State representatives to adjust the basic extrapolation method to fit the particular process.
The savings estimate is based on the reduction in labor costs that can be achieved by changing from the
current process to the reengineered process statewide. Budgetary savings are identified in those cases
where actual reductions in FTEs can be achieved. Budgetary savings usually occur when a core of FTEs
devotes 100 percent of its time to a process. Examples include procurement, payroll, asset management,
and travel reimbursement. FTE savings are based on the average compensation for employees who carry
out the processes under consideration.
Many of the process improvements do not result in FTE reductions, but instead result in increased
efficiency. Increased efficiency generally reflects a small reduction in the time that a large number of
employees devote to a particular process. Examples include management reporting, rate and position
administration, and certify forward.
Summary
The methodology for carrying out the business process reengineering was tailored to assist in the
assessment of the State’s financial management information system. The methodology includes an
identification of the processes, analysis of the current processes, development of reengineered processes,
and extrapolation statewide of any resulting savings. The result of applying this methodology to each of
the State’s major financial management processes is detailed in the sections that follow.

Business Case Study 3—Business Process ReengineeringOverview
Final ReportPage 3-7
kpmg

Business Case Study 3—Business Process ReengineeringManagement Reporting
3.3 Recommended Process Changes—Management Reporting
This section presents KPMG’s recommendations for reengineering the State’s processes for management
reporting—the processes by which agency managers request and obtain financial information. The
primary focus of this analysis is on management reports from FLAIR. Managers with financial
responsibility obtain management reports from all five subsystems in FFMIS. The five subsystems are
FLAIR, LAS/PBS, COPES, SPURS, and CMS.
Background
Managers and supervisors in State agencies require
certain financial and human resource information from
FLAIR to operate their units and departments
efficiently and effectively. Although managers
throughout the State have adjusted to the quality and
efficiency of the financial management reports that are
now available, when queried they express frustration
with the process. Managers note that huge reports of
little value are printed automatically and distributed
widely, while specialized reports that could meet
individual managers’ needs require a special request,
programming, and extra time to produce. As a result,
the State has developed ad hoc systems to develop and report financial information that meets the special
demands of the Legislature, the Governor, and agency managers. The systems can consist of a series of
telephone calls to several or possibly all State agencies to gather one or two pieces of financial
information. These ad hoc systems require an enormous effort, and that effort is neither tracked nor
managed. Some State agencies have implemented their
own systems applications to provide them with
management reporting capabilities not available with
FFMIS. A manager with the DCF expressed his
experience in preparing reports before and after
implementation of DCF’s own data warehouse.
FFMIS subsystems were originally developed
primarily as transaction processing systems. They
were not designed specifically for management
reporting. FLAIR Report Distribution System (RDS), The FLAIR Information Warehouse (IW),
SPURSView, and COPESView are recent applications developed in the 1990s to enable managers to
“Providing the end user with the appropriate
tools for easy access to the computer data has
always been a high priority at the University of
Florida. The current methods for accessing the
State’s databases are not satisfactory for the
majority of the employees who need this
information to perform their job. I strongly
recommend that any studies for the
reengineering of the State’s automated
systems include a comprehensive solution for
this problem.”
—Manager, University of Florida
“Every month, my staff used to transfer
figures off of a FLAIR report onto a
spreadsheet. We would then prepare charts
and graphs for presentations to our board.
This was a solid 2-day project every month for
one FTE. With a data warehouse, we can do it
in less than 15 minutes.”
—Manager, Department of Children and
Families

3—Business Process Reengineering Business Case StudyManagement Reporting
extract specific information from FFMIS. Despite these data warehouse efforts, the basic FFMIS
subsystems do not serve as effective decision support systems or executive information systems.
Because each agency has unique management reporting requirements, the approaches and resources used
throughout the State to collect and present management reports vary significantly.
Management reports based on the information in FLAIR are also developed and used by the Office of the
Governor and the State Legislature to:
! Assess overall State government financial performance or the financial performance of anindividual department and its organizational units on a periodic or ad hoc basis
! Identify and resolve operational deficiencies
! Respond to miscellaneous constituent or media inquiries
! Quantify issues under legislative review
! Support decision making
! Gauge the State’s progress in meeting financial goals and objectives
Some management reports are developed to support Performance-Based Budgeting requirements
mandated in Florida’s 1994 Government Performance and Accountability Act. Most other reports are
developed as a function of departmental policy. With the State’s requirement for unit-cost reporting,
managers will have to find ways to report cost per unit.
FLAIR provides some management reporting capabilities through its RDS and IW. RDS features nearly
150 standard accounting and payroll reports that an agency can request on a periodic or ad hoc basis.
Selected standard reports can be run and posted to an agency’s RDS library according to a schedule that
the agency requests. Additionally, agencies can write Natural programs to create their own customized
versions of these standard reports. These reports can also be run and posted to the agency’s RDS library
on a prescheduled basis.
The FLAIR IW provides agencies with another option for developing ad hoc management reports using
accounting data. Agencies can query the IW to develop ad hoc reports using accounting and payroll data
stored in central FLAIR. The FLAIR IW is limited primarily to FLAIR Central Accounting.
One concern is Purchase Card (PCard) expenditures. Information on PCard expenditures is apparently in
the FLAIR data warehouse, but obtaining information requires specialized programming. The information
is for all practical purposes not available to many agency managers.

Business Case Study 3—Business Process ReengineeringManagement Reporting
Because the FLAIR RDS and IW provide limited reporting capabilities and can be difficult to use, most
agencies have developed additional resources to produce management reports. Supplemental systems and
applications used by the five study agencies, ranging from simple desktop spreadsheets and databases to
comprehensive data warehouses, are summarized in Exhibit 3-6.
Exhibit 3-6Supplemental Systems Used by Study Agencies in Management Reporting
Agency Supplemental System PurposeInterfaceswith
Department ofTransportation
Financial Management System,other internal systems, andmiscellaneous desktop PCapplications
Develop reports for monthlymanagement meetings, periodicinternal distributions, and Board ofTransportation meetings
FLAIR
Department of Children andFamilies
Information Delivery System Enable users to access records todevelop tailored ad hoc reports
FLAIR
Department of HighwaySafety and Motor Vehicles
Miscellaneous desktop PCapplications
Develop miscellaneousmanagement reports
FLAIR
Department of Insurance,Treasury and State FireMarshall
Miscellaneous desktop PCapplications
Develop miscellaneousmanagement reports
FLAIR
University of Florida SUS Automated FinancialStatements System andmiscellaneous desktop PCapplications
Develop miscellaneousdepartmental reports andmanagement reports for theUniversity of Florida Chancellor
FLAIR
State agencies have a new requirement for unit-cost reporting that FFMIS does not now support. To
address this requirement, agencies will have to develop additional supplemental systems or ad hoc
methodologies to develop and report unit costs. Neither the chart of accounts nor FLAIR is set up to track
and report unit costs.
Current Process
State agencies acquire management reports through the FLAIR RDS or IW, as needed, or by developing
reports on their own systems and PC desktop applications, using information downloaded from FLAIR
records.
Standard reports generated in RDS are run by FLAIR technical staff and posted to an agency’s online
RDS library the next day. Agency personnel, using Natural program routines, can develop custom reports
using FLAIR data—these reports are also posted to the agency’s online RDS library. Authorized agency
personnel can gain access to information from this site and download and/or print reports for internal
distribution. A limited number of agency personnel use the FLAIR IW to develop ad hoc reports. These

3—Business Process Reengineering Business Case StudyManagement Reporting
reports are similarly posted to an agency’s FLAIR online library, where they can be viewed, downloaded,
and/or printed for internal distribution.
Agencies that use their own supplemental systems to develop management reports do so by loading their
own agency data not available on FLAIR, or by downloading or re-keying information from FLAIR to
data warehouses, internal management systems, or PC desktop applications.
Current Process Performance
Management reporting in the State is a highly fragmented process. The FLAIR RDS and IW provide
useful data to a limited number of managers and technicians who know how to get into these systems and
extract the information they need. Exhibit 3-7 presents IW usage metrics for the five study agencies
during the first quarter of Fiscal Year 2000. These statistics show that IW usage appears to be light—
especially among smaller agencies such as DHSMV and DOI.
Exhibit 3-7Average Monthly Information Warehouse Usage
Fiscal Year 2000—Quarter 1
AgencyNumber ofQueries
Numberof Users
TotalAgencyManagementStaff
AgencyManagementStaff UsingIW
Department of Transportation 4,245 118 3,327 3.5%
Department of Children and Families 709 17 975 1.7%
Department of Highway Safety and Motor Vehicles 5 1 834 0.1%
Department of Insurance, Treasury and State FireMarshall
21 3 244 1.2%
University of Florida 18 2 ~4500 <0.1%
Source: State of Florida, Department of Banking and Finance
In many larger agencies, managers use supplemental information systems and data warehouses to obtain
the financial reports they need. Still, other managers rely upon desktop PC database programs to store and
retrieve financial management information. Exhibit 3-8 presents an estimated breakdown of management
reports produced in FLAIR, in agency information systems, and on desktop PC databases. This does not
include management reports from any of the other four subsystems in FFMIS. When actual workload data
was not readily available, KPMG developed composite estimates based on interviews with agency
managers in the five study agencies.
Assumptions used in estimating management reporting workload data are based on actual data and
KPMG interviews of managers in the five study agencies:

Business Case Study 3—Business Process ReengineeringManagement Reporting
! The numbers of FLAIR RDS and IW users are current actual totals provided by the FloridaDepartment of Banking and Finance
! The number of IW queries shown is the actual total for October 1999
! The average agency orders 75 RDS reports per month and each user spends 30 minutes per monthretrieving these reports
! FLAIR IW users spend 30 minutes per query
! Ten percent of all State agencies and universities have significant internal information systems—a limited number of users in these organizations develop an average of 20 reports per month,requiring 2 hours to produce each report (includes data input time)
! Agency data warehouse queries were not included in this total
! Of the estimated 26,000 management and professional staff in Florida State government (includes16,000 State agency users and 10,000 users in the State University System), 25 percent havepersonal computers that are used to produce periodic management reports
! An average of three reports are run off each PC, requiring 2 hours to produce each report(includes data entry time)
In all cases, we based our estimates on conservative assumptions.
Exhibit 3-8Management Reporting Workload Estimates for Florida State Government by Information Source
ManagementInformation Source
Total Number ofUsers (Est.)
Total Number ofReports Produced
per Month
Total Annual HoursDeveloping and/orRetrieving Reports
FLAIR RDS 8,900 2,925 53,600
FLAIR IW 450 9,200 55,200
Agency Information Systems 100 2,000 4,000
PC databases 6,500 19,500 39,000
Total — 33,625 151,800
Source: KPMG interviews and State of Florida, Department of Banking and Finance
Although the estimated workload data in Exhibit 3-8 appears high, managers in the five study
organizations reported problems in obtaining reports quickly, easily, and tailored to their specific
information needs. The Florida Department of Children and Families has attempted to mitigate these
difficulties by developing its own data warehouse—the Information Delivery System (IDS). Recent
statistics indicate that IDS is currently logging nearly 70,000 queries per month, or approximately
840,000 queries per year. This annual count represents nearly twice the total statewide volume of reports
developed in FLAIR and on agency systems and PC databases (33,625 reports). Based on this

3—Business Process Reengineering Business Case StudyManagement Reporting
comparison, it appears that current management reporting resources are not sufficient to meet the needs of
the State’s 26,000 management and professional staff.
Current Process Cost
The cost of the current financial management reporting process from FLAIR is derived by analyzing three
cost components—customer costs, agency costs, and centralized costs. Customer costs generally reflect
the time an individual spends completing a form or entering data to initiate a process. Agency costs reflect
the labor costs of the agency personnel devoted to carrying out the process. Centralized costs reflect the
labor costs of personnel who are located in a statewide administrative support agency and who participate
in the process statewide
The cost analysis focuses on direct labor costs. Overhead and other indirect costs associated with the
process are excluded. The costs measured in the five study agencies are extrapolated to the rest of State
government based on workload factors that most affect the costs. The categories and the costs for the five
study agencies and for estimates of those categories and costs statewide are described below.
Customer Costs: The process does not include a customer cost as defined in this analysis.
Agency Costs: Agency costs consist of the time spent by agency personnel using the FLAIR RDS or IW
to retrieve desired management reports, or in downloading or key-entering information from FLAIR to
agency management systems, data warehouses or PC desktop applications. As shown in Exhibit 3-9, State
employees spend about 151,800 hours per year to developing and retrieving management reports.
Centralized Costs: Centralized costs consist of the time spent by FLAIR administrative staff maintaining
systems and developing and producing desired reports. Effectively, two FTEs from FLAIR assist agencies
in maintaining systems and in developing or running management reports.
The estimated current cost of reporting the State’s financial management information maintained in
FLAIR, summarized by information source, is presented in Exhibit 3-9. The costs were derived by
estimating the annual hours required to develop and retrieve various management reports. These hours
were then multiplied by an estimated average labor cost of an Accountant II ($28,406 divided by 1,850
hours per year).

Business Case Study 3—Business Process ReengineeringManagement Reporting
Exhibit 3-9Costs for Reporting Financial Management Information by Source
Management Information Source
Estimated Hours forDeveloping and/orRetrieving Reports Total Cost
FLAIR RDS 53,600 $823,006
FLAIR IW 55,200 847,574
Agency Information Systems 4,000 61,418
PC databases 39,000 598,829
Total 151,800 $2,330,827
Source: KPMG interviews and State of Florida, Department of Banking and Finance
In total, the State annually expends an estimated $2.3 million in agency costs and $60,000 in centralized
costs to carry out the management reporting process.
Current Process Weaknesses
The overall managers of the State—the Legislature and the Governor—need enterprisewide information
to support them in making enterprisewide decisions. Some enterprisewide information resides in FFMIS,
but too often it does not. When such information is not readily available, the State is faced with two
choices—do without or undertake an ad hoc data gathering exercise that could involve literally hundreds
of analysts and accountants throughout State government. Several factors have contributed to the
difficulty in reporting enterprisewide financial management information:
! Policies and procedures for financial management vary among agencies. The State has noaccounting policies and procedures manual
! The Chart of Accounts is expansive, inconsistent, and outdated
! The State has not developed a set of common core financial management data that every agencyshould collect and report in a consistent manner
The decentralized approach to financial management is supported by dual ledger systems. FLAIR
includes a Central Accounting System and a separate Departmental Accounting System.
State agencies need simple, timely access to accounting and human resource data to assess operational
performance and support decision making. However, the means to secure this information is often costly
and time consuming. Problems identified with the State’s current management information processes
include the following issues:
! FLAIR RDS does not support ad hoc reporting. Information available in RDS is limited by theformat and content inherent in standard reports and any custom reports an agency may have

3—Business Process Reengineering Business Case StudyManagement Reporting
developed. Also, agencies without technical staff capable of writing Natural programs cannotdevelop desired RDS custom reports.
! The FLAIR IW is reportedly difficult to use. Access and query capabilities are limited. IWusage—measured as a percentage of an agency’s total management staff that routinely taps thesystem to retrieve data—is extremely low. It appears that critical management information in theIW, when requested, is funneled through a limited number of agency staff.
! The current Chart of Accounts lacks a coherent logical structure. As such, it is often animpediment to extracting statewide financial management information. Over time, codes havebeen added as needed, few codes have been deleted, and no attempt has been made to rationalizecodes that do exist.
! Because RDS and IW do not fully support management reporting needs, managers who needspecific archived information to evaluate an organization’s operational performance or to supportdecision making will typically exercise one of the following options:
– Ask other employees who have access and experience working with RDS and IW to retrieverequested information. This option involves RDS and IW system expenses and personnelcosts associated with requesting and distributing reports.
– Refer to historical data recorded on their own PC desktop applications or on other agencydatabases. In this option, the agency incurs systems and personnel costs associated withstoring data in more than one location:
! Cost of redundant data entry and storage
! Costs incurred when data stored in multiple locations is misplaced
! Cost of validating information found to be inconsistent
! Lacking useful management information:
– Managers may make inappropriate and potentially costly decisions
– Agencies may not be able to determine the degree to which strategies, action plans, and workmethods are successful in helping the organization to achieve its goals and objectives
In summary, inefficiencies in the State’s current statewide management reporting processes are seriously
restricting management and professional staff from quickly and easily obtaining reports tailored to their
unique information needs. The result is the huge dispersed and largely hidden cost of gathering financial
management information that does not fit neatly into the current Chart of Accounts or standard financial
management reports.

Business Case Study 3—Business Process ReengineeringManagement Reporting
Reengineered Process
The weakness in the management reporting process can be addressed by first identifying the core
financial management information needed to manage the State as an enterprise, developing a statewide
information warehouse, and changing the Chart of Accounts to support those core information needs.
Recommendation BPR-1: Identify enterprisewide financial management informationneeds
The State should identify the core financial management information that it needs from every agency and
program throughout the government to manage the State as an enterprise. This challenge is the same
management and organizational challenge that conglomerates face in the private sector. Stockholders
expect the enterprise to be profitable but the businesses that make up the conglomerate often have
different ways of reporting financial information. Likewise, Florida’s stakeholders expect the State to be
fiscally sound.
With input from the legislative budget staffs, the Governor’s budget office, selected central administrative
support agencies, and agency representatives, the State should identify the core financial management
data needed to manage the State as an enterprise.
Fiscal Impact: This recommendation will require the use of existing resources to develop an
enterprisewide financial management data plan. The existence of enterprisewide financial information
should significantly affect critical legislative and executive branch decisions. Better information can yield
better financial decisions that will benefit the State and its stakeholders.
Recommendation BPR-2: Develop a flexible decision support system by providing Stateagencies with the ability to create their own custom management reports
To give State employees the ability to develop their own customized management reports quickly and
easily, the State should develop a data warehouse for storing and retrieving management information.
This data warehouse should have the following features:
! Is accessible via the Internet, to provide remote offices and mobile employees with the capabilityto view and download management information
! Provides interactive, user-friendly query tools
! Is updated with information from an integrated financial management system nightly
! Includes historical data
! Enables State agencies to enter selected other data to the system

3—Business Process Reengineering Business Case StudyManagement Reporting
The data warehouse should have detailed transaction operational information as well as derived
information. The State will need to make a concerted effort to identify the derived (value-added)
information to be included in the data warehouse. By developing this derived information, the State can
increase significantly the usefulness of the data warehouse.
Costs for the data warehouse could be offset by financing the implementation and system maintenance
expenses through an enterprise fund—charging each agency according to the data volume stored and for
each query posted.
For agencies that have already invested in their own data warehouse solutions, the State should develop a
simple means for downloading daily transactions from its integrated financial management system to the
agency’s data warehouse.
Fiscal Impact: The most significant impact from implementation of this recommendation is that State
managers will be in a better position to make financial management decisions that affect the State’s
bottom line. Managers will be able to focus more of their time on planning, decision making, and resource
allocation rather than on gathering and verifying information. The total number of FTE hours for those
currently involved in developing management reports would decrease. Managers would have access to
better information that should result in better decision making and lower overall cost of government
service.
Recommendation BPR-3: Streamline and reengineer the Chart of Accounts to reflectreporting requirements
The State is reviewing and reengineering its Chart of Accounts. The Chart of Accounts should allow
managers to track financial data consistent with legislated reporting requirements. The new Chart of
Accounts should support performance budgeting and unit costing specifically.
Fiscal Impact: Implementation of this recommendation is expected to eliminate a significant portion of
existing and future manual processes needed to develop and report program and unit cost information that
cannot be reported now through FLAIR. With better information, managers will be able to make more
effective program management decisions. The most significant effect will be improved government
services.
Reengineered Process—System Requirements
A statewide data warehouse for storing and retrieving accounting and human resource information should
be developed and have the following features:

Business Case Study 3—Business Process ReengineeringManagement Reporting
! Is accessible via the Internet
! Provides interactive, user-friendly query tools
! Is updated with information from an integrated financial management system nightly
! Includes historical data
! Enables State agencies to enter selected other data to the system
Additionally, agencies should be able to download daily transactions from the integrated financial
management system to their existing proprietary data warehouses.
Options Analysis
The proposed reengineering solution for developing management reports based on information in
FLAIR—developing a statewide data warehouse—can be accomplished with all systems alternatives
except Option 1, maintaining the status quo. Option 2 will see partial savings in management reporting
because consolidation of a statewide decision support system will be limited by the lack of a uniform
Chart of Accounts. Options 3 through 5 include the capabilities for a financial data warehouse and easier
reporting capabilities necessary to support the financial management reporting process. Exhibit 3-10
provides the savings associated with each of the five alternatives.

3—Business Process Reengineering Business Case StudyManagement Reporting
Exhibit 3-10Summary of Annual Savings by Option
OptionBudgetarySavings
IncreasedEfficiency
Total BPRSavings
Recommendation BPR-1
Option 1 $0 $0 $0
Option 2 0 0 0
Option 3 0 0 0
Option 4 0 0 0
Option 5 0 0 0
Recommendation BPR-2
Option 1 0 0 0
Option 2 0 0 0
Option 3 0 0 0
Option 4 0 0 0
Option 5 0 0 0
Recommendation BPR-3
Option 1 0 0 0
Option 2 0 0 0
Option 3 0 0 0
Option 4 0 0 0
Option 5 0 0 0
Total
Option 1 $0 $0 $0
Option 2 $0 $0 $0
Option 3 $0 $0 $0
Option 4 $0 $0 $0
Option 5 $0 $0 $0

Business Case Study 3—Business Process ReengineeringAccounting for Payments from Multiple Accounts

Business Case Study 3—Business Process ReengineeringFinancial Reporting
3.4 Recommended Process Changes—Financial Reporting
This section presents recommendations for reengineering the State of Florida’s financial reporting
process—the process for producing the Comprehensive Annual Financial Report (CAFR).
Background
The CAFR is a formal, audited presentation of the State’s financial and operating activities that is
prepared after each fiscal year-end. The CAFR is prepared in conformance with Generally Accepted
Accounting Principles prescribed by the Governmental Accounting Standards Board (GASB) and
includes combined balance sheets, operating statements, and cash flow statements for the Florida State
government. It also includes selected statistical and economic data. State agencies provide input to the
State Comptroller for preparation of the CAFR. Some State agencies also develop their own unique
financial reports, as needed, to secure bond funding, grants, and other revenue sources. The CAFR reports
on the financial health of the State and as such is important for the State’s overall bond rating.
The CAFR process is a set of procedures and activities performed by personnel in the State Comptroller’s
office, each State agency, and the Auditor General’s office to prepare financial statements and other
information to be included in Florida’s CAFR.
The CAFR and other agency-specific financial reports are used by a broad cross-section of customers,
including legislators and other elected officials, agency managers and directors, commercial lending
institutions, the general public, and policy groups to:
! Compare actual financial results with the legally adopted budget
! Assess financial conditions and the results of operations
! Assist in determining compliance with finance-related laws, rules, and regulations
! Assist in evaluating government efficiency and effectiveness
Creation of the CAFR requires participation of departmental accounting units statewide. When FLAIR’s
Departmental Accounting System was originally implemented, the State did not publish a CAFR. Each
State agency published its own financial statements. Consequently, FLAIR’s Departmental Accounting
System was not designed to consider the State as an enterprise. The Central Accounting System in FLAIR
is not structured to report all relevant agency-level detail at an enterprisewide level.
Chapter 16 of the Florida Statutes requires the State Comptroller to prepare audited statewide financial
reports annually. The CAFR is prepared in conformance with Generally Accepted Accounting Principles
as prescribed in pronouncements of the GASB. Florida voters passed a referendum effective January 2003
that combines the offices of the State Comptroller and the Treasurer into a Chief Financial Officer.

Business Case Study 3—Business Process ReengineeringFinancial Reporting
Current Process
The State Comptroller uses FLAIR ledger files and desktop applications to develop the CAFR. At the end
of each fiscal year, the State Comptroller’s Financial Reporting section downloads the FLAIR
Departmental Accounting System records to a Statewide Master File, a FLAIR module. It develops a
FoxPro database file to analyze, sort, and compare information provided by each agency. Before
producing a final report, the Auditor General’s comments and corrections are included.
When the CAFR is reviewed, proofed, and edited, approximately 500 copies are printed and distributed.
After the CAFR is presented to the Governor (typically by mid-February of the following fiscal year), the
State-wide Financial Reporting Section within the State Comptroller’s office prepares a PDF and HTML
file version to post on the State Comptroller’s Internet site.
Current Process Performance
The performance of the financial reporting process is usually measured by how quickly the CAFR is
issued after the close of the fiscal year. By that measure, Florida’s performance is poor. Forty-three of the
50 states issue their CAFRs within 6 months of the close of the fiscal year. For Fiscal Year 1998, Florida
issued its CAFR 8 months after the close of the fiscal year. For Fiscal Year 1999, Florida expects to issue
its CAFR within 7 or 8 months after June 30, 1999.
Current Process Costs
The cost of the financial reporting process is derived by analyzing three cost components—customer
costs, agency costs, and centralized costs. Customer costs generally reflect the time an individual spends
completing a form or entering data to initiate a process. Agency costs reflect the labor costs of agency
personnel devoted to carrying out the process. Centralized costs reflect the labor costs of personnel who
are located in a statewide administrative support agency and who participate in the process statewide.
The cost analysis focuses on direct labor costs. Overhead and other indirect costs associated with the
process are excluded. The costs measured in the five study agencies are extrapolated to the rest of State
government based on workload factors that most affect the costs. The categories and costs for the five
study agencies and statewide are described below.
Customer Costs: This process does not include a customer cost as defined in this analysis.
Agency Costs: Agency costs consist of personnel time and expense on the part of accounting offices in 49
agencies required to collect, analyze, and submit year-end financial data needed by the State Comptroller
to produce the CAFR. For the five study agencies, accounting offices spent 14,606 hours or 7.9 FTEs
developing the CAFR. The amount of time and effort that each agency expends preparing information

Business Case Study 3—Business Process ReengineeringFinancial Reporting
needed by the State Comptroller to prepare the CAFR varies. Agency level-of-effort estimates (FTE
hours) are summarized in Exhibit 3-11.
Exhibit 3-11Estimate of Personnel Hours to Prepare Florida’s CAFR
Agency Total FTE HoursTotal Estimated Number
of Effective FTEs
Department of Transportation 4,000 2.2
Department of Children and Families 2,460 1.3
Department of Highway Safety and MotorVehicles
316 0.2
Department of Insurance, Treasury andState Fire Marshal
200 0.1
University of Florida 7,630 4.1
Total 14,606 7.9
Source: KPMG interviews of various Florida State fiscal personnel
Generally, agencies with larger budgets, greater number of funds, and greater number of geographic
locations, etc., require more time and resources to support the State Comptroller’s preparation of the
CAFR. Following this assumption, Florida’s total estimated personnel costs for this process can be
approximated by factoring the labor costs assumed by the five study organizations in preparing the CAFR
by a ratio of the State’s total appropriations divided by the sum of the appropriations for the five study
agencies. This cost extrapolation is summarized in Exhibits 3-12 and 3-13.

Business Case Study 3—Business Process ReengineeringFinancial Reporting
Exhibit 3-12FTE Costs and Fiscal Year 1999 Appropriations for Study Agencies
Agency Number of FTEs Cost of FTEsFiscal Year 1999
Appropriations
Department ofTransportation
2.16 $61,357 $5,592,308,779
Department of Children andFamilies
1.33 37,780 3,553,149,918
Department of HighwaySafety and Motor Vehicles
0.17 4,829 334,648,029
Department of Insurance,Treasury and State FireMarshal
0.11 3,124 124,036,407
University of Florida/StateUniversity System
4.11 116,749 1,066,279,000
Total Study Agencies 7.88 $223,839 $10,670,422,133
Notes: (1) Assume $28,406 Salary + Fringe Benefits per FTE (average) and 1,854 hours per year(2) Excludes certify forward related costs
With total statewide appropriations for Fiscal Year 1999 of $49.5 billion, the ratio of statewide
appropriation to study agency appropriations is 4.6 to 1. The extrapolated cost of all State agency
personnel in processing the CAFR, therefore, would be approximately $1,040,000, and the total number
of actual and “effective” FTEs would be 36.6.
Exhibit 3-13Estimated Statewide CAFR Development Costs
Cost ComponentNo. of FTEs
(Actual and “Effective”) Personnel Costs
State Agencies 36.6 $1,040,000
State Comptroller 5.0 261,000
Auditor General 15.0 648,000
Total 56.6 $1,949,000
Centralized Costs: Centralized costs consist of personnel time and expense to solicit, collect, input,
analyze, audit, and present financial information required in the CAFR. The State Comptroller dedicates 5
FTEs that have an average salary plus benefits of $52,116 to this process while the Auditor General
dedicates 15 FTEs that have an average salary and benefits of $43,230.
Combining the cost of personnel in the Auditor General’s and State Comptroller’s offices (as shown
above), the total annual cost of preparing the CAFR is an estimated $1,949,000.
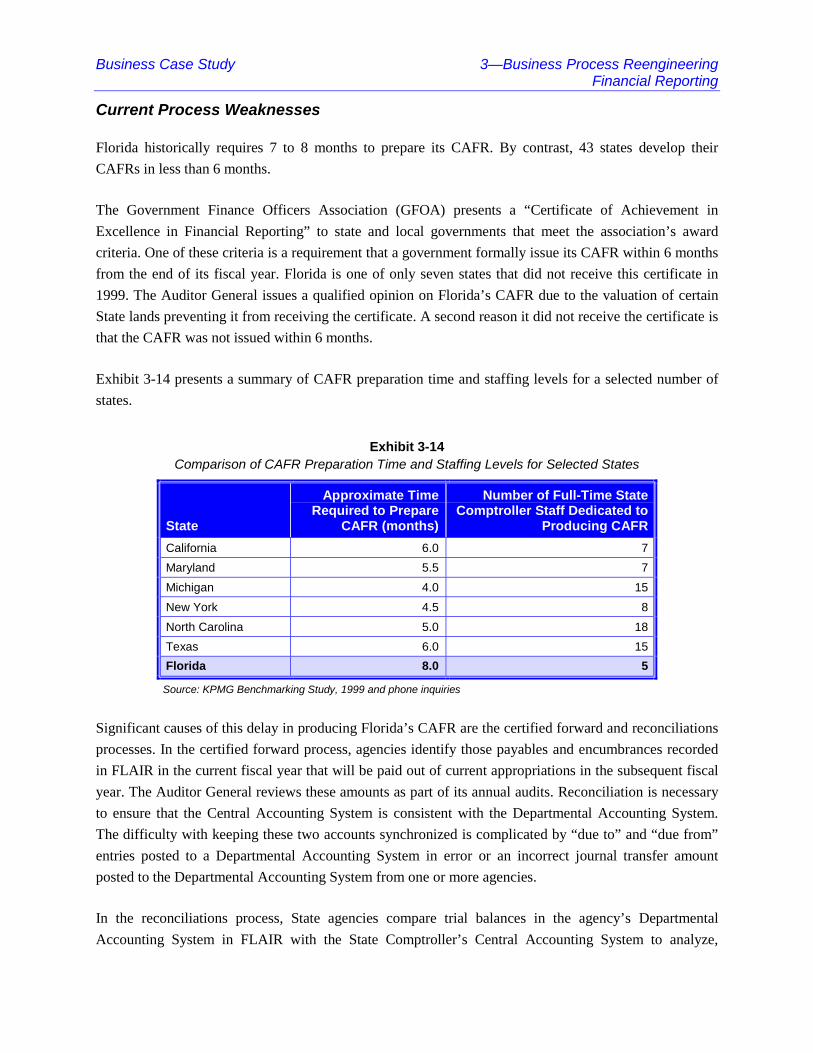
Business Case Study 3—Business Process ReengineeringFinancial Reporting
Current Process Weaknesses
Florida historically requires 7 to 8 months to prepare its CAFR. By contrast, 43 states develop their
CAFRs in less than 6 months.
The Government Finance Officers Association (GFOA) presents a “Certificate of Achievement in
Excellence in Financial Reporting” to state and local governments that meet the association’s award
criteria. One of these criteria is a requirement that a government formally issue its CAFR within 6 months
from the end of its fiscal year. Florida is one of only seven states that did not receive this certificate in
1999. The Auditor General issues a qualified opinion on Florida’s CAFR due to the valuation of certain
State lands preventing it from receiving the certificate. A second reason it did not receive the certificate is
that the CAFR was not issued within 6 months.
Exhibit 3-14 presents a summary of CAFR preparation time and staffing levels for a selected number of
states.
Exhibit 3-14Comparison of CAFR Preparation Time and Staffing Levels for Selected States
State
Approximate TimeRequired to Prepare
CAFR (months)
Number of Full-Time StateComptroller Staff Dedicated to
Producing CAFR
California 6.0 7
Maryland 5.5 7
Michigan 4.0 15
New York 4.5 8
North Carolina 5.0 18
Texas 6.0 15
Florida 8.0 5
Source: KPMG Benchmarking Study, 1999 and phone inquiries
Significant causes of this delay in producing Florida’s CAFR are the certified forward and reconciliations
processes. In the certified forward process, agencies identify those payables and encumbrances recorded
in FLAIR in the current fiscal year that will be paid out of current appropriations in the subsequent fiscal
year. The Auditor General reviews these amounts as part of its annual audits. Reconciliation is necessary
to ensure that the Central Accounting System is consistent with the Departmental Accounting System.
The difficulty with keeping these two accounts synchronized is complicated by “due to” and “due from”
entries posted to a Departmental Accounting System in error or an incorrect journal transfer amount
posted to the Departmental Accounting System from one or more agencies.
In the reconciliations process, State agencies compare trial balances in the agency’s Departmental
Accounting System in FLAIR with the State Comptroller’s Central Accounting System to analyze,

Business Case Study 3—Business Process ReengineeringFinancial Reporting
identify, and resolve exceptions and make adjusting entries necessary to reconcile the agency’s accounts
to the Central Accounting System.
The process of developing the CAFR is further slowed by awkward systems, interfaces, and network
applications, resulting in paper-laden, labor-intensive work activities. Problems with the current process
include the following issues:
! Process is paper-intensive and involves frequent information and data exchanges betweendepartments and agencies via mail or courier:
– State Comptroller prints and distributes SWFS forms, instructions, and reports downloadedfrom its Statewide Master File
– Most (but not all) agencies print trial balances of their FLAIR records for internal distributionand analysis
– Agencies manually complete SWFS forms and mail them back to State Comptroller (a fewreturn forms on disk)
– Agencies manually complete post-closing adjustments and mail them to State Comptroller(more than 1,000 agency adjustments and nearly 2,000 Comptroller adjustments in FiscalYear 1998)
– State Comptroller develops a discrepancy report and distributes it to agencies for resolution
– Agencies resolve issues on the discrepancy report and mail it back to State Comptroller
! Automated processes are awkward:
– Agencies that elect to download their trial balances from FLAIR must write subroutines toprocess the transfer of records to agency databases
– Agency information must be loaded into the State Comptroller’s Statewide Master Fileovernight by FLAIR systems personnel
– SWFS data is key-entered to FoxPro database file for analysis
– State Comptroller must run a comparison report to confirm agreement between data in theStatewide Master File and FoxPro database
– Edited information in the Statewide Master File must be transferred to an MS Excel file toformat CAFR-combined financial statements
! After the first draft of the CAFR is reviewed by the Auditor General, revisions must be entered tothe Statewide Master File and the revised data transferred to MS Excel file again
! Maintaining separate ledgers for the Central Accounting System and Departmental AccountingSystem within FLAIR requires a great deal of time and expense to reconcile

Business Case Study 3—Business Process ReengineeringFinancial Reporting
In addition to the slowness of the process, the State lacks a standard set of accounting policies and
procedures. In many cases, agencies follow their own department-based policies and procedures, which
differ from other agencies’ policies and procedures. This can affect the coding of actions or purchases and
the timing of transactions. Inconsistency in accounting policies and procedures bears directly on the time
it takes to obtain accurate and consistent statewide financial information.
Another impending issue is the requirement to develop financial reports compliant with GASB Statement
34. The new financial reporting model prescribed in this GASB pronouncement must be used by the State
of Florida in developing its Fiscal Year 2002 CAFR. Fundamentally, it requires that Florida prepare new
governmentwide financial statements using accrual accounting for all activities. Long-term assets and
liabilities—including infrastructure assets and depreciation and expenses associated with maintaining
these assets—will need to be recorded. Also, all revenues and costs associated with providing government
services in a given year will need to be reported—not solely those received or paid in the current fiscal
year.
Reengineered Process
To address the weaknesses of the financial reporting process, the State should change its certified forward
process, establish a communications network that will enhance data exchange between the State
Comptroller and the agencies, and enhance system support to automate the rollup of statewide financial
data. In addition, the State should assess the impact of the new financial reporting requirements associated
with the GASB Statement 34.
Recommendation BPR-4: Estimate certified forward amounts to be reported in the CAFR
Significant delays in the CAFR development process are attributable to Florida’s practice of certifying
forward encumbrances from one fiscal year to the next. While Florida must report certified forward
amounts in its CAFR, it does not need to identify and audit each certified forward item to satisfy
Generally Accepted Accounting Principles financial reporting requirements. Instead, the State
Comptroller could develop reasonable, auditable estimates of its certified forward balances using a
program that:
! Identifies automatically all liabilities recorded in an agency’s accounts for the current fiscal year,but payable in the next
! Uses prior-year data to estimate the percentage of certified forward amounts that will be paid inthe 90-day period following the end of the fiscal year
! Applies these percentages to estimate the total certified forward amounts for this 90-day period

Business Case Study 3—Business Process ReengineeringFinancial Reporting
Certified forward estimates could be run in late August, when each agency has officially closed its books
for the fiscal year. The Auditor General could audit these estimates in September, decreasing the CAFR
development time by 30 days.
Fiscal Impact: By estimating certified forward balances to be reported in the CAFR, audit workload
would be reduced and the State could eliminate approximately one and a half FTE positions in the
Auditor General’s office—an annual saving of approximately $56,000. An estimated 15 FTEs from the
Auditor General’s office work on the statewide financial statement audit at any given time during an 8-
month period from June of one fiscal year to the end of January in the next fiscal year. Reducing this time
period by 1 month would effectively reduce the Auditor General’s workload by 12.5 percent—nearly two
FTEs. Additional savings relating to the certified forward process can be found in Recommendation
BPR-37.
Recommendation BPR-5: Establish communications network needed for the StateComptroller and State agencies to collect, compile, and exchange data for the CAFRelectronically
The State Comptroller should be able to retrieve all agency year-end fund balances and information
needed to prepare the CAFR from FLAIR or any other enterprise financial management system.
However, for the Financial Reporting Section to develop the CAFR, each agency would need to provide
information that the State Comptroller cannot readily obtain. This information relates to:
! Post-closing adjustments to cash ledgers for each fund
! Year-end payables and receivables (accrual amounts)
! Inventory values
! Balances for agency revolving and clearing funds
! Investments not included in one of the State Treasurer’s investment pools
! Value of compensated leave balances
! Long-term assets and liabilities
! Notes and disclosure information requested by the State Comptroller
To improve the accuracy and the speed by which this data is compiled and reviewed by each agency and
provided to the State Comptroller for incorporation into the CAFR, Florida should use the Internet to
facilitate the electronic exchange of financial information integral to this process. Information could be
exchanged by attaching files to e-mail or by posting data to specific, secure online libraries accessible to
the agency and the State Comptroller.

Business Case Study 3—Business Process ReengineeringFinancial Reporting
Fiscal Impact: By implementing this proposed change, the State would eliminate the time and related
expense associated with the redundant key-entering of data by staff at the agency level and in the State
Comptroller’s office. Considered together with the fiscal impact for recommendation BPR-6, we estimate
that the State could realize a 10 percent reduction in the time and expense it incurs preparing the CAFR
and other financial reports at a cost savings of approximately $90,000 per year.
Recommendation BPR-6: Automate the process of developing and formatting financialstatements for inclusion in the CAFR
The State Comptroller could efficiently and effectively develop and format the financial statements,
notes, and statistical data in its CAFR by acquiring a commercial software application such as
CAFRonMICRO, offered by the GFOA, or by acquiring or developing a comparable custom software
application. Ideally, this type of software solution would also:
! Provide the State Comptroller with the ability to produce interim financial statements
! Produce HTML or PDF file versions of the CAFR that can be easily posted to the StateComptroller’s Internet site
! Support State agencies that need to produce their own unique annual or interim financial reports
Fiscal Impact: By implementing this proposed change, the State would eliminate the time and related
expense associated with the manual entry and formatting of financial statements and statistics on desktop
productivity software—activities performed by staff in the State Comptroller’s office. Considered
together with the fiscal impact for recommendation BPR-5, the State could reduce the time it takes to
prepare the CAFR and other financial reports by 2 weeks—at a cost savings of approximately $90,000 per
year.
Recommendation BPR-7: Develop and enforce statewide accounting policies andprocedures
The State should convene a task force composed of Department Accounting System and Central
Accounting System staffs to develop a manual of accounting policies and procedures. These policies and
procedures should include a new Chart of Accounts with clear, consistent definitions of codes and
examples of how to use them. The manual should address issues of how and when to record transactions
and at what level of detail for statewide reporting purposes. The State Comptroller (or the Chief Financial
Officer beginning in January 2003) should be charged with overseeing the development of the policies
and procedures and ensuring compliance through training and audits. The process of developing these
standards has begun.
Fiscal Impact: This recommendation can be carried out primarily using internal resources. The State may
wish to use outside resources to compile and publish the policies and procedures manual, the cost of

Business Case Study 3—Business Process ReengineeringFinancial Reporting
which is estimated at $50,000. Training on the new policies and procedures is estimated to cost another
$50,000, assuming 100 key staff members from the 50 agencies are trained, with the members responsible
for training the accounting staffs in their agencies.
Recommendation BPR-8: Assess impact of new financial reporting requirements andincorporate into requirements for new financial management system solution
GASB Statement 34 requires that Florida re-evaluate the way it currently records and reports on its annual
financial operations. Changes from the current reporting model to the new model specified in this recent
GASB pronouncement include:
! Governmentwide reporting
! Focus on major funds and new focus added for government activities
! Changes in budgetary reporting
! Requirements for a narrative analysis to accompany basic financial statements
Key implementation challenges identified by GFOA include the requirement to address the following
issues and activities:
! Infrastructure reporting
! Depreciation accounting
! Conversion of data for governmental activities (for example, removing capital outlays and debtservice principal outlays from operating statements, reporting amortizations, and reporting certainexpenses and revenues not currently reported)
! Reporting cash flows from operating activities for proprietary funds
We understand that Florida is assessing its readiness to implement this new reporting model and is
defining necessary changes as requirements to be specified and included in its financial management
system. We have included the recommendation to raise awareness of the new reporting requirements.
Fiscal Impact: There would be no direct fiscal impact of this recommendation; however, failure to
implement by this date places Florida in potential jeopardy of not meeting SEC requirements for periodic
disclosure, thereby affecting its capacity to secure bond financing at favorable interest rates.
Reengineered Process—System Requirements
To implement recommendations proposed for reengineering the CAFR development process, the State
must implement the following systems requirements:

Business Case Study 3—Business Process ReengineeringFinancial Reporting
! Establish statewide intranet or Internet access capability, as required, to link all State agencies toprovide for timely, accurate, and cost-effective exchange of financial information betweenagencies and the State Comptroller’s office
! Create or acquire software that facilitates development of the CAFR and other agency orstatewide financial reporting requirements that:
– Interfaces or integrates with the new financial management system
– Provides interim and annual financial reporting capabilities for the State Comptroller’s officeand for individual State agencies
– Presents financial reports and notes compliant with requirements stated in GASBStatement 34
Options Analysis
Florida’s financial reporting processes are significantly affected by delays in the reconciliation process.
Recommendations that would improve this process could shorten the CAFR development cycle by as
much as 2 months. Costs associated with these process savings are included elsewhere in this report.
Recommendation BPR-4 requires that Florida develop a program that estimates certified forward balances
for a fiscal year automatically. This improvement strategy would reduce the Auditor General’s workload
by nearly 30 days, resulting in cost savings of approximately $56,000. Implementing recommendations
BPR-5 and BPR-6 (combined) requires the State to develop process and systems changes that would
reduce the CAFR development time frame by 2 weeks—reducing labor costs by approximately $90,000.
Recommendations BPR-4, BPR-5, and BPR-6 require that systems improvements be implemented. These
improvement strategies can be included in Options 2 through 5, but not in Option 1.
In addition, there is an initial cost of implementation of $100,000 for all five options in year 1 under
recommendation BPR-7. Exhibit 3-15 provides the savings associated with each of the five alternatives.

Business Case Study 3—Business Process ReengineeringFinancial Reporting
Exhibit 3-15Summary of Annual Savings by Option
OptionBudgetary
SavingsIncreasedEfficiency
Total BPRSavings
Recommendation BPR-4
Option 1 $0 $0 $0
Option 2 56,000 0 56,000
Option 3 56,000 0 56,000
Option 4 56,000 0 56,000
Option 5 56,000 0 56,000
Recommendations BPR-5 and BPR-6
Option 1 0 0 0
Option 2 0 90,000 90,000
Option 3 0 90,000 90,000
Option 4 0 90,000 90,000
Option 5 0 90,000 90,000
Recommendation BPR-7*
Option 1 (100,000) 0 (100,000)
Option 2 (100,000) 0 (100,000)
Option 3 (100,000) 0 (100,000)
Option 4 (100,000) 0 (100,000)
Option 5 (100,000) 0 (100,000)
Recommendation BPR-8
Option 1 0 0 0
Option 2 0 0 0
Option 3 0 0 0
Option 4 0 0 0
Option 5 0 0 0
Total
Option 1 ($100,000) $0 ($100,000)
Option 2 ($44,000) $90,000 $46,000
Option 3 ($44,000) $90,000 $46,000
Option 4 ($44,000) $90,000 $46,000
Option 5 ($44,000) $90,000 $46,000
* The amounts are included in year 1 only

Business Case Study 3—Business Process ReengineeringAccounting Reconciliation Process
3.5 Recommended Process Changes—Accounting Reconciliation
This section presents the recommendations for reengineering the State of Florida’s process for reconciling
the FLAIR Departmental Accounting System with the FLAIR Central Accounting System.
Background
Using the accounting reconciliation process, State agencies compare trial balances in the agency’s
Departmental Accounting System of FLAIR with the Central Accounting System. This process allows the
agencies to analyze, identify, and resolve exceptions and make adjusting entries necessary to reconcile the
Departmental Accounting System with the Central Accounting System. The principal customers in this
process are the State Comptroller and each State agency. Reconciliation processes occur throughout State
government whenever the same piece of information is maintained on two systems. This analysis focuses
on reconciliation between the Departmental Accounting System and Central Accounting System.
Generally, Chapter 216 of the Florida Statutes specifies accounting requirements for State agencies,
including reconciling actions necessary to develop a single, consistent set of financial records for the State
(currently the State Comptroller’s ledgers).
The FLAIR subsystem of FFMIS is used to record State accounting transactions. While the Departmental
Accounting System in FLAIR provides agency management with a budgetary check mechanism,
FLAIR’s Central Accounting System maintains a separate accounting system on a cash basis, for the
control of budget by line item of the appropriations act by the State Comptroller.
Some Florida State agencies have developed or acquired their own automated reconciliation programs.
These systems identify discrepancies between the State Comptroller’s ledgers and the agency’s FLAIR
records automatically. Most of these systems are programmed to interface with FLAIR to download
monthly trial balances through a variety of exchange mediums, commonly tape or disk transfer.
Supplemental systems and applications used by the five study agencies to automate the accounting
reconciliation process are summarized in Exhibit 3-16.

Business Case Study 3—Business Process ReengineeringAccounting Reconciliation Process
Exhibit 3-16Agency Supplemental Systems Used in the Reconcilation Process
AgencySupplementalSystem Purpose
InterfacesWith
Department of Transportation Automated CostReconciliation System
Identifies exceptions toComptroller’s ledgers
FLAIR
Department of Children and Families FLAIR/ComptrollerReconciliation System
Identifies exceptions toComptroller’s ledgers
FLAIR
Department of Insurance, Treasuryand State Fire Marshal
AutomatedReconciliation System
– –
Department of Highway Safety andMotor Vehicles
None – –
University of Florida AutomatedReconciliation System
Identifies exceptions toComptroller’s ledgers
FLAIR
Current Process
The accounting reconciliation process is a consequence of having two separate sets of financial records in
FLAIR—one official set maintained by the State Comptroller and another set kept by each State agency.
Most agencies reconcile these two accounts monthly—to avoid the undesirable task of reconciling 12
months of transactions at year-end.
The process of reviewing and reconciling outstanding items is similar in each State agency. Approaches
vary mainly in the volume of transactions to review each month and the methods used to identify
exceptions. Not surprisingly, agencies with the largest budgets have the most reconciliations to process.
Many agencies have acquired simple programs that compare agency FLAIR records with the State
Comptroller’s ledgers for each fund, noting items outstanding in either set of records. Both sets of records
are downloaded from FLAIR to the reconciliation program, commonly by tape or disk. Agencies without
access to automated reconciliation programs perform this process manually.
After outstanding items are identified, the agency must determine the source and cause of any exceptions.
Often, this involves communication with district, regional, or subsidiary offices. When the cause of the
exception is determined, the agency makes online adjustments to its FLAIR records, as required, to bring
its records into agreement with the State Comptroller’s ledgers. Alternatively, an agency may send a
reconciliation statement to the State Comptroller explaining exceptions that require an adjusting entry to
the Central Accounting System.

Business Case Study 3—Business Process ReengineeringAccounting Reconciliation Process
Current Process Performance
Exhibit 3-17 provides a summary of the average number of monthly cash and unexpended budget release
reconciling items for each study agency and the estimated number of FTE hours each agency spends in a
month performing necessary reconciling adjustments. In performing cash reconciliations, an agency
identifies and resolves differences between cash ledger entries recorded in the Central Accounting System
and Departmental Accounting System for a given time period. Similarly, an agency reconciles its
unexpended budget releases by identifying and resolving differences in Central and Departmental
accounts for funds that have been appropriated but have not yet been spent. Cash and unexpended budget
releases commonly represent most of an agency’s monthly reconciliation workload.
Exhibit 3-17Average Number of Monthly Reconciling Items for Study Agencies
AgencyNumber of CashReconciliations
Number of UnexpendedBudget ReleaseReconciliations
ApproximateNumber ofFTE hours
Department of Transportation 2,043 54 540
Department of Children and Families 5,594 282 3,400
Department of Highway Safety andMotor Vehicles
350 Not available 120
Department of Insurance, Treasury andState Fire Marshal
118 2 72
University of Florida 2,928 24 410
Source: KPMG Interviews of accounting personnel at DOT, DCF, DHSMV, DOI, and University of Florida, 1999
Current Process Costs
The cost of the reconciliation process is derived by analyzing three cost components—customer costs,
agency costs, and centralized costs. Customer costs generally reflect the time an individual spends
completing a form or entering data to initiate a process. Agency costs reflect the labor costs of the agency
personnel who are devoted to carrying out the process. Centralized costs reflect the labor costs of
personnel who are located in a statewide administrative support agency and who participate in the process
statewide.
The cost analysis focuses on direct labor costs. Overhead and other indirect costs associated with the
process are excluded. The costs measured in the five study agencies are extrapolated to the rest of State
government based on workload factors that most affect the costs. The categories and the costs for the five
study agencies and statewide are described below.

Business Case Study 3—Business Process ReengineeringAccounting Reconciliation Process
Customer Costs: This process does not include a customer cost as defined in this analysis.
Agency Costs: Agency costs consist of district and central office accounting staff who identify and
resolve differences between the Departmental Accounting System and the Central Accounting System.
Exhibit 3-18 presents an estimate of personnel costs incurred by each of the five study agencies in
performing monthly reconciliation.
Exhibit 3-18Estimated Annual Cost of Reconciling Cash and Unexpended Budget Releases in Five Study Agencies
Agency
Number ofMonthly FTE
Hours
EffectiveNumber of
FTEsEstimated
Cost
Department of Transportation 540 3.5 $99,000
Department of Children and Families 3,400 22.0 625,000
Department of Highway Safety andMotor Vehicles
120 0.8 22,000
Department of Insurance, Treasury andState Fire Marshal
72 0.5 13,000
University of Florida 410 2.6 75,000
Total 4,542 29.4 $834,000
Assumptions: (1) $28,406 Salary + Fringe Benefits per FTE (average); (2) 1,854 hours per yearSource: KPMG interviews of accounting personnel in DOT, DCF, DHSMV, DOI, and University of Florida
Exhibit 3-19 presents a summary of total estimated annual costs incurred by all agencies in performing
reconciliations.
Exhibit 3-19Estimate of Total Annual Statewide Labor Costs for Reconciling Cash and Unexpended Budget Releases
Cost Component
Total ProcessCosts—Study
AgenciesExtrapolation
FactorTotal Statewide
Costs
State Agencies $759,000 5.16 $3,916,000
State University System 75,000 2.10 158,000
Total $4,074,000
The extrapolation factors are based on 1998-1999 appropriations data. For State agencies, we divided the
total statewide appropriations (other than the State University System [SUS]) by the sum of
appropriations for DOT, DCF, DHSMV, and DOI and calculated the factor to be 5.16. For the SUS, we
divided the total appropriations for all SUS schools by the appropriations for University of Florida and
calculated the factor to be 2.10.

Business Case Study 3—Business Process ReengineeringAccounting Reconciliation Process
Centralized Costs: Centralized costs include time spent by the State Comptroller addressing
reconciliations issues that affect its own ledgers or resolving discrepancies in interfund/interagency
journal transfers. It is estimated that the State spends approximately $58,000 per year for the
reconciliation process.
In total, the State annually expends an estimated $4.1 million in agency costs and $58,000 in centralized
costs to carry out the reconciliation process.
Current Process Weaknesses
Most of the reconciling items that State agencies identify and adjust each month are caused by problems
in trying to maintain two sets of ledgers for the Central Accounting and Departmental Accounting
Systems.
Reconciling items are affected by several different factors, including:
! Errors made in posting disbursements or receipts to a specific organization, object, or ledger code
! Timing differences created when an agency records a disbursement (that is, the agency issues avoucher and records it in the Departmental Accounting System, but the State Comptroller doesnot record this same disbursement in the Central Accounting System until the warrant is issued)
! Disbursements corrections made to the Central Accounting System that the State Comptroller’soffice does not communicate to the appropriate State agency
Several Florida State agencies have acquired reconciliation programs that detect and identify
discrepancies between two ledgers automatically. Most agencies, however, still perform this activity
manually. After the reconciling item is identified—whether automatically or manually—the agency
determines the status of the exception by reviewing and comparing amounts posted to each ledger—
another manual process. When each exception is resolved, the agency or the State Comptroller makes
adjusting entries online.
Many agencies also need to reconcile cash balances every month for each revolving account and clearing
funds account they maintain in local banks. These account balances are not recorded in FLAIR and
consequently are not affected by most of the issues listed above. However, the high volume of monthly
activity in these accounts results in a supplemental reconciliation activity that most agencies perform
manually.
Reengineered Process
The only way to change the reconciliation process significantly is to end the practice of maintaining a
Central Accounting System separate from the Departmental Accounting System.

Business Case Study 3—Business Process ReengineeringAccounting Reconciliation Process
Recommendation BPR-9: Implement an automated financial management system thatmaintains a single set of accounts for each fund
Florida should implement an automated financial management system featuring a single set of ledgers for
each fund. Ledgers would be secure, shared, online files that are available only to the managing agency,
the State Comptroller, and the State Treasurer. Generally, the roles to be assumed by each of these entities
in maintaining the State’s financial records under a single-ledger system, would be as follows:
! Agency: The agency managing a particular fund would assume primary authority andresponsibility for posting transactions to its own ledgers. Journal transfers, Treasury receipts, andcorrections identified by the State Comptroller would be posted to the ledger only with themanaging agency’s online concurrence
! State Comptroller: The State Comptroller would audit selected ledger transactions, reviewingthose entries automatically identified by the system according to criteria it predefines. Exceptionswould be presented to the agency managing a fund, with correcting entries automatically postedto the fund’s ledgers only with the agency’s online concurrence
! State Treasurer: The State Treasurer would electronically notify an agency regarding receipts itproposes to credit to a particular fund. The revenue entry would automatically be posted to thefund’s ledgers only with the agency’s online concurrence
Fiscal Impact: By implementing a single-ledger system, Florida could eliminate 70 percent of the
reconciling items that it must resolve each month. The annual cost savings to three of the larger study
agencies alone (that is, DOT, DCF, and University of Florida) would be an estimated $560,000. Our
estimate was derived from eliminating 70 percent of the FTEs currently performing reconciliations and
using an estimated annual cost per FTE of $28,406 (average salary and benefits for an Accountant II).
The estimated FTEs used to extrapolate to Other State Agencies and Universities was derived by applying
extrapolation factors based on relative appropriations for nine of Florida’s largest agencies and nine other
State universities. The resulting total cost savings to Florida’s largest agencies, estimated to be
$2,739,000, is summarized in Exhibit 3-20 provided at the end of this section. The resulting total cost
savings to the remaining Florida agencies is estimated to be $109,000, bringing the statewide savings to
$2,848,000.
Recommendation BPR-10: Require online approval from both agencies before aninterfund or interagency journal transfer can be entered to the financial managementsystem
Many reconciling items result from journal transfers that are unilaterally posted to an agency’s ledgers
without the agency’s knowledge or consent. Considered together with recommendation BPR-9, the State
should develop an automated financial management system that requires concurrent online approval from
Business Case Study 3—Business Process ReengineeringAccounting Reconciliation Process
both agencies before an interfund or interagency journal transfer can be entered into either agency’s
ledgers.
Fiscal Impact: The cost savings associated with this recommendation are included in the discussion for
recommendation BPR-9.
Recommendation BPR-11: Implement a system that rejects entries made withunrecognizable organization, object, or ledger codes
To eliminate key-entry errors caused by operators posting transactions to the wrong organization, object,
or ledger code, Florida should implement a financial management system that automatically rejects
entries with unrecognizable codes or with codes not commonly used by the agency for a given fund. The
system should continue to feature warning messages and provide the capacity to override the rejection,
but require a supervisor to approve the override.
Fiscal Impact: This recommendation could eliminate another 5 percent of the State’s current
reconciliation workload, which we estimate to be approximately $145,000.
Recommendation BPR-12: Establish online banking and automated reconciliationservices with local banks holding an agency’s revolving fund or clearing funds accounts
Many State agencies maintain revolving fund or clearing fund accounts in local banks to facilitate petty
cash transactions and accept certain local deposits before transferring these revenues to the State
Treasurer. These funds are not recorded in FLAIR and therefore are not subject to the accounting
reconciliation process issues addressed in recommendations BPR-9 and BPR-10. However, accounting
personnel in each agency must reconcile these account balances to the bank’s records—a process that can
be very time consuming and costly.
To address this problem partially, agencies could establish online bank accounts for their revolving and
clearing funds, and use automated reconciliation services to maintain accurate balances for each account.
Using a bank’s automated reconciliation services, an agency grants the bank authority to review its online
account register daily. The bank identifies exceptions and informs the agency of discrepancies found. The
agency would still need to determine the cause of any errant entry and make an adjusting entry. However,
the agency would maintain more accurate account balances and save a significant amount of the time that
it spends reviewing monthly (paper) bank statements and reconciling exceptions—weeks and sometimes
months after an incorrect entry is posted.
Fiscal Impact: The cost to implement this recommendation is minimal—most commercial banks offer
online banking and automated reconciliation services either free of charge or for a small monthly fee
although a substantial minimum balance may be required. However, the resulting time and cost savings to

Business Case Study 3—Business Process ReengineeringAccounting Reconciliation Process
each agency could be considerable. Because this process issue does not directly affect Florida’s integrated
financial management system, KPMG did not identify workload measures and process costs that could be
used to extrapolate an estimate of cost savings.
Reengineered Process—System Requirements
To implement recommendations proposed for reengineering Florida’s accounting reconciliation
processes, the State must address the following systems requirements:
! Maintain a single set of ledgers for each fund within the integrated financial management system
! Control access to ledger files and restrict authority to make account entries:
– Grant primary authority for recording all entries to a fund solely to the agency responsible formanaging that fund
– Permit State Comptroller personnel to view fund balances and ledger entries but restrict themfrom recording or adjusting entries
! Require online approval for interfund and interagency journal transfers from each agency that thejournal transfer affects
! Prevent entries with unrecognizable organization, object, or ledger codes by automaticallyrejecting such entries and requiring secondary approval to override the rejections
Options Analysis
Estimated savings from recommendations to improve Florida’s accounting reconciliation process can be
achieved in all the systems options except Option 1 and Option 2. Although Option 2 includes
modifications to the current system, it would not eliminate the practice of maintaining a central ledger
along with agency ledgers. Option 2 does not add savings to recommendation BPR-9; however,
recommendation BPR-10, which shares savings with recommendation BPR-9, does include Option 2. The
savings depend on the implementation of the following systems improvements:
! Implement a single set of ledgers for each fund
! Require online approval from both agencies before an interfund or interagency journal transfercan be entered to the financial management system
! Automatically reject entries made with unrecognizable organization, object, or ledger codes
Options 3 through 5 can provide the functionality required for these applications.
Exhibit 3-20 provides the savings associated with each of the five alternatives.

Business Case Study 3—Business Process ReengineeringAccounting Reconciliation Process
Exhibit 3-20Summary of Annual Savings by Option
OptionBudgetary
SavingsIncreasedEfficiency
Total BPRSavings
Recommendation BPR-9 and BPR-10
Option 1 $0 $0 $0
Option 2 0 0 0
Option 3 2,848,000 0 2,848,000
Option 4 2,848,000 0 2,848,000
Option 5 2,848,000 0 2,848,000
Recommendation BPR-11
Option 1 0 0 0
Option 2 0 145,000 145,000
Option 3 0 145,000 145,000
Option 4 0 145,000 145,000
Option 5 0 145,000 145,000
Recommendation BPR-12
Option 1 0 0 0
Option 2 0 0 0
Option 3 0 0 0
Option 4 0 0 0
Option 5 0 0 0
Total
Option 1 $0 $0 $0
Option 2 $0 $145,000 $145,000
Option 3 $2,848,000 $145,000 $2,993,000
Option 4 $2,848,000 $145,000 $2,993,000
Option 5 $2,848,000 $145,000 $2,993,000

Business Case Study 3—Business Process ReengineeringAccounting for Payments from Multiple Accounts
3.6 Recommended Process Changes—Accounting for Paymentsfrom Multiple Accounts
This section presents the recommendations for reengineering the State of Florida’s process for accounting
for payments from multiple accounts.
Background
Agencies make payments to employees and vendors regularly. The payroll and accounts payable
functions are present in some form in every State agency. Whenever a disbursement is made, an
expenditure amount equal to the disbursement amount must be charged against an expenditure account in
FLAIR. Normally, this is not a problem. However, when a disbursement is funded from more than one
expenditure account, a limitation in FLAIR requires that disbursements be expensed against only one
expenditure account. To ensure proper accounting, the State staff has to go back into FLAIR and, through
a series of journal transfers, allocate the expenditure amount to the proper expenditure accounts.
Specifically, the disbursement is made from one fund and an adjustment, Journal Transfer Voucher
Schedule, is prepared to effect the transfer of expenditures from the paying account to other supporting
accounts.
An alternative to executing a series of journal transfers is to issue more than one warrant to the vendor or
employee. The University of Florida does not perform back-end journal transfers to overcome the FLAIR
deficiency; instead, it issues multiple checks against a single invoice, thereby taking the alternative route
to solve the deficiency.
The issuance of a warrant in FLAIR is restricted by funds, category, and budget entity. If an agency
attempts to issue a warrant and it crosses either a funding source, category (for example, expense,
operating capital outlay, and other personal services), or budget entity, the agency cannot issue a single
warrant to the vendor. These restrictions cause the journal transfer process or the issuance of multiple
warrants for a single invoice. FLAIR currently has the capability to use a distribution matrix for PCard
and Electronic Data Interchange (EDI) payments, which eliminates the allocation problem for those
transactions.
State Statutes do not govern this process. It is a process created to address a deficiency in FLAIR.
Current Process
The smaller agencies that we studied rely on functionality within FLAIR to execute the fund journal
transfers, but large agencies with a high volume of federal grant activity have developed automated
systems to mitigate the manual workload. Of the agencies we reviewed, only one has a supplemental
system aimed specifically at automating this journal transfer process—DCF. The DCF system determines

Business Case Study 3—Business Process ReengineeringAccounting for Payments from Multiple Accounts
the amounts to be distributed by fund and generates accounting entries to effect the transfer of
expenditures from the paying account to the supporting account. Data is transferred regularly from
FLAIR to the Cost Journal Transfer (CJT) system and subsequently to the Automated Journal Transfer
(AJT) system to accomplish the objective.
The method for allocating payments from multiple accounts varies from agency to agency. Exhibit 3-21
indicates the variation among the five study agencies.
Exhibit 3-21Methods for Accounting for Payments from Multiple Accounts
Agency Method
Department of Transportation Pays nearly all its expenditures out of the StateTransportation Fund; therefore, these adjustments arean insignificant part of its workload
Department of Children and Families Uses an AJT system
Department of Highway Safety and MotorVehicles
Manual
Department of Insurance, Treasury and StateFire Marshal
Manual
University of Florida Issues multiple checks, avoids making journal transfers
Because of the variance reported, the process is separated into the automated (represented by DCF) and
the manual effort accomplished by the smaller agencies.
Current Process Performance
Exhibit 3-22 provides annual workload and performance information by agency for the accounting for
payments process described above.

Business Case Study 3—Business Process ReengineeringAccounting for Payments from Multiple Accounts
Exhibit 3-22Workload and Performance Metrics for Accounting for Payments from Multiple Accounts
Agency
Annual Workload(Hours) or System
MaintenanceTransaction
Activity FTEs
Department of Transportation Not applicable Not applicable Not applicable
Department of Children and Families $300,000 5,708,671 debits Automated system
Department of Highway Safety and MotorVehicles
696 hours* Unable todetermine
0.4
Department of Insurance, Treasury and StateFire Marshal
Insignificant amount Insignificantamount
Insignificantamount
University of Florida Not applicable Not applicable Not applicable
*Workload hours represent agency estimate for manual fund journal transfer activities for a given fiscal year
The only agency that was able to provide reliable workload transaction volume was DCF. The agency
uses a Financial Data Warehouse that is capable of providing transaction counts from FLAIR on a
multitude of agency activities. The agency reported that 5,708,671 debits were posted by the AJT system
in Fiscal Year 1999. The other agencies do not have systems in place to perform this process or were
unable to determine the transaction activity associated with the process.
Current Process Costs
The cost of the accounting for payments from multiple accounts is derived by analyzing three cost
components—customer costs, agency costs, and central costs. Customer costs generally reflect the time
an individual spends completing a form or entering data to initiate a process. Agency costs reflect the
labor costs of the agency personnel devoted to carrying out the process. Central costs reflect the labor
costs of personnel who are located in a statewide administrative support agency and who participate in the
process statewide.
The cost analysis focuses on direct labor costs. Overhead and other indirect costs associated with the
process are excluded. The costs measured in the five study agencies are extrapolated to the rest of State
government based on workload factors that most affect the costs. The categories and costs for the five
study agencies and statewide are described below.
Customer Costs: The process does not include a customer cost as defined in this analysis.
Agency Costs: Agency costs for this process are incurred for all types of expenditures including payroll
expenditures. Exhibit 3-23A summarizes agency efforts to allocate payments from multiple accounts by
agency. Exhibit 3-23B summarizes agency-related efforts to make adjustments in FLAIR to update their
payroll Departmental Accounting System. The costs include FTEs and systems operation and
maintenance costs.

Business Case Study 3—Business Process ReengineeringAccounting for Payments from Multiple Accounts
Exhibit 3-23AAgency Estimates for FTEs or System Maintenance Costs to Allocate Payments from Multiple Accounts
AgencyAgency
FTEsAgency SystemMaintenance $
Total Cost ofAllocation Process
Department of Transportation NotApplicable
– –
Department of Children and Families 0.0 $300,000 $300,000
Department of Highway Safety and Motor Vehicles 0.4 – 12,000
Department of Treasury, Insurance and State FireMarshal
0.0 – –
University of Florida NotApplicable
– –
Total 0.4 $300,000 $312,000
The agency FTEs represent the central staff required to make manual adjustments in FLAIR to allocate
payments from a single funding source to the appropriate authorized funding sources. We used statewide
budget figures to estimate the statewide cost savings associated with modifying this process. The process
required using the workload FTEs reported by DHSMV and the total Fiscal Year 1999 appropriations for
all State agencies. The DHSMV Fiscal Year 1999 total appropriations of $334,648,029 was divided by its
corresponding FTE to determine an appropriation dollars/FTE of $836,620,073. The appropriations for
each agency that does not have an AJT system was then divided by the appropriation dollars/FTE figure
to estimate the number of FTEs in an applicable agency associated with accounting for payments from
multiple accounts. We estimated that 55 statewide FTEs were associated with this process at an estimated
cost of $1,562,330. We have not extrapolated the cost of maintaining DCF’s fund journal transfer systems
because it is unique among State government agencies.
Exhibit 3-23BAgency Estimates for FTEs or System Maintenance Costs to Allocate Payments from Multiple Accounts
AgencyAgency
FTEsAgency SystemMaintenance $
Total Cost ofAllocation Process
Department of Transportation 2.7 – $77,000
Department of Children and Families 0.0 $116,220 116,220
Department of Highway Safety and Motor Vehicles 0.3 – 9,000
Department of Treasury, Insurance and State FireMarshal
0.1 – 3,000
University of Florida 8.0 – 227,000
Total 11.1 $116,220 $432,220
The agency FTEs represent the central and dispersed agency staffs required to process payroll File 0013
data and make adjustments in FLAIR to update their Departmental Accounting System. This includes
Business Case Study 3—Business Process ReengineeringAccounting for Payments from Multiple Accounts
systems and accounting or budgeting personnel who process the tape, produce reports for various
departments, and manually enter transaction 51s (unencumbered expenditure transactions) in FLAIR to
allocate the Central FLAIR payroll data to the departmental records. We used statewide numbers of
employees to estimate the statewide cost savings associated with modifying the payroll journal transfer
process. The study agencies require 11.1 FTEs to carry out the payroll journal transfer process for 27
percent of the State’s employees. Assuming that the number of FTEs is commensurate with the number of
employees being paid, we estimate that the State as a whole devotes 43 FTEs or $1.2 million to the
process. We have not extrapolated the cost of maintaining DCF’s system because it is unique among State
government agencies. All costs associated with this process were agency costs. In total, the State annually
expends an estimated $2.8 million in agency labor costs to carry out the accounting for payments from
multiple accounts and to allocate Central FLAIR payroll data to the departmental records.
Centralized Costs: No centralized costs were collected or reported.
Current Process Weaknesses
The accounting for payments from multiple accounts process has one significant weakness—FLAIR lacks
the capability to issue a warrant from multiple accounts. FLAIR does not accommodate multiple-fund
warrant issues, requiring the individual agencies to perform extensive journal transfers on the back-end of
an expenditure to ensure that the appropriated accounts are being expended for their intended use.
The problem is particularly acute in agencies such as the DCF that have large federal grant activity. If the
agency does not have disbursements in the appropriate fund categories when they do federal reporting, the
agency does not get reimbursed for its federal dollars. AJT systems move dollars to the accounts based on
the federal guidelines allowing them to maximize funds recoupment.
Reengineered Process
To address the weakness in the system that is causing additional journal transfer activity, the State needs
to change its system to accommodate the need to disburse from more than one fund.
Recommendation BPR-13: Develop the capability to automatically debit against morethan one account
The State’s accounting system should be able to charge payments against more than one account. If the
State’s Central Accounting System can disburse from more than one account, a significant amount of
manual data entry would be eliminated across State government.
Under the reengineered model, agency personnel enter their expenditure transactions for a particular
budget entity, internal budget indicator, expense, other cost accumulator, and category code combination.
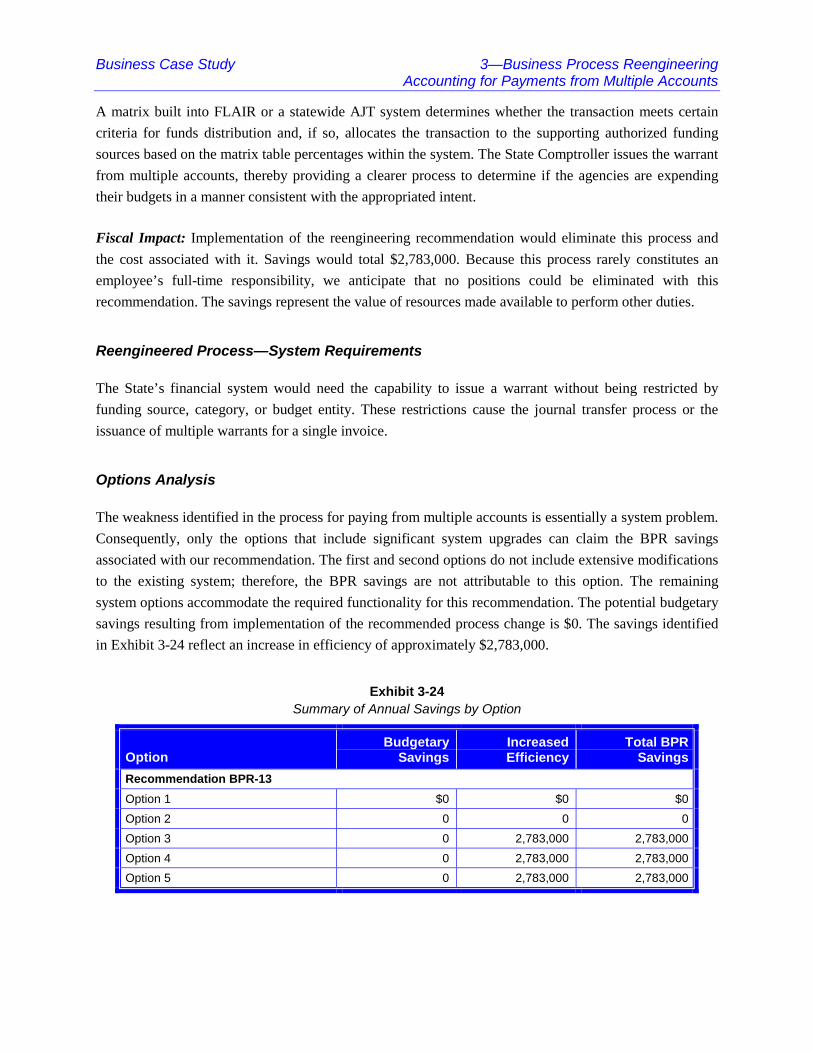
Business Case Study 3—Business Process ReengineeringAccounting for Payments from Multiple Accounts
A matrix built into FLAIR or a statewide AJT system determines whether the transaction meets certain
criteria for funds distribution and, if so, allocates the transaction to the supporting authorized funding
sources based on the matrix table percentages within the system. The State Comptroller issues the warrant
from multiple accounts, thereby providing a clearer process to determine if the agencies are expending
their budgets in a manner consistent with the appropriated intent.
Fiscal Impact: Implementation of the reengineering recommendation would eliminate this process and
the cost associated with it. Savings would total $2,783,000. Because this process rarely constitutes an
employee’s full-time responsibility, we anticipate that no positions could be eliminated with this
recommendation. The savings represent the value of resources made available to perform other duties.
Reengineered Process—System Requirements
The State’s financial system would need the capability to issue a warrant without being restricted by
funding source, category, or budget entity. These restrictions cause the journal transfer process or the
issuance of multiple warrants for a single invoice.
Options Analysis
The weakness identified in the process for paying from multiple accounts is essentially a system problem.
Consequently, only the options that include significant system upgrades can claim the BPR savings
associated with our recommendation. The first and second options do not include extensive modifications
to the existing system; therefore, the BPR savings are not attributable to this option. The remaining
system options accommodate the required functionality for this recommendation. The potential budgetary
savings resulting from implementation of the recommended process change is $0. The savings identified
in Exhibit 3-24 reflect an increase in efficiency of approximately $2,783,000.
Exhibit 3-24Summary of Annual Savings by Option
OptionBudgetary
SavingsIncreasedEfficiency
Total BPRSavings
Recommendation BPR-13
Option 1 $0 $0 $0
Option 2 0 0 0
Option 3 0 2,783,000 2,783,000
Option 4 0 2,783,000 2,783,000
Option 5 0 2,783,000 2,783,000

Business Case Study 3—Business Process ReengineeringAllocation of Common Costs
3.7 Recommended Process Changes—Allocation of Common Costs
This section presents the recommendations for reengineering the State of Florida’s process for allocating
common costs—the process by which agencies calculate indirect cost for the purpose of charging
overhead expenses to grants, contracts, and other agreements with the federal government.
Background
Indirect costs are the costs of an agency that are not directly attributable to a particular project or program
activity but are necessary to the general operation of the agency and conduct of the activity it performs.
States develop Indirect Cost Allocation Plans to estimate the indirect costs applicable to sponsored
activities performed under grants, contracts, and other agreements with the federal government.
In theory, such costs might be charged directly to the contract or grant; however, practical difficulties
prevent such an approach. These costs are usually grouped into common cost pools and distributed to
those agency activities that benefit from them. The cost allocation process provides the distribution of the
indirect costs of an agency to the direct service activities in proportion to the extent of their use of
administrative resources. The cost allocation process provides the agency with a means to determine its
indirect rates for federal grant and contract billing purposes, thereby maximizing the amount of funding
provided from nonstate entities. The process also provides accountability to the federal agency for
satisfying the allowable use of the grant funds.
The customers of this process are primarily the cognizant agencies. The term “cognizant agencies” refers
to the federal agencies that oversee the grants and have approval authority for the indirect cost plan
submissions.
State agencies benefit from the end result of the cost allocation process as do citizens. A well-structured
cost allocation plan can maximize nongeneral fund income for a State agency. The cost allocation process
is governed by various federal regulations depending on the cognizant federal agency and nature of the
State agency’s mission. The cognizant federal agencies for the five study agencies are as follows:
! DOT falls under Office of Management and Budget (OMB) Circular A-87, Cost Principles forState, Local and Indian Tribal Agreements, and the Code of Federal Regulations (CFR) Title 23(Highways)
! DCF works in accordance with OMB Circular A-87 and Subpart E of CFR, 45 CFR Part 95
! SUS is governed by OMB Circular A-21, Cost Principles for Educational Institutions
! DHSMV and DOI do not prepare Indirect Cost Allocation Plans because they perform minimalfederal grant and contract activity

Business Case Study 3—Business Process ReengineeringAllocation of Common Costs
Guidelines in the OMB circulars and federal rules require that agencies and institutions identify allocation
methodologies for all costs of the respective agency/institution and that they restrict or provide guidance
on unallowable costs. Because each cognizant agency has its own standards for and interpretations of
indirect costs, the methodology for classifying administrative costs varies among agencies. In addition,
the State does not have a common approach for charging administrative costs within a State agency.
Some agencies budget and are appropriated funding directly for administrative expenses; others charge
administrative costs to the State agency divisions and programs.
In general, agencies rely on the FLAIR system to provide the base financial data for the cost allocation
process; however, because the volume of grant activity and funding is so high, some agencies have
developed complex processes and supplemental systems to satisfy their cost and activity reporting
requirements. Exhibit 3-25 provides a listing by agency of the supplemental systems and their
corresponding purpose and system interfaces.
Exhibit 3-25Agency Supplemental Systems Used in the Allocation of Common Costs Process
Agency Supplemental System PurposeInterfacesWith
Department ofTransportation
Project Cost ManagementSystem
Work Program System
Reciprocal Cost AllocationModel
COPES
Calculates indirect rates for agiven project
Provides project numbers used fordirect cost pools
Provides reciprocal cost model toapply indirect costs to direct costs
Provides personnel information foractivity reporting
FLAIR
FLAIR
None
None
Department of Childrenand Families
COPES
Grants Management System
Random Moment SamplingSystem(s)
Substance Abuse and MentalHealth
Adult Services
Family Safety andPreservation
Economic Self-Sufficiency
Adult Payments
Provides FTE data used forallocation bases
Determines which OCAs areallocated directly (remaining OCAsare potential indirects). Also usedfor billing purposes
Determines activity reporting andproduces reports that allocate costpercentages to budget entities
None
FLAIR
None
Department of HighwaySafety and Motor Vehicles
None* Not applicable Not applicable

Business Case Study 3—Business Process ReengineeringAllocation of Common Costs
Exhibit 3-25 (continued)
Agency Supplemental System PurposeInterfacesWith
Department of Insurance,Treasury and State FireMarshal
None** Not applicable Not applicable
University of Florida Comprehensive RateInformation System
University of Florida DataWarehouse
University of Florida OnlineSpace Reporting System
Non-Academic EffortReporting System
Academic Activity ReportingSystem
Generates Indirect Cost ProposalRates
Provides a means of sorting andmanipulating FLAIR expendituredata
Space utilization reporting
Non-academic activity reporting
Academic activity reporting
FLAIR
FLAIR
None
None
None
*Department of Highway Safety and Motor Vehicles has one federal grant with the U.S. Department of Transportation for FatalAccident Reporting. It does not submit a cost allocation plan.
**Department of Insurance, Treasury and State Fire Marshal has minimal federal grant activity. Florida Wildfires (FEMA) does notapply administrative burdens, only spending authority.
Current Process
Agency cost allocation processes and the amount of activity vary considerably among the five agencies.
However, regardless of the cognizant federal agency, the methodology and subsequent rate development
used for billing indirect costs need to be auditable. Depending on the cognizant federal agency, the plans
and subsequent rates can be updated annually, over a period of years, or routinely. If the State agency
changes its methodology for common cost allocation, the plan is revised and submitted in full for
approval.
At the end of a given fiscal year, the agencies use FLAIR expenditure data and various supplemental
systems to determine their direct and indirect cost pools. Indirect cost pools include such items as
building and equipment, operations and maintenance, and general and administrative. Direct cost pools
include programs, projects, organizational research, and other sponsored grant activities. Depending on
the number of grants and other factors overseen by the agency, this can be a substantial effort.
Usually, after determining the initial direct and indirect cost pools, the agencies will determine their
modified direct costs by removing certain unallowable costs. They will determine the reasonableness of
the modified direct costs based on the guidelines of the OMB circulars and past experience. At this point,
the agency has determined its “clean” cost pools to use as a basis for applying indirect costs to the direct
costs in a reasonable manner.

Business Case Study 3—Business Process ReengineeringAllocation of Common Costs
Using various allocation bases extracted from various agency supplemental and statewide systems such as
COPES, the agencies apply their indirect costs to the direct costs in a reasonable manner consistent with
the beneficiary of that activity. Examples of allocation bases include:
! Full time equivalents
! Revenue expenditures
! Budget transactions
! Hours of service
After applying the indirect costs to the direct costs in a reasonable manner, the agencies are able to
determine the indirect cost rates to be applied to a budget entity.
After completing this portion of the process, the agencies finalize their Indirect Cost Allocation Plans
detailing their methodologies, indirect rate proposals, and supporting schedules. The plan is submitted to
the cognizant federal agency for negotiation and subsequent approval. Upon approval, the indirect rates
are applied to the direct costs associated with a grant or contract and billed out on the respective grant
reports for cost recoupment.
Current Process Performance
Exhibit 3-26 provides annual workload statistics by agency for each of the five study agencies. The
workload hours represent the total annual hours expended by the agency to perform its cost allocation
processes. The number of grants, other cost accumulators (accounting codes established to capture costs
of federally funded programs), and dollar amount of grants directly affect the workload of the study
agencies.
Exhibit 3-26Workload and Performance Metrics for Allocation of Common Costs
AgencyAnnual Workload
(in hours)Number of Grants or
OCAs
Department of Transportation 928 TBD
Department of Children and Families 65,232 Number Grants TBD
1220 Active OCAs
Department of Highway Safety and Motor Vehicles 40 1 Grant
Department of Insurance, Treasury and State FireMarshal
Negligible 3 Grants
University of Florida 38,158 4,000+ Restricted Grants
1,000+ Unrestricted Grants

Business Case Study 3—Business Process ReengineeringAllocation of Common Costs
Current Process Costs
The cost of the allocation of common costs process is derived by analyzing three cost components—
customer costs, agency costs, and centralized costs. Customer costs generally reflect the time an
individual spends completing a form or entering data to initiate a process. Agency costs reflect the labor
costs of the agency personnel devoted to carrying out the process. Centralized costs reflect the labor costs
of personnel who are located in a statewide administrative support agency and who participate in the
process statewide.
The cost analysis focuses on direct labor costs. Overhead and other indirect costs associated with the
process are excluded. The costs measured in the five study agencies are extrapolated to the rest of State
government based on workload factors that most affect the costs. The categories and the costs for the five
study agencies and for estimates of those categories and costs statewide are described below.
Customer Costs: The process does not include a customer cost as defined in this analysis.
Agency Costs: As shown in Exhibit 3-27, the total number of FTEs devoted to this process totals 56.32.
The cost for these FTEs is $1.6 million annually. (The estimated average salary is based on an
Accountant II.)
Within the agencies, this process is carried out using central and dispersed staff. The agency central FTEs
represent the effort involved in overseeing the agency’s allocation of common costs processes and
reporting mechanisms. This includes the overseeing of district/departmental activity reporting functions,
compliance with cost accounting standards, rate development, determination of cost pools, and other
indirect plan development requirements. Dispersed agency FTEs represent district/departmental efforts
associated with the allocation of common costs processes. This includes overseeing district/departmental
activity reporting mechanisms and implementing usage and other requirements used in the allocation of
common costs process. In agencies that have a large amount of grant activity, hundreds of people at the
district/departmental level participate in this process.

Business Case Study 3—Business Process ReengineeringAllocation of Common Costs
Exhibit 3-27Agency FTEs and Associated Costs for Allocation of Common Costs
Agency
AgencyFTEs
Central
AgencyFTEs
DispersedTotalFTEs
Cost ofAllocation of
Common Costs
Department of Transportation 0.50 Not applicable 0.50 $14,000
Department of Children and Families 4.00 31.20 35.20 1,000,000
Department of Highway Safety and MotorVehicles
0.02 Not applicable 0.02 1,000
Department of Insurance, Treasury and StateFire Marshal
Negligible Not applicable Negligible Negligible
University of Florida 3.40 17.20 20.60 585,000
Total 7.92 48.40 56.32 $1,600,000
Statewide agency costs are derived based on grant activity throughout government. The study agencies
require 56.3 FTEs to carry out the cost allocation process for 29.6 percent of the federal grants that the
State receives. Assuming that the number of FTEs is commensurate with the size of the federal grant, we
estimate that the State as a whole devotes 190 FTEs or $5.4 million to the process.
Centralized Costs: The State bears no centralized costs for this process.
In total, the State annually expends an estimated $5.4 million in agency costs to carry out the allocation of
common costs process.
Current Process Weaknesses
We identified the following key weaknesses in the current process:
! Information needed for cost allocation exists in separate systems. A significant level of staffresources is devoted to the exchange of automated data and reconciling differences amongvarious systems
! There is no State policy or associated methodology on cost allocation
One of the issues that surfaced when evaluating the five agencies’ cost allocation processes is the number
of systems that have been developed by the agencies to meet their unique grant reporting requirements.
DCF and the University of Florida in particular have developed multiple systems to meet the specific
requirements associated with their cost allocation processes. The University of Florida uses multiple
systems in its process; information is culled from various systems and input into other systems to
complete all facets associated with the University’s Facilities and Administrative Cost Plan. For example,
the Contracts and Grants Management department downloads State records from FLAIR and inputs the

Business Case Study 3—Business Process ReengineeringAllocation of Common Costs
data into the university’s financial data warehouse, allowing department personnel to manipulate and sort
the information with the degree of granularity and flexibility they require. DCF also has developed
systems to meet its unique requirements.
The State does not have a cost allocation policy or standard methodology that could be used by the
agencies as the basis for their unique requirements. Each agency has its own unique interpretation of cost
allocation. We even found instances where cost allocation was defined differently by different units
within the same agency. The absence of a cost allocation policy and a uniform methodology means that
some agencies may be inconsistent in classifying similar costs as direct and indirect. The individual
agency determines its cost allocation process and corresponding procedures on its own with no uniform
guidance from the State.
Reengineered Process
To address the weaknesses in the current allocation of common costs process, the State should establish
general policies and procedures regarding the allocation of common costs and augment the functionality
of FFMIS to support the calculation of indirect costs.
Recommendation BPR-14: Establish policies and general methodologies for allocation ofcommon costs
The State should establish a standard set of definitions and a methodology for calculating administrative
costs and allocating them to direct services. Among the definitions that should be included in the
methodology are administrative costs, common costs, direct costs, and indirect costs. The methodology
should use real examples from agencies to illustrate the application of these standard definitions.
The State Comptroller (or the Chief Financial Officer, beginning in January 2003) should work with the
State agencies that have received a substantial portion of their funding from grants (for example, Regents,
Labor, and Transportation) and with representatives of the cognizant agencies to determine acceptable
definitions and a methodology.
The State Comptroller (or the Chief Financial Officer beginning in January 2003) should perform audits
on the State agencies to monitor compliance with the State policies and methodologies for allocation of
common costs.
Fiscal Impact: This recommendation can be carried out using internal resources with no significant
impact on costs.

Business Case Study 3—Business Process ReengineeringAllocation of Common Costs
Recommendation BPR-15: Augment system functionality to support the calculation ofindirect costs
After developing a policy and common methodology, the State should then develop a cost allocation
system that can support the development of an Indirect Cost Allocation Plan and have the commonality to
support improved statewide cost reporting and associated recoupment of federal funds. An integrated
system would provide the functionality to:
! Accommodate the direct and indirect cost pool generation and adjustments and determineunallowable costs in line with the specific OMB circular requirements
! Generate statistical bases for allocation
! Perform the reciprocal or step-down allocation of common costs into the beneficiary direct costpools and rate development including supporting schedules
Using these capabilities should make resources available that can be applied to other work.
Fiscal Impact: Increased system functionality would yield significant time savings in the effort now
performed by dispersed FTEs. Currently, the dispersed FTEs are carrying out work that can be gathered
partially by an improved system. We estimate that up to 50 percent of the workload for dispersed FTEs
could be eliminated with the introduction of an improved financial management system. For the five
study agencies, the savings would total 24 FTEs or $0.7 million. Statewide, the savings are estimated at
$2,324,000.
The process takes into account the development of a State of Florida cost allocation system that interfaces
with FLAIR and the agency supplemental systems. Together, these systems would determine appropriate
statistical bases, indirect and direct cost pools, applicable unallowable costs, and the application of
indirect costs to the direct cost pool beneficiaries to support rate development.
Reengineered Process—System Requirements
To implement the reengineered process, the State needs to develop a cost allocation system for the
agencies that provide the base functionality to support agency generation of Indirect Cost Allocation
Plans. The system should be flexible to allow the agency to comply with its unique federal requirements
while simultaneously providing for common data elements to support more effective statewide reporting
of its costs. The system, at a minimum, should:
! Support relatively quick development of direct and indirect cost pool generation and adjustmentsand determine unallowable costs in line with the specific OMB circular requirements
! Generate statistical bases for allocation
! Interface with other agency systems

Business Case Study 3—Business Process ReengineeringAllocation of Common Costs
! Perform the reciprocal or step-down allocation of common costs into the beneficiary direct costpools and support rate development
! Develop supporting schedules
! Support generating grant reporting mechanisms for cost recoupment
! Provide a powerful query tool to develop agency-unique and statewide reports for cost allocation
Any system developed would have to interface with FLAIR.
Options Analysis
Exhibit 3-28 provides the savings associated for each of the five alternatives. The statewide savings of
$2,324,000 can be realized in Options 3 through 5. Because Option 1 is the status quo, it does not produce
any savings. Option 2 only meets two of the seven system requirements, while Options 3 through 5 meet
all of the necessary provisions. The development of a cost allocation system will provide the State with
benefits that include standardized cost reporting across agencies and statewide. It will reduce time and
effort throughout State government.

Business Case Study 3—Business Process ReengineeringAllocation of Common Costs
Exhibit 3-28
Summary of Annual Savings by Option
OptionBudgetary
SavingsIncreasedEfficiency
Total BPRSavings
Recommendation BPR-14
Option 1 $0 $0 $0
Option 2 0 0 0
Option 3 0 0 0
Option 4 0 0 0
Option 5 0 0 0
Recommendation BPR-15
Option 1 0 0 0
Option 2 0 0 0
Option 3 2,324,000 0 2,324,000
Option 4 2,324,000 0 2,324,000
Option 5 2,324,000 0 2,324,000
Total
Option 1 $0 $0 $0
Option 2 $0 $0 $0
Option 3 $2,324,000 $0 $2,324,000
Option 4 $2,324,000 $0 $2,324,000
Option 5 $2,324,000 $0 $2,324,000

Business Case Study 3—Business Process ReengineeringFlow of Federal Funds
3.8 Recommended Process Changes—Flow of Federal Funds
This section presents the recommendations for reengineering the State of Florida’s flow of federal funds
process—the process by which the State draws on federal grant funds.
Background
Federal funds provide a significant proportion of total revenues for many Florida State agencies. Funds
are provided in various forms, including entitlements, grants, scholarships, and various program
allocations, which are awarded by a number of federal agencies.
In the flow of federal funds process, a State government agency files for a draw on a line of credit, or it
requests reimbursement for funds that the agency or its subgrantee organizations have already expended.
After the applicable federal authority approves a funding request, the U.S. Treasury deposits the funds in
a commercial “receipt” bank account maintained by the Florida State Treasurer.
The customers of this process include each requesting agency and the grant recipients to which many of
these revenues are suballocated and distributed, including:
! Local governments and government authorities
! Local charities and community organizations providing children and family services
! Other State agencies
The State Treasurer is responsible for receiving and depositing federal funds appropriated to State
agencies, in accordance with Article IV, Section 4(e) of the Florida Constitution. In addition,
Chapter 18.10 of the Florida Statutes assigns the State Treasurer the responsibility of maintaining these
funds in bank accounts and establishing investment operations to keep funds fully invested or deposited.
The purpose of this is to realize maximum earnings while providing for the cash requirements of the
State. Annually, in accordance with the federal requirement for a single audit of all federal funds, the
State must gather and report information on all federal funds that the State receives.
Larger agencies have developed detailed, internal policies to guide their employees through the flow of
federal funds processes for their respective organizations.
A Contracts and Grants subsystem in FLAIR offers State agencies a resource to record, monitor, and
manage data related to federal funds they receive and expend or suballocate to other agencies and local
government or community groups. However, this system reportedly cannot adequately record and monitor
detailed transactions for projects and activities with multiple funding sources. Consequently, agencies
with large, complex federal funding process requirements have developed their own internal management

Business Case Study 3—Business Process ReengineeringFlow of Federal Funds
systems to record, compile, and report project costs. These agency systems upload and download
financial information to and from FLAIR daily.
Other agencies download or re-key information from FLAIR to PC desktop applications, where they
format cost information required to process federal funding requests. Supplemental systems and
applications used by the five study agencies to automate parts of the flow of federal funds process are
summarized in Exhibit 3-29.
Exhibit 3-29Agency Supplemental Systems Used in the Flow of Federal Funds Process
AgencySupplementalSystem Purpose
InterfacesWith
Department ofTransportation
Federal ProgramsManagement System
Interfaces with Florida DOT’sFinancial Management System toprocess requests for reimbursementof federal highway funds
FLAIR
Department of Childrenand Families
GRANTS System Processes financial information fromFLAIR and other DCF inputs tofacilitate draw on federal lines ofcredit
FLAIR
Department of HighwaySafety and Motor Vehicles
None – –
Department of Insurance,Treasury and State FireMarshal
None – –
University of Florida PC desktopapplications invarious departmentscampuswide
Track grant expenditures anddevelop reports and invoices
FLAIR
Source: KPMG interviews with staff in five study organizations
A receipt processing module in FLAIR provides a mechanism for the Treasurer to validate federal funds
posted to an agency’s trust funds. The State Comptroller and State agencies use this module to verify
receipt of federal funds and subsequently to update their respective FLAIR ledgers.
Current Process
As an agency expends fiscal resources on eligible federal-aid activities or projects, it tracks and records
its costs, applies indirect cost rates, and prepares a funding request report. Information provided in this
report is collected from the agency’s records in the FLAIR Contracts and Grants subsystem or is
processed through the agency’s supplemental systems. Agencies that receive their federal funds via a
letter-of-credit draw must forecast their anticipated cash needs by fund before they file a draw request.

Business Case Study 3—Business Process ReengineeringFlow of Federal Funds
After a funding report or invoice is developed, the agency processes a draw or reimbursement request
(typically daily, weekly, or monthly), which is sent to the applicable federal authority by wire, e-mail, fax,
or U.S. Postal Service. If the request is approved, federal funds are wired or sent by electronic fund
transfer (EFT) or by mail from the U.S. Treasury for deposit to a commercial receipt bank account
maintained by the State Treasurer. By October 1, 2002, all federal agencies will be required to use either
Automated Standard Application for Payments (ASAP) or Payment Management System (PMS) to
process State funding requests.
Daily statements from the State Treasurer’s receipt bank show which federal funds were deposited each
day. However, this transaction record does not always provide enough detail to indicate which Florida
State agency is the intended recipient of any particular deposit. The State Treasurer must match each
deposit manually with the State agency requesting the federal draw or reimbursement request and transfer
the appropriate deposit amount to the correct agency trust fund.
When the Treasurer has identified the proper fund, it posts a verification entry in the treasurer’s receipt
processing module in FLAIR, which triggers an update in the State Comptroller’s FLAIR accounts to
record receipt of the federal funds. The verification entry confirms the receipt of funds, which had been
anticipated by the State agency that entered the transaction in FLAIR.
The State Comptroller runs an annual “clearance pattern” study in accordance with its Cash Management
Improvement Act (CMIA) agreement with the U.S. Treasury’s Financial Management Service (FMS) to
estimate the aggregate time that the State holds cash before expending federal funds. Florida must
compensate the federal government for the interest it earns on federal funds (alternatively, the federal
government must pay Florida for delays in remitting federal-aid payments).
Current Process Performance
Output and outcome measures provide insight into how the flow of federal funds process is working in
Florida. Output measures reveal the volume of work associated with the flow of federal funds process.
The quantity of work an agency must assume is directly related to the number of different federal funds
the organization manages and the frequency with which it processes funding draw or reimbursement
requests. Exhibit 3-30 provides a summary of the total estimated number of letter-of-credit draws or
reimbursement requests filed by the five study agencies in Fiscal Year 1999.

Business Case Study 3—Business Process ReengineeringFlow of Federal Funds
Exhibit 3-30Estimated Number of Federal Fund Draw or Reimbursement Requests Filed by Five Study Agencies
AgencyFund or GrantType
TotalNumber ofPrograms,
Grants, etc.
FundingRequest
Frequency
Total Numberof Federal Fund
Transactions(Annually)
FTA, FAA, FRA andNHTSA Grants
42 * Monthly 504Department ofTransportation
FHWA TEA-21funds
1 Weekly 52
Entitlement,Program or BlockGrants
~ 90 Weekly 4,680Department of Children andFamilies
Program or BlockGrants
10 Monthly 120
Department of HighwaySafety and Motor Vehicles
FHWA Grants andFEMA Funds
3 Monthly 36
Department of Insurance,Treasury and State FireMarshal
None – – –
IFAS Grants andFunds
523 Varies 2,288
Other ResearchGrants and Funds
N/A Varies 2,351
University of Florida
Student Loans andGrants
N/A Varies 184
* Represents nearly 500 different grant recipients for whom Florida DOT processes invoices for federal reimbursement
An appropriate outcome indicator for this process is the time required by agency personnel to prepare the
required financial information needed to support a funding draw or reimbursement request. For line-of-
credit draws, agencies must submit funding requests expeditiously to receive federal funds in time to pay
anticipated disbursements. If an agency delays requesting and receiving its federal fund draw or it
miscalculates its cash flow needs, it may have to pay late charges on invoices for federal-aid activities and
programs.
If the agency receives more funding than it needs to pay immediate liabilities for these activities and
programs, it must pay the federal government an amount commensurate with the time these funds were
banked and earning interest before they were spent. Therefore, it is critical that the agency understand its
current cash position and that it request and receive its federal fund draw quickly, so it can pay its
invoices on time. For most agencies, estimating periodic cash flow needs and developing the subsequent
letter-of-credit draw request takes 30 to 90 minutes per transaction.
Agencies entitled to federal fund reimbursement payments are motivated to file quickly to recover the
money already spent on federal-aid projects and activities. Ideally, an agency would file its funding

Business Case Study 3—Business Process ReengineeringFlow of Federal Funds
requests daily, as it incurred reimbursable costs. However, agencies are limited by specific filing
frequencies stated in federal funding rules and contracts—typically weekly, biweekly, or monthly.
To minimize impacts on its cash flow, an agency must quickly compile and prepare all current cost
information required to submit the reimbursement request—so that it receives the maximum amount of
payment for which it is eligible in any filing period. Agencies typically require 90 to 120 minutes to
process each federal funding reimbursement request.
Current Process Costs
The cost of the flow of federal funds process is derived by analyzing three cost components—customer
costs, agency costs, and centralized costs. Customer costs generally reflect the time an individual spends
completing a form or entering data to initiate a process. Agency costs reflect the labor costs of agency
personnel devoted to carrying out the process. Centralized costs reflect the labor costs of personnel who
are located in a statewide administrative support agency and who participate in the process statewide.
The cost analysis focuses on direct labor costs. Overhead and other indirect costs associated with the
process are excluded. The costs measured in the five study agencies are extrapolated to the rest of State
government based on workload factors that most affect the costs. The categories and costs for the five
study agencies and for estimates of those categories and costs statewide are described below.
Customer Costs: This process does not include a customer cost as defined in this analysis.
Agency Costs: State agencies incur some of the following additional costs:
! Administration of statewide programs (for example, Medicaid, TANF, and Food Stamps)
! Administration of grant “pass through” to other State agencies or to community groups and localgovernments and authorities
! Forecasting cash requirements
! Maintenance of complex grants and program management systems
Exhibit 3-31 presents a summary of the estimated State personnel costs associated with flow of federal
funds process for the five study agencies.

Business Case Study 3—Business Process ReengineeringFlow of Federal Funds
Exhibit 3-31Estimated Cost of Filing Federal Fund Draw or Reimbursement Requests for Five Study Agencies
Agency
Total EstimatedFTE Hours per
MonthEstimated Total
FTEsTotal Estimated
Cost
Department of Transportation 36 0.2 $6,000
Department of Children andFamilies
120 0.8 23,000
Department of Highway Safetyand Motor Vehicles
8 0.1 3,000
Department of Insurance,Treasury and State Fire Marshal
N/A N/A N/A
University of Florida
! IFAS 775 5.0 142,000
! College of Engineering 620 4.0 114,000
! Other 1705 11.0 312,000
Total 3,264 21.1 $600,000
Assumptions: (1) $28,406 Salary + Fringe Benefits per FTE (Accountant II); (2) 1,854 hours per year = 155 hours/month;(3) FTE hours for DOT and DCF do not include time incurred by field personnel recording project or activity data to internalmanagement systems (e.g., FMS GRANTS)
The University of Florida employs Grants Administrators who are responsible for all aspects of grants
and funds management for designated programs or colleges. Responsibilities include preparing and
submitting grants applications, setting up and managing grants and contracts, and reporting and invoicing
for federal fund payment.
Based on the portion of all federal grant funds that go to the five study agencies, we have extrapolated the
process costs statewide. An extrapolation factor is applied to all universities based on the experience of
the University of Florida and a factor is applied to all other State agencies based on the experience of the
four non-university study agencies. KPMG’s estimate of the total labor costs associated with this process
is presented in Exhibit 3-32.
Exhibit 3-32Estimate of Total Statewide Labor Costs for Flow of Federal Funds Process
Cost Component
Total ProcessCosts—Study
AgenciesExtrapolation
Factor
TotalStatewide
Costs
State Agencies $32,000 3.2 $102,000
State University System 568,000 2.5 1,420,000
Total $1,522,000

Business Case Study 3—Business Process ReengineeringFlow of Federal Funds
The extrapolation factor for State agencies is 3.2. The factor was derived by dividing the total federal
revenues less State University System funds into the sum of federal revenues received by DOT and DCF.
The extrapolation factor for the SUS is 2.5. The factor was derived by dividing the total federal revenue
of the SUS into the federal revenue received by the University of Florida.
Centralized Costs: Centralized costs are those incurred by the State Treasurer in performing the following
activities:
! Matching federal revenues received with the State agency making the funding draw orreimbursement request
! Forecasting cash receipts, which include federal revenues
The State Treasurer staff spends an estimated 120 hours per month or about 0.8 FTEs on this process. The
estimated annual centralized labor cost associated with this process is $23,000, assuming an average FTE
and benefit cost of $28,406 per year. (The estimated average salary is based on an Accountant II.)
In total, the State annually expends an estimated $1.5 million in agency costs and $23,000 in centralized
costs to carry out the flow of federal funds processes.
Current Process Weaknesses
Several significant process and technical issues affect the flow of federal funds process in Florida. Many
of these issues result from a lack of functionality in FLAIR’s Contracts and Grants subsystem, causing
many agencies to track project data and costs on their own internal management systems or even on PC
desktop programs. When federal funding data is filed in many different systems and applications
throughout Florida, the State incurs costs related to:
! Redundant data entry to the Contracts and Grants subsystem and an agency’s supplementalsystems
! Data consistency and integrity
! Accessibility of data for statewide reporting and revenue forecasting needs
Problems identified with the Contracts and Grants subsystem include the inability to:
! Develop, approve, and submit grants applications electronically
! Set up grants and contracts in the system with adequate user-defined award information (forexample, terms and conditions, Catalog of Federal Domestic Assistance (CFDA) identification,compliance guidelines and restrictions, and awarding agency information)

Business Case Study 3—Business Process ReengineeringFlow of Federal Funds
! Manage cost and performance data for grants and contracts according to flexible, user-definedrequirements
! Support online submission of federal fund draw or reimbursement requests
! Allocate and record disbursements for projects with federal and nonfederal funding sources
Other process problems identified include the following:
! Matching receipts and expenditures: The State has difficulty in matching federal grant receiptswith the federal grant expenditures. In many cases federal grant funds are deposited into trustfunds that also receive deposits of State moneys and other grant funds. An estimated 10 percentof federal funds deposited in the State Treasurer’s receipt bank lack sufficient detail for theTreasurer to readily match receipts to the agency making the funding draw or reimbursementrequest. In these instances, staff in the State Treasurer’s office must manually research thedeposit—calling State and federal agencies, and sometimes the U.S. Treasury, to determine whichState agency is to receive the funds. In some instances, the funds are posted to the wrong agencyaccount—requiring staff members in the State Comptroller’s office and in several agencies tomake time-consuming corrections to their respective FLAIR ledgers
! Tracking grants across agencies: The State does not have a consistent definition for a grant, aproject, or a contract. Each State agency can define these terms as it chooses. There is currentlyno statewide assignment of numbers for grants, projects, and contracts. The assignment of thesenumbers is unique within each State agency but the numbers are not unique statewide. This factfurther contributes to the difficulty in tracking the flow of federal grant funds received by oneState agency and then subgranted to another State agency
! Forecasting: Florida cannot forecast its cash flow needs accurately and consequently earns excessinterest on federal funds requested by State agencies but not needed for immediate disbursement.According to its CMIA agreement, Florida must return all excess federal interest—an amounttotaling approximately $4,867,000 in Fiscal Year 1999
An important area of potential weakness in the process is the possibility that the State may be losing float
(that is, interest earnings) because of delays in drawing on federal funds. After investigating this issue, we
did not find this to be a significant problem. In some areas it may be possible to eliminate a day from the
process, but the payback is small ($15,000 in the case of the universities). Consequently, this is not
included as a significant weakness nor is it addressed in the recommended process changes.
Reengineered Process
To address the weaknesses in the flow of federal funds process, the State should develop a statewide
grants management system and automate the federal funds matching process.

Business Case Study 3—Business Process ReengineeringFlow of Federal Funds
Recommendation BPR-16: Develop a statewide grants management system that fullysupports the information management and reporting needs of Florida State agencies
Several Florida State agencies have developed their own management information systems to record and
report information needed to support federal-aid draws or reimbursement requests. Most other agencies
rely upon FLAIR’s Contracts and Grants subsystem, supplemented with miscellaneous PC desktop files,
to perform this function. To reduce personnel costs, maintain consistent and reliable federal project and
program data, and shorten the time required by State agencies to file federal-aid draw or reimbursement
requests, Florida should reengineer its Contracts and Grants subsystem. Proposed system requirements
and related process improvements include:
! Improved pre-award functions
– Enhanced capacity to prepare grant applications (including a library of prior grant applicationdocuments)
– Automated routing of grant applications for agency-level approval
– Electronic submission of grant applications to federal agencies
! Improved account set-up and award information features
– Adequate number of user-defined fields to summarize project award information (forexample, terms and conditions, CFDA identification, restrictions, awarding agency,compliance guidelines, contact persons, addresses, and telephone numbers)
– Budgetary controls with user-defined rules
! Improved grants and contracts management features
– Greater flexibility in defining types of project and program costs
– Greater flexibility in developing deliverables required to support funding draws orreimbursement requests
– Capability to allocate and record disbursements for projects with multiple funding sources
– Capability to submit federal fund draw or reimbursement requests online through ASAP orPMS
! Automated receipt-matching program (see recommendation BPR-17)
! Federal fund forecasting module
! Interface with existing grants and contract management systems maintained by agencies withunique federal-aid data management and reporting requirements (for example, DCF and DOT)
Fiscal Impact: This strategy would provide the greatest benefit to State universities and some small State
agencies that presently rely upon the FLAIR Contracts and Grants subsystem, supplemented with
miscellaneous PC desktop applications, to manage their respective federal funds processes. With access to

Business Case Study 3—Business Process ReengineeringFlow of Federal Funds
a well-designed grants management system, these universities and State agencies could reduce personnel
costs related to these processes. We estimate that Grant Specialists throughout the State government could
reduce their workloads by approximately 20 percent using an integrated system. This estimate is based on
agencies’ reporting of time devoted to data entry, reconciling, resolving errors, and other non-value-added
work. Estimated savings for agencies other than the SUS are estimated at $20,000. Exhibit 3-33 presents
actual University of Florida FTE data, extrapolated to all institutions in the SUS to estimate costs savings
from eliminating 20 percent of Grants Specialists positions. The number of Grants Specialists positions
for University of Florida is actual—FTE counts for other State universities were extrapolated on the basis
of federal funding received by each university.
Exhibit 3-33Estimate of Annual FTE Cost Savings from Improving Contracts and Grants Management Subsystem
State University
Federal FundingFiscal Year 1997
($million)
Actual or EstimatedNo. of Grants
Specialists FTEs20 Percent
of FTEs
EstimatedAnnual Cost
Savings
University of Florida $145.4 20 4 $114,000
Florida State University 64.5 9 2 57,000
Florida A&M University 30.6 4 1 28,000
University of South Florida 42.5 6 1 28,000
Florida Atlantic University 14.2 2 0 0
University of West Florida 8.8 1 0 0
University of Central Florida 28.6 4 1 28,000
Florida Int’l University 24.1 3 0 0
University of North Florida 5.1 1 0 0
Florida Gulf Coast University 1.5 1 0 0
Total $365.3 51 9 $255,000
Source: KPMG interviews and the SUS 1997-1998 Fact Book
Recommendation BPR-17: Automate the process of matching federal fund receipts withState agencies initiating a funding draw or reimbursement request
Currently, the State Treasurer manually traces and matches federal fund receipts to agencies initiating a
funding draw or reimbursement request. This process could be automated by implementing the following
systems requirements and related process improvements:
! State agencies record the following information in the grants management subsystem for eachfederal-aid draw or reimbursement request:
– Agency and fund (by name and by code)
– Draw or reimbursement amount
– Date of request and anticipated payment

Business Case Study 3—Business Process ReengineeringFlow of Federal Funds
– CFDA code
! Payment remittance data is attached via an electronic template to an agency’s ASAP or PMSsubmittal (or alternate electronic filing mechanism), and returned by federal agency with paymentto Treasurer’s receipt bank
! Payment remittance data is included on the agency’s reimbursement invoice documents forpayments processed via U.S. Postal Service
! State Treasurer’s receipt bank collects payment and remittance data, and provides daily electronicreports to the Treasurer, listing payment amount and matching remittance data
! Treasurer runs program in the grants management subsystem to:
– Process the bank’s electronic reports to match each payment with the agency originating afunding request, using remittance data (codes) to establish a confirmed link
– Automatically initiate transfer of payment to appropriate agency fund and record transactionin the State’s integrated financial management system
– Automatically update the status of federal funds in the Federal Funds Forecasting module
This automated receipt-matching program would provide the most benefit to the State in October 2002,
when all federal agencies are required to use either ASAP or PMS to process all State agency funding
requests.
Fiscal Impact: Implementing this recommendation would reduce time spent by personnel in the State
Treasurer’s office and in each agency manually tracing and matching funds to the State agency
originating the draw or reimbursement request. The Treasurer’s office may eliminate one FTE for a
saving of $28,406 annually. Potential savings to each State agency are not large enough to warrant the
elimination of any whole FTE position. This strategy would also improve cash flow for each State agency
by shortening the time required to transfer federal funds to the proper State fund. Because Florida’s
CMIA agreement with the U.S. Treasury requires the State to return all excess interest earned on invested
federal funds, this recommendation would not affect the net interest revenue earned by the State.
Reengineered Process—System Requirements
To implement recommendations proposed for reengineering Florida’s flow of federal funds processes, the
State must develop a grants management system with features and functionality needed by a broad cross-
section of users from most State agencies and universities. General requirements for this system include:
! Improved pre-award functions
– Enhanced capacity to prepare grant applications (including library of prior grant applicationdocuments)
– Automated routing of grant applications for agency-level approval

Business Case Study 3—Business Process ReengineeringFlow of Federal Funds
– Electronic submission of grant applications to federal agencies
! Improved account set-up and award information features
– Adequate number of user-defined fields to summarize project award information (forexample, terms and conditions, CFDA identification, restrictions, awarding agency,compliance guidelines, contact persons, addresses, and phone numbers)
– Budgetary controls with user-defined rules
! Improved grants and contracts management features
– Greater flexibility in defining types of project and program costs
– Greater flexibility in developing deliverables required to support funding draws orreimbursement requests
– Capability to allocate and record disbursements for projects with multiple funding sources
– Capability to submit federal fund draw or reimbursement requests online through ASAP orPMS
! Ability to interface with existing grants and contract management systems maintained byagencies with unique federal-aid data management and reporting requirements (for example, DCFand DOT)
Other recommended systems improvements include developing a program that automatically processes
federal funds deposited in the Treasurer’s receipt bank by:
! Processing electronic files containing bank deposit data and tracking template information(submitted with federal receipts) through the State’s integrated financial management system tomatch receipts with agency originating the fund draw or reimbursement request
! Automatically transferring federal receipts from bank to the appropriate agency’s trust fund(s)
! Automatically updating Departmental Accounts to record credit in trust fund
Options Analysis
Estimated savings from recommendations to improve the flow of federal funds process can be achieved in
three of the subsystems options—Options 3, 4, and 5. The savings depend on implementing an enhanced
grants management system and a program that can automate the Treasurer’s matching of federal fund
receipts to funding requests. Options 3 through 5 can provide the functionality for these applications
while Options 1 and 2 do not. Exhibit 3-34 provides the savings associated with each of the five
alternatives.

Business Case Study 3—Business Process ReengineeringFlow of Federal Funds
Exhibit 3-34Summary of Annual Savings by Option
OptionBudgetary
SavingsIncreasedEfficiency
Total BPRSavings
Recommendation BPR-16 Agencies
Option 1 $0 $0 $0
Option 2 0 0 0
Option 3 20,000 0 20,000
Option 4 20,000 0 20,000
Option 5 20,000 0 20,000
Recommendation BPR-16 SUS
Option 1 0 0 0
Option 2 0 0 0
Option 3 255,000 0 255,000
Option 4 255,000 0 255,000
Option 5 255,000 0 255,000
Recommendation BPR-17
Option 1 0 0 0
Option 2 0 0 0
Option 3 28,000 0 28,000
Option 4 28,000 0 28,000
Option 5 28,000 0 28,000
Total
Option 1 $0 $0 $0
Option 2 $0 $0 $0
Option 3 $303,000 $0 $303,000
Option 4 $303,000 $0 $303,000
Option 5 $303,000 $0 $303,000

Business Case Study 3—Business Process ReengineeringPayroll
3.9 Recommended Process Changes—Payroll
This section presents the recommendations for reengineering the State of Florida’s payroll process.
Background
The State of Florida has approximately 200,000 employees, including both employees in established
positions and Other Personal Services (OPS) employees. Each employee receives a regular monthly or
biweekly paycheck. About 48 percent of the employees receive their paychecks monthly and the rest
receive them biweekly. Annually, Florida processes 5.5 million payments for its employees. Most of the
payments (75 percent) are electronic fund transfers; the rest are distributed to employees via interoffice
mail. All employees receive hard-copy pay stubs through interoffice mail.
All State employees submit a timesheet. Employees in established positions on an active pay status
submit timesheets primarily to record leave. Their timesheets are not required to generate their pay
checks, but are required of OPS employees. OPS employees represent 17 percent of State employees. The
leave and attendance personnel of the five study agencies enter from 177 timesheets up to 8,700
timesheets each pay period.
Florida’s payroll process is supported by automated systems that track employee time and leave, calculate
salary and benefits, and disburse payment. Employee payments are calculated based on the rules and
regulations of the personnel system in which they are included. Exhibit 3-35 shows the personnel systems
and the number of authorized positions that fall within each of them.
Exhibit 3-35Employees Compensated Under Each Personnel Group
Personnel GroupsTotal Number of
State Employees
Career Service System 120,855
Office of Legislative Services 1,211
Senior Management Service System 508
Selected Exempt Service 3,474
Faculty 12,592
University Support Personnel System 15,382
Administrative and Professional/Executive Services 4,350
Other Personal Services 11,823
Judicial Branch 9,756
Total 179,951
Source: State of Florida’s Annual Workforce Report, 1999

Business Case Study 3—Business Process ReengineeringPayroll
In addition to regular biweekly and monthly payroll, employees can receive additional payments referred
to as supplemental payments. Supplemental payments are processed on a biweekly schedule following a
regular payroll cycle. Supplemental payments include Criminal Justice Incentive Pay (CJIP), terminated
leave, overtime, on-call, uniform allowances, and other nonrecurring payments. These payments are made
through the payroll process, but are disbursed on warrants separate from salary warrants.
Exhibit 3-36 shows the estimated annual number of supplemental payments made to employees by type.
Exhibit 3-36Supplemental Payments by Type
Payment Type Number of Payments
Overtime 306,216
CJIP 157,692
On-Call 43,584
Uniform 2,880
Other 148,176
Total 658,548
Source: Fiscal year supplemental payment data provided by the Bureau of State Payrolls
The laws and regulations governing the payroll process include:
! Chapter 110, § 11.46(3), 215.93, 20.23(3)(I) 2 of the Florida Statutes
! Chapters 60K-60N, § 14-17.021 of the Florida Administrative Code
! Federal Fair Labor Standards Act
The discussion that follows generally represents the payroll process including both agencies that use
COPES and those agencies that do not use COPES (for example, the State University System and the
Legislative Branch). The payroll process starts in COPES and ends in FLAIR. COPES supports flexible
entry of payroll data and tracks information. Payroll data entered in COPES interfaces with FLAIR and
generates error reports per agency and per payroll. Reports and different types of payroll information are
stored in COPES and other personnel systems.
The FLAIR Payroll Accounting System generates payroll registers for the agencies based on a data
interface from COPES. The FLAIR Payroll Accounting System updates the FLAIR Central Accounting
System and generates a File 0013 (payroll register) to enable agencies to update the FLAIR Departmental
Accounting System. To ensure that the information from COPES is appropriately transferred into the
FLAIR Departmental Accounting System, agencies transfer the data on File 0013 to a tape. That tape is
used to update the FLAIR Departmental Accounting System with payroll data in COPES. Finally, journal

Business Case Study 3—Business Process ReengineeringPayroll
entries are prepared in the FLAIR Departmental Accounting System to allocate payroll costs to more than
one account code, and then the FLAIR Payroll Accounting System is updated.
Although the State relies on FLAIR and COPES to provide the bulk of financial management as well as
human resources (HR) and payroll information, many agencies use shadow or exception systems to assist
in managing and tracking HR and payroll. Exhibit 3-37 shows the supplemental systems used by the
study agencies.
Exhibit 3-37Agency Supplemental Systems Used in the Payroll Process
AgencySupplementalSystem Purpose Interfaces With
Department of Transportation Payroll PersonnelSystem
Track leave andattendance on a projectbasis and handleinquiries
COPES and FLAIR
Department of Children andFamilies
PersonnelManagement DataSystem
Update departmentalFLAIR following apayroll run
COPES and FLAIR
Department of Highway Safetyand Motor Vehicles
Access database Input specialcompensation and othernonrecurring payments
None
Department of Insurance,Treasury and State FireMarshal
None None None
University of Florida InformationAssociates
Payroll, personnel andbudget system
FLAIR
Current Process Costs
The process begins at the end of an employee’s pay period and ends with the issuance of a payroll
warrant. For the following discussion, warrants include both EFT payments and paper warrants. The
major components of the process include:
! Data Capture: Data regarding the actual time worked by an employee is entered into the system.For those employees under an exception reporting time process, the system automaticallycalculates and pays them all hours for the pay period, with exceptions for leave being enteredmanually. For those agencies with positive time reporting, COPES requires the hours workedfrom a timesheet to be entered for each person every pay period. Those actual hours worked arethen used as the underlying input for generating payroll
! Processing: For each pay cycle, COPES generates both change order and nonrecurring files basedon the payroll data entered by agencies. COPES then processes the files and creates an interfacefile, which is forwarded to FLAIR for payroll calculation and to update the financial system
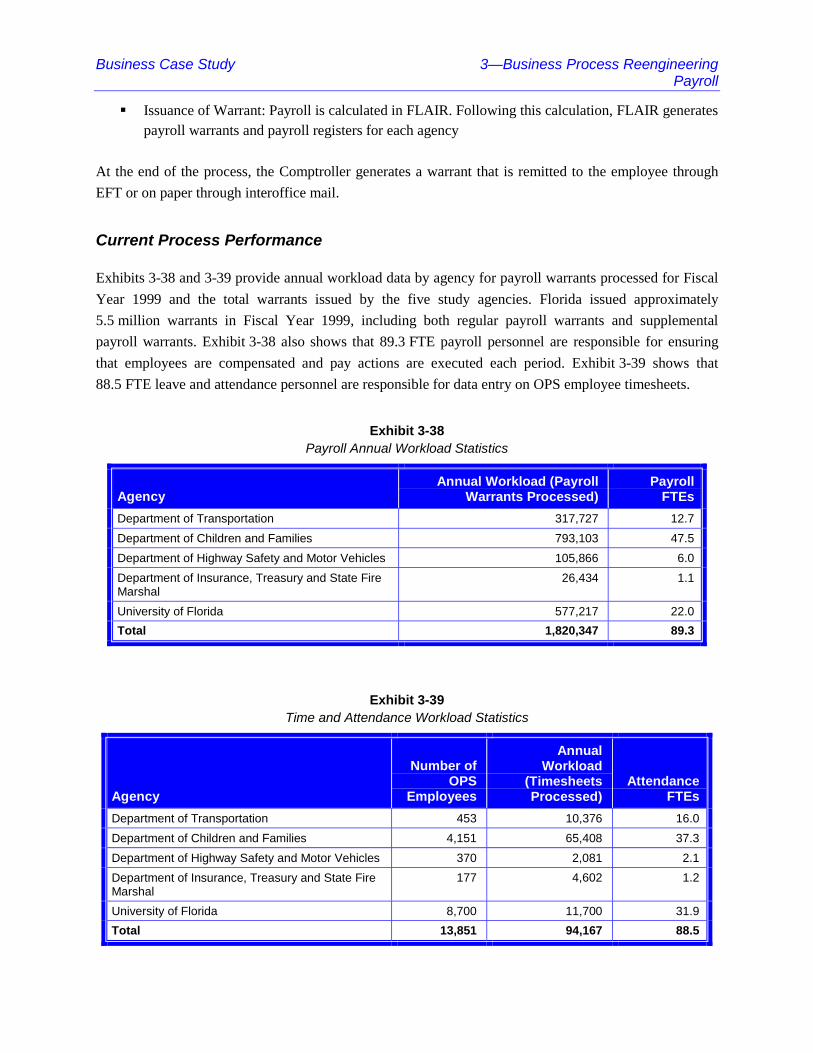
Business Case Study 3—Business Process ReengineeringPayroll
! Issuance of Warrant: Payroll is calculated in FLAIR. Following this calculation, FLAIR generatespayroll warrants and payroll registers for each agency
At the end of the process, the Comptroller generates a warrant that is remitted to the employee through
EFT or on paper through interoffice mail.
Current Process Performance
Exhibits 3-38 and 3-39 provide annual workload data by agency for payroll warrants processed for Fiscal
Year 1999 and the total warrants issued by the five study agencies. Florida issued approximately
5.5 million warrants in Fiscal Year 1999, including both regular payroll warrants and supplemental
payroll warrants. Exhibit 3-38 also shows that 89.3 FTE payroll personnel are responsible for ensuring
that employees are compensated and pay actions are executed each period. Exhibit 3-39 shows that
88.5 FTE leave and attendance personnel are responsible for data entry on OPS employee timesheets.
Exhibit 3-38Payroll Annual Workload Statistics
AgencyAnnual Workload (Payroll
Warrants Processed)Payroll
FTEs
Department of Transportation 317,727 12.7
Department of Children and Families 793,103 47.5
Department of Highway Safety and Motor Vehicles 105,866 6.0
Department of Insurance, Treasury and State FireMarshal
26,434 1.1
University of Florida 577,217 22.0
Total 1,820,347 89.3
Exhibit 3-39Time and Attendance Workload Statistics
Agency
Number ofOPS
Employees
AnnualWorkload
(TimesheetsProcessed)
AttendanceFTEs
Department of Transportation 453 10,376 16.0
Department of Children and Families 4,151 65,408 37.3
Department of Highway Safety and Motor Vehicles 370 2,081 2.1
Department of Insurance, Treasury and State FireMarshal
177 4,602 1.2
University of Florida 8,700 11,700 31.9
Total 13,851 94,167 88.5

Business Case Study 3—Business Process ReengineeringPayroll
Source: Interviews with agencies and Fiscal Year 1999 payroll data provided by Bureau of State Personnel
Current Process Costs
The cost of the current payroll process is derived by analyzing three cost components—customer costs,
agency costs, and centralized costs. These costs are estimated in the agencies that were part of the study
and then extrapolated to the entire State government. Customer costs generally reflect the time an
individual spends completing a form or entering data to initiate a process. Agency costs reflect the labor
costs of the agency personnel devoted to carrying out the process. Centralized costs reflect the labor costs
of personnel who are located in a statewide administrative support agency and who participate in the
process statewide.
The cost analysis focuses on direct labor costs. Overhead and other indirect costs associated with the
process are excluded. The costs measured in the five study agencies are extrapolated to the rest of State
government based on workload factors that most affect the costs. The categories and the costs for the five
study agencies and for estimates of those categories and costs statewide are described below.
Customer Costs: The customer for this process is the employee. Customer-related costs refer to the time
it takes the employee to report his or her time worked. For employees whose time is reported by
exception, the customer costs are minimal. Employees need only report exceptions to the normal work
week or month. For employees whose time is reported positively, the customer cost is the time it takes to
complete the timesheet. Each timesheet requires about 10 minutes to complete. Extrapolated to the entire
State government, the customer cost for this process based on an average of $23 per hour (average of all
State employees’ salaries and benefits), 178,000 employees, and 26 pay periods per year is $20.2 million.
Agency Costs: Agency costs include three parts—data entry, oversight of the creation of the payroll file,
and journal transfers to ensure proper accounting. The costs for data entry and oversight of the payroll file
are summarized in Exhibit 3-40.
Exhibit 3-40Summary of Labor Costs Associated with the Payroll Process
Agency Payroll FTE Costs
Department of Transportation 12.7 $361,000
Department of Children and Families 47.5 1,349,000
Department of Highway Safety and Motor Vehicles 6.0 170,000
Department of Insurance, Treasury and State Fire Marshal 1.1 31,000
University of Florida 22.0 625,000
Total 89.3 $2,536,000
Source: Interviews and data provided by agencies

Business Case Study 3—Business Process ReengineeringPayroll
Each agency has staff responsible for entering leave and attendance for OPS and positive pay employees.
As shown in Exhibit 3-39, for the study agencies, 88.5 FTEs are devoted to data entry for positive pay
and OPS employees. We extrapolated our study agencies to the entire State operations and estimated the
number of FTEs devoted to this function at 279.3 FTEs. We used an average annual FTE payroll
processing compensation of $28,406, including benefits. The total statewide cost for leave and attendance
FTEs is estimated at $7.9 million.
Agencies’ payroll personnel are responsible for determining that employees are accurately compensated
and pay actions are properly executed. In addition, errors resulting from leave and attendance records are
examined and resolved by payroll personnel. Furthermore, these personnel ensure that following a payroll
run, the FLAIR Departmental Accounting System is updated to reflect payroll amounts for the period.
Staff devoted to overseeing the creation of the payroll file, handling errors, and resolving issues totals
89.3 for the five study agencies. Extrapolated statewide based on the total number of State employees, we
estimate that 289.8 FTEs are devoted to this function, costing approximately $8.2 million.
Additional agency costs include the time required to update the FLAIR Departmental Accounting System.
Because FLAIR allows disbursements from only one account code, accounting personnel must execute a
series of journal transfers to allocate payroll warrants to more than one account code. The costs for this
portion of the process are addressed in Section 3.6 (Accounting for Payments from Multiple Accounts).
Centralized Costs: These are costs for the staff in the Comptroller’s office who are responsible for
printing warrants and the staff in the Bureau of State Payrolls who are responsible for processing payroll
centrally. Currently, there are 35 FTEs in the Bureau of State Payrolls, which equates to a cost of
$1,504,000.
In total, the State annually expends an estimated $20.2 million in customer costs, $16.1 million in agency
costs, and $1,504,000 in centralized costs to carry out the payroll process.
Current Process Weaknesses
The payroll process for the State of Florida is inefficient. Inefficiencies arise from:
! Separate supplemental payments
! Inconsistent payrolls
! Redundant data entry
! Inefficient use of payroll personnel in small agencies
! Inadequate system support for dually employed personnel
! Inadequate interface between COPES and FLAIR

Business Case Study 3—Business Process ReengineeringPayroll
Separate Supplemental Payments
During Fiscal Year 1999, the State issued nearly 5.5 million payroll warrants. This includes both regular
payroll warrants and supplemental payroll warrants. Supplemental warrants account for approximately 12
percent (648,000) of the payroll warrants issued, because the State does not always include supplemental
payments in regular payroll warrants. A best practice of many states is to combine overtime payments and
other supplemental payments with regular warrants. The overtime amount is included in the warrant and
indicated separately on the pay stub. The State’s policy of issuing these payments separately results in the
creation of 648,000 additional warrants.
Inconsistent Payrolls
The State does not have a standard pay cycle. Employees are either on a monthly or biweekly pay cycle,
causing inconsistency of payroll cycles statewide. Generally, the agencies that use both pay cycles,
compensate OPS employees using a biweekly cycle. The practice of having each agency establish its own
pay cycles leads to a proliferation of payroll processes and inefficient use of payroll resources. Based on
data provided by 45 State agencies, we observed that large agencies are twice as efficient as small ones.
The average ratio for agencies larger than 3,500 employees is 989 employees per one payroll staff. For
agencies with fewer than 3,500 employees, the ratio is 464 employees to one payroll staff.
Redundant Data Entry
The use of manual time cards for positive pay and OPS employees results in redundant data entry. Leave
and attendance data is entered once manually by the employee and then again by data entry clerks. OPS
employees make up 23 percent of the employees compensated through the State’s payroll system. The
greater the frequency that the data is entered, the greater the probability for error. Data received from the
Bureau of State Payrolls indicates the reasons that contribute to the errors, such as incorrect Social
Security number, incorrect number of hours worked, and leave-without-pay hours not captured. The post-
payroll adjustments include activities such as warrant cancellation, salary refunds, EFT cancellation, and
other miscellaneous adjustments.
Inadequate System Support for Dually Employed Personnel
In addition, without modification the current system cannot ensure compliance with Fair Labor Standards
Act (FLSA) standards. The scope of work for our study assumes that Florida is a single employer and as
such all agencies operate under the same rules and regulations, using a uniform set of management
principles, while working toward the same goal of the State. Governed by Florida Statutes 110.109 and
110.207, the State has a regulatory obligation to follow the guidance and stipulations of the FLSA and the
Family Medical Leave Act (FMLA). The State has staff who are dually employed and are drawing

Business Case Study 3—Business Process ReengineeringPayroll
income conjointly from multiple agencies. The criteria for overtime dual employment and leave under the
FLSA applies uniformly to all employees.
Inadequate Interface Between COPES and FLAIR
Finally, the inadequate interface between COPES and FLAIR does not allow efficient data connectivity
between the two systems. Following a payroll cycle, agency personnel expend resources to ensure that
data between COPES and FLAIR are synchronized. Interface files such as File 0001 and File 0013 are
created to make certain that data from both systems match. This process is inefficient, because the
financial system is not updated as soon as the process is complete. Agency personnel enter data manually
from the interface files and create a tape to feed the data into the financial system.
Reengineered Process
To address the weaknesses in Florida’s payroll system, the State should:
! Move to a shared services concept by having several agencies served by a single payroll unit
! Incorporate supplemental warrants into regular payroll
! Establish a statewide semi-monthly payroll
! Automate positive pay data entry
! Enhance the integration of payroll and accounting functions
Recommendation BPR-18: Move to a shared services concept by having severalagencies served by a single payroll unit
The State should organize its payroll personnel (and possibly its personnel staffs) into five shared services
clusters that would each serve a number of agencies. Shared services units should be organized into the
following clusters:
! Education
! Human Services
! Criminal Justice and Corrections
! Natural Resources/Environment/Growth Management/Transportation
! General Government
The shared services approach takes advantage of the economies of scale that come with serving a large
number of employees. As indicated previously, payroll staffs at the larger agencies are nearly twice as
efficient as payroll personnel in the smaller agencies. By having fewer payroll offices—each handling

Business Case Study 3—Business Process ReengineeringPayroll
more employees—the State can move all payroll personnel to a 1 to 989 ratio of payroll staff to
employees, rather than a 1 to 464 ratio experienced by smaller agencies.
Exhibit 3-41 illustrates a technique the State may consider using to combine the State agencies. Each
group contains agencies that provide similar functions and can be supported by a single large agency
within that group. The bolded agencies in the table will serve as the HR/Payroll central processing units
for the agencies that belong in the same section.
Fiscal Impact: The estimated number of payroll staff statewide is 289.8. If the State adopts this
recommendation and assumes a ratio of 989 to 1 payroll staff, the total number of payroll personnel could
be reduced by about 71 positions for an annual estimated savings of $2,016,000. (The estimated average
salary is based on an Accountant II.)

Business Case Study 3—Business Process ReengineeringPayroll
Exhibit 3-41Allocation of Payroll Personnel Based on Shared Services Concept
AgenciesPayroll Warrants
Oct. 1999Current
Payroll FTEsShared Services
Payroll FTEs
Department of Corrections 26,667 56.0 43.6
Justice Administrative Commission 7,740 6.0
Department of Juvenile Justice 5,812 5.0
Department of Law Enforcement 1,705 2.4
Department of Legal Affairs/Attorney General 1,059 1.0
Parole Commission 183 1.5
Subtotal 43,166 71.9 43.6
Department of Education 1,069 2.3 72.0
Board of Regents 151 2.0
Universities 70,326 72.2
Subtotal 71,546 76.5 72.0
Department of Transportation 10,154 12.7 21.5
Agriculture/Consumer Services 4,338 2.0
Department of Community Affairs 544 2.5
Department of Environmental Protection 4,237 4.0
Florida Fish and Wildlife Commission 2,072 2.0
Subtotal 21,345 23.2 21.5
Department of Children and Families 26,347 47.5 43.0
Agency/Health Care Administration 1,972 3.8
Florida School for the Deaf and Blind 799 1.5
Department of Elder Affairs 402 2.4
Department of Health 13,459 13.9
Department of Veterans’ Affairs 382 1.2
Subtotal 43,361 70.3 43.0
Department of Management Services 1,554 2.0 28.7
Banking and Finance/Comptroller 897 1.0
Business and Professional Regulation 1,889 2.0
Division of Retirement 261 1.0
Ringling Museum 59 .75
Department of Citrus 148 1.0
Administrative Hearings 67 1.0
Executive Office of the Governor 326 6.0
Department of Highway Safety and Motor Vehicles 4,715 6.0
Office of the Auditor General 423 1.2
Department of Insurance, Treasury and State Fire Marshal 1,483 1.1
Department of Labor and Employment Security 5,761 5.0
Legislative Offices 1,417 2.3
Department of Lottery 637 1.2
Department of Military Affairs 255 1.0
Public Service Commission 402 2.5
Department of Revenue 5,324 5.0
Department of State 777 1.5
State Courts System 2,800 3.0
Subtotal 29,195 44.55 28.7
Total 208,613 286.45 208.8

Business Case Study 3—Business Process ReengineeringPayroll
Recommendation BPR-19: Fold supplemental warrants into regular payroll
By combining supplemental warrants (other than travel reimbursements) with regular payroll warrants,
the State would significantly reduce the total number of warrants issued. If a supplemental payment is due
to an employee after or before the payroll cycle, the warrant would be held until the next payroll cycle to
be issued along with the regular payroll.
The advantage of adopting this recommendation is the reduction in the number of warrants and the cost of
issuing warrants. Based on studies conducted by the Federal Department of the Treasury, organizations
can reduce costs by $0.28 per check if payroll checks are issued via EFT.
Fiscal Impact: In Fiscal Year 1999, the State processed approximately 658,000 supplemental payments.
Based on the State’s current rate of non-EFT payments to employees of 25 percent, calculations show that
this recommendation would result in eliminating 493,500 separate EFT payments and 164,500 separate
warrants. By combining supplemental warrants with regular payroll, the State would save approximately
$88,000 annually.
Recommendation BPR-20: Establish a semi-monthly payroll
Innovative practices for processing payroll show that many government agencies are moving toward a
consistent payroll cycle and calendar for all employees. The more consistent the payroll is statewide, the
more success the State will have with the shared services concept for payroll processing. A single
statewide payroll process is consistent with an enterprisewide perspective for managing State
government. The adoption of a single pay cycle for all State employees would assist the State in its efforts
to standardize human resources and payroll policies, procedures, and practices and to implement the
shared services concept. The standardization would also allow for cost reduction in processing payroll.
We recommend that the State adopt a semi-monthly pay cycle. A semi-monthly pay cycle allows
employees to be paid twice per month. This cycle results in 24 pay periods each year instead of 26 or 27
pay periods and generally provides an equal pay rate for employees each pay period. Although there
could be variation in the number of hours worked each pay period, the effect would be minimal compared
to that of a monthly cycle.
A semi-monthly payroll cycle standardizes employment practices among all State agencies. The State
would see a reduction in the amount of processing time required to calculate payroll. There would be no
tax calculation complexities when an employee switches from one agency to another mid-cycle. The State
should further consider the impact of cash flow to employees.
Fiscal Impact: Because the State now has monthly and biweekly pay periods, the number of payrolls and
warrants produced during the year would not change significantly with the change to a semi-monthly

Business Case Study 3—Business Process ReengineeringPayroll
payroll. Consequently, there are no net savings associated with the recommendation. However, depending
on payment timing, significant interest earnings would be lost by the State as a result of moving to a
semi-monthly payroll cycle. In addition, retaining multiple paycycles could significantly increase
implementation costs.
Recommendation BPR-21: Automate positive pay decentralized data entry statewide
HR/Payroll professionals recommended that companies integrate the entry of leave and attendance with
HR/Payroll systems and decentralize entry for nonexempt employees. This simplifies time reporting and
eliminates exempt reporting and exception reporting where possible. The automation and integration of
leave and attendance entry would enable approximately 70 percent of OPS and positive pay employees to
report time directly in the leave and attendance system.
Decentralization of leave and attendance entry would allow employees to enter their time directly into the
time keeping system and would reduce the number of data entry personnel required to enter leave and
attendance by 75 percent. Late timesheets would be processed in the next time period along with current
payroll.
Leave and attendance capture systems can be integrated with the payroll system and can be close to the
source with corrections made at the source. Leave and attendance processing improvements would also
contribute to the reduction in supplemental payroll processing, cost of typing, and logging of manual
checks and would allow for real-time maintenance of the payroll database. Late timesheets would be
processed in the next time period along with current pay. This allows for employee empowerment and
accountability.
Fiscal Impact: The five pilot agencies studied have a total of 89.3 FTEs dedicated to entering leave and
attendance. Extrapolating this number based on the number of positive pay and OPS employees working
for the State, we estimate that 279.3 FTEs perform this function statewide. With decentralization, the
effort required of these 279.3 FTEs would be reduced by an estimated 75 percent. Based on an estimated
279.3 data entry FTEs statewide, at a salary of $28,406 per FTE and 75 percent reduction, the calculation
shows that the State could realize potential annual savings of $5,950,000.
Recommendation BPR-22: Enhance the integration of payroll and accounting functions
A best practice for payroll processing is to integrate payroll information with HR and financial systems.
The State must determine how to distribute the overtime charges between agencies and internal account
codes, as well as how to determine the rate of overtime payment when multiple employees have multiple
rates of pay. The State must set guidelines for establishing a primary employer when an employee is
dually employed, with explanations on how to handle issues such as nonstandard work schedules or
unexpected work demands affecting overtime rates and charges to another agency.

Business Case Study 3—Business Process ReengineeringPayroll
An integrated HR/Payroll system would screen dual employment practices to ensure that the State is in
compliance with FLSA and FMLA standards. This would minimize the State’s exposure to dual
employment violations.
Over time, stipulations could be monitored to ensure that employment standards are not violated. An
integrated HR/Payroll system would enable the State to adhere to federal requirements as a single
employer. It would aid the State in screening employees who seek additional employment for FLSA
overtime qualifications by one system and one set of criteria. In addition, all employees would be treated
to the legal and ethical applications outlined in FLSA and FMLA overtime benefits, and employees
would be timely paid to ensure compliance with FLSA standards.
All State agencies would have a uniform system. An integrated HR/Payroll system would replace the
current system to ensure that Florida has a state-of-the-art HR/Payroll Management System. Agency
personnel could easily evaluate employees for FLSA and FMLA compliance and rely more on the
efficiency of the financial system through an integrated system.
Fiscal Impact: The fiscal impact from this recommendation would only ensure that the State stays in
compliance with FLSA, FMLA, and Internal Revenue Service regulations.
Reengineered Process—System Requirements
An integrated HR/Payroll system should have the following capabilities:
! Support biweekly, monthly, or semi-monthly pay cycles for more than 200,000 employees
– Pay employees on any cycle
– Provide a common pay master support
– Allow agencies the ability to cancel warrants online
– Track detailed and summary payroll history for each employee
! Send funding source information to accounting
– Update the accounting segments of the financial system
– Distribute labor costs according to project, account, or cost center
– Compute overtime premium and distribute the premium portion of the pay to separate generalledger accounts by cost center
! Capture and integrate time worked by all employees who must report time
– Allow time reporting from automated electronic collection system
– Provide time entry screens that select all employees eligible for a particular earning type for aspecific agency

Business Case Study 3—Business Process ReengineeringPayroll
– Display current leave accrual balances to the agency at the time of payroll certification/entry
– Produce agency payroll reports after time entry is complete to ensure an accurate pay run
! Accommodate salary/salary, salary/OPS, and OPS/OPS payments made from the same ordifferent agencies
– Provide an electronic approval process for dual employment and compensation betweenagencies
Options Analysis
Options 3, 4, and 5 will accommodate the State’s move to a single payroll unit. This single
recommendation contains savings of $2.0 million. An additional $88,000 in savings can be applied to
Options 2 through 5 by folding supplemental warrants into regular payroll. Following a cycle change and
standardization of pay cycle to semi-monthly, it is recommended that any process change require
implementation of all systems options. In addition, the adoption of the recommendation to automate
positive pay decentralized data entry statewide will necessitate the implementation of system Options 2,
3, 4, or 5. Finally, implementing a system that enhances the integration of payroll and accounting
functions, while having its benefits, requires an overhaul of the current system. To achieve this venture
and maintain systems integration, the State may consider 70 percent of system Option 2, and all of
Options 3, 4, or 5. Exhibit 3-42 provides the savings associated with each of the five alternatives.

Business Case Study 3—Business Process ReengineeringPayroll
Exhibit 3-42Summary of Annual Savings by Option
OptionBudgetary
SavingsIncreasedEfficiency
Total BPRSavings
Recommendation BPR-18
Option 1 $0 $0 $0
Option 2 0 0 0
Option 3 2,016,000 0 2,016,000
Option 4 2,016,000 0 2,016,000
Option 5 2,016,000 0 2,016,000
Recommendation BPR-19
Option 1 0 0 0
Option 2 88,000 0 88,000
Option 3 88,000 0 88,000
Option 4 88,000 0 88,000
Option 5 88,000 0 88,000
Recommendation BPR-20
Option 1 0 0 0
Option 2 0 0 0
Option 3 0 0 0
Option 4 0 0 0
Option 5 0 0 0
Recommendation BPR-21
Option 1 0 0 0
Option 2 5,950,000 0 5,950,000
Option 3 5,950,000 0 5,950,000
Option 4 5,950,000 0 5,950,000
Option 5 5,950,000 0 5,950,000
Recommendation BPR-22
Option 1 0 0 0
Option 2 0 0 0
Option 3 0 0 0
Option 4 0 0 0
Option 5 0 0 0
Total
Option 1 $0 $0 $0
Option 2 $6,038,000 $0 $6,038,000
Option 3 $8,054,000 $0 $8,054,000
Option 4 $8,054,000 $0 $8,054,000
Option 5 $8,054,000 $0 $8,054,000

Business Case Study 3—Business Process ReengineeringTravel Reimbursement
3.10 Recommended Process Changes—Travel Reimbursement
This section presents the recommendations for reengineering the State of Florida’s travel reimbursement
process.
Background
A public officer, public employee, or authorized person uses the travel reimbursement process to obtain
reimbursement for authorized and allowable out-of-pocket expenses while on State business. Allowable
expenses include transportation, meals, lodging, and other costs incidental to traveling such as taxi fares,
parking fees, and tolls.
Governed by Chapter 112.061 of the Florida Statutes, travel status is classified as Class A, Class B, and
Class C:
! Class A travel is defined as continuous travel of 24 hours or more away from the traveler’sofficial headquarters. Travel time is based on a calendar day—from midnight to midnight
! Class B travel is defined as continuous travel of less than 24 hours that requires an overnightabsence from the traveler’s official headquarters. Travel time is calculated on the travel periodconsisting of 6-hour cycles beginning with departure time
! Class C travel is defined as travel for short or day trips where the traveler is not away fromofficial headquarters overnight. Class C meal expense allowances are a fringe benefit and areconsidered taxable income by the IRS, subject to federal income tax withholding and SocialSecurity taxes
The travel expenditures for Fiscal Year 1999 are estimated at $174.4 million for all 49 State entities
(agencies and universities). A travel expenditure report received from the Bureau of Auditing shows that
the 1999 budget allocations for travel for State agencies ranges from $1.1 million to $16.5 million per
year.
To obtain reimbursement, a State traveler must generally receive authorization or approval from an
authorizing agent before departing. The only exception to the authorization policy is Class C travel. Class
C travel may involve vicinity or map mileage; related parking and toll expense; and airfare, car rental,
meals, or travel for an emergency situation. Thus, pre-approval is unnecessary.
Guidelines for reimbursement are specified in the Statutes. A Class A or Class B traveler is usually
reimbursed $50 per day or actual expenses to the extent allowed. A Class C traveler is reimbursed for
applicable meal allowances plus actual expenses for items such as parking and tolls.

Business Case Study 3—Business Process ReengineeringTravel Reimbursement
Agencies are afforded some flexibility in administering travel. We observed variations in the following
areas:
! Mileage requirements: Agencies have some variations in mileage parameters that a traveler has tomeet to be eligible for Class C meals reimbursement. The mileage parameters may range from 25to 80 miles. In some cases, city limits define the parameters
! Credit cards and PCards: Although the use of PCards is rare, some employees use PCards fortravel expense. Others are required to pay for expenses with individual credit cards.Reimbursement of PCard expenses are paid directly to the vendor by the bank, and the bank isreimbursed by the State Comptroller. The majority of Department of Banking and Financeemployees use PCards to incur travel expenses, whereas the use of PCards in other agencies isinfrequent
! Expense reimbursement forms: Different reimbursement forms are used by agencies. However,the Bureau of Auditing requires that forms capture basic information such as the name of thetraveler, date of travel, Social Security number, and authorization signatures
Travel expenditures, including travel advances, are entered and maintained in the FLAIR subsystem.
Agencies generate voucher schedules and transmit them to the State Comptroller’s office. FLAIR
produces and tracks warrants issued to reimburse travelers.
Current Process
The travel reimbursement process has three major components—completing, processing, and auditing the
requisition form. The traveler completes the form and central agency staff members process and audit the
form; the State Comptroller conducts an audit as well.
Before incurring travel expenses, the agency traveler generally submits an authorization form to the
authorizing agent. The agent reviews the form and authorizes travel. After the traveler incurs travel
expenses, he or she completes an expense reimbursement form manually and submits the completed form
to the authorizing agent. The agent reviews the reimbursement form and manually signs and authorizes
reimbursement for travel expenses.
The reimbursement form is forwarded to agency personnel who audit the form and the attached
supporting documentation. Agency personnel classify expenses on the form by object codes and enter
details of the expenses into the FLAIR system manually. In addition to this task, personnel process Class
C meals separately from other expenses through the payroll system. If errors are found during the auditing
function, the form is generally sent back to the traveler for correction. If no errors are found and expenses
are $1,000 or less, FLAIR generates an expense warrant or EFT (which is sent to agency personnel for
distribution to the employee) and a voucher schedule.

Business Case Study 3—Business Process ReengineeringTravel Reimbursement
If travel expenses are over $1,000, agency personnel will forward the reimbursement form and supporting
documentation to the State Comptroller’s office for auditing and reimbursement. When the State
Comptroller has reviewed the travel expenses, an expense reimbursement warrant or EFT is issued to the
traveler.
The University of Florida uses an automated travel reimbursement system known as Travel Request and
Reimbursement Information Processing System (TRRIPS). TRRIPS automates the entering, routing, and
approval of travel authorizations and vouchers for reimbursement of travel expenses. The traveler enters a
Travel Approval Request into TRRIPS and forwards it for budget approval. Following budget approval,
funds are encumbered and forwarded to the Disbursement Office for approval. The Disbursement Office
approves travel electronically and assigns an encumbrance number to the traveler’s record. After travel is
completed, the traveler forwards receipts to agency personnel and enters expenses online. This entry
creates a travel voucher, which is electronically forwarded to the traveler for review and is subsequently
forwarded to the traveler’s authorizing agent for expense approval. The approval by the authorizing agent
is sent electronically to the Disbursement Office for reimbursement, and agency personnel mail original
receipts to the Disbursement Office. TRRIPS includes an automatic audit function to ensure compliance
with travel rules and regulations. The traveler is reimbursed approximately 3 days after travel is
completed.
Current Process Performance
Exhibit 3-43 provides Fiscal Year 1999 annual workload data by agency for the travel reimbursement
process.
Exhibit 3-43Workload and Performance Metrics for the Travel Reimbursement Process
AgencyAnnual Workload (TravelReimbursement Forms)
Average Cycle orTransaction Cost
(Days)
Department of Transportation 34,675 10
Department of Children and Families 111,475 15
Department of Highway Safety and MotorVehicles
6,500 10
Department of Insurance, Treasury andState Fire Marshal
9,364 15
University of Florida 55,357 10
Source: Interviews with agency personnel
The five study agencies generally reimburse travel expenses through their revolving fund accounts. This
process accelerates reimbursement to the traveler for expenses incurred while on travel status. The
average cycle time shown in the Exhibit 3-43 indicates the cycle time beginning with entry of a traveler’s

Business Case Study 3—Business Process ReengineeringTravel Reimbursement
expense data by agency personnel and ending with expense reimbursement to the traveler from the State
Comptroller.
Current Process Costs
The cost of the travel reimbursement process is derived by analyzing three cost components—customer
costs, agency costs, and centralized costs. Customer costs generally reflect the time an individual spends
completing a form or entering data to initiate a process. Agency costs reflect the labor costs of agency
personnel devoted to carrying out the process. Centralized costs reflect the labor costs of personnel who
are located in a statewide administrative support agency and who participate in the process statewide.
The cost analysis focuses on direct labor costs. Overhead and other indirect costs associated with the
process are excluded. The costs measured in the five study agencies are extrapolated to the rest of State
government based on workload factors that most affect the costs. The categories and the costs for the five
study agencies and for estimates of those categories and costs statewide are described below.
Customer Costs: These are costs incurred by the traveler. Customer costs reflect the time spent by the
employee to complete the travel reimbursement form—currently about 20 minutes. The reductions in
these costs are beneficial but are not likely to lead to reduced staffing costs. Based on the total number of
travel reimbursement forms completed statewide (887,689), estimates are that State employees spend
292,000 hours per year completing travel reimbursement forms. Based on an average hourly rate of $23
(average of all employees’ salaries and benefits), estimates are that the customer cost is $6.8 million.
Agency Costs: Agency costs are represented in the staff time and effort associated with data entry and
auditing the travel reimbursement process. Exhibit 3-44 shows the number of FTEs that are 100 percent
dedicated to the travel reimbursement process. The total number of FTEs dedicated to the travel
reimbursement process for the five study agencies is 36.8. The total cost of these positions is $1.0 million.
(The estimated average salary is based on an Accountant II.) The staff members dedicated to processing
travel reimbursement devote 75 percent of their time to data entry and auditing of travel reimbursement
forms.
In Fiscal Year 1999, a total of 887,689 reimbursement forms were processed statewide. The total number
of reimbursement forms processed by the five study agencies was 217,371. Each FTE handles about
5,907 reimbursement forms per year. Based on this ratio, calculations indicate that the State has
approximately 150.3 FTEs who process expense reimbursement forms. This translates to $4.3 million
annually in agency labor costs devoted to the travel reimbursement process.
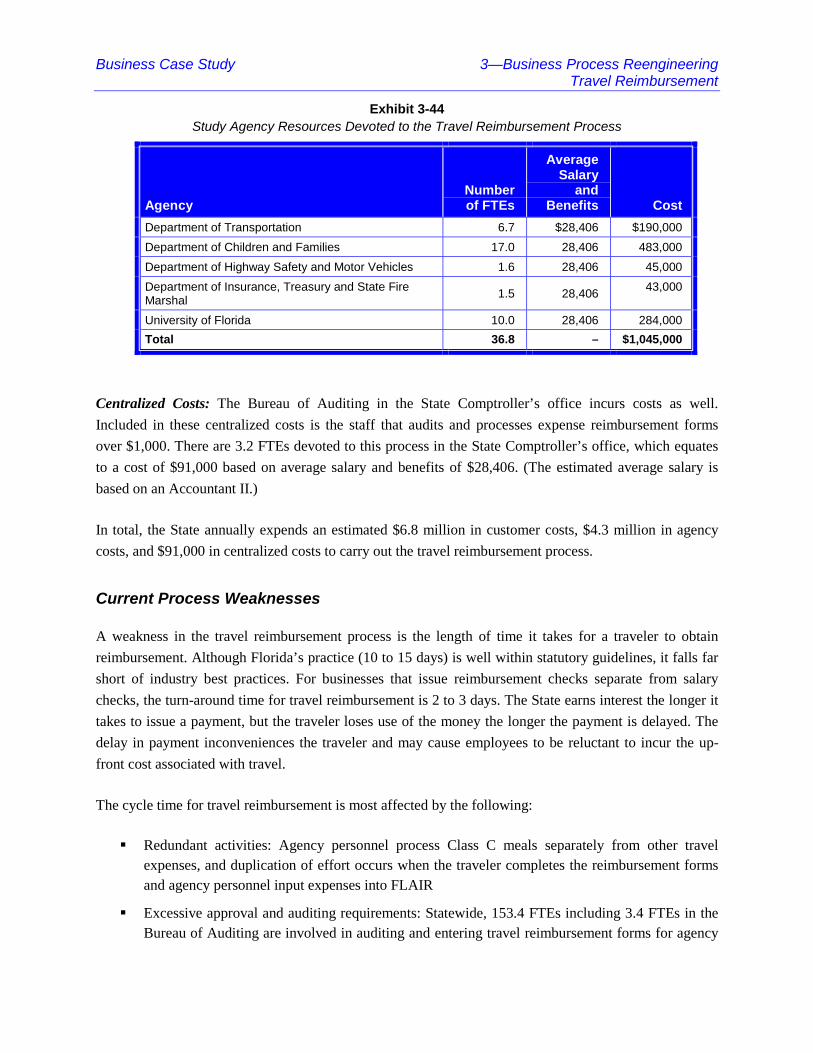
Business Case Study 3—Business Process ReengineeringTravel Reimbursement
Exhibit 3-44Study Agency Resources Devoted to the Travel Reimbursement Process
AgencyNumberof FTEs
AverageSalary
andBenefits Cost
Department of Transportation 6.7 $28,406 $190,000
Department of Children and Families 17.0 28,406 483,000
Department of Highway Safety and Motor Vehicles 1.6 28,406 45,000
Department of Insurance, Treasury and State FireMarshal
1.5 28,40643,000
University of Florida 10.0 28,406 284,000
Total 36.8 – $1,045,000
Centralized Costs: The Bureau of Auditing in the State Comptroller’s office incurs costs as well.
Included in these centralized costs is the staff that audits and processes expense reimbursement forms
over $1,000. There are 3.2 FTEs devoted to this process in the State Comptroller’s office, which equates
to a cost of $91,000 based on average salary and benefits of $28,406. (The estimated average salary is
based on an Accountant II.)
In total, the State annually expends an estimated $6.8 million in customer costs, $4.3 million in agency
costs, and $91,000 in centralized costs to carry out the travel reimbursement process.
Current Process Weaknesses
A weakness in the travel reimbursement process is the length of time it takes for a traveler to obtain
reimbursement. Although Florida’s practice (10 to 15 days) is well within statutory guidelines, it falls far
short of industry best practices. For businesses that issue reimbursement checks separate from salary
checks, the turn-around time for travel reimbursement is 2 to 3 days. The State earns interest the longer it
takes to issue a payment, but the traveler loses use of the money the longer the payment is delayed. The
delay in payment inconveniences the traveler and may cause employees to be reluctant to incur the up-
front cost associated with travel.
The cycle time for travel reimbursement is most affected by the following:
! Redundant activities: Agency personnel process Class C meals separately from other travelexpenses, and duplication of effort occurs when the traveler completes the reimbursement formsand agency personnel input expenses into FLAIR
! Excessive approval and auditing requirements: Statewide, 153.4 FTEs including 3.4 FTEs in theBureau of Auditing are involved in auditing and entering travel reimbursement forms for agency

Business Case Study 3—Business Process ReengineeringTravel Reimbursement
travelers. To ensure compliance with Chapter 215.422 of the Florida Statutes, which allows 40days to process travel expenditures, agency personnel audit all reimbursement forms extensivelyand enter Class C travel separately. Except for Class C travel, travel must generally be pre-approved by an authorizing agent. The Bureau of Auditing performs random sampling ofreimbursement forms in the amount of $1,000 or less and audits all expense reimbursement formsover $1,000
! Manual processes: For many agencies, travel reimbursement is a manual process involving thetraveler, supervisor/authorizing agent, agency personnel, and Bureau of Auditing (StateComptroller). Much of the information required for the travel reimbursement form is not capturedin FLAIR or any other automated system. Consequently, the information cannot be reviewedthrough computer-aided audit techniques. The travel reimbursement form can only be auditedmanually
If an agency does not have revolving funds available to reimburse the traveler and the reimbursement due
is greater than $1,000, the cycle time can take up to 30 days.
Another impediment to an efficient travel reimbursement process is the separate processing of Class C
meals. An efficiently operating process should process all classes of travel together. Because Class C
reimbursements are processed separately, they contribute to the proliferation of warrants, dual processing
efforts, and unnecessary costs.
In Fiscal Year 1999, 171,141 warrants were issued for Class C travel. There are additional costs
associated with issuing Class C travel warrants including the following:
! Class C meal reimbursement is a fringe benefit to employees and is therefore considered taxableincome by the IRS. To withhold federal income and Social Security taxes, Class C meals areprocessed separately from other expenses through the payroll system. However, warrants issuedfor Class C meals are not included with the regular payroll
! FLAIR cannot withhold taxes or allocate funds for Class C meals to the correct funding source
The State of Florida has provided its employees with the Class C travel benefit for many decades and any
changes to the policy would have to consider the effect that this category of reimbursement has on State
employees.
Finally, Florida travel reimbursement rates do not reflect actual costs or cost variation by location. A per
diem rate of $50 for lodging and meals is specified in the Statutes. These rates have not kept up with
inflation. Currently, reimbursement does not vary based on where the costs are incurred. The mileage
reimbursement of $0.29 offered by the State has not changed in several years and does not meet the
federal reimbursement rate of $0.31 per mile. Federal per diem rates vary by city. Exhibit 3-45 indicates
the Federal per diem rates for major Florida cities.

Business Case Study 3—Business Process ReengineeringTravel Reimbursement
Exhibit 3-45Federal Per Diem Rates for Comparison to $50 State Per Diem
Item Federal Per Diem Rates
Jacksonville Miami Fort Lauderdale
Lodging $65 (04/16–12/31) $75
(01/01–04/15) $89
(05/01–12/14) $65
(12/15–04/30) $89
Meals $34 $42 $42
Source: http://policyworks.gov/org/main/mt/homepage/mtt/perdiem/perd00d.html
Reengineered Process
To address the major weaknesses in the travel reimbursement process, Florida needs to change its
reimbursement policies and implement a web-based travel reimbursement system.
Recommendation BPR-23: Require that all travel reimbursements be provided throughEFT
The State should require that all employees traveling on behalf of the State accept their reimbursements
through EFT. Currently, this option is available and widely used, but it is not mandatory. Information
about the reimbursement should be included with the employee’s regular pay stub information. The
current technology used by the State allows for a 2-day reimbursement using EFT; however, only
75 percent of agency travelers are reimbursed this way, leaving 221,922 separately issued warrants for
travel reimbursement.
In Fiscal Year 1999, of 887,689 reimbursement forms processed, 75 percent of Class A, B, and C travel
expense reimbursements were issued via EFT. A total of 171,141 were issued for the Class C travel
category alone. Expense reimbursement and payroll warrants are issued separately.
Fiscal Impact: Based on studies conducted by the Federal Department of the Treasury, organizations can
reduce costs by $.28 per item if payment is made by EFT rather than by separate warrants. By requiring
that all travel reimbursements are EFT and by putting all travel reimbursement information on the
employee’s pay stub, the State would eliminate 221,922 warrants and pay stubs. Total annual savings
would approximate $62,000.
Recommendation BPR-24: Allow for traveler to enter travel reimbursement informationon the network or remotely
The State should implement a web-based travel reimbursement system that allows remote data entry of
travel reimbursement information. This system would allow the traveler to directly enter expense
information.

Business Case Study 3—Business Process ReengineeringTravel Reimbursement
A web-based reporting system reduces the paper process, relieves agency personnel of the responsibility
of entering and auditing reimbursement forms, and decentralizes data entry. Implementation of this
recommendation would eliminate the need for centralized data entry and auditing. Centralized data entry
and auditing make up approximately 75 percent of the workload of the 150.2 FTEs statewide devoted to
the travel reimbursement process.
Fiscal Impact: By implementing this system, the State would see a reduction of 112.6 FTE positions and
a reduction in personnel costs estimated at $3,198,000. (The estimated average salary is based on an
Accountant II.) A web-based system allows for remote access capability, online booking, and automated
transmission of authorization and reimbursement forms; it also reduces calculation errors.
Recommendation BPR-25: Create a corporate travel program
The major components of a corporate travel program include the following:
! Single credit card for all travel expenses
! A single travel agent
! Improved travel policies aimed at efficiency
The State should require that all travelers use a PCard to pay for travel expenses. This would relieve the
traveler of having to pay for travel expenses and wait for reimbursement. The bank is able to transmit
expenses charged with the corporate card or PCard electronically to the State Comptroller.
A further benefit of using a PCard for travel expenses is that it should allow the State to gather data that
can be used to negotiate better rates with vendors.
KPMG studies conducted of the five agencies showed that the use of PCards for travel expenses is rare.
Nearly 79 percent of all corporations use corporate credit cards for official travel.
Eighty-three percent of global corporations implement corporate travel policies, 46 percent of
corporations employ a corporate manager, and 73 percent of corporations have one designated travel
agency (American Express Global Travel & Expense Management Survey). FFMIS does not produce
information useful for negotiating rates with vendors. A statewide travel management program would
coordinate and oversee official travel by State employees to achieve fiscal accountability and significant
financial savings to the State.
Fiscal Impact: With more complete information on travel expenditures, it is estimated that the State
could reduce its travel expenditures by 2 percent or about $3,482,000 annually through negotiations with
providers.

Business Case Study 3—Business Process ReengineeringTravel Reimbursement
Recommendation BPR-26: Remove travel parameters from Florida Statutes 112.061 andplace in administrative rules
The Department of Management Services (DMS) should be given responsibility for developing proposed
rules for travel reimbursements. We recommend that the DMS consider using the federal per diem and
mileage rates. This would reduce the administrative effort associated with setting the rates periodically, as
well as lowering the cost of lodging.
Guidelines in administrative rules can change more easily with changes in economic factors. Furthermore,
by piggybacking on federal rates, the State would not have to set per diem rates annually. Although the
mileage and meal rates are higher under federal per diem, lodging rates (not specified in the statute) are
likely to be lower than actual Florida experience.
Fiscal Impact: The estimated net savings for this recommendation is zero. If the state adopts this
recommendation, the mileage rate will increase from $0.29 to $0.31 (the federal rate), and the allowance
for meals will increase from $21 to $30. On the other hand, cost for lodging may go down because the
State now pays actual costs rather than a per diem based on location.
Reengineered Process—System Requirements
A self-service web expense reporting system provides employees with convenient access to information.
It also eases the workload for internal support staff and human resources personnel. The system at a
minimum should provide the following functionality:
! The system should capture and reimburse state-related travel expenses for State and non-stateemployees
! Agency personnel should have the ability to enter actual travel expenses to a pre-defined, onlinescreen and automatically calculate mileage between destinations. The system should also becapable of allocating cost component information automatically and of supporting online bookingof reservations (auto, airfare, etc.)
! The system should pay third parties directly and associate the payment to a specific employee. Inaddition, the system should reconcile travel advances to actual expenditures, audit travelinformation for compliance with State travel regulations, identify duplicate payments toemployees and nonemployees, encumber multiple funding sources, provide inquiry access toemployees’ travel history, maintain a travel profile on each traveler, and track advancesdistributed to employees for travel purposes

Business Case Study 3—Business Process ReengineeringTravel Reimbursement
Options Analysis
Both of the recommendations requiring that all travel reimbursements be provided by EFT and allowing
for remote and desktop data entry of travel reimbursement information can be accomplished in Options 3,
4, and 5. The remaining recommendations can be implemented regardless of which option is chosen. The
savings by option are summarized in Exhibit 3-46.

Business Case Study 3—Business Process ReengineeringTravel Reimbursement
Exhibit 3-46Summary of Annual Savings by Option
OptionBudgetary
SavingsIncreasedEfficiency
Total BPRSavings
Recommendation BPR-23
Option 1 $0 $0 $0
Option 2 0 0 0
Option 3 62,000 0 62,000
Option 4 62,000 0 62,000
Option 5 62,000 0 62,000
Recommendation BPR-24
Option 1 0 0 0
Option 2 0 0 0
Option 3 3,198,000 0 3,198,000
Option 4 3,198,000 0 3,198,000
Option 5 3,198,000 0 3,198,000
Recommendation BPR-25
Option 1 3,482,000 0 3,482,000
Option 2 3,482,000 0 3,482,000
Option 3 3,482,000 0 3,482,000
Option 4 3,482,000 0 3,482,000
Option 5 3,482,000 0 3,482,000
Recommendation BPR-26
Option 1 0 0 0
Option 2 0 0 0
Option 3 0 0 0
Option 4 0 0 0
Option 5 0 0 0
Total
Option 1 $3,482,000 $0 $3,482,000
Option 2 $3,482,000 $0 $3,482,000
Option 3 $6,742,000 $0 $6,742,000
Option 4 $6,742,000 $0 $6,742,000
Option 5 $6,742,000 $0 $6,742,000

Business Case Study 3—Business Process ReengineeringPurchasing Commodities and Services
3.11 Recommended Process Changes—Purchasing Commoditiesand Services
This section presents the recommendations for reengineering the State of Florida’s purchasing process—
the process whereby the State procures commodities and services.
Background
Florida’s purchasing processes are used to obtain commodities and services requested by agencies to
carry out their responsibilities. Purchases are made through a traditional requisition process, which
generates a purchase order, or purchases are made by means of a State VISA Purchasing Card (PCard).
Annually, Florida State agencies purchase more than $1 billion worth of commodities and services. This
includes only those items purchased through a purchase order or on the PCard. For Fiscal Year 1999, the
State is expected to expend $80 million on goods and services using the PCard.
The State procures additional services through contracts that are not included entirely in the $1 billion.
Contractual services are procured primarily through contracts, although some State agencies convert
contracts to purchase orders to streamline processing. The primary customers of this process are State
agencies and their staffs that need to purchase goods or services from private vendors.
Agencies in the Florida State government do their own purchasing for the most part. The Division of
State Purchasing within the Department of Management Services negotiates and manages statewide
contracts and selected blanket purchases for agencies to use. The Division of State Purchasing has
approximately 63 staff members. Agencies are generally bound to purchase from these State contracts for
the commodities and services that fall within these contracts’ purview. For all other purchases, agencies
purchase on their own.
Chapter 287 of the Florida Statutes governs the purchasing process. Additional rules and regulations are
also found in the Florida Administrative Code (Rule 60A). The Judicial Branch and the SUS are exempt
from Chapter 287. These rules govern the method of procurement based on thresholds. Chapter 287
defines five categories of purchases:
! Category One: $15,000
! Category Two: $25,000
! Category Three: $50,000
! Category Four: $150,000
! Category Five: $250,000

Business Case Study 3—Business Process ReengineeringPurchasing Commodities and Services
The amount of a purchase determines its category. Each category has different guidelines for the method
of procurement. Category One purchases allow the most flexibility. Purchases over Category Two
generally require a sealed, competitive bid. Category Three purchases may require additional approvals
(budget, legal). Categories Four and Five define limits for purchases using State Negotiated Agreement
Price Schedules (SNAPS) agreements and other caps.
A portion of the purchasing process is automated, although the requisition component of the process for
most agencies is manual. Most State agencies rely on Florida’s SPURS to generate purchase orders and
encumber funds. When a purchase order is created in SPURS, the user has the option to encumber funds.
If funds are encumbered, then SPURS interfaces with FLAIR to create an encumbrance in the accounting
system. Some agencies interface directly with FLAIR to encumber funds, while others do not encumber
funds at all. The SUS does not use SPURS for any aspect of the purchase order process. The SUS has its
own purchasing subsystem that interfaces with FLAIR. A Consolidated Vendor File (CVF) within
SPURS is used to manage vendors. No vendor can receive payment from the State of Florida without
being on CVF.
Exhibit 3-47 shows the supplemental systems identified for the purchasing system during analysis of the
five study agencies.
Exhibit 3-47Supplemental Systems
AgencySupplementalSystem Purpose
InterfacesWith
Department of Transportation Access database Track requisitionsand assign POnumbers
–
Department of Children and Families Excel spreadsheet PO numberassignment
–
Department of Highway Safety and MotorVehicles
Excel spreadsheet PO numberassignment
–
Department of Insurance, Treasury and StateFire Marshal
Access database Track requisitions,assign PO number
–
University of Florida Topaz Entire requisition/purchasing function
FLAIR
Current Process
The current process for requesting goods and creating a purchase order (PO) has five major components.
Employees first identify a need and complete a paper requisition, which is forwarded to a centralized
purchasing unit in the agency. The purchasing unit keys in the requisition information to create a PO,
performs several checks, and then sends the PO to the vendor with copies going to receiving and

Business Case Study 3—Business Process ReengineeringPurchasing Commodities and Services
accounting. We should note that the purchasing units also often assist employees in finding the right
product at the right price from the right vendor. For simple purchases of commodities or services, the
employee may do all the purchasing research needed, but most often the employee needs help in
identifying the best product for the job and the correct vendor (for example, State contract and PRIDE) to
provide the product. Obtaining informal quotes for items under $25,000 and conducting formal sealed
competitive bids for items over $25,000 are important aspects of the purchasing units’ responsibilities.
PCard transactions follow a different set of procedures. PCard procedures vary widely by agency. The
proposed PCard procedure is standardized and is discussed in the recommendations.
Current Process Performance
Exhibit 3-48 provides annual workload statistics for Fiscal Year 1999 by agency for the purchasing
process described above. The annual workload for POs created does not include the number of times a
blanket PO was used. The number of PCard transactions refers to the transactions for which a PO was not
created. The purchasing unit does incur work when the PCard is used. PCard users are trained by the
purchasing unit, and many purchasing units are assigned the responsibility of PCard administration,
which requires follow-up and tracking activities.
Exhibit 3-48Workload Metrics for Purchasing Process
Agency
AnnualWorkload
(POs Created)
Annual Workload(PCard
Transactions)
Total Workload(POs andPCards)
Department of Transportation 9,760 60,896 70,656
Department of Children and Families 69,955 468 70,423
Department of Highway Safety and MotorVehicles
4,220 343 4,563
Department of Insurance, Treasury andState Fire Marshal
2,898 427 3,325
University of Florida 55,705 13,107 68,812
As indicated in Exhibit 3-48, use of the PCard varies widely among agencies. Workload factors and cycle
times are directly affected by the level of PCard usage. Thus, the impact of reengineering will vary
depending on the level of current PCard usage.
(Note: At the time of our analysis, all the Study agencies except for the Department of Transportation
were in the very early stages of PCard rollout. Just before the issuance of the final Study Report, a second
review of PCard usage was completed. Based on this review, it appears that PCard usage is rapidly
increasing. Only midway through Fiscal Year 2000, the PCard usage by the Study agencies other than the

Business Case Study 3—Business Process ReengineeringPurchasing Commodities and Services
Department of Transportation had increased anywhere from 200 percent [University of Florida] to more
than 1,000 percent [Department of Children and Families].)
Current Process Costs
The cost of the purchasing process is derived by analyzing three cost components—customer costs,
agency costs, and centralized costs. Customer costs generally reflect the time an individual spends
completing a form or entering data to initiate a process. Agency costs reflect the labor costs of the agency
personnel devoted to carrying out the process. Centralized costs reflect the labor costs of personnel who
are located in a statewide administrative support agency and who participate in the process statewide.
The cost analysis focuses on direct labor costs. Overhead and other indirect costs associated with the
process are excluded. The costs measured in the five study agencies are extrapolated to the rest of State
government based on workload factors that most affect the costs. The categories and the costs for the five
study agencies and for estimates of those categories and costs statewide are described below.
Customer Costs: Customer costs include the time spent completing a requisition and getting approvals.
On average, the customer spends an hour completing a requisition and getting approvals. The customer in
this example is an employee of a State agency who has duties and responsibilities not related to
purchasing goods or services. In the five study agencies, 142,538 POs were created, each of which
required a requisition. This translates to 76.9 FTEs of staff time annually devoted to the requisition and
approval process. Extrapolated statewide, the customer time spent on requisitions and approvals in Fiscal
Year 1999 is estimated to be the equivalent of 191 FTEs. Assuming an average salary and benefits of
$28,406, the annual costs of the purchasing process to the customer is approximately $5.4 million.
Agency Costs: Agency costs consist primarily of centralized staff usually located in an office of
purchasing dedicated to carrying out the purchasing process. Many agencies have pushed out their lower
level purchases to front-line management through use of the PCard. Staff functions include data entry into
SPURS/FLAIR, auditing for accuracy, and document management. The estimated time spent by function
is:
! Data entry: 20 percent
! Auditing for accuracy/preparing for input: 10 percent
! Document management: 20 percent
! Other (training, bid specifications): 50 percent
Exhibit 3-49 presents the number of FTEs dedicated to the purchasing process in the five agencies
studied.

Business Case Study 3—Business Process ReengineeringPurchasing Commodities and Services
Exhibit 3-49FTEs Devoted to Centralized Purchasing Function in the Five Study Agencies
AgencyAgency FTEs-
CentralAgency FTEs-
Dispersed Total
Department of Transportation 12 17 29
Department of Children and Families 8 64 72
Department of Highway Safety and Motor Vehicles 9 0 9
Department of Insurance, Treasury and State FireMarshal
6 0 6
University of Florida 38 0 38
The FTEs identified in Exhibit 3-49 represent the employees who make up the purchasing unit in each
agency. These staff are dedicated to the central processing of POs. They do, however, have duties and
responsibilities beyond actual purchase order processing which include developing purchasing
specifications, assisting employees in the purchasing process, obtaining quotes, conducting sealed
competitive bids, negotiating, and training staff on purchasing guidelines. In addition, some purchasing
units are responsible for the administration of the PCard and the Minority Business Enterprise program.
The FTEs identified above also include individuals in a supervisory role.
The number of FTEs dedicated to the purchasing process statewide is estimated to be 615, including the
SUS. This estimate was derived by applying the PO/FTE ratio for the sample agencies excluding the
University of Florida (745) to the statewide number of POs processed in Fiscal Year 1999 (354,071) plus
the number of FTE in the SUS (140). The SUS is added separately because it does not use SPURS.
This estimate is within a fair range of the total number of positions identified as having purchasing-related
job titles in a COPES report run on October 10, 1999. The report identified 420 staff in State agencies not
including the SUS. Including the SUS and positions that have other job titles should bring the staff
number to 615. The staff identified includes only those agency-level staff who are dedicated to the
purchasing process. The customers who spend time preparing requisitions and getting approvals are not
included in Exhibit 3-49, because they are not dedicated to the purchasing process.
Assuming an average salary and benefits of $28,406, the annual cost of the purchasing process is
approximately $17.5 million.
Centralized Costs: Central costs consist of costs of operating a central function statewide. DMS operates
a central purchasing unit for all State agencies. This unit is responsible for negotiating and maintaining
State contracts, operating and maintaining the Vendor Bid System and other purchasing Internet
applications, operating and maintaining the purchasing system, and maintaining CVF and the commodity
file. There are 63 FTEs at DMS dedicated to these processes.

Business Case Study 3—Business Process ReengineeringPurchasing Commodities and Services
In total, the State annually expends an estimated $5.4 million in customer costs, $17.5 million in agency
costs, and $2 million in centralized costs to carry out the purchasing process for goods and services.
Current Process Weaknesses
We identified several weaknesses with the current process. Among the most significant are the following:
! PCard implementation includes inefficient steps
! CVF does not achieve its purpose
! Commodity codes are excessively detailed
Florida operates a rather typical government purchasing operation in that it generally relies on manual
completion of requisition forms and centralized data entry. As a result, the current purchasing process is
more costly than necessary. Customers prepare requisitions manually and get a hard copy document
approved. Upon completion, a requisition is forwarded to a central purchasing unit that duplicates much
of the work by re-keying information into SPURS to create a purchase order. The current process requires
an extended cycle time, increased risk of error, and a need for additional staff at the agency level.
Although the State has made progress in the use of technology for purchasing (for example, using the
Internet to make contracts and SNAPS agreements readily available), these problems result because the
process does not take full advantage of current technology to streamline purchasing processes.
Technology is available that can support a decentralized purchasing process that can dramatically reduce
the need for centralized agency staff in the purchasing process.
A second weakness in the current process is in the agencies’ implementation of the PCard. While
implementation of the PCard reduced some inefficiencies in the traditional procurement process, the
current PCard procedures are still inefficient. Procedures vary widely among agencies, some of which
have made little, if any, changes to the purchasing process as a result of using PCards. Moreover, the
post-audit process of PCard transactions, which is carried out by agency-level accounting staff, is
intensive, without adding benefit. A Department of Banking and Finance analysis of purchasing indicated
that the cost of processing and auditing a payment is roughly the same for a PCard purchase as it is for a
traditional purchase. Savings are realized on the front end of the PCard process but not the back end
because the back end of the processes are fairly similar.
CVF and the Commodity Code List create additional inefficiencies in the purchasing process. CVF is
wrought with duplication and inaccuracies. The reason for the inaccuracies in CVF include:
! A large number of users have permission to add new vendors
! Vendor numbers are appended with a sequence code that identifies a location
! Insufficient maintenance is performed

Business Case Study 3—Business Process ReengineeringPurchasing Commodities and Services
Currently in CV, one KPMG address is listed four times. The tax identification number is the same for all
four KPMG address listings, but the company name is different. CVF lacks the control mechanism to
ensure that only one name is associated with one tax identification number.
Agencies must have a vendor number from CVF before they can issue a payment. Because agencies are
under pressure to issue payments within a strict deadline, they are allowed to enter vendors into CVF
themselves. Consequently, few controls exist to ensure accuracy and to eliminate redundancy.
CVF uses the tax identification number. Attached to the number is a location code. Florida allows
vendors to designate more than one location for sending a payment. As a result, there can be more than
one record in the database for a vendor that has more than one location for receiving payments.
The commodity code listing is excessively detailed. More than 40,000 different commodities exist in the
list. There is no requirement for complete accuracy of the commodity code when creating a PO. Thus, the
data collected on commodity purchases is inaccurate.
Reengineered Process
To reengineer the purchasing process for commodities and services, the State must decentralize purchase
and payment authority, change the post-audit process for PCard purchases, enable e-commerce, enhance
the central purchasing function, and restructure the vendor file.
Recommendation BPR-27: Decentralize purchase and verification of receipt of goods andservices to the lowest possible level within service delivery units
Employees would have the ability to request, order, receive, and pay for goods from their desktops.
Reengineering the current centralized process to a decentralized process would require a procedural
change along with a technology solution. A web-enabled electronic procurement system with an
electronic mall concept would be implemented statewide. The culture and control of the current central
system must change to oversight and support in a decentralized system.
All purchases, whenever possible, would be performed using e-commerce. Purchases above specific
threshold amounts would require a pre-approval process prior to actual purchase. The pre-approval
process would be electronically routed for approval, and a virtual PO would be created at completion of
the approval process. The PCard could be used in emergencies as a back-up and for travel expenses.
A decentralized procurement system would reduce cycle times and reallocate scarce resources.
The following two examples illustrate the opportunities available with this recommendation.

Business Case Study 3—Business Process ReengineeringPurchasing Commodities and Services
Advanced Micro Devices
Advanced Micro Devices (AMD), a leading global supplier of integrated circuits for PCs and networks,
implemented a decentralized purchasing solution using an Internet-based catalog system. In the past,
AMD had followed a traditional purchasing approach: the requester completed a form and sent it to
purchasing; purchasing reviewed the requisition, added information, and generated a PO; a supplier was
selected and signed to a contract; and finally, the order was placed. This approach generated mountains of
paper work that needed to be processed and filed. Now authorized users access pre-qualified suppliers on
the intranet, which ties directly to suppliers. Orders and payments are handled over the Internet. AMD
reports decreased process costs and savings between $15 million and $37 million annually.
Cisco Systems
With an Internet-based, decentralized catalog solution, Cisco Systems offers its 9,000 U.S. employees
one-stop shopping for the items they need for daily operations. The system provides fast and cost-
effective access to computer and communications equipment, office supplies, and even a wide array of
consulting services. To place an order, the user launches an Internet browser and logs onto the corporate
purchasing site. He or she searches the illustrated electronic catalogs and makes a selection. From there,
the system routes the requisition for approvals based on a complex set of decision rules before
transmitting the request electronically to the appropriate supplier.
Fiscal Impact: Decentralization of purchases and verification of receipt of goods and services to the
lowest possible level within service delivery units would have a significant impact on agency central
purchasing staff needs. The need for centralized data entry and PO processing would be completely
eliminated. However, a central purchasing unit would still be necessary to develop specifications;
negotiate contracts; and provide customer service, training, and oversight. The impact would vary across
State agencies, however, and the degree of impact would vary based on each agency’s current level of
decentralization and automation. In the five agencies studied, the use of the PCard and other decentralized
purchasing mechanisms such as local POs varied significantly. For example, DOT created eight district
purchasing offices and used the PCard for more than 60,000 transactions in Fiscal Year 1999, while DCF
used it for fewer than 500 transactions. Therefore, the impact of decentralization and e-commerce would
be less significant on agencies such as DOT than it will be for agencies such as DCF.
From extensive interviews and analysis, we estimate that the time savings on purchasing units from e-
commerce would range from 20 to 50 percent. One-third of the centralized purchasing workload
statewide could be eliminated when the technology solution recommended is implemented. In total, this
recommendation would yield approximate savings in staff workload reductions equivalent to 191 FTEs.
Assuming an average salary and benefits of $28,406, the annual savings would total $5,425,000. In
addition, savings would be generated from the reduction of paper, printing, and postage expenses incurred
in the present process.

Business Case Study 3—Business Process ReengineeringPurchasing Commodities and Services
Recommendation BPR-28: Replace the current exhaustive post-audit activity in thePCard process with a sampling methodology
The State should implement a sampling methodology for auditing PCard transactions. This audit process
should be carried out at the agency level as well as centrally at the State Comptroller’s office. A sampling
methodology, coupled with a transaction profiling system, would provide adequate internal controls with
fewer resources than the current system. The Office of the Comptroller should research the development
of intelligent queries to identify high-risk transactions by object codes, transaction amount, and
appropriation categories. As more advanced monitoring tools are developed, agencies will be more
willing to use data-on-demand as an adequate internal control.
In addition, the State should standardize use of the PCard by setting consistent parameters and criteria for
use. The maximum cost of a PCard transaction should be raised to at least $1,000 across all State
agencies. If the State implements e-commerce for its purchasing process, the State should use the PCard
as a principal payment method for online transactions, travel management, and small purchases under the
$1,000 threshold. However, any restriction on the use of the PCard must be balanced with the
understanding that the State has a free purchasing card program because of its volume potential of $750
million annually. Should any future policies limit card volume, the State could incur costs to maintain a
program.
Fiscal Impact: The savings generated through use of the PCard are part of the savings estimated from the
use of e-commerce. No additional savings are calculated here.
Recommendation BPR-29: Require that most vendors doing business with the State havee-commerce capabilities (online invoicing and payment) prior to full systemimplementation
The State should require that all vendors that do a significant amount of business with the State have e-
commerce capabilities. Based on a consultation with agencies and central purchasing, KPMG suggests
that the State define “a significant amount of business with the State” as the total annual payments to a
vendor in excess of a set amount. Based on our preliminary review of this issue, KPMG suggests that a
set amount between $5,000 and $10,000 would be appropriate. Before doing business with the State, all
vendors that meet the threshold level would be required to register as e-vendors. The registration process
would ensure that all vendors have a mechanism (most likely the Internet) for transmitting invoices
electronically and receiving payment electronically. It is expected that by the time the system is fully
implemented, nearly all businesses engaged in business-to-business commerce (by definition, this
includes all vendors doing business with the State) will be engaged in e-commerce. By making this
requirement, the State would not be forcing businesses to do business on the Internet—the market is
already making that requirement.

Business Case Study 3—Business Process ReengineeringPurchasing Commodities and Services
Fiscal Impact: The fiscal impact of this recommendation is included in the fiscal impact for
recommendation BPR-27, decentralizing and automating the purchasing process.
Recommendation BPR-30: Purge the vendor file, augment central staff, and reorient thevendor file around a random number key
The State should create a CVF with one record per vendor organized by a vendor number but allowing for
as many addresses as desired by the vendor. The first step in implementing a new vendor file is to purge
the existing vendor file of duplicates and incorrect information. The second step is to strengthen the
central online mechanism for updating and maintaining the file. The State would need to augment its
SPURS help desk to maintain the database. The central staff would be responsible for approving most
changes to the vendor file—specifically, changes to the address.
The State should change the structure of the vendor file to be keyed on a random number rather than tax
ID, and it should allow for as many addresses to be tied to that vendor number as the firm wishes.
Agencies should be able to query the system for existing vendors, add vendors if none exist, and obtain a
provisional vendor number. This vendor number would be a multiple-digit number randomly generated
by the computer. The central staff should be of sufficient size to guarantee a 24-hour turn-around for
approving all changes to the vendor file.
Fiscal Impact: Implementation of this recommendation would increase the service delivery requirements
and consequently the workload of the SPURS help desk. The State should add three additional FTEs to
assist in maintaining the vendor file. This would cost about $90,000 per year. In addition, the State should
obtain temporary help to purge the vendor file. We estimate that a one-time investment of approximately
$500,000 would be needed to purge the file. This estimate is based on a temporary staff cost of $15 per
hour, 300,000 vendors, and 8 to 9 verifications per person per hour.
Recommendation BPR-31: Enhance the central purchasing function at DMS and Stateagencies to focus on strategic sourcing
The savings calculated so far represent only transactional savings from reengineering. It is likely that
significant savings from strategic sourcing would also be garnered. That is, with better information and
less expensive order costs, the State would be able to negotiate lower prices with vendors. An e-
commerce solution will reduce the costs to vendors for filling orders because of online electronic transfer
of information and payment. As a result, the State should be able to reduce current contract prices by a
small margin to account for the cost savings to the vendor. In addition, an e-commerce solution will
expand the opportunities for contract negotiation with more “intelligence” related to what goods and
services the State acquires, from whom the acquire them, and at what volume. The State should be able to

Business Case Study 3—Business Process ReengineeringPurchasing Commodities and Services
increase the amount of purchases made through discounted contracts by developing more contracts and
allowing easier access to the information by State agencies.
Fiscal Impact: The fiscal impact of strategic sourcing is divided into two categories: savings from current
contracts via reduced order costs and savings from growth in the use of State contracts.
The savings from current contracts via reduced order costs is assumed to be 1 percent of current contract
expenditures. This assumption is conservative because of the uncertainty in quantifying these savings.
Some vendors will reduce prices by a margin greater than 1 percent while others may not be willing to
reduce prices at all because of their own inability to accommodate e-commerce. The exponential growth
in e-commerce today suggests that the overwhelming majority of vendors will realize and pass on savings
from business to business electronic commerce by the time the State is prepared to engage in e-
commerce. In Fiscal Year 1999, DMS reported State contract expenditures of $630 million. These
expenditures do not include many agency-level contracts that also have the potential for savings from e-
commerce. On the other hand, the $630 million includes purchases made by public entities other than the
State (counties, school districts, etc.). These two factors cannot be determined precisely and have an
inverse impact on savings. The impact of these factors will essentially offset each other. Therefore, it is
estimated that the State can save 1 percent of $630 million from reduced order costs passed on from the
vendor as a result of e-commerce. This represents an annual savings of $6.3 million.
The second area of savings from e-commerce is the growth in State and agency term contract
expenditures. E-commerce allows the State to focus on negotiating more, better contracts and expand
access for the use of these contracts by State agencies. In addition, agencies themselves will be able to
expand their own unique contract needs. It is estimated that the State and agency term contract
expenditures can grow by 25 percent through the introduction of e-commerce and strategic sourcing. This
represents a growth of $157.5 million in State and agency term contract expenditures. DMS reports that
through vendor certification it saves approximately 23 percent on its current State contracts. Marginal
savings from expanded growth of State and agency terms contracting expenditures is assumed to be only
10 percent because of diminishing marginal returns. That is, the easier savings have already been realized
and future growth will focus on more difficult savings items. The gross savings are estimated to be $15.7
million a year.
These savings cannot be realized without a redirection of resources. To attain the projected growth in
State and agency term contract utilization, the State will need to re-direct traditional purchasing staff to
become purchasing agents who analyze data and negotiate contracts. The physical location of these agents
is uncertain. DMS is the logical location for some of these agents, but State agencies will need their own
agents to negotiate agency-specific contracts and act as liaison to DMS. It is estimated that a force of 100
purchasing agents will be necessary to realize strategic sourcing savings. These agents will be in
professional positions requiring higher salaries than purchasing technicians. It is estimated that the annual
salary and benefits of each purchasing agent will average $50,000. This yields a $5 million marginal cost

Business Case Study 3—Business Process ReengineeringPurchasing Commodities and Services
offset to the $15.7 savings from expanded State and agency term contracting. The net savings are
estimated to be $10.7 annually.
The total savings from strategic sourcing, current contracts, and State and agency term contract growth is
estimated to be $17 million annually.
Reengineered Process—System Requirements
A reengineered purchasing process will require enhancements to the current information technology
architecture. The following elements are necessary to fulfill the recommendations in this section:
! Electronic Online Catalog
! Electronic Shopping Cart
! Product Information and Configuration
! Price Negotiation
! Order Verification, Tracking, and Proof ofDelivery
! Requisition and Order Management
! Vendor Registration and Management
! Customer Relationship Management
! Agency Bid Posting, Proposal Vault, andAward Management
! Comprehensive Data Warehousing,Reporting, and Analysis Features
! Electronic Bill Payment and Settlement
! Customer Registration
! Customer Authentication
! Provisions for Local Government Accessto State Contracts with Appropriate BillingProcedures
! Electronic Storage of Documents
Options Analysis
The savings in recommendations BPR-27 and BPR-29 depend on the functionality of a web-enabled e-
commerce solution and are included in Options 3 through 5, but are not included in Options 1 and 2. The
savings in recommendation BPR-31 include the enhancement of the central purchasing function at DMS
to focus on strategic sourcing, which is included in Options 2, 3, 4, and 5. Because the implementation of
recommendation BPR-30 would increase the service delivery requirements and consequently the
workload of the SPURS help desk, a cost of $590,000 for additional FTEs and training is applied to
Options 3, 4, and 5. A comparison of the five options is shown in Exhibit 3-50, followed by a discussion
of each of the five system options and their effect on the proposed reengineering solution.
In addition, there is an initial cost of implementation of $500,000 for all Options 2 through 5 in year 1
under recommendation BPR-30.

Business Case Study 3—Business Process ReengineeringPurchasing Commodities and Services
The recommendation to improve the current system’s functional and technical capabilities would be
affected by the system option chosen. Here is how each of the options affects the reengineering
recommendation:
! Option 1: Because the status quo assumes no changes, the State would not have to develop thefunctionality necessary to implement e-commerce; thus no savings would result
! Option 2: Making modifications to the existing system would generate cost savings fromreengineered process. Our analysis shows that $17 million could be saved by adding e-commercecapabilities to the existing system
! Option 3: The custom solution would be built to ensure implementation of the reengineeredprocesses. It is assumed that all BPR recommendations could be adopted under Option 3; thus allBPR savings would be realized
! Option 4: The next versions of the Enterprise Resource Planning (ERP) systems will be web-enabled and e-commerce ready. Assuming this is the case, all of the estimated savings can berealized through implementation of Option 4
! Option 5: The best solution would likely have one of the ERP systems as its base, which means itwould have the e-commerce capabilities of Option 4. This option also would enable the State torealize the estimated cost savings from the reengineering of the purchasing process
This analysis concludes that an estimated $22 million can be saved through a reengineering of the
purchasing process. The cost savings would be derived primarily from the elimination of centralized
positions that now are dedicated to manual processing steps in the process. These savings can only be
realized through the introduction of a technology solution that includes the system requirements identified
in this section.

Business Case Study 3—Business Process ReengineeringPurchasing Commodities and Services
Exhibit 3-50Summary of Annual Savings by Option
OptionBudgetary
SavingsIncreasedEfficiency
Total BPRSavings
Recommendation BPR-27 and BPR-29
Option 1 $0 $0 $0
Option 2 0 0 0
Option 3 5,425,000 0 5,425,000
Option 4 5,425,000 0 5,425,000
Option 5 5,425,000 0 5,425,000
Recommendation BPR-28
Option 1 0 0 0
Option 2 0 0 0
Option 3 0 0 0
Option 4 0 0 0
Option 5 0 0 0
Recommendation BPR-30*
Option 1 0 0 0
Option 2 0 0 0
Option 3 (590,000) 0 (590,000)
Option 4 (590,000) 0 (590,000)
Option 5 (590,000) 0 (590,000)
Recommendation BPR-31, reduced order costs
Option 1 0 0 0
Option 2 6,300,000 0 6,300,000
Option 3 6,300,000 0 6,300,000
Option 4 6,300,000 0 6,300,000
Option 5 6,300,000 0 6,300,000
Recommendation BPR-31, growth in State contracts
Option 1 0 0 0
Option 2 10,700,000 0 10,700,000
Option 3 10,700,000 0 10,700,000
Option 4 10,700,000 0 10,700,000
Option 5 10,700,000 0 10,700,000
Total
Option 1 $0 $0 $0
Option 2 $16,910,000 $0 $16,910,000
Option 3 $22,335,000 $0 $22,335,000
Option 4 $22,335,000 $0 $22,335,000
Option 5 $22,335,000 $0 $22,335,000
* Includes cost of $500,000 in year 1 only
Business Case Study 3—Business Process ReengineeringPurchasing Commodities and Services
3.12 Recommended Process Changes—Payment for Goods andServices
This section presents recommendations for reengineering the State of Florida’s payment process—the
process by which the State pays its vendors.
Background
This process is used to pay vendors for the delivery of goods and services that agencies request to perform
their operations. The primary customers of this process are the vendors that want to receive accurate and
timely payments. Most vendors must submit paper invoices to agencies to receive payments. However, in
the case of a PCard transaction, the vendor receives payment from the bank upon posting the transaction,
and the bank requests reimbursement from the State agency. In addition, a few large vendors that receive
recurring payments, such as Florida Power and Light, have the capability to submit invoices
electronically.
Payment processes are governed primarily by Chapter 215 of the Florida Statutes. Among other things,
the Statutes limit the length of time that may transpire between invoice and payment. After 40 days, the
vendor is entitled to receive interest payment. Chapter 287 of the Florida Statutes and the Florida
Administrative Code 60A are supplements to further detail State policy and requirements. In addition, the
Department of Banking and Finance produces a voucher handbook, which outlines the procedures
agencies are to use to process vouchers.
State agencies rely on FLAIR to process payments for goods and services. Generating payments in
FLAIR is a manual, paper-intensive process. Data entry clerks input transactions manually and provide
supporting documentation for audits with paper copies. Warrant distribution via the U.S. Postal Service is
the primary form of vendor payment. Even in the case of EFT, vendors are mailed a paper remittance with
minimal information.
FLAIR does not have the functionality necessary to meet all of an agency’s accounts payable needs.
Many agencies make recurring payments to vendors. FLAIR has a module for handling recurring
payments, but most agencies do not use it because it lacks certain critical capabilities. Recurring
payments, which should be handled automatically in the system, are handled like all other payments at
most agencies.
Exhibit 3-51 identifies the supplemental systems for the payment process for the five agencies studied.
These systems are used either to process invoices more efficiently or to expedite the cost allocation
process.

Business Case Study 3—Business Process ReengineeringPurchasing Commodities and Services
Exhibit 3-51Agency Supplemental Systems Used in the Payment Process
AgencySupplementalSystem Purpose
InterfacesWith
Department of Transportation CITS, EED Invoice tracking,approval and auditing,automate constructionestimates to submit forpayment
FLAIR
Department of Children andFamilies
FoxPro database Track invoices and POstatus
FLAIR
Department of Highway Safetyand Motor Vehicles
Spreadsheetapplication
Cost allocation andmanagement reporting
None
Department of Insurance,Treasury and State FireMarshal
Spreadsheetapplication
Cost allocation andmanagement reporting
None
University of Florida Spreadsheetapplication
Cost allocation andmanagement reporting
None
Current Process
The current payment process is manual, and paper and labor intensive. The process starts with the receipt
of an invoice, receiving report, contract, or purchase order. These documents are filed awaiting the receipt
of the remaining source document to be matched. When all documents are received, they are manually
matched to determine accuracy and legitimacy. Then, the transaction is entered into FLAIR for payment
processing. At this point, a voucher schedule is printed by FLAIR that identifies the transactions entered
that day. If a transaction has been flagged for audit (all invoices greater than $1,000 plus a random sample
of all others), then photocopies of all source documents are made and forwarded to the Comptroller for
audit. Upon clearance of the audit, the Comptroller prints a warrant. The warrant is delivered to the
respective State agency, then mailed to the vendor by the agency. In the case of an EFT, a remittance
advice is printed in place of a warrant, attached to the invoice, and processed identically thereafter.
Current Process Performance
Exhibit 3-52 provides annual workload and performance information by agency for each of the
subprocesses described. The annual workload is represented by warrants and EFT payments issued. These
figures represent the number of payments distributed. The actual number of invoices processed is greater
than the number of warrants issued because invoices to the same vendor on the same day are generally
combined into one warrant. Warrants and EFTs processed are presented in Exhibit 3-52 because it is a
more reliable figure to collect across all State agencies. In addition, it is assumed that the average number
of invoices per warrant is essentially the same across agencies. Thus, warrants and EFTs issued are a
valid representation of relative workload.

Business Case Study 3—Business Process ReengineeringPurchasing Commodities and Services
The average cycle time varies widely because of the audit function and method of payment. The cycle
time starts when all source documents have been received and ends when the vendor receives payment.
The current process can take several days before the transactions are entered into FLAIR and several
more days to prepare a voucher. Comptroller approval may require from 3 to 14 days after which the
warrant is printed and mailed. If an invoice is not audited by the State Comptroller and payment is made
by EFT, the process can take less than a week.
Exhibit 3-52Workload and Performance Metrics for Accounts Payable Process
Agency
Annual Workload(Warrants and EFTs
Issued)Average Cycle or
Time (As-Is)
Department of Transportation 86,980 6 to 30 days
Department of Children and Families 355,775 6 to 30 days
Department of Highway Safety and MotorVehicles
29,555 6 to 30 days
Department of Insurance, Treasury andState Fire Marshal
7,516 6 to 30 days
University of Florida 177,742 6 to 30 days
Current Process Costs
The cost of the payment process is derived by analyzing three cost components—customer costs, agency
costs, and centralized costs. Customer costs generally reflect the time an individual spends completing a
form or entering data to initiate a process. Agency costs reflect the labor costs of the agency personnel
devoted to carrying out the process. Centralized costs reflect the labor costs of personnel who are located
in a statewide administrative support agency and who participate in the process statewide.
The cost analysis focuses on direct labor costs. Overhead and other indirect costs associated with the
process are excluded. The costs measured in the five study agencies are extrapolated to the rest of State
government based on workload factors that most affect the costs. The categories and the costs for the five
study agencies and for estimates of those categories and costs statewide are described below.
Customer Costs: The process does not include a customer cost as defined in this analysis.
Agency Costs: These costs include costs for staff members dedicated to carrying out the payment process.
The functions of these positions include filing documents, matching source document, performing data
entry, auditing for accuracy, photocopying documents, and distributing warrants/remittances. Staff
members carry out these steps for goods and services, professional services, and recurring payments.
Exhibit 3-53 identifies the staff costs for the five agencies sampled.

Business Case Study 3—Business Process ReengineeringPurchasing Commodities and Services
Exhibit 3-53Agency Labor Costs Associated with the Accounts Payable Process
AgencyAgency FTEs
CentralAgency FTEs
Dispersed Total FTEs
Department of Transportation 21.9 40.1 62.0
Department of Children and Families 8.5 156.5 165.0
Department of Highway Safety and MotorVehicles
27.5 0.0 27.5
Department of Insurance, Treasury andState Fire Marshal
6.5 0.0 6.5
University of Florida 30.0 0.0 30.0
Based on the FTEs identified in the sample and the corresponding workload accomplished by the sample
agencies, estimates are that 1,097 FTEs statewide are dedicated to the payment process. This estimate is
derived by extrapolating the warrants issued per FTE for the sample (2,268) to the total warrants issued
statewide in Fiscal Year 1999 (2,478,968). The total agency labor costs for carrying out the payment
process is estimated at $31.1 million.
Agency costs also include the cost of paper to carry out the process and the cost of mailing warrants and
remittances to vendors. It is estimated that 20 million pieces of paper are generated through the
purchasing and payment process annually. Estimating $0.04 per sheet for paper and printing costs, this
yields a paper and printing expense of $800,000 per year. In addition, $650,000 in postage expenses is
incurred for mailing of 2.5 million warrants/remittances.
Centralized Costs: These costs include Comptroller’s (Department of Banking and Finance) audit of
transactions. The audit process consists primarily of ensuring completeness of supporting documentation
and accuracy of payment. The Bureau of Auditing has 44 FTEs statewide dedicated to auditing vendor
invoices. Assuming an average salary and benefits of $28,406, the annual costs of the audit process is
approximately $1.2 million.
In total, the State annually expends an estimated $32.4 million in agency costs and $1.2 million in
centralized costs to carry out the payment processes.
Current Process Weaknesses
The current payment process is time consuming and expensive. It is estimated that more than 1,000 FTEs
are dedicated to the payment process across all State agencies. The current process consumes
approximately 20 million pieces of paper a year and relies primarily on the U.S. Postal Service for the
delivery of payment and/or remittance advice. Vendor payment can occur within 1 week of invoice, but
usually extends to 1 month. The excessive time and expense are the result of poorly engineered processes.
Business Case Study 3—Business Process ReengineeringPurchasing Commodities and Services
The current payment process is essentially manual and paper intensive. Documents are matched
manually, invoices are keyed manually into FLAIR for generation of warrants, transactions are audited
manually by the Comptroller, and warrants are mailed using the U.S. Postal Service. Even for recurring
payments, which could be handled using a more streamlined process, the basic steps are the same. The
current state of the art allows for electronic invoicing, automated document matching, auditing, vendor
payment, and remittance information. Each of these processes can be performed online at reduced
expense to the customer, agency, and central audit unit.
EFT for vendor payment has grown to 15 percent of total transactions, but the process for generating the
payment, making the payment, and informing the vendor has remain unchanged. Although vendors
receive payment through EFT, a paper remittance advice containing minimal information is matched with
a copy of the invoice and both are mailed to the vendor. The remittance information is generally
inadequate for the vendor, causing vendors to call agencies to inquire about the details of an EFT
payment. The introduction of EFT payments has reduced the payment cycle time but has done little to
reduce process costs. Other governmental entities have developed sophisticated vendor tracking and
remittance systems that provide detailed information to vendors online. An automated tracking and
remittance application will reduce the expense of vendor payment and increase customer satisfaction.
Central auditing of invoices is inefficient. DBF requires all invoices over $1,000 and a random sample of
invoices under $1,000 to be audited by the central agency. This current audit process is extremely paper
intensive and lacks clear benefits. Transactions selected for audit require agency staff to photocopy all
supporting documentation and forward it to DBF. DBF audits the completeness of the supporting
documentation and the accuracy of the payment amount. This audit process is essentially the same
process undertaken by each agency before the central audit. DBF has 44 FTEs dedicated to this process.
Electronic audit systems can be developed to validate the accuracy of information and validity of a
transaction. An exception reporting system can be developed to identify transactions, through profiling,
that are suspicious. The transactions identified are audited in further detail by an auditor.
Reengineered Process
The expansion of e-commerce opens up significant possibilities for the State. With e-commerce, the State
can decentralize key components of the payment process and reduce the time it takes to audit transactions.
The recommendations included in this report are designed to leverage the Internet and the growing
capabilities across all industries to carry out business electronically.
Recommendation BPR-32: Decentralize and automate the payment process
The State should replace the manual central processing of paper documents with an automated system.
This will require a procedural change and a technology solution. The reengineered process would allow
for invoice processing from employee desktops. Not every employee should be given the responsibility of

Business Case Study 3—Business Process ReengineeringPurchasing Commodities and Services
authorizing or making payments, but the function may be decentralized to a single person within an
organizational unit. This would eliminate the need for central processing of invoices. A central function
of transaction review and audit would still exist; however, the State needs to fundamentally change its
focus away from a 100 percent audit coverage. This process would become an electronic verification
process, which would significantly reduce the need for invoice processing staff. This system would
reduce cycle time and free staff by eliminating paper processing, document storage, copying, and mail
processing. Implementation of this recommendation is constrained by technological requirements and
cultural change. This recommendation would dramatically change the current process and create the need
for reorganization and training. In addition, it will require access to the financial management information
system from employee desktops. Finally, this recommendation introduces an unquantifiable risk that
employees may expend funds inappropriately. Effective budget monitoring can help control this risk.
Fiscal Impact: Implementation of this recommendation would eliminate half of the work now being
performed by agency accounts payable staff. This work would be decentralized to program personnel and
streamlined through the use of web-enabled systems. As a result, agencies would no longer need at a
minimum 50 percent of the positions dedicated to invoice processing. This translates into approximately
$15,581,000 in annual savings from FTE reductions. We estimate that 10,000 employees would need to
learn the payment and approval functions on the new system. Comptroller staff may also need training for
auditing this new payment process. An additional $1 million in training costs during the first year would
be required.
Recommendation BPR-33: Mandate EFT payments for all vendors and develop a web-based remittance information system
The current process of printing warrants and remittances should be replaced with EFT payments to all
vendors combined with a web-based remittance information system. Implementation of this
recommendation would require policy and procedural changes along with a technological solution. The
State would have to change current policy to mandate EFT payments to all vendors. The procedure for
vendor payment would change from printing and mailing a warrant or remittance to an EFT without
mailing any supporting documentation. A web-based application must be developed to allow vendor
access to remittance information online. Implementation of this recommendation would eliminate paper
and postage expenses and increase customer satisfaction. Vendor access to remittance information would
drastically reduce customer calls to agencies regarding invoice payment issues. Implementation of the
recommendation is constrained by the need to mandate EFT payments and the need for a technological
solution.
Fiscal Impact: Implementation of this recommendation would eliminate all paper and postage expenses
currently incurred for vendor payment. This translates into approximately $1.5 million in annual savings.

Business Case Study 3—Business Process ReengineeringPurchasing Commodities and Services
Recommendation BPR-34: Introduce electronic auditing of invoices and exceptionreporting for in-depth audits
The State should replace the manual central auditing of paper documents with an automated system. This
will require a procedural change and a technological solution. The reengineered process would allow for
invoice auditing electronically. This will eliminate the need for copying source documents, forwarding
them to the Comptroller, and manual auditing transactions. A central audit function would still exist. This
process would become an electronic verification process, with an exception reporting mechanism that
identifies suspicious transactions for in-depth follow-up by an auditor. This system would provide
electronic profiling of transactions for targeted investigation, reduce paper handling, and eliminate
manual processing staff. Implementation of this recommendation would require the development of an
electronic auditing and profiling application.
Fiscal Impact: Implementation of this recommendation would eliminate the need for most field staff
dedicated to auditing invoice payments and eliminate 25 percent of the positions in the central processing
unit. This translates into approximately $824,000 in annual savings.
Reengineered Process—System Requirements
Changes in policies and procedures are required to implement the reengineered process, but by
themselves they are not sufficient. Changes in the system that supports the purchasing and payment
processes must occur before the State can implement an e-commerce solution. The following are the key
system requirements for the proposed reengineered process:
! Electronic receipt of invoices and receiving reports
! Recurring payment capabilities
! Automated document matching
! Automatic posting to ledgers
! Automatic EFT for payment
! Online vendor access to remittance information, and thus no mail
! Online access to source documents for auditing
! Waste, fraud, and abuse profile system to identify suspicious transactions
! Electronic storage of documents
! User-friendly reporting capabilities
! Additional data fields for vendor invoice number

Business Case Study 3—Business Process ReengineeringPurchasing Commodities and Services
These high-level system requirements will allow the introduction of the conceptual model described in
this section. These system enhancements are required to obtain the entire fiscal impact estimated.
Options Analysis
Based on the definition of the five options, the State can achieve the estimated saving from reengineering
in Options 3 through 5. The savings depend on the implementation of a web-enabled e-commerce
solution. Options 3 through 5 include the necessary functionality for e-commerce while Options 1 and 2
do not. However, Option 2 does permit savings associated with mandated EFT payments for all vendors,
in addition to the development of a web-based remittance information system. Because the basic e-
commerce functionality is part of Options 3 through 5, there are no additional implementation costs
associated with reengineering the payment process. A comparison of the five options is shown in
Exhibit 3-54.

Business Case Study 3—Business Process ReengineeringPurchasing Commodities and Services
Exhibit 3-54Summary of Annual Savings by Option
OptionBudgetary
SavingsIncreasedEfficiency
Total BPRSavings
Recommendation BPR-32*
Option 1 $0 $0 $0
Option2 0 0 0
Option3 15,581,000 0 15,581,000
Option4 15,581,000 0 15,581,000
Option5 15,581,000 0 15,581,000
RecommendationBPR-33
Option1 0 0 0
Option2 1,500,000 0 1,500,000
Option3 1,500,000 0 1,500,000
Option4 1,500,000 0 1,500,000
Option5 1,500,000 0 1,500,000
RecommendationBPR-34
Option1 0 0 0
Option2 0 0 0
Option3 824,000 0 824,000
Option4 824,000 0 824,000
Option5 824,000 0 824,000
Total
Option1 $0 $0 $0
Option2 $1,500,000 $0 $1,500,000
Option3 $17,905,000 $0 $17,905,000
Option4 $17,905,000 $0 $17,905,000
Option5 $17,905,000 $0 $17,905,000
*Savings are net of $1,000,000 of costs in year 1 only

Business Case Study 3—Business Process ReengineeringBudgeting
3.13 Recommended Process Changes—Budgeting
This section presents KPMG’s recommendations for reengineering the State’s processes for developing
and executing the annual budget.
Background
The purpose of the budgeting process is for State leadership to allocate scarce resources to meet the
business objectives of the State. A successful budgeting process should have the following elements:
! Customer and stakeholder participation
! Development of priorities and required resources
! Execution of budget decisions
The budget development process involves many customers and stakeholders. In developing the State’s
budget, input is solicited from State agencies, statewide elected officials, and the Governor. The
legislature weighs this input and input from constituents, organizations, and the public before making the
final appropriations decision. The input is critical for developing the strategic objectives of the State and
determining the resources required to accomplish these objectives.
The State relies primarily on LAS/PBS for budget development and execution. However, because of
limitations in the existing system, several supplemental systems have been developed to support the
budget process. Exhibit 3-55 provides a list of the supplemental systems used by some of the agencies
involved in the budget process.

Business Case Study 3—Business Process ReengineeringBudgeting
Exhibit 3-55Supplemental Systems
AgencySupplementalSystem Purpose
InterfacesWith
Department of Transportation Spreadsheet
Word processing
Develop budget issues
Allocation of appropriations
Prepare reports
LAS/PBS
Department of Children andFamilies
Spreadsheet
Word processing
Develop budget issues
Allocation of appropriations
Prepare reports
LAS/PBS
Department of Highway Safetyand Motor Vehicles
Spreadsheet
Word processing
Develop budget issues
Allocation of appropriations
Prepare reports
LAS/PBS
Department of Insurance,Treasury and State FireMarshal
Spreadsheet
Word processing
Develop budget issues
Allocation of appropriations
Prepare reports
LAS/PBS
University of Florida Spreadsheet
Word processing
Develop budget issues
Allocation of appropriations
Prepare reports
LAS/PBS
Office of Planning and Budget Spreadsheet
Word processing
Develop budget issues
Prepare reports
LAS/PBS
Senate Budget Office Spreadsheet
Word processing
Amtrak
Conduct analyses
Prepare reports
Amendment tracking
LAS/PBS
House Budget Office Spreadsheet
Word processing
Amtrak
Conduct analyses
Prepare reports
Amendment tracking
LAS/PBS
Current Process
The budget process has the following two major components:
! Budget development—Consists of identifying and prioritizing the needs of the State anddetermining the amount of resources required to meet the needs of the State
! Budget execution—Consists of carrying out the decisions from the budget development process
Budgeting is a resource-intensive and time-consuming process. The process of identifying, prioritizing,
and determining the level of resources needed to address priority issues requires input and analyses from
across State government and from management to front-line workers.

Business Case Study 3—Business Process ReengineeringBudgeting
As previously stated, it is important to get input from agency management and staff who will be
responsible for carrying out the objectives set forth in the budget. It is also important to get guidance and
input from the Executive Branch, which is ultimately responsible for managing the operations of the
State. Lastly, it is important to get input from the elected officials in the House and Senate who represent
the interests of the citizens and businesses in the State.
Getting agreement from these groups on the State’s priority issues and required resources takes
considerable time to complete. Development of budget issues begins in May and is completed when the
General Appropriations Act is passed the following April.
Budget Development
Agencies develop their budgets at a level of detail necessary for State leaders to make decisions. Budget
issues are developed at the program component level, which is used by the Office of Policy and Budget
(OPB), the Senate Budget Office, and the House Budget Office to review and refine. After the budget
issues are finalized at the program component level, they are summarized at the budget entity,
appropriation category, and fund level where they are approved or rejected by the Senate and House. The
approved budget issues at the budget entity level are what compose the Appropriations Act.
The budget process begins when OPB, in conjunction with the House and Senate, issues budget
instructions to the agencies. Agencies prepare their budgets and forward them to OPB and the Legislature
simultaneously. OPB develops issues based on new legislation, the Governor’s priorities, and last year’s
budget and prepares the continuation budget. Information is collected from different systems during this
process, including:
! FLAIR—Expenditure data
! COPES—Salary and benefit data
! LAS/PBS—Current-year appropriations
The agencies develop their budget issues on PCs using software such as word processing and
spreadsheets. When the budget issues are completed, the financial information is input and the narrative is
downloaded into LAS/PBS. The OPB, Senate Budget Office, and House Budget Office also use
spreadsheets to analyze and manipulate budget data and re-input results and changes into LAS/PBS.
Budget Execution
After the Appropriations Act is passed, the budget is used primarily as a management tool. The budget is
monitored and modified throughout the year to ensure that the objectives set forth during the budget
development process and any new initiatives are successfully carried out. The agencies receive the

Business Case Study 3—Business Process ReengineeringBudgeting
approved appropriations at the budget-entity, appropriation category, and fund level and then reallocate
the funding to the lower levels of the organization.
The account information from the Appropriations Act is downloaded into the budget ledger in LAS/PBS.
The budget ledger is the system OPB uses to execute the budget. The appropriation information is also
sent to the agencies where it is input into spreadsheets and allocated to business units. The allocations are
done at different levels of detail, depending on the needs of the agency. The agencies have the flexibility
to allocate the funds to the organizational and program components with a budget entity. They must not,
however, allocate money across line items (for example, personal services funds cannot be allocated to
equipment). When the allocations are complete, they are input into the Departmental Accounting System,
which is used as the budget execution system for the agencies.
Through the budget execution process, agencies are managing expenditures to stay within the
appropriated line items for all expenditures except personnel expenditures. For personnel expenditures,
agencies are required to manage within the appropriated amount and within the total salary rate for each
budget entity. Salary rate is an amount calculated based on the annual salary rate for filled and vacant
authorized positions. Rate calculation and management is a complicated issue that is addressed as a
separate process in Section 3.14.
Agencies must submit budget amendments to move funds across line items or request more budget. The
budget amendment process is similar to the budget development process. Agencies develop budget
amendment issues with guidance from OPB. Issues are submitted to OPB and reviewed and updated if
necessary. The issues are sent to the House and Senate Budget offices, which notify OPB only for
exceptions. Approved budget amendments need to be updated in all of the budget systems, including
LAS/PBS, Central Accounting System, Departmental Accounting System, and in some cases COPES.
Performance-Based Program Budgeting
In recent years, a number of State agencies have begun incorporating the elements of program budgeting
into the traditional budgeting process. The program budgeting component is submitted as a manual
schedule with the annual budget. The current budgeting systems do not support performance-based
program budgeting (PB2). The schedule primarily includes a number of performance measures designed
to measure the performance of specific programs organized in four categories—input, output, outcome,
and efficiency.
The State is in the process of rolling out PB2 to most major agencies. Although instructions have been
created to assist agencies in developing program-based budgets, the primary emphasis during budget
development is on the traditional budget.

Business Case Study 3—Business Process ReengineeringBudgeting
Current Process Performance
Several factors drive the workload and performance of the budget process. The primary workload factor
during budget development is the number of budget issues that need to be developed, and the primary
workload factor during budget execution is the number of budget amendments. In general, the budget
issues and budget amendments begin in the agencies and are forwarded to OPB for further review and
analysis.
Exhibit 3-56 provides the annual workload statistics for the five study agencies.
Exhibit 3-56Budget Process Workload Statistics
Agency Budget Issues Budget Amendments
Department of Transportation 164 42
Department of Children and Families 188 158
Department of Highway Safety and Motor Vehicles 79 28
Department of Insurance, Treasury and State FireMarshal
100 34
University of Florida * *
*Tracked at the Board of Regents level
The workload statistics shown in Exhibit 3-56 are affected by several other factors, including:
! Number of budget entities
! Number of appropriation categories
! Number of funds
! Number of budget programs
! New legislation
! Budget schedules
The Executive and Legislative branches determine the number of budget entities and budget programs,
based on their desired level of control.
Current Process Costs
The cost of the current process is derived by analyzing three cost components—customer costs, agency
costs, and centralized costs. Customer costs generally reflect the time an individual spends completing a
form or entering data to initiate a process. Agency costs reflect the labor costs of the agency personnel
devoted to carrying out the process. Centralized costs reflect the labor costs of personnel who are located

Business Case Study 3—Business Process ReengineeringBudgeting
in a statewide administrative support agency and who participate in the process statewide. These costs are
extrapolated to the rest of State government based on the factors that drive the costs. The cost of
preparing Florida’s budget is incurred by each agency, OPB, and the House and Senate Budget offices.
These cost components are summarized in the following paragraphs:
Customer Costs: The process does not include a customer cost as defined in this analysis.
Agency Costs: Agency costs are defined specifically as those costs incurred by the centralized budget
staffs. For the five study agencies, we identified the central budget staff and the portion of their time
devoted to the budget formulation and budget execution processes. Our interviews with budget staff in the
five study agencies indicate that the centralized budget offices in the study agencies devote 20 percent of
their time to budget formulation and 30 percent to budget execution annually. Exhibit 3-57 shows the
centralized budget staff at the study agencies.
Exhibit 3-57Budget Office Staffing Levels and Process Labor Costs
Agency
CentralBudget
Office Staff
FTEs Devotedto Formulationand Execution
SalaryCosts*
ProcessCosts
(Agency)
Department of Transportation 3.5 $58,643 $205,251
Department of Children andFamilies
29 14.5 58,643 850,324
Department of Highway Safetyand Motor Vehicles
6 3.0 58,643 175,929
Department of Insurance,Treasury and State Fire Marshal
4 2.0 58,643 117,286
University of Florida 2 1.0 58,643 58,643
Total 48 24.0 – $1,407,433
*Based on the average salary cost plus benefits for State positions designated as budget related
Determining the total number of budget staff in all State agencies requires estimation, and the following
methodolgy was used. The 48 centralized budget staff identified in the study agencies are responsible for
21.6 percent of Fiscal Year 1999 statewide appropriations. Extrapolating the 48 staff to the rest of State
government based on total appropriations yields an estimated 222 central agency budget staff statewide.
Assuming that they spend half their time on budget formulation and execution, the total statewide labor
cost for these processes, based on an average salary and benefits of $58,643, is estimated at 111 FTEs or
$6.5 million.
In addition, costs are incurred by managers who prepare documentation to support budget issues and
attend meetings to discuss resource allocation alternatives. We estimate that State managers with budget
entity responsibility spend at least 5 percent of their time interacting with the budget process to advance

Business Case Study 3—Business Process ReengineeringBudgeting
their programmatic priorities. There are 221 budget entities statewide, requiring an estimated 20,500
manager hours. Therefore, the estimated manager cost is $650,000.
Total agency costs for the budget process development and execution is estimated to be $7.2 million.
Centralized Costs: Centralized costs consist of the Governor’s office (OPB), and the House and Senate
Budget offices’ staff time devoted to budget preparation and execution. The budget offices also have
technology staff members who support information system needs. OPB, for example, has 48 technology
staff members who support IT operations for LAS/PBS (these costs are not included here but are in the
cost for operating FFMIS). Based on an average salary and benefits of $58,643, the centralized budget
staff accounts for 100 FTEs or $5.9 million in additional labor costs. Most of the legislative budget staff
are devoted to budget formulation. OPB and technology staff efforts are divided between formulation and
execution.
In total, the State annually expends an estimated $7.2 million in agency costs and $5.9 in centralized costs
to carry out the budget formulation and execution processes.
Current Process Weaknesses
A budget process should allocate resources consistent with needs. It should do so efficiently and during as
short a time period as possible. Our experience with budget processes in other states indicates that neither
the length of Florida’s budget process nor the resources it consumes is out of line with common practice.
The State’s main issue is that it must use several systems that are not well integrated to formulate and
execute the budget. The State’s primary budgeting system, LAS/PBS, does not meet all of the
requirements for a budgeting system. Furthermore, the system does not support one of the key analytical
processes of budget analysis—the development of “what if” scenarios.
Based on interviews and analyses, LAS/PBS was identified as a weakness of the current budget process.
It does not provide the necessary functionality in the following areas:
! Analytical—Analyses are performed in spreadsheets and re-input into system
! Reporting and inquiry—Ad hoc reporting or changes to reports are difficult
! Interfaces—Flow of data is not automatic
! Ease of use—System is not easy to use or understand
! Performance-based program budgeting—Performance measures and program budgets are trackedmanually

Business Case Study 3—Business Process ReengineeringBudgeting
The lack of analytical and reporting capabilities creates the need for a budget analyst to enter information
from LAS/PBS to spreadsheets manually and to analyze budget information and develop reports. This
situation is complicated by users’ perceptions that LAS/PBS is a difficult system to learn and use.
LAS/PBS’s limitations are caused by its system architecture and baseline functionality. The system’s
programming language and database are neither as flexible nor as easy to use as newer generation
technologies are. These factors make it difficult to make changes or enhancements to the system and
provide minimal reporting and inquiry capabilities.
Interfaces between LAS/PBS and other systems are difficult because the system does not have an open
architecture. To update or create new interfaces takes considerable effort. In addition, the budgeting Chart
of Accounts is different from the systems with which it interfaces, creating additional complications.
The weaknesses in the system described cause analysts to perform non-value-added activities, such as
inputting information into spreadsheets, and requires a significant IT staff to support the number of
systems that support the budgeting process. In general, when organizations use multiple systems that are
not integrated, it becomes necessary to ensure that data is consistent among systems. The central budget
offices and agencies have this problem. When the Appropriation Act is passed, the information is input
into the LAS/PBS ledger, which is used by OPB for budget execution. This information must also be
input into the State’s Central Accounting System in the State Comptroller’s office.
At the same time, the agencies allocate and input the same appropriation information into the
Departmental Accounting System, which is the system used to execute the budget. Appropriations related
to personal services must be updated in COPES. When changes need to be made to the budget (for
example, a budget amendment), the information must be changed in each of the systems. OPB and agency
staff must reconcile the systems periodically to ensure that the systems have the same information.
Modern budgeting systems have greater capabilities and capacities to meet the needs of today’s budget
analysts. Today’s systems can provide the ability to capture information at a low level of detail, conduct
forecasting and trend analyses, and develop different types of budgets (for example, zero-based and
modified zero-based). Integrated systems with open architectures make transmitting and sharing
information much easier.
Integrated budgeting and accounting systems do not have this problem. Budget changes are automatically
reflected in each system, therefore eliminating the need to reconcile the systems periodically.
Reengineered Process
To reengineer the current budgeting process, the State must leverage technology to improve system
capabilities and eliminate the need to perform manual or non-value-added tasks.

Business Case Study 3—Business Process ReengineeringBudgeting
Recommendation BPR-35: Expand the functionality of the automated system to integratebudgeting with other financial management processes
By purchasing or developing an integrated financial management system, the State can address the
deficiencies described throughout this section. An integrated budgeting system with modern functionality
and architecture would enable OPB and agency management to use the same system to develop and
execute the budget.
An integrated system would benefit the State by eliminating reconciliation efforts and providing enhanced
capabilities that eliminate the need to use other applications. The use of improved databases and reporting
tools would increase the reporting capabilities of budget analysts and eliminate non-value-added tasks,
such as entering information into spreadsheets.
Fiscal Impact: No reduction in the number of budget analysts from implementation of this reengineering
recommendation is expected. However, time savings from the elimination of non-value-added tasks are
expected. These savings, which are indicated in Exhibit 3-58, are deemed “soft” savings because they do
not reflect elimination of positions, but instead reflect increased efficiency. Analysts would have
improved reporting and analytical capabilities and would have more time to spend on higher value tasks.
Exhibit 3-58 presents the estimated time and cost savings of the recommendation.
Our interviews with budget staff in the study agencies indicated that each analyst spends an average of 2
hours per week entering data manually to and from spreadsheets for analysis and reporting purposes. The
State could save an estimated 38,480 hours per year if such downloading and uploading were obviated by
a new system. Assuming an average salary and benefits of $58,643, this would result in approximately
$1.2 million in resources reallocated to higher value tasks.

Business Case Study 3—Business Process ReengineeringBudgeting
Exhibit 3-58Estimated Soft Cost Savings
AgencyBudget
Staff
ManualInput
HoursAverageSalary* Costs
Department of Transportation 7 728 $58,643 $23,000
Department of Children and Families 29 3,016 58,643 95,000
Department of Highway Safety and MotorVehicles
6 624 58,643 20,000
Department of Insurance, Treasury andState Fire Marshal
4 416 58,643 13,000
University of Florida 2 208 58,643 7,000
Office of Planning and Budget 69 7,176 58,643 227,000
Senate 13 1,352 58,643 43,000
House 18 1,872 58,643 59,000
Remaining Agencies 222 23,088 58,643 730,000
Total – 38,480 – $1,217,143
*Based on the average salary cost plus benefits for State positions designated as budget related
Reengineered Process—System Requirements
The changes resulting from reengineering the budget process are not apparent in the flow of information
between organizational units. The major changes to the process are how information is generated and
passed from system to system.
A major requirement for the system that supports the budget process is to provide budget analysts with
the ability to conduct analyses while in the system and to produce necessary reports. The system should
provide agencies with the ability to develop a budget at the necessary level of detail. A new system
should be able to transmit data from other key source systems such as the human resources and
accounting systems.
The system should also provide the ability to develop and track program budgets to support the State’s
performance-based program budgeting initiative.
Options Analysis
The recommendation to improve the current system’s functional and technical capabilities would be
affected by the system option chosen. Option 1 contains no savings as the status quo, by definition,
cannot support the integration and enhanced functionality called for in the recommendation. The
remaining options, however, lead to BPR savings in the form of increased efficiency.

Business Case Study 3—Business Process ReengineeringBudgeting
The fiscal impact of the options on the projected BPR savings is summarized in Exhibit 3-59.
Exhibit 3-59Summary of Annual Savings by Option
OptionBudgetary
SavingsIncreasedEfficiency
Total BPRSavings
Recommendation BPR-35
Option 1 $0 $0 $0
Option 2 0 1,217,000 1,217,000
Option 3 0 1,217,000 1,217,000
Option 4 0 1,217,000 1,217,000
Option 5 0 1,217,000 1,217,000

Business Case Study 3—Business Process ReengineeringRate and Position Administration
3.14 Recommended Process Changes—Rate and PositionAdministration
This section presents recommendations for reengineering the State of Florida’s rate and position
administration process.
Background
Most state legislatures have developed mechanisms for controlling personnel expenditures that
supplement normal appropriations limitations. Such controls are designed to prevent an agency from
hiring excess personnel in the middle of one year and expecting the legislature to fund those personnel for
the next full year. In many cases the full-year cost of personnel who are hired midway through the
previous year may cause an agency’s personnel costs to exceed its annual expected budget level.
For example, suppose an agency has an annual appropriation for personnel salaries of $50,000, which is
meant to hire one manager. If no controls are in place, a well-meaning agency head could wait until the
sixth month of the fiscal year, hire two $50,000 managers, and still stay within the $50,000 annual
appropriation. (Each manager would receive his or her full salary for half a year—$25,000 each.) At the
start of the next fiscal year, the legislature is told that the agency cannot do without the two managers and
requests an increase in appropriation for salaries from $50,000 to $100,000 to avoid terminating staff.
State legislatures have enacted various measures to restrict hiring staff when hiring that staff forces
budget increases in subsequent years. For the State of Florida, this is done through rate and position
administration.
In Florida, State agencies’ salary expenditures—except for the SUS—are controlled by annual salary rate,
the annual budget for salaries, and the number of positions. SUS salary expenditures are controlled by
annual salary rate and salary and benefits appropriation. Governed by Chapter 216.181 of the Florida
Statutes, the annual salary rate is calculated based on the actual salary rate in effect on June 30 and the
number of authorized positions and salary policy specified in the General Appropriations Act. In
calculating salary rate, vacant positions are calculated at the minimum of class plus additives, and filled
positions are calculated based on an employee’s base rate of pay plus additives. Additives generally
include such items as shift differentials, hazardous duty pay, and temporary special duty. In addition,
biweekly pay rate is annualized based on 26.1 weeks per year while monthly pay rate is calculated based
on 12 months.
An agency may exceed its approved rate for all budget entities by no more than 5 percent, provided that
by June 30 of every fiscal year each budget entity is within the approved rate. The annual salary rate is
controlled at the position level within the budget entity, and rates cannot be transferred among budget
entities unless positions are transferred as well. Hence, position, but position additions and reductions
impact the approved rate.

Business Case Study 3—Business Process ReengineeringRate and Position Administration
The State relies on FLAIR, COPES, and LAS/PBS to provide the bulk of budget information related to
rate; however, there are exceptions. Some agencies rely on supplemental systems for the calculation of
rate. Exhibit 3-60 shows the supplemental systems used by the five study agencies.
Exhibit 3-60Agency Supplemental Systems Used in the Rate and Position Administration Process
AgencySupplementalSystem Purpose
InterfacesWith
Department ofTransportation
Focus Desktop,Lotus
Report generation on projectbasis
COPES
Department of Children andFamilies
Excel Analytical tool for calculationof rate
None
Department of HighwaySafety and Motor Vehicles
Focus Desktop,Lotus
Produce information, reportsmanagement, and ratecalculation
None
Department of Insurance,Treasury and State FireMarshal
Impromptu,Access
For data retrieval fromCOPES and reportsgeneration
COPES
University of Florida Supers Provide biweekly reports toBoard of Regents
None
Current Process
The current process has two major components—establishing a rate amount for the year and managing
personnel expenditures against the rate throughout the year.
The process starts at the end of one fiscal year, with agencies reconciling their personnel budgets with the
data in LAS/PBS and ensuring that they are within their appropriated and approved budgets. OPB and the
agencies’ budget analysts use COPES to determine positions for the next year. Finally, OPB distributes
personnel pay packages to the agencies for the next fiscal year.
During the year, agencies may review daily reports generated by COPES to determine whether personnel
expenditures are within the calculated or approved rate amount and to make any adjustments to the rate
amount based on separations and accessions. Also, COPES does not provide the ability to issue pending
actions allowing the overall rate balances to show approved rate, actual rate, and actual rate with pending
action.
Current Process Costs
The cost of the rate and position administrating process is derived by analyzing three cost components—
customer costs, agency costs, and centralized costs. Customer costs generally reflect the time an

Business Case Study 3—Business Process ReengineeringRate and Position Administration
individual spends completing a form or entering data to initiate a process. Agency costs reflect the labor
costs of the agency personnel devoted to carrying out the process. Centralized costs reflect the labor costs
of personnel who are located in a statewide administrative support agency and who participate in the
process statewide.
The cost analysis focuses on direct labor costs. Overhead and other indirect costs associated with the
process are excluded. The costs measured in the five study agencies are extrapolated to the rest of State
government based on workload factors that most affect the costs. The categories and the costs for the five
study agencies and for estimates of those categories and costs statewide are described in the following
paragraphs.
Customer Costs: The process does not include a customer cost as defined in this analysis.
Agency Costs: The agency cost is reflected in the effort undertaken by the budget office staff and
managers who receive monthly reports on rate usage and by the information technology staff who convert
COPES data into LAS/PBS. In the five agencies reviewed, staff hours devoted to converting COPES into
LAS/PBS total 516. This is based on 29 hours per month for 12 months and year-end efforts totaling 168
hours. Based on the average salary and benefits of $58,643 for budget professionals statewide, the total
estimated annual cost is $16,000.
Examination of the five study agencies suggests that it takes 516 hours to manage 26 percent of the
State’s non-university positions. Extrapolated statewide, the hours required for the rate and position
administration process is 1,985 hours or about $64,000.
For the purpose of the extrapolation, universities are considered separately. Universities manage to an
overall salary rate but are exempt from the position control requirements. Consequently, they expend
fewer resources managing salary rate and position. The University of Florida has approximately 33
percent of all the university positions statewide. Based on the estimated 16 hours that the University of
Florida spends on rate and position administration, calculations indicate that all the universities spend
about 54 hours annually.
Exhibit 3-61 shows the agency cost components of the position control process.

Business Case Study 3—Business Process ReengineeringRate and Position Administration
Exhibit 3-61Labor Costs Associated with Position and Rate Administration
Agency
MonthlyMaintenance
(Hours)
End of YearProcess(Hours)
StaffInvolved
Department of Transportation 2 40 7
Department of Children and Families(Central office)
23 113 15
Department of Highway Safety and MotorVehicles
1 4 6
Department of Insurance, Treasury andState Fire Marshal
2 7 2
University of Florida* 1 4 2
Total 29 168 32
* State universities are held to annual salary appropriations and rate but not to a number of positions
Centralized Costs: The centralized costs are represented by the time the OPB analysts expend
downloading currently authorized position data from COPES into LAS/PBS and comparing currently
authorized position data and approved salary rate at the end of the fiscal year. With 40 FTEs dedicated
centrally to rate and position control, the time required for this function is estimated at 300 hours
annually, which translates to about $9,000 annually.
In total, the State annually expends an estimated $64,000 in agency costs and $9,000 in centralized costs
to carry out the rate and position administration.
Current Process Weaknesses
The State’s process for managing personnel expenditures and positions is overly complicated, time
consuming, and limits agencies’ flexibility to manage their operations. With rate control, agencies have to
manage personnel expenditures against two numbers—salary appropriations and rate. The calculation of
rate is complicated, and the approved rate changes throughout the year while the appropriation amount
generally does not. (Appropriation amount can change with a budget amendment, cost-of-living
adjustment, or other legislative action.)
As a result of using rate to manage positions and personnel expenditures, nearly 15 percent of the State’s
$50 billion budget is not managed through the accounting system (FLAIR).
Although the State recognizes the importance of controlling the continuing cost of authorized positions,
agencies’ personnel expenditures are managed primarily through COPES. FLAIR, COPES, and LAS/PBS
are not sufficiently interfaced to allow efficient management of budget for personnel expenditures. The

Business Case Study 3—Business Process ReengineeringRate and Position Administration
insufficient interface between the systems causes several agencies to use supplemental systems and
reporting software to obtain reports and manage their personnel expenditures relative to the salary rate.
The current systems are not designed to support the management of personnel expenditures through rate.
The management of rate requires that three systems interface—FLAIR, COPES, and LAS/PBS. This end-
of-year process is inefficient because systems are inconsistent across agencies. The three systems are used
separately in the budgeting process, and each year, much effort in late May through June is required to
synchronize them on June 30. This problem also causes concern to the agencies when calculating rate and
dollars to be given for annual salary increases.
Reengineered Process
To address the weaknesses in the current process, the State should simplify rate and automate it in the
financial system.
Recommendation BPR-36: Simplify salary rate calculation and automate within thefinancial accounting system
To simplify the concept of rate, the State should control salary expenditures by setting allowable rate at
100 percent of the budgeted salary amount at the start of the year. The total projected salary for the
remainder of the year would need to be less than the rate. The allowable salary rate would decline during
the course of the fiscal year on a straight line from 100 percent on July 1 to 0 percent on June 30. The
accounting systems would track the amount of allowable rate to projected rate at any time during the year.
Upon a request to add a person to the payroll, the system would calculate three things:
! Portion of remaining salary rate to be expended based on current workforce strength within thebudget entity
! Amount of salary rate needed to add the person to the payroll for the remainder of the year
! Difference between the salary rate needed to add the person and the salary rate available
If the last calculation shows a positive difference between what is available and what is needed, then the
accounting system would allow the person to be placed on the payroll at the salary level requested.
Otherwise, the request would be rejected.
The following example illustrates the new proposed method for calculating and managing rate:
An agency with 10 positions submits a budget request to fund all 10 positions for the upcomingfiscal year. The agency requests $320,000 for salary and benefits. Through the course of budgetnegotiations, the House budget staff realizes that two of the positions are vacant and could not

Business Case Study 3—Business Process ReengineeringRate and Position Administration
possibly be filled until 3 months into the fiscal year. The Executive Branch and LegislativeBranch agree that the positions should be funded because they are slated to carry out worthwhileendeavors, but realized that funding is need for only 9 months for two of the positions. Theremaining eight positions are already filled and it is assumed that they will continue to be filledthrough the course of the fiscal year.
To meet the salary and budget needs for this agency, the House should fund eight positions attheir current rate (assuming no cost-of-living increases, step increases, or promotions) and twopositions for 9 months. Furthermore, the budget staff members realize that this agency has a highattrition rate historically. Based on their experience with this agency, they reduce the salary andbenefits request by another 5 percent across the board. When this negotiation is competed, whichshould be based on the best estimate of actual needs at the time, the result eventually becomes thesalary and benefits appropriation for the agency. As a result, the agency’s salary and benefitneeds are, for example, $300,000 rather than $320,000. The $300,000 also becomes the basis forcalculating the rate.
On the first day of the fiscal year, rate equals $300,000. On the last day, it equals $0. The rate atthe 6-month mark of the fiscal year would equal $150,000. If the agency delays filling theposition, it will have rate that could be expended for other authorized purposes within theappropriation.
The recommendation eliminates the concept of rate as it is used by Florida and may eliminate the need to
control the Executive Branch by position. This measure of control would give the Legislature more
assurance that personnel expenditures would not exceed budgetary appropriations and would not place
demands on a future budget, while at the same time giving agency heads more flexibility.
Fiscal Impact: Implementation of this recommendation would eliminate the time now expended on rate
and position administration. Total savings are estimated at $73,000 annually. The State may experience a
reduction in hours expended by the customers of this process, agency staff, and centralized staff to
manage and calculate rate. Adopting the proposed recommendation would reduce the monthly and end-
of-year workload on agencies and centralized staff.
Reengineered Process—System Requirements
To implement the reengineering recommendations, the State requires a financial management system that
must be able to calculate the salary rate remaining at any given time based on a straight-line reduction of
rate over the course of the fiscal year. This would require an integrated personnel and financial system.
When staff is to be added to the payroll, the system must calculate salary rate remaining to ensure
compliance with budget limitations.

Business Case Study 3—Business Process ReengineeringRate and Position Administration
Options Analysis
KPMG’s recommendation to simplify salary rate calculation and automate within the financial system
will require implementation of systems Options 3, 4, or 5. Although there will be some additional costs
involved with adopting any of the systems options, the State would benefit exceedingly with a change that
makes it easier for department managers to manage rate. Simplifying rate and automation would ease the
monthly workload on agency personnel and reduce the complexities of calculating rate. Agency personnel
responsible for calculating and managing rate would need training on the integrated system functionality.
The potential budgetary reduction resulting from implementation of recommended process changes is $0.
The savings identified in Exhibit 3-62 reflect an increase in efficiency valued at $73,000.
Exhibit 3-62Summary of Annual Savings by Option
OptionBudgetary
SavingsIncreasedEfficiency
Total BPRSavings
Recommendation BPR-36
Option 1 $0 $0 $0
Option 2 0 0 0
Option 3 0 73,000 73,000
Option 4 0 73,000 73,000
Option 5 0 73,000 73,000

Business Case Study 3—Business Process ReengineeringCertified Forward
3.15 Recommended Process Changes—Certified Forward
This section presents recommendations for reengineering the State of Florida’s certified forward
process—the process by which undisbursed balances are certified for expenditure during the subsequent
fiscal year.
Background
The certified forward process is governed by Chapter 216.301, Florida Statutes: Appropriations;
Undisbursed Balances. This Chapter requires the head of each agency and the judicial and legislative
branches to certify to the Executive Office of the Governor on or before August 1 of the fiscal year
undisbursed amounts that have outstanding obligations at the end of the prior fiscal year. The Statutes
require the agencies to report in detail obligated but undisbursed appropriations to the Executive Office of
the Governor. The detail must include the obligees to whom the balances are obligated and the amounts of
the obligations. The Statutes further state that if such certification is not made and an obligation is proven
to be legal and binding, then the obligation will be paid and charged to the agency’s current-year
appropriations.
The SUS falls under purview of Chapter 240.272, Florida Statutes: Carry Forward of Unexpended Funds,
which requires the Executive Office of the Governor to certify forward all unexpended funds appropriated
or provided for the SUS on July 1. Unexpended balances in the current-year operating budget, including
unexpended student fee revenues, are carried forward by the Board of Regents for use by the university to
which the funds were allocated. Of the unexpended funds certified forward, any unencumbered amounts
may be transferred to university carry forward accounts on September 1 of each year. In addition, any
certified forward funds remaining undisbursed on December 31 are transferred to university carry forward
accounts. There are limitations on the amount of funding that universities can carry forward. Specifically,
only 5 percent of the aggregate budget can be carried forward by an institution.
The certified forward process has been in existence for more than 30 years. When it started, its original
purpose was to provide flexibility by reverting unneeded funds to the general revenue fund. When the
certified forward process was established, the State did not have a rainy day fund nor other funds to
address unforeseen needs. In its infancy, the process was completely manual, only estimates were
developed, and it required only 2 weeks to complete. Since then, the process has become more automated,
the State has established a rainy day fund, the obligations are provided in specific detail, and the process
takes about 2 months to complete.
Although the process is largely a budgetary exercise, it has implications for the State’s financial reporting
process. Information on the status of obligations and payables at the end of a fiscal year supplies
important input for the State’s CAFR. Payables are reported as a part of the annual report. Consequently,
the two processes (certified forward and the annual financial report) are linked.

Business Case Study 3—Business Process ReengineeringCertified Forward
In general, the agencies rely on FLAIR and LAS/PBS to support the bulk of the certified forward
processing requirements, management reporting, and appropriation changes, but there are exceptions.
Exhibit 3-63 identifies the agency systems used to support the completion of the certified forward process
and their corresponding purposes and system interfaces.
Exhibit 3-63Agency Supplemental Systems Used in the Certified Forward Process
AgencySupplementalSystem Purpose
InterfacesWith
Department ofTransportation
DOT FMS Research, verification, and cross-walks
FLAIR (tape)
Department of Children andFamilies
Northwood DataCenter (CertifiedForward)
Allocates approved certified forwardamounts into Departmental FLAIR(District Accounting Records)
FLAIR (tape)
Department of HighwaySafety and Motor Vehicles
EXCEL Contract and Utility Payment TrackingSystems
No interfaces
Department of Insurance,Treasury and State FireMarshal
EXCEL Management reporting tool to monitorobligations throughout the fiscal year
No interfaces
University of Florida TOPAZ
Payroll PersonnelSystem
Financial DataWarehouse
Reconciling FLAIR transactions withpurchasing requisitions
Supports certifying forward theuniversity’s payroll requirements
Provides a check on a multitude offinancial transactions
FLAIR
FLAIR
FLAIR
Current Process
The current process includes five major components:
! OPB and Comptroller initiating activities
! Agency certification activities
! Agency fixed capital outlay (FCO) unique requirements
! Agency submittal and OPB review activities
! University of Florida activities
Exhibit 3-64 depicts the timeline associated with the current certified forward process.

Business Case Study 3—Business Process ReengineeringCertified Forward
Exhibit 3-64Certified Forward Current Timeline
ID Task Name
1 OPB Promulgates Memo to Agencies
2 Agencies increase monitoring Type As, Bs, and Cs
3 Agencies validate individual records for certify forward
4 Agencies submit DCFR01 and DCFR03 Reports
5 OPB Review and Adjustment of Certified Forward
6 OPB Publishes Approved Certified Forward
7 Agencies process approved certified forward items
8 Reversions
9 Reversions
���������
���������
���������
������������������
������������������
���������������������������
���������������������������
6/18�����������������������������������������������������������������������������������
8/2������������
8/23������������������������������������������������������������������������
8/23
������
������������������������������������
May Jun Jul Aug Sep Oct Nov DecMay June July August September October November December
OPB and Comptroller Initiating Activities: During the first week of July, OPB provides a tentative
certified forward release compiled from the Comptroller’s unexpended release balance to roll forward for
operating categories. The amounts obtained from the Comptroller are aggregated by operating category
and not broken down to the level of detail implied in the Statutes. For fixed capital outlay appropriations,
the unexpended release balances as of June 30 are tentatively certified forward (including unreleased
approved budget and any amount held in reserve). Agencies are able to pay prior year vouchers from
tentative certified forward release until final certified forward approval by Executive Office of the
Governor. The Comptroller does not process vouchers that exceed the unexpended release balance for any
certified forward appropriation category.
Specific direction on certified forward is provided by the OPB before the end of the fiscal year, usually in
mid-June. A memorandum from the OPB describes the requirements to the agencies and provides specific
directions regarding the submission of agency FLAIR DCFR01 (operations appropriations) and FLAIR
DCFR03 (fixed capital outlays) reports. The reports are due no later than August 1, and OPB publishes
the final approved certified forward appropriations on or before September 1.
Agency Certification Activities: Agency Central Accounting offices provide direction to their
districts/departments regarding the recording, update, and certification of accounts payable (Type A),
encumbrances (Type B), and accounts receivable (Type C) transactions for operating accounts and for
fixed capital outlay. Because this process is performed annually, agencies typically provide their
districts/departments direction in May or early June. More specific direction is forwarded upon receipt of
the OPB memorandum. Accounts receivables are generally not certified forward by the agencies unless
an agency has incurred obligations that are more than its unexpended release balance in anticipation of
receiving a reimbursement and subsequently depositing this amount in the fund from which it was
expended.
Agency District/Departmental Accounting offices initiate the process of recording certified forward all A,
B, and C items, when applicable, in FLAIR—A items to the accounts payable subsidiary, B items to the
encumbrance subsidiary, and C items to the accounts payable subsidiary. Encumbrances, accounts
payable, and accounts receivable items to be certified forward are marked for certification forward in the
Business Case Study 3—Business Process ReengineeringCertified Forward
CF field in FLAIR in one of three ways: on original input, updated in the appropriate subsidiary ledger, or
updated through Request for Certifications. Agencies also have the option of having all their records
automatically marked as certified forward on June 30 to avoid designating the records individually.
Regardless of the means of designating the individual records as certified forward, the agency
District/Departmental Accounting offices still need to perform research on outstanding contracts,
invoices, and purchase orders to determine whether they are a valid and legal obligation of the agency
from the prior year to comply with Statute 216.301.
While the agency District/Departmental Accounting offices are researching and recording items as
certified forward, agency Central Accounting offices run various discrepancy reports to determine the
accuracy of the District/Departmental entries. Examples of these reports include FLAIR Certification
Forward Subsidiaries Errors and FLAIR progress reports designating certified forward status by Internal
Budget Indicator (IBI), category, and fund source. The Central Accounting System notifies the
District/Departmental offices of any errors and requests that they make corrections or adjustments as
necessary.
In addition to overseeing the development of the certified forward reports, Central Accounting offices are
monitoring budgeted funds to ensure that no negative balances are showing up. Central Accounting
transfers funds from other sources to mitigate negative balances showing up on the certified forward
reports.
Agency Fixed Capital Outlay Unique Requirements: Because of the long-term nature of capital projects,
appropriations have unique requirements for the certified forward process relative to the operating
appropriations. The FCO certified forward process requires the agencies to indicate within the FLAIR
DCFR03 reports specific project status information about the following:
! Architectural program has been approved
! Architect/engineer is under contract
! Construction contract is approved
! Equipment purchases have been completed
! Force account approval has been granted
Codes of Y=Yes, N=No, and 0=Not Applicable are entered by the agencies in the appropriate field to
capture the required information.
Agencies are also required to detail agency obligations or commitments for fixed capital outlay. This is
accomplished through FLAIR with the agency reporting amounts in six fields used in the DCFR03 report
to break out funding as follows:

Business Case Study 3—Business Process ReengineeringCertified Forward
! Conducting a study provided by the appropriation
! Performing the architectural/engineering design work
! Purchasing land required to complete the project
! Performing the construction work including a contingency for unforeseen circumstances
! Purchasing equipment or furnishings required to complete the project
! Any amounts held in reserve for post-occupancy corrective work or other unforeseen allowancesnot covered by the construction contingency
The total of these amounts serves as justification for the FCO certified forward amount requested.
For agencies that perform extensive multiyear capital projects, there is a considerable amount of effort in
providing this information, and agencies have had to develop automated capabilities to relieve some of
the manual workload. For example, because of the extremely large volume associated with FCO and work
program appropriations within the Department of Transportation, DOT uses a scripting program to
designate the detail required for the appropriation category amounts.
Agency Submittal and OPB Review Activities: Upon completion of the certified forward detailed effort,
FLAIR Certification Forward Request reports are run for each operating appropriation category
(DCFR01) and for Fixed Capital Outlay (DCFR03). The agency head signs the report and submits the
report to the Auditor General. The Fixed Capital Outlay reports are submitted to the Department of
Management Services. In addition, agencies are also required to submit their reports electronically to the
Comptroller’s office through the FLAIR RDS. Accordingly, agencies notify the FLAIR help desk of their
intention to submit the reports, and the FLAIR help desk assists the agencies in transferring the
computerized FLAIR Certification Forward Request Data to LAS/PBS.
OPB uses LAS/PBS to compare departmental disbursement data to State account balances. Agencies are
notified of required adjustments in their certified forward reports. Because FLAIR certified forward
capabilities are unavailable until OPB has completed its review, agency personnel need to come to OPB’s
office to make the adjustments in LAS/PBS and make the corresponding adjustments in FLAIR.
Alternatively, OPB agency points of contact also make adjustments and then notify their agency
counterparts of the changes. After completing the review and adjustments of the certified forward data,
OPB approves the agency certified forward amounts on or before September 1.
Upon approval, OPB sends a tape to State Accounts (FLAIR Central Accounting System) designating
available appropriation balances by fund and IBI 00. Reversions return to the applicable funding source as
unappropriated dollars. FLAIR Central Accounting System posts the approved certified forward amounts
to State accounts, and agencies are allowed to continue processing their prior year obligations through
December 31. At this point, any unexpended operating certified forward amounts revert to the applicable
funding source.
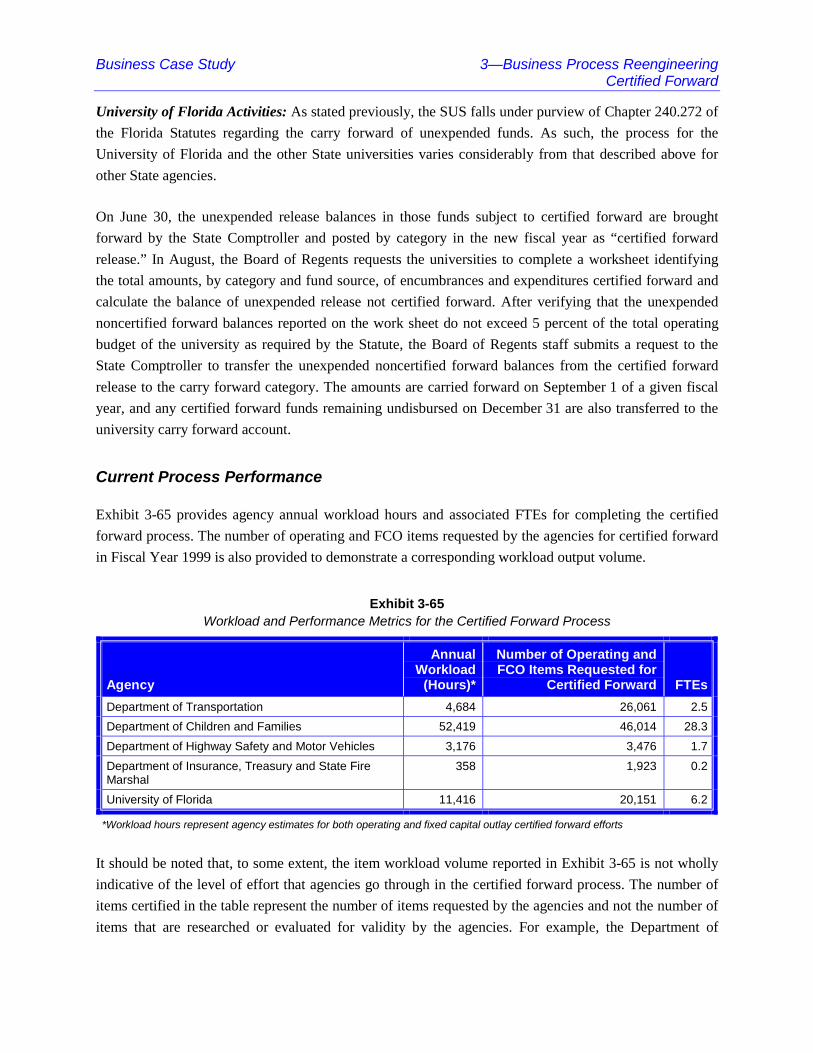
Business Case Study 3—Business Process ReengineeringCertified Forward
University of Florida Activities: As stated previously, the SUS falls under purview of Chapter 240.272 of
the Florida Statutes regarding the carry forward of unexpended funds. As such, the process for the
University of Florida and the other State universities varies considerably from that described above for
other State agencies.
On June 30, the unexpended release balances in those funds subject to certified forward are brought
forward by the State Comptroller and posted by category in the new fiscal year as “certified forward
release.” In August, the Board of Regents requests the universities to complete a worksheet identifying
the total amounts, by category and fund source, of encumbrances and expenditures certified forward and
calculate the balance of unexpended release not certified forward. After verifying that the unexpended
noncertified forward balances reported on the work sheet do not exceed 5 percent of the total operating
budget of the university as required by the Statute, the Board of Regents staff submits a request to the
State Comptroller to transfer the unexpended noncertified forward balances from the certified forward
release to the carry forward category. The amounts are carried forward on September 1 of a given fiscal
year, and any certified forward funds remaining undisbursed on December 31 are also transferred to the
university carry forward account.
Current Process Performance
Exhibit 3-65 provides agency annual workload hours and associated FTEs for completing the certified
forward process. The number of operating and FCO items requested by the agencies for certified forward
in Fiscal Year 1999 is also provided to demonstrate a corresponding workload output volume.
Exhibit 3-65Workload and Performance Metrics for the Certified Forward Process
Agency
AnnualWorkload
(Hours)*
Number of Operating andFCO Items Requested for
Certified Forward FTEs
Department of Transportation 4,684 26,061 2.5
Department of Children and Families 52,419 46,014 28.3
Department of Highway Safety and Motor Vehicles 3,176 3,476 1.7
Department of Insurance, Treasury and State FireMarshal
358 1,923 0.2
University of Florida 11,416 20,151 6.2
*Workload hours represent agency estimates for both operating and fixed capital outlay certified forward efforts
It should be noted that, to some extent, the item workload volume reported in Exhibit 3-65 is not wholly
indicative of the level of effort that agencies go through in the certified forward process. The number of
items certified in the table represent the number of items requested by the agencies and not the number of
items that are researched or evaluated for validity by the agencies. For example, the Department of

Business Case Study 3—Business Process ReengineeringCertified Forward
Children and Families pre-certified 240,431 operating items on June 30. The research, reconciliation, and
analysis required for a large agency to certify forward is extensive.
Current Process Costs
The cost of the certified forward process is derived by analyzing three cost components—customer costs,
agency costs, and centralized costs. Customer costs generally reflect the time an individual spends
completing a form or entering data to initiate a process. Agency costs reflect the labor costs of the agency
personnel devoted to carrying out the process. Centralized costs reflect the labor costs of personnel who
are located in a statewide administrative support agency and who participate in the process statewide.
The cost analysis focuses on direct labor costs. Overhead and other indirect costs associated with the
process are excluded. The costs measured in the five study agencies are extrapolated to the rest of State
government based on workload factors that most affect the costs. The categories and the costs for the five
study agencies and for estimates of those categories and costs statewide are described in the following
paragraphs.
Customer Costs: The process does not include a customer cost as defined in this analysis.
Agency Costs: Exhibit 3-66 shows the agency certified forward workload effort by Central Agency FTEs
and District/Departmental FTEs and gives the total costs of certified forward for the five participating
agencies.
Exhibit 3-66Agency Costs for Certified Forward
Agency
AgencyFTEs—Central
AgencyFTEs—
DispersedTotalFTEs
Cost ofCertifiedForward
Department of Transportation 0.3 2.2 2.5 $71,000
Department of Children and Families 0.3 27.9 28.2 801,000
Department of Highway Safety and Motor Vehicles 1.7 Not Applicable 1.7 48,000
Department of Insurance, Treasury and State FireMarshal
0.2 Not Applicable 0.2 6,000
University of Florida 6.0 0.1 6.1 173,000
Total 8.5 30.2 38.7 $1,099,000
The Central Agency FTEs represent the effort involved in overseeing the agency’s certified forward
process and reporting mechanisms. This is not a full-time responsibility for any one person during an
entire year. Instead, it is the full-time responsibility of one person or a small group of people over a 2-

Business Case Study 3—Business Process ReengineeringCertified Forward
month period. This includes oversight of District/Departmental accounting activities, running and
analyzing exception and error reports, and in some cases adjusting negative account funding balances.
Agency dispersed FTEs represent District/Departmental efforts associated with the certified forward
process. The dispersed FTEs spend only a fraction of their time on the process; however, there are a large
number of employees involved at one level or another. This includes the researching of vouchers and
contracts to determine whether an accounts payable or encumbrance is a valid obligation of the agency
associated with the prior fiscal year. In the large agencies and the University of Florida, hundreds of
people at the District/Departmental level participate in this process.
To arrive at an accurate reporting estimate, agency Districts/Departments are required to report on their
certified forward workload focusing on only those activities that are associated with certified forward and
not end-of-year closing. For example, DCF reported on five districts of various sizes. Workload hours
were captured for each of the five districts and central headquarters accounting in relative detail. From the
five districts, working with the DCF certified forward expert, the information was extrapolated to the
remaining district offices by designating districts of similar size and transaction volume and then
extrapolating the FTEs and associated workload dollars accordingly using the five reporting districts as
the basis.
To calculate the statewide agency labor cost savings associated with modifying the certified forward
process, it was necessary to determine a transaction item/FTE for a small and large agency. This was
accomplished using an average of the two small and large agencies in terms of FTEs and items certified.
For the large agencies, this amounted to adding the FTEs and transaction items for DOT and DCF and
dividing them by 2. Then, the total number of average transaction items (36,037) of the two agencies was
divided by the average FTE (15.4) to achieve a ratio of transaction items per FTE of 2,342. A similar
calculation was accomplished for the two small agencies, DHSMV and DOI, to achieve a ratio of
transaction items per FTE of 2,842. For the University of Florida, a ratio of transaction items per FTE of
3,277 was calculated.
For the extrapolation, the number of transaction items certified forward was used as the basis and divided
by the appropriate transaction item/FTE to determine the number of FTEs associated with completing an
agency’s certified forward process. Those State agencies that certified in excess of 20,000 items used the
large transaction item/FTE factor. Those agencies that certified fewer than 20,000 items used the small
agency transaction item/FTE factor. For the SUS, all universities used the University of Florida
transaction item/FTE factor because their certified forward process is different from the other agencies
evaluated. Dividing the number of items by the appropriate transaction item/FTE factor provided the
number of estimated FTEs in an agency associated with certified forward. This FTE amount was
multiplied by the average State salary for an Accountant II with benefits of $28,406 to determine the
agency-specific cost of certified forward. All agency certified forward costs were summed to determine a
total statewide cost of $4.2 million.

Business Case Study 3—Business Process ReengineeringCertified Forward
Centralized Costs: Costs are incurred centrally by OPB during its review of the agency certified forward
requests. Based on discussions with OPB staff, we estimate that they spend 375 hours on this process,
which equates to 0.2 FTEs for an estimated cost of $11,000. This cost estimate is based on the average
salary and benefits for the staff in the centralized budget offices—$58,643.
In total, the State annually expends an estimated $4.2 million in agency costs and $11,000 in centralized
costs to carry out the certified forward process.
Current Process Weaknesses
The State’s current process for certified forward is inefficient and costly. The detailed listing of individual
items for certification forward consumes valuable labor resources. During the certified forward
extrapolation, we determined that the State uses approximately 146 FTEs to complete this process for the
State. In Fiscal Year 1999, State agencies requested 379,309 operating and FCO items as certified
forward.
This process is so labor intensive because of the following:
! The State’s interpretation of the law requires that agencies certify all outstanding items at adetailed level requiring each agency to research each outstanding encumbrance and payable todetermine if it is a valid obligation of the State
! FLAIR Departmental Accounting System, FLAIR Central Accounting System, and LAS/PBS arenot integrated systems, which requires reconciliation to determine available budget balances andadjustments to ensure that no one overspends
The certified forward process consumes resources far in excess of the benefits it provides. The detailed
itemizing of an encumbrance or payable is accomplished regardless of the transaction size. It is
understandable that the State and its agencies would want to investigate and determine any large,
outstanding obligations from the previous year; however, the certification process is accomplished
whether the item is a $1 million contract or a $40 voucher. In addition, agency representatives indicate
that approximately 70 to 80 percent of those items researched for certification are paid out within the first
2 months of the new fiscal year with the overwhelming majority of certified items being processed before
the end of the calendar year—by some agency estimates as much as 95 percent.
It is also interesting to note the degree to which an agency’s requested amounts are actually approved as
certified forward. Exhibit 3-67 provides agency total operating and FCO certified forward dollars
requested and approved in the Fiscal Year 1999.

Business Case Study 3—Business Process ReengineeringCertified Forward
Exhibit 3-67Agency Requested and Approved Certified Forward Dollars
Fiscal Year 1999
AgencyAmount Requested
for Certified ForwardAmount Approved
for Certified Forward
Department of Transportation* $3,598,663,982 $3,597,245,401
Department of Children and Families 296,829,162 297,816,848
Department of Highway Safety and Motor Vehicles 26,291,041 26,291,041
Department of Insurance, Treasury and State FireMarshal
5,056,487 5,056,487
University of Florida $148,811,150 $148,487,359
*DOT amounts represent the total of operating, FCO, and Work Program categories
For Fiscal Year 1999, 99 percent of the certified forward items were approved. For operating categories,
which drive the overwhelming majority of the workload, $2,553,209,274 was approved. This amount
represents 6 percent of the entire annual State operating appropriations.
Differences between the amount requested and the amount approved in Exhibit 3-67 are due to
adjustments made during the OPB review process. Certain items may not be approved or additional items
may be approved during the OPB review. As stated earlier in the report, OPB analyst and agency
representatives coordinate these adjustments to ensure LAS/PBS and FLAIR are reconciled. It is
worthwhile to note, however, that the overwhelming majority of those items requested are approved as
certified forward. In fact, in some cases, the exact amount requested by an agency (for example,
DHSMV) was actually approved by OPB. With the large appropriations involved in the review process,
the lack of deviation between the review and approved amounts calls into question the benefits of the
State performing a detailed review.
The effect of the process is to drain the State of valuable labor resources. Eliminating or revising the
certified forward process can save the State millions of dollars annually or increase the productivity of its
workforce by freeing valuable resources to accomplish more productive tasks.
Furthermore, certified forward also undermines agencies’ compliance with Florida Statutes, Chapter
215.422: Prompt Payments Law, during July. Agencies reported that during July they cannot meet the
threshold requirements for prompt payments to their vendors. This is attributable to the amount of time
the agencies spend certifying forward during July.
Reengineered Process
To address the weaknesses in the certified forward process, the State would need to make wholesale
changes in the way it handles year-end undisbursed balances.

Business Case Study 3—Business Process ReengineeringCertified Forward
Recommendation BPR-37: Eliminate the detailed certified forward process for operationsappropriations
This can be accomplished by carrying forward automatically the prior year obligations on June 30 and
allowing agencies to process these obligations through September 30. All funds not expended by
September 30 would revert to the applicable fund source and be available for appropriation in the current
fiscal year. An exception process would have to be developed between OPB and agencies for certain
items that need to be carried forward beyond the September 30 reversion date. It is recommended that this
process last approximately 2 weeks beginning on or about September 15. Those obligation items that will
truly impact an agency’s current year funding if they are not allowed to be carried forward beyond that
date, should be itemized at the detail level. Those items that are not carried beyond September 30 would
be paid by the agency out of the subsequent year’s funding. All operating items not disbursed within 6
months of the end of the fiscal year would need to be funded from the subsequent year’s appropriation
and any unexpended moneys would revert to the applicable fund sources at that time.
Florida Statutes, Chapter 216.301: Appropriations; Undisbursed Balances, would have to be modified to
move the date for certification from August 1 to October 1. OPB would also need to develop a different
policy for this process to accommodate the change.
Fiscal Impact: The fiscal impact of changing the certified forward process is considerable. State agencies
currently spend extensive amounts of time researching contracts and vouchers at the end of the fiscal year
to comply with certified forward. Changing this requirement would free State resources or allow the
agencies to cut costs because the elimination of certified forward allows workloads in the agency central
and district/departmental accounting offices to be redistributed. Agencies estimated that 70 to 80 percent
of certified items are expended or eliminated during the first 2 months of the new fiscal year. We estimate
that eliminating the detailed certified forward process would reduce the work associated with the process
by 75 percent and thereby the labor costs as well. The value of the labor hours saved would total an
estimated $3,125,000.
Reengineered Process—System Requirements
The process change recommended for certified forward does not require changes to FLAIR or agency-
specific systems.
Options Analysis
The proposed process change does not depend on any of the system options under consideration.
Therefore, for each of the alternatives, KPMG estimates that a conservative cost savings of $3.2 million
can be achieved for the State of Florida by altering the certified forward process. The results are
summarized in Exhibit 3-68.

Business Case Study 3—Business Process ReengineeringCertified Forward
Exhibit 3-68Summary of Annual Savings by Option
OptionBudgetary
SavingsIncreasedEfficiency
Total BPRSavings
Recommendation BPR-37
Option 1 $3,125,000 $0 $3,125,000
Option 2 3,125,000 0 3,125,000
Option 3 3,125,000 0 3,125,000
Option 4 3,125,000 0 3,125,000
Option 5 3,125,000 0 3,125,000

Business Case Study 3—Business Process ReengineeringCash Receipts and Cash Management
3.16 Recommended Process Changes—Cash Receipts and CashManagement
This section presents recommendations for reengineering the State of Florida’s cash receipts and cash
management process and improving the return on investment in the certificate of deposit program and
internal investment liquidity pool.
Background
The cash receipts and cash management process involves the collection of fees, fines, and other revenues
and the deposit of these monies into the State’s concentration account. State agencies receive payments
for numerous reasons including the sale of goods and services. Receipt sources for examples of sale or
service items for the five study agencies are presented in Exhibit 3-69.
Exhibit 3-69Revenue Sources by Agency
Agency Receipt Source
Department of Transportation Tolls, interagency fuel sales, permits, fines, saleof maps
Department of Children and Families Certificates, licenses, fees
Department of Highway Safety and MotorVehicles
Address change fees, data listings, publicrecords, tax collector offices, DMV offices, driverlicense offices, truckers permits and fees
Department of Insurance, Treasury andState Fire Marshal
Fees assessed, taxes (license, general revenue,and trust fund), penalties
University of Florida Tuition, fines, campus department sales
The cash receipt and cash management processes are governed by Chapters 215.31, 215.322, 116.01, and
18.10 of the Florida Statutes.
FFMIS and FLAIR, in particular, lack cash receipt functionality. To obtain information on receipts by
month or category, agencies require the assistance of a programmer to retrieve the information from
FLAIR. It is difficult to extract or manipulate data from FLAIR to generate daily, weekly, monthly, or
annual cash receipts reports. Consequently, agencies have purchased or developed supplemental systems
to produce management information reports on cash receipts. The costs of these systems range from
millions of dollars to less than $100.
Exhibit 3-70 illustrates several of the supplemental systems being used, their purpose, and the subsystems
with which they interface.

Business Case Study 3—Business Process ReengineeringCash Receipts and Cash Management
Exhibit 3-70Agency Supplemental Systems Used in the Cash Receipts Process
AgencySupplementalSystem Purpose Interfaces With
Department ofTransportation
Cashiers System Records revenue and deposits,generates management reports
FLAIR
Department of Childrenand Families
Cash ReceiptsDatabase
Tracks individual checks andrefunds, searches and generatesmanagement reports
FLAIR
Department of HighwaySafety and MotorVehicles
ATB Records deposits anddisbursements, generatesmanagement reports
–
Department of Insurance,Treasury and State FireMarshal
RVS and RECSystem - AS400
Processes daily deposits made byState agencies, verifies receipts,and creates daily/monthly reports;reconciles account transactionswith FLAIR system; processescharge backs and debit memos
FLAIR
University of Florida Cashier ReceiptSystem
Records and receipts paymentsand deposits, generatesmanagement reports, updatesstudent records.
FLAIR
After the cash is received, it is managed through various accounts in DOI. Cash is invested in three ways
primarily: the internal portfolio, bridge portfolio, and external portfolio. The internal portfolio is the most
liquid and yields the lowest return. The external portfolio yields the highest return and is for longer term
investments. The bridge portfolio is somewhere in between the external and internal portfolios in return
and liquidity.
The internal portfolio has three parts: a certificate of deposit program, an internal investment liquidity
pool, and a liquidity pool. Both of these parts are managed “internally” by DOI. As of November 24,
1999, the State’s certificate of deposit program held total time deposits of $2.085 billion. These
instruments are generally held to maturity and are not used to meet short-term liquidity needs. The overall
CD rate for Fiscal Year 1999 was 5.45 percent. The break down of investments is shown in Exhibit 3-71.
Exhibit 3-71Time Deposits in State’s Certificate of Deposit Program
Type CSP (2 Year) Renewal (1 Year) Total
Bank CDs 1.183 0.376 1.559
Savings and Loan CDs 0.434 0.092 0.526
Total 1.617 0.468 2.085

Business Case Study 3—Business Process ReengineeringCash Receipts and Cash Management
In addition, the State maintains an internal investment liquidity pool of $2.297 billion. These funds are
invested in short-term instruments to ensure that the State has ample liquidity to address immediate needs.
The overall rate for these funds was about 5.28 percent for Fiscal Year 1999.
Current Process
Cash receipt transaction workload factors included the annual number of bank deposits, journal transfers
(JTs), EFTs/WIREs, and credit card transactions.
The process cycle begins when the agency receives payment for goods or services rendered. Most
agencies code and deposit such receipts daily into the State’s concentration account at NationsBank.
However, there are exceptions. One example is field offices and districts located in rural areas that do not
have access to a NationsBank branch. Chapter 116.01 of the Florida Statutes and administrative rule 4C-1
allow these offices and districts the opportunity to deposit receipts in a convenient local bank and then
transfer such funds to the concentration account no later than 7 working days from the close of the week
in which the agency received the funds. This allows some offices to make deposits weekly rather than
daily.
After depositing the receipts, a FLAIR entry must be made to correspond with the deposit. The physical
location of the entry varies among agencies. Entries are made at either the central/headquarters cashier
office or at the field/district offices. Most agencies make receipt entries into individual supplemental
systems first and then make a FLAIR entry. The FLAIR entry is the last step of the process an agency
takes. However, the funds are not available until the State Treasurer verifies the deposit.
Each morning, the State Treasurer attempts to match bank deposits to FLAIR entries. When a match is
made, the FLAIR entry is verified. The availability of funds for agency use is the last step in the cycle
process.
Current Process Performance
The current average cycle time for making receipts available for expenditure ranges from 24 hours to 15
days. Timely and error-free deposits can be available to an agency as quickly as 24 hours or can take as
long as 15 days, as shown in Exhibit 3-72. If a deposit cannot be verified, the Treasurer will continue the
automatic verification process for 3 days. On the fourth day, the Treasurer’s office will call the agency
and notify it that a deposit was received but no corresponding FLAIR entry was made. The average cycle
time for most transactions is approximately 4 days.

Business Case Study 3—Business Process ReengineeringCash Receipts and Cash Management
Exhibit 3-72Workload and Performance Metrics for Cash Receipts
Agency Annual WorkloadAverage Cycle Time(Current)*
Department of Transportation ! 1,829 Deposits(110,310 Items)
! 4,462 JTs
! 362 WIREs
! 1,068 Credit Cards
1 to 2 Days
Department of Children and Families ! 17,527 Deposits
! 2,594 JTs
2 to 15 Days
Department of Highway Safety andMotor Vehicles
! 1,563 Deposits(406,288 Items)
! 499 WIREs
1 to 15 Days
Department of Insurance, Treasuryand State Fire Marshal
! 106,467
! Transactions Verified
1 to 4 Days
University of Florida ! 251 Deposits(230,056 Items)
! 5,069 Credit CardTrans.
! 2,570 Debit CardTrans.
3 to 4 Days
* Average cycle times vary according to workload factor (cost driver). Time presented is an average of workloadfactors (cost drivers)
Current Process Costs
The cost of the cash receipts and cash management process is derived by analyzing three cost
components: customer costs, agency costs, and centralized costs. Customer costs generally reflect the
time an individual spends completing a form or entering data to initiate a process. Agency costs reflect the
labor costs of the agency personnel devoted to carrying out the process. Centralized costs reflect the labor
costs of personnel who are located in a statewide administrative support agency and who participate in the
process statewide.
The cost analysis focuses on direct labor costs. Overhead and other indirect costs associated with the
process are excluded. The costs measured in the five study agencies are extrapolated to the rest of State
government based on workload factors that most affect the costs. The categories and the costs for the five
study agencies and for estimates of those categories and costs are described in the following paragraphs.
Customer Costs: The process does not include a customer cost as defined in this analysis.

Business Case Study 3—Business Process ReengineeringCash Receipts and Cash Management
Agency Costs: Agency costs are those costs incurred at the agency level. Agency costs include staff with
primary responsibility for carrying out the receiving, coding, verifying, depositing, and entering functions
of the process. This is the number of FTEs dedicated to the cash receipts process. To estimate the labor
cost associated with this process, we used the average salary and benefits for an Accountant II position—
$28,406.
The total number of FTEs dedicated to the cash receipts process at the five study agencies is 48 at the
central/headquarters level and 95 at the field/district level as indicated in Exhibit 3-73. Other costs include
technical support for the individual supplemental systems, data entry, and mailroom personnel associated
with the cash receipts process and network costs.
Exhibit 3-73Cost of Dedicated FTEs to Process
Agency Number of FTE Salary and Benefits Cost
Department of Transportation 5.5 $28,406 $156,000
Department of Children and Families 34.0 28,406 966,000
Department of Highway Safety andMotor Vehicles
90.5 28,406 2,571,000
Department of Insurance, Treasuryand State Fire Marshal
0.0 28,406 0
University of Florida 8.0 28,406 227,000
Total 138.0 – $3,920,000
We estimated the average ratio of transactions per FTE at DOT, DCF, and the UF at 752 to 1. This
estimate includes all transactions recorded and tracked by the DOT, DCF, and UF divided by the total
number of FTEs devoted to this process. We excluded the Department of Highway Safety and Motor
Vehicles and DOI from the calculation because of their unique functions. DHSMV processes a high
number of small dollar amount transactions all over the State, which requires that it have a significant
cash receipts staff. DOI has statewide responsibility for handling financial transactions. Using this ratio,
we estimate that there are 232.1 FTEs (including the 90.5 at DHSMV) devoted to cash receipts for this
process. The total cost is $6.6 million.
Centralized Costs: Centralized costs associated with the cash receipts process are those costs incurred by
the State Treasurer when verifying bank deposits, FLAIR entries, and bank adjustments and when
identifying WIREs and ACHs. The Department of Insurance, Treasury and State Fire Marshal has five
FTEs devoted to this process. At the average salary and benefits for an Accountant II of $28,406 per year,
the central labor costs associated with this process are approximately $142,000.

Business Case Study 3—Business Process ReengineeringCash Receipts and Cash Management
In total, the State annually expends an estimated $6.6 million in agency costs and $142,000 in centralized
costs to carry out the cash receipts and cash management processes.
Current Process Weaknesses
The following five major weaknesses associated with the State’s process for handling cash receipts are:
! Interagency receipts transfers: Interagency cash transfers are slow and inefficient. JTs tend to be amajor source of frustration and extra work to those responsible for verifying such transactions. Itis extremely difficult to verify and track JTs if they do not include complete and accurateinformation. The average time an employee in the Cash Receipts Department spends verifyingand reconciling JTs is approximately 5 hours a week or 20 hours a month
! Transaction type: A high proportion of transactions for the five study agencies are cash andchecks rather than electronic. Currently, 25 percent of the value of receipts is electronic and 75percent of it is checks or cash. This is an important statistic because, as mentioned earlier, the costto the customer (the agency) is the time that it takes for the funds to become available for use bythe agency. The State should modify the mix so that the percentage of check and cash receiptsdecreases significantly and the percentage of electronic receipts increases
! System support: FLAIR provides inadequate support for the cash receipts function. The State’sfinancial management system does not support cash receipt or cash management functionswithout the use of agency-specific supplemental systems. Operating such supplemental systemssometimes requires duplicative data entry. Agencies first enter receipts, deposits, and collectionsin their supplemental system and then either repeat the process manually and enter data in FLAIRor upload data from the supplemental system. This practice also requires network connectionaccess
! Investment policy: State law requires that the Treasurer offer to purchase certificates of depositfrom Florida-based banks and savings and loans (S&Ls). At 5.45 percent during FiscalYear 1999, these banks and S&Ls had a lower rate of return than the State’s external program,which was about 6.28 percent for Fiscal Year 1999
! Cash flow forecasting: The financial management system does not provide adequate informationfor cash flow forecasting purposes. Consequently, the State keeps more than $2.2 billion in liquidassets despite studies recommending that a lower amount be held
Without the use of agency-specific supplemental systems, it is difficult to sort, extract, and/or manipulate
data to generate needed management and performance reports. In general, FLAIR is not user friendly and
does not contribute to either cash receipt or cash management functions.

Business Case Study 3—Business Process ReengineeringCash Receipts and Cash Management
Reengineered Process
A high-level narrative summary of the reengineered process—which can include a series of individual
process changes—is presented. We also review steps in the reengineered process and discuss the human
(that is, impacts on individuals, work units, and external stakeholders) and technology resources involved.
Recommendation BPR-38: Make the acceptance of debit cards a statewide standard, withuse of credit cards a secondary option
The State can reduce the number of check transactions by enabling agencies (and by encouraging
customers) to accept credit or debit cards and other electronic payments for goods and services. This
should be accomplished in several ways:
! Require agencies to provide goods and services online wherever possible. Customers will be ableto accomplish a majority of their needs online, from any location, and pay electronically for suchgoods and services through a secure web site
! Require all agencies to make it convenient for walk-in customers who chose to pay electronically
! Reduce the threshold to $5,000 for businesses that transmit their sales taxes paymentselectronically. This threshold could be reduced over time
! Prohibit checks as a form of payment for selected transactions. For example, Georgia does notaccept checks for drivers’ licenses
Implementation of these recommendations would require that every agency be set up with the appropriate
equipment to process electronic payments and have terminals with Internet access available to walk-in
clients. Debit card payments can be either online (requiring a personal identification number) or offline
(not requiring a personal identification number). Online payments are more secure and result in faster
funds transfer, while offline payments are quicker (there is no wait for online approval) but can take 2
days before funds are transferred. The State should review both options to determine which is more
appropriate.
Electronic payment acceptance will significantly affect the receipt mix by increasing the percentage of
electronic receipts. According to the State Treasury, receipts during Fiscal Year 1999 totaled more than
$48.5 billion. Of that amount, $12 billion was in checks and some cash (checks account for more than 95
percent of the $12 billion). A significant portion of these receipts are taxes collected by the Department of
Revenue.
Increased electronic receipts will change the cash receipts process significantly, making electronic
receipts available within 24 hours or, in some instances, instantaneously. When a sale is made through the
Internet, the data associated with such a sale should be automatically entered into the accounting system,
thus eliminating many or all the steps currently taken to record receipts.
Business Case Study 3—Business Process ReengineeringCash Receipts and Cash Management
Fiscal Impact: Electronic payments will ultimately result in increased collection of funds, availability of
funds sooner, and a significant reduction in account receivables. A New York-based market analysis
company, E Marketer, predicts that business-to-business e-commerce will increase 1,575 percent during
the next 3 years and consumer-to-business e-commerce will increase from 100 to 500 percent according
to the commodity during the same period.
Based on the current rate of growth of e-commerce and its expected future growth and on the
implementation of the measures suggested in this recommendation, the State could reasonably expect to
convert 50 percent of its check receipts to cash or electronic receipts during the next 3 years. By changing
the mix of payments to the government from checks to cash and EFT/debit card transactions, the State
would decrease its float on $6 billion by an average of 3 days: 1 day for the check to clear and 2 days for
the agency to process it. This would yield increased interest earnings, based on a 5 percent return, of
about $2,473,000.
This recommendation anticipates savings from interest earnings; however, we do not expect any savings
in processing costs. The cost to process a debit transaction is not free, but is no more than (and usually
less than) the cost for processing a check. Because we do not have estimates of what it costs for the State
to process a debit card transaction versus a check, we have not calculated any savings associated with
streamlined processing through the use of debit cards. However, there would be some modest savings in
processing costs.
Recommendation BPR-39: Terminate the certificate of deposit program aimed at Floridabanks and S&Ls and transfer funds to the externally managed program
The State should end its program of giving preference to Florida institutions in the certificate of deposit
program. This would require a change to Chapter 18.10 of the Florida Statutes.
Fiscal Impact: For the last 7 fiscal years, the State lost an average of approximately $11,679,000 in CDs
with Florida institutions rather than investing these funds in the State’s externally managed program. If
the State had invested in the externally managed funds, it would have made a total of $81,750,000 more
in investment earnings or approximately $11,679,000 per year. We cannot forecast that this differential
will continue, but it is an estimate of the fiscal impact.
Recommendation BPR-40: Reduce funds in the internal investment liquidity pool andtransfer them to the externally managed funds
With better projections on cashflows through an improved financial management system and the faster
collection and clearing of receipts, the State should move an additional $1 billion to the bridge and/or
external program. This change does not require legislation.

Business Case Study 3—Business Process ReengineeringCash Receipts and Cash Management
Fiscal Impact: Long term, moving $1 billion from the internal to the external program could realize an
additional 100 basis points of annual return or $10 million per year for the State Treasury.
Recommendation BPR-41: Eliminate the transfer of State Trust Funds’ monies betweeninvested status and cash status with the State Treasurer
Agencies are currently required to routinely transfer State trust funds’ monies held by the State Treasurer
from invested status to cash status to meet ongoing obligations and from cash status to invested status to
have interest earned on State trust funds’ monies accrue to the benefit of the respective trust fund. Interest
earned on State trust funds’ monies held in cash status accrue to the General Revenue Fund.
The State Treasurer does not make actual investment decisions based on the agencies’ classifications of
funds. Thus, the primary purpose of the classifications is to designate the recipient of interest earnings.
Based on our analysis at the five study agencies, we estimate that the statewide cost of these routine
transfers is $504,000.
Fiscal Impact: The State should eliminate the requirement for agencies to designate the status of State
trust funds’ monies as either “invested” or “cash.” Interest should accrue to the State trust funds based on
actual balances held by the State Treasurer. The impact of lost interest earnings by the General Revenue
Fund can be offset by increasing the General Revenue Service charge to State trust funds. The State will
realize labor savings in the amount of $504,000 by eliminating these routine transfers.
Reengineered Process—System Requirements
The following system requirements are necessary for implementing the reengineering recommendations:
! Online acceptance of electronic payments for goods and services provided
! A fully integrated, web-based accounting and reporting system
! An updated accounting system to include enhanced functionality for managing receipts andeliminate the need for agency-specific supplemental systems. A fully integrated, web-basedaccounting and reporting system would eliminate the need for supplemental systems and wouldend inefficient duplicative data entry
! A fully integrated, web-based accounting and reporting system that would eliminate networkapplications and reduce network costs, decrease time and effort of technical staff currentlysupporting supplemental systems, facilitate decentralized data entry, decrease errors in data entry,enhance tracking, and produce accurate and timely reports
! An integrated accounting and reporting system that would reconcile credits and debitsautomatically between the financial accounts of two or more agencies, thereby facilitating journal

Business Case Study 3—Business Process ReengineeringCash Receipts and Cash Management
transfers for services provided or received. This would eliminate the need to spend approximately5 inefficient hours tracking and verifying JTs
Options Analysis
Based on the definition of the five options, we estimate that savings of $2.5 million from increased use of
debit cards and other electronic payments can be achieved in all the options. The savings depend on the
implementation of a web-enabled e-commerce solution. The $11.7 million in savings from elimination of
the certification of deposit program can also be achieved regardless of the option. The recommendation to
move $1 billion from the internal program to the external program can be implemented under Options 2
through 5. The savings depend on enhanced financial management information as well as reengineered
processes. The estimated savings of $504,000 achieved by eliminating the transfer of State trust funds’
monies between invested status and cash status with the State Treasurer can be realized in all options.
A summary of the cost impacts is shown in Exhibit 3-74.

Business Case Study 3—Business Process ReengineeringCash Receipts and Cash Management
Exhibit 3-74Summary of Annual Savings by Option
OptionBudgetary
SavingsIncreasedEfficiency
Total BPRSavings
Recommendation BPR-38
Option 1 $2,473,000 $0 $2,473,000
Option 2 2,473,000 0 2,473,000
Option 3 2,473,000 0 2,473,000
Option 4 2,473,000 0 2,473,000
Option 5 2,473,000 0 2,473,000
Recommendation BPR-39
Option 1 11,679,000 0 11,679,000
Option 2 11,679,000 0 11,679,000
Option 3 11,679,000 0 11,679,000
Option 4 11,679,000 0 11,679,000
Option 5 11,679,000 0 11,679,000
Recommendation BPR-40
Option 1 0 0 0
Option 2 10,000,000 0 10,000,000
Option 3 10,000,000 0 10,000,000
Option 4 10,000,000 0 10,000,000
Option 5 10,000,000 0 10,000,000
Recommendation BPR-41
Option 1 504,000 0 504,000
Option 2 504,000 0 504,000
Option 3 504,000 0 504,000
Option 4 504,000 0 504,000
Option 5 504,000 0 504,000
Total
Option 1 $14,656,000 $0 $14,656,000
Option 2 $24,656,000 $0 $24,656,000
Option 3 $24,656,000 $0 $24,656,000
Option 4 $24,656,000 $0 $24,656,000
Option 5 $24,656,000 $0 $24,656,000

Business Case Study 3—Business Process ReengineeringAccounts Receivable
3.17 Recommended Process Changes—Accounts Receivable
This section presents recommendations for reengineering the State of Florida’s accounts receivable
process.
Background
This process is used to manage and collect money owed for goods or services provided by State agencies
and State universities. Accounts receivable are classified as amounts due that have not been recouped
within 30 days of receipt of goods or services. Generally, Article 7, Section 10, of the State Constitution
prohibits the State from extending credit, except under certain conditions. Accounts receivable often
occur, however, when customers receive goods or services and pay for them with checks or credit cards
that are not cleared by the payee financial institution. Examples of receivables for the five study agencies
are presented in Exhibit 3-75.
Exhibit 3-75Accounts Receivable (Revenue) Sources by Agency
Agency Source of Revenue Owed
Department of Transportation Tolls, permits, fines
Department of Children and Families Overpayment of benefits, fees
Department of Insurance, Treasury and State FireMarshal
Administrative fines, examiner reimbursements
Department of Highway Safety and Motor Vehicles Data listings and crash accounts, drivers licenses
University of Florida Tuition, fines, campus department sales
Florida’s 1998 CAFR reported Primary Government accounts receivable at $4,122,161,000 (does not
include Component Units) and Allowance for Uncollectibles at $2,745,821,000. A substantial portion of
this accounts receivable number is made up of unemployment compensation taxes, retirement
contribution receivables, and child support payments. For the purposes of this analysis, we have
eliminated unemployment compensation taxes, retirement contribution receivables, and child support
payments to arrive at an accounts receivable total for Fiscal Year 1998 of $805 million. Retirement
contributions and unemployment compensation taxes represent primarily a delay in payment rather than
insufficient funds. Child support enforcement payments are unique and complicated because they involve
courts, child welfare agencies, and two parents.
Primarily, administrative rules and internal policies and procedures govern the accounts receivable
process. The State, however, must adhere to Generally Accepted Accounting Principles (GAAP). Write-
offs of uncollectibles are governed by Chapter 17.04 of the Florida Statutes.

Business Case Study 3—Business Process ReengineeringAccounts Receivable
FLAIR does not have an accounts receivable module. Consequently, accounts receivable information is
entered and maintained in agency-specific supplemental systems. FLAIR use is limited and in most cases
is not used at all. Currently, FLAIR is set up to record amounts owed up to 30 days but is not capable of
tracking and maintaining collection efforts or generating invoices and aging reports.
It is difficult to extract pertinent data from FLAIR and manipulate that data to generate daily, weekly,
monthly, or annual reports. Frustration by users of reports and those generating such reports lead
individual agencies to purchase or build supplemental systems to meet their needs, at costs ranging from
millions of dollars to less than $100 for purchasing off-the-shelf software.
Exhibit 3-76 indicates several of the supplemental systems being used, their purpose, and how they
interface with FLAIR.
Exhibit 3-76Agency Supplemental Systems to Facilitate Accounts Receivable Process
AgencySupplementalSystem Purpose
InterfacesWith
Department ofTransportation
Accounts ReceivableInvoice System
! Customeraccountsreceivable data
! Invoices
! Security depositdata
! FLAIR entries
FLAIR
Department of Childrenand Families
! FeeMaintenance System
! BenefitRecoverySystem
! Audit trail
! A/R journal pertransaction
! Claims owed
! Quarterly federalreports
! Managementreports
None
Department of HighwaySafety and MotorVehicles
Quickbooks ! Accountsreceivableinvoices
! Aging reports
! Payments
None
Department of Insurance,Treasury and State FireMarshal
– – –
University of Florida Student ReceivableSystem
! Studentreceivables
! Managementreports
None

Business Case Study 3—Business Process ReengineeringAccounts Receivable
Current Process
When accounts receivable are established, the information on the receivable is entered into the agency’s
accounts receivable supplemental system. Initial invoices are generated and mailed within 30 days. Initial
aging reports generated at the 45-day mark indicate which accounts are still outstanding. The timing of
aging reports and invoices varies among agencies. An analysis of the aging report initiates the generation
and mailing of follow-up invoices to facilitate collections. In general, this process is repeated every 30
days. Florida Administrative Code 3A.21.003 requires that accounts receivable more than 6 months old
be turned over to the Department of Banking and Finance.
Banking and Finance takes one of two actions when it receives an account from an agency. In most cases,
the Department uses a vendor under contract to perform collection activities. If and when an account is
determined to be uncollectible, Banking and Finance authorizes the agency to write off the account.
Current Process Performance
The workload factors of accounts receivable transactions consist of the number of receivable transactions
for Fiscal Year 1999. The variation in agency procedures dictates the current average cycle time
associated with the collection process. Cycle times range from 30 days to 3 years as depicted in
Exhibit 3-77. The process cycle ends upon receipt of a receivable or the write-off of a receivable.
Exhibit 3-77Workload and Performance Metrics for Accounts Receivable
Agency
Annual Workload(Individual Accounts
Receivable)
Average Cycle orTransaction Cost
(As-Is)
Department of Transportation 39,360 45 to 75 days
Department of Children and Families (including all districts) Cannot determine Do not write off
Department of Highway Safety and Motor Vehicles 20,495 30 to 90 days
Department of Insurance, Treasury and State Fire Marshal Cannot determine Do not track
University of Florida 357,793 30 days to 3 years
Current Process Costs
The cost of the accounts receivable process is derived by analyzing three cost components: customer
costs, agency costs, and centralized costs. Customer costs generally reflect the time an individual spends
completing a form or entering data to initiate a process. Agency costs reflect the labor costs of agency

Business Case Study 3—Business Process ReengineeringAccounts Receivable
personnel devoted to carrying out the process. Centralized costs reflect the labor costs of personnel who
are located in a statewide administrative support agency and who participate in the process statewide.
Customer Costs: This process does not include a customer cost as defined in our analysis.
Agency Costs: Agency costs reflect the number of FTEs dedicated to the accounts receivable process.
These staff members are responsible for tracking, managing, collecting, and reporting on accounts
receivable. The total number of FTEs dedicated to the accounts receivable process at the five study
agencies is 45, as shown in Exhibit 3-78. Based on the current average salary and benefits of $28,406 for
an Accountant II in the Florida State government, calculations show the total labor cost for the accounts
receivable process in the five study agencies is $1.3 million.
According to the State Comptroller’s listing of accounts receivable by agency for Fiscal Year 1998, the
study agencies accounted for $532.9 million. This amount represents 66.1 percent of the $805.8 million in
Fiscal Year 1999 accounts receivable included in this analysis. Using the ratio of staff to accounts
receivable in the five study agencies, we estimate that 68 FTEs are devoted to the accounts receivable
function statewide. This translates to a total statewide labor cost for this process of approximately
$1,800,000. Additional costs that are directly related to the process include fees and commissions paid to
private collection agencies.
Exhibit 3-78Cost of Dedicated FTEs to Process
Agency # FTE Salary & Benefits Cost
Department of Transportation 4 $28,406 $114,000
Department of Children and Families 19 28,406 539,000
Department of Highway Safety and Motor Vehicles 4 28,406 114,000
Department of Insurance, Treasury and State Fire Marshal 0 28,406 0
University of Florida 18 28,406 511,000
Total 45 $1,278,000
Centralized Costs: Centralized costs associated with the accounts receivable process include the one FTE
in the Department of Banking and Finance associated with write-offs and managing collection agencies.
Other centralized costs include those costs incurred 1 day a year to get accounts receivable information
into the CAFR.
In total, the State expends an estimated $1.9 million in agency costs and $51,000 in centralized costs to
carry out accounts receivable processes.

Business Case Study 3—Business Process ReengineeringAccounts Receivable
Current Process Weaknesses
The major weaknesses of the State’s accounts receivable function include the following:
! A person or a vendor can owe one State agency and receive services from another
! The accounting system does not have the functionality to support the accounts receivable function
! Agencies’ approaches to accounts receivable vary widely
An individual or entity that owes one State agency can easily obtain goods or services from most other
State agencies. Exceptions exist in child support enforcement and State taxes; but without a centralized
database, these exceptions are difficult to enforce. Because the accounts receivable information is
maintained for the most part at the agency level, agencies can and do refuse service to an entity that owes
it money. When an entity owes one State agency and seeks services from another, the second agency is
unlikely to know that the entity has an outstanding debt with the first agency.
FFMIS and FLAIR in particular do not support collection management and reporting functions and must
be supplemented with agency-specific systems. Without the use of agency-specific supplemental systems,
it is extremely difficult to sort, extract, and manipulate data to generate needed management and
performance reports.
The private collection agency under contract to perform collections for the Department of Banking and
Finance is not the State’s exclusive vendor. Numerous contracts exist with private collection agencies.
The fee or commission structure for services provided is quite inconsistent. Fees and commissions
charged directly to an agency range from 10 to 30 percent. The vendor under contract to the Department
of Banking and Finance charges the fee to the debtor, rather than the State or agency, which enables the
State or agency to collect 100 percent of the overdue amount.
Reengineered Process
To address the weaknesses with the current process, the State of Florida should establish a statewide
policy for accounts receivable, implement a “clean hands” law, and make debit cards a standard for
payment throughout the State. These recommendations are discussed in more detail in the following
paragraphs.
Recommendation BPR-42: Establish an enterprisewide policy for accounts receivable
The State should centralize responsibility of all accounts receivable (excluding benefit recovery, fee
maintenance, unemployment compensation taxes, retirement contribution receivables, and child support
enforcement) with the Department of Banking and Finance. An agency should send no more than one
notice to a delinquent debtor before assigning the account to Banking and Finance (typically after 60

Business Case Study 3—Business Process ReengineeringAccounts Receivable
days). The Department should then contract with a select number of vendors to maintain collections
statewide. The contracts should be similar to the one currently in effect, charging the debtor for the
service rather than the State.
Exceptions to this 60 day policy are inevitable (for example, student debts at the SUS) and should be
granted to agencies accordingly. Banking and Finance will be responsible for granting such exceptions.
Fiscal Impact: An enterprisewide policy would eliminate the use of numerous collection agencies at the
agency level. The cost of managing the collection agencies would decrease through centralization. FTEs
dedicated to collections at the study agencies expend approximately 10 percent of their time tracking
receivables 60 days or more past due. Through centralization, agencies would devote fewer resources to
the collection function. Of the 45 FTEs in the study agencies who are dedicated to the collection
functions, we estimate that agencies will need 10 percent fewer FTEs when collection functions are
centralized. This is a reduction of 4.5 FTEs for the study agencies and 6.8 FTEs statewide for a savings of
approximately $193,000 annually.
Recommendation BPR-43: Implement a clean hands law giving the State authority todeny certain services (statewide) until the requestor’s hands are clean
To implement this recommendation, the State must first capture statewide accounts receivable
information on a centralized database. The Department of Banking and Finance would manage the
centralized data warehouse of entities that owe the State. Certain goods and services would be denied
requestors if they owe the State. The data warehouse would be accessible by all agencies to review the
status of a vendor or an individual. Some services, particularly those related to social services, would be
exempted under the clean hands policy.
Fiscal Impact: Allowance for uncollectibles in 1998 increased $118 million. We believe that
implementation of this act will have a significant fiscal impact by decreasing the level of uncollectibles
each year. No good benchmarks are available for measuring the effect of this recommendation and we did
not estimate any related savings.
Reengineered Process: System Requirements
Implementation of the reengineered process would require some changes in the State’s financial
management system. Key system requirements necessary to support these recommendations include:
! A statewide accessible, centralized data warehouse of individuals and entities that owe money tothe State
! Online acceptance of electronic payments for goods and services provided

Business Case Study 3—Business Process ReengineeringAccounts Receivable
! Integration of debit card receipt with the State’s accounting system
! Accounts receivable function integrated with the statewide financial management system
Setting-up and maintaining the data warehouse will require an initial investment but can yield significant
results.
Options Analysis
Based on the definition of the five options, we estimate that the total savings of $0.2 million from
reengineering can be achieved in all the options. Exhibit 3-79 shows the savings associated with the
accounts receivable process.

Business Case Study 3—Business Process ReengineeringAccounts Receivable
Exhibit 3-79Summary of Savings by Option
OptionBudgetary
SavingsIncreasedEfficiency
Total BPRSavings
Recommendation BPR-42
Option 1 $0 $193,000 $193,000
Option 2 0 193,000 193,000
Option 3 0 193,000 193,000
Option 4 0 193,000 193,000
Option 5 0 193,000 193,000
Recommendation BPR-43
Option 1 0 0 0
Option 2 0 0 0
Option 3 0 0 0
Option 4 0 0 0
Option 5 0 0 0
Total
Option 1 $0 $193,000 $193,000
Option 2 $0 $193,000 $193,000
Option 3 $0 $193,000 $193,000
Option 4 $0 $193,000 $193,000
Option 5 $0 $193,000 $193,000

Business Case Study 3—Business Process ReengineeringAsset Management
3.18 Recommended Process Changes—Asset Management
This section presents recommendations for reengineering the State of Florida’s asset management
process.
Background
Government organizations have traditionally identified and tracked fixed assets for two primary reasons.
The first is to provide information on capitalized assets for financial reporting purposes and the second is
to track the amount of missing, lost, or stolen assets. To accomplish these objectives, governments
typically set a fixed asset or capitalization threshold to identify the assets that should be tracked for
financial reporting and control purposes.
The State of Florida’s asset management process is governed by Florida Statutes, Chapter 273 and
Chapter 10.300 of the Rules of the Auditor General. The State currently defines an asset as an item with a
unit cost greater than $1,000 and a useful life more than 1 year. Before July 1, 1999, the asset threshold
was $500.
Currently, State agencies use the property subsystem in FLAIR to process and track assets. The property
subsystem is integrated with other accounting subsystems, allowing some accounting information to be
passed between the accounting and property subsystems. Some agencies use other systems or tools to
assist in managing or processing assets. Each of the study agencies used some form of bar-code software
to assist in the annual inventory process. Other agencies, such as the University of Florida, have external
databases to assist in reporting.
Current Process
The asset management process begins when an agency acquires a fixed asset. Assets are generally
acquired through the procurement process, but in some cases assets are received through donations or
grant programs. Assets acquired through the procurement process start with an individual preparing a
requisition. The purchase requisitions are generally processed in the agency’s purchasing office. The
supporting documentation generated in the procurement process is forwarded to a property unit where it
waits in a pending status.
After the asset is received, the agency begins the process of paying the vendor. Before the vendor is paid,
the necessary information is input into the FLAIR Departmental Accounting System to record the
accounting transaction and produce a warrant. The FLAIR Departmental Accounting System generates an
electronic pending file that is sent to the property subsystem. The hard copy documentation is also
forwarded to the property unit for further processing. The property unit inputs the nonaccounting

Business Case Study 3—Business Process ReengineeringAsset Management
information into the electronic pending file created by the accounting transaction. The acquisition process
is completed when the property record is created in the property master file.
Throughout the life of an asset, several activities are performed to manage and control the asset. Property
records must be updated throughout the life of the asset to reflect changes to the following:
! Location
! Property custodian
! Lost, missing, or stolen
Current Process Performance
The following is a description of the major activities in the asset management process:
! Acquisition—The process that occurs when an agency establishes ownership of an asset;examples of methods of acquisition include purchases and donations
! Transfers/changes—The process of transferring ownership of an asset within an agency orchanging a field on a property record (for example, condition)
! Inventory—The process of physically counting all assets (currently, required annually)
! Dispositions—The process of disposing or retiring an asset
Exhibit 3-80 provides annual workload information by agency for each of the four subprocesses
described.

Business Case Study 3—Business Process ReengineeringAsset Management
Exhibit 3-80Workload and Performance Metrics for Asset Management
Agency Assets Acquisitions Transfers Dispositions
Department of Transportation 56,000 11,005 9,575 4,676
Department of Children and Families 82,000 3,852 0 2,834
Department of Highway Safety and Motor Vehicles 58,000 5,525 5,165 7,227
Department of Insurance, Treasury and State FireMarshal
7,500 1,369 800 628
University of Florida 122,000 16,801 2,970 9,028
Total 325,500 38,552 18,510 24,393
Source: KPMG Interviews of asset management and accounting personnel at DOT, DCF, DHSMV, DOI, and UF, 1999
Current Process Costs
The cost of the current asset management process is derived by analyzing three cost components—
customer costs, agency costs, and centralized costs. These costs are estimated in the agencies that were
part of the study and then extrapolated to entire State government. Customer costs generally reflect the
time an individual spends completing a form or entering data to initiate a process. Agency costs reflect the
labor costs of the agency personnel devoted to carrying out the process. Centralized costs reflect the labor
costs of personnel who are located in a statewide administrative support agency and who participate in the
process statewide.
The cost analysis focuses on direct labor costs. Overhead and other indirect costs associated with the
process are excluded. The costs measured in the five study agencies are extrapolated to the rest of State
government based on workload factors that most affect the costs. The categories and the costs for the five
study agencies and for estimates of those categories and costs statewide are described in the following
paragraphs.
Customer Costs: Customer costs consist of the time it takes a person requesting or transferring property
to complete the necessary paperwork. A property custodian, who is the individual primarily responsible
for the asset, most often completes the necessary paperwork. Paperwork is needed for all transactions (for
example, acquisition, transfers, and dispositions).
The customer costs of the five study agencies are estimated to be $208,000, assuming it takes 10 minutes
to complete the necessary paperwork. Exhibit 3-81 indicates the customer costs for each study agency.
Through extrapolation, it is estimated that there are 39.48 FTEs statewide.

Business Case Study 3—Business Process ReengineeringAsset Management
Exhibit 3-81Customer Costs
Agency Acquisitions Transfers Dispositions Total Hours Cost*
Department of Transportation 11,005 9,575 4,676 25,256 4,209 $64,000
Department of Children andFamilies
3,852 0 2,834 6,686 1,114 17,000
Department of HighwaySafety and Motor Vehicles
5,525 5,165 7,227 17,917 2,986 46,000
Department of Insurance,Treasury and State FireMarshal
1,369 800 628 2,797 466 7,000
University of Florida 16,801 2,970 9,028 28,799 4,800 74,000
Total 38,552 18,510 24,393 81,455 13,576 $208,000
Source: KPMG interviews of asset management and accounting personnel at DOT, DCF, DHSMV, DOI, and UF, 1999
*Cost assumes average annual salary and benefits of an Accountant II of $28,406
Agency Costs: Agency costs consist of dedicated property staff who handle the asset management
transactions and other staff used for inventory purposes. A dedicated property staff member is defined as
a person who spends at least 75 percent of his or her time on property-related duties. As illustrated in
Exhibit 3-82, the estimated asset management costs for the five study agencies are $1.7 million.
Exhibit 3-82Asset Management Costs for Five Study Agencies
AgencyProperty
StaffInventory
Staff Cost*
Department of Transportation 3 3 $ 170,000
Department of Children and Families 28 4 908,000
Department of Highway Safety and Motor Vehicles 3 3 170,000
Department of Insurance, Treasury and State Fire Marshal 2 0 57,000
University of Florida 7 7 398,000
Total 43 17 $1,703,000
Source: KPMG interviews of asset management and accounting personnel at DOT, DCF, DHSMV, DOI, and UF, 1999
*Cost assumes average annual salary and benefits of an Accountant II of $28,406
The number of inventory staff is based on the assumption that one staff member counts 17,429 assets per
year.
Asset management costs for the remaining State agencies are estimated at $2.8 million based on the
following assumptions:
! Agencies average two dedicated property staff members. Total estimated staff of 88 (44 agenciestimes two staff members) at a cost of $2.5 million

Business Case Study 3—Business Process ReengineeringAsset Management
! There are 870,000 assets in the remaining agencies. Total estimated staff of 50 FTEs required
Asset management costs for all State agencies are illustrated in Exhibit 3-83.
Exhibit 3-83Statewide Asset Management Costs
DedicatedProperty Staff
InventoryStaff Cost*
Study Agencies 43 17 $1,704,000
Remaining Agencies 88 50 3,920,000
Total 131 67 $5,624,000
Source: KPMG interviews of asset management and accounting personnel at DOT, DCF, DHSMV,DOI, and University of Florida, 1999
*Cost assumes average annual salary and benefits of an Accountant II of $28,406
Centralized Costs: We identified no significant centralized costs for this process.
Current Process Weaknesses
The major weakness in the State’s asset management process is that agencies track more assets than
necessary to meet their business and financial objectives. For financial reporting purposes, the current
asset threshold level includes a large number of assets that do not affect the State’s financial condition
substantially. Based on the five study agencies reviewed, conclusions are that 80 percent of the assets
tracked account for less than 20 percent of the value of all fixed assets.
The practice of capitalizing assets as a method for controlling assets also needs to be reviewed. Although
it is the government’s responsibility to maintain a level of control over assets to minimize the amount of
loss, theft, or misuse, the costs and benefits of including these assets within the capitalization threshold
should be compared. As shown in Exhibit 3-83, the total cost to manage the State’s assets is estimated at
$5.8 million annually.
The outcome of maintaining inventory records leads to a better understanding of the number of missing or
stolen items; however, the practice of tracking and counting assets does little to prevent mishandling of
assets. Tracking and counting assets is a reactive method for managing assets because it only deals with
assets after they become missing or stolen. The historical method of tracking assets is a detective control
that only identifies what is missing and not why it is missing or where it is. Organizations are developing
more preventive controls and proactive methods for controlling assets such as establishing and
maintaining adequate control procedures at the appropriate levels of each agency. Other methods such as
using radio frequencies to track computers are designed to minimize asset loss or theft before it occurs.

Business Case Study 3—Business Process ReengineeringAsset Management
Another weakness of the asset management process is that asset management transactions (for example,
acquisitions, transfers, and disposals) are paper driven and manual. All asset transactions are initiated by
completing a paper form requesting a specific action. To complete a transaction, personnel must prepare
and review the appropriate form and input it into the appropriate system to create or update property
records.
Paper-driven processes such as these are more resource intensive and slower than processes that have
eliminated the need for paper. Paper-driven processes are used by the State for two primary reasons:
! Insufficient information systems
! Need for paper documentation for approval and audit purposes
Modern property systems enable organizations to distribute work by providing easy access to systems
throughout the organization. These systems allow information to be captured at the source of the
transaction, therefore eliminating the need for additional manual tasks. The systems automate the
approval process by providing the ability to develop online approval paths based on asset type or cost.
Other controls include improved security through the use of user class and user IDs. These controls can
restrict user access to specified data or transactions types. These capabilities eliminate the need for review
and approval of paper documents.
Using new technologies, such as web-based applications, provides a cost-effective method to give a large
number of people access to applications regardless of their location.
Another weakness of the asset management process is that the agencies use excessive resources to
conduct the annual inventory. State Statutes mandate that all assets be physically counted every year.
Physically counting every asset every year requires significant time and resources. The State spends an
estimated $2 million in personnel costs to conduct the annual inventory of all assets. The output from
these efforts is an understanding of the number of lost, stolen, or missing items.
Management can get the same understanding of the extent of lost, stolen, or missing items from a sample
of inventoried items. Using a rotating inventory schedule will ensure that all assets are physically counted
at least once, but not necessarily every year.
The agencies currently use a perpetual inventory system that constantly updates additions, deletions, and
changes to assets. Effective use of perpetual inventory systems can reduce the need for an annual physical
count of all assets.
Another weakness in the asset management area is the lack of warranty tracking. Of the five study
agencies, only one used the current system to track warranty information. The remaining agencies either

Business Case Study 3—Business Process ReengineeringAsset Management
tracked warranty information manually or not at all. No consistent policies and procedures mandated the
tracking of warranty information.
Tracking warranties on assets is an important part of effective asset management. Warranties can reduce
the cost of maintenance and provide information on required maintenance schedules.
Reengineered Process
To reengineer the asset management process, the State would have to make a dramatic change to the
definition of an asset, change the way it conducts inventory, and enhance the integration of the property
management system with the procurement and accounting systems.
Recommendation BPR-44: Raise the capitalization threshold to the $5,000 limitrecommended by GFOA
By raising the capitalization threshold to $5,000, the State can eliminate approximately 80 percent of the
assets that need to be tracked, while still capturing over 80 percent of the State’s asset value for financial
reporting purposes. Exhibit 3-84 shows the number of assets that would be tracked for the five study
agencies at the $1,000 and $5,000 capitalization thresholds.
The State should rely on other means to address the need to protect and control desirable assets such as
computers. Strict policies and procedures should be developed and enforced. Other methods such as
tracking computers through local area networks or using computers that can be tracked by radio
frequency are more proactive and effective methods for controlling and protecting these assets.
Increasing the capitalization threshold would reduce the current processing and inventory workload of the
agencies significantly, while meeting the requirements for financial reporting purposes. Implementing this
recommendation would require a change in the Florida Statutes, which currently mandate a capitalization
threshold level of $1,000. The recommendation does not require raising the operating capital outlay
(OCO) limit to $5,000.
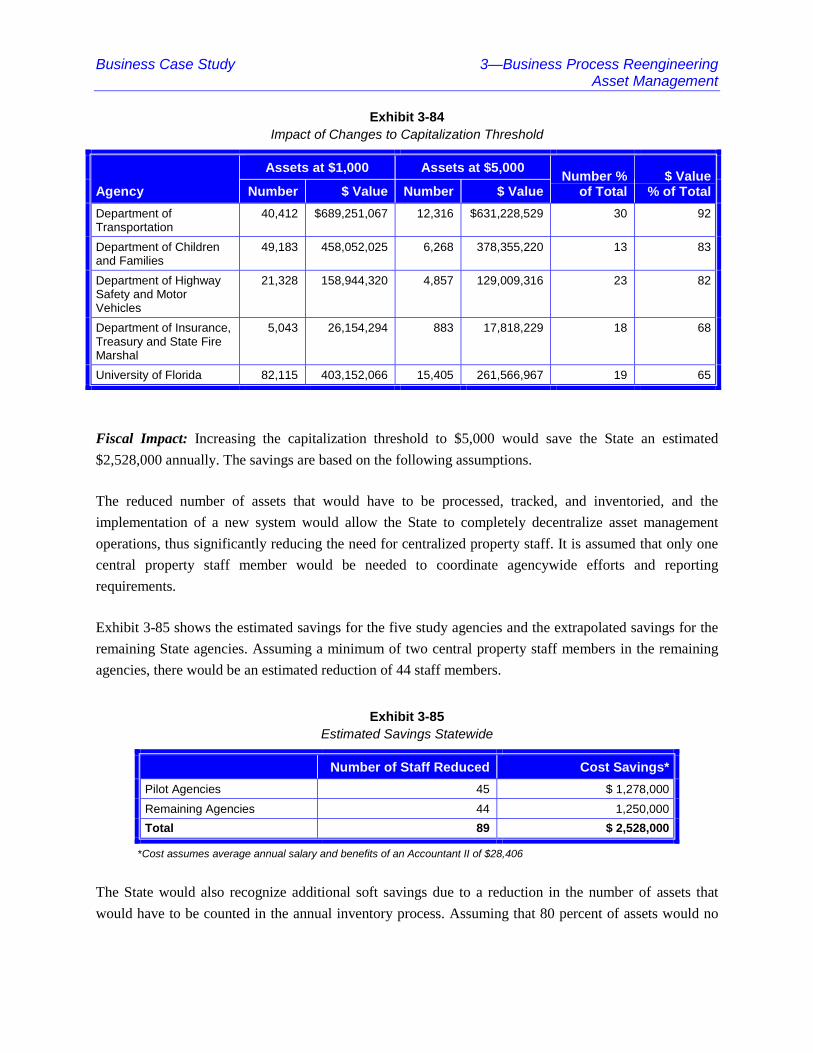
Business Case Study 3—Business Process ReengineeringAsset Management
Exhibit 3-84Impact of Changes to Capitalization Threshold
Assets at $1,000 Assets at $5,000
Agency Number $ Value Number $ ValueNumber %
of Total$ Value
% of Total
Department ofTransportation
40,412 $689,251,067 12,316 $631,228,529 30 92
Department of Childrenand Families
49,183 458,052,025 6,268 378,355,220 13 83
Department of HighwaySafety and MotorVehicles
21,328 158,944,320 4,857 129,009,316 23 82
Department of Insurance,Treasury and State FireMarshal
5,043 26,154,294 883 17,818,229 18 68
University of Florida 82,115 403,152,066 15,405 261,566,967 19 65
Fiscal Impact: Increasing the capitalization threshold to $5,000 would save the State an estimated
$2,528,000 annually. The savings are based on the following assumptions.
The reduced number of assets that would have to be processed, tracked, and inventoried, and the
implementation of a new system would allow the State to completely decentralize asset management
operations, thus significantly reducing the need for centralized property staff. It is assumed that only one
central property staff member would be needed to coordinate agencywide efforts and reporting
requirements.
Exhibit 3-85 shows the estimated savings for the five study agencies and the extrapolated savings for the
remaining State agencies. Assuming a minimum of two central property staff members in the remaining
agencies, there would be an estimated reduction of 44 staff members.
Exhibit 3-85Estimated Savings Statewide
Number of Staff Reduced Cost Savings*
Pilot Agencies 45 $ 1,278,000
Remaining Agencies 44 1,250,000
Total 89 $ 2,528,000
*Cost assumes average annual salary and benefits of an Accountant II of $28,406
The State would also recognize additional soft savings due to a reduction in the number of assets that
would have to be counted in the annual inventory process. Assuming that 80 percent of assets would no

Business Case Study 3—Business Process ReengineeringAsset Management
longer need to be inventoried, the cost of inventory could be reduced by 80 percent, or an estimated
savings of $1,009,000 annually.
Recommendation BPR-45: Adopt a rotating inventory schedule
The schedule should be set to count each asset once every 2 years. Counting assets every 2 years would
provide the same benefits of the current process, but would reduce the workload by 50 percent.
To implement this recommendation, the State must change the existing legislation that mandates agencies
to conduct a physical inventory of all assets every year. By using a rotating physical inventory, the
agencies could reduce the number of assets that must be counted each year and therefore reduce the
number of resources used to conduct inventory.
Fiscal Impact: By counting each asset an average of every other year, the agencies could reduce the
number of assets that need to be counted by approximately 50 percent. A 50 percent reduction in assets
could reduce the number of staff time required by 50 percent, resulting in estimated savings of $505,000.
Recommendation BPR-46: Improve the integration of procurement, accounting, andasset management systems
Improved integration would allow much information to be captured during the purchasing and accounting
events, thereby eliminating the need for paper forms and central data input of nonaccounting information.
Fiscal Impact: Capturing the necessary accounting and nonaccounting information during the purchasing
process would save resources by reducing the need to capture the information centrally. For the five study
agencies, the estimated savings from this recommendation are $178,000. The savings are based on the
assumption that it currently takes 5 minutes to process a new asset or transfer an asset to another property
custodian.
The reengineered asset management process leverages improved technology and focuses on the minimum
amount of workload necessary to accomplish the required business objectives. The decreased workload
and web-based property management system would enable the agencies to achieve significant savings by
reducing the amount dedicated property staff required. Because of the increase in the capitalization
threshold, the existing staff in the agencies would be able to absorb the additional workload of processing
and tracking their own assets.
Reengineered Process—System Requirements
This section outlines the system requirements that need to be present in a new financial management
system to realize the cost savings. A new system must be accessible to agency staff in remote locations or

Business Case Study 3—Business Process ReengineeringAsset Management
facilities and have a sufficient level of integration with the procurement and accounting systems. The
integration with the purchasing and accounting systems is key to eliminating paper from the process and
related data entry activities. A common method for providing cost-effective access to many users is to
develop a web-enabled system.
Options Analysis
Two of the reengineering recommendations discussed previously are independent of the system options:
! Raising capitalization threshold to $5,000
! Conducting inventory on a rotating basis
These recommendations require changes to current statutes. Any savings from these recommendations
will be realized regardless of the system option.
The recommendation to improve the current system’s integration with the accounting and purchasing
systems would be affected by the system option chosen. The recommendation and related savings can be
achieved with system Options 3, 4, and 5.
The savings and estimated additional implementation costs are given in Exhibit 3-86.

Business Case Study 3—Business Process ReengineeringAsset Management
Exhibit 3-86Summary of Annual Savings by Option
OptionBudgetary
SavingsIncreasedEfficiency
Total BPRSavings
Recommendation BPR-44
Option 1 $2,528,000 $1,009,000 $3,537,000
Option 2 2,528,000 1,009,000 3,537,000
Option 3 2,528,000 1,009,000 3,537,000
Option 4 2,528,000 1,009,000 3,537,000
Option 5 2,528,000 1,009,000 3,537,000
Recommendation BPR-45
Option 1 0 505,000 505,000
Option 2 0 505,000 505,000
Option 3 0 505,000 505,000
Option 4 0 505,000 505,000
Option 5 0 505,000 505,000
Recommendation BPR-46
Option 1 0 0 0
Option 2 0 0 0
Option 3 0 178,000 178,000
Option 4 0 178,000 178,000
Option 5 0 178,000 178,000
Total
Option 1 $2,528,000 $1,514,000 $4,042,000
Option 2 $2,528,000 $1,514,000 $4,042,000
Option 3 $2,528,000 $1,692,000 $4,220,000
Option 4 $2,528,000 $1,692,000 $4,220,000
Option 5 $2,528,000 $1,692,000 $4,220,000

Business Case Study 4—IT Assessment
Final ReportPage 4-1
kpmg
4. IT Assessment4.1 Introduction
The IT Assessment required KPMG to understand and document current FFMIS subsystems. The
assessment included analyzing the costs, performance, systems, data, infrastructure, key management
processes, plans, and supporting IT organizations. KPMG also conducted a survey of FFMIS users to
assess their satisfaction with the current systems.
The methodology used in the assessment phase included interviews, application inventory forms,
management practices workshops, functional quality (FQ) questionnaires, a technical quality (TQ) tool,
document reviews, site surveys, and the capturing of FFMIS IT costs. We have summarized the results of
the assessment activities in this section. The tools used are described below.
Interviews: Interviews were conducted with:
! FFMIS IT leaders and functional owners to identify and gather information about customers, keyfunctions, reporting, interfaces, limitations, issues, and key initiatives
! IT leaders of each FFMIS subsystem to identify and gather information about their technologyinfrastructure, IT organization, IT processes, strategic plan, and strengths and areas of opportunity
! IT leaders of the study agencies to identify and gather information about their technologyinfrastructure, IT organization, network and desktop environment, FFMIS subsystem usage,FFMIS support, shadow systems, FFMIS interfaces, and FFMIS costs
Application Inventory Forms: An inventory form was completed for each FFMIS subsystem and selected
exception systems. The exception systems primarily focused on the human resource and payroll systems
used at the State University System, the Legislature, and the Office of the Auditor General. The main
categories of the form included number of users, number of interfaces, date of implementation,
programming language, database system, hardware platform, network topology, and user interface
information.
Management Practices Workshops: KPMG conducted two management practice workshops with each of
the FFMIS subsystem owners. One workshop focused on the processes used by the application
development and maintenance groups. Key processes included project management, change management,
documentation, process measurement, system design and development, methods, and tools. The other
workshop focused on infrastructure support processes such as configuration management, capacity
management, change management, problem management, backup and recovery, information security,
training, and help desk support.

4—IT Assessment Business Case Study
Final ReportPage 4-2
kpmg
Functional Quality Questionnaires: FQ questionnaires were sent to approximately 400 key and active
users of the FFMIS subsystems covering each agency or entity. More than 300 were returned and
provided significant insight on the strengths and weaknesses of the systems. The questionnaires also
allowed for the respondent to specify potential areas of improvement and assess how well the system
meets current and future needs. The improvement suggestions have not been reviewed for validity,
complexity, or importance.
Technical Quality Tool: The TQ tool was used at workshops with each FFMIS IT organization’s
application development and maintenance leaders. The tool allows KPMG to assess the soundness and
quality of the application. The specific categories included accuracy, compliance to standards, ease of
update, problem analysis, security, performance, testing, and reliability.
Document Reviews: During the initial phase of the study, a Project Initiation Document Request form
was sent to each of the functional owners of the five FFMIS subsystems requesting information about the
primary functions supported by each subsystem, specific requirements/specifications documentation,
primary data entities sorted, end-user reporting requirements and reports, hardware, operating systems,
data architecture and network schematics, programming languages, database file formats, and planned
and ongoing application initiatives. This data was reviewed and relied upon as a primary reference by the
Business Process Reengineering and Information Technology BCS teams. Additional information was
obtained from publicly available online State documentation, standard industry research channels such as
GartnerGroup, Giga, and Forrester, and from KPMG.
Site Surveys: Site surveys were conducted at each data center used for FFMIS processing. The surveys
helped gather information about the State’s ability to provide a secure and hardened physical environment
that meets the demands of the FFMIS subsystems.
Capture Costs: An analysis form was created to capture detailed costs incurred for processing and
supporting the FFMIS subsystems. The cost categories include hardware, software, network, desktop, and
staffing.

Business Case Study 4—IT Assessment
Final ReportPage 4-3
kpmg
4.2 IT Assessment Findings
The following are the IT findings that were derived from observations made during the data gathering
process. Some findings may not be directly related to FFMIS subsystems but are relevant in the context of
an enterprisewide approach to information technology. KPMG’s findings are presented in four categories:
! FFMIS subsystems
! Information technology processes
! Information technology infrastructure
! Information technology organization
A review of the FFMIS subsystems showed that the functionality of these subsystems can be improved.
Detailed scores of both the functional and the technical qualities of these subsystems were gathered in
workshops with State personnel. The scores have been compiled and summarized in Exhibit 4-1 to
indicate the subsystems’ overall fitness from the users’ perspective.
The detailed scoring for each subsystem is presented in Section 4.8.
Exhibit 4-1Opportunities for Improvement
1
2
3
4
5
1 2 3 4 5
Technical Quality
Fu
nc
tio
na
l Qu
alit
y
Improvement Target Area
Technical Reengineering Healthy
Replacement Functional Enhancement
COPESView
SPURSView
Vendor Bid System
LAS/PBS
SPURS
COPES
CMSFLAIR DA
FLAIR IWFLAIR CA
FLAIR PR

4—IT Assessment Business Case Study
Final ReportPage 4-4
kpmg
Although there are significant opportunities for improvement, the FFMIS subsystems do what they were
designed to do quite well, which is to process large amounts of financial data and transactions. Despite
inhibitors such as recruitment and retention of skilled IT staff and use of older technology, the FFMIS
subsystems are stable and provide consistent performance to their users. In addition, support staffs have
introduced new technology such as client/server and web applications to provide improved reporting and
functionality. IT organizations have been gradually moving away from older network and desktop
technology. The FFMIS subsystems’ data centers are physically secure and environmentally hardened
(raised floor, fire protection, and electric backup); some have advanced disaster avoidance methods.

Business Case Study 4—IT Assessment
Final ReportPage 4-5
kpmg
4.3 Option Descriptions
The State’s scope of work for the BCS described five options to evaluate:
! Maintain the existing system as-is
! Enhance the existing system
! Build a new custom integrated system
! Implement a COTS ERP solution
! Implement a best of breed solution
KPMG worked with the State to define a detailed description of each of these options. KPMG began the
process by creating a draft description of each option. The draft was reviewed with the Study Advisory
Council members and their comments solicited. The definitions also were reviewed with the IT leaders of
the FFMIS subsystems and the Governor’s Chief Information Officer (CIO). Feedback from all sessions
was incorporated to create the following options descriptions.
Option 1: Maintain the current systems as-is with no major modifications orupgrades
This option assumes little or no modification to existing systems and assumes that enhancements to
business functions and practices will not occur. It implies that IT owners and functional owners will
conduct business as usual. The level of effort to enter data, reconcile systems, and process paper will not
change. The characteristics of this option follow:
! Maintenance of the current legacy systems as-is with no major modifications
! Continued use of current systems by the three branches of State government including the StateUniversity System
! Limited number of minor modifications that will not affect functionality of legacy processesunless required by mandates
! Maintenance of system functionality
! Minimal additional budget requirements except those required for growth upgrades
! Limited number of IT support organization changes
! Limited amount of additional user training
! Limited internal resources required to design, code, manage, and implement

4—IT Assessment Business Case Study
Final ReportPage 4-6
kpmg
Option 2: Enhance current systems by adding new tools and functionality
This option assumes that significant modifications to existing systems will be made. It also assumes that
enhancements to business functions and practices will occur. The level of effort to enter data, reconcile
systems, and process paper will decrease based on the degree of change made. It is likely that this option
will include changes to the Chart of Accounts and agency interfaces, Florida Statutes and administrative
policies and require a significant effort. The characteristics of this option follow:
! People
– Significant internal and external resources to design, code, manage and implement
– Training for user and IT staff
– IT support staff changes (retool, reduction, additions)
! Process
– BPR functional changes that require modifications to legacy systems
– Use of a standardized system development methodology
– Changes to Florida Statutes and administrative policies
! Technology
– Continued use of current systems by the three branches of State government including theState University System
– Significant reprogramming and new programs to add functionality
– Standardization of data elements
– Changes to agency interfaces
– Front-end modifications (for example, GUI and WEB)
– Middleware modifications (for example, BEA, Open Link, and XIPC)
– Back-end modifications (for example, data warehouse, report writers, and query/extract tools)
– Hardware, software, and desktop expenditures
– Data conversion and cleansing effort
Option 3: Develop a new custom integrated information management system
This option assumes a major effort to redesign, test, and implement new and customized systems to
replace existing FFMIS subsystems. This option will use significant resources from both the State of
Florida and external sources. The new system will be fully integrated with changes to the existing system
architecture. This option assumes that significant enhancements to business functions and practices will
occur. The level of effort to enter data, reconcile systems, and process paper will improve significantly.

Business Case Study 4—IT Assessment
Final ReportPage 4-7
kpmg
This option will include changes to the Chart of Accounts and agency interfaces and will require
substantial effort to complete. The characteristics of this option follow:
! People
– Significant internal and external resources to design, code, manage and implement
– Significant training for user and IT staffs
– Changing ownership/location of IT resources (infrastructure and personnel)
! Process
– Changes to the current Chart of Accounts
– Use of a standardized system development methodology
– Functional changes to implement BPR recommendations
– Changes to Florida Statutes and administrative policies
! Technology
– Replacement of FLAIR, COPES, SPURS, LAS/PBS, and CMS
– Integrated subsystems
– Standardization of data elements
– Changes to the current hardware and software technical architecture
– Front-end modifications (for example, GUI and WEB)
– Middleware modifications (for example, BEA, Open Link, and XIPC)
– Back-end modifications (for example, data warehouse, report writers, and query/extract tools)
Option 4: Implement a commercial off-the-shelf (COTS) package
This option assumes a major effort to design, test, and implement a new ERP package to replace existing
FFMIS subsystems using significant resources from both the State of Florida and external sources to
accomplish. A high-level comparison of PeopleSoft, SAP, and Oracle to system requirements will take
place. However, this will not include the selection of a vendor package. The ERP system will be fully
integrated with changes to the existing system architecture and IT support resources. It assumes the use of
basic capabilities of the ERP system without significant modifications. It also assumes that significant
enhancements to business functions and practices will occur. The level of effort to enter data, reconcile
systems and process paper will improve significantly. This option will include changes to the Chart of
Accounts and agency interfaces and will require significant effort to perform. The characteristics of this
option follow:
4—IT Assessment Business Case Study
Final ReportPage 4-8
kpmg
! People
– Significant internal and external resources to design, code, manage and implement
– Significant training for user and IT staffs
– Changing ownership/location of IT resources (infrastructure and personnel)
! Process
– Changes to the current Chart of Accounts
– Use of a standardized system integration, implementation, and change methodology
– Functional changes to implement BPR recommendations
– Changes to Florida Statutes and administrative policies
! Technology
– Replacement of FLAIR, COPES, SPURS, LAS/PBS, and CMS
– Integrated subsystems
– Standardization of data elements
– Changes to agency interfaces
– Significant network changes/expenditures
– Significant hardware, software, and desktop expenditures
– Changes to the current hardware and software technical architecture
– Data conversion and cleansing effort
– Use of basic ERP capabilities without significant modifications
– Comparison of PeopleSoft, Oracle, and SAP to systems requirements
– Use of KPMG resources for ERP comparison and costing exercise
Option 5: Use a “best of breed” approach (that is, a combination of the otheroptions)
This option assumes that some combination of Options1 through 4 may be used in this alternative. The
assumption is that the various FFMIS components may require different solutions. It is possible that
multiple ERP packages combined with As-Is, major modifications, or rewrite of a subsystem may occur.
This option will require a major effort to design, test, and implement possible replacements of existing
FFMIS subsystems. The effort will use significant resources from both the State of Florida and external
sources. A high level comparison of PeopleSoft, Oracle, and SAP to system requirements will also be
conducted. It is probable that the solution will be fully integrated with changes to the existing system
architecture and IT support resources. It assumes the use of basic capabilities of the ERP system without
significant modifications. It also assumes that significant enhancements to business functions and

Business Case Study 4—IT Assessment
Final ReportPage 4-9
kpmg
practices will occur. The level of effort to enter data, reconcile systems, and process paper will be reduced
significantly. This option will likely include changes to the Chart of Accounts and agency interfaces and
will require significant effort to perform. Potential characteristics of this option follow:
! People
– Significant internal and external resources to design, code, manage, and implement
– Significant training for user and IT staffs
– Changing ownership/location of IT resources (infrastructures and personnel)
– Significant IT support staff changes (retool, reduction, and additions)
! Process
– Use of a standardized system development methodology
– Functional changes to implement BPR recommendations
– BPR functional changes may require modifications to legacy systems
– Will require changes to Florida Statutes and administrative policies
! Technology
– Comparison of PeopleSoft, Oracle, and SAP to systems requirements
– Changes to the current Chart of Accounts
– Significant hardware, software, and desktop expenditures
– Changes to agency interfaces
– Changes to the current hardware and software technical architecture
– Data conversion and cleansing effort
– Use of basic ERP capabilities without significant modifications
– Replacement of parts or all of FLAIR, COPES, SPURS, LAS/PBS, and CMS systems
– Implementation of integrated subsystems
– Standardization of data elements
– Front-end modifications (for example, GUI and WEB)
– Middleware modifications (for example, BEA, Open Link, and XIPC)
– Back-end modifications (for example, D.W., report writers, and query/extract tools)
– Significant network changes/expenditures
– Use of Options 1 through 4 for various subsystems
– Replacement of some agency shadow systems
– Use of KPMG resources for ERP comparison and costing exercise

4—IT Assessment Business Case Study
Final ReportPage 4-10
kpmg
4.4 FFMIS Subsystems
Finding IT–1. FFMIS subsystems experience a high level of up time andperformance
According to the TQ questionnaires (completed by interviewing IT owners), reliable operations of the
systems are a strength of the FFMIS subsystems. The FQ questionnaires (completed by FFMIS subsystem
users) show that all FFMIS subsystems were rated good or excellent for reliability and availability.
Finding IT–2. FFMIS subsystems are not integrated
The surveys and interviews conducted indicate that FFMIS subsystems were developed to address
specific requirements within a business function, with little consideration for data re-use across the State.
This creates a lack of consistency in how information is captured, stored, and accessed. In addition,
FFMIS subsystems do not share data easily and require specially written programs or manual processes to
exchange information. Documentation shows that FLAIR supports 267 interfaces.
Finding IT–3. FFMIS subsystems do not provide adequate decision supportinformation
Surveys show that management reporting of statewide financial information is inadequate. Users are
unable to access all information required, resulting in an inability to use the information as an important
management tool. Substantial quantities of information that would be useful in making management
decisions are often difficult to obtain because:
! Information is not consistently stored in a manner that is easily understood by the user
! FFMIS subsystems lack strong ad hoc reporting capabilities
! FFMIS subsystems lack user-friendly query capabilities
! Critical management information is stored in several different places and is not integrated
Finding IT–4. FFMIS subsystems lack strong ad hoc reporting capabilities
Surveys indicate that FFMIS subsystems do not provide easy access to the data so that the data can be
turned into information useful in making decisions. Users are frustrated because of their inability to
generate simple reports as needed because:
! Documentation or online help is lacking
! In some cases, the tools used for ad hoc reporting do not exist

Business Case Study 4—IT Assessment
Final ReportPage 4-11
kpmg
! The tools used for ad hoc reporting were built for experienced users and are cumbersome (forexample, COPESView and SPURSView were specifically designed to meet the needs of ad hocreporting, but are often difficult to run)
! Users are unable to access the data because of unnecessary security restrictions
! Data needed for ad hoc reports resides on several unique subsystems and requires agency-specific(shadow) systems to download information and generate reports
Finding IT–5. FFMIS subsystems have limited online viewing and printingcapabilities
Surveys indicate that FFMIS subsystems do not provide the ability to view and print data on the screen
easily. Often information is available, but users are unable to obtain all needed information at the first
look-up screen. Users are unable to print information on the screen and must run lengthy queries to obtain
that information. User concerns include the following:
! Documentation or online help is lacking
! View-only capability is not available in systems such as SPURSView (reviewing order status)
! Some components are not user friendly
! Selective printing capabilities are inadequate
! Reports take a long time to be printed and delivered
Finding IT–6. Not all State entities use FFMIS subsystems and have developedshadow and feeder systems to support business functions not provided byFFMIS subsystems
The surveys indicate that some State entities and agencies do not have the information or systems
functionality needed to support their processes in the FFMIS subsystems. As a result, some State entities
and agencies continue to develop alternative methods to perform the functionality or obtain the
information needed. Our review indicates that at least 300 shadow or feeder systems interface with
FFMIS subsystems. Shadow systems are systems used to perform a process outside the five key
subsystems. The development of shadow systems has resulted in the following:
! Increased information system investment
! Costly, complex, and time-consuming changes to FFMIS subsystems
! Duplicate data entry and maintenance of data
! Inconsistent data on different systems

4—IT Assessment Business Case Study
Final ReportPage 4-12
kpmg
! Inconsistent reporting results or output
! Loss of productivity
Strategic planning documents state that there are an “extensive number of agency-unique applications that
interface with the FFMIS functional owner information subsystems. These interfaces provide a means for
State agencies to upload and download data from the FFMIS functional owner information subsystems.
The vast majority of these agency-unique applications interface with the State accounting system
(FLAIR).”
Implications of shadow systems are:
! Movement away from enterprise data
! Increased silo operations
! Increased requirements for agencies to assist in interpreting data
Finding IT–7. The current FFMIS design does not lend itself to timely access ofcurrent data
FLAIR was designed to update information one day behind real time. All subsystems within FFMIS share
information with the FLAIR system. Some subsystems have automated interfaces, while others such as
COPES require their own systems to feed human resource and payroll information to FLAIR. Because of
this, State agencies often obtain vital information too late.
Three specific “data warehouse” systems—COPESView, SPURSView, and the FLAIR Information
Warehouse—are web- and UNIX-based systems that provide additional reporting capability. Each system
receives a snapshot copy of COPES, SPURS, and FLAIR data nightly. Surveys show that users are
concerned about the time it takes to perform downloads. Users also thought that because of the delay in
information exchange, some data was not updated daily or did not match on each system, which makes
currency or frequency of updates an issue.
Finding IT–8. FFMIS subsystems often require manual and duplicate input ofinformation
Each of the FFMIS subsystems maintains its own database. Each database is updated by data transactions
that are keyed in by users or updated by batch loads. Some data transactions need to be input into more
than one subsystem. Because each database is independently updated, these data transactions may not be
recorded at all, the data transactions could be input incorrectly, or the data transactions could be updated
with different dates and times. The inconsistent data contributes to user confusion and frustration.

Business Case Study 4—IT Assessment
Final ReportPage 4-13
kpmg
Finding IT–9. Legacy FFMIS subsystems are not user friendly and are difficult forusers to navigate through
Users across the board stated in the surveys that ease of use and usability were issues. Legacy FFMIS
subsystems are based upon architectural concepts from the 1970s and 1980s. User navigation is labor
intensive, and information is very difficult to retrieve rapidly and effectively. Users often have to navigate
through several input screens to record a single transaction. Difficulties in using software ultimately
increase both the time and training costs required for users to learn a system and use the software. This
contributes to a loss of productivity and user frustration.
Technology architectures today use a common set of standards that define accessibility and navigation
throughout the system. These standards use a common set of menus, bars, help screens, and file transfer
methods that allow the user to navigate through the system independent of the application.
Finding IT–10. FFMIS subsystems have inconsistent data entry edit and validationmethods
Because each FFMIS subsystem database is unique, the methods by which data is captured and validated
for errors are different. SPURS users reported that the system does not perform data editing or validation
at time of input. Instead, errors are not found until batch processing. This causes delays in production of
purchase orders. Similar concerns were voiced by the users of the FLAIR Departmental Accounting
System. FLAIR Payroll users identified the need for better editing of data for duplicate payments.
Finding IT–11. FFMIS subsystems have had limited enhancement or modificationsduring the last 2 years
In interviews with the IT application support groups of the FFMIS subsystems, group members report that
most have performed limited maintenance or enhancements to the legacy FFMIS subsystems during the
last few years. The main inhibitors for changes have been the Y2K project and uncertainty about the
future of FFMIS subsystems. It is important to note that new functionality and improved access to data
have been made through FFMIS subsystems such as COPESView, SPURSView, and FLAIR Information
Warehouse. These systems have been developed using newer and more open technologies such as Visual
Basic, Oracle, and other web-based applications.
Finding IT–12. Changes to FFMIS legacy systems are often time consuming andcumbersome
After determining the age of the FFMIS subsystems, it is clear that many of the systems have exceeded
the industry norm for age. Most analysts agree that the useful life of an application is between 7 and 10
years. Except for CMS, the core legacy FFMIS subsystems are between 11 and 29 years old. Most FFMIS

4—IT Assessment Business Case Study
Final ReportPage 4-14
kpmg
subsystems use older technology, which provides a challenge in finding people skilled in these areas. In
general, as systems age, modifications are performed inconsistently, especially if development standards
are not in place. Over time, these systems become difficult to maintain as staff leaves and documentation
has not been updated with modifications. The systems become fragile, inflexible, and difficult and costly
to modify to meet changing business requirements. A current change being considered in FFMIS—to add
a two-digit field in the Chart of Accounts—will affect numerous interfaces and is projected to cost more
than $900,000 to complete.
Exhibit 4-2 depicts the age of the key FFMIS subsystems and their major subsystems.
Exhibit 4-2Age of Key FFMIS Subsystems and Their Major Subsystems
2000
1995
1990
1985
1980
1975
1970
1965
FLAIR Payroll
Accounting
LAS/PBS
FLAIR Departmental Accounting
COPES
FLAIR Central Accounting
SPURS
CMSCOPESView
FLAIR Information
WarehouseSPURSView
SPURSVBS
YE
AR

Business Case Study 4—IT Assessment
Final ReportPage 4-15
kpmg
Finding IT–13. FFMIS end-users’ window of operation does not meet the needs ofall users
During interviews at the agencies and in responses on the FQ questionnaire, it was noted that some end-
users of FFMIS work outside the normal hours of 8 a.m. to 5 p.m., Monday through Friday. However,
most FFMIS subsystems of operation and support are available only during the standard 8 a.m. to 5 p.m.
Eastern Standard Time period. This is further complicated by Florida geographically spanning two time
zones. Most requests for longer hours of accessibility to both the systems and help desk operations were
from COPESView, SPURSView, and FLAIR users. Because no batch processing is performed during the
weekend, users need to wait until Monday to get results of any transactions entered after 5 p.m. on Friday.
This restricts an agency’s ability to service its clients. FLAIR Information Warehouse users reported that
the system was not available on critical days such as year-end.
Finding IT–14. FFMIS does not use a common Chart of Accounts
Another indication that substantiates the lack of integration among FFMIS subsystems is in the Chart of
Accounts. The Chart of Accounts is the backbone of any financial management system and will serve as
the basic building block to any enhancement or replacement of FFMIS. If the Chart of Accounts is not
properly managed, the State will be unable to provide information effectively to its citizens, its
elected officials, or its senior management. Surveys, interviews, and analysis by KPMG personnel
indicate the following:
! The State of Florida does not have a single person or entity with ultimate control over the Chartof Accounts, including controlling code design, controlling and managing code interpretation,code use, and managing code changes
! The current Chart of Accounts has codes containing more than 350 characters. The FFMIS Chartof Accounts for COPES, SPURS, FLAIR’s Central Accounting System, LAS/PBS, and CMSuses codes with more than 100 characters. The FFMIS Chart of Accounts for FLAIR’sDepartmental Accounting System has additional codes with additional characters totaling morethan 250. Because of improper code structure and despite the large number of codes available foragencies to use in the Departmental Accounting System, agencies have been forced to usespecific codes for purposes other than originally intended to accommodate their financialreporting needs
! The State has undergone many important changes during the past 20 years that have affectedFFMIS and the Chart of Accounts, including constitutional revisions; the creation, abolition andreorganization of departments; adoption of Performance Based Budgeting; and statutoryrequirements for agencies to provide unit cost information. The Chart of Accounts was notdesigned and has not been modified to accommodate these changes
! During the past 20 years, the State and business in general have adopted new business practicesthat have changed the character of expenditures, including the increased use of overnight mail; air

4—IT Assessment Business Case Study
Final ReportPage 4-16
kpmg
travel; new technologies such as personal computers, pagers, and cellular phones; and contractingservices. The State needs to anticipate information requests and proactively make changes to itsChart of Accounts. Failure to anticipate these changes (with or without a new system) will makeit very time consuming and costly to react to information requests by citizens, elected officials,and senior management to manage and monitor the financial operations of the State
It is important to note that regardless of any action taken or not taken related to enhancing or replacing
FFMIS, the State must consider changing the way it manages its Chart of Accounts.
Business Case Study 4—IT Assessment
Final ReportPage 4-17
kpmg
4.5 Information Technology Processes
Finding IT–15. FFMIS support organizations do not have formal performancemeasurement and management processes
Several of the IT organizations (Infrastructure and Application Development and Maintenance) do not
formally measure IT performance or perform regular reporting. Surveys to measure user satisfaction with
services and to manage user expectations and perceptions are not conducted regularly. Although some
service-level agreements (SLA) exist, regular and consistent management and definition of SLAs with
customers to ensure that agreed-upon service is provided are not performed. No consistent effort is made
across the five subsystems to ensure that work is competitive in cost and quality.
Finding IT–16. FFMIS training and online help facilities are not meeting end-users’needs
Results of the FQ surveys indicate that the FFMIS user community is extremely concerned about the lack
of hands-on training in the proper use of all FFMIS subsystems. The lack of proper training forces the
end-user to call help desks frequently with “how-to” questions. Help desk response is not always friendly
or helpful, prompting the user to bypass the help desk and ask for peer support from other users at the
agency. Peer support is a nonproductive process for providing knowledge and help to FFMIS users.
FFMIS subsystems lack up-to-date and useful online help facilities and online user manuals. Adequate
help facilities would alleviate many of the how-to questions by providing answers directly to users.
Finding IT–17. FFMIS subsystems have multiple security controls and policies
Survey results indicate that some FFMIS end-users are frustrated by the multiple logons and passwords
required for all systems and applications used to perform their daily duties. This becomes especially
annoying when passwords expire at different times (some 30 days, others 90 days). This can lead to users
writing their passwords for the different systems on notes and leaving them on their workstations, voiding
the underlying security policy.
The agencies, however, are working to comply with the law as stated in the Information Resource
Security Policy adopted May 1998:
Agencies shall prescribe sufficient controls to ensure that access to network services and host
services and subsystems is restricted to authorized users and uses only. These controls shall
selectively limit services based upon: user identification and authentication (for example,
password), or designation of other users, including the public where authorized, as a class (for

4—IT Assessment Business Case Study
Final ReportPage 4-18
kpmg
example, public access through dial-up or public switched networks), for the duration of a
session.
Under a statewide Information Financial Management System, a more streamlined security methodology
can be devised.
Finding IT–18. Project prioritization at the IT organizations supporting FFMISsubsystems does not ensure that high priority end-user needs are being met
Discussions with IT leaders revealed that many IT organizations pursue their own understanding of
FFMIS priorities and those dictated by the functional owners of the system rather than priorities based on
agency business leaders’ needs. In many cases, there are no IT steering committees with agency
representation to set IT direction. Often, no formal initiation and prioritization processes are in place to
ensure that an IT organization is working on high-value projects. Implementing the best practices of
prioritization imposes discipline while avoiding bureaucracy. Critical components of an effective process
are both on-going and post-completion reviews of projects to determine whether their objectives are being
met. An effective scoring model should be simple to apply with a few standard key criteria such as the
following:
! Financial value added
! Current financial cost
! Implementation costs
! Strategic fit
! Time to realize benefits
! Implementation risks
! Cost/benefit
! Intangible benefits
! Impact of lost opportunities
Finding IT–19. Not all FFMIS subsystems have backup and disaster recoverycapabilities for the mainframe components of the system
The Comptroller’s IT organization has a mainframe recovery plan and a formal “hot-site” agreement to
use IBM equipment in upstate New York in the case of a disaster for FLAIR, LAS/PBS, and other
systems. The plan has been tested four times with satisfactory results according to responsible State
officials. In addition, LAS/PBS has an agreement and plan to use the Office of Legislative Technology
Systems data in case of a disaster. The Comptroller’s IT organization is working on a plan for the

Business Case Study 4—IT Assessment
Final ReportPage 4-19
kpmg
recovery of business units. DMS and DOI do not have formal disaster recovery plans, strategies, or
agreements for recovery of the COPESView, SPURSView, and CMS.

4—IT Assessment Business Case Study
Final ReportPage 4-20
kpmg
4.6 Information Technology Infrastructure
Finding IT–20. Florida lacks a statewide data architecture model
Interviews conducted indicate that some agency departments do not have all of the information or systems
to fully support their FFMIS business processes. Management reporting of enterprise data is ineffective.
Respondents had no clear vision about how to provide the State government with the information it needs
to develop a resource management plan. No statewide plan has been adopted to develop an integrated and
shared use of information and systems.
The Agency Data Administration Policy adopted in May 1998 was a start. It declared:
State agencies find it difficult to identify overlapping data, which should be shared with other
agencies. No mechanisms have been developed to identify and to foster the use of best practices
in data definition and data sharing. The responsibilities of data owners and data custodians have
not been clearly and consistently defined or assigned. Consequently, most of the existing data is
accessible and usable only to those individuals given access through a dedicated computer
application.
It appears that little has been done to enforce the policy as it pertains to FFMIS or other systems.
Finding IT–21. Florida lacks a statewide technical architecture model
Interview responses indicated a consensus that the State’s oversight structure and procedures for
information technology contribute to the perception that technology use as it pertains to FFMIS
subsystems is not optimized. Although a process is in place to provide centralized planning and oversight,
the individual agencies have considerable latitude over technology direction and decisions. This has
resulted in “stovepipe” systems that appear to have been developed without fully considering consistency,
interoperability, and the overall needs of the State.
Individual agency strategic plans, while all having the same underlying theme of “work smarter and more
efficiently,” do not add up to a comprehensive and cohesive State vision as seen by its constituents.
The Strategic Governance Committee was established with the following mission: “Provide statewide
policy, direction and leadership to maximize the State of Florida’s information assets, share and leverage
resources, and effectively manage investments.” However, it is not apparent that the committee has the
power or authority to carry out the directive.

Business Case Study 4—IT Assessment
Final ReportPage 4-21
kpmg
Finding IT–22. Existing FFMIS platforms are not interoperable in a seamlessmanner
Our assessment shows that many key systems are old but still provide most of the needed functionality.
The majority of the systems surveyed were more than 12 years old, were written in second-generation
languages (for example, COBOL), use older databases, and are not tightly integrated with other related
systems. Most applications have been developed to address specific requirements within a business
function, with little consideration for data re-use across the enterprise. The database management systems
in use include ADABAS, DB2, DB2/400, Oracle, and Unisys DMS. Unfortunately, these systems do not
share data easily and require the staff to have different skills to support them. Data modeling tools and
techniques have not been widely used to define business information needs.
The present process of data exchange is that one system with a specially written program extracts data
from its files, formats it, then writes the file to disk. The file is then either sent by file transfer protocol
(FTP) or, in more than half the cases, a tape is created and hand delivered to the receiving system.
Likewise, on the receiving system, a special program has been written to read the file format and update
the files on its system. Any changes in file formats, requested data, or data availability requires
modifications on both ends of this process. There have been instances where data was changed but the
receiving agency was not properly informed, resulting in processing delays and unscheduled time to
resolve issues.

4—IT Assessment Business Case Study
Final ReportPage 4-22
kpmg
4.7 Information Technology Organization
Finding IT–23. FFMIS processing and application support occurs in four separateIT organizations
The five legacy FFMIS subsystems are processed on four different platforms in three distinct data centers.
CMS is on an AS/400 at the Treasury Department in the Larson Building, and LAS/PBS and FLAIR run
on an IBM ES9000 series 9672-R76 at the Comptroller’s Data Center in the Fletcher Building. SPURS
runs on an IBM S390 Multiprise 2003-1C5, and COPES runs on a Unisys Clearpath IX5602 D2; both are
at the DMS data center in the Carlton Building. The SPURS and COPES applications are maintained by
DMS, CMS is supported by the Department of Insurance, Treasury and State Fire Marshal, FLAIR is
supported by the Comptroller’s office, and LAS/PBS is supported by the Executive Office of the
Governor. While this in itself is not an issue, the lack of coordinated activities, duplicate and redundant
hardware, system software, networks, processes, and administration can be inhibitors as the State moves
forward. In addition, the IT organizations have pursued different directions regarding development and
maintenance of the FFMIS subsystems.
Finding IT–24. Existing State personnel policies and funding processes inhibit therecruitment and retention of skilled employees required to perform FFMIStechnology support
The complexity and sophistication of IT require specialized skills and expertise for employees at all
levels. The State’s existing personnel practices do not support attracting and retaining the best talent to
support this critical area.
A common concern in FFMIS technology staffs is the difficulty in attracting and retaining technical
employees. IT leaders interviewed all voiced the opinion that the State salary scales are below the private
market for skilled IT professionals. This prevents the State from competing with employers for recent
college graduates and for experienced IT professionals. The classification system compounds the problem
by limiting the grade and salary levels of top IT personnel. This prevents career growth in line with the
private sector and causes employees to move from one agency to another to increase salary and obtain
promotions.
FFMIS support organizations currently have shortages in a number of key skill areas. An example of this
is the need for experienced COBOL and Natural Language programmers to support legacy FFMIS
subsystems.

Business Case Study 4—IT Assessment
Final ReportPage 4-23
kpmg
Finding IT–25. Multiple help desks exist for FFMIS support that do not providesufficient and effective service
Interviews and surveys show that multiple help desks support FFMIS application end-users. These help
desks are neither interconnected nor use the same problem management software. Connectivity issues
may be redirected by the help desk receiving the call to the agency’s help desk because no network
management software is tied to the problem management software that would inform the help desk agent
of a network problem. Most application problems are dispatched to a programmer. The user, through
experience, may call the programmer directly, by-passing the help desk(s) altogether. Programmers for
the most part do not have access to the trouble ticket software; therefore, the call is not recorded. If
problems and solutions are not recorded, no knowledge base can be developed that would assist the help
desk agent in solving problems without having to dispatch the call.

4—IT Assessment Business Case Study
Final ReportPage 4-24
kpmg
4.8 Detailed Functional Quality and Technical Quality Assessment
1
2
3
4
5
1 2 3 4 5
Technical Quality
Fu
nct
ion
al Q
ual
ity
Improvement Target Area
Technical Reengineering Healthy
Replacement Functional Enhancement
COPESView
SPURSView
Vendor Bid System
LAS/PBS
SPURS
COPES
CMSFLAIR DA
FLAIR IWFLAIR CA
FLAIR PR
Functional and TechnicalQuality Summary Results
Functional and TechnicalQuality Summary Results
• Opportunities exist for functionalenhancement in seven applications
• Areas of potential improvementinmost cases focused on flexibility,ad-hoc reporting capabilities, easeof use, and training
• Technical scores indicate the abilityto interface and integrate systemsis difficult
• Major functional deficiencies are inusability, flexibility, and helpfacilities
• One application could be replaced

Business Case Study 4—IT Assessment
Final ReportPage 4-25
kpmg
Ability of FFMIS Subsystems to Meet Overall Present and Future Business Needs
The last two questions in the FQ Survey asked end users ofthe FFMIS subsystems how the applications meet their presentand future overall business needs. They rated the overallapplication from 1 to 5 as follows:
1 = New Application Required2 = Major Enhancement Needed3 = Significant Modifications Required4 = Minor Modifications Required5 = Completely Acceptable As Is
The following chart shows the responses of these twoquestions by average response per application.
Application Portfolio Analysis - FQ
������������������������������������������������������������������������������������������������������������������������������������������������������������������������������������������������������������������������������������������������������������������������������������������������������
��������������������������������������������������������������������������������������������������
Based on results of questionwhether FFMIS subsystemsare meeting current andfuture needs of users:
Application Portfolio Analysis - FQ
Meet Present and Future Business Needs
���������������������������������������������������������������������������������������������������������������������������������������������������������������������������������������������������������������������������������������������������������������������������������������������������������������������������������������������
���������������������������������������������������������������������������������������������������������������������������������������������������������������������������������������������������������������������������������������������������������������������������������������������������������������������������������������������������������������������������������������������������������������������������������������������������������������������������������������������������������������������������������������������������������������������������
���������������������������������������������������������������������������������������������������������������������������������������������������������������������������������������������������������������������������������������������������������������������������������������������������������������������������������������������
Overall FQ Assessment
0.0
0.5
1.0
1.5
2.0
2.5
3.0
3.5
4.0
4.5
5.0
FL
AIR
CA
FL
AIR
DA
FL
AIR
PR
FL
AIR
IW
CO
PE
S
Co
pes
Vie
w
SP
UR
S
Sp
urs
Vie
w
Sp
urs
VB
S
LA
S/P
BS
CM
S
Meets Current Business Needs Meets Future Business Needs
Acceptable As Is
Minor Modifications Required
Significant Modifications Required
Major Enhancement Needed
New Application Required
• Most applications willnot meet the futurebusiness needs of theState of Florida
• Most applications arenot meeting all of thecurrent businessrequirements
• Significant modificationsneed to be made to atleast six applications

4—IT Assessment Business Case Study
Final ReportPage 4-26
kpmg
* Improvement comments provided by COPESView users survey
• Reporting is complex and difficult• Performance issue that exists is the time
it takes to do COPESView loads
• It was felt that improvements or changesto meet agency needs are not done in atimely manner
• Another performance issue withCOPESView is attributed to lengthyqueries
• Concerns regarding security to ensureconfidentiality regarding personnel insensitive positions (i.e., law enforcement)
• Concerns regarding lack ofdocumentation on the system and datafields
• Some data is not updated daily whichmakes currency or frequency of updatesof data an issue
• Frequent training on Impromptu isrequired as is improved technical supportrelated to questions and issues
• Training on COPESView is not performedand help facilities require improvement
• Some data fields in COPES are notavailable in COPESView
Improvements Needed*:
1
2
3
4
5
Provided
Required
Functional QualityCOPESView
Functional QualityCOPESView
AC
CU
RA
CY
RE
SP
ON
SIV
EN
ES
S
DA
TA
CU
RR
EN
CY
SE
CU
RIT
Y
AV
AIL
AB
ILIT
Y
EA
SE
OF
US
E
HE
LP F
AC
ILIT
IES
US
AB
ILIT
Y
FLE
XIB
ILIT
Y
AD
HO
CP
RO
CE
SS
ING
US
ER
SU
PP
OR
T
TR
AIN
ING
ME
ET
S P
RE
SE
NT
BU
SIN
ES
S
ME
ET
S F
UT
UR
EB
US
INE
SS
Excellent
Good
Fair
Unacceptable
�������������������������������������������������������������������������������������������������������������������������������������������������������������������������������������������������������������������������������������������������������������������������������������������������������������������������������������������������������������������������������������������������������������������������������������������������������������������������������������������������������������������������������������������������������������������������������������������������������������������������������������������������������������������������������������������������������������������������������������������������������������������������������������������������������������������������������������������������������������������������������������������������������������������������������������������������������������������������������������������������������������������������������������������������������������������������������������������������������������������������������������������������������������������������������������������������������������������������������������������������������������������������������������������������������������������
�������������������������������������������������������������������������������������������������������������������������������������������������������������������������������������������������������������������������������������������������������������������������������������������������������������������������������������������������������������������������������������������������������������������������������������������������������������������������������������������������������������������������������������������������������������������������������������������������������������������������������������������������������������������������������������������������������������������������������������������������������������������������������������������������������������������������������������������������������������������������������������������������������������������������������������������������������������������������������������������������������������������������������������������������������������������������������������������������������������������������������������������������������������������������������������������������������������������������������������������������������������������������������������������������������������������
Excellent
Good
Fair
Unacceptable
AC
CU
RA
CY
SE
CU
RIT
YF
EA
TU
RE
S
* A
BIL
ITY
TO
INT
ER
FA
CE
US
E O
FR
ES
OU
RC
ES
PO
RT
AB
ILIT
Y
EA
SE
OF
AN
AL
YS
IS
EA
SE
OF
MA
KIN
GC
HA
NG
ES
TE
ST
ING
PR
OB
LE
MR
ES
OL
UT
ION
RE
LIA
BIL
ITY
INO
PE
RA
TIO
N
ST
AN
DA
RD
CO
MP
LIA
NC
E
EA
SE
OF
OP
ER
AT
ION
Technical Quality–COPESView
Application Portfolio Analysis - TQ
* NOT APPLICABLE TO THIS SYSTEM* NOT APPLICABLE TO THIS SYSTEM

Business Case Study 4—IT Assessment
Final ReportPage 4-27
kpmg
* Improvement comments provided by SPURSView users survey
• All agencies use except for theUniversities
• There were several requests foradditional search capabilities
• There were several requests to allowfor downloading to MS products
• Many users requested view onlycapability as it applies to reviewingorder status
• If a change order is made to SPURS,it doesn't get reflected to SPURSView
• There were several comments aboutdata in SPURS and SPURSView notmatching (i.e., vendor)
• Many users requested thatSPURSView gets updated more often
• Data in SPURS and SPURSViewnot matching
Improvements Needed*:
1
2
3
4
5
Functional QualitySPURSView
Functional QualitySPURSView
AC
CU
RA
CY
RE
SP
ON
SIV
EN
ES
S
DA
TA
CU
RR
EN
CY
SE
CU
RIT
Y
AV
AIL
AB
ILIT
Y
EA
SE
OF
US
E
HE
LP F
AC
ILIT
IES
US
AB
ILIT
Y
FL
EX
IBIL
ITY
AD
HO
C
PR
OC
ES
SIN
G
US
ER
SU
PP
OR
T
TR
AIN
ING
ME
ET
S P
RE
SE
NT
BU
SIN
ES
S
ME
ET
S F
UT
UR
E
BU
SIN
ES
S
Provided
Required
Excellent
Good
Fair
Unacceptable
�������������������������������������������������������������������������������������������������������������������������������������������������������������������������������������������������������������������������������������������������������������������������������������������������������������������������������������������������������������������������������������������������������������������������������������������������������������������������������������������������������������������������������������������������������������������������������������������������������������������������������������������������������������������������������������������������������������������������������������������������������������������������������������������������������������������������������������������������������������������������������������������������������������������������������������������������������������������������������������������������������������������������������������������������������������������������������������������������������������������������������������������������������������������������������������������������������������������������������������������������������������������������������������������������������������������
������������������������������������������������������������������������������������������������������������������������������������������������������������������������������������������������������������������������������������������������������������������������������������������������������������������������������������������������������������������������������������������������������������������������������������������������������������������������������������������������������������������������������������������������������������������������������������������������������������������������������������������������������������������������������������������������������������������������������������������������������������������������������������������������������������������������������������������������������������������������������������������������������������������������������������������������������������������������������������������������������������������������������������������������������������������������������������������������������������������������������
Excellent
Good
Fair
Unacceptable
* A
CC
UR
AC
Y
* S
EC
UR
ITY
FE
AT
UR
ES
* A
BIL
ITY
TO
INT
ER
FA
CE
US
E O
FR
ES
OU
RC
ES
* P
OR
TA
BIL
ITY
EA
SE
OF
AN
AL
YS
IS
EA
SE
OF
MA
KIN
GC
HA
NG
ES
TE
ST
ING
PR
OB
LE
MR
ES
OL
UT
ION
RE
LIA
BIL
ITY
IN
OP
ER
AT
ION
ST
AN
DA
RD
CO
MP
LIA
NC
E
EA
SE
OF
OP
ER
AT
ION
Application Portfolio Analysis - TQ
Technical Quality–SPURSView
* NOT APPLICABLE TO THIS SYSTEM* NOT APPLICABLE TO THIS SYSTEM
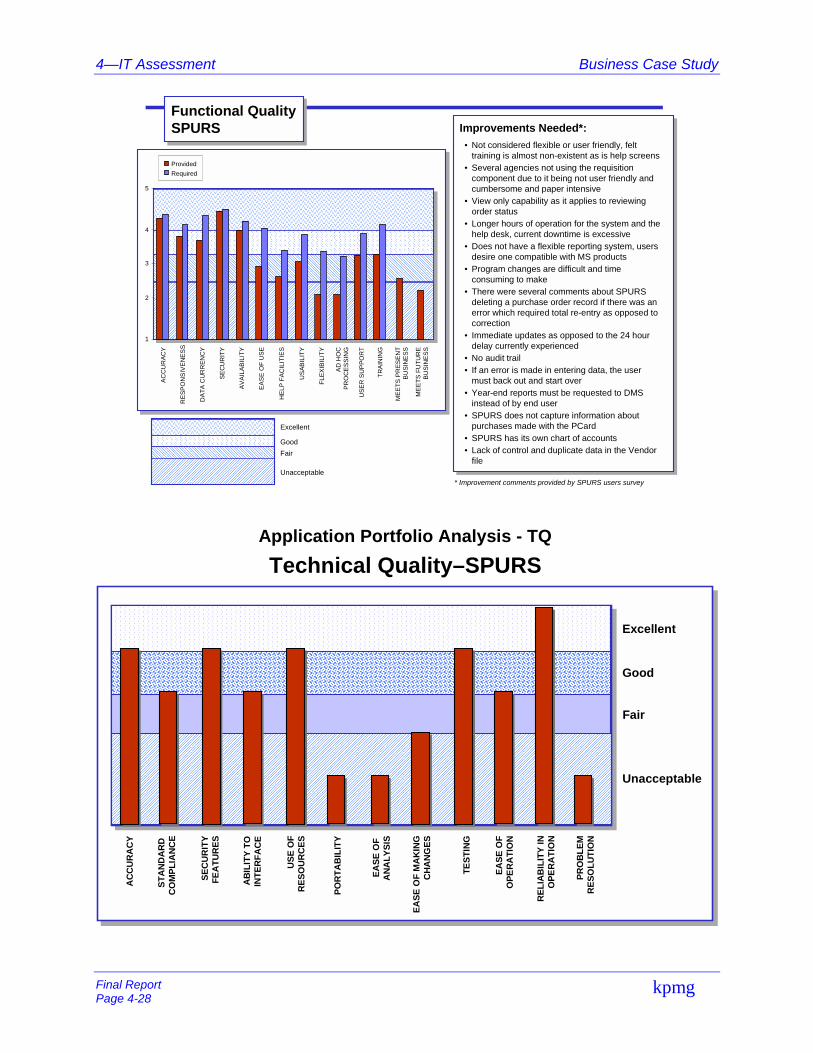
4—IT Assessment Business Case Study
Final ReportPage 4-28
kpmg
����������������������������������������������������������������������������������������������������������������������������������������������������������������������������������������������������������������������������������������������������������������������������������������������������������������������������������������������������������������������������������������������������������������������������������������������������������������������������������������������������������������������������������������������������������������������������������������������������������������������������������������������������������������������������������������������������������������������������������������������������������������������������������������������������������������������������������������������������������������������������������������������������������������������������������������������������������������������������������������������������������������������������������������������������������������������������������������������������������������������������������������������������������������������������������������������������������������������������������������������������������������������������������������������������������������������������������������������������������������������������������������������������������������������������������������������������������������������������������������������������������������������������������������������������������������������������������������������������
1
2
3
4
5
AC
CU
RA
CY
RE
SP
ON
SIV
EN
ES
S
DA
TA
CU
RR
EN
CY
SE
CU
RIT
Y
AV
AIL
AB
ILIT
Y
EA
SE
OF
US
E
HE
LP F
AC
ILIT
IES
US
AB
ILIT
Y
FLE
XIB
ILIT
Y
AD
HO
CP
RO
CE
SS
ING
US
ER
SU
PP
OR
T
TR
AIN
ING
ME
ET
S P
RE
SE
NT
BU
SIN
ES
S
ME
ET
S F
UT
UR
EB
US
INE
SS
* Improvement comments provided by SPURS users survey
• Not considered flexible or user friendly, felttraining is almost non-existent as is help screens
• Several agencies not using the requisitioncomponent due to it being not user friendly andcumbersome and paper intensive
• View only capability as it applies to reviewingorder status
• Longer hours of operation for the system and thehelp desk, current downtime is excessive
• Does not have a flexible reporting system, usersdesire one compatible with MS products
• Program changes are difficult and timeconsuming to make
• There were several comments about SPURSdeleting a purchase order record if there was anerror which required total re-entry as opposed tocorrection
• Immediate updates as opposed to the 24 hourdelay currently experienced
• No audit trail• If an error is made in entering data, the user
must back out and start over• Year-end reports must be requested to DMS
instead of by end user• SPURS does not capture information about
purchases made with the PCard• SPURS has its own chart of accounts• Lack of control and duplicate data in the Vendor
file
Improvements Needed*:Functional QualitySPURS
Functional QualitySPURS
Provided
Required
��������������������������������������������������������������������������������������������������������������������������������������������������������������������������������������������������������������������������������������������������������������������������������������������������������������������������������������������������������������������������������������������������������������������������������
Excellent
Good
Fair
Unacceptable
����������������������������������������������������������������������������������������������������������������������������������������������������������������������������������������������������������������������������������������������������������������������������������������������������������������������������������������������������������������������������������������������������������������������������������������������������������������������������������������������������������������������������������������������������������������������������������������������������������������������������������������������������������������������������������������������������������������������������������������������������������������������������������������������������������������������������
Technical Quality–SPURS
����������������������������������������������������������������������������������������������������������������������������������������������������������������������������������������������������������������������������������������������������������������������������������������������������������������������������������������������������������������������������������������������������������������������������������������������������������������������������������������������������������������������������������������������������������������������������������������������������������������������������������������������������������������������������������������������������������������������������������������������������������������������������������������������������������������������������
��������������������������������������������������������������������������������������������������������������������������������������������������������������������������������������������������������������������������������������������������������������������������������������������������������������������������������������������������������������������������������������������������������������������������������������������������������������������������������������������������������������������������������������������������������������������������������������������������������������������������������������������������������������������������������������������������������������������������������������������������������������������������������������������������������������������������������������������������������������������������������������������������������������������������������������������������������������������������������������������������������������������������������������������������������������������������������������������������������������������������������������������������������������������������������������������������������������������������������������������������������������������������������������������������������������������������������������������������������������������������������������������������������������������������������������������������������
Excellent
Good
Fair
Unacceptable
AC
CU
RA
CY
SE
CU
RIT
YF
EA
TU
RE
S
AB
ILIT
Y T
OIN
TE
RF
AC
E
US
E O
FR
ES
OU
RC
ES
PO
RT
AB
ILIT
Y
EA
SE
OF
A
NA
LY
SIS
EA
SE
OF
MA
KIN
GC
HA
NG
ES
TE
ST
ING
PR
OB
LE
MR
ES
OL
UT
ION
RE
LIA
BIL
ITY
INO
PE
RA
TIO
N
ST
AN
DA
RD
C
OM
PL
IAN
CE
EA
SE
OF
OP
ER
AT
ION
Application Portfolio Analysis - TQ

Business Case Study 4—IT Assessment
Final ReportPage 4-29
kpmg
* Improvement comments provided by LAS/PBS users survey
• Narrative input needs to mirror word processingsoftware - user friendly capabilities
• Minimize number of different input screens the usermust access in order to enter position and budgetdetail data
• Simplified Schedule I input process by user viewingthe status of revenue and/or non-operatingexpenditure totals while still in the data input screen
• On-line access to real-time accounting and personneldata, including organization charts
• Column access (not update) to amended LBR data atall times from agency workstations. Changes madein SP environment not available to agencies in the APenvironment, even ability to run current reports
• Rounding issues between COPES and LAS/PBS
• Security so tight information needed to allocate rateor budget must be obtained from OPB and thenrouted to agency
• Reporting cumbersome
• Most work done in spreadsheets prior to entering thesystem - Analytical tools weak, need modeling tools
• Zero Base Budgeting could require a new system
• Always reconciliation issues
• Track Legislative actions by issue
• Too many codes - not descriptive - Report 3A has nomeaning
• Download capabilities not provided to all agencies
• An issue that requests positions and/or salaryamounts can not be entered and viewed at same time
• LAS/PBS budgets at program component levelwhereas FLAIR budgets at org. code level - shouldbe consistent
Improvements Needed*:Functional QualityLAS/PBS
Functional QualityLAS/PBS
��������������������������������������������������������������������������������������������������������������������������������������������������������������������������������������������������������������������������������������������������������������������������������������������������������������������������������������������������������������������������������������������������������������������������������������������������������������������������������������������������������������������������������������������������������������������������������������������������������������������������������������������������������������������������������������������������������������������������������������������������������������������������������������������������������������������������������������������������������������������������������������������������������������������������������������������������������������������������������������������������������������������������������������������������������������������������������������������������������������������������������������������������������������������������������������������������������������������������������������������������������������������������������������������������������������������������������������������������������������������������������������������������������������������������������������������������������������������������������������������������������������������������������������������������������������������������������������������������������������������������������������������������������������������������
1
2
3
4
5
AC
CU
RA
CY
RE
SP
ON
SIV
EN
ES
S
DA
TA
CU
RR
EN
CY
SE
CU
RIT
Y
AV
AIL
AB
ILIT
Y
EA
SE
OF
US
E
HE
LP
FA
CIL
ITIE
S
US
AB
ILIT
Y
FL
EX
IBIL
ITY
AD
HO
CP
RO
CE
SS
ING
US
ER
SU
PP
OR
T
TR
AIN
ING
ME
ET
S P
RE
SE
NT
BU
SIN
ES
S
ME
ET
S F
UT
UR
EB
US
INE
SS
Provided
Required
����������������������������������������������������������������������������������������������������������������������������������������������������������������������������������������������������������������������������������������������������������������������������������������������������������������������������������������������������������������������������������������������������������������������������������������
Excellent
Good
Fair
Unacceptable
�������������������������������������������������������������������������������������������������������������������������������������������������������������������������������������������������������������������������������������������������������������������������������������������������������������������������������������������������������������������������������������������������������������������������������������������������������������������������������������������������������������������������������������������������������������������������������������������������������������������������������������������������������������������������������������������������������������������������������������������������������������������������������������������������������������������������������������������������������������������������������������������������������������������������������������������������������������������������������������������������������������������������������������������������������������������������������������������������������������������������������������������������������������������������������������������������������������������������������������������������������������������������������������������������������������������
������������������������������������������������������������������������������������������������������������������������������������������������������������������������������������������������������������������������������������������������������������������������������������������������������������������������������������������������������������������������������������������������������������������������������������������������������������������������������������������������������������������������������������������������������������������������������������������������������������������������������������������������������������������������������������������������������������������������������������������������������������������������������������������������������������������������������������������������������������������������������������������������������������������������������������������������������������������������������������������������������������������������������������������������������������������������������������������������������������������������������
Excellent
Good
Fair
Unacceptable
AC
CU
RA
CY
SE
CU
RIT
YF
EA
TU
RE
S
AB
ILIT
Y T
OIN
TE
RF
AC
E
US
E O
FR
ES
OU
RC
ES
PO
RT
AB
ILIT
Y
EA
SE
OF
AN
AL
YS
IS
EA
SE
OF
MA
KIN
GC
HA
NG
ES
TE
ST
ING
PR
OB
LE
MR
ES
OL
UT
ION
RE
LIA
BIL
ITY
INO
PE
RA
TIO
N
ST
AN
DA
RD
CO
MP
LIA
NC
E
EA
SE
OF
OP
ER
AT
ION
Technical Quality–LAS/PBS
Application Portfolio Analysis - TQ

4—IT Assessment Business Case Study
Final ReportPage 4-30
kpmg
��������������������������������������������������������������������������������������������������������������������������������������������������������������������������������������������������������������������������������������������������������������������������������������������������������������������������������������������������������������������������������������������������������������������������������������������������������������������������������������������������������������������������������������������������������������������������������������������������������������������������������������������������������������������������������������������������������������������������������������������������������������������������������������������������������������������������������������������������������������������������������������������������������������������������������������������������������������������������������������������������������������������������������������������������������������������������������������������������������������������������������������������������������������������������������������������������������������������������������������������������������������������������������������������������������������������������������������������������������������������������������������������������������������������������������������������������������������������������������������������������������������������������������������������������������������������������������������������������������������������������������������������������������������������������
1
2
3
4
5
AC
CU
RA
CY
RE
SP
ON
SIV
EN
ES
S
DA
TA
CU
RR
EN
CY
SE
CU
RIT
Y
AV
AIL
AB
ILIT
Y
EA
SE
OF
US
E
HE
LP
FA
CIL
ITIE
S
US
AB
ILIT
Y
FL
EX
IBIL
ITY
AD
HO
CP
RO
CE
SS
ING
US
ER
SU
PP
OR
T
TR
AIN
ING
ME
ET
S P
RE
SE
NT
BU
SIN
ES
S
ME
ET
S F
UT
UR
EB
US
INE
SS
* Improvement comments provided by Vendor Bid users survey
• All agencies use except for theUniversities
• There were several requests to purgeincorrect vendor data
• It was felt that the process to order labelsrequired improvement
• It was requested to use drop down lists(i.e., selecting class, group, posting,search)
• It was requested to use spellcheck
• Users cannot place the entire bid or RFPin system
Improvements Needed*:
Functional QualityVendor Bid System
Functional QualityVendor Bid System
Provided
Required
������������������������������������������������������������������������������������������������������������������������������������������������������������������������������������������������������������������������������������������������������������������������������������������������������������������������������������������������������������������������������������������������������������������������
Excellent
Good
Fair
Unacceptable
����������������������������������������������������������������������������������������������������������������������������������������������������������������������������������������������������������������������������������������������������������������������������������������������������������������������������������������������������������������������������������������������������������������������������������������������������������������������������������������������������������������������������������������������������������������������������������������������������������������������������������������������������������������������������������������������������������������������������������������������������������������������������������������������������������������������������������������������������������������������������������������������������������������������������������������������������������������������������������������������������������������������������������������������������������������������������������������������������������������������������������������������������������������������������������������������������������������������������������������������������������������������������������������������
������������������������������������������������������������������������������������������������������������������������������������������������������������������������������������������������������������������������������������������������������������������������������������������������������������������������������������������������������������������������������������������������������������������������������������������������������������������������������������������������������������������������������������������������������������������������������������������������������������������������������������������������������������������������������������������������������������������������������������������������������������������������������������������������������������������������������������������������������������������������������������������������������������������������������������������������������������������������������������������������������������������������������������������������������������������������������������������������������������
Excellent
Good
Fair
Unacceptable
* A
CC
UR
AC
Y
* S
EC
UR
ITY
FE
AT
UR
ES
* A
BIL
ITY
TO
INT
ER
FA
CE
US
E O
FR
ES
OU
RC
ES
* P
OR
TA
BIL
ITY
EA
SE
OF
AN
AL
YS
IS
EA
SE
OF
MA
KIN
GC
HA
NG
ES
TE
ST
ING
PR
OB
LE
MR
ES
OL
UT
ION
RE
LIA
BIL
ITY
IN
OP
ER
AT
ION
ST
AN
DA
RD
CO
MP
LIA
NC
E
EA
SE
OF
OP
ER
AT
ION
* NOT APPLICABLE TO THIS SYSTEM* NOT APPLICABLE TO THIS SYSTEM
Application Portfolio Analysis - TQ
Technical Quality–Vendor Bid System

Business Case Study 4—IT Assessment
Final ReportPage 4-31
kpmg
������������������������������������������������������������������������������������������������������������������������������������������������������������������������������������������������������������������������������������������������������������������������������������������������������������������������������������������������������������������������������������������������������������������������������������������������������������������������������������������������������������������������������������������������������������������������������������������������������������������������������������������������������������������������������������������������������������������������������������������������������������������������������������������������������������������������������������������������������������������������������������������������������������������������������������������������������������������������������������������������������������������������������������������������������������������������������������������������������������������������������������������������������������������������������������������������������������������������������������������������������������������������������������������������������������������������������������������������������������������������������������������������������������������������������������������������������������������������������������������������������������������������������������������������������������������������������������������������������������������������������������������������
1
2
3
4
5
AC
CU
RA
CY
RE
SP
ON
SIV
EN
ES
S
DA
TA
CU
RR
EN
CY
SE
CU
RIT
Y
AV
AIL
AB
ILIT
Y
EA
SE
OF
US
E
HE
LP
FA
CIL
ITIE
S
US
AB
ILIT
Y
FL
EX
IBIL
ITY
AD
HO
CP
RO
CE
SS
ING
US
ER
SU
PP
OR
T
TR
AIN
ING
ME
ET
S P
RE
SE
NT
BU
SIN
ES
S
ME
ET
S F
UT
UR
EB
US
INE
SS
* Improvement comments provided by COPES users survey
• The current use of COPES has exceeded the originalscope - cannot process Criminal Justice Incentive pay,deferred compensation, flexible spending account, etc.
• Not an executive Management system• Many agencies had or have developed shadow and
feeder systems to provide functionality not available inCopes or automatic interfaces with FLAIR. Otheragencies have created systems to deal with lack ofreports to meet their needs
• Not considered flexible or user friendly, no flexiblereporting system, one compatible with MS products
• Manual entry of data creates room for error• Lack of funding has limited COPES changes/
enhancements, changes are difficult• Many agencies and FLAIR itself utilize different codes
and definitions of data elements (i.e., EEO, Sex codes)The only error processing performed is during batchprocess, not during data entry
• Many processes require re-entering data, users musttraverse multiple input screens to enter one transaction
• There were several requests to have more than oneyear’s history online
• Better selective printing facilities• Can not handle all Payroll functions such as call-back
time, excluded overtime pay, defferred compensation outof leave payments, overtime after the employee has leftthe agency and severance pay, criminal justice incentivepay, leave payments that have tax deferrals, multiplecost accounting capability, grant funding, and postpayroll process
• Should be available at 7:00 AM• Better training• Combine employee deductions to one screen - have to
access FLAIR to determine if there are levys, childsupport, deferred compensation, etc.
Improvements Needed*:Functional QualityCOPES
Functional QualityCOPES
Provided
Required
����������������������������������������������������������������������������������������������������������������������������������������������������������������������������������������������������������������������������������������������������������������������������������������������������������������������������������������������������������������������������������������������������������������
Excellent
Good
Fair
Unacceptable
�����������������������������������������������������������������������������������������������������������������������������������������������������������������������������������������������������������������������������������������������������������������������������������������������������������������������������������������������������������������������������������������������������������������������������������������������������������������������������������������������������������������������������������������������������������������������������������������������������������������������������������������������������������������������������������������������������������������������������������������������������������������������������������������������������������������������������������������������������������������������������������������������������������������������������������������������������������������������������������������������������������������������������������������������������������������������������������������������������������������������������������������������������������������������������������������������������������������������������������������������������������������������������������������������������
������������������������������������������������������������������������������������������������������������������������������������������������������������������������������������������������������������������������������������������������������������������������������������������������������������������������������������������������������������������������������������������������������������������������������������������������������������������������������������������������������������������������������������������������������������������������������������������������������������������������������������������������������������������������������������������������������������������������������������������������������������������������������������������������������������������������������������������������������������������������������������������������������������������������������������������������������������������������������������������������������������������������������������������������������������������������������������������������������������������
Excellent
Good
Fair
Unacceptable
AC
CU
RA
CY
SE
CU
RIT
YF
EA
TU
RE
S
AB
ILIT
Y T
OIN
TE
RF
AC
E
US
E O
FR
ES
OU
RC
ES
PO
RT
AB
ILIT
Y
EA
SE
OF
AN
AL
YS
IS
EA
SE
OF
MA
KIN
GC
HA
NG
ES
TE
ST
ING
PR
OB
LE
MR
ES
OL
UT
ION
RE
LIA
BIL
ITY
IN
OP
ER
AT
ION
ST
AN
DA
RD
CO
MP
LIA
NC
E
EA
SE
OF
OP
ER
AT
ION
Technical Quality–COPES
Application Portfolio Analysis - TQ

4—IT Assessment Business Case Study
Final ReportPage 4-32
kpmg
��������������������������������������������������������������������������������������������������������������������������������������������������������������������������������������������������������������������������������������������������������������������������������������������������������������������������������������������������������������������������������������������������������������������������������������������������������������������������������������������������������������������������������������������������������������������������������������������������������������������������������������������������������������������������������������������������������������������������������������������������������������������������������������������������������������������������������������������������������������������������������������������������������������������������������������������������������������������������������������������������������������������������������������������������������������������������������������������������������������������������������������������������������������������������������������������������������������������������������������������������������������������������������������������������������������������������������������������������������������������������������������������������������������������������������������������������������������������������������������������������������������������������������������������������������������������
1
2
3
4
5
AC
CU
RA
CY
RE
SP
ON
SIV
EN
ES
S
DA
TA
CU
RR
EN
CY
SE
CU
RIT
Y
AV
AIL
AB
ILIT
Y
EA
SE
OF
US
E
HE
LP
FA
CIL
ITIE
S
US
AB
ILIT
Y
FL
EX
IBIL
ITY
AD
HO
CP
RO
CE
SS
ING
US
ER
SU
PP
OR
T
TR
AIN
ING
ME
ET
S P
RE
SE
NT
BU
SIN
ES
S
ME
ET
S F
UT
UR
EB
US
INE
SS
* Improvement comments provided by CMS users survey
• More help with training
• Time of printing reports
• Excessive "Run Time" errors that kickyou out of the system, causing you to logback in and start job over
• Cannot update records in ConsolidatedRevolving Account System - sequencingissues
• Some kind of archive mechanism needsto be established for cleared bankrecords
• Communication is poor between the usergroup and Tech Support
Improvements Needed*:
Functional QualityCMS
Functional QualityCMS
Provided
Required
��������������������������������������������������������������������������������������������������������������������������������������������������������������������������������������������������������������������������������������������������������������������������������������������������������������������������������������������������������������������������������������������������������������������������������
Excellent
Good
Fair
Unacceptable
�������������������������������������������������������������������������������������������������������������������������������������������������������������������������������������������������������������������������������������������������������������������������������������������������������������������������������������������������������������������������������������������������������������������������������������������������������������������������������������������������������������������������������������������������������������������������������������������������������������������������������������������������������������������������������������������������������������������������������������������������������������������������������������������������������������������������������������������������������������������������������������������������������������������������������������������������������������������������������������������������������������������������������������������������������������������������������������������������������������������������������������������������������������������������������������������������������������������������������������������������������������������������������������������������������������������
������������������������������������������������������������������������������������������������������������������������������������������������������������������������������������������������������������������������������������������������������������������������������������������������������������������������������������������������������������������������������������������������������������������������������������������������������������������������������������������������������������������������������������������������������������������������������������������������������������������������������������������������������������������������������������������������������������������������������������������������������������������������������������������������������������������������������������������������������������������������������������������������������������������������������������������������������������������������������������������������������������������������������������������������������������������������������������������������������������������������������
Excellent
Good
Fair
Unacceptable
AC
CU
RA
CY
SE
CU
RIT
YF
EA
TU
RE
S
AB
ILIT
Y T
OIN
TE
RF
AC
E
US
E O
FR
ES
OU
RC
ES
PO
RT
AB
ILIT
Y
EA
SE
OF
AN
AL
YS
IS
EA
SE
OF
MA
KIN
GC
HA
NG
ES
TE
ST
ING
PR
OB
LE
MR
ES
OL
UT
ION
RE
LIA
BIL
ITY
INO
PE
RA
TIO
N
ST
AN
DA
RD
CO
MP
LIA
NC
E
EA
SE
OF
OP
ER
AT
ION
Application Portfolio Analysis - TQ
Technical Quality–CMS

Business Case Study 4—IT Assessment
Final ReportPage 4-33
kpmg
�������������������������������������������������������������������������������������������������������������������������������������������������������������������������������������������������������������������������������������������������������������������������������������������������������������������������������������������������������������������������������������������������������������������������������������������������������������������������������������������������������������������������������������������������������������������������������������������������������������������������������������������������������������������������������������������������������������������������������������������������������������������������������������������������������������������������������������������������������������������������������������������������������������������������������������������������������������������������������������������������������������������������������������������������������������������������������������������������������������������������������������������������������������������������������������������������������������������������������������������������������������������������������������������������������������������������������������������������������������������������������������������������������������������������������������������������������������������������������������������������������������������������������������������������������������������������������������������������������������������������������������������������������������������������������������
1
2
3
4
5
AC
CU
RA
CY
RE
SP
ON
SIV
EN
ES
S
DA
TA
CU
RR
EN
CY
SE
CU
RIT
Y
AV
AIL
AB
ILIT
Y
EA
SE
OF
US
E
HE
LP
FA
CIL
ITIE
S
US
AB
ILIT
Y
FL
EX
IBIL
ITY
AD
HO
CP
RO
CE
SS
ING
US
ER
SU
PP
OR
T
TR
AIN
ING
ME
ET
S P
RE
SE
NT
BU
SIN
ES
S
ME
ET
S F
UT
UR
EB
US
INE
SS
* Improvement comments provided by FLAIR CA users survey
• Data is redundant to data in DepartmentalAccounting
• System is batch processing, normally one daybehind real time
• History file for Journal Transfers should beenhanced to have the functionality of the VendorHistory File
• System to be updated on-line or "real time",including enabling agencies to delete and/ormodify payments in pending status
• System should know if a SWD# is a voucher orJT, similar pitfalls should be eliminated
• Make payments from multiple sources, someagencies have many funding sources andredistribution of cost is a major workload
• User friendly input and browse screens, includingthe ability to find data using various fields andability to get all needed information at the firstlook up screen
• All codes used in Departmental should beavailable in Central
• Easily invest funds, either automated or byaccounting transaction
• Journal transfers between agencies should go toa pending area/status until approved by thereceiving agency
• GUI interface including the ability to have morethan one screen up at a time
• Additional accounting functionality, i.e., studentaccounting functions, accounts receivable,financial aid disbursements, financial aid awards,cashiering, etc.
Improvements Needed*:Functional QualityFLAIR CA
Functional QualityFLAIR CA
Provided
Required
������������������������������������������������������������������������������������������������������������������������������������������������������������������������������������������������������������������������������������������������������������������������������������������������������������������������������������������������������������������������������������������������������������������������
Excellent
Good
Fair
Unacceptable
��������������������������������������������������������������������������������������������������������������������������������������������������������������������������������������������������������������������������������������������������������������������������������������������������������������������������������������������������������������������������������������������������������������������������������������������������������������������������������������������������������������������������������������������������������������������������������������������������������������������������������������������������������������������������������������������������������������������������������������������������������������������������������������������������������������������������������������������������������������������������������������������������������������������������������������������������������������������������������������������������������������������������������������������������������������������������������������������������������������������������������������������������������������������������������������������������������������������������������������������������������������������������������������������������������������������������������������������������������������������������������������������������������������������������������������������������������������������������������������������������������������������������������������������������������������������������������������������������������������������������������
1
2
3
4
5
AC
CU
RA
CY
RE
SP
ON
SIV
EN
ES
S
DA
TA
CU
RR
EN
CY
SE
CU
RIT
Y
AV
AIL
AB
ILIT
Y
EA
SE
OF
US
E
HE
LP F
AC
ILIT
IES
US
AB
ILIT
Y
FLE
XIB
ILIT
Y
AD
HO
CP
RO
CE
SS
ING
US
ER
SU
PP
OR
T
TR
AIN
ING
ME
ET
S P
RE
SE
NT
BU
SIN
ES
S
ME
ET
S F
UT
UR
EB
US
INE
SS
* Improvement comments provided by FLAIR IW users survey
• Some Agencies have expressed that littlereliance can be placed on this system due touser unfriendly tools. It is difficult tocorrectly use the multiple key indexes andfurther supported by a request for traveldata by the BPR team.
• Easier to use tools are needed, it takes atechnical programming type person todesign an ad hoc report
• The current data store has only CentralAccounts data, other components of datashould be available
• System has been reported to be slow andawkward
• Some agencies report that the system is notavailable on some key days, like year end
• Tables, fields and data dictionaries shouldbe relatively constant and communicatedwhen changes are necessary
• Fields used in Departmental Accounting andAgency Unique codes to be included on thetransactions
• Security requires yet another password andit expires in 30 days, much too soon for asystem utilized as infrequently as awarehouse
• Need GUI interface
Improvements Needed*:Functional QualityFLAIR IW
Functional QualityFLAIR IW
Provided
Required
��������������������������������������������������������������������������������������������������������������������������������������������������������������������������������������������������������������������������������������������������������������������������������������������������������������������������������������������������������������������������������������������������������
Excellent
Good
Fair
Unacceptable

4—IT Assessment Business Case Study
Final ReportPage 4-34
kpmg
������������������������������������������������������������������������������������������������������������������������������������������������������������������������������������������������������������������������������������������������������������������������������������������������������������������������������������������������������������������������������������������������������������������������������������������������������������������������������������������������������������������������������������������������������������������������������������������������������������������������������������������������������������������������������������������������������������������������������������������������������������������������������������������������������������������������������������������������������������������������������������������������������������������������������������������������������������������������������������������������������������������������������������������������������������������������������������������������������������������������������������������������������������������������������������������������������������������������������������������������������������������������������������������������������������������������������������������������������������������������������������������������������������������������������������������������������������������������������������������������������������������������������������������������������������������������������������������������������������������������������������������������������������������������������������������������������������������������������������������������������������������������������1
2
3
4
5
AC
CU
RA
CY
RE
SP
ON
SIV
EN
ES
S
DA
TA
CU
RR
EN
CY
SE
CU
RIT
Y
AV
AIL
AB
ILIT
Y
EA
SE
OF
US
E
HE
LP
FA
CIL
ITIE
S
US
AB
ILIT
Y
FL
EX
IBIL
ITY
AD
HO
CP
RO
CE
SS
ING
US
ER
SU
PP
OR
T
TR
AIN
ING
ME
ET
S P
RE
SE
NT
BU
SIN
ES
S
ME
ET
S F
UT
UR
EB
US
INE
SS
* Improvement comments provided by FLAIR DA users survey
• Transactions between Agencies to update bothagencies records
• Better edits at the time of entry
• Ability to easily interface with Agency Specific shadowsystems
• User friendly input and browse screens, including theability to find data using various fields and ability to getall needed information at the first look up screen
• Reconciliations between systems is a big workload
• More levels in Organization code
• Real time updates, eliminate two day delay in batchprocessing
• User friendly ad hoc reporting and GUI interface
• More paperless technology, i.e., electronic invoicing
• Vendor history information
• Systems should be more integrated i.e., Vendor inSPURS=Departmental, CMS projections migrate tomicro projections in Agency fund, COPES/Payroll datashould create Departmental Accounting transactions,Central and Departmental should have same cashbalances
• System should be more flexible to permit change inpolicy/law/reporting requirements
• Able to make payments from multiple funds on onewarrant or an automated allocation process
• Unit Cost support/functionality
• Provision for a true management tool to performcomparisons of current year budget to actualexpenditures; perform cost accounting; allow forecastinginto future years; provide calculation of depreciation
• Ability to aggregate financial information from multiplefunding entities
• Accept input from bar code readers and scanners
• Ability to track and report on contract and grant activity
Improvements Needed*:Functional QualityFLAIR DA
Functional QualityFLAIR DA
Provided
Required
��������������������������������������������������������������������������������������������������������������������������������������������������������������������������������������������������������������������������������������������������������������������������������������������������������������������������������������������������������������������������������������������������������������������������������
Excellent
Good
Fair
Unacceptable
������������������������������������������������������������������������������������������������������������������������������������������������������������������������������������������������������������������������������������������������������������������������������������������������������������������������������������������������������������������������������������������������������������������������������������������������������������������������������������������������������������������������������������������������������������������������������������������������������������������������������������������������������������������������������������������������������������������������������������������������������������������������������������������������������������������������������������������������������������������������������������������������������������������������������������������������������������������������������������������������������������������������������������������������������������������������������������������������������������������������������������������������������������������������������������������������������������������������������������������������������������������������������������������������������������������������������������������������������������������������������������������������������������������������������������������������������������������������������������������������������������������������������������������������������������������������������������������������������������������������������������������������������������������������������������������������������1
2
3
4
5
AC
CU
RA
CY
RE
SP
ON
SIV
EN
ES
S
DA
TA
CU
RR
EN
CY
SE
CU
RIT
Y
AV
AIL
AB
ILIT
Y
EA
SE
OF
US
E
HE
LP
FA
CIL
ITIE
S
US
AB
ILIT
Y
FL
EX
IBIL
ITY
AD
HO
CP
RO
CE
SS
ING
US
ER
SU
PP
OR
T
TR
AIN
ING
ME
ET
S P
RE
SE
NT
BU
SIN
ES
S
ME
ET
S F
UT
UR
EB
US
INE
SS
* Improvement comments provided by FLAIR PR users survey
• Agencies to have access to payroll history with queryabilities. Data should be available for a longer period oftime.
• User friendly input and browse screens, including theability to find data using various fields and ability to get allneeded information at the first look up screen and ad hocreporting
• Integration with COPES and other FLAIR systems so thatall systems have complete and consistent information
• All additives to be included on regular paycheck• Real-time time and leave processing• Electronic signatures for personnel actions and
management approvals to eliminate paper pushing• Timely updates of Departmental Records• Central location to access payroll/personnel system
support. Currently DMS and/or BOSP.• Better and faster way to correct erroneous
insurance/benefit deductions• Transactions to be time delimited so that proper rates and
limits are applied• Ability to get an emergency wage payment timely• Automate all payment types• Enhance edits for duplicate payments• Automate the calculations for partial payments and
overtime• Flexibility to meet specific needs of agency• Ability to request perquisites by class• More timely reports after payroll processing to detect
errors prior to wt. dt.• Benefit information to go with employee when employee
transfers• Payroll System to address IRS reporting requirements• Need for system to quickly respond to changes required
by law or policy• Ability to make real-time updates for w-4 or adjustments
etc.
Improvements Needed*:Functional QualityFLAIR PR
Functional QualityFLAIR PR
Provided
Required
������������������������������������������������������������������������������������������������������������������������������������������������������������������������������������������������������������������������������������������������������������������������������������������������������������������������������������������������������������������������������������������������������������������������
Excellent
Good
Fair
Unacceptable

Business Case Study 4—IT Assessment
Final ReportPage 4-35
kpmg
������������������������������������������������������������������������������������������������������������������������������������������������������������������������������������������������������������������������������������������������������������������������������������������������������������������������������������������������������������������������������������������������������������������������������������������������������������������������������������������������������������������������������������������������������������������������������������������������������������������������������������������������������������������������������������������������������������������������������������������������������������������������������������������������������������������������������������������������������������������������������������������������������������������������������������������������������������������������������������������������������������������������������������������������������������������������������������������������������������������������������������������������������������������������������������������������������������������������������������������������������������������������������������������������������������������������������������������������������������������������������������������������������������������������������������������������������������������������������������������������������������������������������������������������������������������������������������������������������������������������
���������������������������������������������������������������������������������������������������������������������������������������������������������������������������������������������������������������������������������������������������������������������������������������������������������������������������������������������������������������������������������������������������������������������������������������������������������������������������������������������������������������������������������������������������������������������������������������������������������������������������������������������������������������������������������������������������������������������������������������������������������������������������������������������������������������������������������������������������������������������������������������������������������������������������������������������������������������������������������������������������������������������������������������������������������������������������������������������������������������������������������������������������������������������������������������������������������������������������������������������������������������������������������������������������������������������������������������������������������������������������������������������������������������������
Excellent
Good
Fair
Unacceptable
AC
CU
RA
CY
SE
CU
RIT
YF
EA
TU
RE
S
AB
ILIT
Y T
OIN
TE
RF
AC
E
US
E O
FR
ES
OU
RC
ES
PO
RT
AB
ILIT
Y
EA
SE
OF
AN
AL
YS
IS
EA
SE
OF
MA
KIN
GC
HA
NG
ES
TE
ST
ING
PR
OB
LE
MR
ES
OL
UT
ION
RE
LIA
BIL
ITY
IN
OP
ER
AT
ION
ST
AN
DA
RD
CO
MP
LIA
NC
E
EA
SE
OF
OP
ER
AT
ION
Application Portfolio Analysis - TQ
Technical Quality–FLAIR (All Components)
Part of the Functional Quality Survey was to ask the end users of the FFMISsubsystems how the applications meet their present and future business needs.They rated the overall application from 1 to 5 as follows:
1 = New Application Required2 = Major Enhancement Needed3 = Significant Modifications Required4 = Minor Modifications Required5 = Completely Acceptable As Is
The following charts show the result of this important attribute of the subsystems byaverage response by application, then by the percentage of respondents in each ofthe five categories by application. The consensus is that most of the subsystems donot meet the State of Florida’s current or future needs.
Overall Functional Quality AssessmentOverall Functional Quality Assessment

4—IT Assessment Business Case Study
Final ReportPage 4-36
kpmg
������������������������������������������������������������������������������������������������������������������������������������������������������������������������������������������������������������������������������������������������������������������������������������������������������������������������������������������������������������������������������������������������������������������������������������������������������������������������������������������������������������������������������������������������������������������������������������������������������������������������������������������������������������������������������������������������������������������������������������������������������������������������������������������������������������������������������������������������������������������������������������������������������������������������������������������������������������������������������������������������������������������������������������������������������������������������������������������������������������������������������������������������������������������������������������������������������������������������������������
������������������������������������������������������������������������������������������������������������������������������������������������������������������������������������������������������������������������
Overall FQ Assessment
0.0
0.5
1.0
1.5
2.0
2.5
3.0
3.5
4.0
4.5
5.0
FL
AIR
CA
FL
AIR
DA
FL
AIR
PR
FL
AIR
IW
CO
PE
S
Co
pes
Vie
w
SP
UR
S
Sp
urs
Vie
w
LA
S/P
BS
CM
S
Ve
nd
or
Bid
Meets Current Business Needs Meets Future Business Needs
�������������������������������������������������������������������������������������������������������������������������������������������������������������������������������������������������������������������������������������������������������������������������������������������������������������������������������������������������������
��������������������������������������������������������������������������������������������������
• Almost all applications will notmeet the future businessneeds of the State of Florida
• Most applications are barelymeeting current businessrequirements
• Significant modifications needto be made to at least sixapplications
• Modifications will affect thoseapplications that need onlyminor modifications
Overall Functional Quality AssessmentOverall Functional Quality Assessment
Acceptable As Is
Minor Modifications Required
Significant Modifications Required
Major Enhancement Required
New Application Required
�������������������������������������������������������������������������������������������������������������������������������������������������������������������������������������������������������������������������������������������������������������������������������������������������������������������������������������������������������������������������������������������������������������������������������������������������������������������������������������������������������������������������������������������������������������������������������������������������������������������������������������������������������������������������������������������������������
FLAIR Central Accounting
0%
20%
40%
60%
80%
100%
1 2 3 4 5
Meets Present Business Meets Future Business
��������������������������������������������������������������������������������������������������������������������������������������������������������������������������������������������������������������������������������������������������������������������������������������������������������������������������������������������������������������������������������������������������������������������������������������������������������������������������������������������������������������������������������������������������������������������������������������������������������������������������������������������������������������������������������������������������������������
FLAIR Department Accounting
0%
20%
40%
60%
80%
100%
1 2 3 4 5
��������������������������������������������������������������������������������������������������������������������������������������������������������������������������������������������������������������������������������������������������������������������������������������������������������������������������������������������������������������������������������������������������������������������������������������������������������������������������������������������������������������������������������������������������������������������������������������������������������������������������������������������������������������������������������������������������������������
FLAIR Payroll
0%
20%
40%
60%
80%
100%
1 2 3 4 5
�������������������������������������������������������������������������������������������������������������������������������������������������������������������������������������������������������������������������������������������������������������������������������������������������������������������������������������������������������������������������������������������������������������������������������������������������������������������������������������������������������������������������������������������������������������������������������������������������������������������������������������������������������������������������������������������������������
FLAIR Information Warehouse
0%
20%
40%
60%
80%
100%
1 2 3 4 5
Overall Functional Quality Assessment ChartsOverall Functional Quality Assessment Charts
Meets Present Business Meets Future Business
Meets Present Business Meets Future Business Meets Present Business Meets Future Business

Business Case Study 4—IT Assessment
Final ReportPage 4-37
kpmg
������������������������������������������������������������������������������������������������������������������������������������������������������������������������������������������������������������������������������������������������������������������������������������������������������������������������������������������������������������������������������������������������������������������������������������������������������������������������������������������������������������������������������������������������������������������������������������������������
COPES
0%
20%
40%
60%
80%
100%
1 2 3 4 5
��������������������������������������������������������������������������������������������������������������������������������������������������������������������������������������������������������������������������������������������������������������������������������������������������������������������������������������������������������������������������������������������������������������������������������������������������������������������������������������������������������������������������������������������������������������������������������������������������������������������������������������������������������������������������������������������������������������
CopesView
0%
20%
40%
60%
80%
100%
1 2 3 4 5
������������������������������������������������������������������������������������������������������������������������������������������������������������������������������������������������������������������������������������������������������������������������������������������������������������������������������������������������������������������������������������������������������������������������������������������������������������������������������������������������������������������������������������������������������������������������������������������������������������������������������������������������������������������������������������������������
SPURS
0%
20%
40%
60%
80%
100%
1 2 3 4 5
������������������������������������������������������������������������������������������������������������������������������������������������������������������������������������������������������������������������������������������������������������������������������������������������������������������������������������������������������������������������������������������������������������������������������������������������������������������������������������������������������������������������������������������������������������������������������������������������������������
SpursView
0%
20%
40%
60%
80%
100%
1 2 3 4 5
Overall Functional Quality Assessment ChartsOverall Functional Quality Assessment Charts
Meets Present Business Meets Future Business Meets Present Business Meets Future Business
Meets Present Business Meets Future Business Meets Present Business Meets Future Business
������������������������������������������������������������������������������������������������������������������������������������������������������������������������������������������������������������������������������������������������������������������������������������������������������������������������������������������������������������������������������������������������������������������������������������������������������������������������������������������������������������������������������������������������������������������������������������������������
LAS/PBS
0%
20%
40%
60%
80%
100%
1 2 3 4 5
������������������������������������������������������������������������������������������������������������������������������������������������������������������������������������������������������������������������������������������������������������������������������������������������������������������������������������������������������������������������������������������������������������������������������������������������������������������������������������������������������������������������������������������������������������������������������������������������������������������
CMS
0%
20%
40%
60%
80%
100%
1 2 3 4 5
��������������������������������������������������������������������������������������������������������������������������������������������������������������������������������������������������������������������������������������������������������������������������������������������������������������������������������������������������������������������������������������������������������������������������������������������������������������������������������������������������������������������������������������������������������������������������������������������������������������������������������������������������������������������������������������������������������������
Vendor Bid System
0%
20%
40%
60%
80%
100%
1 2 3 4 5
Overall Functional Quality Assessment ChartsOverall Functional Quality Assessment Charts
Meets Present Business Meets Future Business Meets Present Business Meets Future Business
Meets Present Business Meets Future Business

4—IT Assessment Business Case Study
Final ReportPage 4-38
kpmg
* Information obtained through interviews & questionnaires * Information obtained through interviews & questionnaires
• Core legacy systems usehierarchical and inverted listdatabases
• Client/Server and webapplications use relationaldatabases
• One database can notautomatically update anotherdatabase with the sametransaction
• Hierarchical DBs are difficultfor reporting
• Applications that usehierarchical DBs are costlyand time consuming tochange
Multiple databases for FFMIS subsystems lead to difficulty in exchanging data
Multiple databases for FFMIS subsystems lead to difficulty in exchanging data
SYSTEM OracleUnisys DMS
AdabasC
IBM Universal DB2
CMS XSPURS XSPURSView XVendor Bid XCOPES XCOPESView XFLAIR XFLAIR IW XLAS/PBS X
Databases*
* Information obtained in Y2k Agency File Interface Directory 9/1999
• FFMIS subsystems account for652 out of 1,451 interfaces theState of Florida uses to sharedata
• The high number of interfacesindicate that agencies’ functionalneeds are not fully provided byFFMIS
• Interfaces are costly to maintain
• Changes to interfaces canadversely affect an agency
• Any change to the core FFMISsystem could result inproblems/changes to interface(s)
• Of all the State of Florida’s dataprocessing systems, FFMISaccounts for 44.9 percent of allinterfaces
Interfaces were built because the FFMIS subsystems do not support all of the functionality required by agencies
Interfaces were built because the FFMIS subsystems do not support all of the functionality required by agencies
Total FFMIS Interfaces
118
242
16
84
55
122
12
3
Copes
FLAIR
SPURS
CA
DA
PR
LAS/PBS
CMS
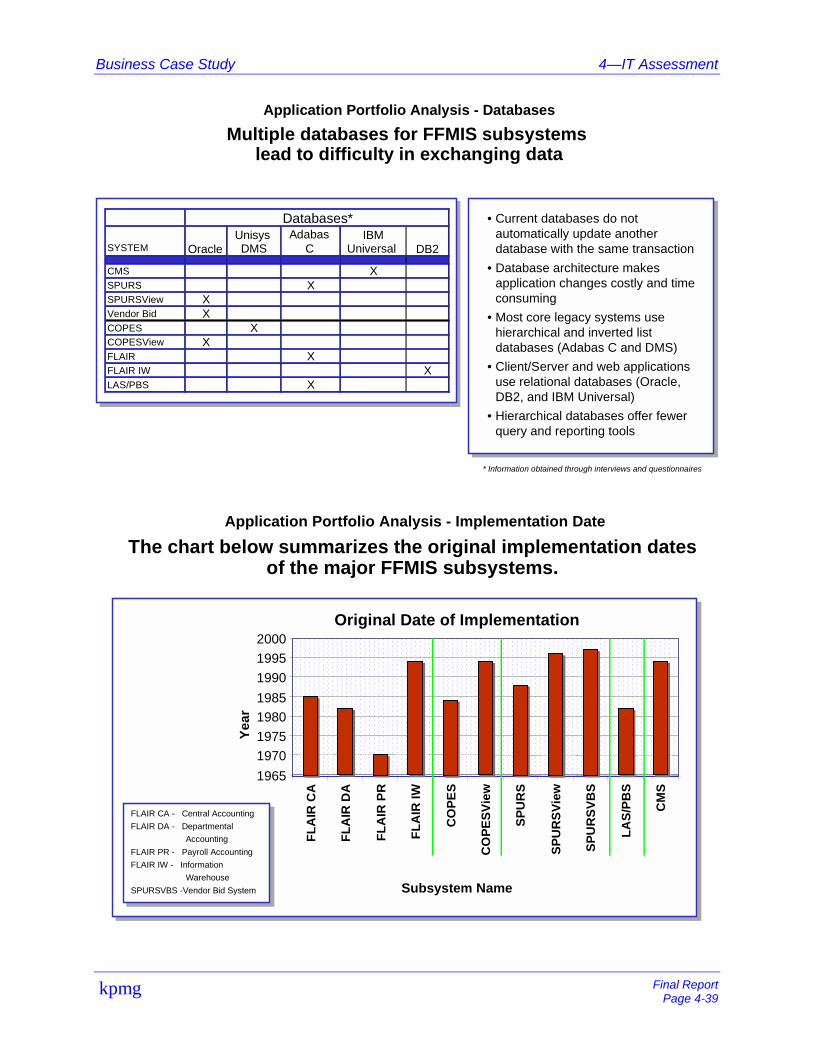
Business Case Study 4—IT Assessment
Final ReportPage 4-39
kpmg
Multiple databases for FFMIS subsystems lead to difficulty in exchanging data
* Information obtained through interviews and questionnaires
SYSTEM OracleUnisys DMS
AdabasC
IBM Universal DB2
CMS XSPURS XSPURSView XVendor Bid XCOPES XCOPESView XFLAIR XFLAIR IW XLAS/PBS X
Databases*
Application Portfolio Analysis - Databases
• Current databases do notautomatically update anotherdatabase with the same transaction
• Database architecture makesapplication changes costly and timeconsuming
• Most core legacy systems usehierarchical and inverted listdatabases (Adabas C and DMS)
• Client/Server and web applicationsuse relational databases (Oracle,DB2, and IBM Universal)
• Hierarchical databases offer fewerquery and reporting tools
Application Portfolio Analysis - Implementation Date
The chart below summarizes the original implementation dates of the major FFMIS subsystems.
����������������������������������������������������������������������������������������������������������������������������������������������������������������������������������������������������������������������������������������������������������������������������������������������������������������������������������������������������������������������������������������������������������������������������������������������������������������������������������������������������������������������������������������������������������������������������������������������������������������������������������������������������������������������������������������������������������������������������������������������������������������������������������������������������������������������������������������������������������������������������������������������������������������������������������������������������������������������������������������������������������������������������������������������������������������������������������������������������������������������������������������������������������������������������������������������������������������������������������������������������������������������������������������������������������������������������������������������������������������������������������������������������������������������������������������������������������������������������������������������������������������������������������������������������������������������������������������������������
Original Date of Implementation
1965
1970
1975
1980
1985
1990
1995
2000
FL
AIR
CA
FL
AIR
DA
FL
AIR
PR
FL
AIR
IW
CO
PE
S
CO
PE
SV
iew
SP
UR
S
SP
UR
SV
iew
SP
UR
SV
BS
LA
S/P
BS
CM
S
Subsystem Name
Ye
ar
FLAIR CA - Central Accounting
FLAIR DA - Departmental
Accounting
FLAIR PR - Payroll Accounting
FLAIR IW - Information
Warehouse
SPURSVBS -Vendor Bid System
FLAIR CA - Central Accounting
FLAIR DA - Departmental
Accounting
FLAIR PR - Payroll Accounting
FLAIR IW - Information
Warehouse
SPURSVBS -Vendor Bid System

4—IT Assessment Business Case Study
Final ReportPage 4-40
kpmg
This page intentionally left blank.

Business Case Study 5—System Requirements
Final Report Page 5-1 kpmg
5. System Requirements5.1 Methodology
The System Requirements Phase allowed KPMG to gain consensus on system requirements as they
pertain to the current or proposed Florida Financial Management Information System (FFMIS)
subsystems. The System Requirements Phase included understanding and documenting the State’s key
technical and business requirements. KPMG used existing State material, industry best practices, results
of the IT Assessment and Business Process Reengineering (BPR) components, and KPMG technical
leaders’ experiences to build a draft of system requirements. Key State personnel reviewed the draft of
system requirements. KPMG conducted workshops to finalize the requirements.
KPMG developed a set of high-level system requirements to form a basis for measuring the functionality
of the five system options in our evaluation. The requirements are not intended to be a full set of
functionality requirements that should be present in the final solution.
The IT Team developed an initial draft of the As-Is system requirements using various methods. KPMG’s
methodology to develop the requirements is illustrated in Exhibit 5-1.
Exhibit 5-1Requirements Development
KPMG’s approach involved first analyzing each subsystem by reviewing system documentation and
deriving requirements from that review. We compared each derived requirement to a set of requirements
developed from other states, and from KPMG’s experience in identifying best-in-class requirement
standards. This comparison helped to evaluate the relevance and substance of each requirement derived
from the documentation. Expert users and leaders from a cross-section of State agencies reviewed the
Best-in-ClassDocumentation
KPMGExperience
ExistingSystem
Documentation
SystemFunctional
Requirements
BusinessProcess
Reengineering
StateExpert User/Leaders
EvaluateOptions andAlternatives
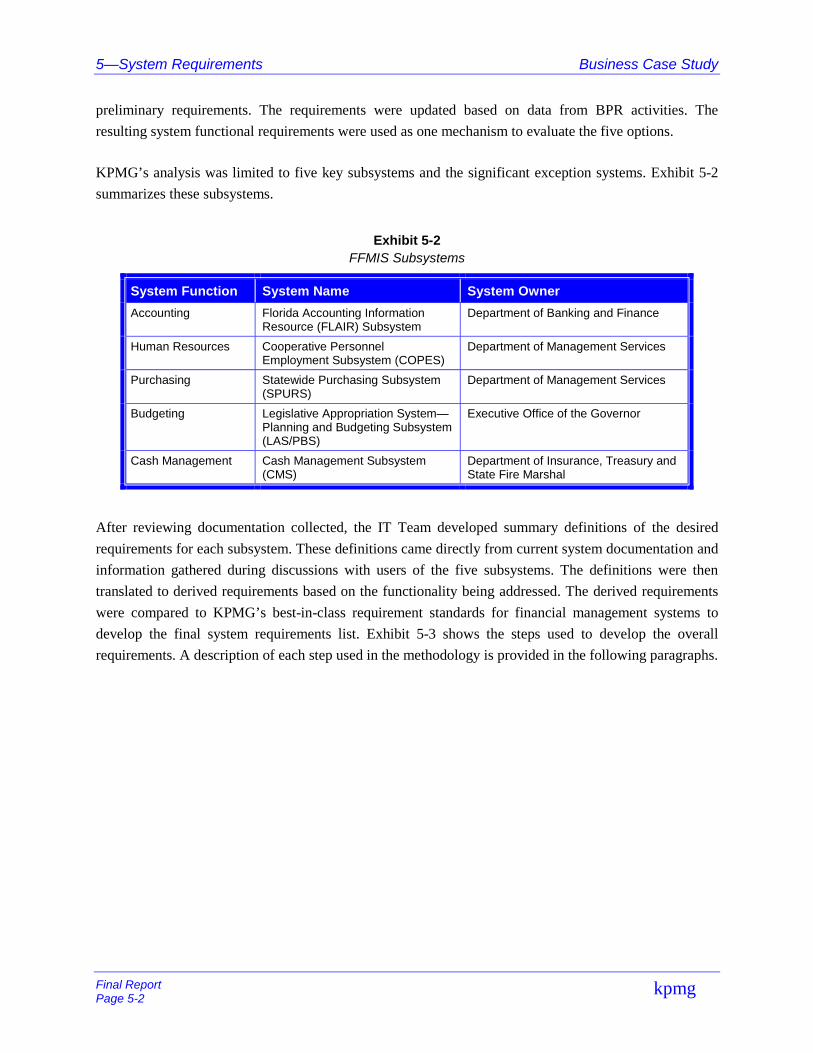
5—System Requirements Business Case Study
Final ReportPage 5-2
kpmg
preliminary requirements. The requirements were updated based on data from BPR activities. The
resulting system functional requirements were used as one mechanism to evaluate the five options.
KPMG’s analysis was limited to five key subsystems and the significant exception systems. Exhibit 5-2
summarizes these subsystems.
Exhibit 5-2FFMIS Subsystems
System Function System Name System Owner
Accounting Florida Accounting InformationResource (FLAIR) Subsystem
Department of Banking and Finance
Human Resources Cooperative PersonnelEmployment Subsystem (COPES)
Department of Management Services
Purchasing Statewide Purchasing Subsystem(SPURS)
Department of Management Services
Budgeting Legislative Appropriation System—Planning and Budgeting Subsystem(LAS/PBS)
Executive Office of the Governor
Cash Management Cash Management Subsystem(CMS)
Department of Insurance, Treasury andState Fire Marshal
After reviewing documentation collected, the IT Team developed summary definitions of the desired
requirements for each subsystem. These definitions came directly from current system documentation and
information gathered during discussions with users of the five subsystems. The definitions were then
translated to derived requirements based on the functionality being addressed. The derived requirements
were compared to KPMG’s best-in-class requirement standards for financial management systems to
develop the final system requirements list. Exhibit 5-3 shows the steps used to develop the overall
requirements. A description of each step used in the methodology is provided in the following paragraphs.

Business Case Study 5—System Requirements
Final Report Page 5-3 kpmg
Exhibit 5-3KPMG’s Methodology
STEP 1Review ExistingDocumentation
STEP 5Perform Requirements
Union
STEP 4Derive Requirements from
System Documentation
STEP 2Identify and Document
System Processesand Procedures
STEP 6Refine Requirements
IT TEAM
ExternalKPMG
STEP 3Review Best-in-Class
Requirements
BPR TEAM
STEP 7Develop FinalRequirements
State Users /Leaders
Step 1—Review Existing Documentation
KPMG’s process began with Step 1 as illustrated in Exhibit 5-3. The KPMG Team collected the
following documentation to assist in developing requirements for the financial management systems:
! System documentation, user manuals, and procedure manuals for FLAIR, COPES, SPURS,LAS/PBS, and CMS
! Department of Management Services (DMS) Human Resources/Payroll Request for Proposal(DMS 97/98-001)
! Public Services Financial Management Systems Request for Proposal documents from Indiana,Kentucky, Michigan, and North Carolina to be used for further review
Step 2—Identify and Document System Processes and Procedures
In Step 2, KPMG reviewed the documentation collected in Step 1 and developed a summary of the
procedures and interfaces involved in system operation. Along with the summaries, system process flows
(context diagrams) were developed to represent KPMG’s understanding of the flow of information within
each subsystem.

5—System Requirements Business Case Study
Final ReportPage 5-4
kpmg
Step 3—Review Best-in-Class Requirements
KPMG reviewed the RFP documents collected from various states for relevance, similarity, and level of
detail. We noted requirements that had relevance to the processes being performed by the FFMIS
subsystems and that were selected for further analysis. A hybrid of these requirements was selected to be
used as the best-in-class baseline.
Step 4—Derive Requirements from System Documentation
During Step 4, we developed a list of requirements using the deliverables prepared in Step 2. We
developed these requirements based on existing functionality in FLAIR, COPES, SPURS, LAS/PBS, and
CMS using:
! Procedure lists
! Process diagrams
! Context diagrams
! Survey instruments
The requirements extraction was performed by staff familiar with the operation of the system and
validated by staff experienced in system analysis and documentation of system functional and technical
requirements.
Step 5—Perform Requirements Union
In Step 5, we compared the derived financial management systems requirements to KPMG’s best-in-class
requirements obtained in Step 3. Requirements that were unique to Florida were coded as FL
requirements. Requirements that were identified both in State documentation and also in best-in-class
documentation were also coded as FL requirements. In addition, those best-in-class requirements that
were applicable were noted as BP requirements. Each type of requirement was then incorporated in the
System Requirements Document.
Step 6—Refine Requirements
In Step 6, feedback from the following sources was incorporated into KPMG’s System Requirements
Document:

Business Case Study 5—System Requirements
Final Report Page 5-5 kpmg
! 1999 Florida Statues—These statutes were reviewed to update requirements for the five keysubsystems
! BPR Team Findings—These findings identified areas where there might be new requirements orrecommendations for improvement. Shadow systems were also identified. Shadow systems aresystems used to perform a process outside the five key subsystems
! IT Team Deliverables:
– IT Assessment—Functional Quality Questionnaire: This questionnaire was sent to more than300 agency users and solicited feedback on the functionality of the five key subsystems.Included in the questionnaire were questions on new requirements and recommendations forimprovement
– IT Assessment—Technical Quality Questionnaire: This questionnaire was completed withapplication development leaders and solicited feedback on the technical soundness andquality of the five FFMIS subsystems
– IT Assessment—Application Inventory: The IT Team performed an inventory of theapplications and systems being used to perform financial management systems’ businessprocesses and placed the inventory in an Access database for further analysis
! External KPMG Resources:
– KPMG Industry Leaders—Key SAP, Oracle, and PeopleSoft industry leaders were eitherbrought on site or consulted to obtain feedback on the validity, breadth, and independence ofKPMG’s requirements
– KPMG Public Services Industry Practice Leaders—Partner-level financial system practiceleaders were consulted to validate and refine the list of requirements
Data from all sources was compiled and stored in requirement templates that were distributed to
functional and technical representatives for final feedback and input.
Step 7—Develop Final Requirements
In Step 7, the IT Team distributed the draft requirements, through the State’s Project Manager, to
appropriate representative users for review, comment, and validation. These users were asked to classify
the draft system requirements as:
! (H)igh—Capabilities that the current systems provide
! (M)edium—Capabilities that do not currently exist but are desirable
! (L)ow—Capabilities that have limited value
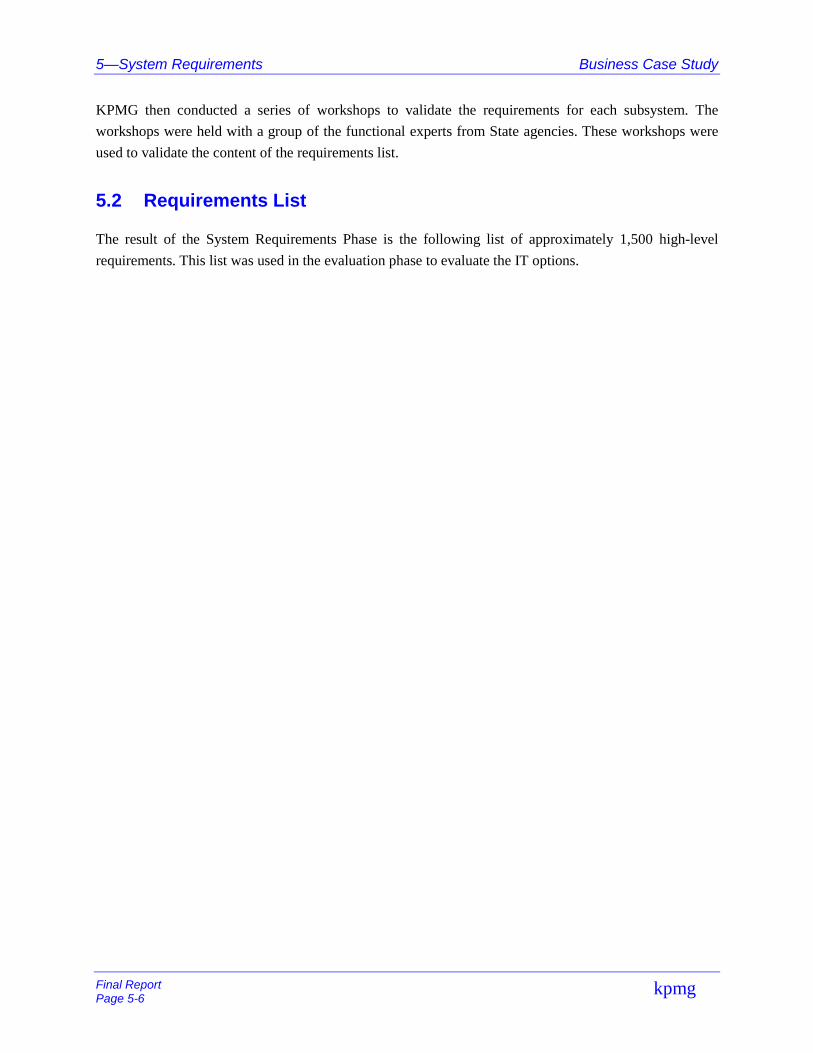
5—System Requirements Business Case Study
Final ReportPage 5-6
kpmg
KPMG then conducted a series of workshops to validate the requirements for each subsystem. The
workshops were held with a group of the functional experts from State agencies. These workshops were
used to validate the content of the requirements list.
5.2 Requirements List
The result of the System Requirements Phase is the following list of approximately 1,500 high-level
requirements. This list was used in the evaluation phase to evaluate the IT options.

Business Case Study 5—System Requirements
Type Meth Ref # Source Functional Requirements Description RankingPUR Core Requirements
2 2 1.1 FL Ability to provide on-line entry and updates of:2 2 1.1.1 Vendors2 2 1.1.2 Requisitions2 2 1.1.3 Bids2 2 1.1.4 Purchase orders2 2 1.1.5 Contracts2 2 1.1.6 Receiving reports2 2 1.1.7 Change orders/addenda2 2 1.1.8 Cancellations2 2 1.1.9 Planning1 3 1.2 FL Ability for the system to have default information based on user ID with
override capability:1 3 1.2.1 Bill to/Ship to information1 3 1.2.2 Accounting information1 3 1.2.3 Contact person and phone number with drill down capability for email
address and mailing address.1 4 1.3 BP Ability to, without drill down, view on-screen item descriptions, names, etc.
rather than codes on any document type.2 3 1.4 BPR Ability to access a user friendly commodity code system. (e.g. Indexing and
Drop down menu)2 3 1.5 FL Ability to issue changes on-line and cancel against the following posted
documents with appropriate security:2 3 1.5.1 Requisitions2 3 1.5.2 Purchase Orders 2 3 1.5.3 Contracts2 3 1.5.4 Bids (bid addenda)2 3 1.5.4 Receiving reports2 3 1.6 FL Ability to change any aspect of the document including but not limited to:
2 3 1.6.1 Account codes2 3 1.6.2 Header (including terms and conditions)2 3 1.6.3 Detail (commodity, quantity, unit cost, unit of measure and
specifications)2 3 1.6.4 Subcontractor information with appropriate edits2 4 1.7 FL Ability to automatically assign a unique source document number, in series,
(e.g. by agency) for the following:2 4 1.7.1 Requisitions2 4 1.7.2 PO’s2 4 1.7.3 Contracts 2 4 1.7.4 Change orders2 4 1.7.5 Amendments2 4 1.7.6 Receiving2 4 1.7.7 Blanket purchase order2 4 1.7.8 Bid requests1 4 1.7.9 Inventory Control1 4 1.7.10 Fixed Assets1 4 1.8 BP Ability to set up specific approval paths at the commodity level.2 3 1.9 BPR Ability to reverse the original impact of a canceled document (e.g. pre-
encumbrance and encumbrance).2 4 1.10 FL Ability to inquire and report against vendor and product history files using
user defined criteria e.g. date, commodity, user group, etc.
kpmgFinal Report
Page 5-64

Business Case Study 5—System Requirements
Type Meth Ref # Source Functional Requirements Description RankingPUR Core Requirements
2 4 1.11 FL Ability to support system or user generated requisition and purchase order numbers.
2 3 1.12 BPR Ability to support user defined on-line vendor registration (e.g. through the Web), including interactive assistance to guide vendors through the process.
2 5 1.13 BP Ability to support links for agencies to electronically submit vendor complaints to the buyers, and vice versa.
2 5 1.14 BP Ability for the buyer to enter on-line the resolution of the agency complaint.
2 5 1.15 BP Ability for the system to track the timely response of the buyer/agency to resolve the complaint.
2 5 1.16 BP Ability for complaints and resolutions to link to the vendor history file.1 5 1.17 BP Ability to maintain integrated pre-qualification records, including DBE
registration, engineering associations, staff experience, equipment, etc.
2 5 1.18 BPR Ability for vendors to look up their invoices on-line e.g. on the Web.2 2 1.19 FL Ability to store up to 999 vendor addresses with suffixes per vendor.2 4 1.20 FL Ability to maintain vendor records that, at a minimum, encompass the
following:2 4 1.20.1 All information contained in the vendor registration2 4 1.20.2 EFT information2 4 1.20.3 Performance history (delivery dates, etc.)2 4 1.20.4 Unique vendor number2 4 1.20.5 Contracts associated with the vendor2 4 1.20.6 Other user defined fields2 4 1.20.7 Vendor on-hold (not allowing payment or receipt of bids).2 4 1.20.8 1099 reportable2 4 1.20.9 Federal ID type2 4 1.20.10 Back-up withholding2 4 1.20.11 Products/services offered2 4 1.20.12 Product performance2 5 1.21 BP Ability to maintain an on-line database of each vendor’s performance,
communications, quality, user defined comments, etc.2 5 1.22 BP Ability to maintain and track product performance.2 4 1.23 FL Ability to have user defined criteria for vendor file management e.g. purging
vendors with no activity within a certain time frame, with system generated notification (through EDI, e-mail, computer generated fax, etc.) to the affected vendors.
2 5 1.24 BP Ability to flag vendors (with user defined criteria) to manage them based on their previous record or current situation e.g. not sending bid documents to vendors who owe state taxes, etc.
1 5 1.25 BP Ability to support user defined links to external databases (e.g. the Federal Tax Identification system) to support vendor management activities, e.g. diverting payments if vendor has not paid their federal taxes.
1 4 1.26 FL Ability to have a minimum four places after the decimal for all prices.2 3 1.27 FL Ability to either encumber or pre-encumber funds at any stage in the
process.2 3 1.28 FL Ability to enter account distributions at multiple approval levels.2 4 1.29 BP Ability for system to generate reminder notices to vendors for shipments
due based on user defined thresholds.
kpmgFinal Report
Page 5-65

Business Case Study 5—System Requirements
Type Meth Ref # Source Functional Requirements Description RankingPUR Core Requirements
2 5 1.30 FL Ability for user definition of fields that must be completed for procurement activities to proceed. In addition, this definition must be flexible i.e. different requirements for different commodities, fund types, etc.
1 5 1.32 FL Ability to automatically create PO’s from user defined sources e.g. for preferred vendors.
1 4 1.33 FL Ability to display, at a minimum, the previous three prices for a specific commodity.
2 5 1.34 BP Ability for the system to indicate whether the commodity is an inventoried item or available from an in-house supplier.
2 5 1.35 BP Ability to order from in-house suppliers.2 5 1.36 FL Ability for the end user and receiving staff to receive on-line shipping
notifications and order acknowledgments from vendors.1 4 1.37 BPR Ability for purchasing and inventory modules to share a common receiving
function and commodity file.2 5 1.38 FL Ability to support (including vendor updating) online catalogs that can be
used to automatically order:2 5 1.38.1 By fax2 5 1.38.2 By EDI2 5 1.38.3 Via the Web1 3 1.39 BP Ability for ordered items to update commodity usage and history tables.
1 4 1.41 BP Ability to set price and quantity tolerances by line item or purchase orders for over-runs and under-runs.
1 4 1.42 FL Ability for the system to automatically create and track orders for items that have graduated pricing e.g. the first 25 items are $0.25 , 26-50 items are $.20, etc.
2 4 1.43 BP Ability to have multiple ship to locations on purchase orders.2 4 1.44 BP Ability to have multiple remit to locations on purchase orders.2 3 1.45 FL Ability to enter requisitions of any length in one master document, with on-
line updating of all other affected documents.2 3 1.46 FL Ability to award multiple contracts from one requisition.2 3 1.47 FL Ability to perform the following requisition functions on-line:2 3 1.47.1 User-friendly inquiry without having to know the requisition number
2 3 1.47.2 Add2 3 1.47.3 Change2 3 1.47.4 Cancel2 3 1.47.5 Delete2 4 1.48 FL Ability to retrieve or lookup line-item information from history or master files
and include on the requisition any combination of the following:2 4 1.48.1 Commodity code/inventory item number2 4 1.48.2 Description2 4 1.48.3 Unit of measure2 4 1.48.4 Recommended vendor2 4 1.48.5 Buyer2 4 1.48.6 Previous vendor2 4 1.48.7 Previous price2 4 1.48.8 Account information2 4 1.48.9 Ship to/Bill to/Remit to1 5 1.49 BPR Ability to maintain an on-line specifications library.
kpmgFinal Report
Page 5-66

Business Case Study 5—System Requirements
Type Meth Ref # Source Functional Requirements Description RankingPUR Core Requirements
2 5 1.50 BPR Ability to support an on-line specification library interface into the Internet.
1 5 1.51 BPR Ability for the system to notify affected users of changes to underlying specifications in the library if these changes would affect any open documents that a specific user is working with.
1 5 1.52 BP Ability to calculate line item cost estimates, using historical or other user defined information.
2 3 1.53 FL Ability to display the total estimated dollar amount of the requisition.1 4 1.54 FL Ability for user to define multiple order request types, including but not
limited to:1 4 1.54.1 Inventory items1 4 1.54.2 Non-inventory & fixed asset items1 4 1.54.3 Services1 4 1.54.4 Blanket release for commodities1 4 1.54.5 Blanket order contract1 4 1.54.6 Blanket release for services1 4 1.54.7 Direct purchase orders (no requisition created)1 4 1.54.8 In-house providers e.g. Correctional Industries2 4 1.55 FL Ability for multiple requisitions to be combined into one bid.2 4 1.56 FL Ability for a single requisition to be split over any combination of:2 4 1.56.1 Purchase orders2 4 1.56.2 Bid documents2 4 1.56.3 Contracts2 4 1.56.4 Blanket Purchase Orders2 4 1.56.5 Vendors2 4 1.56.5 Buyers2 2 1.57 FL Ability to produce a list of potential vendors (e.g. during bid preparations)
from the vendor registration file or other sources, and to be able to customize the resulting list as required.
2 3 1.58 FL Ability to maintain a terms and conditions table for contracts.2 4 1.59 BPR Ability to store and retrieve contract templates.1 5 1.60 BP Ability to make multiple awards per line item for blanket contracts, and for
the system to capture this information in its history.2 5 1.61 BPR Ability for the system to automatically generate contract renewal notices
which are triggered by the expiration date field.2 5 1.62 BPR Ability to forward contract renewal notices (e.g. on screen, by EDI, computer-
generated fax, mail, etc.) to vendors and agencies.2 5 1.63 BPR Ability to track milestones, payment milestones, retainage and milestone
performance within a contract e.g. personal service contracts, and contracts with deliverables.
1 5 1.64 BPR Ability to track cost-plus contracts for services.2 3 1.65 FL Ability to have multiple account distributions associated with one contract.
1 5 1.66 BPR Ability to support revenue-producing contracts.1 5 1.67 FL Ability for system to perform a global price adjustment to a price contract
either through a user defined change (e.g. global increase of 5% to all prices) or by using vendor supplied data (e.g. new price list in ASCII flat file format).
2 4 1.68 FL Ability to maintain and retrieve historical information on construction contracts.
kpmgFinal Report
Page 5-67

Business Case Study 5—System Requirements
Type Meth Ref # Source Functional Requirements Description RankingPUR Core Requirements
2 3 1.69 FL Ability to create and maintain templates of documents e.g. terms and conditions, instructions to vendors, etc.
2 4 1.70 FL Ability for a single bid to be split over any combination of:2 4 1.70.1 Purchase orders2 4 1.70.2 Bid documents2 4 1.70.3 Contracts2 4 1.70.4 Blanket Purchase Orders2 4 1.70.4 Vendors2 4 1.70.5 Buyers2 3 1.71 FL Ability to allow vendor listings to be sorted by user defined categories.2 4 1.72 FL Ability to support the following types of bids:2 4 1.72.1 Formal bids/RFP’s - advertised sealed bids2 4 1.72.2 Informal bids2 4 1.72.3 Informal request for quotes2 5 1.73 FL Ability for a vendor to specify a particular brand in a bid that cross-
references to an agency-defined acceptable brands list.2 5 1.74 BPR Ability to automatically edit the contents of the contract and/or PO against
built-in procurement guideline and rules. (e.g. Is a quote, bid, RFP, and/or IT approval required)
2 5 1.75 BPR Ability to locate and extract sample contract and/or PO language from a Knowledge Database.
2 4 1.76 BPR Ability to support posting the formal bid, addendum, results and award to the Web.
2 3 1.77 BPR Ability to send the bid to potential bidders via EDI, email, fax, regular mail, etc.
2 5 1.78 BPR Ability to receive responses to bids electronically (in a user-defined format), in a secured environment and upload data to a bid tabulation screen.
2 5 1.79 BPR Ability to electronically time and date stamp the electronic bid1 5 1.80 BPR Ability to automatically limit “receipt” responses from registered vendors
only2 5 1.81 BPR Ability to enter and track non-electronic bid responses.2 5 1.82 BPR Ability to attach test results and other documents to the electronic bid
record.2 5 1.83 BP Ability to easily electronically tabulate bids in the following manner:2 5 1.83.1 Direct feed from electronic responses2 5 1.83.2 Grouping line items or multiple or single line items2 5 1.83.3 Modify bid tabulations by adding lines as required e.g. shipping
charges2 5 1.83.4 Accept formulas as a part of the bid (per line or group of lines)2 5 1.83.5 Accept weighted tabulation criteria as part of the bid (per line or group
of lines)2 5 1.83.6 Take into consideration discounts in an unlimited manner (per line or
group of lines)2 5 1.83.7 Take into consideration trade-ins, replacements and salvage (per line
item or group of line items)2 5 1.83.8 Allowance for revenue generating contracts2 4 1.84 BP Ability for trade-ins to be reflected on purchase orders upon award without
requiring extensive adjustments to the original document.2 4 1.85 FL Ability to award a single line item to multiple vendors.
kpmgFinal Report
Page 5-68

Business Case Study 5—System Requirements
Type Meth Ref # Source Functional Requirements Description RankingPUR Core Requirements
2 5 1.86 BPR Ability to support electronic public viewing of bid results after the tabulation is official.
2 5 1.87 BPR Ability for system to automatically schedule bid opening dates with override capability.
2 5 1.88 BPR Ability for bid transactions to be tracked from cradle to grave.1 5 1.89 BPR Ability to provide an overridable warning message to the buyer for any
contract award which is not to the low bidder.1 5 1.90 BPR Ability to define criteria where completion of an award explanation field are
mandatory.2 4 1.91 FL Ability to automatically create a purchase order, from information on the bid
or requisition.2 3 1.92 FL Ability for purchase order to specify multiple delivery dates.2 4 1.93 FL Ability to create on-line blanket purchase orders.2 5 1.94 FL Ability for release transactions to be issued against a blanket purchase
order.2 5 1.95 FL Ability to enter account distributions on blanket order releases which will be
used to encumber funds.2 5 1.96 FL Ability to prevent a blanket release transaction from posting if it will cause
the blanket purchase order remaining amount to go negative, with override capabilities.
2 4 1.97 BPR Ability to pre-load blanket and regular PO’s for upcoming fiscal year and “encumber and release on or after July 1.
2 4 1.98 BPR Ability to encumber current year funds for a multi-year PO and update encumbrance at start of each fiscal year.
2 5 1.99 BPR Ability to compare receipts and invoices (quantities, receipt date and prices) with the purchase order line items originally ordered and report discrepancies.
2 4 1.100 BP Ability to support updates of open purchase order status and balances based on receipts into inventory.
1 5 1.101 BP Ability to support updates of inventory on hand and on order when items are received into inventory.
1 5 1.102 BP Ability to authorize designated receivers by department.1 5 1.103 BP Ability to optionally perform blind receiving, including at a minimum:1 5 1.103.1 Quantity blocked out but product description, number and unit of
measure showing1 5 1.103.2 Prompts to indicate to receiver that product count is over or under
ordered amount1 5 1.103.3 System forces recounts and also allows process to continue once
recount indicates correct amount1 5 1.103.4 In case of discrepancy, system generates on-line notification for
buyer or end-user that would be able to either hold payment or allow partial payment. System would automatically modify all related documentation accordingly
1 5 1.103.5 An easy drill down to a more detailed description of the item2 4 1.104 BP Ability for multiple receiving transactions from multiple locations to
reference the same PO.2 4 1.105 FL Ability to provide for the following transactions:2 4 1.105.1 Partial receipts2 4 1.105.2 Inspections2 4 1.105.3 Material disposition (stocked, rejected, returned and disposed)2 4 1.105.4 Return goods
kpmgFinal Report
Page 5-69

Business Case Study 5—System Requirements
Type Meth Ref # Source Functional Requirements Description RankingPUR Core Requirements
2 4 1.105.5 Trade-ins (a line item rather than deducting from the actual cost)
2 5 1.106 BPR Ability to track compliance with other shipping instructions (e.g. documentation, packing specifications, etc.) and to modify the vendor performance records accordingly.
2 5 1.107 BPR Ability to process a return goods authorization (either electronic or hard copy depending on vendor capabilities) for materials to be returned (i.e. rejected goods).
1 5 1.108 BPR Ability to track and enter a reason for rejection for each receiver.2 4 1.109 FL Ability to provide for purchase order receipt in total for selected vendors or
commodities so that line item entries are not required.2 4 1.110 BP Ability to enter hazardous materials codes based on user-defined
standards.1 5 1.111 BPR Ability for receiving, not payment, to update inventory.2 5 1.112 BP Ability to process two-way matches - PO and receipt; services rendered and
invoice; Receiving report and invoice.2 5 1.113 BP Ability to process three-way matches - PO, receipt and invoice.2 5 1.114 BP Ability to process four-way matches - PO, receipt, inspection report and
invoice.2 5 1.115 BP Ability to integrate purchasing and payment processes.2 3 1.116 FL Ability to process partial receipts or over shipments.2 5 1.117 BPR Ability to support procurement card interface for consumption dollars.2 4 1.118 BP Ability of system to handle the assignment of payments to an alternate
vendor.2 5 1.119 BPR Ability to provide on-line access to relevant information, product histories,
documentation and financial information to support analysis activities.
1 5 1.120 BPR Ability to track results of audits on-line and be able to analyze the resulting costs and benefits.
2 3 1.121 FL Ability to access, track, and maintain vendor information by FEID, SSN, or "other" unique identifier.
2 3 1.122 FL Ability to access and display fund encumbrance by account code.2 3 1.123 FL Ability to verify current balances for: Fund Cash, Fund releases,
Organization Cash, Organization allotments, Grant Fund Cash, Contract Fund Cash, Grant Allotments, and Contract Allotments before issuing a PO.
2 3 1.124 FL Ability to check Available Balance for agencies that want encumbrance, disbursement, payable and/or general accounting transactions checked for positive balances prior to accepting transaction.
2 3 1.125 FL System shall validate that all PO funds have been allocated to a single or multiple accounts during addition, modification, or deletion of PO information.
2 2 1.126 FL Ability to copy existing PO information into a new or modified PO.2 3 1.127 FL Ability to designate if subsequent requests can or cannot be added to PO.
2 2 1.128 FL Ability to establish and maintain lists for: Buyers, Ship To, Invoice To, Tax Status, Freight Terms, Commodity Number, Unit of Measure, Unit, Vendor, Vendor Status.
2 2 1.129 FL System shall validate data entry information that is maintained in system lists.
kpmgFinal Report
Page 5-70

Business Case Study 5—System Requirements
Type Meth Ref # Source Functional Requirements Description RankingPUR Core Requirements
2 1 1.130 FL Ability to enter discount percentage to be taken on PO.2 2 1.131 FL Ability to enter term conditions for %, net days, and/or date of month if
vendor offers prompt payment discount.2 5 1.132 BPR Ability to track the utilization of discounts.2 3 1.133 BPR Ability to specify and track a need date.1 2 1.134 BPR Ability to specify and track a "promised by" date.2 1 1.135 FL Ability to specify if purchased items contain recycled content.1 2 1.136 FL Ability to specify a line item "for internal use only." When specified, the line
item description will not print on PO.2 4 1.137 BP Ability to distribute PO across multiple account codes by percent, quantity,
or dollar amount.2 4 1.138 BPR Ability to flag items within a PO that must update the Property File after
receipt of goods. 2 Interface / Integration Requirements
2 3 2.1 FL Purchasing transactions including requisitions, purchase orders and contracts will validate against system wide reference tables for all accounting codes
1 5 2.2 FL Requisition transactions will create real time accounting entries that debit appropriate pre-encumbrance accounts and credit reserve for pre-encumbrance accounts
2 4 2.3 FL Purchase order and contract transactions will create real time accounting entries that debit appropriate encumbrance accounts and credit reserve for encumbrance accounts
2 2 2.4 FL Purchasing and Accounts Payable will share a common vendor file (see accounts payable requirements for additional details)
2 4 2.5 FL Purchasing and Accounts Payable will share a common set of inquiries which span the entire purchasing/payables cycle including requisitions, purchase orders, receivers, vendor invoices, match status, payment vouchers, and disbursements. Users should be able to infer all of major parts of the document chain based on knowing only one document number (e.g. ability to look up payment voucher based on PO number). See accounts payable requirements for additional details.
2 4 2.6 FL Purchasing and Accounts Payable should have a common set of vendor related inquiries. Included should be a summary inquiry showing pending orders, YTD orders, pending payables, unmatched receivers, and unmatched vendor invoices
2 5 2.12 FL Accounts payable and purchasing modules share a common 2, 3, and 4 way match facility that generates vouchers automatically from successful matches. (See accounts payable requirements for details)
1 5 2.13 FL Provides comprehensive intra-governmental purchasing, payment/settlement, approval processing that spans payables and purchasing modules.
2 4 2.14 FL Purchase order and contract transactions automatically update grant and project budgets with encumbrance information when grant or project codes are entered.
2 4 2.15 FL Requisition, purchase order, and contract accounting entries are automatically posted to grant and project inception to date files
2 3 2.17 FL Purchase orders and contracts create a hard reservation of funds against appropriation and management budgets
kpmgFinal Report
Page 5-71

Business Case Study 5—System Requirements
Type Meth Ref # Source Functional Requirements Description Ranking 2 Interface / Integration Requirements
2 3 2.18 FL Provides a purchase requisition transaction that includes multiple accounting and commodity lines.
1 3 2.19 FL Provide a departmental purchase order that accommodates multiple accounting lines and commodity lines. This document would be limited to orders for one department and would typically be used without a requisition.
1 4 2.20 BP Provide a centralized purchase order that can cover orders for multiple departments. This purchase order should require a requisition to precede it. It should have multiple accounting lines and commodity lines.
1 5 2.22 FL Provide an ability to enter and post an intra-governmental purchase order
2 4 2.23 BP Ability to process all transactions by any of the following methods:2 4 2.23.1 Online with real-time posting2 4 2.23.2 Online data entry, editing, and correction with off-line posting2 4 2.23.3 Off-line data feeds with off-line editing and posting followed by online
correction and posting (where required)
kpmgFinal Report
Page 5-72

Business Case Study 6—Options AnalysisBest of Breed Option
6. OPTIONS ANALYSIS6.1 Introduction
The primary objective of the Evaluation Phase was to evaluate the requirements, risk, and financial
impact associated with each of the five options shown in Exhibit 6-1.
Exhibit 6-1Options
Option 1 As-Is Maintain the current legacy systems as-is with no major modifications or upgrades
Option 2 Enhanced Enhance current systems by adding new tools and functionality
Option 3 Custom Develop a new custom integrated information management system
Option 4 COTS Implement a commercial off-the-shelf Enterprise Resource Planning package
Option 5 Best of Breed Use some combination of the other four options
The functionality provided by each option was evaluated using the business and technical requirements
that were gathered over the course of the Business Case Study. Next, we identified and analyzed three
general categories of risk. The risk categories considered were project risk, continuation risk, and
strategic risk. Finally, we estimated project and maintenance costs for each option, and quantified the
fiscal impact on the State for each option over a 15-year period.
We present our evaluation in this section by first listing the general assumptions upon which we based our
analysis. Then we describe the criteria used for evaluating requirements, risks, and financial impact, and
conclude by providing an in-depth analysis of each option based on the evaluation criteria.

Business Case Study 6—Options AnalysisAssumptions
6.2 Assumptions
We operated under the following general assumptions:
! This review represents a “snapshot in time” as to the configurations and functionality of theFlorida Financial Management Information System (FFMIS) subsystems. All projections arebased on the time that the data was gathered, compiled, and verified. We assumed that theconfiguration and functionality of FFMIS subsystems continued to change during the course ofthis review
! All State entities in the three branches of State government, including the State UniversitySystem, will adopt the recommended option
! All costs are represented using the rate schedules and pricing structures in effect at the time of thereview. Similarly, hardware costs represent the cost today and do not take into account pricingfluctuations due to market conditions, discounts, new technology, and future software releases
! There was no detailed review and inclusion of the agency shadow or feeder systems, other than toreview FFMIS interfaces. The identification of such agency systems was outside the scope of thisproject. These shadow systems could affect the projected implementation schedule of the selectedoption
! The State will have a fully implemented IP-based network, replacing the existing SNA networks,within the next 2 years
! The State is willing to change hardware, operating systems, related networks, and desktopplatforms
! All State personal computers will continue to run commonly used, industry-supported desktopoperating systems
! The State is willing to consider major fiscal policy, legislative, and regulatory changes to improveefficiency and effectiveness

Business Case Study 6—Options AnalysisEvaluation Criteria
6.3 Evaluation Criteria
The specific criteria for evaluating the requirements, risk, and financial impact are outlined in the
following paragraphs.
Requirements Analysis
The functionality provided by each option was evaluated using the business and technical requirements
that were gathered over the course of the Business Case Study. Approximately 1,500 specific
requirements were gathered during the Business Case Study and are included in Section 5. The techniques
used to gather these requirements are also described in Section 5.
The requirements measured for this analysis fall into two major categories: functional requirements and
technical requirements. The relative weight awarded to these two high-level categories are 70 percent and
30 percent, respectively.
To ensure objectivity and the appropriate degree of product and system knowledge, several distinct
groups performed the evaluations. The core Business Case Study team reviewed them to identify and
resolve major inconsistencies and omissions in the rankings provided. The following external groups
performed the requirement evaluation/ranking:
! Functional and technical State personnel, identified as specialists in each of the five FFMISsubsystems, performed the rankings for the As-Is option and Enhanced option solutions. Theseevaluation results were refined by KPMG technical and functional specialists who compared thecurrent processes and environment to the best practices and potential improvements availablewith current technology solutions
! KPMG core team and external resources specializing in each of the three commercial off-the-shelf (COTS) package solutions being considered participated in the evaluation of the COTSoption. This rating process required input from functional and technical specialists in each of thethree COTS solutions under consideration (SAP, Oracle, and PeopleSoft). The rankings allowedus to prepare a composite score for a generic COTS solution for comparison to the other fouroptions. While the high-level requirements allowed us to identify some strengths and weaknessesof each of the COTS solutions, a detailed requirement analysis is necessary to determine the bestpackage fit
! KPMG personnel experienced in custom system design and development, in collaboration withthe KPMG COTS package specialists, were key to the evaluation of the solution presented in theCustom option and the Best of Breed option. The source of information used to evaluate theseoptions included the rankings of the existing systems, the relative fit of each of the COTSsolutions, and the wide range of middleware and network tools available for integration, web-enabling, and reporting

6—Options Analysis Business Case StudyBest of Breed Option
Functional Requirements
The functional requirements ranking consists of two high-level scores: information processing and
business operating requirements.
The information processing category, which represents 50 percent of the functional requirements score,
measures how well the option satisfies the State’s requirements. This rating was calculated from an
analysis of the approximately 1,500 requirements of the five FFMIS subsystems, which were compiled in
the System Requirements Phase.
The requirements are grouped into roughly the same five functional areas as the subsystems of the State’s
FFMIS:
! Financial Accounting: Includes all account processes (General Ledger, Accounts Receivables,and Accounts Payables) and is closely patterned on the processing currently performed by theFlorida Accounting Information Resource (FLAIR) Subsystem
! Human Resources/Payroll: Modeled after the requirements of Cooperative PersonnelEmployment Subsystem (COPES) and the payroll-processing portion of FLAIR, and includestraining, recruitment, time, and labor
! Purchasing: Encompasses all of the requirements indicated for the Statewide PurchasingSubsystem (SPURS)
! Budgeting: Represents the State’s budgeting requirements, and is modeled after the LegislativeAppropriation System/Planning and Budgeting Subsystem (LAS/PBS)
! Cash Management and Investment: Derived from the existing Cash Management Subsystem(CMS) processing system requirements
The compiled list of business operating requirements consists of high-level requirements that represent
the breadth and the scope of the complete FFMIS. They do not, however, address other elements
significant to the effectiveness and usability of the system. To highlight the visionary and strategic
direction of the State for FFMIS, and to measure each option’s adaptability to that direction, we have
added the following measurement criteria with a weight of 20 percent toward the total functional
requirements score.
! Integration: The integration score measures how well the option meets the State’s vision of anintegrated FFMIS. The integration of the financial system components is key to getting accurateand real-time planning and performance measurement reports. The usage of a uniform Chart ofAccounts and uniform business codes is required to achieve this goal. The uniformity of datastructures, the degree of data redundancy, and the number of shadow systems and intersysteminterfaces indicate the overall level of integration

Business Case Study 6—Options AnalysisEvaluation Criteria
! Flexible Reporting: This score measures how well the option meets the reporting requirements ofthe State. The reports should be flexible for summarization and drill down, and provide accurate,timely information that should be easy to obtain and analyze. This score represents the ability toextract current, consistent data from the system, in an unspecified variety of combinations andformats, to provide a comprehensive decision support system
! Service Level: The accessibility, availability, and responsiveness of the system for updates andreporting are key measures of the service level of the system. Due in part to the pace of change intechnology, service-level expectations of constituents, legislators, and employees are increasing.In particular, we have placed considerable emphasis on web-based forms and reporting in scoringthe accessibility of the system
! Human Resource Utilization: This score measures the degree to which the system supportsemployee productivity. It is believed that e-commerce and web-enabled employee self-servicecomponents add considerably to the productivity potential of the system
! Strategic Direction: The State’s strategic vision is to integrate financial information at the Statelevel. This category measures the degree to which the solution supports the strategic direction ofthe State (for example, management and citizen access to financial information, perceivedfinancial stability, and reduction of manual processes and shadow systems)
Technical Requirements
The technical requirements component of the analysis focuses on the capabilities and flexibility of the
technical architecture associated with each option. This component is given an overall weight of 30
percent and consists of two categories: sustainability and industry direction.
The sustainability category measures the flexibility and adaptability of the proposed architecture and
represents 20 percent of the overall requirement score. Sustainability is measured based on the following
components:
! Scalability: Describes how easily the architecture can be upgraded to support the State’santicipated growth in number of transactions, concurrent users, and changing technology
! System Availability: Describes the amount of system up-time expected or likely available to theend-user, based on the system architecture of each option
! Ease-of-Use: Measures the user friendliness of the environment. This largely depends on the helpand training available. The quality of the graphical user interface (GUI), as well as browser usedfor the front end, is important for this category
! Security: Assesses the system’s security features. Security of the environment is an importantissue. However, security should not be intrusive. Authentication should only be required once persession. Authorization facilities/layers should recognize the user’s profile throughout the entiresession

6—Options Analysis Business Case StudyBest of Breed Option
! Backup and Recovery: Assesses the ability to maintain consistent, recoverable images of thedatabase in a timely manner
! Architectural Integration: Addresses ease with which hardware and software componentsintegrate with each other
The industry direction category weighs the architecture of the proposed options against the current
industry standards and technology forecasts, and represents the remaining 10 percent of the technical
requirements score. The factors considered in the analysis of the industry direction include the following:
! Client/Server Environment: The degree to which FFMIS uses client/server technology
! Interoperability: Ease with which FFMIS interacts with various other application software andCOTS software belonging to the State agencies
! Uniform Data Models: The consistency of the data dictionary across multifunctional systems. Aconsistent data definition is important for an effective data exchange and to analyze theconsolidated reports
! Web, Workflow, and Middleware: Efficient and effective use of tools and techniques for webenablement, workflow, and middleware capabilities to connect systems seamlessly
! Open Systems: Degree to which application programming interfaces are published and generallyavailable, and the ease of interfacing with other systems
! Development and Test Tools: Quality, sophistication, ease-of-use, and effectiveness ofdevelopment and test tools
Risk Analysis
Risk accompanies any major change to an organization, especially technology change. We define risk in
this analysis as the “possibility of loss.” Three distinct categories of risk are assessed in this analysis:
! Strategic Risk: Relates to the risk of not meeting the State’s strategic information technologygoals, and applies uniformly to all the options presented in this analysis
! Project Risk: Relates directly to Options 2 through 5. We will define the risk elements, or riskfactors, associated with large-scale IT projects for each of the options
! Continuation Risk: Applies to all the options presented, and relates to the risks associated withongoing operations of the State’s financial system (1) after project completion or (2) if theexisting system is used as-is, whichever is applicable
The people, processes, and technology in each of the three risk categories are discussed in the following
paragraphs.

Business Case Study 6—Options AnalysisEvaluation Criteria
Strategic risk factors include management, employee, and citizen access to data; perceived financial
stability as it relates to the State’s financial reporting and accounting infrastructure; and the State’s
strategic goal of eliminating data redundancy and inconsistency. The risk of the State being unable to
fulfill its strategic goals will be assessed for each of the five options.
Project risk factors include such risks as project size and effort, requirement stability, and overall design
complexity. The project risk factors analyzed will include those risk factors that have historically been—
based on industry research and KPMG experience—the key determinants in a large-scale IT project’s
success or failure.
Continuation risk factors address risk associated with a fully installed system. These types of risk, which
include enhancement capability, scalability, and technical obsolescence, will be incurred under each of
the five options. The acknowledgement and assessment of continuation risk factors are crucial in
determining how well the IT system is positioned to serve an organization in future years.
For each option, we will assess the perceived level of risk for the three risk categories. This risk ranking
will then be applied to the final evaluation of the options presented.
Financial Analysis
In this analysis, we evaluated each IT option to measure the value of the investment. We started this
process by measuring the operating cost of FFMIS. Then we estimated the implementation costs for
Enhanced, Custom, COTS software, and Best of Breed solutions. Next, we estimated the cost of ongoing
operations of each new system, if implemented. The cost estimation of each option used the information
gathered in the IT Assessment and Requirements phases, which were performed before the Evaluation
Phase. The costs of implementation and operation are totaled for 15 years.
This evaluation also included the future benefits from improving the financial management practices and
enhancing productivity through increased leverage of technology based upon the Business Process
Reengineering (BPR) recommendations. We quantified the fiscal impact on the State of each option for
15 years. For each option, we calculated the total cost of ownership, savings, length of time required to
pay back the investment, the net present value of future cash flows, and the internal rate of return.
We made certain general assumptions during our analysis of the total cost of ownership and of perceived
savings from the BPR analysis. Sizing information used to compute the hardware capacity in terms of
annual transaction volume is shown in Exhibit 6-2.

6—Options Analysis Business Case StudyBest of Breed Option
Exhibit 6-2Hardware Capacity
SystemTransaction
Volume
FLAIR 89,000,000
COPES (Personnel) 27,000,000
SPURS (Purchasing) 18,000,000
LAS/PBS 3,000,000
CMS 20,000,000
Employees 250,000
Purchasing Vendors 50,000
Registered Users 12,000
Concurrent Users 2,500
Total 157,314,500
Server sizing was estimated using the information in Exhibit 6-3.
Exhibit 6-3Server Sizing
ProductionEnvironment Processor Speed Active Memory Storage Memory
Database Server(s): 12-24 @ ~550MHz 12GB 4.5TB
Application Server(s): 6 @ ~550MHz 4GB 36GB (Usable)
Web Server(s): 4 @ ~550MHz 1GB 9GB (Usable)
DevelopmentEnvironment Processor Speed Active Memory Storage Memory
Database Server(s): 3 @ ~550MHz 4GB 100GB
Application Server(s): 3 @ ~550MHz 1GB 9GB (Usable)
We estimated hardware costs for the new systems using the following assumptions:
! Three development environments are assumed to be required to support Development, QualityAssurance, and Training
! Hardware price is assumed to be decreasing every year at a rate of 4 percent (Source:GartnerGroup)
! A hardware upgrade schedule of once in 5 years is assumed in our cost estimation

Business Case Study 6—Options AnalysisEvaluation Criteria
We estimated software costs using current costs increased annually at a rate of 4 percent, which is
consistent with recent GartnerGroup studies.
We estimated personnel costs for each option using the following assumptions:
! Estimated State staff is assumed to be the existing State personnel who can be made available tothe project at no extra cost
! For the Enhanced option operating costs, we assumed that the existing data center cost structurewould continue
! For the Custom, COTS, and Best of Breed options, fewer staff will be needed to operate the newsystem. We assume that the remaining staff will be redeployed to realize the cost savings in IToperations
! Personnel costs are estimated to increase at the rate of 4 percent per year
! For the Custom, COTS, and Best of Breed options, we assumed a centralized model for the datacenter in lieu of a distributed model
We used a discount rate of 3 percent to compute the net present value based on the State’s current cost of
funds.
The cost estimates associated with each option during the next 15 years were assembled in the IT
Assessment and Evaluation Task. In evaluating the costs of each option, we estimated the initial costs of
hardware, software, implementation, and training. We also estimated the ongoing operational costs of
each option. The cost of ownership is computed as the cost of new system implementation and the cost of
operation.
Implementation costs in our study included the following:
! Hardware costs include the cost of new hardware required to run the selected system. Because theState is upgrading the desktops and communications network regardless of the options evaluated,we did not include the cost for these components in our hardware cost estimation. The hardwarecost estimation is based on the technical architecture we recommended. To estimate the capacityof the hardware, we compiled information about volume of transactions and number of users thefuture FFMIS would have. Using the vendors’ list price for the hardware components that wouldmeet the estimated capacity, we determined the hardware costs
! Software costs include the cost of any system software and utilities, software licenses, and bolt-onpackages
! Implementation costs include the cost associated with the software’s implementation such asconsulting services. Implementation costs have also been annualized to show the spread of theinvestment, as well as to apply the 5 percent increment in the consulting cost per year. IT projects

6—Options Analysis Business Case StudyBest of Breed Option
are subject to numerous risks. The end result of unavoidable or improperly mitigated risk on ITprojects is a delay in project schedule or an increase in the project cost. We have consideredproject risk in our analysis through the application of a risk multiplier to our projected cost. Thismultiplier was determined by considering specific risk areas identified for each option, whichwould increase project expense. We selected 10 risk factors from internal KPMG documentationand industry research, and used them to determine the risk multiplier. A risk multiplier of 1.093was applied to the base cost for the Enhanced option, 2.560 for the Custom option, 1.404 for theCOTS option, and 1.453 for the Best of Breed option. The detailed basis used to determine therisk multiplier for each option is provided in Appendix B
! Training costs include the cost of instruction for new systems, technology, and support staff userson the new hardware and software
The costs of operations in our study included the following costs necessary to support the system for the
next 15 years:
! Hardware costs of upgrades required to operate the selected system
! Software licenses maintenance costs for database, application, and other software tools
! Maintenance support staff costs necessary to support the operations, to maintain the applicationand architecture, and to provide help to end-users
! Upgrade costs include the cost of upgrading the application
The costs of consumables such as paper and toner, the facility cost to house the team, and the costs of
hardware are not included in the cost model.
Using the information we compiled in the BPR task, we estimated the costs and benefits from
improvements in process and financial management practices in the agencies in which we conducted the
high-level BPR. Then we extrapolated the known costs and benefits to the remaining agencies in State
government. The savings generated by the streamlined IT operations with the Custom, COTS, and Best of
Breed options are also included.
We summarized the total fiscal impact, including both the required investment and estimated benefits for
each of the five options for 15 years. Based on the 15-year estimated fiscal impacts, we calculated the
length of time each option will need to pay back the investment of the specific option, the net present
value of future cash flows, and the inherent internal rate of return.

Business Case Study 6—Options AnalysisEvaluation Criteria
Evaluation Summary
In the remainder of this section, we present each option in the following format:
! Option Description: Includes a general overview, general assumptions, sample technical archi-tectures, and proposed timeline
! Requirements Analysis: Describes the level of functionality provided by each option, as measuredagainst the requirements definition in Section 5
! Risk Analysis: Describes the primary risks associated with each option
! Financial Analysis: Describes the financial impact of choosing each option

Business Case Study 6—Options AnalysisAs Is
Option 1: As-Is
Overview
We have defined the As-Is option as leaving the existing legacy FFMIS subsystems in place during the
next 15 years, while making no major enhancements to the overall system. In this evaluation, we
measured the degree to which the present system meets the requirements definitions, and evaluated the
risks and financial impact associated with using the current, unmodified system to support the operations
of Florida’s State government.
Assumptions
The following assumptions were made to evaluate the As-Is option:
! No major modifications will be made to the system during the 15-year timeline underconsideration
! Agencies will continue to provide the minimum necessary work-around and shadow systems forprocessing needs that are not met by the current FFMIS subsystems
! Even though KPMG’s Functional Quality and Technical Quality assessments indicate that themajority of the systems require major functional and technical enhancements, this option assumesthat the State can function at the current service level of the legacy systems
! The FFMIS subsystems have approximately 2.7 million lines of COBOL programming languagecode. The State will continue to possess and train mainframe COBOL programmers formaintenance of these subsystems
Technical Architecture
The Department of Management Services (DMS) network is predominately a TCP/IP network that
includes SPURS and COPES. SPURS runs on an IBM mainframe, and COPES runs on a Unisys
Clearpath server. The architecture of SPURS is approximately 88 percent COBOL and 12 percent Natural
using an Adabas database engine. COPES architecture is all COBOL using Unisys’s DMS220 database
engine.
There has been a great deal of effort in web application development for applications operated by DMS.
Web-based applications such as SPURSView and Vendor Bid System can be accessed by both State
personnel inside the State architecture and by any vendor on the World Wide Web. Examples of ongoing
web initiatives include COPESView, COPES Direct, Employee Direct in COPES and Paperless
Purchasing Requisition System, and Statewide Vendor File in SPURS.

6—Options Analysis Business Case StudyBest of Breed Option
DMS also has a small, group of approximately 4,000 native SNA users on the network. Of the 4,000
users, approximately 500 are using SNA protocol to access COPES. Some users from the agencies pass
through DMS’s SNA network to access the Comptroller’s system and other SNA networks. DMS’s focus
is to replace native SNA and Unisys terminal emulation and print services with IP services. SNA network
will not support web-based and client/server applications as the State moves forward.
FLAIR and LAS/PBS reside on the mainframe in the Comptroller’s data center where communications
are predominately SNA. FLAIR and LAS/PBS’s architecture is mostly Natural with some COBOL. Some
work has been done on web initiatives. LAS/PBS has added client/server applications such as
Correspondence Tracking System, Budget Tracking System, CAS, In/Out Board, SITS, and GMS.
CMS is an IBM AS/400-based system using COBOL and RPG programming languages accessing an
IBM Universal Database. CMS uses a Visual Basic GUI to access the AS/400. Extensive web application
work is underway.
We have included a schematic of the proposed high-level architecture for the As-Is option in Appendix G.
Timeline
The current system will continue to operate as-is during the next 15 years.
Requirements Analysis
The following is our analysis of how well the existing system meets both functional and technical
requirements. We outline the major requirements categories and present our scoring of the As-Is option
compared to the other four options.
Functional Requirements
We found that less than 60 percent of the overall information processing functional requirements are met
by the existing processing systems. The higher levels of satisfaction were found in the FLAIR Subsystem
(75 percent) and CMS (78 percent) with percentages as low as 35 percent for SPURS and 43 percent for
COPES.
Examination of the existing subsystems revealed an inadequate level of integration between the major
functional processes:

Business Case Study 6—Options AnalysisAs Is
! Lack of a single Chart of Accounts limits the ability of the system to integrate financialinformation
! FFMIS subsystems have inconsistent edits and validation of data entry
! Multiple shadow systems are interfaced to rather than integrated with the five financial systems tomeet the reporting needs of the individual agencies
! Florida lacks a statewide data and technical architectural model
! FFMIS subsystems do not use a common data exchange method
! FFMIS computing platforms are not interoperable seamlessly
The analysis of current systems indicates that the flexible reporting requirements of the State are not met
to an acceptable level with this option:
! The system does not provide adequate ad hoc reports
! The system does not provide an adequate decision support system
! The system has limited online viewing and printing capability
The service level of the current FFMIS design does not provide timely access to current data:
! The online availability of FFMIS to end-users does not meet the needs of all users
! Users are not happy with the turn-around time, especially for the batch-process reports and for thecross-system updates
! Response time of the online transactions is satisfactory; the response time needed for the ad hocreports is not satisfactory
! Because the data center is decentralized at subsystem level, it is difficult to obtain timely andaccurate information when cross-system updates are involved
! Multiple help desks exist for FFMIS support that do not provide sufficient and effective service
! Legacy FFMIS subsystems are not user friendly and are difficult to navigate
! The project prioritization processes used at the IT support organizations do not ensure that allend-user needs are being met
The lack of integration and technological capabilities of the current subsystems lead to inefficient
utilization of existing human resources:
! FFMIS subsystems require manual and duplicate input
! Not having web-enabled applications like employee self-service and web-based procurement mayincrease end-user dissatisfaction for the system

6—Options Analysis Business Case StudyBest of Breed Option
! With this option, workflow is not available to automate processes, thus hindering productivity
! Because of salary constraints, it is difficult to attract and retain qualified staff. FFMIS trainingand online help facilities do not provide sufficient and effective service
The limitations of the current systems present major challenges to the State’s strategic direction:
! Keeping the systems as they are will be equivalent to putting the strategy on hold indefinitely
! Not all systems have web access
! An integrated financial policy cannot be implemented with this option
! Citizens will not have adequate access to the State’s information
We scored the As-Is option against the information processing and business operating requirements.
Exhibit 6-4 shows our scoring by subcategory for this option and a comparison to the other four options.
Exhibit 6-4Functional Requirements Matrix–As-Is Option
Category Wei
gh
t
As-
Is
En
han
ced
Cu
sto
m
CO
TS
Bes
t o
f B
reed
General Ledger 15% 3.5 4.0 5.0 4.0 5.0
Human Resource 15% 2.0 3.0 5.0 4.0 5.0
Budgeting 5% 2.5 3.0 5.0 3.0 4.0
Cash Management and Investment 5% 3.0 4.0 5.0 4.0 5.0
Purchasing 10% 2.0 3.0 5.0 4.0 5.0
Information Processing Requirements 50% 1.3 1.7 2.5 2.0 2.5
Integration 5% 1.0 3.0 5.0 5.0 5.0
Flexible Reporting 5% 1.0 3.0 5.0 5.0 5.0
Service Level 5% 1.0 2.0 5.0 4.0 4.0
Human Resource Utilization 3% 1.0 3.0 5.0 4.0 4.0
Strategic Direction 2% 1.0 3.0 5.0 5.0 5.0
Business Operating Requirements 20% 0.2 0.6 1.0 0.9 0.9
Total Functional Score 70% 1.5 2.3 3.5 2.9 3.4

Business Case Study 6—Options AnalysisAs Is
The current system does not adequately meet the business operating requirements of the
State. The existing FFMIS subsystems lack integration and adequate flexible reporting,
and do not maximize the human resource potential of the State.
Technical Requirements
The architecture is scalable for the growing volume of transactions and number of users. However, the
biggest concern the State has is the ability of the system to adapt to rapidly increasing expectations and
changing technology. The system is becoming increasingly unwieldy and difficult to change. Hence, a
low score of 2 for this option:
! Changes to FFMIS legacy subsystems are often time-consuming, costly, and cumbersome
! FFMIS legacy subsystems have had limited enhancements or modifications during the last 2years
! The core technology of some of the subsystems (for example, SPURS and COPES) cannot adaptthe new generation of technology like web, middleware, and flexible reporting tools
Although IS management believes that the system is available to an adequate level, users have some
concerns regarding system availability:
! Intersystem updates do not always take place during weekends
! End-user expectations are changing. Users want access to the system 24 hours a day, 7 days perweek
! Users expect a faster response when new reports and analytical information are needed
Although the trained users are not complaining about the ease-of-use, a concern about lack of training
was expressed during our assessment. It is also difficult to get help when cross-system processes and
updates are involved because the help desk and data centers are decentralized among the subsystems.
Security is working as expected. However, FFMIS subsystems have multiple security controls and
policies. This causes the users to write down their user IDs and passwords and post them on their
computers, which compromises security. No centralized user profile is maintained; therefore it is difficult
to administer the security controls.
Although the State has an acceptable general backup and recovery plan, some of the subsystems lack such
plans. Because these subsystems (for example, COPES and SPURS) are part of dissimilar architecture, it
would be difficult to synchronize the disaster recovery process in case of a systemwide disaster.

6—Options Analysis Business Case StudyBest of Breed Option
The architectures of the five FFMIS subsystems are not integrated.
The current industry direction is to client/server-based computing with real-time integration between
financial subsystems. The core FFMIS subsystems have been in place for 15 to 25 years. A significant
number of the subsystems operate from mainframe environments. The subsystems integrate with one
another only via numerous interfaces. In addition, we note the following points:
! No data models are present in the legacy subsystems, although some code tables have been builtand are being used
! The legacy subsystems make very limited use of web applications and middleware technology
! The current subsystems make very limited use of open systems design
! There is limited availability of sophisticated development and test tools in the mainframeCOBOL world as compared to the client/server environment
We scored the As-Is option against the technical requirements that relate specifically to sustainability and
industry direction. Exhibit 6-5 shows our scoring by subcategory for this option and a comparison to the
other four options.

Business Case Study 6—Options AnalysisAs Is
Exhibit 6-5Technical Requirements Matrix–As-Is Option
Category Wei
gh
t
As-
Is
En
han
ced
Cu
sto
m
CO
TS
Bes
t o
f B
reed
Scalability 5% 2.0 3.0 4.0 5.0 4.0
System Availability 5% 2.0 3.0 5.0 5.0 5.0
Ease-of-Use 3% 2.0 3.0 4.0 4.0 4.0
Security 3% 3.0 3.0 5.0 5.0 5.0
Backup and Recovery 2% 1.0 3.0 5.0 5.0 4.0
Architectural Integration 2% 1.0 3.0 5.0 5.0 4.0
Sustainability 20% 0.4 0.6 0.9 1.0 0.9
Client/Server Environment 2% 1.0 2.0 5.0 5.0 5.0
Interoperability 2% 2.0 3.0 5.0 4.0 4.0
Uniform Data Models 2% 1.0 1.0 4.0 5.0 4.0
Web, Workflow, and Middleware 2% 1.0 3.0 5.0 4.0 5.0
Open Systems 1% 1.0 3.0 5.0 4.0 4.0
Development and Test Tools 1% 2.0 3.0 4.0 4.0 4.0
Industry Direction 10% 0.1 0.2 0.5 0.4 0.4
Total Technical Score 30% 0.5 0.8 1.4 1.4 1.3
The core FFMIS subsystems are based on older technology and do not adequately meet
the State’s technical requirements related to industry direction. Specifically, the existing
subsystems do not have a single, uniform data model and lack real-time integration with
one another. In addition, the existing FFMIS subsystems did not compare well with the
other options under consideration for ease-of-use, backup and recovery plans, and
architectural integration.
Risk Analysis
The primary risks associated with leaving the existing system in place with no significant modifications
or enhancements are strategic risk and continuation risk.

6—Options Analysis Business Case StudyBest of Breed Option
Strategic Risk
Strategic risk relates to the possibility of the State not meeting its strategic information technology goals.
FFMIS was created by the Florida Legislature to provide the information necessary to carry out the intent
of the Legislature and to provide the necessary information for the effective operation of the State
government. FFMIS’s Coordinating Council has outlined three primary strategic issues:
! The existing financial management system and processes with which the State of Floridaconducts payroll, human resources, purchasing, cash management, and accounting and budgetingfunctions are not meeting the State’s needs
! The State does not have an enterprisewide financial management system that integrates financialinformation and standardizes policies and information
! The State’s current financial management information systems are not positioned to respondrapidly to changes in business processes or technology
Exhibit 6-6 shows our scoring by subcategory for this option and a comparison to the other four options.
Exhibit 6-6Strategic Risk Matrix–As-Is Option
Category Wei
gh
t
As-
Is
En
han
ced
Cu
sto
m
CO
TS
Bes
t o
f B
reed
Management access to consolidated financialinformation
16.7% 5.0 3.0 1.0 1.0 1.0
Citizen access to financial information 16.7% 5.0 2.0 1.0 1.0 1.0
Employee access/self-service to administrativeinformation
16.7% 5.0 3.0 1.0 1.0 1.0
Perceived financial stability/bond rating 16.7% 4.0 3.0 1.0 1.0 1.0
Reduction of manual processes and redundantdata entry
16.7% 5.0 3.0 2.0 1.0 2.0
Reduction of agency feeder/shadow systems 16.7% 5.0 3.0 2.0 2.0 2.0
People/Process/Technology 100% – – – – –
Total Strategic Risk/Weighted Average 100% 4.8 2.8 1.3 1.2 1.3
The As-Is option will not fulfill the strategic requirements of the State, as laid out by
FFMIS’s Coordinating Council.

Business Case Study 6—Options AnalysisAs Is
Project Risk
There is no project risk associated with the As-Is option.
Continuation Risk
Continuation risks are associated with the ongoing operations of the State’s financial system (1) after
project completion or (2) if the existing system is used as-is.
Significant risk would be incurred by continuing to operate the State’s financial information system as-is,
with no significant modifications or enhancements. We discuss significant continuation risks within the
context of how it relates to people, processes, and technology.
A significant risk to continuing operations with the existing system is the risk that FFMIS subsystem
owners will not be able to meet the staffing demands of the legacy system. As documented in Finding
IT-24 in Section 4, a common concern of the FFMIS technology staff is the difficulty of attracting and
retaining skilled technical employees. It was noted that FFMIS support organizations have shortages in a
number of key skill areas, such as the need for experienced COBOL and Natural language programmers.
Because of the rapid growth in usage of more expressive programming languages and development tools
in enterprisewide computing environments, it is our belief that the State will find it increasingly difficult
to attract and retain skilled IT professionals to maintain the FFMIS subsystems’ large legacy code base.
Process risk refers to the risk that the State cannot make changes to the core FFMIS subsystems to
support ongoing changes in the State’s business requirements, without considerable time and expense.
As noted in Finding IT-12 in Section 4, changes to the core FFMIS subsystems are often difficult and
costly. An example of this is the change being considered in FFMIS to add a two-digit field in the Chart
of Accounts—an effort that has been projected to cost over $900,000 to complete. Enhancement support
is a closely related issue. Because of the fragmented nature of the FFMIS subsystems, the older
technology used, and the fact that these subsystems support three data centers, any enhancements or
upgrades made to one subsystem require additional time and expense to determine its impact on the other
subsystems. The support initiative for these enhancements rests solely upon the State.
The risk of technical obsolescence is considerable under this option. It is our observation that the owners
of the five FFMIS subsystems have generally followed industry standards, which is the best defense
against both hardware and software obsolescence. However, these standards have been applied to what
might be considered today as a technically obsolete, enterprisewide financial system. Modern
enterprisewide financial systems stress real-time availability of data, a cohesive data and technical model,
system performance measurement tools, data consistency, and extensive management reporting

6—Options Analysis Business Case StudyBest of Breed Option
capabilities. Current FFMIS subsystems lack integration, data consistency, and a common Chart of
Accounts and do not provide a sufficient level of decision support information (see Finding IT-3 in
Section 4).
Another considerable technology-related risk is the risk to continuing operations if a catastrophic system
failure and data loss occurs. As noted in Finding IT-19 in Section 4, not all FFMIS subsystems have
backup and disaster recovery capabilities for the mainframe components of the system. Currently, DMS
and DOI do not have formal disaster recovery plans, strategies, or agreements for recovery of COPES,
SPURS, and CMS. Exhibit 6-7 shows our scoring by subcategory for this option and a comparison to the
other four options.
Exhibit 6-7Continuation Risk Matrix–As-Is Option
Category Wei
gh
t
As-
Is
En
han
ced
Cu
sto
m
CO
TS
Bes
t o
f B
reed
System Leadership 10% 4.0 4.0 3.0 2.0 3.0
System Ownership 10% 4.0 4.0 3.0 3.0 3.0
Personnel Skill Set Availability 10% 5.0 4.0 3.0 3.0 3.0
System Sponsorship/Funding 10% 2.0 2.0 3.0 4.0 4.0
People 40% – – – – –
Stability of Vendor 6.7% 3.0 3.0 3.0 3.0 3.0
Enhancement Capability and Support 6.7% 4.0 4.0 3.0 2.0 3.0
System Flexibility 6.7% 5.0 5.0 2.0 3.0 3.0
Change Management 6.7% 4.0 4.0 3.0 1.0 2.0
Contingency Planning 6.7% 4.0 4.0 3.0 2.0 2.0
Post-Implementation Defect Rate 6.7% 3.0 3.0 5.0 2.0 2.0
Process 40% – – – – –
Post-Implementation Technical Obsolescence 5% 5.0 4.0 3.0 1.0 3.0
Disaster Recovery 5% 3.0 3.0 3.0 1.0 2.0
Adoption of Industry Standards 5% 5.0 4.0 3.0 1.0 2.0
Scalability 5% 2.0 2.0 3.0 2.0 2.0
Technology 20% – – – – –
Total Continuation Risk/Weighted Average 100% 3.8 3.6 3.1 2.3 2.8

Business Case Study 6—Options AnalysisAs Is
The risk of further technological obsolescence is high under the As-Is option. System
flexibility is also questionable under this option, which may result in an inability of
FFMIS subsystems to keep pace with the State’s changing business requirements.
Financial Analysis
The costs involved in this option are designed to keep the system running for 15 years. We gathered
information from agencies to compile the costs of operating FFMIS. Costs included the cost of support
personnel and appropriated costs for hardware and software maintenance. After compiling this
information, we obtained the actual cost figures for the operations of the current system. Using KPMG’s
cost model, modified to suit the State of Florida’s requirements, we generated the operating-cost model
for the current system.
This operating cost model is extrapolated for 15 years. We used a decreasing rate of 4 percent for the
hardware cost and an increasing rate of 4 percent for the software and personnel costs. Total operations
costs for the As-Is option are shown in Exhibit 6-8.

6—Options Analysis Business Case StudyBest of Breed Option
Exhibit 6-8Operations Costs—As-Is Option
OperationsYear
01Year
02Year
03Year
04Year
05Year
06Year
07Year
08
Hardware
Support and Maintenance (1) $8,991 $8,452 $7,945 $7,468 $7,020 $6,599 $6,203 $5,831
New Hardware – – – – – – – –
Hardware Subtotals 8,991 8,452 7,945 7,468 7,020 6,599 6,203 5,831
Software
Support and Maintenance 2,218 2,396 2,587 2,794 3,018 3,259 3,520 3,802
License Costs – – – – – – – –
Software Subtotals (2)2,218 2,396 2,587 2,794 3,018 3,259 3,520 3,802
Staff (3)12,260 12,750 13,260 13,790 14,342 14,916 15,512 16,133
Undiscounted Costs 23,469 23,598 23,792 24,052 24,380 24,774 25,235 25,766
Year09
Year10
Year11
Year12
Year13
Year14
Year15
TotalCosts
Hardware
Support and Maintenance (1) – – – – – – – –
New Hardware $5,481 $5,152 $4,843 $4,552 $4,279 $4,022 $3,781 –
Hardware Subtotals 5,481 5,152 4,843 4,552 4,279 4,022 3,781 $90,619
Software
Support and Maintenance 4,106 4,434 4,789 5,172 5,586 6,033 6,516 –
License Costs – – – – – – – –
Software Subtotals (2)4,106 4,434 4,789 5,172 5,586 6,033 6,516 $60,230
Staff (3)16,778 17,449 18,147 18,873 19,628 20,413 21,230 $245,481
Undiscounted Costs 26,365 27,035 27,779 28,597 29,493 30,468 31,526 $396,329
Assumptions: (1) Hardware Price Increases/(Decreases), (0.06) per annum; No New Hardware Is Purchased
(2) Software Price Increases/(Decreases), 0.08 per annum; No New Software Is Purchased
(3) Staff Cost Growth, 0.04 per annum

Business Case Study 6—Options AnalysisAs Is
The net present value, internal rate of return, and payback period in years for the As-Is option are shown
in Exhibit 6-9.
Exhibit 6-9BPR Savings—As-Is Option
DiscountRate = 6% Year 01 Year 02 Year 03 Year 04 Year 05 Year 06 Year 07 Year 08
Implementation Costs – – – – – – – –
Operations Costs $(23,469) $(23,597) $(23,792) $(24,053) $(24,380) $(24,774) $(25,235) $(25,765)
TechnologyDependent Savings
– – – – – – – –
Subtotal (23,469) (23,597) (23,792) (24,053) (24,380) (24,774) (25,235) (25,765)
Other BPR Savings 19,250 26,257 27,046 27,857 28,692 29,554 30,442 31,356
Grand Total $(4,219) $2,660 $3,254 $3,804 $4,312 $4,780 $5,207 $5,591
Payback Period:Option 1
$(23,469) $(47,066) $(70,858) $(94,911) $(119,291) $(144,065) $(169,300) $(195,065)
Year 09 Year 10 Year 11 Year 12 Year 13 Year 14 Year 15Total
Costs
Implementation Costs – – – – – – – –
Operations Costs $(26,365) $(27,035) $(27,779) $(28,597) $(29,493) $(30,468) $(31,526) $(396,328)
TechnologyDependent Savings
– – – – – – – –
Subtotal (26,365) (27,035) (27,779) (28,597) (29,493) (30,468) (31,526) $(396,328)
NPV (of subtotal) – – – – – – – $(250,806)
Internal Rateof Return
– – – – – – – N/A
Other BPR Savings 32,296 33,265 34,262 35,290 36,350 37,441 38,564 $467,922
Grand Total $5,931 $6,230 $6,483 $6,693 $6,857 $6,973 $7,038 $71,594
Payback Period:Option 1
$(221,430) $(248,465) $(276,244) $(304,841) $(334,334) $(364,802) $(396,328) N/A

Business Case Study 6—Options AnalysisEnhanced
Option 2: Enhanced
Overview
This option focuses on a relatively low cost and quick technical upgrade of the legacy FFMIS subsystems
to achieve a certain level of integration among the subsystems. For this analysis, the key enhancements
are defined as improved reporting capability, creation of web-based front ends for the primary
subsystems, and improved integration among subsystems. The Enhanced option would satisfy a limited
number of the new functional requirements.
Using middleware technology, the five subsystems would be integrated with real-time, cross-system
database updates. Online data-capturing forms would be developed using web-enabling tools. COTS
reporting tools would be used to generate flexible reports for the FFMIS subsystems.
The State would need to conduct a study of the level of integration required to reasonably produce real-
time and consolidated reports. One hundred percent integration of the five subsystems may not be
achieved and may not be required. Because the State does not have a uniform Chart of Accounts and
business coding structure, the integration and real-time update of the financial information would need
several conversion tables to reflect a financial transaction in different systems. Because State agencies
maintain additional ledgers for funds different from the State’s ledgers for funds, careful analysis and
design of the updates would be necessary to avoid duplicating transactions at the State level.
Modern reporting tools are capable of producing web-enabled and flexible reports. The majority of the
reporting tools are capable of using middleware technology to access dissimilar databases to produce
consolidated reports. However, because of a lack of uniform data definition among the subsystems, the
enhanced system would have to use multiple gateways to update and retrieve the information. The
enhancements may increase the redundancy of the data because some consolidated reports will require
data stored in some uniform format.
The enhanced system would have more overhead processing because of real-time, cross-system updates,
GUI and web front ends, and additional reporting requirements. Careful planning and tuning of the
hardware and network would be necessary before implementation.
The Enhanced option would not consider the usage of automated workflow because automation and
workflow require modular design of the system with parameter-driven transactions. The core subsystems
of FFMIS generally lack such capability.

6—Options Analysis Business Case StudyBest of Breed Option
Prioritizing the needs of integration, reports, and web access and coordinating the enhancements and data
exchanges among subsystems would require a centralized program office focused on results, quality, and
standards.
Assumptions
The following assumptions were made to evaluate the Enhanced option:
! The enhancements will only be in the areas of data integration, web-enabling, and flexiblereporting. There will be limited functional enhancements within the core processing systems
! Workflow is considered outside the scope of the enhancement because of the requirement formodular, transaction-oriented trigger points
! The State will use middleware technology to facilitate real-time updates of the dissimilardatabases of the FFMIS subsystems
! All end-user interactions and all standard reports will be web-enabled
! The chosen reporting software will be able to access multiple databases to provide consolidatedreports
! External personnel will augment the State’s application development staff as necessary
! The duration of the undertaking will be 2 to 3 years
! Because data redundancy will continue to exist with this option, it is assumed that the State willdevelop standards for data access, which will designate the appropriate source of information forreporting purposes when the data exists in more than one system
! Because the standardization of data elements is nonexistent with dissimilar subsystems, multiplegateways and conversion tables are required to share the data across subsystems
! Manual reconciliation of Chart of Accounts information between separate systems will continue
Technical Architecture
The Enhanced option would require that existing SNA services to the desktop be completely replaced by
an IP network to allow web and client/server access to enhanced applications. This network technology
builds upon the existing direction of the State to migrate to an all IP network. The natural progression of
the State to retire older technology is maintained by the use of Citrix technology. Citrix allows users who
do not have the latest PC hardware and software to access all systems from either a local area network
connection (connections through the routed Metropolitan Area Network) or remotely (dial-in). Citrix
servers perform the application processing and send the updated screens to the end-user’s PC and accepts
keystrokes from the end-user’s PC keyboard.

Business Case Study 6—Options AnalysisEnhanced
The current applications (FLAIR, COPES, SPURS, LAS/PBS, and CMS) would remain on their existing
platforms with enhancements to both functionality and end-user interfaces implemented with tools from
SAGA and Unisys. These tools allow present application developers to generate web-enabled code in
their existing environment by separating business logic from the presentation code. The presentation code
becomes the application’s front end, which would execute on an application server that resides in front of
the firewall and accesses the existing or enhanced business logic code on the original platform. By having
the application servers in front of the firewall or in a DMZ, system security and integrity are maintained.
The high volume OnLine Transaction Processing (OLTP) databases, Adabas, IBM Universal Database,
and DMS2200, would have a middleware product such as SagaVista and BEA eLink that would allow
execution of a transaction on one system to trigger an event on another system so that updates are
instantaneous. This middleware product could also be used to map elements from one Chart of Accounts
to other Charts of Accounts as long as both accounts have an associated element.
This option would require a minimum investment in new hardware and software. The existing application
personnel would need to learn new application development; however, minimal training would be needed
to learn the new tools. This technology will give quick results since individual subsystems can be web-
enabled in a logical order by need and priority.
We have included a schematic of the proposed high-level architecture for the Enhanced option in
Appendix G.
Timeline
Certain phases of the new FFMIS such as the Travel and E-Mall modules would be operational in Fiscal
Year 2001. The remainder of the enhancements would be operational in either Fiscal Year 2002 or 2003,
as shown in Exhibit 6-10.

6—Options Analysis Business Case StudyBest of Breed Option
Exhibit 6-10Timeline for Implementation–Enhanced Option
Requirements Definition
Integration Solution
Phased Implementation
BPR Savings
7/1/
00
FY
01 1
/1/0
17/
1/01
7/1/
02
7/1/
03
7/1/
04
7/1/
05
7/1/
06
7/1/
07
FY
02 1
/1/0
2
FY
03 1
/1/0
3
FY
04 1
/1/0
4
FY
05 1
/1/0
5
FY
06 1
/1/0
6
FY
07 1
/1/0
7
Requirements Analysis
Functional Requirements
The rankings provided by our study indicate that with the Enhanced option the State would gain a notable
functionality improvement of the information processing requirements compared to the legacy system.
The Enhanced option will meet an additional 20 percent of the requirements of the State and will deliver
an overall 75 percent of the application requirements evaluated. Significant improvement over the legacy
system is found in the Human Resource and Payroll applications, which will meet 73 percent of the
evaluated requirements versus 44 percent scored by the current system. The integration and flexible
reporting will serve to meet 74 percent of the budgeting system requirements versus 55 percent scored by
LAS/PBS. Web enablement and integration will meet a somewhat higher percentage of the requirements
in purchasing by raising the percentage to 58 as compared to that of 35 in the legacy system. The other
two areas—accounting and cash management—will also gain by integration and reporting, bringing their
percentages to 82 and 89, respectively, which is an improvement of about 10 percent over the legacy
system. Overall, the Enhanced option will meet about 50 percent the State’s new application
requirements.
Business processing requirements of the State will be met to an adequate level. However, many factors
limit the level of integration that can be achieved with this option:
! The nonstandard data definitions, redundant processes, and feeder and shadow systems willcontinue to exist and will significantly hamper the level of integration that can be achieved
! The five core subsystems will remain disjointed in their application processes. True applicationintegration will not be achieved with this option. For example, a requirement for an automatic

Business Case Study 6—Options AnalysisEnhanced
creation of the purchase order from the purchase requisition will not be fulfilled by the databaseintegration using middleware technology
! Without a uniform Chart of Accounts, consolidation of the financial statements and drilling downto the individual transaction from the consolidated reports will be cumbersome
! Systems developed using the COBOL language, (for example, COPES) are not friendly formiddleware programs. This might limit the level of integration
The flexible reporting requirements of the State can be met to an acceptable level with this option:
! The level of integration achieved during enhancement factors heavily into the level ofconsolidation
! The level of real-time, cross-system updates performed will significantly influence the timelinessof the report contents
! Lack of a uniform data model will also hamper the flexibility and friendliness of the reports
! Lack of a uniform data model will also limit the drill-down capability of a consolidated report
! Inability of the current system to produce reports because insufficient information has beengathered will not be addressed with this option. For example, performance-based programbudgeting reports will not be available with this option
The Enhanced option will provide an improved service level compared to the current system because of
real-time updates, web access, and flexible reports:
! The help and training will not improve over the current system
! It will be more difficult to get help for missed updates and to troubleshoot for the fiveindependent subsystems integrated using middleware technology
This option has the most potential for making best use of the existing IS personnel for both the project
and for operations, but the application will produce only a small (compared to other options) increase in
productivity:
! By extensively web-enabling COPES to facilitate employee self-service (travel and expenseclaims and interactive benefit management), the enhanced system can increase productivity ascompared to the legacy system
! Because redundant processes and systems will not be addressed with this option, they willcontinue to hinder productivity
! Lack of workflow and automated processes will continue to hinder productivity

6—Options Analysis Business Case StudyBest of Breed Option
Enhancing the legacy system will provide only a modest step in the strategic direction of the State’s
financial system and will stop considerably short of meeting the goal:
! Although this option provides a level of integration of the information at the State level, the coresystem remains agency-oriented, not State-oriented
! Integrated financial policy will still be difficult to achieve without a uniform Chart of Accounts
! Because the financial processing will not be significantly improved, this option will notcontribute to the improvement of the perceived stability of the State’s financial system
This option will not focus on reducing the redundancy in processes and systems.
Exhibit 6-11 shows our scoring by subcategory for this option and a comparison to the other four options.
Exhibit 6-11Functional Requirements Matrix–Enhanced Option
Category Wei
gh
t
As-
Is
En
han
ced
Cu
sto
m
CO
TS
Bes
t o
f B
reed
General Ledger 15% 3.5 4.0 5.0 4.0 5.0
Human Resource 15% 2.0 3.0 5.0 4.0 5.0
Budgeting 5% 2.5 3.0 5.0 3.0 4.0
Cash Management and Investment 5% 3.0 4.0 5.0 4.0 5.0
Purchasing 10% 2.0 3.0 5.0 4.0 5.0
Information Processing Requirements 50% 1.3 1.7 2.5 2.0 2.5
Integration 5% 1.0 3.0 5.0 5.0 5.0
Flexible Reporting 5% 1.0 3.0 5.0 5.0 5.0
Service Level 5% 1.0 2.0 5.0 4.0 4.0
Human Resource Utilization 3% 1.0 3.0 5.0 4.0 4.0
Strategic Direction 2% 1.0 3.0 5.0 5.0 5.0
Business Operating Requirements 20% 0.2 0.6 1.0 0.9 0.9
Total Functional Score 70% 1.5 2.3 3.5 2.9 3.4
It is expected that the Enhanced option, as defined, will satisfy approximately 75 percent
of the information processing requirements of the State. Integration, flexible reporting,
and service level will be improved over the existing FFMIS subsystems.

Business Case Study 6—Options AnalysisEnhanced
Technical Requirements
The sustainability scores of the Enhanced option are based on the following key points:
! The Enhanced option will provide only a small improvement in scalability over the legacysystem. The architecture is scalable for the State’s growing number of transactions
! The functional scalability will not improve much over the legacy system because the core systemis the same as the legacy system. Adding an additional field or changing a process will be veryexpensive
! System availability will improve some over the legacy system because fewer batch updates orinterfaces are required. However, the option will not deliver a significant improvement inavailable time because the core subsystems will need almost the same level of operationaldowntime for online access because of maintenance and batch windows
! Ease-of-use will improve slightly over the legacy system because of flexible reports and webaccess. However, the core system and processes will continue with the same level of help andtraining available
! Security will be more user friendly and comfortable with the use a of web portal. However, adetailed security definition to restrict users to a certain level of access and functions, as well asthe ability to maintain the security profile centrally, will not be available with this option becauseof disparate core subsystems
! The backup and recovery system will be enhanced over the current level. However, because thereare five disparate subsystems with different databases, it will still be cumbersome
! Multiplatform technical architecture will continue to exist, but the use of middleware technologywill improve the technical integration both for updates and maintenance, to a certain degree. Thiswill be better than the current system, but will not be close to an integrated architecture
The industry direction scores of the Enhanced option are based on the following key points:
! The Enhanced option will not move the technical architecture to a total client/server environment.However, the reporting tools and web applications will improve the current architecture and moveto a client/server environment
! Interoperability of the system will see some improvement over the legacy system because ofmiddleware usage, but the systems themselves will remain noninteroperable
! The Enhanced option will not add any value to a data model because it uses conversion tables
! Web and middleware tools and technologies will be used in the Enhanced option; however, thelimitations of the core legacy systems do not allow for the use of truly integrated workflowtechniques

6—Options Analysis Business Case StudyBest of Breed Option
! Middleware and web applications are based on open-system technology. Because the core systemis not going to change, it is not going to make sufficient use of open-system technology
! The Enhanced option will use modern development and test tools, but the core system cannotmake use of these modern tools
Exhibit 6-12 shows our scoring by subcategory for this option and a comparison to the other four options.
Exhibit 6-12Technical Requirements Matrix–Enhanced Option
Category Wei
gh
t
As-
Is
En
han
ced
Cu
sto
m
CO
TS
Bes
t o
f B
reed
Scalability 5% 2.0 3.0 4.0 5.0 4.0
System Availability 5% 2.0 3.0 5.0 5.0 5.0
Ease-of-Use 3% 2.0 3.0 4.0 4.0 4.0
Security 3% 3.0 3.0 5.0 5.0 5.0
Backup and Recovery 2% 1.0 3.0 5.0 5.0 4.0
Architectural Integration 2% 1.0 3.0 5.0 5.0 4.0
Sustainability 20% 0.4 0.6 0.9 1.0 0.9
Client/Server Environment 2% 1.0 2.0 5.0 5.0 5.0
Interoperability 2% 2.0 3.0 5.0 4.0 4.0
Uniform Data Models 2% 1.0 1.0 4.0 5.0 4.0
Web, Workflow, and Middleware 2% 1.0 3.0 5.0 4.0 5.0
Open Systems 1% 1.0 3.0 5.0 4.0 4.0
Development and Test Tools 1% 2.0 3.0 4.0 4.0 4.0
Industry Direction 10% 0.1 0.2 0.5 0.4 0.4
Total Technical Score 30% 0.5 0.8 1.4 1.4 1.3
The Enhanced option will not add any value to a uniform data model. Ease-of-use will
improve slightly over the legacy system because of an increased level of flexible
reporting and through web access.

Business Case Study 6—Options AnalysisEnhanced
Risk Analysis
The primary risks associated with enhancing the existing legacy system involve strategic, project, and
continuation risks.
Strategic Risk
We assume three major enhancements would be made to the existing legacy subsystems under this option.
These are web-enablement, flexible reporting, and database integration. While the proposed
enhancements would improve the usability and integration of the existing FFMIS subsystems—goals that
are in line with the State’s vision for information management—these changes would only manage to
fulfill 75 percent of the State’s requirements, as defined in the accompanying requirements definitions.
Therefore, we conclude that the strategic risk to the State is moderate. Exhibit 6-13 shows our scoring by
subcategory for this option and a comparison to the other four options.
Exhibit 6-13Strategic Risk Matrix–Enhanced Option
Category Wei
gh
t
As-
Is
En
han
ced
Cu
sto
m
CO
TS
Bes
t o
f B
reed
Management access to consolidated financialinformation
16.7% 5.0 3.0 1.0 1.0 1.0
Citizen access to financial information 16.7% 5.0 2.0 1.0 1.0 1.0
Employee access/self-service to administrativeinformation
16.7% 5.0 3.0 1.0 1.0 1.0
Perceived financial stability/bond rating 16.7% 4.0 3.0 1.0 1.0 1.0
Reduction of manual processes and redundantdata entry
16.7% 5.0 3.0 2.0 1.0 2.0
Reduction of agency feeder/shadow systems 16.7% 5.0 3.0 2.0 2.0 2.0
People/Process/Technology 100% – – – – –
Total Strategic Risk/Weighted Average 100% 4.8 2.8 1.3 1.2 1.3
The risk of not meeting the State’s overall strategic goals under the Enhanced option is
moderate, based on improved management access to timely and accurate financial data
and the reduction in redundant data entry over the existing FFMIS subsystems. This
option does not, however, fulfill the State’s stated strategic goal of a single integrated
financial management system (IFMS).

6—Options Analysis Business Case StudyBest of Breed Option
Project Risk
Project risk is defined as the possibility that the IT development and implementation is not successful (on
time and reasonably within budget). By limiting the project to only three discrete, primarily independent
enhancements, project risk is significantly lowered. Market research shows clearly that larger projects
with larger timelines have, in general, a much greater probability of failure. Project risk, therefore, is
partially mitigated under the Enhanced option. Exhibit 6-14 shows our scoring by subcategory for this
option and a comparison to the other four options.
Exhibit 6-14Project Risk Matrix–Enhanced Option
Category Wei
gh
t
As-
Is
En
han
ced
Cu
sto
m
CO
TS
Bes
t o
f B
reed
Project Leadership 6.7% 0.0 2.0 5.0 4.0 4.0
Culture of Organization 6.7% 0.0 2.0 4.0 4.0 4.0
Personnel Skill Set Availability 6.7% 0.0 2.0 4.0 4.0 4.0
Project Ownership 6.7% 0.0 2.0 4.0 4.0 5.0
Project Sponsorship/Funding 6.7% 0.0 2.0 5.0 4.0 4.0
Project Effort 6.7% 0.0 2.0 5.0 4.0 3.0
People 40% – – – – –
System Design Complexity 5% 0.0 2.0 5.0 4.0 3.0
System Development Methodology 5% 0.0 2.0 5.0 3.0 3.0
Implementation Strategy 5% 0.0 3.0 5.0 3.0 3.0
Change Management 5% 0.0 2.0 5.0 5.0 5.0
Process Quality Management 5% 0.0 2.0 5.0 1.0 2.0
Requirements Stability 5% 0.0 2.0 5.0 3.0 3.0
Project Length 5% 0.0 2.0 5.0 3.0 3.0
Training and Support 5% 0.0 2.0 5.0 3.0 3.0
Process 40% – – – – –
In-Project Technical Obsolescence 6.7% 0.0 3.0 5.0 1.0 2.0
Data Conversion and Cleansing 6.7% 0.0 0.0 4.0 3.0 3.0
Adoption of Industry Standards 6.7% 0.0 4.0 2.0 1.0 2.0
Technology 20% – – – – –
Total Project Risk/Weighted Average 100% 0.0 2.1 4.5 3.2 3.3

Business Case Study 6—Options AnalysisEnhanced
Industry evidence suggests that project size, effort, and duration are critical factors in IT
project success. By limiting the project to only three discrete, primarily independent
enhancements, project risk is significantly lowered.
Continuation Risk
Continuation risk addresses ongoing risks to the information system, during the 15-year timeframe
considered in this analysis, after project completion. Many of the same risks associated with the As-Is
option apply to the Enhanced option. The Enhanced option is at risk of technical obsolescence because its
core systems, which are built on older technology, will essentially remain in tact. The State’s ongoing
operations are also at risk because of the lack of formal disaster recovery plans for COPES, SPURS, and
CMS. Another continuation risk is to system flexibility. While the Enhanced option adds functionality to
the core systems, it in no way makes the system more adaptable to future changes. Exhibit 6-15 shows
our scoring by subcategory for this option and a comparison to the other four options.

6—Options Analysis Business Case StudyBest of Breed Option
Exhibit 6-15Continuation Risk Matrix–Enhanced Option
Category Wei
gh
t
As-
Is
En
han
ced
Cu
sto
m
CO
TS
Bes
t o
f B
reed
System Leadership 10% 4.0 4.0 3.0 2.0 3.0
System Ownership 10% 4.0 4.0 3.0 3.0 3.0
Personnel Skill Set Availability 10% 5.0 4.0 3.0 3.0 3.0
System Sponsorship/Funding 10% 2.0 2.0 3.0 4.0 4.0
People 40% – – – – –
Stability of Vendor 6.7% 3.0 3.0 3.0 3.0 3.0
Enhancement Capability and Support 6.7% 4.0 4.0 3.0 2.0 3.0
System Flexibility 6.7% 5.0 5.0 2.0 3.0 3.0
Change Management 6.7% 4.0 4.0 3.0 1.0 2.0
Contingency Planning 6.7% 4.0 4.0 3.0 2.0 2.0
Post-Implementation Defect Rate 6.7% 3.0 3.0 5.0 2.0 2.0
Process 40% – – – – –
Post-Implementation Technical Obsolescence 5% 5.0 4.0 3.0 1.0 3.0
Disaster Recovery 5% 3.0 3.0 3.0 1.0 2.0
Adoption of Industry Standards 5% 5.0 4.0 3.0 1.0 2.0
Scalability 5% 2.0 2.0 3.0 2.0 2.0
Technology 20% – – – – –
Total Continuation Risk/Weighted Average 100% 3.8 3.6 3.1 2.3 2.8
The Enhanced option shares many of the same continuation risks with the As-Is option.
The Enhanced option is at risk of technical obsolescence because its core systems, which
are built on older technology, will essentially remain in tact.
Financial Analysis
During the functional evaluation, we analyzed approximately 1,500 high-level requirements to derive the
number of functional requirements that will be met with enhancements. The Enhanced option focuses
mainly on the integration using middleware, web access to forms and screens, and flexible reporting using
reporting tools. Having this definition for the Enhanced option, we estimated 348 additional requirements
would be fulfilled with this option. Additionally, 16 other minor reporting and 30 minor interfacing

Business Case Study 6—Options AnalysisEnhanced
requirements identified in the evaluation of the legacy system and that would be included in this project
were also included in the cost estimation.
This number of high-level requirements is used as a base number to estimate the cost of development. By
performing random sampling of simple and complex requirements and by leveraging KPMG’s
experience, we estimated that an average development effort of 30 FTE days is necessary for each
requirement. Similarly for the minor reports, we estimated 5 FTE days, and for minor interfaces we
estimated 10 FTE days of development effort. The total development effort is computed as 10,820 FTE
days based on the number of requirements.
Adopting a GartnerGroup estimation for the percentage of effort for the software development life cycle,
we multiplied the development effort by 5 to get the total project time, which includes requirement
analysis, logical and physical design, coding, unit and integration testing, and implementation.
(Reference: GartnerGroup’s Sizing up the SDLC, published on October 29, 1998, which states that only
20 percent of the total project hours are used for the code construction.) Additionally, we assumed that 20
percent of the project effort is required to run the project office, plan the implementation schedule,
manage the expectations, ensure quality of deliverables, and monitor project cost and schedule.
Assuming a project duration of 2 years and using the total FTEs required, we estimated that
approximately 180 personnel are required for the implementation. We also assumed that 200 effective
working days are available per year. Because State personnel have to continue to support the legacy
system, it is assumed that the project team’s consultant-to-employee ratio will be 70:30. We split the total
effort required for the development also at 70:30 ratio between consultants and State personnel for the
cost estimation. The duration was estimated considering the manageable project team size as well as the
early returns.
We estimated a consultant’s cost per day as $2,000, and that of the employee as $225.
Hardware costs are computed based on the technical architecture recommended.
Training costs include preparing the training material and instructing the trainers. We assumed that the
Enhanced option would be implemented in at least four waves. With five consultants working to prepare
the training material for five subsystems in four phases, we estimate it would cost $1 million.
Software costs include the middleware, reporting tools, and web-enablement tools. We estimated the
software costs using a pricing model for SAGAVISTA.
We assumed that the State personnel required for the implementation project are the personnel supporting
the current system. This reduces the operating costs during implementation. However, we are assuming

6—Options Analysis Business Case StudyBest of Breed Option
that all personnel will continue to be part of the support system. Operations costs for the next 15 years for
the Enhanced option are shown in Exhibit 6-16.
Exhibit 6-16Operations Costs—Enhanced Option
Operations Year 01 Year 02 Year 03 Year 04 Year 05 Year 06 Year 07 Year 08
Hardware
Support andMaintenance (1)
$8,991 $8,452 $7,945 $7,468 $7,020 $6,599 $6,203 $5,831
New Hardware – – – 101 101 101 246 74
Hardware Subtotals 8,991 8,452 7,945 7,569 7,121 6,700 6,449 5,905
Software
Support andMaintenance
2,218 2,396 2,587 2,794 3,018 3,259 3,520 3,802
License Costs – – – 594 635 680 727 778
Software Subtotals (2)2,218 2,396 2,587 3,388 3,653 3,939 4,247 4,580
FFMIS Support Staff (3)11,585 10,050 10,560 13,790 14,342 14,916 15,512 16,133
Total Operations Costs
New System – – – $695 $736 $781 $973 $852
Old System (Option 1) $11,209 $10,848 $10,532 $10,262 $10,038 $9,858 $9,723 $9,633
Total w/Staff $22,794 $20,898 $21,092 $24,747 $25,116 $25,555 $26,208 $26,618
Year 09 Year 10 Year 11 Year 12 Year 13 Year 14 Year 15Total
Costs
Hardware
Support andMaintenance (1)
$5,481 $5,152 $4,843 $4,552 $4,279 $4,022 $3,781
New Hardware 74 74 74 181 54 54 54
Hardware Subtotals 5,555 5,226 4,917 4,733 4,333 4,076 3,835 $91,807
Software
Support andMaintenance
4,106 4,434 4,789 5,172 5,586 6,033 6,516
License Costs 833 891 954 1,020 1,092 1,168 1,250
Software Subtotals (2)4,939 5,325 5,743 6,192 6,678 7,201 7,766 $70,852
FFMIS Support Staff (3)16,778 17,449 18,147 18,873 19,628 20,413 21,230 $239,406
Total Operations Costs
New System $907 $965 $1,028 $1,201 $1,146 $1,222 $1,304 –
Old System (Option 1) $9,587 $9,586 $9,632 $9,724 $9,865 $10,055 $10,297 –
Total w/Staff $27,272 $28,000 $28,807 $29,798 $30,639 $31,690 $32,831 $402,065
Assumptions: (1) Hardware Price Increases/(Decreases), (0.06) per annum, Maintenance Costs % of Purchase Price, 0.3 per annum: New Hardware Purchased Every 5 years(2) % Increase in Maintenance Cost Annually, 0.07 per annum(3) Staff Cost Growth, 0.04 per annum

Business Case Study 6—Options AnalysisEnhanced
Implementation costs for the Enhanced option are shown in Exhibit 6-17.
Exhibit 6-17Implementation Costs—Enhanced Option
ImplementationYear
01Year
02Year
03Year
04Year
05Year
06Year
07Year
08
New Hardware (1) – $335 $101 – – – – –
License Costs (2) – 3,700 555 – – – – –
Consulting (3) $11,077 42,981 45,130 – – – – –
Interfaces – – – – – – – –
Subtotal 11,077 42,981 45,130 – – – – –
Risk Adjusted Subtotal (4) 11,077 46,978 49,327 – – – – –
Training – – 1,000 – – – – –
Implementation Totals 11,077 46,978 50,327 – – – – –
Project Staff 749 2,700 2,700 – – – – –
Undiscounted Costs 11,826 53,713 53,683 – – – – –
Year09
Year10
Year11
Year12
Year13
Year14
Year15
TotalCosts
New Hardware (1) – – – – – – – $436
License Costs (2) – – – – – – – $4,255
Consulting (3) – – – – – – –
Interfaces – – – – – – –
Subtotal – – – – – – –
Risk Adjusted Subtotal (4) – – – – – – –
Training – – – – – – –
Implementation Totals – – – – – – – $108,382
Project Staff – – – – – – – $6,149
Undiscounted Costs – – – – – – – $119,222
Assumptions: (1) Maintenance Costs % of Purchase Price, 30% per annum(2) Maintenance Costs % of Purchase Price, 15% per annum % Increase in Maintenance Cost Annually, 7% per annum(3) Consulting Costs Increases, 5% per annum(4) Risk Adjustment Factor, 1.0933

6—Options Analysis Business Case StudyBest of Breed Option
The net present value, internal rate of return, and payback period in years for the Enhanced option are
shown in Exhibit 6-18.
Exhibit 6-18BPR Savings—Enhanced Option
DiscountRate 6% Year 01 Year 02 Year 03 Year 04 Year 05 Year 06 Year 07 Year 08
ImplementationCosts
$(11,826) $(53,713) $(53,683) – – – – –
Operations Costs (22,794) (20,898) (21,092) $(24,747) $(25,116) $(25,555) $(26,208) $(26,618)
TechnologyDependent Savings
(354) 238 246 254 262 41,682 42,932 44,220
Subtotal (34,974) (74,373) (74,529) (24,493) (24,854) 16,127 16,724 17,602
Other BPR Savings 19,250 26,257 27,046 27,857 28,692 29,554 30,442 31,356
Grand Total $(15,724) $(48,116) $(47,483) $3,364 $3,838 $45,681 $47,166 $48,958
Payback Period–Option 2
$(34,974) $(109,347) $(183,876) $(208,369) $(233,223) $(217,096) $(200,372) $(182,770)
Year 09 Year 10 Year 11 Year 12 Year 13 Year 14 Year 15 Totals
ImplementationCosts
– – – – – – – $(119,222)
Operations Costs $(27,272) $(28,000) $(28,807) $(29,798) $(30,639) $(31,690) $(32,831) $(402,065)
TechnologyDependent Savings
45,546 46,912 48,320 49,769 51,262 52,799 54,383 $478,471
Subtotal 18,274 18,912 19,513 19,971 20,623 21,109 21,552 $(42,816)
NPV (of subtotal) – – – – – – – $(96,638)
Internal Rate ofReturn
– – – – – – – (2%)
Other BPR Savings 32,296 33,265 34,262 35,290 36,350 37,441 38,564 $467,922
Grand Total $50,570 $52,177 $53,775 $55,261 $56,973 $58,550 $60,116 $425,106
Payback Period–Option 2
$(164,496) $(145,584) $(126,071) $(106,100) $(85,477) $(64,368) $(42,816) N/A

Business Case Study 6—Options AnalysisCustom
Option 3: Custom
Overview
The Custom option would require a complete rewrite of the existing five FFMIS subsystems into one
integrated client/server application. This option would achieve 100 percent of the required functionality,
detailed in Chapter 5. The Custom option includes such features as web enabling, workflow, Windows
(2000/NT and future releases) compatible client programs, and document management.
We are not evaluating the particular suite of tools that would be used to develop the application, but
assume that most of the programming requirements would be handled in fourth-generation or higher
programming languages and development environments. All transactions with the databases would be
performed in Structured Query Language.
All data would be stored in a single, uniform, database format and would reside on a single database
server or cluster of database servers housed at a single data center. By adapting to an open client/server
system architecture, modern tools and design techniques would assist the State in achieving a flexible,
interoperable, and modular system, which can meet the future needs of the State.
A 6-year development cycle for this option would not include the initial requirements definition and
vendor bid/selection process. A semi-phased development and implementation approach would be used,
where core modules will be placed into production based on areas of functionality. A core group of 60
consultants would design, manage, and develop the application, while 100 State personnel would be
available to provide business process expertise during the analysis and design phases. In addition, we
assume that State personnel will actively participate in the coding, testing, and implementation phases.
The Custom option puts the responsibility for the quality of the product entirely on the State. To increase
the quality of the product, the State must give special attention to the following:
! A very focused and effective project office is necessary to manage expectations. The inability tomeet quality requirements and project milestones and deliverables could potentially result insignificant cost overruns
! Sufficient efforts should be invested in maintaining standards and ensuring a modular and genericparameter-driven design of the application
! Because the duration of the development project is about 6 years, changes in technology, businessrequirements, and industry standards will affect the course of the project. To maintain thestandards and quality of the product, the State will have to reinvest periodically in earlyimplementation modules

6—Options Analysis Business Case StudyBest of Breed Option
! To keep the system up-to-date with current technology after the implementation, the State has toinvest in upgrading the solution periodically. Otherwise, the State will run the risk ofobsolescence
Assumptions
The following assumptions were made to evaluate the Custom option:
! The Custom option will be based on client/server technology. The State can use the existingmainframe as the database host
! A custom-developed IT solution of this magnitude will take 6 years to design, build, andimplement
! To ensure inclusion and consideration of every business process and business rule in the customdesign, the State will dedicate personnel from multiple agencies to support this effort for theduration of the project
! External personnel will be used to augment the application development staff
! For the sake of simplicity, the Custom option assumes that the whole development effort will useone standard development tool set, without considering the probable changes in the technologyduring the project duration of 6 years
! No major enhancements will be made to the current system for the duration of the Custom option
! The Chart of Accounts and other business coding structures will be consolidated into one uniformstatewide system
! A committee will be assigned to oversee and coordinate the design and development project toensure agency requirements are prioritized and coordinated in the best interest of the State
! The designed solution will be a State-oriented system with consolidated requirements of Stateagencies and universities
! A Quality Assurance team will ensure the quality and standardization of the design. During theproject, if the standards change, the State will maintain the standards at an acceptable level
! Agency-specific requirements will continue to be supported by shadow and supplemental systemsmodified to interface with the custom FFMIS
! The integrated FFMIS will reduce the number of shadow and feeder systems and interfaces
! One data center and help desk will support the new FFMIS
! The network will be TCP/IP based by the time of implementation

Business Case Study 6—Options AnalysisCustom
Technical Architecture
The Custom option, like the Enhanced option, is predominately an IP network. The major change to the
overall system would be in the use of Unix-based applications and database servers for mission critical
systems. The custom rewrite of FFMIS applications would be accomplished on a separate platform. The
original data centers will continue to exist because other applications reside on those systems.
This option would require a major investment in new hardware and software. The new application
development platform will require extensive training of existing personnel and outside support assistance.
We have included a schematic of the proposed high-level architecture for the Custom option in
Appendix G.
Timeline
The first phases of the new FFMIS will be functional in year 4. Certain phases of the new FFMIS such as
the Travel and e-Mall modules would be operational in Fiscal Year 2001. The remainder of the modules
would not be operational until Fiscal Year 2005 or 2006. The entire system would be in place and
functional by the end of year 6, as shown in Exhibit 6-19.
Exhibit 6-19Timeline for Implementation–Custom Option
Requirements Definition
Integration Solution
Phased Implementation
BPR Savings
7/1/
00
FY
01 1
/1/0
17/
1/01
7/1/
02
7/1/
03
7/1/
04
7/1/
05
7/1/
06
7/1/
07
FY
02 1
/1/0
2
FY
03 1
/1/0
3
FY
04 1
/1/0
4
FY
05 1
/1/0
5
FY
06 1
/1/0
6
FY
07 1
/1/0
7
Requirements Analysis
Functional Requirements
As stated in the assumptions for this option, we scored this option with the highest scores for information
processing functional requirements. The key points in the analysis of functional requirements are:

6—Options Analysis Business Case StudyBest of Breed Option
! The Custom option is assumed to meet 100 percent of functionality
! The system will be designed to provide full integration among the core areas of functionality
! The system will meet 100 percent of the flexible reporting requirements
! A Custom option would satisfy all the State’s service level requirements. Service level will beaffected by spreading the computational load over the network to improve responsivenessbetween front-end and back-end processors and by reducing the number of batch updates to addreal-time system availability
! For maximum human resource utilization, the State should invest in defining and furtherautomating existing manual processes and incorporate these findings into the new Custom option
! The Custom option will be built to meet the strategic direction of the State
Exhibit 6-20 shows our scoring by subcategory for this option and a comparison to the other four options.
Exhibit 6-20Functional Requirements Matrix–Custom Option
Category Wei
gh
t
As-
Is
En
han
ced
Cu
sto
m
CO
TS
Bes
t o
f B
reed
General Ledger 15% 3.5 4.0 5.0 4.0 5.0
Human Resource 15% 2.0 3.0 5.0 4.0 5.0
Budgeting 5% 2.5 3.0 5.0 3.0 4.0
Cash Management and Investment 5% 3.0 4.0 5.0 4.0 5.0
Purchasing 10% 2.0 3.0 5.0 4.0 5.0
Information Processing Requirements 50% 1.3 1.7 2.5 2.0 2.5
Integration 5% 1.0 3.0 5.0 5.0 5.0
Flexible Reporting 5% 1.0 3.0 5.0 5.0 5.0
Service Level 5% 1.0 2.0 5.0 4.0 4.0
Human Resource Utilization 3% 1.0 3.0 5.0 4.0 4.0
Strategic Direction 2% 1.0 3.0 5.0 5.0 5.0
Business Operating Requirements 20% 0.2 0.6 1.0 0.9 0.9
Total Functional Score 70% 1.5 2.3 3.5 2.9 3.4
A successfully designed and implemented Custom option should, under ideal
circumstances, meet 100 percent of the State’s functional requirements.

Business Case Study 6—Options AnalysisCustom
Technical Requirements
The sustainability scores of the Custom option are based on the following key points:
! Ideally, a custom-built solution should be 100 percent scalable. However, the Custom option willhave many unknowns. After factoring in the following difficulties in achieving the 100 percentscore, this option is awarded a score of 4 out of 5 for scalability
! Little data is available for a custom-built solution to scale the system with renewed processes andtechnology
! The option will be implemented over 6 years with multiple implementation phases among Stateagencies and universities. This lengthy implementation for the custom-built solution willnegatively affect the functional scalability of the system
! The following factors were considered while evaluating system availability with this option:
– A client/server environment will help with decentralized hardware management that shouldresult in a high percentage of up-time
– Real-time updates and full integration between system components will reduce the need forinterfaces and batch updates. This will effectively increase the availability of the application
! Because of the complexity of the system in general, ease-of-use will be perceived by the userpopulation based on the level of training received and the adequacy of training materialsprovided. In addition, ease-of-use is improved by providing context-sensitive online help and aconsistent appearance throughout front-end screens, forms, and reports. It is expected thatachieving the full satisfaction of the user population in this category will be difficult
! An effective and user-friendly security system is achievable with the Custom option
! The backup and recovery system will be enhanced over the current level. The best availablebackup and recovery solution can be achieved with the industry standard database and networkand computer architecture
! As a custom-built option, it is expected to have an integrated architecture
The industry direction scores of the Custom option are based on the following key points:
! A Custom option is assumed to be client/server based
! We assume that the State will use interoperable tools and will build the system using industry-standard, application-process integration techniques
! The State is expected to develop a uniform data model for the development effort. However,given the extended timeframe needed to design, build, and implement a custom-built solution, itis expected that uniformity will be difficult to enforce

6—Options Analysis Business Case StudyBest of Breed Option
! We assume that the custom solution will use web front-end screens for input as well as someinformation delivery and will incorporate workflow techniques to reduce manual processes.Middleware technology will be used for component integration
! We assume that the State will choose open systems to increase compatibility and interoperabilityamong components of the new system
! The State will have access to the most current and productive development and test tools underthis option
Exhibit 6-21 shows our scoring by subcategory for this option and a comparison to the other four options.
Exhibit 6-21Project Risk Matrix–Custom Option
Category Wei
gh
t
As-
Is
En
han
ced
Cu
sto
m
CO
TS
Bes
t o
f B
reed
Scalability 5% 2.0 3.0 4.0 5.0 4.0
System Availability 5% 2.0 3.0 5.0 5.0 5.0
Ease-of-Use 3% 2.0 3.0 4.0 4.0 4.0
Security 3% 3.0 3.0 5.0 5.0 5.0
Backup and Recovery 2% 1.0 3.0 5.0 5.0 4.0
Architectural Integration 2% 1.0 3.0 5.0 5.0 4.0
Sustainability 20% 0.4 0.6 0.9 1.0 0.9
Client/Server Environment 2% 1.0 2.0 5.0 5.0 5.0
Interoperability 2% 2.0 3.0 5.0 4.0 4.0
Uniform Data Models 2% 1.0 1.0 4.0 5.0 4.0
Web, Workflow, and Middleware 2% 1.0 3.0 5.0 4.0 5.0
Open Systems 1% 1.0 3.0 5.0 4.0 4.0
Development and Test Tools 1% 2.0 3.0 4.0 4.0 4.0
Industry Direction 10% 0.1 0.2 0.5 0.4 0.4
Total Technical Score 30% 0.5 0.8 1.4 1.4 1.3
Total Score 100% 2.0 3.1 4.9 4.3 4.7

Business Case Study 6—Options AnalysisCustom
The Custom option should approach meeting 100 percent of the State’s technical
requirements. However, the shear magnitude, complexity, and duration of the Custom
option may negatively impact scalability, design as it relates to ease-of-use, and a truly
uniform data model.
Risk Analysis
The Custom option is in line with the State’s strategic vision of one integrated financial information
system for the State of Florida. Under this option, strategic risk is negligible.
Based on KPMG’s experience with custom-developed IT solutions, KPMG surveys, and market research
of large-scale IT development projects, we conclude that the risk of failure associated with this option is
large enough to render this option unacceptable to the State.
Strategic Risk
The strategic risk under this option is negligible. Exhibit 6-22 shows our scoring by subcategory for this
option and a comparison to the other four options.
Exhibit 6-22Strategic Risk Matrix–Custom Option
Category Wei
gh
t
As-
Is
En
han
ced
Cu
sto
m
CO
TS
Bes
t o
f B
reed
Management access to consolidated financialinformation
16.7% 5.0 3.0 1.0 1.0 1.0
Citizen access to financial information 16.7% 5.0 2.0 1.0 1.0 1.0
Employee access/self-service to administrativeinformation
16.7% 5.0 3.0 1.0 1.0 1.0
Perceived financial stability/bond rating 16.7% 4.0 3.0 1.0 1.0 1.0
Reduction of manual processes and redundantdata entry
16.7% 5.0 3.0 2.0 1.0 2.0
Reduction of agency feeder/shadow systems 16.7% 5.0 3.0 2.0 2.0 2.0
People/Process/Technology 100% – – – – –
Total Strategic Risk/Weighted Average 100% 4.8 2.8 1.3 1.2 1.3

6—Options Analysis Business Case StudyBest of Breed Option
Strategic risk under this option is negligible because a custom-developed solution should,
under the best circumstances, follow the strategic direction exactly as determined by the
State.
Project Risk
A 1998 Standish Group survey of 7,552 IT projects indicated that, in general, 28 percent of projects
surveyed failed, and 46 percent were “challenged” (source: GartnerGroup and Software Magazine). Only
26 percent of the projects surveyed were characterized as successes. The term challenged was defined as a
project that was completed or operational but was over budget, behind schedule, or had fewer features and
functions than originally planned. Exhibit 6-23 shows cost overruns as a percentage of original
estimation.
Exhibit 6-23IT Project Cost Overruns–Custom Option
40%
30%
20%
10%
0%
Res
po
nd
ents
Under20%
21%-50%
51%-100%
101%-200%
Over200%
Percent Over Budget
For projects in excess of $10 million, the failure rate is even higher. Of those larger projects, 51 percent
were challenged and 49 percent of projects failed. These figures are in line with similar research data
gathered for this analysis.
Specific project risks identified for a Custom option for the State of Florida include project length, size
and effort of project, design complexity, requirements stability, and the culture of the organization. The

Business Case Study 6—Options AnalysisCustom
funding source, as it relates to the budgeting process, was also identified as a risk factor. Exhibit 6-24
shows our scoring by subcategory for this option and a comparison to the other four options.
Exhibit 6-24Project Risk Matrix–Custom Option
Category Wei
gh
t
As-
Is
En
han
ced
Cu
sto
m
CO
TS
Bes
t o
f B
reed
Project Leadership 6.7% 0.0 2.0 5.0 4.0 4.0
Culture of Organization 6.7% 0.0 2.0 4.0 4.0 4.0
Personnel Skill Set Availability 6.7% 0.0 2.0 4.0 4.0 4.0
Project Ownership 6.7% 0.0 2.0 4.0 4.0 5.0
Project Sponsorship/Funding 6.7% 0.0 2.0 5.0 4.0 4.0
Project Effort 6.7% 0.0 2.0 5.0 4.0 3.0
People 40% – – – – –
System Design Complexity 5% 0.0 2.0 5.0 4.0 3.0
System Development Methodology 5% 0.0 2.0 5.0 3.0 3.0
Implementation Strategy 5% 0.0 3.0 5.0 3.0 3.0
Change Management 5% 0.0 2.0 5.0 5.0 5.0
Process Quality Management 5% 0.0 2.0 5.0 1.0 2.0
Requirements Stability 5% 0.0 2.0 5.0 3.0 3.0
Project Length 5% 0.0 2.0 5.0 3.0 3.0
Training and Support 5% 0.0 2.0 5.0 3.0 3.0
Process 40% – – – – –
In-Project Technical Obsolescence 6.7% 0.0 3.0 5.0 1.0 2.0
Data Conversion and Cleansing 6.7% 0.0 0.0 4.0 3.0 3.0
Adoption of Industry Standards 6.7% 0.0 4.0 2.0 1.0 2.0
Technology 20% – – – – –
Total Project Risk/Weighted Average 100% 0.0 2.1 4.5 3.2 3.3
Based on industry research and KPMG experience with custom solutions, we conclude
that because of the size, complexity, project length, and organizational culture, the risk of
project failure associated with the Custom option is large enough to render this option
unacceptable to the State.

6—Options Analysis Business Case StudyBest of Breed Option
Continuation Risk
Continuation risk is present under the Custom option. However, it is mitigated by the technology upgrade
performed during the implementation. Adherence to “open” data format and communication standards,
which we are assuming will occur, will significantly reduce continuation risk. Risks to the State
associated with maintaining an up-to-date, modern IT system include skill set availability, leadership,
system ownership, and change management. It is assumed under the Custom option that a single,
comprehensive disaster recovery and fallback plan will be implemented. One final risk that warrants
mention is the risk that the resulting product will sustain a high post-implementation defect rate. This risk
can be mitigated through strict process and quality process management, and rigorous system testing
during the project development phases. Exhibit 6-25 shows our scoring by subcategory for the Custom
option and a comparison to the other four options.
Exhibit 6-25Continuation Risk Matrix–Custom Option
Category Wei
gh
t
As-
Is
En
han
ced
Cu
sto
m
CO
TS
Bes
t o
f B
reed
System Leadership 10% 4.0 4.0 3.0 2.0 3.0
System Ownership 10% 4.0 4.0 3.0 3.0 3.0
Personnel Skill Set Availability 10% 5.0 4.0 3.0 3.0 3.0
System Sponsorship/Funding 10% 2.0 2.0 3.0 4.0 4.0
People 40% – – – – –
Stability of Vendor 6.7% 3.0 3.0 3.0 3.0 3.0
Enhancement Capability and Support 6.7% 4.0 4.0 3.0 2.0 3.0
System Flexibility 6.7% 5.0 5.0 2.0 3.0 3.0
Change Management 6.7% 4.0 4.0 3.0 1.0 2.0
Contingency Planning 6.7% 4.0 4.0 3.0 2.0 2.0
Post-Implementation Defect Rate 6.7% 3.0 3.0 5.0 2.0 2.0
Process 40% – – – – –
Post-Implementation Technical Obsolescence 5% 5.0 4.0 3.0 1.0 3.0
Disaster Recovery 5% 3.0 3.0 3.0 1.0 2.0
Adoption of Industry Standards 5% 5.0 4.0 3.0 1.0 2.0
Scalability 5% 2.0 2.0 3.0 2.0 2.0
Technology 20% – – – – –
Total Continuation Risk/Weighted Average 100% 3.8 3.6 3.1 2.3 2.8

Business Case Study 6—Options AnalysisCustom
A Custom option would significantly reduce the State’s exposure to continuation risk over
the As-Is and Enhanced options. However, experience indicates that the design
complexity and size of the project increase the risk of post-implementation defects and
increase the risks associated with change management.
Financial Analysis
We have estimated a cost range for a custom-developed, fully integrated information management system
to replace the State of Florida’s existing five FFMIS subsystems. The existing systems/functionality
considered for this cost estimate were FLAIR, COPES, SPURS, LAS/PBS, and CMS.
We have taken a top-down approach to estimating the costs of a custom-developed IFMS, as shown in
Exhibit 6-26. This exercise consisted of defining an initial frame of reference, or base cost estimate, for
the proposed system. Inputs to this activity were estimated application size, initial assumptions and
constraints, data on comparable projects, and industry cost data. The next phase was to review the base
cost estimate with internal KPMG specialists. This activity consisted of reviewing the project cost data,
attributes, initial assumptions, and constraints, and making revisions to the cost estimate. This review and
revision is an iterative process. From these activities, a final cost estimate was achieved.
Exhibit 6-26Methodology Flow Chart–Custom Option
Application SizeEstimated Source Lines
of Code (SLOC)To Build New System
Base Cost EstimateCustom IFMS
InitialAssumptions
and/orConstraints
KPMGCost Data and Comparables
IndustryCost Data
KPMGSpecialists
Revised CostEstimate
Custom IFMS
Review Project
Attributes and
Assumptions

6—Options Analysis Business Case StudyBest of Breed Option
In this section we discuss the following phases of our estimation process:
! Overall Assumptions
! Application Sizing
! Cost and Comparable Data
! Base Cost Estimate
! Review of Project Attributes and Assumptions
! Final/Revised Cost Estimate
Overall Assumptions
We initiated the estimating process by placing a baseline constraint on the project length of 6 years, which
we consider the maximum acceptable time to complete the proposed project. The proposed application
will be constructed using a fourth-generation language. An individual programming language and
development environment is not specified for the purpose of this cost estimation. The cost of the Custom
option was based on the assumption that both consulting personnel and State personnel will participate in
the design, development, and implementation of the proposed application.
Application Sizing
We used the total source lines of code (SLOC) of the existing system to provide a base size for the new
system under consideration. SLOC data was provided by each of the functional owners of the five FFMIS
subsystems. Much of the existing code base of the five FFMIS subsystems is written in the COBOL and
Natural programming languages.
Programming languages can be measured in terms of expressiveness; that is, 1 line of code written in a
high-level programming language might be 10 times more productive than 1 line of code written in a
lower level programming language. A well-known and ongoing study by Capers Jones of Software
Productivity Research, Inc., attempts to establish a code level for each of the most commonly used
programming languages. We have used these code-level conversion factors to estimate the total lines of
code in a generic fourth-generation language for the proposed system as shown in Exhibit 6-27.

Business Case Study 6—Options AnalysisCustom
Exhibit 6-27Conversion Factors of Programming Languages–Custom Option
ExistingLanguage
ExistingSystem
SLOCConversion
Factor
ProposedSystem
SLOCProposedLanguage
COBOL 2,674,188 0.19 501,410 4GL
Natural 1,919,723 0.38 719,896 4GL
RPG 12,048 0.36 4,330 4GL
MS Access 171,216 0.53 90,959 4GL
PL/SQL 20,354 1.69 34,347 4GL
Total 4,797,529 – 1,350,942 –
Based on the conversion process shown in Exhibit 6-27, we estimate that the proposed IFMS would
require approximately 1.35 million lines of generic fourth-generation language code.
Much of the industry data available on custom software development is represented as cost per function
point (FP). We therefore relied on the Capers Jones study to determine the number of function points for
the proposed project. Based on the study and our SLOC estimate of 1.35 million, we are estimating that
the proposed project would consist of 67, 547 function points. The following software size estimates are
used:
! Application size is in SLOC: 1,350,000
! Application size in FPs: 67,547
Cost and Comparable Data
We analyzed cost data on comparable projects and gathered industry data on large-scale IT projects to
determine costs to apply to our SLOC- and FP-based estimates. The costs are presented in Exhibit 6-28.

6—Options Analysis Business Case StudyBest of Breed Option
Exhibit 6-28Project Cost Estimates–Custom Option
Project/Industry Data Code $/SLOC SDLC $/SLOC Code $/FP SDLC $/FP
PC1 $12.60 $64.70 $251.94 $1,294
IC1 20.78 – – –
IC2 – – – 1,134
IC3 – – 250.00 1,250
IC4 – – – 1,000
SDLC=Software Development Life Cycle
PC1=Florida Retirement System, RIM Project, 2000
IC1=“Economics of rewriting lost source code,” Caper Jones
IC2=“Measuring the Software Process,” Garmus and Herron, Prentice Hall, 1996
IC3=“Expected Value of Software Projects,” Hrubin Systems, Inc., 1999
IC4=PMI, San Diego Presentation, Artemis Management Systems, Inc., 1998
Based on our review of industry data and on comparable project data, we applied a cost to construct code
of $12.60 per SLOC and a cost per FP for the entire Software Development Life Cycle (SDLC) of $1,250.
Base Cost Estimate
We used three methods to arrive at a base cost estimate. These were cost per SLOC, cost per FP, and an
estimation based on cost per hour. The information is presented in Exhibit 6-29.
Exhibit 6-29SLOC, FP, and Hourly Cost Estimates–Custom Option
Basis Metric Cost Per Total Code
SLOC 1,350,000 $12.60 $17,010,000
FP 67,547 250.00 16,886,750
Hours 102,923 250.00 25,730,700
Hours were derived from an estimated productivity rate of 21 FP per person-month converted to person-
hours. The total hours from this method were multiplied by 20 percent to arrive at estimated coding hours.
The rate of $250 per hour is based on a blended consulting rate.
We applied a confidence weighting to the figures in Exhibit 6-29 to arrive at a single cost to construct
code for the project, which is shown in Exhibit 6-30. Our confidence rating is based on our experience
with the derivation method used and knowledge of the data source.

Business Case Study 6—Options AnalysisCustom
Exhibit 6-30Cost-to-Construct Estimates–Custom Option
BasisTotalCode Weight Total
SLOC $17,010,000 0.6 $10,206,000
FP 16,886,750 0.2 3,377,350
Hours 25,730,700 0.2 5,146,140
Estimated Cost to Construct Code $18,729,490
We applied our estimated cost to construct code of $18,729,490 to the SDLC. We adopted a
GartnerGroup estimate on the percentage of effort for the SDLC for client/server environments. This
estimate, along with associated cost estimates, is shown in Exhibit 6-31.
Exhibit 6-31Basic Cost Estimates–Custom Option
Phase Effort Cost
Requirements and Analysis 15% $14,047,118
Logical Design 10% $9,364,745
Physical Design 15% $14,047,118
Code Construction 20% $18,729,490
Unit Testing 15% $14,047,118
System Testing 15% $14,047,118
Implementation 10% $9,364,745
Total 100% $93,647,450
We adopted $93,647,450 as our base cost estimate for the Custom option.
Review of Project Attributes and Assumptions
KPMG specialists reviewed the SDLC costs presented in Exhibit 6-31. Considerable attention was paid to
the similarities and differences between the proposed project and the Florida Retirement System’s
Reengineering, Modernization, and Improvement (RIM) project. The RIM system is a complete,
integrated custom system—at the time of this writing—being implemented by KPMG. We performed a
comparison analysis between the proposed project and the RIM project to determine gaps in complexity
that should be reflected in our cost estimate. The results of this phase of the cost estimation process are
shown in the Exhibit 6-32.

6—Options Analysis Business Case StudyBest of Breed Option
Exhibit 6-32Comparison of RIM and Proposed Project Costs–Custom Option
Phase Effort Cost MultiplierRevised
CostRevised
Effort
Requirements and Analysis 15% $14,047,118 1.5 $21,070,676 17%
Logical Design 10% 9,364,745 1.5 14,047,118 11%
Physical Design 15% 14,047,118 1.2 16,856,541 13%
Code Construction 20% 18,729,490 1.1 20,602,439 16%
Unit Testing 15% 14,047,118 1.1 15,451,829 12%
System Testing 15% 14,047,118 1.3 18,261,253 15%
Implementation 10% 9,364,745 2.0 18,729,490 15%
Total – $93,647,450 – $125,019,346 –
In addition to the revised cost total in Exhibit 6-32, we applied a standard 20 percent project management
expense (Program Office). The resulting total development cost (excluding State personnel costs, some
training costs, database fees, and hardware expense) is estimated to be approximately $150 million.
Based on the revised cost estimate and internal discussion and review at this stage of the analysis, we
further refined the following project assumptions, shown in Exhibit 6-33.
Exhibit 6-33Proposed Project Cost Estimates–Custom Option
Total Estimated Cost (in millions) $150
Total SLOC 1,486,036
Language 4GL
Total FPs 74,302
Total Hours 576,000
Max Acceptable Time to Completion (years) 6
Total Person-Hours per Year 96,000
Total Days per Staff Year 200
Total Hours per Staff Year 1,600
Average # Consulting Staff per Year 60
Total Estimated Cost per SLOC $101
Total Estimated Cost per FP $2,020
Estimated Hours/FP 7.75
These numbers appear to be reasonably in line with industry data collected on large-scale, custom-
developed solutions.

Business Case Study 6—Options AnalysisCustom
For a separate verification of our cost totals, we used Quantitative Software Management, Inc.’s
SLIM 4.0. SLIM is a well-known cost-estimating model/tool that has been validated over a 15-year
period with thousands of completed projects. Using the software size estimate in SLOC described earlier,
we ran our solution based on a peak staff constraint of 160 available staff (60 consulting, 100 available
State personnel), and an estimated 1,486,036 SLOC to produce. A resulting cost estimate of $184 million
was produced, with a peak development staff of 90 persons and an estimated time to completion of 88
months. In general, we concluded that this exercise and result affirmed our independent cost-estimation
results.
Final/Revised Cost Estimate
We arrived at a preliminary cost estimate of $150 million. This figure does not include State personnel
costs, hardware and database costs, and software development tool costs. We present these costs in
Exhibit 6-34.
Exhibit 6-34Final/Revised Cost Estimate–Custom Option
Development Costs $150,023,215
State Personnel 27,000,000
Hardware Costs 30,000,000
Database Fees 5,000,000
Software Costs 1,500,000
Total $213,523,215
Our best estimate of costs to develop a custom IFMS for the State of Florida is $220 million. This figure
represents a best case scenario (low estimate) in our estimated cost range. We developed a risk adjustment
factor for the Custom option, described earlier, that we apply to development costs of $150 million. We
estimated, given the scope, complexity, and organizational structure, that an appropriate risk multiplier of
2.56 is warranted for this option.
We therefore present a cost range of $214 million to $448 million for the Custom option.
Operations costs over the next 15 years for the Custom option are shown in Exhibit 6-35.

6—Options Analysis Business Case StudyBest of Breed Option
Exhibit 6-35Operations Costs—Custom Option
OperationsYear
01Year
02Year
03Year
04Year
05Year
06Year
07Year
08
Hardware
Support and Maintenance (1) $8,991 $8,452 $7,945 $7,468 $7,020 $6,599 $6,203 –
New Hardware – – – – – – – $6,615
Hardware Subtotals 8,991 8,452 7,945 7,468 7,020 6,599 6,203 6,615
Software
Support and Maintenance 2,218 2,396 2,587 2,794 3,018 3,259 3,520 –
License Costs – – – – – – – 500
Software Subtotals (2)2,218 2,396 2,587 2,794 3,018 3,259 3,520 500
FFMIS Support Staff (3)12,260 7,970 8,760 9,290 9,842 10,416 11,012 6,270
Total Operations Costs
New System – – – – – – – $7,115
Old System (Option 1) $11,209 $10,848 $10,532 $10,262 $10,038 $9,858 $9,723 –
Total w/Staff $23,469 $18,818 $19,292 $19,552 $19,880 $20,274 $20,735 $13,385
Year09
Year10
Year11
Year12
Year13
Year14
Year15
TotalCosts
Hardware
Support and Maintenance (1)– – – – – – – –
New Hardware – – – – $4,854 – – –
Hardware Subtotals – – – – 4,854 – – $64,147
Software
Support and Maintenance – – – – – – – –
License Costs $535 $572 $613 $655 701 $750 $803 –
Software Subtotals (2)535 572 613 655 701 750 803 $24,921
FFMIS Support Staff (3)6,521 6,782 7,053 7,335 7,628 7,934 8,251 $127,324
Total Operations Costs
New System $535 $572 $613 $655 $5,555 $750 $803 –
Old System (Option 1) – – – – – – – –
Total w/Staff $7,056 $7,354 $7,666 $7,990 $13,183 $8,684 $9,054 $216,392
Assumptions: (1) Hardware Price Increases/(Decreases), (6.0%) per annum(2) New Hardware Purchased Every 5 years % Increase in Maintenance Cost Annually, 7.0% per annum(3) Staff Cost Growth, 4.0% per annum

Business Case Study 6—Options AnalysisCustom
Implementation costs for the Custom option are shown in Exhibit 6-36.
Exhibit 6-36Implementation Costs—Custom Option
ImplementationYear
01Year
02Year
03Year
04Year
05Year
06Year
07Year
08
New Hardware (1) – – $9,013 – – – – –
License Costs (2) – – 5,000 $803 $859 $919 $983 –
Consulting (3) $7,590 $34,937 17,066 28,822 31,595 42,241 23,213 –
Interfaces – – – – 2,667 4,000 1,333 –
Subtotal 7,590 34,937 17,066 28,822 34,262 46,241 24,546 –
Risk Adjusted Subtotal (4) 7,590 89,439 43,689 73,783 87,710 118,376 62,838 –
Training – 1,600 – – – 8,853 24,450 –
Implementation Totals 7,590 91,039 43,689 73,783 87,710 127,229 87,288 –
Project Staff 560 4,780 4,500 4,500 4,500 4,500 4,500 –
Undiscounted Costs 8,150 95,819 62,202 79,086 93,069 132,648 92,771 –
Year09
Year10
Year11
Year12
Year13
Year14
Year15
TotalCosts
New Hardware (1) – – – – – – – $9,013
License Costs (2) – – – – – – – $8,564
Consulting (3) – – – – – – – –
Interfaces – – – – – – – –
Subtotal – – – – – – – –
Risk Adjusted Subtotal (4) – – – – – – – –
Training – – – – – – – –
Implementation Totals – – – – – – – $518,328
Project Staff – – – – – – – $27,840
Undiscounted Costs – – – – – – – $563,745
Assumptions: (1) Maintenance Costs for 5 years included in Purchase Price(2) Maintenance Costs % of Purchase Price, 0.15 per annum % Increase in Maintenance Cost Annually, 0.07 per annum(3) Consulting Cost Increases, 0.05 per annum(4) Risk Adjustment Factor, 2.56
The net present value, internal rate of return, and payback period in years for the Custom option are
shown in Exhibit 6-37.

6—Options Analysis Business Case StudyBest of Breed Option
Exhibit 6-37BPR Savings—Custom Option
DiscountRate 6% Year 01 Year 02 Year 03 Year 04 Year 05 Year 06 Year 07 Year 08
ImplementationCosts
$(8,150) $95,819) $(62,202) $(79,086) $(93,069) $(132,648) $(92,771) –
Operations Costs (23,469) (18,818) (19,292) (19,552) (19,880) (20,274) (20,735) $(13,385)
TechnologyDependent Savings
(176) 5,858 6,034 6,216 6,403 6,595 6,792 84,495
Subtotal (31,795) (108,779) (75,460) (92,422) (106,546) (146,327) (106,714) 71,110
Other BPR Savings 19,250 26,257 27,046 27,857 28,692 29,554 30,442 31,356
Grand Total $(12,545) $(82,522) $(48,414) $(64,565) $(77,854) $(116,773) $(76,272) $102,466
Payback Period-Option 3
$(31,795) $(140,574) $(216,034) $(308,456) $(415,002) $(561,329) $(668,043) $(596,933)
Year 09 Year 10 Year 11 Year 12 Year 13 Year 14 Year 15 Totals
ImplementationCosts
– – – – – – – $(563,745)
Operations Costs $(7,056) $(7,354) $(7,665) $(7,990) $(13,184) $(8,684) $(9,054) $(216,392)
TechnologyDependent Savings
88,297 90,947 93,676 96,486 99,381 102,361 105,432 $798,797
Subtotal 81,241 83,593 86,011 88,496 86,197 93,677 96,378 $18,660
NPV (of subtotal) – – – – – – – $(166,387)
Internal Rate ofReturn
– – – – – – – (1%)
Other BPR Savings 32,296 33,265 34,262 35,290 36,350 37,441 38,564 $467,922
Grand Total $113,537 $116,858 $120,273 $123,786 $122,547 $131,118 $134,942 $486,582
Payback Period-Option 3
$(515,692) $(432,099) $(346,088) $(257,592) $(171,395) $(77,718) $18,660 15 Years

Business Case Study 6—Options AnalysisCOTS
Option 4: COTS
Overview
The industry trend is to implement a COTS solution to obtain an integrated solution in less time than is
necessary to implement a custom-built solution. We considered three industry leaders in COTS
solutions—SAP, PeopleSoft, and Oracle—for the purpose of evaluation. We evaluated these three
Enterprise Resource Planning (ERP) packages using the State’s 1,500 high-level requirements. However,
it is important to note that this analysis is not intended to recommend a specific ERP package.
The COTS option contains all financial management, human resources, and payroll systems. The option
also assumes that all modules are acquired from the same vendor. Statistics show that a COTS software
implementation without major modifications will produce faster and better return on investment
compared to enhanced COTS solutions. In this option, we evaluated the SAP, PeopleSoft, and Oracle
packages with minimal enhancements that include only additional reports, minor interfaces, and minor
modifications. This approach is commonly referred as a “vanilla” COTS solution.
ERP packages were evaluated based on the functionality available with their latest releases. Functionality
that is planned for future releases was not considered during the evaluation. The State’s software
procurement and implementation will not occur for several years, and ERP packages may have additional
functionality by then.
The implementation assumes a single production instance of the software with a single database and
database server using multiple application servers being configured in an N-tier client/server
environment. The database server and application servers, as well as the ERP software, would be
supported by a centralized technical support staff and help desk housed in a single data center.
The COTS option would replace all five major existing systems, including FLAIR, SPURS, COPES,
LAS/PBS, and CMS. There would be no separate agency-level accounting system as in the current
configuration. Generally all agencies would share common tables for items such as objects, accounts,
funds, vendors, items, and projects. The tables would have a minimal number of designated fields, which
would be under semi-autonomous agency-level control to satisfy truly unique agency requirements. The
ERP software would not replace agency-specific revenue and unique operations software.
The implementation would be completed in approximately 3½ years. The financials portion would be
rolled out in three separate phases where agencies and universities go live at 2- to 3-month intervals. The
HR and Payroll implementation would take place in two phases. Careful planning of the implementation
strategy is necessary.

6—Options Analysis Business Case StudyBest of Breed Option
We assume that the vendor will provide training to the core implementation team of 100 FTEs during the
first 6 months of the project and that consultants will “train the trainers” who will then train the agency-
level users just before the go-live period.
Assumptions
The following assumptions were made to evaluate the COTS option:
! A single COTS solution will be used for all the State FFMIS including the universities
! Because the ERP’s industry solutions provide modules built on generally accepted governmentprocesses, the State will adapt to these standard processes wherever feasible
! The Chart of Accounts and other business coding structures will be consolidated into oneuniform, statewide system
! The COTS option will be implemented without significant process modifications. However,normal table configuration, minor modifications, additional reports, and interfaces identified inthe documented requirements are included in the evaluation of the COTS implementation
! A carefully planned, multiphased implementation approach will be adopted for the COTSimplementation
! One help desk and a data center will support FFMIS
! The network will be TCP/IP-based by the time of implementation
Technical Architecture
The architecture for Option 4 is identical to Option 3. The only difference is in the application server. All
the attributes of Option 3 are the same for Option 4, except for the COTS package. Extensive training in
the programming language of the selected ERP package is required to make any modifications to meet
government business needs. We have included a schematic of the proposed high-level architecture for the
COTS solution in Appendix G.
Timeline
The proposed timeline calls for full implementation within 3½ years and is shown in Exhibit 6-38.
Certain phases of the new FFMIS such as the Travel and E-Mall modules will be operational in Fiscal
Year 2001. The remainder of the modules will be operational in Fiscal Year 2004 or 2005.

Business Case Study 6—Options AnalysisCOTS
Exhibit 6-38Timeline for Implementation–COTS Option
Requirements Definition
Integration Solution
Phased Implementation
BPR Savings
7/1/
00
FY
01 1
/1/0
17/
1/01
7/1/
02
7/1/
03
7/1/
04
7/1/
05
7/1/
06
7/1/
07
FY
02 1
/1/0
2
FY
03 1
/1/0
3
FY
04 1
/1/0
4
FY
05 1
/1/0
5
FY
06 1
/1/0
6
FY
07 1
/1/0
7
Requirements Analysis
Functional Requirements
The evaluation summary of the COTS packages for the State’s functional information processing
requirements is shown in Exhibit 6-39. The basic score represents the total functionality provided by
COTS packages as delivered. The minimum score shows the functionality delivered with minimal
enhancements which include reports, minor interfaces, and minor modifications. The versions evaluated
were SAP 4.6A, PeopleSoft 7.5, and Oracle 11.02.
Exhibit 6-39Evaluation of ERP Packages–COTS Option
SAP PeopleSoft Oracle
Basic Minimum Basic Minimum Basic Minimum
Functional Area
Accounting 90% 95% 87% 94% 86% 91%
Cash and Investments 86% 97% 82% 93% 32% 50%
Budget 54% 70% 49% 71% 63% 90%
Human Resources 84% 93% 91% 98% 58% 93%
Purchasing 81% 88% 75% 80% 80% 85%
Overall 84% 92% 82% 91% 70% 87%
Considering a 5 percent margin of error, all evaluated COTS packages scored similarly. In some
functional areas, some packages are weaker than others, but overall score averages are close. For

6—Options Analysis Business Case StudyBest of Breed Option
example, PeopleSoft scores better than SAP in human resources, and SAP provides better functionality
for purchasing and accounting.
In summary, the implementation of the COTS option will achieve an average of approximately 80 percent
of the required functionality, as defined in the accompanying requirements definition, without
modification. It will achieve 90 percent or better functionality with only minor modifications, simple
interfaces, and simple reports, which can be developed during implementation.
We scored the COTS option as average in meeting the functional requirements. The COTS solution
provides more than 80 percent of the functionality in accounting, cash management, human resources,
and purchasing. However, none of the evaluated ERP packages provided the necessary functionality
required to support the budget approval process. Therefore, the score is 3 in this functional area for the
COTS packages.
Other highlights for the COTS option evaluation results are:
! ERP packages are generally weak in the following areas:
– Legislative approval of budget issues
– Web-enabled vendor bid management system
– Travel profiles and reservations for the employees
– Cash and accrual basis of accounting
! Oracle Financials has low functionality in investment management
! All evaluated packages have specialized functionality for government and higher education needs
A summary of the business operating requirements follows:
! ERP packages bring the best possible integrated solution to the State. The integration is deliveredat both the database and process levels. ERP solutions have been proven over the years and acrossindustries, and are known for their high degree of integration
! The COTS option provides the best available tool for flexible reporting. Many of the reportingneeds are packaged in the delivered solution. The integrated software and database offer effectiveand flexible reporting
! The COTS option will support an acceptable level of service:
– A client/server architecture helps to maximize responsiveness by spreading the computationalload and by better using the power of the PC and desktop computers
– Accessibility of the system will also be enhanced because the front end will be independentof back-end applications. For example, browser software and a GUI front end on PCs can

Business Case Study 6—Options AnalysisCOTS
interact with UNIX-based back-end applications. Use of web-enabled forms and reports isassumed in rating accessibility
– A reduced number of batch updates will add to the real-time availability of the system
– Additional processing time is required for the COTS option because of the GUI and real-timevalidation of almost every data field. Generic processes and table-driven processing logic willalso cause the system response time to be less than the response time of a custom-developedsolution
! A COTS option generally increases productivity by automating processes and eliminatingredundant processes. Use of workflow and web-based applications such as employee self-servicewill increase productivity. However, the COTS options will need relatively more end-user and ITpersonnel training. It is also difficult to retain COTS-trained IT personnel because they are inhigh demand
! The COTS option promotes the enterprise vision and therefore it supports the State-orientedFFMIS subsystems. The integrated accounting and fund management functionality will provide astrong foundation for perceived financial stability
Exhibit 6-40 shows our scoring by subcategory for this option and a comparison to the other four options.

6—Options Analysis Business Case StudyBest of Breed Option
Exhibit 6-40Functional Requirements Matrix–COTS Option
Category Wei
gh
t
As-
Is
En
han
ced
Cu
sto
m
CO
TS
Bes
t o
f B
reed
General Ledger 15% 3.5 4.0 5.0 4.0 5.0
Human Resource 15% 2.0 3.0 5.0 4.0 5.0
Budgeting 5% 2.5 3.0 5.0 3.0 4.0
Cash Management and Investment 5% 3.0 4.0 5.0 4.0 5.0
Purchasing 10% 2.0 3.0 5.0 4.0 5.0
Information Processing Requirements 50% 1.3 1.7 2.5 2.0 2.5
Integration 5% 1.0 3.0 5.0 5.0 5.0
Flexible Reporting 5% 1.0 3.0 5.0 5.0 5.0
Service Level 5% 1.0 2.0 5.0 4.0 4.0
Human Resource Utilization 3% 1.0 3.0 5.0 4.0 4.0
Strategic Direction 2% 1.0 3.0 5.0 5.0 5.0
Business Operating Requirements 20% 0.2 0.6 1.0 0.9 0.9
Total Functional Score 70% 1.5 2.3 3.5 2.9 3.4
The implementation of a COTS option will achieve approximately 80 percent of the
required functionality without modification, as defined in the accompanying requirements
definition. The key areas of weakness, with respect to the specific needs of the State of
Florida, are in the budgeting modules.
Technical Requirements
The sustainability scores of the COTS option are based on the following key points:
! The COTS option scores best in this category. The generic design and the amount of industrybenchmark information available for planning makes the COTS option the best scalable solution.COTS vendors constantly invest in new technology, and it is available to customers throughupgrades. The client/server architecture is expected to be scalable
! A client/server environment will help the decentralized hardware management by producing ahigh percentage of up-time

Business Case Study 6—Options AnalysisCOTS
! Real-time updates and an integrated solution will reduce the need for interfaces and batchupdates. This will effectively increase the availability of the application
! The complexity of COTS screens is a concern in general. In addition, COTS products tend to usegeneric terminology instead of the State’s business terminology. The following factors weigh infavor and against the ease-of-use of a COTS solution:
– The usage of web applications, a GUI, and a browser front end will enhance usabilityconsiderably over the current system. However, not all screens are web-enabled in the currentversions of COTS packages, but this is changing very rapidly
– COTS solutions will provide training materials and training sessions
– COTS solutions provide online, context-sensitive help screens
– COTS solutions have a consistent appearance for all screens, forms, and reports
– Because COTS solutions have a generic design, they have more information in the screensand more screens and menu items to navigate through. However, ERP packages provide toolsto customize the screens, report formats, and menus
– COTS solutions use many generic business terms. Because it is considerable work tocustomize the terminology, the COTS vendors recommend that customers acclimate to thegeneric terminology rather than change it. This is a common concern for the end-users untilthey become familiar with the new system
! COTS solutions generally provide effective, configurable, and easily manageable security.Security is verified once during logon, and a user profile keeps track of user access to variousfunctions, fields, and reports for different activities such as display, update, and authorize
! The backup and recovery system will be enhanced over the current level. COTS solutions provideutilities for backup and recovery. With the industry-standard database, and network and computerarchitecture, the best available disaster recovery system can also be implemented
! Because COTS vendors support and recommend an integrated architecture, we are expecting theState to follow the norm
The industry direction scores of the COTS option are based on the following key points:
! COTS packages are client/server-based. However, not all COTS solutions are web-enabled. Moreprocessing is required on the desktop, and therefore higher end clients are required. Additionalbandwidth is needed because forms must be downloaded to the PC at request time
! COTS solutions are designed to be interoperable, but their application process interfaces are notfreely available. Other software vendors will have to work with the ERP vendors to make theirsoftware operable with a COTS solution. However, many tools and software are available in themarket that can operate with a COTS solution
! The COTS option provides a uniform data model

6—Options Analysis Business Case StudyBest of Breed Option
! The COTS option will use modern technology like web and workflow to the fullest extent
! ERP software vendors make the code available for the customer to modify, but the solution itselfdoes not make use of open-system technology
! COTS solutions provide good development and test tools, which are usually proprietary tools
Exhibit 6-41 shows our scoring by subcategory for this option and a comparison to the other four options.
Exhibit 6-41Technical Requirements Matrix–COTS Option
Category Wei
gh
t
As-
Is
En
han
ced
Cu
sto
m
CO
TS
Bes
t o
f B
reed
Scalability 5% 2.0 3.0 4.0 5.0 4.0
System Availability 5% 2.0 3.0 5.0 5.0 5.0
Ease-of-Use 3% 2.0 3.0 4.0 4.0 4.0
Security 3% 3.0 3.0 5.0 5.0 5.0
Backup and Recovery 2% 1.0 3.0 5.0 5.0 4.0
Architectural Integration 2% 1.0 3.0 5.0 5.0 4.0
Sustainability 20% 0.4 0.6 0.9 1.0 0.9
Client/Server Environment 2% 1.0 2.0 5.0 5.0 5.0
Interoperability 2% 2.0 3.0 5.0 4.0 4.0
Uniform Data Models 2% 1.0 1.0 4.0 5.0 4.0
Web, Workflow, and Middleware 2% 1.0 3.0 5.0 4.0 5.0
Open Systems 1% 1.0 3.0 5.0 4.0 4.0
Development and Test Tools 1% 2.0 3.0 4.0 4.0 4.0
Industry Direction 10% 0.1 0.2 0.5 0.4 0.4
Total Technical Score 30% 0.5 0.8 1.4 1.4 1.3
There are general concerns about the complexity of COTS screens. Positive aspects of a
COTS solution include a truly uniform data model, superior systems security,
architectural integration, and backup and recovery.

Business Case Study 6—Options AnalysisCOTS
Risk Analysis
Like the Custom option, the COTS option has substantial project risk. The ERP concept and current
technology will adequately mitigate strategic risks. Continuation risks are present, but are mitigated to a
large degree because of the regular cycle of upgrades provided by the top-tier ERP solution providers.
ERP software packages are the industry standard for very large organizations.
Strategic Risk
Strategic risk under this option is minimal. Exhibit 6-42 shows our scoring by subcategory for this option
and a comparison to the other four options.
Exhibit 6-42Strategic Risk Matrix–COTS Option
Category Wei
gh
t
As-
Is
En
han
ced
Cu
sto
m
CO
TS
Bes
t o
f B
reed
Management access to consolidated financialinformation
16.7% 5.0 3.0 1.0 1.0 1.0
Citizen access to financial information 16.7% 5.0 2.0 1.0 1.0 1.0
Employee access/self-service to administrativeinformation
16.7% 5.0 3.0 1.0 1.0 1.0
Perceived financial stability/bond rating 16.7% 4.0 3.0 1.0 1.0 1.0
Reduction of manual processes and redundantdata entry
16.7% 5.0 3.0 2.0 1.0 2.0
Reduction of agency feeder/shadow systems 16.7% 5.0 3.0 2.0 2.0 2.0
People/Process/Technology 100% – – – – –
Total Strategic Risk/Weighted Average 100% 4.8 2.8 1.3 1.2 1.3
We consider that strategic risk under the COTS option is negligible and that this option
will satisfy the strategic direction of the State. Because of the unique needs of State
agencies, it is likely that many agency feeder systems will remain in place.
Project Risk
Project risks should be given a considerable amount of attention. As indicated in the risk analysis section
for the Custom option, large-scale IT development projects are historically very risky propositions.

6—Options Analysis Business Case StudyBest of Breed Option
Canceled or delayed projects can be very costly to an organization, and the potential loss is magnified for
larger projects. COTS solutions are no exception. Therefore, it is imperative that adequate steps be taken
to mitigate such risks.
A recent GartnerGroup study on ERP delivery was conducted. With respect to on-time delivery, 55
percent of the 600 companies surveyed indicated that delivery was “about as expected,” while 32 percent
claimed delivery was “later than expected.” Ten percent indicated that the project was dropped. These
numbers compare slightly more favorably than IT projects in overall success rates. According to the
GartnerGroup, “Enterprises that approach ERP projects with realistic expectations, skilled management,
and adequate resources face reduced, not increased, risks compared to build-from-scratch internal
projects” (GartnerGroup SPA-06-9382, Feb. 1999). In general, market research supports the notion that a
limited customization approach taken in an ERP implementation produces a greater probability of a
successful implementation.
Exhibit 6-43 shows our scoring by subcategory for this option and a comparison to the other four options.

Business Case Study 6—Options AnalysisCOTS
Exhibit 6-43Project Risk Matrix–COTS Option
Category Wei
gh
t
As-
Is
En
han
ced
Cu
sto
m
CO
TS
Bes
t o
f B
reed
Project Leadership 6.7% 0.0 2.0 5.0 4.0 4.0
Culture of Organization 6.7% 0.0 2.0 4.0 4.0 4.0
Personnel Skill Set Availability 6.7% 0.0 2.0 4.0 4.0 4.0
Project Ownership 6.7% 0.0 2.0 4.0 4.0 5.0
Project Sponsorship/Funding 6.7% 0.0 2.0 5.0 4.0 4.0
Project Effort 6.7% 0.0 2.0 5.0 4.0 3.0
People 40% – – – – –
System Design Complexity 5% 0.0 2.0 5.0 4.0 3.0
System Development Methodology 5% 0.0 2.0 5.0 3.0 3.0
Implementation Strategy 5% 0.0 3.0 5.0 3.0 3.0
Change Management 5% 0.0 2.0 5.0 5.0 5.0
Process Quality Management 5% 0.0 2.0 5.0 1.0 2.0
Requirements Stability 5% 0.0 2.0 5.0 3.0 3.0
Project Length 5% 0.0 2.0 5.0 3.0 3.0
Training and Support 5% 0.0 2.0 5.0 3.0 3.0
Process 40% – – – – –
In-Project Technical Obsolescence 6.7% 0.0 3.0 5.0 1.0 2.0
Data Conversion and Cleansing 6.7% 0.0 0.0 4.0 3.0 3.0
Adoption of Industry Standards 6.7% 0.0 4.0 2.0 1.0 2.0
Technology 20% – – – – –
Total Project Risk/Weighted Average 100% 0.0 2.1 4.5 3.2 3.3
Although top-tier ERP vendors and third-party implementers of ERP solutions have
experience gained from thousands of implementations installed worldwide, significant
exposure to project risk remains. Specific factors relating to project risk under this option
include change management, overall system design complexity, and organizational
factors.

6—Options Analysis Business Case StudyBest of Breed Option
Continuation Risk
Continuation risks are present in the COTS option. Although the risk of technical obsolescence is
decreased by regular ERP vendor-supplied software upgrades, industry experience has shown that too
much customization in an installation can make system upgrades costly, time consuming, and in some
extreme cases, impossible. There is also a risk that the funding requirements of such regular upgrade
cycles might not be met.
Exhibit 6-44 shows our scoring by subcategory for this option and a comparison to the other four options.
Exhibit 6-44Continuation Risk Matrix–COTS Option
Category Wei
gh
t
As-
Is
En
han
ced
Cu
sto
m
CO
TS
Bes
t o
f B
reed
System Leadership 10% 4.0 4.0 3.0 2.0 3.0
System Ownership 10% 4.0 4.0 3.0 3.0 3.0
Personnel Skill Set Availability 10% 5.0 4.0 3.0 3.0 3.0
System Sponsorship/Funding 10% 2.0 2.0 3.0 4.0 4.0
People 40% – – – – –
Stability of Vendor 6.7% 3.0 3.0 3.0 3.0 3.0
Enhancement Capability and Support 6.7% 4.0 4.0 3.0 2.0 3.0
System Flexibility 6.7% 5.0 5.0 2.0 3.0 3.0
Change Management 6.7% 4.0 4.0 3.0 1.0 2.0
Contingency Planning 6.7% 4.0 4.0 3.0 2.0 2.0
Post-Implementation Defect Rate 6.7% 3.0 3.0 5.0 2.0 2.0
Process 40% – – – – –
Post-Implementation Technical Obsolescence 5% 5.0 4.0 3.0 1.0 3.0
Disaster Recovery 5% 3.0 3.0 3.0 1.0 2.0
Adoption of Industry Standards 5% 5.0 4.0 3.0 1.0 2.0
Scalability 5% 2.0 2.0 3.0 2.0 2.0
Technology 20% – – – – –
Total Continuation Risk/Weighted Average 100% 3.8 3.6 3.1 2.3 2.8

Business Case Study 6—Options AnalysisCOTS
The risk of technical obsolescence is decreased by regular ERP vendor-supplied software
upgrades. However, industry experience has shown that too much customization in an
installation can make system upgrades costly, time consuming, and in some extreme
cases, impossible.
Financial Analysis
The method used to estimate the cost of implementation is different from the Custom option and the
Enhanced option because of the nature of ERP implementation projects.
A COTS solution requires a high level of planning for the implementation strategy, a business blue print,
and a uniform definition of the organizational and business coding structure. The preparation includes the
project office, core team, hardware, and support structure. This planning and preparation phase also
includes the training of the project’s core team members.
Individual module implementation costs for a functional consultant’s time were determined by estimating
the duration for actual module configuration and testing. The number of consultants estimated varied
from 2 to 6 per module, based on our experience with similar implementations, and taking into account
the size and complexity of the State and its many diverse agencies.
A list of 1,500 high-level requirements was compared to the capabilities of the COTS solution, to derive
the number of requirements that can be fulfilled with this option. Further enhancements needed to meet
the State’s requirements were classified into categories from simple reports to complex interfaces and
modifications of business logic. Time estimates, ranging from 5 days for simple reports to 30 days for
complex changes, were assigned and priced at $2,000 per day. The COTS option includes only costs for
minor enhancements, minor reports, and simple interfaces because we assumed that the COTS option
includes ERP software implementation without major modifications to the package.
We made the following assumptions in our analysis:
! Based on our experience with similar engagements, costs of technical support consultants will beapproximately equal to the cost of functional consultants, or 40 percent of the total cost
! Approximately 20 percent of the total project effort will be required for the project office to planimplementation, manage expectations and quality of deliverables, and monitor project costs andschedule, based on our experience with similar projects

6—Options Analysis Business Case StudyBest of Breed Option
! The number of employees involved in the project will be the equivalent of 100 FTEs for 36months
! Consultants costs per day will be $2,000 including expenses; partners and senior managers willbe $2,400 per day. These rates are inclusive of expenses. Employee costs will be $225 per day.Working days per year are assumed to be 200
Operating costs were computed based on the number of personnel needed to support a COTS solution and
the other bolt-on applications.
Seventeen percent of the software costs estimated for implementation is used to compute the software
maintenance license fee.
Because ERP vendors release upgrades almost every year and they continue to provide support for the
releases for about 5 years, we accounted for one upgrade in every 3 years. Upgrade of an ERP solution
usually lasts 6 months.
Operations costs over the next 15 years for the COTS option are shown in Exhibit 6-45.

Business Case Study 6—Options AnalysisCOTS
Exhibit 6-45Operations Costs—COTS Option
Operations Year01
Year02
Year03
Year04
Year05
Year06
Year07
Year 08
Hardware
Support and Maintenance (1) $8,991 $8,452 $7,945 $7,468 $7,020 – – –
New Hardware – – – – – – $6,615 –
Hardware Subtotals 8,991 8,452 7,945 7,468 7,020 – 6,615 –
Software
Support and Maintenance 2,218 2,396 2,587 2,794 3,018 $5,920 – –
License Costs – – – – – 3,893 4,165 $4,457
Software Subtotals (2) 2,218 2,396 2,587 2,794 3,018 9,813 4,165 4,457
FFMIS Support Staff (3) 12,260 10,220 8,760 9,290 9,569 7,612 7,916 8,233
Total Operations Costs
New System – – – – – $3,893 $10,780 $4,457
Old System (Option 1) $11,209 $10,848 $10,532 $10,262 $10,038 $5,920 – –
Total w/Staff $23,469 $21,068 $19,292 $19,552 $19,607 $17,425 $18,696 $12,690
Year09
Year10
Year11
Year12
Year13
Year14
Year15
TotalCosts
Hardware
Support and Maintenance (1) – – – – – – –
New Hardware – – – $4,854 – – –
Hardware Subtotals – – – 4,854 – – – $51,345
Software
Support and Maintenance $4,000 – – 4,000 – – $4,000
License Costs 4,769 $5,102 $5,460 5,842 $6,251 $6,688 7,156
Software Subtotals (2) 8,769 5,102 5,460 9,842 6,251 6,688 11,156 $84,716
FFMIS Support Staff (3) 8,562 8,905 9,261 9,631 10,017 10,417 10,834 $141,487
Total Operations Costs
New System $4,769 $5,102 $5,460 $10,696 $6,251 $6,688 $7,156 –
Old System (Option 1) $4,000 – – $4,000 – – $4,000 –
Total w/Staff $17,331 $14,007 $14,721 $24,327 $16,268 $17,105 $21,990 $277,548
Assumptions: (1) Hardware Price Increases/(Decreases), (6.0%) per annum(2) New Hardware Purchased Every 5 years % Increase in Maintenance Cost Annually, 7.0% per annum(3) Staff Cost Growth, 4.0% per annum
Implementation costs for the COTS option are shown in Exhibit 6-46.

6—Options Analysis Business Case StudyBest of Breed Option
Exhibit 6-46Implementation Costs—COTS Option
ImplementationYear
01Year
02Year
03Year
04Year
05Year
06Year
07Year
08
New Hardware (1) – $9,013 – – – – – –
License Costs (2) – – $26,000 $3,400 $3,638 – – –
Consulting (3) $7,590 5,683 29,546 47,740 22,333 – – –
Interfaces 2,667 4,000 1,333 – – – –
Subtotal 7,590 8,350 33,546 49,073 22,333 – – –
Risk Adjusted Subtotal (4) 7,590 11,723 47,099 68,898 31,356 – – –
Training – 1,600 – 8,853 24,450 – – –
Implementation Totals 7,590 13,323 47,099 77,751 55,806 – – –
Project Staff 560 2,530 4,500 4,500 2,250 – – –
Undiscounted Costs 8,150 24,866 77,599 85,651 61,694 – – –
Year09
Year10
Year11
Year12
Year13
Year14
Year15
TotalCosts
New Hardware (1) – – – – – – – $9,013
License Costs (2) – – – – – – – $33,038
Consulting (3) – – – – – – – –
Interfaces – – – – – – – –
Subtotal – – – – – – – –
Risk Adjusted Subtotal (4) – – – – – – – –
Training – – – – – – – –
Implementation Totals – – – – – – – $201,569
Project Staff – – – – – – – $14,340
Undiscounted Costs – – – – – – – $257,960
Assumptions: (1) Maintenance Costs for 5 years included in Purchase Price(2) Maintenance Costs % of Purchase Price, 15% per annum % Increase in Maintenance Cost Annually, 7% per annum(3) Consulting Cost Increases, 5% per annum(4) Risk Adjustment Factor, 1.40444
The net present value, internal rate of return, and payback period in years for the COTS option are shown
in Exhibit 6-47.

Business Case Study 6—Options AnalysisCOTS
Exhibit 6-47BPR Savings—COTS Option
DiscountRate 6%
Year01
Year02
Year03
Year04
Year05
Year06
Year07
Year08
Implementation Costs $(8,150) $(24,866) $(77,599) $(85,651) $(61,694) – – –
Operations Costs (23,469) (21,068) (19,292) (19,552) (19,607) $(17,425) $(18,696) $(12,690)
TechnologyDependent Savings
(176) 5,858 6,034 6,216 6,403 80,220 83,821 86,336
Subtotal (31,795) (40,076) (90,857) (98,987) (74,898) 62,795 65,125 73,646
Other BPR Savings 19,250 26,257 27,046 27,857 28,692 29,554 30,442 31,356
Grand Total $(12,545) $(13,819) $(63,811) $(71,130) $(46,206) $92,349 $95,567 $105,002
Payback Period–Option 4
$(31,795) $(71,871) $(162,728) $(261,715) $(336,613) $(273,818) $(208,693) $(135,047)
Year09
Year10
Year11
Year12
Year13
Year14
Year15
Totals
Implementation Costs – – – – – – – $(257,960)
Operations Costs $(17,331) $(14,007) $(14,721) $(24,327) $(16,268) $(17,105) $(21,990) $(277,548)
TechnologyDependent Savings
88,926 91,595 94,344 97,174 100,089 103,090 106,183 $956,113
Subtotal 71,595 77,588 79,623 72,847 83,821 85,985 84,193 $420,605
NPV (of subtotal) – – – – – – – $133,770
Internal Rateof Return
– – – – – – – 12%
Other BPR Savings 32,296 33,265 34,262 35,290 36,350 37,441 38,564 $467,922
Grand Total $103,891 $110,853 $113,885 $108,137 $120,171 $123,426 $122,757 $888,527
Payback Period–Option 4
$(63,452) $14,136 $93,759 $166,606 $250,427 $336,412 $420,605 10 Years

Business Case Study 6—Options AnalysisBest of Breed
Option 5: Best of Breed
Overview
The recommended Best of Breed option is designed to take the best functionality from both existing
State-developed software and COTS software. Because COTS financial systems have integrated modules,
selecting individual financial modules from various COTS solutions is not a viable option. All of the
evaluated ERP solutions lack certain functionality related to the following general areas:
! Budgeting functionality contained in LAS/PBS that relates to tracking of issues and variousnarrative information is necessary to publish the formal budget
! Bid management tracking, reporting, and manipulation are incorporated in a custom systemalready in use
! E-Mall capabilities are scheduled to be developed by the State during the next 2 years
The Best of Breed option should encompass the retention of these State-owned and developed
applications, and they should be interfaced with the selected ERP solution.
In addition, the Student Administration module is sufficiently self-contained, and a student administration
system could be acquired from a COTS vendor other than the COTS vendor for the financial applications.
Many entities have historically chosen HR and payroll systems from one vendor and the financial
modules from another. Mixing modules from different ERP packages occurred as a result of the quality of
specific products available in the marketplace at different times, rather than conscious decisions to
implement a Best of Breed solution. Because of the size and complexity of the State’s financial structure
and budgetary process, we recommend a single vendor for both HR and payroll and financial systems.
The additional functionality that might be obtained by selecting separate vendors would be overshadowed
by having to support two different databases and train IT personnel in the use of two different toolkits.
The following areas also represent functionality that is lacking in the COTS software:
! Simultaneous cash basis of accounting, modified accrual, and accrual basis of accounting (COTSsolutions are designed to use the accrual basis of accounting)
! Interfaces between the travel reservations system and the integrated financial systems
These areas of functionality should be custom-developed using the development tools provided with the
selected COTS solution.

6—Options Analysis Business Case StudyBest of Breed Option
The Best of Breed option assumes that all pertinent features of LAS/PBS and the bid management system
have been incorporated through interfaces and that the remaining enhancements have been made based on
the requirements definition to ensure 100 percent functionality has been met.
We recommend that the State web-enable the LAS/PBS application components in the Best of Breed
solution.
A key distinction between the COTS option and the Best of Breed option involves the State University
System (SUS). Universities, being the engines of innovation, provide the impetus for economic, technical,
and social progress in modern societies. Like other areas of society, they are also undergoing radical
changes to face the competition to provide quality teaching at a lower cost. An IT solution that integrates
every process of the universities from the fund management to the teaching, research, and student services
will help the universities to reduce the cost of administration. Universities are uniquely autonomous in
their functions but remain accountable to State government. This unique status of the universities must be
properly addressed by the IT solution implemented by Florida. To highlight this relation, the SUS can be
viewed as shown in Exhibit 6-48.
Exhibit 6-48Interrelation of Financial Management and Student Administration Systems
Organization Management! Budget! Accounting! Funds Management! Revenue Management
Human Resource! Position and Recruitment! Personnel Administration! Personnel Development! Time and Leave! Benefits! Payroll! Travel Services
Business Support! Procurement! Inventory Management! Facility Maintenance! Cash and Treasury! Investment Project Management
Customer Relationship Management! Market Research and Brand Marketing! Relationship Management! Alumni Services
Teaching! Curriculum Planning! Student Administration! Teaching and Examination! Studies
Research! Planning and Program Management! Administration of Programs
Student Services! Career Planning and Placement! Financial Aid! Housing! Campus and Media Services
Records Management! Data Warehousing! Workflow and Approvals
State’s FFMIS System Student Administration System

Business Case Study 6—Options AnalysisBest of Breed
As illustrated in Exhibit 6-48, the SUS can be split into two major components: a Financial Management
System and a Student Administration System. Because it is possible that one ERP package may have
higher functionality for the SUS and yet have lower functionality for State government (or vice versa),
limiting both the SUS and the rest of State government to a single package could compromise the overall
functionality of both installations. Permitting, but not requiring, a dual FFMIS implementation will allow
the SUS to choose the best available ERP solution to manage the unique functionality in supporting the
students, staff, and curriculum. Finally, the ERP package selected by the State will interface with the
SUS’s Student Administration System and Financial Management System.
Assumptions
! The Best of Breed option consists of a COTS-centric solution
! Because this option is COTS-centric, all assumptions associated with the COTS option are validwith the Best of Breed option
! The budget appropriation functionality of LAS/PBS will interface with the State’s choice of anERP package. This may need some enhancements especially with a new consolidated Chart ofAccounts
! Some significant modifications within the COTS option will be required to meet the special needsof the State. This will include, but not be limited to, the bid management, travel reservation, andtravel expense reimbursement systems depending on the COTS packages chosen
! The COTS package must be used in conjunction with some additional specialization tools forreport distribution, document image management, and mails
! Some LAS/PBS components remaining in the Best of Breed option will be web-enabled
! The existing Vendor Bid System will remain in place
Technical Architecture
The Best of Breed option is the same as the COTS option. However, in the Best of Breed option, two of
the existing FFMIS applications, Vendor Bid System and LAS, will remain on their original platforms.
The ERP package for the State University System might be different from the COTS package for the
State’s Financial Management System. These remaining applications will undergo some enhancements to
meet the requirements as stated and agreed to in the systems requirements workshop. A new interface
should be written to allow the new COTS package and the existing applications to share data. We have
included a schematic of the high-level architecture for the Best of Breed solution in Appendix G.

6—Options Analysis Business Case StudyBest of Breed Option
Timeline
The proposed timeline shown in Exhibit 6-49 calls for full implementation within 3½ years. Certain
phases of the new FFMIS such as the Travel and E-Mall modules will be operational in Fiscal Year 2001.
The remainder of the modules will be operational in Fiscal Year 2004 or 2005.
Exhibit 6-49Timeline for Implementation–Best of Breed Option
Requirements Definition
Integration Solution
Phased Implementation
BPR Savings
7/1/
00
FY
01 1
/1/0
17/
1/01
7/1/
02
7/1/
03
7/1/
04
7/1/
05
7/1/
06
7/1/
07
FY
02 1
/1/0
2
FY
03 1
/1/0
3
FY
04 1
/1/0
4
FY
05 1
/1/0
5
FY
06 1
/1/0
6
FY
07 1
/1/0
7
Requirements Analysis
Functional Requirements
The Best of Breed option will combine ERP, application bolt-ons, and other modifications to allow nearly
100 percent functionality. We have reservations about this option meeting requirements for automation of
issue tracking and legislative approval process of the budget. Therefore, we scored this with 4 instead of
5, while all other functional areas have scored 5.
A summary of our evaluation of the business operating requirements follows:
! ERP packages bring the best possible integrated solution to the State. The integration is deliveredat both the database and process levels. COTS solutions have been proven over the years, andacross industries they are known for their integration. The COTS solution will be combined withthe web solutions the State has implemented with LAS/PBS
! The Best of Breed option provides the best available tool for flexible reporting. Many reportingneeds are packaged in the delivered solution. Integrated software and databases provide the bestplace to begin effective and flexible reporting. Web applications are feeding into the COTSsolution, and therefore reporting requirements will be served from the COTS option. With LAS,

Business Case Study 6—Options AnalysisBest of Breed
specific issue-tracking reports might need to be outside the COTS package. However, a majorityof the forecasting and planning models will be generated inside the COTS software
! The Best of Breed option will support an acceptable level of service:
– Client/server architecture helps to maximize responsiveness by spreading the computationalload and by better using the power of PC and desktop computers
– System accessibility will also be enhanced because the front end can be independent of back-end applications. For example, browser software and a GUI front end on PCs can interactwith UNIX-based back-end applications. Use of web-enabled forms and reports is assumed inrating accessibility
– A reduced number of batch updates will add to the real-time availability of the system
– Additional processing time is required for the Best of Breed option because of the GUI andreal-time validation of almost every data field. Generic processes and table-driven processinglogic will also cause the system response time to be less than the response time of a custom-developed solution
– Because LAS/PBS will continue as a solution, accessibility will improve with web access, butresponsiveness will only improve marginally. There is general satisfaction with theavailability of LAS/PBS
The Best of Breed option generally increases human resource utilization and productivity by automating
processes and eliminating redundant processes. Use of workflow and web-based applications such as
employee self-service will increase productivity. However, the Best of Breed option will need relatively
more end-user and IT personnel training. It is also difficult to retain COTS-trained IT personnel because
they are in high demand.
The Best of Breed option will promote the enterprise vision and therefore supports the State’s strategic
direction of the FFMIS subsystems. Integrated accounting and fund management functionality will
provide a strong foundation for perceived financial stability.
Exhibit 6-50 shows our scoring by subcategory for this option and a comparison to the other four options.

6—Options Analysis Business Case StudyBest of Breed Option
Exhibit 6-50Functional Requirements Matrix–Best of Breed Option
Category Wei
gh
t
As-
Is
En
han
ced
Cu
sto
m
CO
TS
Bes
t o
f B
reed
General Ledger 15% 3.5 4.0 5.0 4.0 5.0
Human Resource 15% 2.0 3.0 5.0 4.0 5.0
Budgeting 5% 2.5 3.0 5.0 3.0 4.0
Cash Management and Investment 5% 3.0 4.0 5.0 4.0 5.0
Purchasing 10% 2.0 3.0 5.0 4.0 5.0
Information Processing Requirements 50% 1.3 1.7 2.5 2.0 2.5
Integration 5% 1.0 3.0 5.0 5.0 5.0
Flexible Reporting 5% 1.0 3.0 5.0 5.0 5.0
Service Level 5% 1.0 2.0 5.0 4.0 4.0
Human Resource Utilization 3% 1.0 3.0 5.0 4.0 4.0
Strategic Direction 2% 1.0 3.0 5.0 5.0 5.0
Business Operating Requirements 20% 0.2 0.6 1.0 0.9 0.9
Total Functional Score 70% 1.5 2.3 3.5 2.9 3.4
The Best of Breed option, as defined, derives its core functionality from an ERP package,
while leaving in place systems such as the Vendor Bid System and LAS/PBS that
generally scored well compared to the high-level functional requirements. This option,
therefore, scored the highest in meeting functional requirements.
Technical Requirements
The sustainability scores of the Best of Breed option are based on the following key points:
! The scalability provided by the Best of Breed option will be limited slightly because of legacycomponents. The generic design and the amount of industry benchmark information available forplanning makes COTS the best scalable solution. LAS/PBS is a legacy component and isexpected to be functionally less scalable. COTS vendors constantly invest in new technology, andit is available to customers through upgrades. This type of constant upgrade will not be availablewith legacy components. The COTS client/server architecture is expected to be scalable;however, LAS/PBS is not client/server architecture

Business Case Study 6—Options AnalysisBest of Breed
! A client/server environment will help decentralized hardware management by providing a highpercentage of up-time and system availability. Real-time updates and an integrated solution willreduce the need for interfaces and batch updates. This will effectively increase the availability ofthe application. There is general satisfaction with the availability of LAS/PBS
! COTS packages use complex screens, navigation, and generic terminology instead of the State’sbusiness terminology, which is a concern. The following factors weigh in favor of and against theease-of-use for the Best of Breed option:
– The usage of web applications, a GUI, and a browser front end will enhance the usabilityconsiderably over the current system. However, not all screens are web-enabled in the currentversions of COTS packages, but this is changing very rapidly
– COTS packages provide training materials and training sessions
– COTS packages provide online, context-sensitive help
– COTS packages have a consistent appearance for all screens, forms, and reports
– Because COTS packages have a generic design, they have more information on the screensand more screens and menu items to navigate through. However, COTS packages providetools to customize the screens, report formats, and menus
– COTS packages use many generic business terms. Because it is considerable work tocustomize the terminology, COTS vendors recommend that customers acclimate to thegeneric terminology rather than change it. This is a common concern for end-users until theybecome familiar with the new system
! A web portal can provide a gateway to COTS and other bolt-on components with a single logon.The Best of Breed option will provide effective, configurable, and easily manageable security.Security is verified once during logon, and a user profile keeps track of the user access to variousfunctions, fields, and reports for activities such as display, update, and authorize
! The backup and recovery system will be enhanced compared to what now exists. The Best ofBreed option will provide utilities for backup and recovery. With the industry-standard databaseand network and computer architecture, the best available disaster recovery system can also beimplemented
! LAS/PBS requires a different set of backup and recovery procedure. This increases the risk of thedatabases not being synchronized during recovery
! Architecture will not be ideally integrated with COTS and some legacy components. BecauseLAS/PBS is a very small component, we believe architectural integration will be better thanaverage overall for FFMIS
The industry direction scores of the Best of Breed option are based on the following key points:

6—Options Analysis Business Case StudyBest of Breed Option
! The Best of Breed option is significantly client/server-based
! The Best of Breed option is designed to be interoperable. However, its application processinterfaces are not freely available. Other software vendors will have to work with the COTSvendors to make their software interoperate. Many software tools are available in the market thatcan operate with COTS packages
! The Best of Breed option provides the best possible uniform data model for the State. Other bolt-on applications will need to conform to the new uniform data model
! The Best of Breed option will use modern technology such as web and workflow to the fullestextent. The integration of ERP with bolt-on applications will make use of the middleware tools
! COTS software vendors make the code available for the customer to modify, but the solutionitself does not make use of open-system technology
! COTS packages, which are a major portion of the Best of Breed option, provide gooddevelopment and test tools (which are generally proprietary tools)
Exhibit 6-51 shows our scoring by subcategory for this option and a comparison to the other four options.

Business Case Study 6—Options AnalysisBest of Breed
Exhibit 6-51Technical Requirements Matrix–Best of Breed Option
Category Wei
gh
t
As-
Is
En
han
ced
Cu
sto
m
CO
TS
Bes
t o
f B
reed
Scalability 5% 2.0 3.0 4.0 5.0 4.0
System Availability 5% 2.0 3.0 5.0 5.0 5.0
Ease-of-Use 3% 2.0 3.0 4.0 4.0 4.0
Security 3% 3.0 3.0 5.0 5.0 5.0
Backup and Recovery 2% 1.0 3.0 5.0 5.0 4.0
Architectural Integration 2% 1.0 3.0 5.0 5.0 4.0
Sustainability 20% 0.4 0.6 0.9 1.0 0.9
Client/Server Environment 2% 1.0 2.0 5.0 5.0 5.0
Interoperability 2% 2.0 3.0 5.0 4.0 4.0
Uniform Data Models 2% 1.0 1.0 4.0 5.0 4.0
Web, Workflow, and Middleware 2% 1.0 3.0 5.0 4.0 5.0
Open Systems 1% 1.0 3.0 5.0 4.0 4.0
Development and Test Tools 1% 2.0 3.0 4.0 4.0 4.0
Industry Direction 10% 0.1 0.2 0.5 0.4 0.4
Total Technical Score 30% 0.5 0.8 1.4 1.4 1.3
The technical requirements of the State are met under the Best of Breed option.
Shortcomings in this area compared to the COTS solution resulted from the continuation
of legacy system components, which negatively affected scalability, backup and recovery
execution, architectural integration, and our scoring for uniform data models.
Risk Analysis
The risks associated with a Best of Breed option are primarily project and continuation risk.
Strategic Risk
Strategic risk under this option is minimal. Exhibit 6-52 shows our scoring by subcategory for this option
and a comparison to the other four options.

6—Options Analysis Business Case StudyBest of Breed Option
Exhibit 6-52Strategic Risk Matrix–Best of Breed Option
Category Wei
gh
t
As-
Is
En
han
ced
Cu
sto
m
CO
TS
Bes
t o
f B
reed
Management access to consolidated financialinformation
16.7% 5.0 3.0 1.0 1.0 1.0
Citizen access to financial information 16.7% 5.0 2.0 1.0 1.0 1.0
Employee access/self-service to administrativeinformation
16.7% 5.0 3.0 1.0 1.0 1.0
Perceived financial stability/bond rating 16.7% 4.0 3.0 1.0 1.0 1.0
Reduction of manual processes and redundantdata entry
16.7% 5.0 3.0 2.0 1.0 2.0
Reduction of agency feeder/shadow systems 16.7% 5.0 3.0 2.0 2.0 2.0
People/Process/Technology 100% – – – – –
Total Strategic Risk/Weighted Average 100% 4.8 2.8 1.3 1.2 1.3
We conclude that strategic risk under the Best of Breed option is negligible because this
option will satisfy the strategic direction of the State. One strategic risk shortfall is that
under this option the existing budgeting system will continue to operate as an
independent system, instead of being fully integrated into the core COTS system.
Project Risk
With the core portion of the implementation consisting of a COTS solution, a significant degree of risk
for cost overruns or project failure is unavoidable. While the definition of the Best of Breed option leaves
the existing budgeting system and the Vendor Bid System in place, interfaces will have to be rewritten or
modified to integrate these separate subsystems with the integrated core financial and HR system.
Overall, a Best of Breed option would see no appreciable reduction in risks from the slightly reduced
effort and complexity of the implementation.
Additional project risks to successful completion include those attributable to project ownership, system
sponsorship and funding, and organizational culture. We assumed for this option that the budgeting
system would remain under the ownership of the Executive Office of the Governor, while the core
financial systems would migrate under one single owner. The split ownership of the systems being
affected during such a significant implementation adds risk to the process. Other project risks, also

Business Case Study 6—Options AnalysisBest of Breed
identified under the Custom and COTS options, include system design complexity, system development
methodology, and implementation strategy.
Exhibit 6-53 shows our scoring by subcategory for this option and a comparison to the other four options.
Exhibit 6-53Project Risk Matrix–Best of Breed Option
Category Wei
gh
t
As-
Is
En
han
ced
Cu
sto
m
CO
TS
Bes
t o
f B
reed
Project Leadership 6.7% 0.0 2.0 5.0 4.0 4.0
Culture of Organization 6.7% 0.0 2.0 4.0 4.0 4.0
Personnel Skill Set Availability 6.7% 0.0 2.0 4.0 4.0 4.0
Project Ownership 6.7% 0.0 2.0 4.0 4.0 5.0
Project Sponsorship/Funding 6.7% 0.0 2.0 5.0 4.0 4.0
Project Effort 6.7% 0.0 2.0 5.0 4.0 3.0
People 40% – – – – –
System Design Complexity 5% 0.0 2.0 5.0 4.0 3.0
System Development Methodology 5% 0.0 2.0 5.0 3.0 3.0
Implementation Strategy 5% 0.0 3.0 5.0 3.0 3.0
Change Management 5% 0.0 2.0 5.0 5.0 5.0
Process Quality Management 5% 0.0 2.0 5.0 1.0 2.0
Requirements Stability 5% 0.0 2.0 5.0 3.0 3.0
Project Length 5% 0.0 2.0 5.0 3.0 3.0
Training and Support 5% 0.0 2.0 5.0 3.0 3.0
Process 40% – – – – –
In-Project Technical Obsolescence 6.7% 0.0 3.0 5.0 1.0 2.0
Data Conversion and Cleansing 6.7% 0.0 0.0 4.0 3.0 3.0
Adoption of Industry Standards 6.7% 0.0 4.0 2.0 1.0 2.0
Technology 20% – – – – –
Total Project Risk/Weighted Average 100% 0.0 2.1 4.5 3.2 3.3

6—Options Analysis Business Case StudyBest of Breed Option
The core portion of implementation will consist of a COTS option and therefore is subject
to a significant degree of project risk. While the definition of the Best of Breed option
leaves the existing appropriation system and Vendor Bid System in place, interfaces must
be rewritten or modified to integrate these separate subsystems with the integrated core
financial and HR systems. We conclude that a Best of Breed solution would not have an
appreciable reduction in project risk from the slightly reduced effort and complexity of
the implementation.
Continuation Risk
The same continuation risks present under the COTS option apply to the Best of Breed option. In
addition, because one of the systems being left in place is built upon older technology, that portion of the
system incurs a higher degree of risk of technical obsolescence.
Exhibit 6-54 shows our scoring by subcategory for this option and a comparison to the other four options.

Business Case Study 6—Options AnalysisBest of Breed
Exhibit 6-54Continuation Risk Matrix–Best of Breed Option
Category Wei
gh
t
As-
Is
En
han
ced
Cu
sto
m
CO
TS
Bes
t o
f B
reed
System Leadership 10% 4.0 4.0 3.0 2.0 3.0
System Ownership 10% 4.0 4.0 3.0 3.0 3.0
Personnel Skill Set Availability 10% 5.0 4.0 3.0 3.0 3.0
System Sponsorship/Funding 10% 2.0 2.0 3.0 4.0 4.0
People 40% – – – – –
Stability of Vendor 6.7% 3.0 3.0 3.0 3.0 3.0
Enhancement Capability and Support 6.7% 4.0 4.0 3.0 2.0 3.0
System Flexibility 6.7% 5.0 5.0 2.0 3.0 3.0
Change Management 6.7% 4.0 4.0 3.0 1.0 2.0
Contingency Planning 6.7% 4.0 4.0 3.0 2.0 2.0
Post-Implementation Defect Rate 6.7% 3.0 3.0 5.0 2.0 2.0
Process 40% – – – – –
Post-Implementation Technical Obsolescence 5% 5.0 4.0 3.0 1.0 3.0
Disaster Recovery 5% 3.0 3.0 3.0 1.0 2.0
Adoption of Industry Standards 5% 5.0 4.0 3.0 1.0 2.0
Scalability 5% 2.0 2.0 3.0 2.0 2.0
Technology 20% – – – – –
Total Continuation Risk/Weighted Average 100% 3.8 3.6 3.1 2.3 2.8
The continuation risk under this option is acceptable and scored slightly worse than the
COTS option only because of legacy components that will be left in place under this
option. The risk of technical obsolescence is decreased by regular ERP vendor-supplied
software upgrades on the core system, which would not apply to the LAS/PBS or Vendor
Bid System.
Financial Analysis
The method used to derive costs for the Best of Breed option is very similar to the method used for the
COTS option. Because this option attempts to meet 100 percent of functional requirements by enhancing

6—Options Analysis Business Case StudyBest of Breed Option
the COTS option and by bolting on existing systems to the COTS option, the cost of implementation is
higher.
A COTS-centric solution requires a high level of planning for the implementation strategy, a business
blue print, and a uniform definition of the organizational and business coding structure. Preparation
includes the project office, core team, hardware, and support structure. This planning and preparation
phase also includes the training of the project’s core team members.
The individual module implementation cost of a functional consultant’s time was determined by
estimating the duration for actual module configuration and testing. The number of consultants estimated
varied from two to six per module, based on our experience with similar implementations, and taking into
account the size and complexity of the State and its many diverse agencies.
A list of 1,500 high-level requirements was compared to the functionality available with the COTS option
to derive the number of requirements that can be fulfilled with the Best of Breed option. Further
enhancements needed to meet the State’s requirements were classified into categories from simple reports
to complex interfaces and modifications of business logic. Time estimates, ranging from 5 days for simple
reports to 30 days for complex changes, were assigned and priced at $2,000 per day. The Best of Breed
option includes the cost of enhancements needed for a COTS solution and additional interfaces needed to
be built to integrate with the bolt-on systems.
We made the following assumptions for this analysis:
! Based on our experience with similar engagements, the number and costs for technical supportconsultants will be approximately equal to the cost of functional consultants, or 40 percent of thetotal cost
! Based on our experience with similar projects, approximately 20 percent of the total project effortwill be required to plan implementation, manage expectations and quality of deliverables, andmonitor the cost and time
! The number of employees involved in the project will be the equivalent of 100 FTEs for 36months
! Consultants costs per day were estimated to be $2,000 including expenses. Partners and seniormanagers were assumed to cost $2,400 per day. These rates are inclusive of expenses. Employeecosts are assumed to be $225 per day. Working days per year are assumed to be 200
! Operating cost were computed based on the number of personnel needed to support a COTSsolution and the other bolt-on solutions
! Seventeen percent of the software cost estimated for implementation is used to compute thesoftware maintenance license fee

Business Case Study 6—Options AnalysisBest of Breed
! Because ERP vendors release upgrades almost every year and they continue to provide supportfor the releases for about 5 years, we accounted for one upgrade in every 3 years.Implementations of an ERP upgrade usually requires approximately 6 months
Operations costs over the next 15 years for the Best-of-Breed option are shown in Exhibit 6-55.
Exhibit 6-55Operations Costs—Best of Breed Option
Operations Year01
Year02
Year03
Year04
Year05
Year06
Year07
Year 08
Hardware
Support and Maintenance (1) $8,991 $8,452 $7,945 $7,468 $7,020 $1,077 $1,013 $952
New Hardware – – – – – – 9,604 –
Hardware Subtotals 8,991 8,452 7,945 7,468 7,020 1,077 10,617 952
Software
Support and Maintenance 2,218 2,396 2,587 2,794 3,018 6,212 312 334
License Costs – – – – – 3,893 4,165 4,457
Software Subtotals (2)2,218 2,396 2,587 2,794 3,018 10,105 4,477 4,791
FFMIS Support Staff (3)12,260 10,220 8,760 9,290 11,146 9,252 9,622 10,007
Total Operations Costs
New System – – – – – $3,893 $13,769 $4,457
Old System (Option 1) $11,209 $10,848 $10,532 $10,262 $10,038 $7,289 $1,325 $1,286
Total w/Staff $23,469 $21,068 $19,292 $19,552 $21,184 $20,434 $24,716 $15,750
Year09
Year10
Year11
Year12
Year13
Year14
Year15
TotalCosts
Hardware
Support and Maintenance (1) $895 $841 $791 $743 $699 $657 $617 –
New Hardware – – – 7,048 – – – –
Hardware Subtotals 895 841 791 7,791 699 657 617 $64,813
Software
Support and Maintenance 4,357 382 409 4,438 468 501 4,536 –
License Costs 4,769 5,102 5,460 5,842 6,251 6,688 7,156 –
Software Subtotals (2)9,126 5,484 5,869 10,280 6,719 7,189 11,692 $88,745
FFMIS Support Staff (3)10,408 10,824 11,257 11,707 12,175 12,662 13,169 $162,759
Total Operations Costs
New System $4,769 $5,102 $5,460 $12,890 $6,251 $6,688 $7,156 –
Old System (Option 1) $5,252 $1,223 $1,200 $5,181 $1,167 $1,158 $5,153 –
Total w/Staff $20,429 $17,149 $17,917 $29,778 $19,593 $20,508 $25,478 $316,317
Assumptions: (1) Hardware Price Increases/(Decreases), (6.0%) per annum(2) New Hardware Purchased every 5 years % Increase in Maintenance Cost Annually, 7.0% per annum(3) Staff Cost Growth, 4.0% per annum

6—Options Analysis Business Case StudyBest of Breed Option
Implementation costs for the Best of Breed option are shown in Exhibit 6-56.
Exhibit 6-56Implementation Costs—Best of Breed Option
ImplementationYear
01Year
02Year
03Year
04Year
05Year
06Year
07Year
08
New Hardware (1) – $13,086 – – – – – –
License Costs (2) – – $26,000 $3,400 $3,638 – – –
Consulting (3) $7,590 5,683 32,866 52,506 23,677 – – –
Interfaces 2,667 4,000 1,333 - – – –
Subtotal 7,590 8,350 36,866 53,839 23,677 – – –
Risk Adjusted Subtotal (4) 7,590 12,135 53,578 78,247 34,410 – – –
Training – 1,600 – 8,853 24,450 – – –
Implementation Totals 7,590 13,735 53,578 87,100 58,860 – – –
Project Staff 560 2,530 4,500 4,500 2,250 – – –
Undiscounted Costs 8,150 29,351 84,078 95,000 64,748 – – –
Year09
Year10
Year11
Year12
Year13
Year14
Year15
TotalCosts
New Hardware (1) – – – – – – – $13,086
License Costs (2) – – – – – – – $33,038
Consulting (3) – – – – – – –
Interfaces – – – – – – –
Subtotal – – – – – – –
Risk Adjusted Subtotal (4) – – – – – – –
Training – – – – – – –
Implementation Totals – – – – – – – $220,863
Project Staff – – – – – – – $14,340
Undiscounted Costs – – – – – – – $281,327
Assumptions: (1) Maintenance Costs for 5 years Included in Purchase Price(2) Maintenance Costs % of Purchase Price, 15% per annum % Increase in Maintenance Cost Annually, 7% per annum(3) Consulting Cost Increases, 5% per annum(4) Risk Adjustment Factor, 1.45333

Business Case Study 6—Options AnalysisBest of Breed
The net present value, internal rate of return, and payback period in years for the Best of Breed option are
shown in Exhibit 6-57.
Exhibit 6-57BPR Savings—Best-of-Breed Option
DiscountRate 6%
Year01
Year02
Year03
Year04
Year05
Year06
Year07
Year08
Implementation Costs $(8,150) $(29,351) $(84,078) $(95,000) $(64,748) – – –
Operations Costs (23,469) (21,068) (19,292) (19,552) (21,184) $(20,434) $(24,716) $(15,750)
TechnologyDependent Savings
(176) 5,858 6,034 6,216 6,403 80,220 83,821 86,336
Subtotal (31,795) (44,561) (97,336) (108,336) (79,529) 59,786 59,105 70,586
Other BPR Savings 19,250 26,257 27,046 27,857 28,692 29,554 30,442 31,356
Grand Total $(12,545) $(18,304) $(70,290) $(80,479) $(50,837) $89,340 $89,547 $101,942
Payback Period–Option 5
$(31,795) $(76,356) $(173,692) $(282,028) $(361,557) $(301,771) $(242,666) $(172,080)
Year09
Year10
Year11
Year12
Year13
Year14
Year15
Totals
Implementation Costs – – – – – – – $(281,327)
Operations Costs $(20,429) $(17,149) $(17,917) $(29,778) $(19,593) $(20,508) $(25,478) $(316,317)
TechnologyDependent Savings
88,926 91,595 94,344 97,174 100,089 103,090 106,183 $956,113
Subtotal 68,497 74,446 76,427 67,396 80,496 82,582 80,705 $358,469
NPV (of subtotal) – – – – – – – $92,965
Internal Rateof Return
– – – – – – – 10%
Other BPR Savings 32,296 33,265 34,262 35,290 36,350 37,441 38,564 $467,922
Grand Total $100,793 $107,711 $110,689 $102,686 $116,846 $120,023 $119,269 $826,391
Payback Period–Option 5
$(103,583) $(29,137) $47,290 $114,686 $195,182 $277,764 $358,469 11 Years

Business Case Study 7—Recommendation
Final ReportPage 7-1 kpmg
7. Recommendation7.1 Introduction
KPMG has evaluated the five core subsystems—FLAIR, COPES, SPURS, LAS/PBS, and CMS—of the
Florida Financial Management Information System (FFMIS). KPMG used a bottoms-up approach to
arrive at a recommendation for the State of Florida. Exhibit 7-1 illustrates this multiphased approach.
Exhibit 7-1Multiphased, Bottom-up Approach
KPMG initiated the State of Florida Business Case Study for FFMIS by first defining the objectives,
scope, and approach to achieve the best possible decision-useful recommendation. The second task
assessed the current IT environment as it relates to the five core FFMIS subsystems. This task involved
administering functional and technical quality questionnaires, interviewing State technical and functional
personnel, and studying system documentation.
KPMG and the State Study Advisory Council worked to define the five options that were considered and
evaluated in the Study. A summary of those five options is presented in Exhibit 7-2.
Exhibit 7-2Financial System Options
Option 1 As-Is Maintain the current legacy systems as-is with no major modifications or upgrades
Option 2 Enhanced Enhance current systems by adding new tools and functionality
Option 3 Custom Develop a new custom integrated information management system
Option 4 COTS Implement a commercial off-the-shelf Enterprise Resource Planning package
Option 5 Best of Breed Use some combination of the other four options
Define Objectivesand Approach of
Study
Assess CurrentIT Environment
Perform Business ProcessReengineering Study
Gather Functional andTechnical Requirements
Evaluate Options

7—Recommendation Business Case Study
Final ReportPage 7-2 kpmg
KPMG’s Business Process Reengineering (BPR) Team then conducted an in-depth analysis of 16 key
business processes that were identified by State leadership as appropriate for process reengineering. This
analysis consisted of interviewing State personnel, conducting workshops, and reviewing best practices.
Simultaneously, KPMG’s IT Team performed a high-level requirements gathering and evaluation study.
More than 1,500 functional and technical system requirements were gathered by conducting an in-depth
documentation review, interviews, and requirements workshops.
KPMG evaluated each option in three primary categories: functionality, risk, and financial impact. The
functionality provided by each option was evaluated against the business and technical requirements that
were gathered over the course of the Business Case Study. KPMG identified and analyzed three general
categories of risk: project risk, continuation risk, and strategic risk. Finally, KPMG estimated project and
maintenance costs for each option and quantified the fiscal impact on the State of each option over a 15-
year period.
In this section, KPMG first describes its vision for the State’s technology infrastructure. A side-by-side
comparison of how each option scored in functionality, risk, and financial impact is provided. Finally,
KPMG presents its recommendation, explains the rationale for the recommendation, describes an
implementation strategy, and provides a summary of costs and savings for the recommended option.

Business Case Study 7—Recommendation
Final ReportPage 7-3 kpmg
7.2 Vision
The State is assessing its strategic financial system options during unparalleled hardware, software, and
networking innovation and technological development. Adopting a bold vision for an integrated financial
management system will help place Florida at the forefront of state government financial and technology
leadership and innovation.
A new integrated financial management system (IFMS) for the State of Florida should promote and
support the following:
! User and technical capabilities that promote high-quality custom service and governmentaccountability with consequences
! The flexibility to adapt to technological change and innovation
! The commitment to reassess and change State financial management policies, processes, andpractices
! An enterprise view of State government
! Comprehensive e-commerce applications and capabilities
Exhibit 7-3 presents a potential vision for FFMIS that represents a significant set of enhanced capabilities
compared to the current system.
Exhibit 7-3FFMIS Vision
Existing FFMIS
Departmental Focus
Stovepipe System Architecture
Extensive “Dumb Terminals” and “Green Screens”
Inconsistent Chart of Accounts
Limited Integrated Performance Data
Limited Contract Management and Tracking
No CFO Drives Financial Management
No Single Source Drives FFMIS Policy
Excessive Ad Hoc Reporting
Extensive Manual Reconciliations
Four Data Centers
Limited e-commerce
Rigid Financial Policies Embedded in Statute
Focus on Expensive Preventive Controls
Future FFMIS
Statewide Enterprise Focus
Integrated System Structure
Enhanced Desktop Capabilities
Consistent and Integrated Chart of Accounts
Enhanced Integrated Performance Data
Enhanced Contract Management Support System
CFO Drives Financial Management
CFO and Governor Drive FFMIS
Standard Management and Financial Reporting
Automated Reconciliations
Consolidated Data Center Support Structure
Fully Integrated e-commerce
Flexible Financial Policies Set by Administrative Rule
Focus on Employee Efficiency with Cost-Effective Detective Controls

7—Recommendation Business Case Study
Final ReportPage 7-4 kpmg
The State’s technology vision, at its core, should center on providing the highest level of data integration
and delivery, across functional areas, to serve three constituencies—State leadership, State employees,
and Florida citizens.
The result of such integration is the superior delivery of timely and accurate, decision-useful data. The
integrated approach allows for a more efficient and effective government through the full use of the latest
data delivery mediums, such as the Internet, and promotes participation in State government by Florida’s
citizens.

Business Case Study 7—Recommendation
Final ReportPage 7-5 kpmg
7.3 Evaluation Methodology
KPMG’s study focused on evaluating each option to assess its ability to meet the State’s functional and
technical requirements, its exposure to risk, and its financial impact on the State. KPMG quantified its
assessment of each option in each of these areas to facilitate a direct comparison to form the basis of the
final recommendation.
Functionality/Requirements Analysis
The functionality provided by each option was evaluated against the functional and technical
requirements gathered over the course of the Business Case Study. Our in-depth evaluation of the
requirements is described in Section 6. The total score was weighted 70 percent to the functional
requirements and 30 percent to the technical requirements.
The evaluations were performed by both KPMG and State workgroups and reviewed by the core Business
Case Study team to identify and resolve major inconsistencies and omissions in the rankings provided.
The following external groups assisted in the requirements scoring process:
! Functional and technical State personnel, identified as specialists in each of the five FFMISsubsystems being evaluated, performed the rankings for the As-Is and Enhanced options. Theseevaluation results were refined by KPMG technical and functional specialists who examined thecurrent processes and environment and compared them to the best practices and potentialimprovements available with current technological solutions
! KPMG personnel experienced in custom system design and development also assisted
! The KPMG core team and external resources specializing in each of the three ERP packagesolutions being considered participated in the evaluation of the COTS and Best of Breed options.The packages considered included SAP, Oracle, and PeopleSoft. The rankings allowed us toprovide a composite score for a generic ERP solution for comparison against the other options
Section 6 describes our assessment of the functionality provided by each of the options and provides a
qualitative score for each requirement category. Exhibit 7-4 shows a comparison of each of the five
options.
Functional Requirements
The scoring of the functional requirements attempted to measure the total functionality, as would be
perceived by the users of the system, provided under each of the defined options—As-Is, Enhanced,
Custom, COTS, and Best of Breed.

7—Recommendation Business Case Study
Final ReportPage 7-6 kpmg
Exhibit 7-4Qualitative Analysis Requirements Matrix
Category Wei
gh
tP
erce
nta
ge
As-
Is
En
han
ced
Cu
sto
m
CO
TS
Bes
t o
f B
reed
General Ledger 15.0 3.5 4.0 5.0 4.0 5.0
Human Resource 15.0 2.0 3.0 5.0 4.0 5.0
Budgeting 5.0 2.5 3.0 5.0 3.0 4.0
Cash Management and Investment 5.0 3.0 4.0 5.0 4.0 5.0
Purchasing 10.0 2.0 3.0 5.0 4.0 5.0
Information Processing Requirements 50% 1.3 1.7 2.5 2.0 2.5
Integration 5.0 1.0 3.0 5.0 5.0 5.0
Flexible Reporting 5.0 1.0 3.0 5.0 5.0 5.0
Service Level 5.0 1.0 2.0 5.0 4.0 4.0
Human Resource Utilization 3.0 1.0 3.0 5.0 4.0 4.0
Strategic Direction 2.0 1.0 3.0 5.0 5.0 5.0
Business Operating Requirements 20% 0.2 0.6 1.0 0.9 0.9
Fu
nc
tio
na
l
Total Functional Score 70% 1.5 2.3 3.5 2.9 3.4
Scalability 5.0 2.0 3.0 4.0 5.0 4.0
System Availability 5.0 2.0 3.0 5.0 5.0 5.0
Ease of Use 3.0 2.0 3.0 4.0 4.0 4.0
Security 3.0 3.0 3.0 5.0 5.0 5.0
Backup and Recovery 2.0 1.0 3.0 5.0 5.0 4.0
Architectural Integration 2.0 1.0 3.0 5.0 5.0 4.0
Sustainability 20% 0.4 0.6 0.9 1.0 0.9
Client/Server Environment 2.0 1.0 2.0 5.0 5.0 5.0
Interoperability 2.0 2.0 3.0 5.0 4.0 4.0
Uniform Data Models 2.0 1.0 1.0 4.0 5.0 4.0
Web, Workflow, and Middleware 2.0 1.0 3.0 5.0 4.0 5.0
Open Systems 1.0 1.0 3.0 5.0 4.0 4.0
Development and Test Tools 1.0 2.0 3.0 4.0 4.0 4.0
Industry Direction 10% 0.1 0.2 0.5 0.4 0.4
Te
ch
nic
al
Total Technical Score 30% 0.5 0.8 1.4 1.4 1.3
Total Score 100% 2.0 3.1 4.9 4.3 4.7
Measures 0 through 5: 0 means no functionality, 3 is average, and 5 meets complete functionality

Business Case Study 7—Recommendation
Final ReportPage 7-7 kpmg
Exhibit 7-4 shows the qualitative functional requirements score for each option under consideration.
Because the functional requirements constitute 70 percent of the total requirements score, the highest
possible score (complete functionality) is 3.5.
Overall, the As-Is option scored very poorly—scoring 1.5 of out of 3.5—when compared to the defined
functional requirements. The current FFMIS subsystems do not provide adequate service levels,
integration, and reporting capability. In particular, the existing FFMIS subsystems meet less than 60
percent of the overall defined functional requirements.
The Enhanced option scored higher than the As-Is option. By making enhancements that will use
middleware technology, improve employee and citizen access through web technology, and use improved
reporting tools, this option can improve overall system functionality over the existing FFMIS subsystems.
However, because of the older technology and fragmented design currently in place and the scope of the
proposed enhancements, functionality would not be improved to the level that can be achieved through a
complete system redesign. In general, our analysis shows that the Enhanced option, as defined, would
satisfy approximately 75 percent of the information processing requirements of the State. Integration,
flexible reporting, and service level will all be improved over the existing FFMIS subsystems.
A successfully designed and implemented Custom option should, under ideal circumstances, meet 100
percent of the State’s functional requirements. By definition, the Custom option, if successfully
completed, would deliver the highest level of functionality.
The three ERP solutions examined as part of the COTS option should provide between 80 and 90 percent
of functionality desired by the State, with only limited enhancements. The average of the COTS option
functional score was 2.9 out of 3.5. In general, the appropriation modules are the key weakness in
meeting the specific needs of the State of Florida.
The Best of Breed option derives its core functionality from the COTS option, while leaving in place
systems such as the Vendor Bid System and LAS that generally rated well during requirements scoring
and would not be easily replaced with full functionality in the COTS option. With additional custom
development and bolt-on subsystems, the functionality delivered by a COTS system could be extended
beyond 95 percent. The COTS option uses the assumption of the RFP that the entire State of Florida will
act as one enterprise. In the IT and BPR analyses, KPMG noted significant differences in the way the
State University System (SUS) uses its financial management systems, including important interfaces
with the SUS Student Information System (SIS). The
Study scope did not include an analysis of the SIS, but
we are aware that the ERP packages considered in the
Study have significant differences in their SISs. Also,
our experience indicates that most large states permit
The Custom and Best of Breed options wouldprovide the highest level of user functionalityfor the State of Florida.

7—Recommendation Business Case Study
Final ReportPage 7-8 kpmg
different financial management systems; therefore, the Best of Breed option permits a dual track of the
ERP vendor selection for the SUS and for the rest of State government. This scenario represents the Best
of Breed option, which rated a functional score of 3.4 out of 3.5.
Technical Requirements
A set of technical requirements was defined based on the proposed system’s future sustainability and the
current industry direction for enterprise financial systems.
The technical requirements score represents 30 percent of the total requirements score, and therefore the
technical scores are based on a maximum of 1.5. As shown in Exhibit 7-4, the Custom and COTS options
scored the highest of all the options presented with equal scores of 1.4 out of 1.5 for both. The Best of
Breed option scored 1.3, while the Enhanced and As-Is options scored 0.8 and 0.5, respectively.
In general, the core FFMIS subsystems are based on older technology and do not adequately meet the
State’s technical requirements related to industry direction. Specifically, the existing subsystems do not
have a single uniform data model and lack real-time integration with one another. In addition, the existing
FFMIS subsystems did not score well against the other options under consideration for ease-of-use,
backup and recovery plans, and architectural integration. For these reasons, the As-Is option scored
poorly in our evaluation against the technical requirements.
The Enhanced option would not change the technical score significantly over the As-Is option. Ease-of-
use will improve slightly over the legacy system because of an increased level of flexible reporting and
through web access. However, a primary change that is critical in the technical scoring of this analysis—a
uniform data model—would not be made under this option. The key determinant in the technical
requirements scoring for this option is the fact that the core system continues to use the same legacy
applications.
The Custom option should approach achieving 100 percent of the State’s technical requirements.
However, the shear magnitude, complexity, and duration of the Custom option may negatively affect
scalability and design as it relates to ease-of-use and a uniform data model. For these reasons, the
technical requirements score for the Custom option was 1.4 out of 1.5.
General concerns about users becoming comfortable
with the complexity of ERP screens affected the
technical requirements scoring of both the COTS and
Best of Breed options. Positive aspects of a COTS
solution include a uniform data model, superior
systems security, architectural integration, and
Based on the set of technical requirementsthat have been defined, the Custom, COTS,and Best of Breed options are clearly superioralternatives to maintaining the present FFMISsubsystems or enhancing the existingsubsystems.

Business Case Study 7—Recommendation
Final ReportPage 7-9 kpmg
comprehensive backup and recovery functionality. The technical requirements of the State were met
under the Best of Breed option. Shortcomings of a Best of Breed approach compared to a pure ERP
solution resulted from the continuation of legacy system components, which negatively affected
scalability, backup and recovery execution, architectural integration, and our scoring for uniform data
models.
Total Requirements Scores
The scoring approach determined the degree to which each option satisfies the functional and technical
requirements of the State and is a key determinant in our final recommendation.
As illustrated in Exhibit 7-4, the Custom option would be expected to provide the highest level of
functionality compared to the requirements as defined. The Custom option scored 4.9 out of 5 total points
using our scoring method. The Best of Breed option and COTS option scored 4.7 and 4.3 respectively.
Both the As-Is option and the Enhanced option scored 3.1 or lower, which can be interpreted as meeting
less than 62 percent of the State’s functional and technical requirements.
Based solely on our functional and technical requirements scoring, without considering risk and cost, the
Custom, COTS, and Best of Breed options appear to be the best options for the State.
Risk Evaluation
Overview
Each of the options has been evaluated based on its exposure to strategic risk, project risk, and
continuation risk:
! Strategic risk relates to the risk of not meeting the State’s strategic information technology goalsand applies uniformly to all of the options presented in this analysis
! Project risk relates directly to all options except the As-Is option. We have defined the primaryrisk elements or risk factors associated with large-scale IT projects for each of the options
! Continuation risk applies to all of the options presented and relates to the risks associated with theongoing operations of the State’s financial system either after project completion or if the existingsystem remains as-is
For the qualitative scoring, we assigned a score to each individual risk element contained in the three
major risk categories. The scores were based on the following scale: 0 = no risk, 1 = low risk,

7—Recommendation Business Case Study
Final ReportPage 7-10 kpmg
3 = moderate risk, 5 = high risk. Exhibit 7-5 presents the consolidated results of the qualitative risk
analysis.
KPMG based its strategic risk criteria on the strategic goals and directions set forth by the FFMIS
Coordinating Council, the Financial Management Information Board (FMIB), and legislative intent
through the FFMIS Act as cited in Florida Statutes Chapter 215.90-215.96. Chapter 215.93 of the 1999
Florida Statutes states: “The Florida Financial Management Information System shall be fully
implemented and shall be upgraded as necessary to ensure the efficient operation of an integrated
financial management information system and to provide necessary information for the effective
operation of state government.” Strategic risk factors include management, employee, and citizen access
to data, perceived financial stability as it relates to the State’s financial reporting and accounting
infrastructure, and the State’s strategic goal of eliminating data redundancy and inconsistency. Failure to
mitigate strategic risk adequately can result in lack of legislative, employee, and citizen support of the
State’s financial management information system.
Project risk factors analyzed included those risk factors that, based on industry research and KPMG
experience, have historically been the key determinants in a large-scale IT project’s success or failure.
Project risk factors include project size and effort, requirements stability, experience, and overall design
complexity. Failure to mitigate these risk factors adequately can result in the project being severely over
budget, behind schedule, or implemented with reduced functionality.

Business Case Study 7—Recommendation
Final ReportPage 7-11 kpmg
Exhibit 7-5Qualitative Risk Analysis Matrix
Category Wei
gh
tP
erce
nta
ge
As-
Is
En
han
ced
Cu
sto
m
CO
TS
Bes
t o
f B
reed
Management Access to Consolidated Financial Information 16.7 5.0 3.0 1.0 1.0 1.0
Citizen Access to Financial Information 16.7 5.0 2.0 1.0 1.0 1.0
Employee Access/Self-Service to Administrative Information 16.7 5.0 3.0 1.0 1.0 1.0
Perceived Financial Stability/Bond Rating 16.7 4.0 3.0 1.0 1.0 1.0
Reduction of Manual Processes and Redundant Data Entry 16.7 5.0 3.0 2.0 1.0 2.0
Reduction of Agency Feeder/Shadow Systems 16.7 5.0 3.0 2.0 2.0 2.0
People/Process/Technology 100% – – – – –
Str
ate
gic
Ris
k
Total Strategic Risk/Weighted Average 100% 4.8 2.8 1.3 1.2 1.3
Project Leadership 6.7 0.0 2.0 5.0 4.0 4.0
Culture of Organization 6.7 0.0 2.0 4.0 4.0 4.0
Personnel Skill Set Availability 6.7 0.0 2.0 4.0 4.0 4.0
Project Ownership 6.7 0.0 2.0 4.0 4.0 5.0
Project Sponsorship/Funding 6.7 0.0 2.0 5.0 4.0 4.0
Project Effort 6.7 0.0 2.0 5.0 4.0 3.0
People 40% – – – – –
System Design Complexity 5.0 0.0 2.0 5.0 4.0 3.0
System Development Methodology 5.0 0.0 2.0 5.0 3.0 3.0
Implementation Strategy 5.0 0.0 3.0 5.0 3.0 3.0
Change Management 5.0 0.0 2.0 5.0 5.0 5.0
Process Quality Management 5.0 0.0 2.0 5.0 1.0 2.0
Requirements Stability 5.0 0.0 2.0 5.0 3.0 3.0
Project Length 5.0 0.0 2.0 5.0 3.0 3.0
Training and Support 5.0 0.0 2.0 5.0 3.0 3.0
Process 40% – – – – –
In-Project Technical Obsolescence 6.7 0.0 3.0 5.0 1.0 2.0
Data Conversion and Cleansing 6.7 0.0 0.0 4.0 3.0 3.0
Adoption of Industry Standards 6.7 0.0 4.0 2.0 1.0 2.0
Technology 20% – – – – –
Pro
jec
t R
isk
Total Project Risk/Weighted Average 100% 0.0 2.1 4.5 3.2 3.3

7—Recommendation Business Case Study
Final ReportPage 7-12 kpmg
Category Wei
gh
tP
erce
nta
ge
As-
Is
En
han
ced
Cu
sto
m
CO
TS
Bes
t o
f B
reed
System Leadership 10.0 4.0 4.0 3.0 2.0 3.0
System Ownership 10.0 4.0 4.0 3.0 3.0 3.0
Personnel Skill Set Availability 10.0 5.0 4.0 3.0 3.0 3.0
System Sponsorship/Funding 10.0 2.0 2.0 3.0 4.0 4.0
People 40% – – – – –
Stability of Vendor 6.7 3.0 3.0 3.0 3.0 3.0
Enhanced Capability and Support 6.7 4.0 4.0 3.0 2.0 3.0
System Flexibility 6.7 5.0 5.0 2.0 3.0 3.0
Change Management 6.7 4.0 4.0 3.0 1.0 2.0
Contingency Planning 6.7 4.0 4.0 3.0 2.0 2.0
Post-Implementation Defect Rate 6.7 3.0 3.0 5.0 2.0 2.0
Process 40% – – – – –
Post-Implementation Technical Obsolescence 5.0 5.0 4.0 3.0 1.0 3.0
Disaster Recovery 5.0 3.0 3.0 3.0 1.0 2.0
Adoption of Industry Standards 5.0 5.0 4.0 3.0 1.0 2.0
Scalability 5.0 2.0 2.0 3.0 2.0 2.0
Technology 20% – – – – –
Co
nti
nu
ati
on
Ris
k
Total Continuation Risk/Weighted Average 100% 3.8 3.6 3.1 2.3 2.8
Total All Risk Categories/Weighted Average – 2.9 2.8 3.0 2.2 2.5
Measures: 0–N/A or No Risk; 1–Minimal Risk; 3–Average Risk; 5–High Risk
Examples of large, high-risk State of Florida projects include the custom-built FLORIDA system
undertaken by the Department of Health and Rehabilitative Services (HRS) now known as the
Department of Children and Families (DCF). The FLORIDA project was beset with budget problems
(costing between two and three times its original estimate), scheduling problems (delayed for 3 to 5 years
to achieve full operational capabilities), and functionality problems (requiring a 6-month learning period
for low-level field staff who turn over approximately every 12 months). The system failures resulted in
lawsuits and countersuits. Another example of a State of Florida high-risk project is the Statewide
Automated Child Welfare Information System (SACWIS). This custom system has been in the planning
stages for more than 5 years, and the State recently decided to change directions and move to internal
staff and away from outsourcing the project. The project has had scheduling problems, and the final
budget impact and functionality impact are as yet unknown.

Business Case Study 7—Recommendation
Final ReportPage 7-13 kpmg
Continuation risk factors address risks associated with a fully installed system. These risks, which include
enhanced capability, scalability, and technical
obsolescence, would be incurred under each of the
five options. The acknowledgement and assessment
of continuation risk factors are crucial in determining
how well the IT system is positioned to serve an
organization in future years. Failure to mitigate these
factors adequately could result in an information
system whose long-term effectiveness is significantly
impaired.
Strategic Risk
Exhibit 7-5 shows the qualitative risk scoring for each option under consideration. Again, in the
qualitative risk analysis, a score of 1 represents low risk, while a score of 5 represents high exposure to
risk.
As shown in Exhibit 7-5, the Custom, COTS, and Best of Breed options, clearly present the least strategic
risk to the State. The COTS option scored the lowest (least exposure to risk) at an average of 1.2, while
the Custom and Best of Breed options both scored 1.3. The As-Is option in the qualitative scoring
represents the highest exposure to this category of risk, scoring a 4.8 out of 5, while the Enhanced option
scored 2.8.
The exposure to strategic risk under the Custom, COTS, and Best of Breed options is minimal because
these options are in line with the strategic goals set forth by the FFMIS Coordinating Council.
Specifically, the goals of providing timely and accurate data to leadership, management and employees,
and citizens are accommodated best under these options. The risk under the As-Is option of not fulfilling
the strategic goals set forth by the FFMIS Coordinating Council ranks highest among all of the options
presented. Although the Enhanced option would improve the usability and integration of the existing
FFMIS subsystems—goals that are in line with the
State’s vision for information management—these
changes would still only fulfill 75 percent of the
State’s requirements as they are defined in the
accompanying requirements definitions. Therefore,
the strategic risk to the State under the Enhanced
option is moderate.
The three distinct categories of risk areequally important in determining the successor failure of the IT system. We have given therisk categories equal weight in the finalqualitative analysis. Within each of these riskcategories, the individual risk elements arecategorized under people, process, andtechnology.
Based on the qualitative risk analysisperformed during the study, the Custom,COTS, and Best of Breed options, ifsuccessfully implemented, ensure the leastexposure to strategic risk for the State ofFlorida.

7—Recommendation Business Case Study
Final ReportPage 7-14 kpmg
Project Risk
Project risk is defined as the possibility that the IT development/implementation is not successful. KPMG
defined success as delivered on time with desired functionality and within the budget. Market research
demonstrates clearly that larger projects with larger timelines have a much greater probability of failure.
Exhibit 7-5 demonstrates that the Custom option, scoring an average of 4.5 out of 5, exposes the State to
an unacceptable level of project risk. Project risk under the COTS and Best of Breed options are
significant as well, scoring 3.2 and 3.3, respectively. The Enhanced option scored 2.1. A score of 0 (no
risk) was given to the As-Is option because there is no associated project risk under this option.
Specific project risks identified in a Custom option for the State include project length, size, and effort;
design complexity; requirements stability; and the culture of the organization. Funding source, as it relates
to the budgeting process, was also identified as a significant risk factor. Any one of these risks under the
Custom option, if not properly mitigated, could result in significant project delays. Project delays and
extended timelines in a project of this magnitude could add tens of millions of dollars to the cost of the
completed project and possibly result in cancellation if milestones and deliverables are not met.
The COTS and Best of Breed options have significant project risk, as well. However, a significant
difference from the Custom option is the reduced time for implementation. It is expected that a Custom
option would require a minimum of 6 years to implement, while the COTS and Best of Breed options
would require 4 years for complete implementation. Because a strong correlation exists between project
length and project failure, we scored the risk in the COTS and Best of Breed options lower in this
category. Side effects of reduced project length include reduced risk of in-project technical obsolescence
and reduced possibility of requirements changes. Other factors giving the COTS and Best of Breed
options lower risk scores include better process quality management and implementation strategy due to
vendor experience with past implementations. A reduced risk associated with system development
methodology was also noted, because the core modules of the ERP solutions are prebuilt. Another
consideration was that the top-tier ERP vendor products have generally undergone a continual process of
revision spanning many years, resulting in a more efficient and effective product. The three vendors
analyzed in this study are reported to have spent more than $500 million annually updating and enhancing
their products.
It is generally agreed that customization of a COTS solution dramatically increases costs and risk of
project failures. For this reason, we defined the
COTS solution as having limited customization.
The Enhanced option has moderate exposure to
project risk. By limiting the project to only three
Based on our qualitative analysis of projectrisk, the Custom option exposes the State toan unacceptable level of project risk. TheCOTS and Best of Breed solutions also incursignificant exposure to project risk.

Business Case Study 7—Recommendation
Final ReportPage 7-15 kpmg
discrete, primarily independent enhancements under the Enhanced option, project risk is significantly
lowered. Because there is no project under the As-Is option, there is no associated project risk.
Continuation Risk
Continuation risk applies to all the options and relates to the risks associated with the ongoing operations
of the State’s financial system, either after project completion or if the existing system is used As-Is
(whichever is applicable).
In our qualitative analysis, the COTS option scored the lowest (least exposure) to continuation risk with a
score of 2.3. The Best of Breed and Custom options scored 2.8 and 3.1, respectively. The Enhanced and
As-Is options had the highest exposure to continuation risk scoring 3.6 and 3.8 out of 5, respectively.
The As-Is option scored poorly because of the increased risk of technological obsolescence and lack of
system flexibility. Enhancing the existing system under the Enhanced option will not reduce this risk
significantly. Another factor affecting both of these options is the likelihood that it will be increasingly
difficult in future years to maintain a staff with the knowledge and skill set to operate and maintain these
older systems and technologies.
A major risk affecting the Custom option is the risk of
post-implementation defects. The Custom solution
presents a greater risk to technical obsolescence than
either the COTS or Best of Breed solutions because of
an ERP vendor’s schedule of revisions and upgrades.
The likelihood of such continual upgrades under a Custom option is less.
Total Average Risk Scores
The three distinct categories of risk that have been defined and compared under each option are all
equally important in determining the success or failure of the IT system under consideration.
When weighing each of the three risk categories
equally, an average risk score of 2.2 was given to the
COTS option. Scores of 2.5 and 2.8 were given to the
Best of Breed option and Enhanced option,
respectively. The As-Is option ranked fourth with a
score of 2.9, and the Custom option ranked last with
the highest average risk score at 3.0.
The COTS and Best of Breed options providethe least exposure to continuation risk.
After considering strategic, project, andcontinuation risks for each of the options, theCOTS, Best of Breed, and Enhanced optionsrepresent the most viable options, withoutconsideration of functionality and financialimpact, to the State.

7—Recommendation Business Case Study
Final ReportPage 7-16 kpmg
Financial Impact
The financial impact of each option has been measured against four major components: the operational
savings, net present value of the savings, internal rate of return, and payback period in years. As described
in detail in Section 6, implementation costs have been risk adjusted to provide the most reasonably
conservative cost estimate. Operational costs are the ongoing costs of operating the infrastructure to
support the various options. BPR savings are the
savings from reengineered business processes. These
two elements are combined to produce the net
savings for each option. The discounted present value
of the net savings is shown as the net present value.
Exhibit 7-6 shows a comparison of the financial figures for all the options.
Exhibit 7-6Summary of Financial Assessment(dollar amounts are in thousands)
Option Imp
lem
enta
tio
nC
os
ts
Op
erat
ion
s C
ost
s
Tec
hn
olo
gy-
Rel
ated
BP
RS
avin
gs
Net
Fis
cal
Imp
act
(Tec
hn
olo
gy
Sav
ing
s O
nly
)
NP
V
No
nte
chn
olo
gy-
Rel
ated
BP
RS
avin
gs
Net
Fis
cal
Imp
act
All
Rec
om
men
dat
ion
s
IRR
Yea
rs t
o P
ayb
ack
As-Is – $(396,328) – $(396,328) $(250,806) $467,922 $71,594 N/A –
Enhanced $(119,222) (402,065) $478,471 (42,816) (96,638) 467,922 425,106 (2%) –
Custom (563,745) (216,392) 798,797 18,660 (166,387) 467,922 486,582 (1%) 15
COTS (257,960) (277,548) 956,113 420,605 133,770 467,922 888,527 12% 10
Best of Breed (281,327) (316,317) 956,113 358,469 92,965 467,922 826,391 10% 11
The As-Is option has no implementation costs because this option perpetuates the existing FFMIS
subsystems. Operational costs are higher in comparison with the Custom option, COTS option, and the
Best of Breed option because multiple systems are being used to run the FFMIS applications. BPR
savings are available immediately upon implementation but are lower than other options because the
majority of the savings, require IT system changes.
The COTS and Best of Breed option providethe most favorable fiscal impact.

Business Case Study 7—Recommendation
Final ReportPage 7-17 kpmg
The Enhanced option operations costs are higher because the existing systems would be left in place and
additional equipment would be added to enhance these systems. Additional BPR savings over the As-Is
option would be achieved through the IT changes.
The Custom option has the most expensive implementation costs and years to payback because of the
costs and time to develop all the required applications and the time delay until the BPR savings are
achieved. This option has the lowest operations costs because the assumption was made that all the
applications would be optimized to run on a common system.
The COTS and Best of Breed options show the best net present value and internal rate of return. They
both achieve payback in year 7; however, the COTS option has the highest net present value and internal
rate of return because of lower implementation and operations costs. The Best of Breed option costs are
higher because of the need to maintain several existing FFMIS subsystems to provide functionality and to
support current web initiatives.

7—Recommendation Business Case Study
Final ReportPage 7-18 kpmg
7.4 KPMG Recommendation
In earlier sections, KPMG compared the options to the State’s vision and evaluated risk and financial
impacts. From our analysis, as represented in Exhibit 7-7, COTS and Best of Breed options are the only
two viable choices for the State’s financial management information system.
Exhibit 7-7Minimum Requirements Analysis Ratings
(dollar amounts are in thousands)
Functionality Financial
Raw Score Weighted Score Raw Savings (Cost) Weighted Score Total
Option A B A + B
As-Is 2.00 40 $(396,328) – 40
Enhanced 3.10 62 (42,816) 22 84
Custom 4.90 98 18,660 25 123
COTS 4.30 86 420,605 50 136
Best of Breed 4.70 94 358,469 46 140
The COTS option, as defined during evaluation, is a “vanilla” solution without major modification to the
ERP software. As documented in our analysis, ERP packages are generally weak (at the time of
evaluation) in certain key areas such as supporting the legislative approval of budget issues, web-enabled
vendor bid management system, travel profiles, reservations for the employees, and cash and accrual
based accounting. Because these functions are essential for the State, KPMG defined the Best of Breed
option as an ERP-centric option delivering the additional essential functionality either by custom
development or by integrating with other software solutions. This option is designed to take the best
functionality from both existing State-developed software and COTS. The added functionality the State
gains by the Best of Breed option comes with some additional risk as presented in Exhibit 7-7; however,
the additional functionality outweighs the added risk and additional cost.
KPMG recommends that the State implement a new financial management information system using an
ERP package enhanced for the State’s needs and interfaced with a few bolt-on systems. This
recommended Best of Breed option takes the best functionality from both existing State-developed
software and COTS. The recommended solution will interface with the following:

Business Case Study 7—Recommendation
Final ReportPage 7-19 kpmg
! Budgeting functionality contained in LAS/PBS that relates to tracking of issues and variousnarrative information that are necessary to publish the formal budget
! Bid management tracking, reporting, and manipulation that exists in an existing custom systemalready in use
! The State-developed e-Mall because the State would be implementing this function before thepossible ERP implementation
Also, the Best of Breed option would have the following enhancements for the ERP package:
! The COTS option will need to expand the accrual basis of accounting found in the ERP packagesto include cash and modified accrual basis of accounting
! Vendor complaint management does not exist in COTS ERP solutions
In addition, the Student Administration is sufficiently self-contained and a student administration system
could be acquired from an ERP vendor that differs from the ERP vendor for the financial applications.
Recognizing the important differences between general government and Florida’s higher education
system, our recommendation enables a dual track software selection and implementation strategy to
accommodate, but not require, separate software packages for the State University System and the
remainder of State government.
The Best of Breed option is the best practical option to meet the functionality required by the State. With
this option, the State would be able to blend the best practices of the industry with that of the State
wherever the off-the-shelf solution does not meet a requirement. Although KPMG recommends
enhancements to the selected ERP package in some specific areas, we suggest that the State exercise due
diligence for all the enhancements by considering the effect of the modifications during the upgrade
process.
The Best of Breed option is an ERP implementation for most part. As discussed in Section 6, an above-
average risk is associated with large-scale implementation projects. To reduce the risk significantly,
KPMG recommends that a dedicated project management office be established—one that is capable of
maintaining vision, quality, and time. KPMG also recommends that the Executive Office of the Governor
take ownership of the project.
Exhibit 7-8 illustrates a timeline for the implementation of the integrated solution. We overlaid a line on
the chart to graphically represent the estimated early savings (both technology based and nontechnology
based) from the State’s implementation of recommendations before the full system implementation.

7—Recommendation Business Case Study
Final ReportPage 7-20 kpmg
Exhibit 7-8Timeline for Solution Implementation
RFP Bid Requirements Definition
RFP Requirements Definition Vendor Selection
Requirements Definition
Integration RFP Preparation
Integration Vendor Selection
Integration Solution (Design, Build & Test)
Implementation
Implementation of BPR Recommendations
1/1/00 1/1/01 1/1/02 1/1/03 1/1/04 1/1/05
7/1/00 7/1/01 7/1/02 7/1/03 7/1/04 7/1/05
FY01 FY02 FY03 FY04 FY05
Savings
—$45M
—$30M
—$15M
—0
It is important to have a detailed requirements definition for the State’s FFMIS before selecting the ERP
vendor. The requirements definition should focus on the detailed processes of all the State agencies and
universities related to the accounting and human resource functions. After selecting the ERP package, the
State should refine the requirements at the data element level. The State will be able to use the
requirements definition phase to require the ERP vendors and integrators to demonstrate the critical
processes. The requirements definition phase will help the State to understand the capabilities of the ERP
packages and will help ERP integrators to speed implementation. The requirements definition phase will
consist of three distinct tasks:
! State-prepared RFP for requirements definition
! State selection of vendor for the requirements definition
! Vendor-led requirements definition
This process will take 13 months. The compiled list of requirements will be the input to the request for
proposal for implementing the new FFMIS.
Implementation will have the following overlapping subtasks:
! Develop the implementation RFP (3 months)
! Select the ERP vendor and the integrator (6 months)
! Design, build, and test the new solution (3 years)
! Implement the solution ( 2½ years)

Business Case Study 7—Recommendation
Final ReportPage 7-21 kpmg
The implementation process will take approximately 4 years.
For simplicity, we assumed that accounting and human resource modules of the chosen ERP vendor will
be built once and will be implemented in phases. With this approach, the first rollout of the solution will
be 3½ years after the start of the process including the requirements definition. The requirements are
defined already, and with proper planning, control, and approval, the State could roll out the solution
agency-by-agency starting 6 to 9 months before the time shown in our timeline. This process could result
in the first rollout in less than 3 years from the beginning of the process.

7—Recommendation Business Case Study
Final ReportPage 7-22 kpmg
This page intentionally left blank.

Business Case Study Appendix A—Innovative Practices
Final ReportPage A-1
kpmg
Appendix A—Innovative PracticesThis Appendix includes the results of research conducted through the Internet, publications review, and
interviews with other State governments to identify innovative practices used today for the selected
processes. The information in this section summarizes key process improvement strategies that companies
and government agencies have successfully applied. These innovative practices are organized by process.
Management Reporting
Data Warehouse: Accounting and human resource information is stored in relational databases that are
accessible to a broad cross-section of state employees. Applying user-friendly query tools, employees at
all levels of an organization are able to access the warehouse at any time to develop tailored management
reports without system technician intervention. (Sources: Oregon and Washington State)
Financial Reporting
Develop a system with a single set of cash ledgers for each fund: States implement a financial
management system with a single set of cash ledgers for each agency fund. Delays are thus eliminated in
reconciling items between two sets of accounting records. (Sources: Texas, Maryland, Michigan, District
of Columbia)
Statewide intranet: A secure, reliable statewide network provides capability to share, review, and edit
financial information and data files online. (Sources: Washington (State), West Virginia, others)
Comprehensive Annual Fiscal Report (CAFR) development software: Governments acquire or
develop software that helps collect, organize, and present financial statements compliant with
Governmental Accounting Standards Board (GASB) CAFR standards. (Sources: Maryland, other states)
Accounting Reconciliation
Automated statewide financial management system with single set of ledgers for each fund: States
implement a financial management system with a set of ledgers for each agency fund. (Sources: Texas,
Maryland, Michigan, District of Columbia)
Statewide intranet: A secure, reliable statewide network provides agencies with the capability to share,
review, and edit financial information and data files online. (Sources: Washington State, West Virginia,
others)

Business Case Study Appendix A— Innovative Practices
Final ReportPage A-2
kpmg
Online banking/automated reconciliation: Businesses maintain their bank account registers online
where banks can conduct automated account reconciliations daily. (Sources: Most large commercial
banks)
Accounting for Payments from Multiple Accounts
EASY invoice approval system: This electronic invoice approval system facilitates decentralized
approval and payment of invoices. An invoice is received, accounting information is posted, and the
transaction is submitted for payment. The central staff conducts an online review of the transaction.
(Source: U.S. Environmental Protection Agency)
PAID vendor remittance system: An extranet application provides vendors with access to a remittance
database, which can be queried by date, invoice number, payment amount, agency, and other data
available, eliminating the need for mailing remittance advices to vendors. Payment is made by EFT, then
vendors query the system for supporting information. Access is controlled by passwords and user IDs.
(Source: NASA)
Invoice inquiry system: The invoice inquiry system provides vendors and travelers information
regarding the status of invoice payments. An Integrated Voice Response system, entered by using an 800
telephone number, offers access to this information from anywhere in the world. Payments are made
through EFT, and vendors are able to receive remittance information through this system. Access is
controlled with a personal identification number. (Source: Center for Disease Control and Prevention)
Flow of Federal Funds
Remittance-based payment requests: States construct templates to store fund-specific information in
ASAP payment request. Federal fund payments are returned with template data (fund, agency, revenue
code, and CFDA code), providing the State Treasurer with information needed to identify the correct
recipient agency. (Source: Oklahoma)
By October 1, 2002, all federal civilian agencies will be required to use either ASAP or PMS to process
federal fund payment requests electronically from state government agencies.
U.S. electronic grants project: Now in beta testing, this system will permit grants customers to
exchange data and files (for example, applications and funding requests) with federal agency databases
through data screens running via an Internet web browser.
Travel Reimbursement
Exhibit A-1 shows the cost comparison analysis performed by GELCO and Amadeus.

Business Case Study Appendix A—Innovative Practices
Final ReportPage A-3
kpmg
Exhibit A-1Cost Comparison
$38.05
$113.85 $110.58
$47.43
GELCO
Man
ual
Autom
ated
AMADEUS
Man
ual
Autom
ated
Department of Defense—Army Tradoc: GELCO Travel Management Software was implemented and
efficiency increased. Thirty-seven processing steps were reduced to nine; process time of 5.4 hours was
reduced by 77 percent; an 11-day cycle time was reduced to 3 days, and processing costs were reduced by
76 percent. (Source: GELCO’s Government Agency Reengineering Report, 1998)
Online submission and reimbursement of travel expenses: The travel reimbursement form is
completed and submitted by the traveler online, using the Management Administrative Reporting System
(MARS). This initiative is a critical component of a comprehensive reengineering effort initiated 2 years
ago. (Source: Reengineering of Statewide Financial, Budget, and Procurement Systems; Kentucky, 1999)
Online travel authorization, encumbrance, submission of travel expenses, and use of preferred
travel agencies: Travel authorization, encumbrance, and reimbursement are completed online via the
Travel Request and Reimbursement Information Processing System (TRRIPS). A “Ghost Card”—issued
through Diner’s Club—is used for booking airline fares, eliminating the need for the traveler to charge
airline tickets on his or her personal credit card. The Ghost Card is an account the university has with the
travel agency, which allows airline tickets to be billed directly to the agency. (Source: University of
Florida)
Web-based expense reporting system: Use of a web-based expense reporting system allows a traveler to
take advantage of remote access capability. When travel is completed, expense data is downloaded from
the bank’s clearing house credit card issuers. Expenses are then coded and charged to the correct budget
entity. In addition, the web-based system has the ability to audit expenses online to ensure compliance
with the company’s policy. (Source: Merrill Lynch)

Business Case Study Appendix A— Innovative Practices
Final ReportPage A-4
kpmg
Purchasing Commodities and Services
Interior Department Electronic Acquisition System: This system automates the complete procurement
process from requisition to closeout. It operates in a Windows-based environment with an interface to the
financial system. (Source: U.S. Department of the Interior)
One-stop shopping: An Internet-driven procurement program links Los Angeles County to 25,000
suppliers. It provides online approvals and routing from the employee’s desktop and instant access to
centralized databases with contract vendors. (Source: Los Angeles County, California)
MS market: This intranet-based corporate purchasing application allows employees to place orders for
goods and services in less than 3 minutes and receive them the next day. The application is linked directly
to the SAP R/3 accounting system. Administrative costs are decreased from $60 to $5 per order, and the
central purchasing unit staff is reduced by 90 percent. (Source: Microsoft Corporation)
U.S. Department of Agriculture PCard Management System: The system provides delegation of
approval to individuals making purchase. It allows users to approve or dispute transactions, assign
accounting codes, and establish property records via computer. The reconciliation of PCard transactions is
automated. (Source: U.S. Department of Agriculture)
U.S. Army micro purchase reengineering using PCard: PCard will replace 90 percent of commercial
purchases for supplies and services that are valued under $2,500. The Army is using internal controls
inherent in the PCard program to streamline and reengineer business practices surrounding the use of the
card. The U.S. Army Audit Agency estimates savings of over $100 per transaction. (Sources: Federal
Government, U.S. Army)
Rate and Position Administration
Personnel budget is administered by a process called “personnel years,” whereby the Legislature
appropriates 95 percent of a position’s salary to an agency that requests a new position and saves 5
percent. The state uses this mechanism to save salary dollars and phase in positions. Furthermore,
positions are controlled at the agency level and agency heads are held accountable for their divisions.
(Source: California)
Salaries are paid from the personnel services line item in its budget. Funding is generated at the agency
level, by leaving positions vacant for a period of time, filling positions at a lower salary than that of the
incumbent, or filling positions and reallocating the salaries among other employees. Agencies have
limited authority to transfer money between personnel services and other operating accounts. (Source:
South Carolina)

Business Case Study Appendix A—Innovative Practices
Final ReportPage A-5
kpmg
Salary reserve is separate from the appropriation amount similar to salary rate. The budget office will
only approve a hire if salary reserve is available. (Source: North Carolina)
Certified Forward
Prior year obligations of the state carry forward into the next fiscal year automatically: Departments
determine the validity of encumbrances and payables as the audit department reviews specific items by
law. OPB and individual departments monitor outstanding obligations with more scrutiny as the items
remain outstanding further into the fiscal year. (Source: Georgia)
Prior year outstanding obligations are accommodated through the budget process: Estimates are
made on how much needs to be carried forward, and an amount is included in next year’s budget request
under the title of reappropriation amount. Along with next year’s budget, a reappropriation amount is
allotted to cover encumbrances that carry over to the next fiscal year. (Source: Hillsborough County)
Cash Receipts and Cash Management
Automated telephone credit card tax payment system: This automated system enables taxpayers to
pay their current secured property tax bills with a credit card and a touch-tone telephone. The system uses
an interactive voice system that is available 24 hours a day, 7 days a week. (Source: Riverside County,
California)
Online interactive DMV: The site includes an “express lane,” which gives citizens the ability to renew
registrations, apply for duplicate registrations, and pay civil motor vehicle citations using a credit card
and a secure web browser. (Source: Massachusetts)
California State Accounting and Reporting System (CALSTARS): This comprehensive, automated
departmental accounting and reporting system accurately and systematically accounts for all revenue,
receipts, expenditures, disbursements, and property of the state. (Source: California)
Online resources for students (STAR Online): This system allows for electronic money transfer after a
bank routing code and account number are provided. Students may elect to pay tuition using this system.
(Source: University of Washington)
Accounts Receivable
SunPass toll card and acceptance of credit cards and certified funds for payment: The Florida
Department of Transportation, in an effort to eliminate accounts receivable, has initiated statewide
acceptance of a prepaid toll card, which will phase out the use of toll charge accounts during the next
year. The Department has also mandated that any payment received for goods or services must be paid by

Business Case Study Appendix A— Innovative Practices
Final ReportPage A-6
kpmg
credit card or by certified funds. It is the Department’s intent to completely eliminate accounts receivable
within 2 years. Other efforts include an Internet shopping cart for credit card purchases. (Source: Florida)
Set Off Program: An automated collection system of delinquent accounts receivable uses computer
efficiency to match master files of delinquent accounts with state payments in process. Payments are set
off against debt, in effect saying to the debtor: “You owe agency X money and, unless you can prove that
your debt is invalid, we will collect by setting it off against the money the State owes you.” (Source:
Kansas)
Clean Hands Act: District law (D.C. Law 11-118, D.C. Code 47-2861 et seq.) requires applicants to
certify that they do not owe more than $100 to the District of Columbia government. (Source: District of
Columbia)
Mandatory Electronic Funds Transfer (EFT) capabilities and electronic (paperless) accounts
receivable billing: The University of Florida is investigating the success of the University of
Washington’s STAR Online, which allows for electronic money transfer after a bank routing code and
account number are provided. Students may elect to pay tuition using this system. The University of
Florida also hopes soon to use electronic billing of accounts receivable. (Source: University of
Washington)
Asset Management
$5,000 threshold for tracking assets: The Government Finance Officers Association (GFOA) has issued
an opinion that government organizations should consider establishing a $5,000 capitalization threshold
for tracking assets. The $5,000 threshold captures the vast majority of assets that should be included for
financial reporting purposes. The recommendation is based on the fact that capitalization is a financial
reporting issue and should therefore be set at the most cost-effective threshold that meets financial
reporting requirements. (Source: Kentucky)
Conduct inventory on a random test basis: GFOA recommends that government organizations conduct
a physical inventory count on capitalized assets on a rotating basis. The need for an annual inventory can
be reduced if the government uses a perpetual inventory system, similar to what the state has in place.
Each item must be counted at least once within a 5-year period.

Business Case Study Appendix B—Risk Multiplier
Final ReportPage B-1
kpmg
Appendix B—Risk MultiplierA risk-adjusted contingency rate was used in our analysis to account for the perceived risk of additional
project expense associated with each option. This rate was used in place of a standard 10 percent
contingency rate often used when estimating projects. The risk-adjusted rate was derived from the
“Project Risk” portion of KPMG’s risk scoring table used in Section 6 of this Study.
Ten significant risk factors were selected from internal KPMG documentation and industry research. Each
of the 10 risk factors falls under the category of People, Process, and Technology. These risk elements
are:
People
! Project Leadership/Project Ownership—Experienced project management is lacking and thereis no single project owner
! Organizational Culture and Experience—Organization does not have a strong IT culture anddepth of similar-sized project experience
! Personnel Skill Set Availability and Turnover—Staff has inadequate skill-set for IT projectand turnover is high
! Project Sponsorship and Funding—Project does not have strong executive managementsupport and proper funding
Process
! Requirements Stability—Requirements for application are not stable
! Project Size, Effort, and Length—Project scope is significant and duration is expected to begreater than 3 years
! Process Quality Management—Risk of introducing poor design and/or code into the applicationis high
! System Development Methodology and Implementation Strategy—Risk of poor orinconsistently applied development methodology and/or implementation strategy is high
Technology
! System Design Complexity—Risk that the new project encounters delays and/or fails because ofapplication design complexity is high
! In-Project Technical Obsolescence—Risk that major industry-wide technology changes occurduring project life cycle is high

Appendix B—Risk Multiplier Business Case Study
Final ReportPage B-2
kpmg
Based on KPMG’s experience and industry research, we believe that the risk elements previously
described adequately address the primary risks associated with large-scale IT development projects.
We have applied weightings, which are based on industry data from IT project failures, to the following
categories:
! People: 40 percent
! Process: 40 percent
! Technology: 20 percent
Although the improper assessment of risk in one particular area—such as requirements instability—can
result in the failure of a project, multiple reasons are often cited for the failure of a particular IT project.
We have attempted to capture this behavior in our assessment of risk and how that risk applies to project
cost.
A sample risk matrix is shown in Exhibit B-1.
Exhibit B-1Sample Risk Matrix
None Minimal Average HighRisk Factors 0.000 0.002 0.007 0.020 0.060 0.180PeopleProject Leadership and Project Ownership 1Organizational Culture and Experience 1Personnel Skill Set Availability and Turnover 1Project Sponsorship/Funding 1ProcessRequirements Stability 1Project Size, Effort, and Length 1Process Quality Management 1System Development Methodology and Implementation Strategy 1TechnologySystem Design Complexity 1In-Project Technical Obsolescence 1
Total by Column 0.000 0.000 0.000 0.200 0.000 0.000Total (All Columns) 0.200Option Cost Multiplier (1 + Total) 1.200
Risks to Successful Project Execution
For each option, we have determined its level of exposure to each risk element. We have assigned a rank
for each risk element from a range of “no risk” to “high risk.”
The factors we apply to each risk element based on perceived level of risk (0.000-0.180) were derived as
follows:

Business Case Study Appendix B—Risk Multiplier
Final ReportPage B-3
kpmg
! We have assigned a base multiplier of 1.00 to projects with no risk
! We have assigned a base multiplier of 1.20 for a project with average risk. This means that alarge-scale IT project that is determined to have an “average” exposure to each of the 10 riskelements is expected to be completed within 20 percent over the initial cost estimate. Thispercentage is based on market research and KPMG experience
! We have assigned a base multiplier of 2.80 for projects deemed “high risk.” This means that anIT project that has been deemed to have a high risk exposure to each of the 10 risk elements inour matrix will be delivered at 180 percent over original cost estimates. This maximum wasderived by studying project success/failure rates and characteristics of successful/failed projects,and is supported by industry data
! In the context of large-scale IT projects, the probability of project failure increases at anincreasing rate, as exposure to risk increases
A graphical representation of our risk assumptions is shown in Exhibit B-2.
Exhibit B-2Risk Curve
0%20%40%60%80%
100%120%140%160%180%200%
None Minimal Average High
Risk Assessed
Co
nti
ng
ency
F
acto
r
Source data for the risk multiplier derived for this analysis was gathered from a number of sources. One
significant source of data was compiled by the Standish Group, Inc.
A 1998 Standish Group survey of IT projects indicated that 28 percent of all IT projects fail, 46 percent
are either over budget or overdue, and only 26 percent succeed. For large-scale IT projects, the failure rate
is even greater. The report shows that for projects OF more than $10 million, the failure rate is 49 percent.
Exhibit B-3 shows the percentage over original cost estimates of all projects surveyed. These findings
were based on a survey of 7,552 software development projects.

Appendix B—Risk Multiplier Business Case Study
Final ReportPage B-4
kpmg
Exhibit B-3IT Project Cost Overruns
Source: The Standish Group International, Inc., 1998
0%
10%
20%
30%
40%
Under 20% 21-50% 51-100% 101-200% Over 200%
Percent Over Budget
Res
po
nd
ents
The following risk multiplier matrices were constructed for each of the options that had a project
component.

Business Case Study Appendix B—Risk Multiplier
Final ReportPage B-5
kpmg
Option 2: Enhanced
None Minimal Average HighRisk Factors 0.000 0.002 0.007 0.020 0.060 0.180PeopleProject Leadership and Project Ownership 1Organizational Culture and Experience 1Personnel Skill Set Availability and Turnover 1Project Sponsorship/Funding 1ProcessRequirem ents Stability 1Project Size, Effort, and Length 1Process Quality M anagem ent 1System Developm ent M ethodology and Im plem entation Strategy 1TechnologySystem Design Com plexity 1In-Project Technical Obsolescence 1
Total by Column 0.000 0.000 0.053 0.040 0.000 0.000Total (All Columns) 0.093Option Cost Multiplier (1 + Total) 1.093
Risks to Successful Project Execution
Option 3: Custom
None Minimal Average HighRisk Factors 0.000 0.002 0.007 0.020 0.060 0.180PeopleProject Leadership and Project Ownership 1Organizational Culture and Experience 1Personnel Skill Set Availability and Turnover 1Project Sponsorship/Funding 1ProcessRequirem ents Stability 1Project Size, Effort, and Length 1Process Quality M anagem ent 1System Developm ent M ethodology and Im plem entation Strategy 1TechnologySystem Design Com plexity 1In-Project Technical Obsolescence 1
Total by Column 0.000 0.000 0.000 0.000 0.120 1.440Total (All Columns) 1.560Option Cost Multiplier (1 + Total) 2.560
Risks to Successful Project Execution

Appendix B—Risk Multiplier Business Case Study
Final ReportPage B-6
kpmg
Option 4: COTS
None Minimal Average HighRisk Factors 0.000 0.002 0.007 0.020 0.060 0.180PeopleProject Leadership and Project O wnership 1O rganizational Culture and Experience 1Personnel Skill Set Availability and Turnover 1Project Sponsorship/Funding 1ProcessRequirem ents Stability 1Project Size, Effort, and Length 1Process Quality M anagem ent 1System Developm ent M ethodology and Im plem entation Strategy 1TechnologySystem Design Com plexity 1In-Project Technical O bsolescence 1
Total by Column 0.000 0.004 0.000 0.040 0.360 0.000Total (All Columns) 0.404Option Cost Multiplier (1 + Total) 1.404
Risks to Successful Project Execution
Option 5: Best of Breed
None Minimal Average HighRisk Factors 0.000 0.002 0.007 0.020 0.060 0.180PeopleProject Leadership and Project O wnership 1O rganizational Culture and Experience 1Personnel Skill Set Availability and Turnover 1Project Sponsorship/Funding 1ProcessRequirem ents Stability 1Project Size, Effort, and Length 1Process Quality M anagem ent 1System Developm ent M ethodology and Im plem entation Strategy 1TechnologySystem Design Com plexity 1In-Project Technical O bsolescence 1
Total by Column 0.000 0.000 0.013 0.080 0.180 0.180Total (All Columns) 0.453Option Cost Multiplier (1 + Total) 1.453
Risks to Successful Project Execution

Business Case Study Appendix C—List of Participants
Final ReportPage C-1 kpmg
Appendix C—List of ParticipantsName Organization Participation in BCS
Bill Tuck BCS LAS/PBS, SPURS Requirements Workshop
Jim Colbert BCS COPES Requirements Workshop
Anne Blankenship BOR LAS/PBS Requirements Workshop
Jim Kersh BOR COPES Requirements Workshop
Debra Funkhouser Citrus Functional Quality Questionnaire
Dennis Boulnois Citrus Functional Quality Questionnaire
Dianne Screws Citrus Functional Quality Questionnaire
Jayne Whitaker Citrus Functional Quality Questionnaire
Patrick Jackson Citrus Functional Quality Questionnaire
Emily Beck Comptroller FLAIR Requirements Workshop
Eric Walden Comptroller FLAIR Requirements Workshop
Linda Sharpton Comptroller FLAIR Requirements Workshop
Mike Gomez Comptroller FLAIR Requirements Workshop
Molly Merry Comptroller FLAIR Requirements Workshop
Patti Calhoun Comptroller FLAIR Requirements Workshop
Bob Bugbee DBF Functional Quality Questionnaire
Bruce Berger DBF Functional Quality Questionnaire
Cindy Sauls DBF COPES Requirements Workshop
Ginger Daniels DBF Functional Quality Questionnaire
Robbie Stroud DBF Functional Quality Questionnaire
Susan Rayman DBF Functional Quality Questionnaire
Tom Alfsen DBF Functional Quality Questionnaire
Zadok Coxwell DBF CMS,COPES, FLAIR Requirements Workshop
Bob Sloyer DBPR Functional Quality Questionnaire
Dottie Gough DBPR Functional Quality Questionnaire
Jeannie Evans DBPR Functional Quality Questionnaire
Mary Ann Covington DBPR Functional Quality Questionnaire
Mary Horne DBPR Functional Quality Questionnaire
Pam McGinnis DBPR Functional Quality Questionnaire
Terry Burns DBPR Functional Quality Questionnaire
Bo Scearce DC Functional Quality Questionnaire
Cathy Leggett DC Functional Quality Questionnaire
Delores Alcorn DC Functional Quality Questionnaire
John Kelley DC Functional Quality Questionnaire
Johnnie Ruth Caldwell DC Functional Quality Questionnaire
Lynn Roberts DC Functional Quality Questionnaire
Marilyn Washington DC Functional Quality Questionnaire
Martha Evans DC Functional Quality Questionnaire

Business Case Study Appendix C— List of Participants
Final ReportPage C-2
kpmg
Name Organization Participation in BCS
Mary Huff DC Functional Quality Questionnaire
Renee Hermeling DC Functional Quality Questionnaire
Steve Rowan DC Functional Quality Questionnaire
Trish Perego DC Functional Quality Questionnaire
Annette Kittrell DCA Functional Quality Questionnaire
Becky Essman DCA Functional Quality Questionnaire
David Perrin DCA Functional Quality Questionnaire
Debbie Parks DCA Functional Quality Questionnaire
Gloria Cobb DCA Functional Quality Questionnaire
Karen Peyton DCA Functional Quality Questionnaire
Karen Shiver DCA Functional Quality Questionnaire
Elwood McElhaney DCF Functional Quality Questionnaire
Leona Strickland DCF Functional Quality Questionnaire
Leona Strickland DCF LAS/PBS Requirements Workshop
Mike Wolfe DCF FLAIR Requirements Workshop
Mike Wolfe DCF Functional Quality Questionnaire
Monica O'Neal DCF Functional Quality Questionnaire
Sandy Holm DCF Functional Quality Questionnaire
Toni Estes DCF Functional Quality Questionnaire
Wayne Clotfelter DCF Functional Quality Questionnaire
Dean Modling DEP FLAIR Requirements Workshop
Dean Modling DEP Functional Quality Questionnaire
Gail O'Kelly DEP Functional Quality Questionnaire
Gwenn Godfrey DEP Functional Quality Questionnaire
Joe Young DEP Functional Quality Questionnaire
John Cherry DEP SPURS Requirements Workshop
Mona Strickland DEP Functional Quality Questionnaire
Audrey Fleck DJJ Functional Quality Questionnaire
Clayton Tew DJJ Functional Quality Questionnaire
Cleta Wolverton DJJ Functional Quality Questionnaire
Joan Briggs DJJ Functional Quality Questionnaire
Joseph Kennedy DJJ Functional Quality Questionnaire
Neilda Wild DJJ Functional Quality Questionnaire
Paul G. Bryant DJJ Functional Quality Questionnaire
Vicki J. Harris DJJ Functional Quality Questionnaire
Vivian Chambliss DJJ Functional Quality Questionnaire
Dan Moniz DMS COPES Requirements Workshop
Ellen Guthrie DMS COPES Requirements Workshop
Jimmy Powell DMS SPURS Requirements Workshop
Kevin Thompson DMS SPURS Requirements Workshop
Merrill Moody DMS COPES Requirements Workshop

Business Case Study Appendix C—List of Participants
Final ReportPage C-3 kpmg
Name Organization Participation in BCS
Cathy Tarleton DOACS COPES Requirements Workshop
Elaine Cooper DOACS Functional Quality Questionnaire
Frances Coyle DOACS Functional Quality Questionnaire
Jay Howard DOACS Functional Quality Questionnaire
John Reeves DOACS Functional Quality Questionnaire
Lisa Crutchfield DOACS Functional Quality Questionnaire
Stanton Beaszley DOACS Functional Quality Questionnaire
Sue Baker DOACS Functional Quality Questionnaire
Mary Huff DOC COPES Requirements Workshop
Thomas Lemacks DOC FLAIR Requirements Workshop
Bonnie Lewis DOE Functional Quality Questionnaire
D.R.Carlson DOE Functional Quality Questionnaire
F.D.Phillips DOE Functional Quality Questionnaire
Gwen Rittman DOE Functional Quality Questionnaire
Joyce Bradwell DOE Functional Quality Questionnaire
Norman Holley DOE Functional Quality Questionnaire
Sharon Snyder DOE Functional Quality Questionnaire
Tanner Holloman DOE Functional Quality Questionnaire
Cindy Cooley DOH Functional Quality Questionnaire
Doug Woodlief DOH Functional Quality Questionnaire
Ella Hinson DOH FLAIR Requirements Workshop
Ella Hinson DOH Functional Quality Questionnaire
Jackie Gaston DOH Functional Quality Questionnaire
Jim Brewer DOH Functional Quality Questionnaire
Jodi DiMinno DOH Functional Quality Questionnaire
Mark Gressel DOH Functional Quality Questionnaire
Penny Dyer DOH Functional Quality Questionnaire
Rosey Dollar DOH Functional Quality Questionnaire
Sharon Hill DOH Functional Quality Questionnaire
Susan Hensley DOH Functional Quality Questionnaire
Wayne Summerlin DOH FLAIR Requirements Workshop
Wayne Summerlin DOH Functional Quality Questionnaire
Carolyn Ballentine DOI Functional Quality Questionnaire
Claude Sellers DOI Functional Quality Questionnaire
Debra Bradley DOI Functional Quality Questionnaire
Herb Yohner DOI Functional Quality Questionnaire
Hilary Walz DOI Functional Quality Questionnaire
Jean Whitten DOI Functional Quality Questionnaire
Jim Godfrey DOI Functional Quality Questionnaire
Kelly West DOI Functional Quality Questionnaire
Kimberly Gillard DOI Functional Quality Questionnaire

Business Case Study Appendix C— List of Participants
Final ReportPage C-4
kpmg
Name Organization Participation in BCS
Linda Young DOI Functional Quality Questionnaire
Miram Gray DOI Functional Quality Questionnaire
Nancy Donaldson DOI Functional Quality Questionnaire
Nick Tschiggfrey DOI Functional Quality Questionnaire
Paula Crosby DOI Functional Quality Questionnaire
Sharon Doxsee DOI Functional Quality Questionnaire
Stephanie Lliff DOI Functional Quality Questionnaire
Tim Ellinor DOI Functional Quality Questionnaire
Tim Ellinor DOI SPURS Requirements Workshop
Anne Clark DOL Functional Quality Questionnaire
Dawn McWilliams DOL Functional Quality Questionnaire
William Babiez DOL Functional Quality Questionnaire
Al Hewitt DOR Functional Quality Questionnaire
Barbie Phillips DOR Functional Quality Questionnaire
Bobbie Chappell DOR Functional Quality Questionnaire
Darrell Smith DOR LAS/PBS Requirements Workshop
Diane Whitfield DOR Functional Quality Questionnaire
Lewis Gray DOR Functional Quality Questionnaire
Sherrie Ferrell DOR Functional Quality Questionnaire
Yvonne Hutto DOR Functional Quality Questionnaire
Cynthia Leland DOS Functional Quality Questionnaire
D.Miller DOS Functional Quality Questionnaire
K.McCullars DOS Functional Quality Questionnaire
Kathy Hutchins DOS Functional Quality Questionnaire
L.Wilson DOS Functional Quality Questionnaire
S.Cousins DOS Functional Quality Questionnaire
Shiela Cozzocrea DOS Functional Quality Questionnaire
Tammie Mercier DOS Functional Quality Questionnaire
Art Wright DOT Functional Quality Questionnaire
Bernie Schneider DOT Functional Quality Questionnaire
Bernie Schneider DOT LAS/PBS Requirements Workshop
Bill Kynoch DOT LAS/PBS Requirements Workshop
Deanna Trahan DOT Functional Quality Questionnaire
Deborah Hall DOT SPURS Requirements Workshop
Denise Trykowski DOT Functional Quality Questionnaire
Evelyn Rodriguez DOT Functional Quality Questionnaire
Gaylia Boerner DOT Functional Quality Questionnaire
James Hicks DOT Functional Quality Questionnaire
Jim Oakley DOT FLAIR Requirements Workshop
Jim Oakley DOT Functional Quality Questionnaire
Judy Harrison DOT Functional Quality Questionnaire

Business Case Study Appendix C—List of Participants
Final ReportPage C-5 kpmg
Name Organization Participation in BCS
Lois White DOT FLAIR Requirements Workshop
Lois White DOT Functional Quality Questionnaire
Lynn Schwekendiek DOT Functional Quality Questionnaire
Mike Soto DOT FLAIR Requirements Workshop
Rita Hebert DOT Functional Quality Questionnaire
Ron McCloud DOT Functional Quality Questionnaire
Amelia Wilson Elder Affairs Functional Quality Questionnaire
Brenda Jackson Elder Affairs Functional Quality Questionnaire
Chrissy Singletary Elder Affairs Functional Quality Questionnaire
Collette Banks Elder Affairs Functional Quality Questionnaire
Cynthia Reeves Elder Affairs Functional Quality Questionnaire
Jodi Bailey Elder Affairs Functional Quality Questionnaire
Joe Mezzatesta Elder Affairs Functional Quality Questionnaire
Tony Redman Elder Affairs Functional Quality Questionnaire
Trish Heinze Elder Affairs Functional Quality Questionnaire
Wendy Evans Elder Affairs Functional Quality Questionnaire
Alice Sasser EOG LAS/PBS Requirements Workshop
Asalene Robinson EOG Functional Quality Questionnaire
Catherine Heth EOG Functional Quality Questionnaire
Cynthia Kelly EOG LAS/PBS Requirements Workshop
John Hamilton EOG Functional Quality Questionnaire
Ken Allman EOG Functional Quality Questionnaire
Linda Keillor EOG LAS/PBS Requirements Workshop
Phil Fleming EOG Functional Quality Questionnaire
Sandra Brooks EOG Functional Quality Questionnaire
Skip Martin EOG LAS/PBS Requirements Workshop
Stephanie Cunha EOG Functional Quality Questionnaire
Teresa Brossette EOG Functional Quality Questionnaire
Anthony Montero FAU Functional Quality Questionnaire
Carol Sashi FAU Functional Quality Questionnaire
Ed Schiff FAU Functional Quality Questionnaire
Edwin Bemmel FAU Functional Quality Questionnaire
Joan Lehmann FAU Functional Quality Questionnaire
Kathi Danes FAU Functional Quality Questionnaire
Lionel Gnanasselan FAU Functional Quality Questionnaire
Marie Mascaro FAU Functional Quality Questionnaire
Patricia Seita FAU Functional Quality Questionnaire
Patrick Beauvoir FAU Functional Quality Questionnaire
Robert Pope FAU Functional Quality Questionnaire
Amy Lewis FDHC Functional Quality Questionnaire
Bill Barrett FDHC Functional Quality Questionnaire

Business Case Study Appendix C— List of Participants
Final ReportPage C-6
kpmg
Name Organization Participation in BCS
Bill Perry FDHC Functional Quality Questionnaire
Dianne Spooner FDHC Functional Quality Questionnaire
Doug McCleeary FDHC Functional Quality Questionnaire
Elinor Schroeder FDHC Functional Quality Questionnaire
Janet Parramore FDHC Functional Quality Questionnaire
Janice Bragg FDHC Functional Quality Questionnaire
Jim Sewell FDHC Functional Quality Questionnaire
Mike Harris FDHC Functional Quality Questionnaire
Nancy Pfiester FDHC Functional Quality Questionnaire
Sandra Tyer FDHC Functional Quality Questionnaire
Carol McCallum FDLE Functional Quality Questionnaire
Charlotte Fraser FDLE Functional Quality Questionnaire
Gaines Howerton FDLE Functional Quality Questionnaire
Jerry Hendry FDLE Functional Quality Questionnaire
Karen Austin FDLE Functional Quality Questionnaire
Pat Johnson FDLE Functional Quality Questionnaire
Sylvia Holloway FDLE Functional Quality Questionnaire
Teddy Payne FDLE Functional Quality Questionnaire
Alisa Roberson FDLES Functional Quality Questionnaire
Barbara Chance FDLES Functional Quality Questionnaire
Barbara Matthews FDLES Functional Quality Questionnaire
Carolyn Bryant FDLES Functional Quality Questionnaire
Darnell West FDLES Functional Quality Questionnaire
De-Laine Edwards FDLES Functional Quality Questionnaire
Donna Arden FDLES Functional Quality Questionnaire
Donna Pottle FDLES Functional Quality Questionnaire
Fred Thomas FDLES Functional Quality Questionnaire
Jeannine Evans FDLES Functional Quality Questionnaire
Jim Connor FDLES Functional Quality Questionnaire
Laurette Adams FDLES Functional Quality Questionnaire
Lisa Simpson FDLES Functional Quality Questionnaire
Mary Blake FDLES Functional Quality Questionnaire
Midge Grant FDLES Functional Quality Questionnaire
Regina Barker FDLES Functional Quality Questionnaire
Sam Omeke FDLES Functional Quality Questionnaire
Shirley Trotman FDLES Functional Quality Questionnaire
Ted Meredith FDLES Functional Quality Questionnaire
A.R. Kikel FDVA Functional Quality Questionnaire
Cora Stagner FDVA Functional Quality Questionnaire
Karl Dalke FDVA Functional Quality Questionnaire
Ken Dirmitt FDVA Functional Quality Questionnaire

Business Case Study Appendix C—List of Participants
Final ReportPage C-7 kpmg
Name Organization Participation in BCS
Tami Klee FDVA Functional Quality Questionnaire
Dawn Williams FL Army NG Functional Quality Questionnaire
Peggy Evans FL Army NG Functional Quality Questionnaire
Brenda Poulos Florida Courts Functional Quality Questionnaire
Charlotte Jerrett Florida Courts Functional Quality Questionnaire
David Pepper Florida Courts Functional Quality Questionnaire
Delcynth Schloss Florida Courts Functional Quality Questionnaire
Georgia Franklin Florida Courts Functional Quality Questionnaire
Juanita Wilson Florida Courts Functional Quality Questionnaire
Kelly McMullen Florida Courts Functional Quality Questionnaire
Kimber Perkins Florida Courts Functional Quality Questionnaire
Wally Morris Florida Courts Functional Quality Questionnaire
Andrea McPherson FSU Functional Quality Questionnaire
Sandra McVey FSU Functional Quality Questionnaire
Annette Rossi GFC Functional Quality Questionnaire
Barbie Levins GFC Functional Quality Questionnaire
Cheryl Carico GFC Functional Quality Questionnaire
CindyHoffman GFC Functional Quality Questionnaire
Dorene McClintock GFC Functional Quality Questionnaire
Karen Baggett GFC Functional Quality Questionnaire
Karen L'Heureux GFC Functional Quality Questionnaire
Robin Rollins GFC Functional Quality Questionnaire
Rod Schlieder GFC Functional Quality Questionnaire
Sharon Bussey GFC Functional Quality Questionnaire
Bill Johnson HSMV Functional Quality Questionnaire
Brenda Mathews HSMV Functional Quality Questionnaire
Ed Martin HSMV Functional Quality Questionnaire
Ed Nelson HSMV Functional Quality Questionnaire
Jim Hage HSMV Functional Quality Questionnaire
Keith Veitimger HSMV Functional Quality Questionnaire
Laura Adams HSMV Functional Quality Questionnaire
Laura Bruce HSMV Functional Quality Questionnaire
Mary Ann Thorner HSMV Functional Quality Questionnaire
Musette Lewis HSMV Functional Quality Questionnaire
Neil Standley HSMV Functional Quality Questionnaire
Russ Rothman HSMV Functional Quality Questionnaire
Russ Rothman HSMV SPURS Requirements Workshop
Stuart Strickland HSMV Functional Quality Questionnaire
Bruce Burns Legislature Functional Quality Questionnaire
Candace Ardley Legislature Functional Quality Questionnaire
Carolyn Hicks Legislature Functional Quality Questionnaire

Business Case Study Appendix C— List of Participants
Final ReportPage C-8
kpmg
Name Organization Participation in BCS
Cynthia Kelly Legislature Functional Quality Questionnaire
Debbie Kline Legislature Functional Quality Questionnaire
Jim Windsor Legislature Functional Quality Questionnaire
Lisa Swindle Legislature Functional Quality Questionnaire
Lurea Thurman Legislature Functional Quality Questionnaire
Mike Mentillo Legislature Functional Quality Questionnaire
Tom Lonchar Legislature Functional Quality Questionnaire
Jim Colbert OAG CMS Requirements Workshop
Jim Colbert OAG FLAIR Requirements Workshop
Jim Colbert OAG SPURS Requirements Workshop
Barbara Harris PSC COPES Requirements Workshop
Barbara Harris PSC Functional Quality Questionnaire
Barbara Taylor PSC Functional Quality Questionnaire
Evelyn Sewell PSC Functional Quality Questionnaire
Frantk Harrison PSC Functional Quality Questionnaire
Karen Belcher PSC Functional Quality Questionnaire
Marian Ellis PSC Functional Quality Questionnaire
Steve Wharton PSC Functional Quality Questionnaire
Donna Nichols SUS SPURS Requirements Workshop
Bruce Gillander Treasury CMS Requirements Workshop
John Burch Treasury CMS Requirements Workshop
Meriam Grey Treasury CMS Requirements Workshop
Rob Allen Treasury CMS Requirements Workshop
Sharon Doxsee Treasury CMS Requirements Workshop
Kimberly McMurray Treasury CMS Requirements Workshop
Frank Green UFL Functional Quality Questionnaire
Kim Boynton UFL Functional Quality Questionnaire
Lawanna Reaves UFL Functional Quality Questionnaire
Murphy Miller UFL Functional Quality Questionnaire
Anne Hoover UNF Functional Quality Questionnaire
Annie Willis UNF Functional Quality Questionnaire
Ellery Griffis UNF Functional Quality Questionnaire
Leslie Mizell UNF Functional Quality Questionnaire
Ricky Arjune UNF Functional Quality Questionnaire
Eric Walden USF Functional Quality Questionnaire
Gloria Resmondo UWF Functional Quality Questionnaire
Christy Gregg BPR Admin Services Director
Christy Gregg BPR Agency for Health Care Administration
Mike Gresham BPR Department of Agriculture and Consumer Services
Bill Monroe BPR Department of Banking and Finance
Bruce Berger BPR Department of Banking and Finance

Business Case Study Appendix C—List of Participants
Final ReportPage C-9 kpmg
Name Organization Participation in BCS
Cindy Mazzara BPR Department of Banking and Finance
Doug Darling BPR Department of Banking and Finance
Lance Smith BPR Department of Banking and Finance
Robert Milligan BPR Department of Banking and Finance
Steven Ritacco BPR Department of Banking and Finance
Tom McGurk BPR Department of Banking and Finance
William H. McKeown BPR Department of Banking and Finance
William Huffcut BPR Department of Banking and Finance
Dean Mokling BPR Department of Banking and Finance
Emily Beck BPR Department of Banking and Finance
Raymond Marsh BPR Department of Banking and Finance
Richard Sieg BPR Department of Banking and Finance
Tom Clemons BPR Department of Business and Professional Regulation
Mercedes Scarabin BPR Department of Children and Families
Amy Karimipour BPR Department of Children and Families
Becky Rogers BPR Department of Children and Families
Bert Wilkerson BPR Department of Children and Families
Bill Woods BPR Department of Children and Families
Bob Burton BPR Department of Children and Families
Buddy Croft BPR Department of Children and Families
Burton Marshall BPR Department of Children and Families
Carolyn Love BPR Department of Children and Families
Chuck Tardif BPR Department of Children and Families
Cricket Lee BPR Department of Children and Families
Dana Sweat BPR Department of Children and Families
David DiSalvo BPR Department of Children and Families
Dick Chatel BPR Department of Children and Families
Don Winstead BPR Department of Children and Families
Emily Hamby BPR Department of Children and Families
Frank Green BPR Department of Children and Families
Frank Lior BPR Department of Children and Families
Gary Drzewiecki BPR Department of Children and Families
Irma Velez BPR Department of Children and Families
Judy G. BPR Department of Children and Families
Kathy Jones BPR Department of Children and Families
Katie Joiner BPR Department of Children and Families
Keith Veitinger BPR Department of Children and Families
Ken Wilson BPR Department of Children and Families
Kenneth Jones BPR Department of Children and Families
Marilyn Van Dusseldorp BPR Department of Children and Families
MaryAnn Whitley BPR Department of Children and Families

Business Case Study Appendix C— List of Participants
Final ReportPage C-10
kpmg
Name Organization Participation in BCS
Maryanne Perry BPR Department of Children and Families
Maryanne Thorner BPR Department of Children and Families
Michael Williams BPR Department of Children and Families
Monica Thames BPR Department of Children and Families
Nancy Donaldson BPR Department of Children and Families
Nick Tishfry BPR Department of Children and Families
Pam Venoors BPR Department of Children and Families
Pat Shuler BPR Department of Children and Families
Paul Mauck BPR Department of Children and Families
Paula Crosby BPR Department of Children and Families
Richard Jeter BPR Department of Children and Families
Rita Smith BPR Department of Children and Families
Robert Fierro BPR Department of Children and Families
Sabrina Donovan BPR Department of Children and Families
Sandra Gantt BPR Department of Children and Families
Sandy Holm BPR Department of Children and Families
Sheela Moudgil BPR Department of Children and Families
Suzanne Sindldecker BPR Department of Children and Families
Thomas Tonner BPR Department of Children and Families
Thomas Towns BPR Department of Children and Families
Tom Sealey BPR Department of Children and Families
Tom Seawell BPR Department of Children and Families
Toni Estis BPR Department of Children and Families
Wayne Clothfelter BPR Department of Children and Families
Yvonne Bryant BPR Department of Children and Families
Michael Sparks BPR Department of Citrus
Lynn Ekholm BPR Department of Community Affairs
Bill Thurber BPR Department of Corrections
Joyce Hobson BPR Department of Education
Susan Tucker BPR Department of Elder Affairs
Myra Williams BPR Department of Environmental Protection
Thomas W. Arnold BPR Department of Health
Deana Metcalf BPR Department of Highway Safety and Motor Vehicle
Ed Martin BPR Department of Highway Safety and Motor Vehicle
Janet Moran BPR Department of Highway Safety and Motor Vehicle
Joe McKaskill BPR Department of Highway Safety and Motor Vehicle
Laura Bruce BPR Department of Highway Safety and Motor Vehicle
Neil Standley BPR Department of Highway Safety and Motor Vehicle
Russ Rothman BPR Department of Highway Safety and Motor Vehicle
Sandy DeLopez BPR Department of Highway Safety and Motor Vehicle
Yvonne Brown BPR Department of Highway Safety and Motor Vehicle

Business Case Study Appendix C—List of Participants
Final ReportPage C-11 kpmg
Name Organization Participation in BCS
John Birch BPR Department of Insurance Treasurer
Kimberly McMurray BPR Department of Insurance Treasurer
Bruce Gillander BPR Department of Insurance Treasurer
Claude Sellars BPR Department of Insurance Treasurer
David Rodriquez BPR Department of Insurance Treasurer
Jim Godfrey BPR Department of Insurance Treasurer
Ken Jones BPR Department of Insurance Treasurer
Ken Nipper BPR Department of Insurance Treasurer
Tim Ellinor BPR Department of Insurance Treasurer
Elaine Bryant BPR Department of Juvenile Justice
Harrison Guess BPR Department of Juvenile Justice
Bob Allen BPR Department of Labor and Employment Security
Altha Manning BPR Department of Labor and Employment Security
Fredrick L. Thomas BPR Department of Labor and Employment Security
Neil W. Meoni BPR Department of Labor and Employment Security
Tom Thompson BPR Department of Labor and Employment Security
Jerry McDaniel BPR Department of Law Enforcement
Teddy Payne BPR Department of Law Enforcement
Barbara Goltz BPR Department of Lottery
Sharon Larson BPR Department of Management Services
Charles Ghini BPR Department of Management Services
Jay Young BPR Department of Management Services
Jimmy Powell BPR Department of Management Services
Linda Nelson BPR Department of Management Services
Pat Sampey BPR Department of Management Services
Sheree Keeler BPR Department of Management Services
Gary Vanlandingham BPR Department of Military Affairs
Lt. Col. Micky Duren BPR Department of Military Affairs
Gerald Johnson BPR Department of Revenue
Maria Johnson BPR Department of Revenue
Nancy Wittenberg BPR Department of Revenue
Hal Lench BPR Department of State
Annette Dan BPR Department of Transportation
Art. Wright BPR Department of Transportation
Bill Knoch BPR Department of Transportation
Carl Cavanaugh BPR Department of Transportation
Christina Smith BPR Department of Transportation
Dave Ferguson BPR Department of Transportation
George Cole BPR Department of Transportation
Jean Whitten BPR Department of Transportation
Joe Kowalski BPR Department of Transportation

Business Case Study Appendix C— List of Participants
Final ReportPage C-12
kpmg
Name Organization Participation in BCS
Juanita Moore BPR Department of Transportation
Laura Kelly BPR Department of Transportation
Lois White BPR Department of Transportation
Mike Wolfe BPR Department of Transportation
Nelson Hill BPR Department of Transportation
Rod Whit BPR Department of Transportation
Tereasa Stewart BPR Department of Transportation
Terry Cappellini BPR Department of Transportation
Edward McElhaney BPR Department or Children and Families
Marcia Sharma BPR Division of Retirement
David Colburn BPR Florida Legislature
Dr. Bob Bradley BPR Florida Legislature
Eliza Hawkins BPR Florida Legislature
Alice Sasser BPR Florida Legislature
Elton Revell BPR Florida Legislature
Jana Walling BPR Florida Legislature
Mallory Horne BPR Florida Legislature
Marsha Belcher BPR Florida Legislature
Mike Peters BPR Florida Legislature
Paul Belcher BPR Florida Legislature
Curtis Bullock BPR Florida University System
Dr. Paul Gallagher BPR Florida University System
Dr. Rovert Carroll BPR Florida University System
John R. Carnaghi BPR Florida University System
Larry Reese BPR Florida University System
Robert F. Fagin BPR Florida University System
William F. Merck, II BPR Florida University System
Sandra Porter BPR Game and Fresh Water Fish Commission
David Field BPR Gelco, Department of Defense
Shirley Captura BPR Gelco, Department of Defense
Donna Arduin BPR Office of the Governor
Ed Levin BPR Office of the Governor
Kenneth L. Allman BPR Office of the Governor
Linda Keillor BPR Office of the Governor
Roy Cales BPR Office of the Governor
Sally Bradshaw BPR Office of the Governor
Sandra Sartin BPR Office of the Governor
John Turcotte BPR OPPAGA
Shirley Miller BPR Parole Commission
James A. Ward BPR Public Service Commission
Steve Tribble BPR Public Service Commission

Business Case Study Appendix C—List of Participants
Final ReportPage C-13 kpmg
Name Organization Participation in BCS
William F. “Bill” James BPR State Board of Administration
Kelly McMullen BPR State Courts Administrator
Lisa Goodner BPR State Courts Administrator
Joe Lazor BPR State Technology Office
Mary Christopher BPR State Technology Office
Donna Nichols BPR State University System
Tim Frost BPR Tallahassee Community College
Catie Joynor BPR University of Florida
Dottie Haskew BPR University of Florida
E. Hamby BPR University of Florida
Earl Robbins BPR University of Florida
Gerald Schaffer BPR University of Florida
Irma Vellessa BPR University of Florida
Kathy Jones BPR University of Florida
M. Whitley BPR University of Florida
M. Williams BPR University of Florida
Randy Staples BPR University of Florida
Ruth Harris BPR University of Florida
Seri Austin BPR University of Florida
Stuart Hoskins BPR University of Florida
Anne Blankenship BPR University of Florida (Board of Regents)

Business Case Study Appendix C— List of Participants
Final ReportPage C-14
kpmg
This page intentionally left blank.

ID Name Start Finish Duration Deliverable1 Project Launch 4/3/00 5/22/00 7 wks
2 Review/confirm Terms of Reference (ToR),Scope, Objectives
4/3/00 4/17/00 2 wks Project Constitution
3 Review / confirm business needs and anticipatedbenefits
4/17/00 5/15/00 4 wks BNAB - Definition of business needs& anticipated benefits
4 Select Processes 4/21/00 4/25/00 1.75 days Skeleton Path Plan
5 Define and agree Project Managementtechniques.
4/27/00 5/4/00 1 wk PM Techniques
6 Define and agree change management approach(for organizational issues)
4/27/00 5/4/00 1 wk Change Management Strategy
7 Define and agree requirements for linkage withother methodologies.
4/27/00 5/4/00 1 wk Linkages
8 Define organization, people and supportrequirements
5/8/00 5/22/00 2 wks Project Organigramme and JDs
'00 '01 '02 '03 '04 '05 '06 '072000 2001 2002 2003 2004 2005 2006 2007

ID Name Start Finish Duration Deliverable9 Project Model 5/15/00 3/26/01 45 wks
10 Business Needs 6/5/00 7/12/00 5.55 wks
11 Foundation - "as-is" fact-find 6/5/00 6/28/00 3.5 wks
12 Business Vision and Objectives 6/12/00 6/29/00 2.63 wks
13 Constraints 6/30/00 7/12/00 1.75 wks
14 Business Process Design 6/23/00 8/28/00 9.18 wks
15 Business Process design needs 6/23/00 7/19/00 3.5 wks
16 Select ERP base business model templates 7/19/00 7/20/00 0.23 wks
17 Create and maintain ERP enterprise businessmodel
7/20/00 8/3/00 2 wks
18 Schedule ERP process modeling workshops 8/3/00 8/4/00 0.23 wks
19 Conduct ERP process modeling workshops 8/4/00 8/25/00 3 wks
20 Agree initial ERP enterprise business model 8/25/00 8/28/00 0.23 wks
21 System Solution & Feasibility 7/6/00 10/16/00 14.43 wks
22 Review ERP technical status 7/6/00 7/19/00 1.75 wks
23 System Vision: Outline design of the ERPsystem and business processes
7/6/00 7/25/00 2.63 wks
24 Organizational Impact 7/25/00 8/7/00 1.75 wks
25 Identify detailed requirements 8/28/00 9/21/00 3.5 wks
26 Interfacing review 8/28/00 9/8/00 1.75 wks
27 Gap Analysis - existing systems Vsrequirements
9/21/00 10/3/00 1.75 wks
28 Gap Analysis - requirements Vs ERP 10/3/00 10/16/00 1.75 wks
29 Implementation Strategy 5/15/00 3/26/01 45 wks
'00 '01 '02 '03 '04 '05 '06 '072000 2001 2002 2003 2004 2005 2006 2007

ID Name Start Finish Duration Deliverable30 Establish ERP architectural options 9/27/00 10/10/00 1.75 wks
31 Estimate costs and benefits per option 10/3/00 10/23/00 2.63 wks
32 Focus on delivery of benefits - Cost/BenefitModel
5/15/00 3/26/01 200 days
33 Collate and agree requirements report 9/27/00 10/23/00 3.5 wks
34 ERP Architecture & ImplementationStrategy
9/8/00 9/21/00 1.75 wks
'00 '01 '02 '03 '04 '05 '06 '072000 2001 2002 2003 2004 2005 2006 2007

ID Name Start Finish Duration Deliverable35 Design, Prototype & Construction 1/4/00 12/19/02 154.55 wks
36 Prepare to Prototype 1/4/00 12/19/02 154.55 wks
37 Prepare / review / agree design topics,descriptions and sign off.
10/23/00 10/26/00 3 days
38 Review technical environment and planERP installation
10/26/00 11/30/00 4.97 wks
39 Review planned technical solution 10/26/00 11/1/00 0.88 wks
40 Investigate technical environment 10/26/00 10/27/00 0.88 days
41 Collate requirements 10/26/00 11/8/00 1.75 wks
42 Establish options and recommendations 11/14/00 11/20/00 0.88 wks
43 Detail the approach / Technical Plan 11/22/00 11/23/00 0.88 days
44 Review and agree Technical Plan 11/17/00 11/30/00 1.75 wks Technical Plan
45 Install hardware, communicationsequipment, system software, and ERP
11/30/00 11/21/02 103.1 wks
46 Order/acquire equipment, provisions,services etc for Development System
11/30/00 12/25/00 3.5 wks
47 Prepare site(s) / physical environmentfor Development System
11/30/00 12/25/00 3.5 wks
48 Install & test equipment, services etcfor Development System
12/1/00 12/26/00 3.5 wks Installation sign off
49 Monitor needs for further phases ofinstallation
11/30/00 10/3/01 43.75 wks
50 Order/acquire hardware, software andservices for Live Configuration
9/23/02 10/3/02 1.75 wks
51 Prepare Site(s) for Live Configuration 11/30/00 12/25/00 3.5 wks
52 Install and test Live Configuration 10/29/02 11/21/02 3.5 wks Installation sign off(s)
53 Design and set up backup/recoveryprovisions (development & test
11/21/02 12/5/02 2 wks
54 Design and set up system security provisions 12/5/02 12/19/02 2 wks
55 Define, agree and instigate change controlprocedures
10/26/00 8/31/01 44.14 wks
'00 '01 '02 '03 '04 '05 '06 '072000 2001 2002 2003 2004 2005 2006 2007

ID Name Start Finish Duration Deliverable56 Define and agree change control
protocol10/26/00 10/30/00 1.75 days CCP (Change Control Protocol)
57 Communicate procedures to team andother people involved
10/30/00 11/1/00 1.75 days
58 Operate the Change Control Protocol 10/30/00 8/31/01 43.75 wks Change Control
59 Define and instigate Project Teamresponsibilities and techniques for technical
11/14/00 10/3/01 46.09 wks
60 Define and agree needs for support 11/14/00 11/17/00 2.63 days
61 Define and agree responsibilities 11/22/00 11/24/00 1.75 days Development Sys Admin
62 Provide support 11/30/00 10/3/01 43.75 wks
63 Issues - control, escalate, resolve 1/4/00 12/18/00 49.88 wks
64 Define and agree issue controlmechanism
1/4/00 1/10/00 0.88 wks ICP - Issues Control Protocol
65 Communicate Issues Controlmechanism to all participants
1/10/00 1/21/00 1.75 wks
66 Operate Issues Control 1/10/00 12/18/00 49 wks Issues Control
67 Plan & prepare ERP prototyping facilities 12/25/00 12/26/00 0.23 wks
68 Plan and Initiate Team Training Process 12/20/00 1/25/01 5.2 wks
69 Plan, prepare and conduct ERP and generaltraining for project participants
12/20/00 1/11/01 3.22 wks
70 Identify team's training needs 12/20/00 12/22/00 1.75 days
71 Identify options, recommendations &training plan
12/21/00 12/25/00 1.75 days Project Team Training Plan
72 Prepare training facilities and materials 12/20/00 1/2/01 1.75 wks Project Team Courses
73 Provide / attend training 12/25/00 1/11/01 2.63 wks Project Team Training
74 Team building and education 1/11/01 1/12/01 0.23 wks
75 Present approach to user community andteam
1/12/01 1/25/01 1.75 wks Briefings
'00 '01 '02 '03 '04 '05 '06 '072000 2001 2002 2003 2004 2005 2006 2007

ID Name Start Finish Duration Deliverable76 Build base model 1/25/01 4/2/01 9.45 wks
77 Select Business Processes from ERPReference Model
1/25/01 1/26/01 0.23 wks
78 Configure initial ERP system as prototypingmodel
1/26/01 1/29/01 0.23 wks
79 Build core testing data for prototyping 1/29/01 1/30/01 0.23 wks
80 Design / prototype by topic 1/25/01 4/2/01 9.45 wks
81 Define, agree and set up ERPOrganizational Structures
1/25/01 4/2/01 9.45 wks
82 Design / prototype Human Resources 1/25/01 2/14/01 2.93 wks
83 Human Resources 1/25/01 2/14/01 2.93 wks Implementation Paper forDesign/Prototype of Human
84 Master Data 1/25/01 2/1/01 1.13 wks Implementation Paper forDesign/Prototype of Master Data
85 Basic data 1/25/01 1/26/01 0.23 wks Implementation Paper forDesign/Prototype of Basic data
86 Personal data 1/26/01 1/29/01 0.23 wks Implementation Paper forDesign/Prototype of Personal data
87 Data relevant topayment
1/29/01 1/30/01 0.23 wks Implementation Paper forDesign/Prototype of Data relevant
88 Internal data 1/30/01 1/31/01 0.23 wks Implementation Paper forDesign/Prototype of Internal data
89 Planning data 1/31/01 2/1/01 0.23 wks Implementation Paper forDesign/Prototype of Planning data
90 Time Data 2/1/01 2/9/01 1.13 wks Implementation Paper forDesign/Prototype of Time Data
91 Shift schedule 2/1/01 2/2/01 0.23 wks Implementation Paper forDesign/Prototype of Shift schedule
92 Negative time rec. 2/2/01 2/5/01 0.23 wks Implementation Paper forDesign/Prototype of Negative time
93 PDC/positive t.rec. 2/5/01 2/7/01 0.23 wks Implementation Paper forDesign/Prototype of PDC/positive
94 Incentive wages 2/7/01 2/8/01 0.23 wks Implementation Paper forDesign/Prototype of Incentive wages
95 Other 2/8/01 2/9/01 0.23 wks Implementation Paper forDesign/Prototype of Other
'01 '02 '03 '04 '05 '06 '07 '082001 2002 2003 2004 2005 2006 2007 2008

ID Name Start Finish Duration Deliverable96 Travel Expenses 2/9/01 2/14/01 0.68 wks Implementation Paper for
Design/Prototype of Travel97 Environment 2/9/01 2/12/01 0.23 wks Implementation Paper for
Design/Prototype of Environment98 Options 2/12/01 2/13/01 0.23 wks Implementation Paper for
Design/Prototype of Options99 Settings 2/13/01 2/14/01 0.23 wks Implementation Paper for
Design/Prototype of Settings
'01 '02 '03 '04 '05 '06 '07 '082001 2002 2003 2004 2005 2006 2007 2008

ID Name Start Finish Duration Deliverable100 Prototype process 1/4/00 9/23/02 141.8 wks
101 Data Conversion Strategy 1/4/00 1/25/00 3.02 wks
102 Establish requirements 1/4/00 1/14/00 1.75 wks
103 Establish and evaluate options 1/10/00 1/21/00 1.75 wks
104 Agree approach(es) to Data Conversion 1/21/00 1/25/00 1.75 days Data Conversion Strategy
105 Prepare discussion papers 1/5/00 6/23/00 24.5 wks Discussion Papers
106 Set up, execute and manage ERP prototypingworkshop
1/4/00 1/5/00 0.23 wks
107 Manage, control refresh core data forprototyping
1/5/00 1/6/00 0.23 wks
108 Design\prototype by topic 1/5/00 8/14/00 31.78 wks
109 Design / prototype Financial accounting 1/5/00 2/8/00 4.95 wks
110 Financial accounting 1/5/00 2/8/00 4.95 wks Financial accounting
111 Financial Accounting 1/5/00 1/7/00 0.45 wks Financial Accounting
112 Financial Accounting projectscope
1/5/00 1/6/00 0.23 wks Financial Accounting project scope
113 Environment 1/6/00 1/7/00 0.23 wks Environment
114 Master data 1/7/00 1/13/00 0.9 wks Master data
115 Bus. transactions 1/7/00 1/10/00 0.23 wks Bus. transactions
116 Business transactions 1/10/00 1/11/00 0.23 wks Business transactions
117 Closing 1/11/00 1/12/00 0.23 wks Closing
118 Tools 1/12/00 1/13/00 0.23 wks Tools
119 Extended general ledger 1/13/00 1/24/00 1.35 wks Extended general ledger
120 Basic Data 1/13/00 1/14/00 0.23 wks Basic Data
'00 '01 '02 '03 '04 '05 '06 '072000 2001 2002 2003 2004 2005 2006 2007

ID Name Start Finish Duration Deliverable121 Planning 1/17/00 1/18/00 0.23 wks Planning
122 Actual Posting 1/18/00 1/19/00 0.23 wks Actual Posting
123 Periodic Processing 1/19/00 1/20/00 0.23 wks Periodic Processing
124 Reporting 1/20/00 1/21/00 0.23 wks Reporting
125 Tools 1/21/00 1/24/00 0.23 wks Tools
126 Consolidation 1/24/00 2/2/00 1.35 wks Consolidation
127 Master records 1/24/00 1/25/00 0.23 wks Master records
128 Individual financial statementdata
1/25/00 1/26/00 0.23 wks Individual financial statement data
129 Currency translation 1/26/00 1/27/00 0.23 wks Currency translation
130 Posting documents 1/28/00 1/31/00 0.23 wks Posting documents
131 Consolidation 1/31/00 2/1/00 0.23 wks Consolidation
132 Corporate standard report 2/1/00 2/2/00 0.23 wks Corporate standard report
133 Preparations for consolidation 2/2/00 2/8/00 0.9 wks Preparations for consolidation
134 Master data 2/2/00 2/3/00 0.23 wks Master data
135 Financial accounting 2/3/00 2/4/00 0.23 wks Financial accounting
136 Fixed Assets Accounting 2/4/00 2/7/00 0.23 wks Fixed Assets Accounting
137 Extended G/L accounting 2/7/00 2/8/00 0.23 wks extended G/L accounting
138 Design / prototype Asset Management 7/10/00 8/14/00 5.18 wks
139 Implementation Guide AssetAccounting
7/10/00 8/14/00 5.18 wks Implementation Guide AssetAccounting
140 Asset Accounting project range 7/10/00 7/13/00 0.68 wks Asset Accounting project range
'00 '01 '02 '03 '04 '05 '06 '072000 2001 2002 2003 2004 2005 2006 2007

ID Name Start Finish Duration Deliverable141 Select functions 7/10/00 7/11/00 0.23 wks Select functions
142 Specify areas ofresponsibility
7/11/00 7/12/00 0.23 wks Specify areas of responsibility
143 Specify information flow 7/12/00 7/13/00 0.23 wks Specify information flow
144 Asset Accounting environment 7/13/00 7/18/00 0.68 wks Asset Accounting environment
145 Define authorizations 7/13/00 7/14/00 0.23 wks Define authorizations
146 Index specifications 7/14/00 7/17/00 0.23 wks Index specifications
147 System Administration Guide 7/17/00 7/18/00 0.23 wks System Administration Guide
148 Valuation of fixed assets 7/18/00 8/1/00 2.03 wks Valuation of fixed assets
149 Define chart of depreciation 7/18/00 7/19/00 0.23 wks Define chart of depreciation
150 Define depreciation areas 7/20/00 7/21/00 0.23 wks Define depreciation areas
151 Asset Accounting companycodes
7/21/00 7/24/00 0.23 wks Asset Accounting company codes
152 Valuation key 7/24/00 7/25/00 0.23 wks Valuation key
153 Net Worth Tax 7/25/00 7/26/00 0.23 wks Net Worth Tax
154 Insurance 7/26/00 7/27/00 0.23 wks insurance
155 Investment Support 7/27/00 7/28/00 0.23 wks Investment Support
156 Leasing types 7/28/00 7/31/00 0.23 wks Leasing types
157 Revaluation 7/31/00 8/1/00 0.23 wks Revaluation
158 Activities 8/2/00 8/9/00 1.13 wks Activities
159 Document types for postingin fixed assets
8/2/00 8/3/00 0.23 wks Document types for posting in fixedassets
160 Document number ranges 8/3/00 8/4/00 0.23 wks Document number ranges
'00 '01 '02 '03 '04 '05 '06 '072000 2001 2002 2003 2004 2005 2006 2007

ID Name Start Finish Duration Deliverable161 Transaction types 8/4/00 8/7/00 0.23 wks Transaction types
162 Post depreciation 8/7/00 8/8/00 0.23 wks Post depreciation
163 Settlement of asset underconstruction
8/8/00 8/9/00 0.23 wks Settlement of asset underconstruction
164 Reporting 8/9/00 8/14/00 0.68 wks Reporting
165 Sort criteria for asset reports 8/9/00 8/10/00 0.23 wks criteria for asset reports
166 Asset history sheet 8/10/00 8/11/00 0.23 wks Asset history sheet
167 Call up of reports 8/11/00 8/14/00 0.23 wks Call up of reports
168 Design / prototype Treasury 1/18/00 1/21/00 0.68 wks
169 Finalize Position 1/18/00 1/21/00 0.68 wks Finalize Position
170 Master data 1/18/00 1/19/00 0.23 wks Master data
171 Structure 1/19/00 1/20/00 0.23 wks Structure
172 Tools 1/20/00 1/21/00 0.23 wks Tools
173 Design / prototype Human Resources 1/21/00 2/11/00 2.93 wks
174 Human Resources 1/21/00 2/11/00 2.93 wks Human Resources
175 Master Data 1/21/00 1/31/00 1.13 wks Master Data
176 Basic data 1/21/00 1/24/00 0.23 wks Basic data
177 Personal data 1/24/00 1/25/00 0.23 wks Personal data
178 Data relevant to payment 1/25/00 1/26/00 0.23 wks Data relevant to payment
179 Internal data 1/26/00 1/27/00 0.23 wks Internal data
180 Planning data 1/28/00 1/31/00 0.23 wks Planning data
'00 '01 '02 '03 '04 '05 '06 '072000 2001 2002 2003 2004 2005 2006 2007

ID Name Start Finish Duration Deliverable181 Time Data 1/31/00 2/7/00 1.13 wks Time Data
182 Shift schedule 1/31/00 2/1/00 0.23 wks Shift schedule
183 Negative time rec. 2/1/00 2/2/00 0.23 wks Negative time rec.
184 PDC/positive t.rec. 2/2/00 2/3/00 0.23 wks PDC/positive t.rec.
185 Incentive wages 2/3/00 2/4/00 0.23 wks Incentive wages
186 Other 2/4/00 2/7/00 0.23 wks Other
187 Travel Expenses 2/7/00 2/11/00 0.68 wks Travel Expenses
188 Environment 2/7/00 2/8/00 0.23 wks Environment
189 Options 2/8/00 2/9/00 0.23 wks Options
190 Settings 2/10/00 2/11/00 0.23 wks Settings
191 Consolidate ERP prototyping results 8/15/00 8/16/00 0.23 wks
192 Resolve outstanding policy issues 2/4/02 2/5/02 0.23 wks
193 Final ERP Gap Analysis 2/11/02 2/12/02 0.23 wks
194 Build 8/15/00 9/23/02 109.83 wks
195 Create detailed specifications for non-ERPIT development work
2/18/02 3/28/02 5.63 wks
196 Specify Data Conversion approaches 2/18/02 3/20/02 4.5 wks
197 Specify Data conversionapproaches for Financial
2/18/02 2/25/02 5 days
198 Specify Data conversionapproaches for Asset
2/25/02 3/5/02 5 days
199 Specify Data conversionapproaches for Treasury
3/5/02 3/12/02 5 days
200 Specify Data conversionapproaches for Human Resources
3/13/02 3/20/02 5 days
'00 '01 '02 '03 '04 '05 '06 '072000 2001 2002 2003 2004 2005 2006 2007

ID Name Start Finish Duration Deliverable201 Specify Interface extraction 2/18/02 3/28/02 5.63 wks
202 Specify interface extraction forFinancial accounting
2/18/02 2/25/02 5 days
203 Specify interface extraction forAsset Management
2/25/02 3/5/02 5 days
204 Specify interface extraction forControlling
3/5/02 3/12/02 5 days
205 Specify interface extraction forTreasury
3/13/02 3/20/02 5 days
206 Specify interface extraction forHuman Resources
3/20/02 3/28/02 5 days
207 Finalize interface design 4/1/02 9/23/02 25 wks
208 Finalize interface design Financialaccounting
4/1/02 5/6/02 5 wks
209 Finalize interface design AssetManagement
5/6/02 6/10/02 5 wks
210 Finalize interface design Controlling 6/10/02 7/15/02 5 wks
211 Finalize interface design Treasury 7/15/02 8/19/02 5 wks
212 Finalize interface design HumanResources
8/19/02 9/23/02 5 wks
213 Finalize data conversion design 4/1/02 9/23/02 25 wks
214 Finalize data conversion designFinancial accounting
4/1/02 5/6/02 5 wks
215 Finalize data conversion design AssetManagement
5/6/02 6/10/02 5 wks
216 Finalize data conversion designControlling
6/10/02 7/15/02 5 wks
217 Finalize data conversion designTreasury
7/15/02 8/19/02 5 wks
218 Finalize data conversion design HumanResources
8/19/02 9/23/02 5 wks
219 Configure system parameters, codes,structures, etc
8/15/00 8/16/00 0.23 wks
220 Configure system parameters, codes,structures Financial accounting
8/15/00 8/16/00 0.23 wks
'00 '01 '02 '03 '04 '05 '06 '072000 2001 2002 2003 2004 2005 2006 2007

ID Name Start Finish Duration Deliverable221 Configure system parameters, codes,
structures Asset Management8/15/00 8/16/00 0.23 wks
222 Configure system parameters, codes,structures Controlling
8/15/00 8/16/00 0.23 wks
223 Configure system parameters, codes,structures Treasury
8/15/00 8/16/00 0.23 wks
224 Configure system parameters, codes,structures Human Resources
8/15/00 8/16/00 0.23 wks
225 Set up & test coding structures 8/15/00 9/20/00 5.25 wks
226 Set up & test coding structuresFinancial Accounting
8/15/00 9/20/00 5.25 wks
227 Set up & test coding structures forAsset Management
8/15/00 9/20/00 5.25 wks
228 Set up & test coding structuresControlling
8/15/00 9/20/00 5.25 wks
229 Set up & test coding structuresTreasury
8/15/00 9/20/00 5.25 wks
230 Set up & test coding structures HumanResources
8/15/00 9/20/00 5.25 wks
231 Set up screens, queries & report writer etc 4/1/02 4/2/02 0.23 wks
232 Set-up screens, queries & reportFinancial accounting
4/1/02 4/2/02 0.23 wks
233 Select screen variant for documententry
4/1/02 4/2/02 0.23 wks
234 Define report allocation 4/1/02 4/2/02 0.23 wks
235 Define report variants forpayment notices
4/1/02 4/2/02 0.23 wks
236 Define report variants for accountstatements
4/1/02 4/2/02 0.23 wks
237 Define report variants for b/echarges statement
4/1/02 4/2/02 0.23 wks
238 Define report variants for internaldocuments
4/1/02 4/2/02 0.23 wks
239 Define report variants forindividual letters
4/1/02 4/2/02 0.23 wks
240 Define report variants fordocument statements
4/1/02 4/2/02 0.23 wks
'00 '01 '02 '03 '04 '05 '06 '072000 2001 2002 2003 2004 2005 2006 2007

ID Name Start Finish Duration Deliverable241 General reports 4/1/02 4/2/02 0.23 wks
242 Day end reports 4/1/02 4/2/02 0.23 wks
243 Month end reports 4/1/02 4/2/02 0.23 wks
244 Year end reports 4/1/02 4/2/02 0.23 wks
245 Reporting 4/1/02 4/2/02 0.23 wks
246 Maintain Report WriterLanguages
4/1/02 4/2/02 0.23 wks
247 Display Control Report 4/1/02 4/2/02 0.23 wks
248 Set-up screens, queries & report AssetManagement
4/1/02 4/2/02 0.23 wks
249 Screen layout for the asset masterrecord
4/1/02 4/2/02 0.23 wks
250 Screen layout for the depreciationarea
4/1/02 4/2/02 0.23 wks
251 Reporting 4/1/02 4/2/02 0.23 wks
252 Sort criteria for asset reports 4/1/02 4/2/02 0.23 wks
253 Call up of reports 4/1/02 4/2/02 0.23 wks
254 Set-up screens, queries & reportTreasury
4/1/02 4/2/02 0.23 wks
255 Report und Variantenauswahl 4/1/02 4/2/02 0.23 wks
256 Reporting 4/1/02 4/2/02 0.23 wks
257 Define report headings 4/1/02 4/2/02 0.23 wks
258 Set-up screens, queries & report HumanResources
4/1/02 4/2/02 0.23 wks
259 Screen control 4/1/02 4/2/02 0.23 wks
260 Fast entry screens 4/1/02 4/2/02 0.23 wks
'02 '03 '04 '05 '06 '07 '08 '092002 2003 2004 2005 2006 2007 2008 2009

ID Name Start Finish Duration Deliverable261 Entry screens 4/1/02 4/2/02 0.23 wks
262 Build / modify existing non-ERP applicationsoftware
2/12/02 2/13/02 0.23 wks
'02 '03 '04 '05 '06 '07 '08 '092002 2003 2004 2005 2006 2007 2008 2009

ID Name Start Finish Duration Deliverable263 Readiness & Rollout 6/27/95 6/5/03 414.55 wks
264 Create Production Environment 6/27/95 2/5/01 292.88 wks
265 Review technical environment and planproduction ERP system installation
6/27/95 1/30/01 291.98 wks
266 Review planned technical solution 6/27/95 1/8/01 288.98 wks
267 Investigate technical environment 1/9/01 1/9/01 0.78 days
268 Establish options and recommendations 1/9/01 1/16/01 0.88 wks
269 Revise the approach / Technical Plan 1/16/01 1/17/01 0.88 days
270 Review and agree Technical Plan 1/17/01 1/30/01 1.75 wks Technical Plan
271 Implement 'live' ERP client systems -hardware/software
1/30/01 1/31/01 0.23 wks
272 Implement live communications & network 1/31/01 2/1/01 0.23 wks
273 Implement 'live' ERP server systems -hardware / software / database
2/1/01 2/2/01 0.23 wks
274 Set up, transport and verify liveconfiguration
2/2/01 2/5/01 0.23 wks
275 Set up documentation and procedures 6/29/00 2/11/03 136.7 wks
276 Prepare and instigate operators' instructions,procedures and manual
2/5/01 3/26/01 7 wks
277 Design and agree processing approach 2/5/01 2/22/01 2.63 wks
278 Define Backup, Recovery, Restore,Re-organization procedures
2/5/01 2/16/01 1.75 wks
279 Define archiving and off-site backupprocedures
2/5/01 2/16/01 1.75 wks
280 Review, update and test DisasterRecovery Procedure
2/5/01 2/22/01 2.63 wks
281 Define Report Distribution methodsand procedures
2/5/01 2/16/01 1.75 wks
282 Define security and access controls andprocedures
2/5/01 3/1/01 3.5 wks
'95 '96 '97 '98 '99 '00 '01 '021995 1996 1997 1998 1999 2000 2001 2002

ID Name Start Finish Duration Deliverable283 Document Operators procedures 2/5/01 3/26/01 7 wks Ops Manual / Documentation
284 Prepare and instigate User Procedures andUser Manual / electronic information
3/26/01 5/1/01 5.25 wks
285 System Control 3/26/01 4/6/01 1.75 wks
286 Coding structures 3/26/01 5/1/01 5.25 wks
287 Prepare and instigate User Proceduresand User Manual/Electronic
3/26/01 3/27/01 0.23 wks
288 G/L Accounting 3/26/01 3/27/01 0.23 wks
289 Extended general ledger 3/26/01 3/27/01 0.23 wks
290 Menu-Driven report generator 3/26/01 3/27/01 0.23 wks
291 Accounts receivable 3/26/01 3/27/01 0.23 wks
292 Information system 3/26/01 3/27/01 0.23 wks
293 Accounts payable 3/26/01 3/27/01 0.23 wks
294 Information system 3/26/01 3/27/01 0.23 wks
295 Consolidation functions 3/26/01 3/27/01 0.23 wks
296 PC Data entry 3/26/01 3/27/01 0.23 wks
297 Cash management and forecast 3/26/01 3/27/01 0.23 wks
298 Electronic Banking 3/26/01 3/27/01 0.23 wks
299 Central financial budgeting andfinancial resources management
3/26/01 3/27/01 0.23 wks
300 Inter-company businesstransactions
3/26/01 3/27/01 0.23 wks
301 Business area accounting 3/26/01 3/27/01 0.23 wks
302 Account interest calculation(interest scale)
3/26/01 3/27/01 0.23 wks
'01 '02 '03 '04 '05 '06 '07 '082001 2002 2003 2004 2005 2006 2007 2008

ID Name Start Finish Duration Deliverable303 Prepare and instigate User Procedures
and User Manual/Electronic3/26/01 3/27/01 0.23 wks
304 Management of investmentprojects
3/26/01 3/27/01 0.23 wks
305 Tax depreciation simulation -basic functions
3/26/01 3/27/01 0.23 wks
306 Assets Accounting - basicfunctions
3/26/01 3/27/01 0.23 wks
307 Prepare and instigate User Proceduresand User Manual/Electronic
3/26/01 3/27/01 0.23 wks
308 Cost element accounting 3/26/01 3/27/01 0.23 wks
309 Cost center accounting 3/26/01 3/27/01 0.23 wks
310 Planning of functionaldependencies
3/26/01 3/27/01 0.23 wks
311 Basic functions 3/26/01 3/27/01 0.23 wks
312 Unit costing 3/26/01 3/27/01 0.23 wks
313 Open-item management 3/26/01 3/27/01 0.23 wks
314 Settlement 3/26/01 3/27/01 0.23 wks
315 Information system 3/26/01 3/27/01 0.23 wks
316 Activity and allocation bases 3/26/01 3/27/01 0.23 wks
317 Product Costing 3/26/01 3/27/01 0.23 wks
318 Product costing analysis 3/26/01 3/27/01 0.23 wks
319 Product cost controlling 3/26/01 3/27/01 0.23 wks
320 Executive Information System -Management data base
3/26/01 3/27/01 0.23 wks
321 Executive Information SystemData presentation
3/26/01 3/27/01 0.23 wks
322 Prepare and instigate User Proceduresand User Manual/Electronic
3/26/01 3/27/01 0.23 wks
'01 '02 '03 '04 '05 '06 '07 '082001 2002 2003 2004 2005 2006 2007 2008

ID Name Start Finish Duration Deliverable323 Material master record 3/26/01 3/27/01 0.23 wks
324 Vendor master record(purchasingfunctions)
3/26/01 3/27/01 0.23 wks
325 Classification 3/26/01 3/27/01 0.23 wks
326 Document management 3/26/01 3/27/01 0.23 wks
327 Link to graphic subsystems 3/26/01 3/27/01 0.23 wks
328 Basic Purchasing Functions 3/26/01 3/27/01 0.23 wks
329 Contracts/delivery schedulingagreements
3/26/01 3/27/01 0.23 wks
330 Quota agreements 3/26/01 3/27/01 0.23 wks
331 Subcontract order processing 3/26/01 3/27/01 0.23 wks
332 Vendor evaluation 3/26/01 3/27/01 0.23 wks
333 Purchasing information system 3/26/01 3/27/01 0.23 wks
334 Goods Receipt 3/26/01 3/27/01 0.23 wks
335 Inventory management 3/26/01 3/27/01 0.23 wks
336 Physical inventory 3/26/01 3/27/01 0.23 wks
337 Interface for inventory sampling 3/26/01 3/27/01 0.23 wks
338 Inventory sampling 3/26/01 3/27/01 0.23 wks
339 Inventory controlling 3/26/01 3/27/01 0.23 wks
340 Basic invoice verificationfunctions
3/26/01 3/27/01 0.23 wks
341 Balance sheet valuation procedure 3/26/01 3/27/01 0.23 wks
342 Link to EDI Interface 3/26/01 3/27/01 0.23 wks
'01 '02 '03 '04 '05 '06 '07 '082001 2002 2003 2004 2005 2006 2007 2008

ID Name Start Finish Duration Deliverable343 Prepare and instigate User Procedures
and User Manual/Electronic3/26/01 3/27/01 0.23 wks
344 Basic component for inspectionmanagement
3/26/01 3/27/01 0.23 wks
345 Master data and inspectionplanning
3/26/01 3/27/01 0.23 wks
346 Feature-specific inspection resultsrecording
3/26/01 3/27/01 0.23 wks
347 Prepare and instigate User Proceduresand User Manual/Electronic
3/26/01 3/27/01 0.23 wks
348 Organization and Planning 3/26/01 3/27/01 0.23 wks
349 Elementary job, position andworkplace description
3/26/01 3/27/01 0.23 wks
350 HR Plan connection for ERPstructure graphics
3/26/01 3/27/01 0.23 wks
351 ERP structure Graphics for UNIX 3/26/01 3/27/01 0.23 wks
352 Qualifications/Requirements 3/26/01 3/27/01 0.23 wks
353 External training administration 3/26/01 3/27/01 0.23 wks
354 Education and trainingadministration
3/26/01 3/27/01 0.23 wks
355 Room reservation planning 3/26/01 3/27/01 0.23 wks
356 Career and succession planning 3/26/01 3/27/01 0.23 wks
357 Personnel cost planning 3/26/01 3/27/01 0.23 wks
358 Personnel master dataadministration
3/26/01 3/27/01 0.23 wks
359 Interface for international payrollaccounting
3/26/01 3/27/01 0.23 wks
360 Time data administration 3/26/01 3/27/01 0.23 wks
361 Attendance times 3/26/01 3/27/01 0.23 wks
362 Individual incentive wages (dataentry / calculation)
3/26/01 3/27/01 0.23 wks
'01 '02 '03 '04 '05 '06 '07 '082001 2002 2003 2004 2005 2006 2007 2008

ID Name Start Finish Duration Deliverable363 Group incentive wages (data entry
/ calculation)3/26/01 3/27/01 0.23 wks
364 Travel expenses (basic version) 3/26/01 3/27/01 0.23 wks
365 Travel expense supplements forinternational implementations
3/26/01 3/27/01 0.23 wks
366 Cost distribution for one businesstrip
3/26/01 3/27/01 0.23 wks
367 Common payroll elements 3/26/01 3/27/01 0.23 wks
368 Automatic processing ofgarnishments of wages (Germany)
3/26/01 3/27/01 0.23 wks
369 Calculation of statutory sick payand statutory maternity pay (GB)
3/26/01 3/27/01 0.23 wks
370 Limited master data 3/26/01 3/27/01 0.23 wks
371 Limited payroll basis 3/26/01 3/27/01 0.23 wks
372 Prepare and instigate User Proceduresand User Manual/Electronic
3/26/01 3/27/01 0.23 wks
373 Connection to optical archivingsystem
3/26/01 3/27/01 0.23 wks
374 Message control - extendedfunctions
3/26/01 3/27/01 0.23 wks
375 ERP Office basic functions (ERPmail, ERP file, ERP find)
3/26/01 3/27/01 0.23 wks
376 ERP Office - external sending 3/26/01 3/27/01 0.23 wks
377 ERP access 3/26/01 3/27/01 0.23 wks
378 Basis EDI interface 3/26/01 3/27/01 0.23 wks
379 Prepare and instigate User Proceduresand User Manual/Electronic
3/26/01 3/27/01 0.23 wks
380 ERP printer drivers 3/26/01 3/27/01 0.23 wks
381 Basic communications functions 3/26/01 3/27/01 0.23 wks
382 Communication module forconnection to external systems
3/26/01 3/27/01 0.23 wks
'01 '02 '03 '04 '05 '06 '07 '082001 2002 2003 2004 2005 2006 2007 2008

ID Name Start Finish Duration Deliverable383 Connection of ERP to external
systems3/26/01 3/27/01 0.23 wks
384 ERP comm basic function 3/26/01 3/27/01 0.23 wks
385 Extended function library forapplications
3/26/01 3/27/01 0.23 wks
386 Translation tool,terminology/glossary, database
3/26/01 3/27/01 0.23 wks
387 Function modules for integrationof optical storage and document
3/26/01 3/27/01 0.23 wks
388 ERP-COMM Development library 3/26/01 3/27/01 0.23 wks
389 Development library for TCP/IPtransport protocol for AIX
3/26/01 3/27/01 0.23 wks
390 On-line tool information model 3/26/01 3/27/01 0.23 wks
391 Agree user procedures anddocumentation
3/26/01 4/12/01 2.63 wks Procedures / documentation & signoff
392 Set up / revise and agree communicationsplan
5/1/01 5/14/01 1.75 wks Communications Plan
393 Implement change management program 5/14/01 2/11/03 91.25 wks
394 Define the change managementroll-out organization
5/14/01 6/7/01 3.5 wks
395 Build and maintain sponsorship 6/7/01 5/28/02 50.75 wks
396 Identify, brief and educate full changemanagement roll-out support team
5/28/02 6/11/02 2 wks
397 Project team support for ChangeManagement process
6/11/02 2/11/03 35 wks
398 Prepare & distribute tools and materialsfor supporting the roll-out
5/14/01 12/26/01 32.38 wks
399 Plan, prepare and conduct user andmanagement training and education
6/29/00 11/13/01 71.7 wks
400 Training Needs Analysis 6/29/00 7/24/00 3.5 wks Profile Matrix
401 Training Approach 7/24/00 8/17/00 3.5 wks Training Approach
402 Devise and plan training program 8/17/00 9/5/00 2.63 wks Outline specs
'00 '01 '02 '03 '04 '05 '06 '072000 2001 2002 2003 2004 2005 2006 2007

ID Name Start Finish Duration Deliverable403 Develop training courses and materials 5/1/01 8/7/01 14 wks Courses & materials
404 Mobilize trainers 5/1/01 7/13/01 10.5 wks Schedules
405 Set up training environments 5/1/01 7/13/01 10.5 wks Training Environment
406 Invite and prepare attendees 8/7/01 9/25/01 7 wks Invites / advance prep
407 Deliver training and monitorattendance
9/25/01 11/13/01 7 wks Training + log
408 Devise and handover post-liveeducation and training
8/7/01 8/31/01 3.5 wks Post-live training schedule
409 Plan, prepare and conduct operationstraining
12/25/00 2/23/01 8.75 wks
410 Operations - Training Needs Analysisand Approach
12/25/00 1/5/01 1.75 wks Operations Training Approach
411 Develop operations training programand materials
1/5/01 1/18/01 1.75 wks Ops courses & materials
412 Plan, schedule, invite, conduct andmonitor operations training
1/18/01 2/23/01 5.25 wks Ops training
413 Plan, prepare and conduct support stafftraining
11/13/01 1/28/02 10.83 wks
414 Support staff Training Needs Analysisand approach
11/13/01 11/28/01 9.63 days Support Training Approach IP
415 Develop support staff training programand materials
11/28/01 12/13/01 9.63 days Support training materials
416 Plan, schedule, invite, conduct andmonitor support staff training
12/13/01 1/28/02 28.88 days Support training
417 Verify System 6/23/00 12/18/02 129.6 wks
418 Plan, prepare and conduct User / System /Acceptance and Integration testing
6/23/00 8/14/01 59.31 wks
419 Review needs and requirements fortesting and acceptance
6/23/00 7/6/00 1.75 wks
420 Identify and assess options 6/30/00 7/12/00 1.75 wks
421 Agree approach to testing andacceptance
7/6/00 7/19/00 1.75 wks
422 Detail Testing Approach 7/19/00 7/31/00 1.75 wks Testing Approach
'00 '01 '02 '03 '04 '05 '06 '072000 2001 2002 2003 2004 2005 2006 2007

ID Name Start Finish Duration Deliverable423 Agree Testing Approach 8/14/00 8/21/00 0.88 wks
424 Prepare individual Test Objectives 8/21/00 8/31/00 1.75 wks Test Objectives
425 Prepare test detailed definitions andexpected results
12/12/00 3/30/01 15.75 wks Test Definitions
426 Prepare testing environment 3/30/01 4/25/01 3.5 wks Test Environment
427 Conduct test cycles 4/25/01 5/31/01 5.25 wks Test Log / Incident Reports & log
428 Review results and control remedialactions
5/31/01 7/6/01 5.25 wks Incident control
429 Review and accept results 7/6/01 8/14/01 5.25 wks Sign off
430 Plan, prepare and conduct technical tuningand volume testing
9/23/02 12/4/02 10.5 wks
431 Review requirements for technicaltesting
9/23/02 10/3/02 1.75 wks
432 Assess options for Technical Testing 9/23/02 10/3/02 1.75 wks
433 Agree approach to Technical Testing 9/23/02 10/3/02 1.75 wks
434 Define detail of technical testingapproach
9/23/02 10/3/02 1.75 wks
435 Agree Technical Testing 9/23/02 9/27/02 0.88 wks Technical Tuning & Testing
436 Prepare testing environment(s) 9/23/02 10/3/02 1.75 wks Technical Environment
437 Define tests 9/23/02 12/4/02 10.5 wks Test Objectives
438 Prepare test data 9/23/02 10/29/02 5.25 wks Test Definitions
439 Conduct test runs 9/23/02 11/11/02 7 wks Logs / Incident Reports
440 Tune System 9/23/02 11/11/02 7 wks
441 Review results and accept technicalperformance
9/23/02 11/4/02 6.13 wks Test sign off
442 Evaluate testing and report results 12/4/02 12/18/02 2 wks
'00 '01 '02 '03 '04 '05 '06 '072000 2001 2002 2003 2004 2005 2006 2007

ID Name Start Finish Duration Deliverable443 Rollout 9/23/02 6/5/03 36.75 wks
444 Define, plan and agree handover / cutover 9/23/02 10/10/02 2.63 wks
445 System handover - needs &requirements
9/23/02 10/10/02 2.63 wks
446 System handover options andrecommendations
9/23/02 10/3/02 1.75 wks
447 System handover detailed plan 9/23/02 10/3/02 1.75 wks
448 Review and agree System handover 9/23/02 10/3/02 1.75 wks System handover IP
449 Define and agree terms of reference for liveuser support activity
9/23/02 10/16/02 3.5 wks
450 Requirements for live admin & support 9/23/02 10/3/02 1.75 wks
451 Options and recommendations 9/23/02 10/3/02 1.75 wks
452 Detailed approach, organization andstaffing for live admin & support
9/23/02 10/16/02 3.5 wks
453 Agree System Support andAdministration
9/23/02 10/3/02 1.75 wks System Support & Admin
454 Acquire and start support team staff 9/23/02 10/16/02 3.5 wks
455 Plan and instigate phased transition to liveoperation and support and phasing out of
9/23/02 10/29/02 5.25 wks
456 Devise and agree Transition Plan 9/23/02 10/3/02 1.75 wks Transition Plan
457 Transition / shared support of thesystem
9/23/02 10/29/02 5.25 wks
458 Sign off end of Project Team support 9/23/02 9/24/02 0.88 days Transition sign off
459 Establish conversion environment 9/23/02 9/30/02 1 wk
460 Load start up data 9/23/02 6/5/03 36.75 wks
461 Data validation & purification 9/23/02 6/5/03 36.75 wks Clean data
462 Manual Data Loading 9/23/02 9/27/02 0.88 wks Data Load
'02 '03 '04 '05 '06 '07 '08 '092002 2003 2004 2005 2006 2007 2008 2009

ID Name Start Finish Duration Deliverable463 Automated Data Conversion &
Loading9/23/02 9/27/02 0.88 wks Data Load
464 Acceptance of start up data 9/23/02 10/10/02 2.63 wks
465 Define validation processes, tests andcontrols
9/23/02 10/10/02 2.63 wks Test Definitions
466 Validate data and controls 9/23/02 9/27/02 3.5 days Logs
467 Apply manual corrections / rerun /revalidate as required
9/23/02 9/27/02 0.88 wks
468 Accept start up data 9/23/02 9/24/02 0.88 days Sign off
469 Conduct final operations review 9/23/02 9/24/02 0.23 wks
470 Conduct final production / data controlreview
9/23/02 9/24/02 0.23 wks
471 Conduct final user review 9/23/02 9/24/02 0.23 wks
472 Decision to go live 9/23/02 9/24/02 0.88 days Decision to go live
473 Early care 9/23/02 9/24/02 0.23 wks
'02 '03 '04 '05 '06 '07 '08 '092002 2003 2004 2005 2006 2007 2008 2009

ID Name Start Finish Duration Deliverable474 Quality Audit 6/5/03 6/19/03 1.96 wks
475 Check deliverables against QA checklist 6/5/03 6/12/03 0.88 wks Deliverables checklist / CAR(Corrective Action Requests) & log
476 Check required work against project tracking data 6/12/03 6/18/03 0.88 wks Processes checklist / CAR(Corrective Action Requests) & Log
477 QA signoff 6/18/03 6/19/03 0.88 days QA Sign off
'03 '04 '05 '06 '07 '08 '09 '102003 2004 2005 2006 2007 2008 2009 2010

ID Name Start Finish Duration Deliverable478 Terminate Project 6/19/03 10/2/03 14.88 wks
479 Identify / confirm new roles for all project staff 6/19/03 10/2/03 14.88 wks Appraisals / Organigrammes / Jobs
480 File / archive materials, correspondence etc 6/19/03 7/21/03 4.38 wks Demobilization Plan IP
481 Return / redeploy accommodation and equipmentetc
6/19/03 7/8/03 2.63 wks
482 Prepare Project Completion Report 6/19/03 7/2/03 1.75 wks Project Completion Report / Letter
483 Collate / prepare Work Books and Owner'sManual
6/19/03 7/2/03 1.75 wks Work Book(s) & Owners Manual
'03 '04 '05 '06 '07 '08 '09 '102003 2004 2005 2006 2007 2008 2009 2010

Business Case Study Appendix E—Research Documents
Draft Final ReportPage E-1 kpmg
Appendix E—Research DocumentsLAS/PBS
Executive Summary, The Plan for the Redesign of the LAS/PBS, OPB Systems Design and Development
Executive Summary, Option Assessment for the Redesign of the LAS/PBS, OPB Systems Design and Development
Executive Summary, Users' Needs Assessment for the Redesign of the LAS/PBS, OPB Systems Design andDevelopment
The Revised Plan for the Redesign of the LAS/PBS, OPB Systems Design and Development
Option Assessment for the Redesign of the LAS/PBS, OPB Systems Design and Development
Users' Needs Assessment for the Redesign of the LAS/PBS, OPB Systems Design and Development
Primary Functions Supported by LAS/PBS
Functional Requirements
State of Florida Legislative Budget Request Instructions Fiscal Year 2000-2001, EOG, OPB (LBRI)
State Budgeting Overview
Interview Questionnaires
System Design and Development Operational and Organizational Chart
Current LAS/PBS platform
LAS/PBS primary data entities stored
Flow Chart-budget request process
LAS/PBS data dictionary listing 1997-1998
Chapter 216, Florida Statutes (1999)
Functional Quality Questionnaires September 1999
CMA
Chart-Bureau of Banking functions
ACH project with Infinity Software Development description
Florida Treasury web site description
Listing of Interfaces with non-FFMIS systems 1999
Florida Electronic Data Interchange-survey of the states, state of Florida response
AS400 Client Server-table/view listing for Treasury apps
Receipt Verification System (RVS) compiled 1999
Receipt Verification System (RVS): application description
Receipt Verification System (RVS): primary data entities sorted
Receipt Verification System (RVS): item counts
Receipt Verification System (RVS): system application field types
Receipt Verification System (RVS): file descriptions
Receipt Verification System (RVS): program/module listing
Receipt Verification System (RVS): tutorial
Receipt Verification System (RVS): site information file
Receipt Verification System (RVS): office codes report

Business Case Study Appendix E—Research Documents
Draft Final ReportPage E-2 kpmg
CMA
Receipt Verification System (RVS): treasurer's concentration account
Receipt Verification System (RVS): daily reports
Receipt Verification System (RVS): daily reports issued to agencies through network
Receipt Verification System (RVS): BAI list
Receipt Verification System (RVS): currency codes
Account Reconciliation System (ARS) compiled 1999
Account Reconciliation System (ARS): application description
Account Reconciliation System (ARS): daily reports
Account Reconciliation System (ARS): monthly reports
Consolidated Revolving Account System (CRA) compiled 1999
Consolidated Revolving Account System (CRA): application description
Consolidated Revolving Account System (CRA): system application field types
Consolidated Revolving Account System (CRA): item counts
Consolidated Revolving Account System (CRA): CRA VB to Access documentation
Consolidated Revolving Account System (CRA): consolidated revolving account BIA v2
Consolidated Revolving Account System (CRA): primary data entities stored
Consolidated Revolving Account System (CRA): Daily reports
Consolidated Revolving Account System (CRA): reconciled monthly bank statement
EFT Return Items-Dept of Revenue EFT Account compiled 1999
EFT Return Items-Dept of Revenue EFT Account: application description
EFT Return Items-Dept of Revenue EFT Account: primary data entities stored
EFT Return Items-Dept of Revenue EFT Account: RVS EFT Returned Items access application description/tutorial
EFT Return Items-Dept of Revenue EFT Account: ris.mdb MS Access database description
EFT Return Items-Dept of Revenue EFT Account: RVSR codes
EFT Return Items-Dept of Revenue EFT Account: data element description
EFT Return Items-Dept of Revenue EFT Account: daily reports
Clearing Account System compiled 1999
Clearing Account System: application description
Clearing Account System: system application field types
Clearing Account System: quarterly report
Receipt verification process (REC) and FLAIR-Processes and verifies state agency deposits compiled 1999
Receipt verification process (REC) and FLAIR: process description
Receipt verification process (REC) and FLAIR: process description chart
Receipt verification process (REC) and FLAIR: list of primary data entities sorted
Receipt verification process (REC) and FLAIR: application description-REC Daily Receipts System
Receipt verification process (REC) and FLAIR: field types
Receipt verification process (REC) and FLAIR: various reports
Debit Memorandum and Manual Receipt Process (REC)-processing of return checks, EFTs , and manualTreasurer's receipts compiled 1999
Debit Memorandum and Manual Receipt Process (REC): process description
Debit Memorandum and Manual Receipt Process (REC): primary data entities stored

Business Case Study Appendix E—Research Documents
Draft Final ReportPage E-3 kpmg
CMA
Debit Memorandum and Manual Receipt Process (REC): app screenshots-AS400 Manual TRs, Memos andAdjustments
Debit Memorandum and Manual Receipt Process (REC): app screenshots-chargebacks in MS Access
Debit Memorandum and Manual Receipt Process (REC): app screenshots-EFT Returns processing
Debit Memorandum and Manual Receipt Process (REC): reports
State Warrant Paying Process (WRT)-payment of state warrants issued by the office of the controller compiled 1999
State Warrant Paying Process (WRT): description of paying of state warrant process
State Warrant Paying Process (WRT): primary data entities sorted
State Warrant Paying Process (WRT): WRT process chart
State Warrant Paying Process (WRT): warrant system notes (description, tables, views)
State Warrant Paying Process (WRT): application field types
State Warrant Paying Process (WRT): reports
Accounting for Investment Inventory (CAMRA)-process investment transactions and interest activity compiled 1999
Accounting for Investment Inventory (CAMRA): process description
Accounting for Investment Inventory (CAMRA): primary data entities sorted
Accounting for Investment Inventory (CAMRA): application description
Accounting for Investment Inventory (CAMRA): daily reports
Accounting for Investment Inventory (CAMRA): monthly reports
Investment Fund Accounting and Interest Allocation (INV) compiled 1999
Investment Fund Accounting and Interest Allocation (INV): process description
Investment Fund Accounting and Interest Allocation (INV): primary data entities sorted
Investment Fund Accounting and Interest Allocation (INV): field types
Investment Fund Accounting and Interest Allocation (INV): application description-TRS (Transfer Transactions)system
Investment Fund Accounting and Interest Allocation (INV): reports
Certificate of Deposit Placement Program (TDI) compiled 1999
Certificate of Deposit Placement Program (TDI): process description
Certificate of Deposit Placement Program (TDI): primary data entities sorted
Certificate of Deposit Placement Program (TDI): application description
Certificate of Deposit Placement Program (TDI): reports
Demand Accounts (Treasury Bank Ledger) (DEM) compiled 1999
Demand Accounts (Treasury Bank Ledger) (DEM): process description
Demand Accounts (Treasury Bank Ledger) (DEM): primary data entities stored
Demand Accounts (Treasury Bank Ledger) (DEM): field types
Demand Accounts (Treasury Bank Ledger) (DEM): reports generated
State Fund Accounting (BGA) compiled 1999
State Fund Accounting (BGA): description
State Fund Accounting (BGA): primary data entities stored
State Fund Accounting (BGA): application description
State Fund Accounting (BGA): field types
State Fund Accounting (BGA): reports

Business Case Study Appendix E—Research Documents
Draft Final ReportPage E-4 kpmg
CMA
Liquidation of Investments Process (DIS) compiled 1999
Liquidation of Investments Process (DIS): application description
Liquidation of Investments Process (DIS): primary data entities stored
Liquidation of Investments Process (DIS): field types
Liquidation of Investments Process (DIS): journal transfers
Cash management procedures manual
Functional Quality Questionnaires
FLAIR
Central Accounting Functions Overview
FLAIR Payroll Functions
Questionnaires
Staff Chart
Comtroller's Data Communication Network Diagram
Hardware description
Entity Diagrams
List of data entities stored
Comprehensive description of central accounting reports
Department of accounting standard reports
Transaction counts by month
Comprehensive listing of payroll reports
Data received by agency
Data interfaces by file/agency
Approved batch input by agency
Central accounting data interfaces by file/agency
Comprehensive description of central accounting reports
Notes on Wakulla Springs Meeting, May 18, 1999, discussions of current projects
Complete file listing by name-database formats
Designation of Information Security Personnel-policy
Terminal Devices, data communications services, and access requests-policy
Office of Comptroller, Department of Banking and Finance, Agency Strategic Plan 2000-2005
Procedures Manual, State Automated Management Accounting Subsystem (includes functions, chart of accounts,report requests)
Invoice Tracking (IT) through EDI Approval and Distribution Manual
Purchasing Card Agency Approval and Distribution Manual
Property Manual, State Automated Management Accounting Subsystem
Contract and Grants Manual, State Automated Management Accounting Subsystem
Functional Quality Questionnaires
Application Inventory
Report on number of Warrants & EFTs for Fiscal Year 98/99

Business Case Study Appendix E—Research Documents
Draft Final ReportPage E-5 kpmg
FLAIR
Application Technology Quality Questionnaire
COPES
COPES system functions
Interview Questionnaire COPES
Platform description
Primary data entities stored
Listing of COPES and COPESview reports
Current database schema
COPES Users Manual (HR)
Functional Quality Questionnaires
SPURS
Interview Questionnaire SPURS
Functional Quality Questionnaires
SPURS Purchasing Manual
FFMIS Integrated Human Resources Payroll Project
HR/PAYROLL Manual-Book 1
HR/PAYROLL Manual-Book 2
HR/PAYROLL Manual-Book 3
HR/PAYROLL Manual-Book 4
BPR
Florida Department of Transportation; Financial Management System, Volume I, WPA Users Manual
KPMG; Modernization of State Government Financial Management Business Case Analysis Study;Communications Plan–August 1999
Florida Department of Transportation; Financial Management System; Project Cost Management (PCM)
Florida Department of Transportation; on-line SF37 System; Users Manual–February 1998
Florida Information Resource Management System (FLAIR) Modules
Budget Module
Revenue and Receipt Module
Individuals and Organizations Index Module
Purchasing and Contracting Module
Client Benefits Module
Personnel/Payroll and Employee Benefits Modules
Miscellaneous Encumbrances and Expenditures Module
Disbursements Module

Business Case Study Appendix E—Research Documents
Draft Final ReportPage E-6 kpmg
BPR
Fixed Assets Module
Florida Department of Transportation; Financial Management System–Federal Programs Management, UsersManual–January 1998
Florida Department of Transportation; Payroll Processing System, Users Manual
State of Florida FLAIR Transaction Listing, Property Manual
State University System of Florida; Annual IRM Report–Fiscal Year 1997/98
State of Florida Human Resources and Payroll Index System Implementers
State University System of Florida–Payroll Processing Index
Global Networked Business Approach and Architecture
University of Florida; Budget Transfers and Conversions
University of Florida; Managing Your US Budget
State University System of Florida; 1999–2000 Allocations Summary and Workpapers
University of Florida; University Property Services–Users Manual and Operating Procedures
University of Florida; University Disbursement Services
Department of Transportation; Work Program Instruction
Department of Transportation; 2020 Florida Transportation Plan
Department of Transportation; Work Program-Finance and Budget Overview
Department of Transportation; Developing the Work Program
Department of Transportation; Florida Interstate Highway System
Department of Transportation; Financial Plans for State Transportation Trust Fund
Department of Transportation; Cash Forecast Report
Department of Transportation; Program and Resource Plan
Department of Transportation; State Planning and Research Program
Department of Transportation; 1998 Comprehensive Annual Financial Report
Department of Transportation; Florida’s Tentative Five Year Work Program
Department of Transportation; Annual Performance Report
Department of Transportation; Contract Funds Management Manual
Department of Transportation; Executive Committee Meetings
Department of Transportation; Performance and Production Review
Department of Children and Families; Vouchering-General Procedures
Department of Children and Families; Official Travel of Staff Employees and Non-Employees
Department of Insurance and Treasurer; Internal Policies and Procedures
Department of Highway Safety and Motor Vehicles; Briefing Book, Making Highways Safe Through Service,Education and Enforcement
Florida Highway Patrol; Traffic Homicide Investigations
Florida Highway Patrol; Bureau of Investigation, 1998 Annual Report
Florida Highway Patrol; 1998 Annual Uniform Crime Report and Offense and Arrest Summary
Florida Highway Patrol; Contraband Interdiction Program, 1998 Annual Report
Florida Highway Patrol; Pre-Employment, Written Testing and Applicant Processing, 1997-99
Florida Highway Patrol; Final Report, Staff Inspection
Department of Highway Safety and Motor Vehicles; Agency Strategic Plan, SFY 2000-05
Department of Highway Safety and Motor Vehicles; Revenue Report, 1997-98

Business Case Study Appendix E—Research Documents
Draft Final ReportPage E-7 kpmg
BPR
Department of Highway Safety and Motor Vehicles; Quarterly Report, April to June 1999
Department of Highway Safety and Motor Vehicles; Legislative Budget Request
Department of Highway Safety and Motor Vehicles; Agency Capital Improvements Program, SFY 2000-05
University of Florida; Domestic Travel Workshop
University of Florida; Disbursement Services, Introduction to T.R.R.I.P.S.
Automated Collection System of Delinquent Accounts Receivable, State of Kansas,http://da.state.ks.us/ar/setoff/overview.htm, 9/10/1999.
Small Purchase Order Transaction System (SPOTS), State of Oregon, http://scd.das.state.or.us/spots.htm,9/15/1999.
On-line Fixed Asset Inventory System, State of North Dakota, 7/1999.
Gelco Travel Manager, Colorado State University, U.S. Department of Defense, Gelco Government Network,9/15/1999.
Sam II HR/Payroll, State of Missouri, http://www.state.mo.us/mo/samii, 9/14/1999.
UW Online, University Online Administrative Systems, University of Washington,http://www.washington.edu/admin/adminsystems/INTRO.htm, 9/23/1999.
Mississippi Management and Reporting System (MMRS), State of Mississippi, http://www.mmrs.state.ms.us,9/13/1999.
California State Accounting and Reporting System, (CALSTARS), California Department of Finance,http://www.dof.ca.gov/html/calstars/backgrnd.htm, 9/24/1999.
What’s new in the Fed EC, Federal Electronic Commerce Program Office, http://ec.fed.gov/bestprac/index.htm,10/12/1999.
Enterprise Kentucky–Emerging Technologies, State of Kentucky,http://www.state.ky.us/agencies/emgtech/index.htm, 10/12/1999.
“The Check is in the E-Mail”, Todd Newcombe, Government Technology,http://www.govtech.net/publications/eCommerce/Mar99/checkmail/checkmail.shtm, March 1999.
“Minnesota Treasurer: Managing the State’s Money”, State of Minnesota’s Web Site,http://www.state.mn.us/ebranch/treas/question/invest/manage.htm, 9/13/1999.
SAM-State Accounting System on-line documentation, State of Nevada, http://www.clan.lib.nv.us, 9/14/1999.
State of Utah Accounting Policies and Procedures, Federal Revenues, Revenues–FIACCT 07, State of Utah,7/1/1998.
Statewide Employee Management System (SEMA4), State of Minnesota,www.finance.state.mn.us/agencyapps/sema4, 9/13/1999.
Quality Assurance Office Homepage, State of Ohio, www.state.oh.us/das/dhr/qualassur.html, 9/14/1999.
Internal Control Guide, Commonwealth of Massachusetts, Office of State Comptroller,www.state.ma.us/osc/Homeview/CONTROL/asest2.htm, 1998.
Florida International University Operations Analysis and Management Review-Purchasing Department-FinalReport, Management of America, Inc, Tallahassee, Florida, August 27, 1997.
Florida International University Operations Analysis and Management Review-Human Resources Office-FinalReport, Management of America, Inc., Tallahassee, Florida, August 27, 1997.
Florida International University Operations Analysis and Management Review-Controller’s Office-Final Report,Management of America, Inc., Tallahassee, Florida, August 27, 1997.
Monthly Management Report (MMR), Florida Department of Insurance, Treasurer and State Fire Marshall, Divisionof Administration, May 1999.
Unaudited Financial Statements For Fiscal Year ended June 30, 1999, State University System of Florida,June/1999.
IFMS System Prototype, Integrated Financial Management System, Interim Report, October 19, 1999.
FDOT documentation related to procurement, fiscal policies and procedures, financial reports, and management

Business Case Study Appendix E—Research Documents
Draft Final ReportPage E-8 kpmg
BPRreports.
Costing
“Patterns of Software Systems Failure and Success”, GartnerGroup, Inc., Dec. 1995.
PMI, San Diego Presentation, Artemis Management Systems, Inc., 1998.
“Economics of rewriting lost source code”, Caper Jones.
“AD Project Risk: Get a Grip”, SPA-04-8384, M. Light, GartnerGroup, Inc., 1998.
HRubin Systems, Inc., NY, 1996.
“Expected Value of Software Projects”, Hrubin Systems, Inc.
IEEE Computer, Mar. 1995.
“Updated Year 2000 Report”, Appendix F, “Initial List of Prioritized Systems by Agency”, State of Florida, 1997.
Estimating Techniques Paper – TP039, KPMG Internal, April 1998.
COCOMO 2.0 Software Cost Estimation Model, University of Southern California Center for Software Engineering.
KPMG/Client Calculation (Client Confidential).
“Is ERP Doing So Bad?”, SPA-06-9382, GartnerGroup, Inc., Feb, 1999.
Standish Group Survey quoted in Gartner Report, 1998.
“AD: A look at the Data”, GartnerGroup, March 27, 1998.
Florida Division of Retirement/KPMG Custom AD engagement
KPMG PEAT/Peoplesoft/TIMEnX integration
Office of Student Financial Services Web development
“Measuring the Software Process”, Garmus and Herron, Prentice Hall, 1996.
“Software Project Estimation – A workbook for Macro-Estimation of Software Development Effort and Duration”,International Software Benchmarking Standards Group.
“The value of AD Benchmarking”, Strategic Analysis Report, GartnerGroup, Inc., 26 Sep. 1995.
“Searching for ‘average’ Software Development Productivity”, G-05-7953, GartnerGroup, Inc., 21 Dec. 1995.
“AD Methodologies: what does the data tell us?”, GartnerGroup, Inc., 25 Feb. 1998.
“Sizing up the SDLC”, QA-05-9676, GartnerGroup, Inc., 20 Oct. 1998.
“The Benchmark, Release 5”, ISBSG, www.isbsg.org.au/bmarkr5.htm, 1999.

ID Name Start Finish Duration Deliverable1 Project Launch 4/3/00 5/22/00 7 wks
2 Review/confirm Terms of Reference (ToR),Scope, Objectives
4/3/00 4/17/00 2 wks Project Constitution
3 Review / confirm business needs and anticipatedbenefits
4/17/00 5/15/00 4 wks BNAB - Definition of business needs& anticipated benefits
4 Select Processes 4/21/00 4/25/00 1.75 days Skeleton Path Plan
5 Define and agree Project Managementtechniques.
4/27/00 5/4/00 1 wk PM Techniques
6 Define and agree change management approach(for organizational issues)
4/27/00 5/4/00 1 wk Change Management Strategy
7 Define and agree requirements for linkage withother methodologies.
4/27/00 5/4/00 1 wk Linkages
8 Define organization, people and supportrequirements
5/8/00 5/22/00 2 wks Project Organigramme and JDs
'00 '01 '02 '03 '04 '05 '06 '072000 2001 2002 2003 2004 2005 2006 2007

ID Name Start Finish Duration Deliverable9 Project Model 5/15/00 3/26/01 45 wks
10 Business Needs 6/5/00 7/12/00 5.55 wks
11 Foundation - "as-is" fact-find 6/5/00 6/28/00 3.5 wks
12 Business Vision and Objectives 6/12/00 6/29/00 2.63 wks
13 Constraints 6/30/00 7/12/00 1.75 wks
14 Business Process Design 6/23/00 8/28/00 9.18 wks
15 Business Process design needs 6/23/00 7/19/00 3.5 wks
16 Select ERP base business model templates 7/19/00 7/20/00 0.23 wks
17 Create and maintain ERP enterprise businessmodel
7/20/00 8/3/00 2 wks
18 Schedule ERP process modeling workshops 8/3/00 8/4/00 0.23 wks
19 Conduct ERP process modeling workshops 8/4/00 8/25/00 3 wks
20 Agree initial ERP enterprise business model 8/25/00 8/28/00 0.23 wks
21 System Solution & Feasibility 7/6/00 10/16/00 14.43 wks
22 Review ERP technical status 7/6/00 7/19/00 1.75 wks
23 System Vision: Outline design of the ERPsystem and business processes
7/6/00 7/25/00 2.63 wks
24 Organizational Impact 7/25/00 8/7/00 1.75 wks
25 Identify detailed requirements 8/28/00 9/21/00 3.5 wks
26 Interfacing review 8/28/00 9/8/00 1.75 wks
27 Gap Analysis - existing systems Vsrequirements
9/21/00 10/3/00 1.75 wks
28 Gap Analysis - requirements Vs ERP 10/3/00 10/16/00 1.75 wks
29 Implementation Strategy 5/15/00 3/26/01 45 wks
'00 '01 '02 '03 '04 '05 '06 '072000 2001 2002 2003 2004 2005 2006 2007

ID Name Start Finish Duration Deliverable30 Establish ERP architectural options 9/27/00 10/10/00 1.75 wks
31 Estimate costs and benefits per option 10/3/00 10/23/00 2.63 wks
32 Focus on delivery of benefits - Cost/BenefitModel
5/15/00 3/26/01 200 days
33 Collate and agree requirements report 9/27/00 10/23/00 3.5 wks
34 ERP Architecture & ImplementationStrategy
9/8/00 9/21/00 1.75 wks
'00 '01 '02 '03 '04 '05 '06 '072000 2001 2002 2003 2004 2005 2006 2007

ID Name Start Finish Duration Deliverable35 Design, Prototype & Construction 1/4/00 12/19/02 154.55 wks
36 Prepare to Prototype 1/4/00 12/19/02 154.55 wks
37 Prepare / review / agree design topics,descriptions and sign off.
10/23/00 10/26/00 3 days
38 Review technical environment and planERP installation
10/26/00 11/30/00 4.97 wks
39 Review planned technical solution 10/26/00 11/1/00 0.88 wks
40 Investigate technical environment 10/26/00 10/27/00 0.88 days
41 Collate requirements 10/26/00 11/8/00 1.75 wks
42 Establish options and recommendations 11/14/00 11/20/00 0.88 wks
43 Detail the approach / Technical Plan 11/22/00 11/23/00 0.88 days
44 Review and agree Technical Plan 11/17/00 11/30/00 1.75 wks Technical Plan
45 Install hardware, communicationsequipment, system software, and ERP
11/30/00 11/21/02 103.1 wks
46 Order/acquire equipment, provisions,services etc for Development System
11/30/00 12/25/00 3.5 wks
47 Prepare site(s) / physical environmentfor Development System
11/30/00 12/25/00 3.5 wks
48 Install & test equipment, services etcfor Development System
12/1/00 12/26/00 3.5 wks Installation sign off
49 Monitor needs for further phases ofinstallation
11/30/00 10/3/01 43.75 wks
50 Order/acquire hardware, software andservices for Live Configuration
9/23/02 10/3/02 1.75 wks
51 Prepare Site(s) for Live Configuration 11/30/00 12/25/00 3.5 wks
52 Install and test Live Configuration 10/29/02 11/21/02 3.5 wks Installation sign off(s)
53 Design and set up backup/recoveryprovisions (development & test
11/21/02 12/5/02 2 wks
54 Design and set up system security provisions 12/5/02 12/19/02 2 wks
55 Define, agree and instigate change controlprocedures
10/26/00 8/31/01 44.14 wks
'00 '01 '02 '03 '04 '05 '06 '072000 2001 2002 2003 2004 2005 2006 2007

ID Name Start Finish Duration Deliverable56 Define and agree change control
protocol10/26/00 10/30/00 1.75 days CCP (Change Control Protocol)
57 Communicate procedures to team andother people involved
10/30/00 11/1/00 1.75 days
58 Operate the Change Control Protocol 10/30/00 8/31/01 43.75 wks Change Control
59 Define and instigate Project Teamresponsibilities and techniques for technical
11/14/00 10/3/01 46.09 wks
60 Define and agree needs for support 11/14/00 11/17/00 2.63 days
61 Define and agree responsibilities 11/22/00 11/24/00 1.75 days Development Sys Admin
62 Provide support 11/30/00 10/3/01 43.75 wks
63 Issues - control, escalate, resolve 1/4/00 12/18/00 49.88 wks
64 Define and agree issue controlmechanism
1/4/00 1/10/00 0.88 wks ICP - Issues Control Protocol
65 Communicate Issues Controlmechanism to all participants
1/10/00 1/21/00 1.75 wks
66 Operate Issues Control 1/10/00 12/18/00 49 wks Issues Control
67 Plan & prepare ERP prototyping facilities 12/25/00 12/26/00 0.23 wks
68 Plan and Initiate Team Training Process 12/20/00 1/25/01 5.2 wks
69 Plan, prepare and conduct ERP and generaltraining for project participants
12/20/00 1/11/01 3.22 wks
70 Identify team's training needs 12/20/00 12/22/00 1.75 days
71 Identify options, recommendations &training plan
12/21/00 12/25/00 1.75 days Project Team Training Plan
72 Prepare training facilities and materials 12/20/00 1/2/01 1.75 wks Project Team Courses
73 Provide / attend training 12/25/00 1/11/01 2.63 wks Project Team Training
74 Team building and education 1/11/01 1/12/01 0.23 wks
75 Present approach to user community andteam
1/12/01 1/25/01 1.75 wks Briefings
'00 '01 '02 '03 '04 '05 '06 '072000 2001 2002 2003 2004 2005 2006 2007

ID Name Start Finish Duration Deliverable76 Build base model 1/25/01 4/2/01 9.45 wks
77 Select Business Processes from ERPReference Model
1/25/01 1/26/01 0.23 wks
78 Configure initial ERP system as prototypingmodel
1/26/01 1/29/01 0.23 wks
79 Build core testing data for prototyping 1/29/01 1/30/01 0.23 wks
80 Design / prototype by topic 1/25/01 4/2/01 9.45 wks
81 Define, agree and set up ERPOrganizational Structures
1/25/01 4/2/01 9.45 wks
82 Design / prototype Human Resources 1/25/01 2/14/01 2.93 wks
83 Human Resources 1/25/01 2/14/01 2.93 wks Implementation Paper forDesign/Prototype of Human
84 Master Data 1/25/01 2/1/01 1.13 wks Implementation Paper forDesign/Prototype of Master Data
85 Basic data 1/25/01 1/26/01 0.23 wks Implementation Paper forDesign/Prototype of Basic data
86 Personal data 1/26/01 1/29/01 0.23 wks Implementation Paper forDesign/Prototype of Personal data
87 Data relevant topayment
1/29/01 1/30/01 0.23 wks Implementation Paper forDesign/Prototype of Data relevant
88 Internal data 1/30/01 1/31/01 0.23 wks Implementation Paper forDesign/Prototype of Internal data
89 Planning data 1/31/01 2/1/01 0.23 wks Implementation Paper forDesign/Prototype of Planning data
90 Time Data 2/1/01 2/9/01 1.13 wks Implementation Paper forDesign/Prototype of Time Data
91 Shift schedule 2/1/01 2/2/01 0.23 wks Implementation Paper forDesign/Prototype of Shift schedule
92 Negative time rec. 2/2/01 2/5/01 0.23 wks Implementation Paper forDesign/Prototype of Negative time
93 PDC/positive t.rec. 2/5/01 2/7/01 0.23 wks Implementation Paper forDesign/Prototype of PDC/positive
94 Incentive wages 2/7/01 2/8/01 0.23 wks Implementation Paper forDesign/Prototype of Incentive wages
95 Other 2/8/01 2/9/01 0.23 wks Implementation Paper forDesign/Prototype of Other
'01 '02 '03 '04 '05 '06 '07 '082001 2002 2003 2004 2005 2006 2007 2008

ID Name Start Finish Duration Deliverable96 Travel Expenses 2/9/01 2/14/01 0.68 wks Implementation Paper for
Design/Prototype of Travel97 Environment 2/9/01 2/12/01 0.23 wks Implementation Paper for
Design/Prototype of Environment98 Options 2/12/01 2/13/01 0.23 wks Implementation Paper for
Design/Prototype of Options99 Settings 2/13/01 2/14/01 0.23 wks Implementation Paper for
Design/Prototype of Settings
'01 '02 '03 '04 '05 '06 '07 '082001 2002 2003 2004 2005 2006 2007 2008

ID Name Start Finish Duration Deliverable100 Prototype process 1/4/00 9/23/02 141.8 wks
101 Data Conversion Strategy 1/4/00 1/25/00 3.02 wks
102 Establish requirements 1/4/00 1/14/00 1.75 wks
103 Establish and evaluate options 1/10/00 1/21/00 1.75 wks
104 Agree approach(es) to Data Conversion 1/21/00 1/25/00 1.75 days Data Conversion Strategy
105 Prepare discussion papers 1/5/00 6/23/00 24.5 wks Discussion Papers
106 Set up, execute and manage ERP prototypingworkshop
1/4/00 1/5/00 0.23 wks
107 Manage, control refresh core data forprototyping
1/5/00 1/6/00 0.23 wks
108 Design\prototype by topic 1/5/00 8/14/00 31.78 wks
109 Design / prototype Financial accounting 1/5/00 2/8/00 4.95 wks
110 Financial accounting 1/5/00 2/8/00 4.95 wks Financial accounting
111 Financial Accounting 1/5/00 1/7/00 0.45 wks Financial Accounting
112 Financial Accounting projectscope
1/5/00 1/6/00 0.23 wks Financial Accounting project scope
113 Environment 1/6/00 1/7/00 0.23 wks Environment
114 Master data 1/7/00 1/13/00 0.9 wks Master data
115 Bus. transactions 1/7/00 1/10/00 0.23 wks Bus. transactions
116 Business transactions 1/10/00 1/11/00 0.23 wks Business transactions
117 Closing 1/11/00 1/12/00 0.23 wks Closing
118 Tools 1/12/00 1/13/00 0.23 wks Tools
119 Extended general ledger 1/13/00 1/24/00 1.35 wks Extended general ledger
120 Basic Data 1/13/00 1/14/00 0.23 wks Basic Data
'00 '01 '02 '03 '04 '05 '06 '072000 2001 2002 2003 2004 2005 2006 2007

ID Name Start Finish Duration Deliverable121 Planning 1/17/00 1/18/00 0.23 wks Planning
122 Actual Posting 1/18/00 1/19/00 0.23 wks Actual Posting
123 Periodic Processing 1/19/00 1/20/00 0.23 wks Periodic Processing
124 Reporting 1/20/00 1/21/00 0.23 wks Reporting
125 Tools 1/21/00 1/24/00 0.23 wks Tools
126 Consolidation 1/24/00 2/2/00 1.35 wks Consolidation
127 Master records 1/24/00 1/25/00 0.23 wks Master records
128 Individual financial statementdata
1/25/00 1/26/00 0.23 wks Individual financial statement data
129 Currency translation 1/26/00 1/27/00 0.23 wks Currency translation
130 Posting documents 1/28/00 1/31/00 0.23 wks Posting documents
131 Consolidation 1/31/00 2/1/00 0.23 wks Consolidation
132 Corporate standard report 2/1/00 2/2/00 0.23 wks Corporate standard report
133 Preparations for consolidation 2/2/00 2/8/00 0.9 wks Preparations for consolidation
134 Master data 2/2/00 2/3/00 0.23 wks Master data
135 Financial accounting 2/3/00 2/4/00 0.23 wks Financial accounting
136 Fixed Assets Accounting 2/4/00 2/7/00 0.23 wks Fixed Assets Accounting
137 Extended G/L accounting 2/7/00 2/8/00 0.23 wks extended G/L accounting
138 Design / prototype Asset Management 7/10/00 8/14/00 5.18 wks
139 Implementation Guide AssetAccounting
7/10/00 8/14/00 5.18 wks Implementation Guide AssetAccounting
140 Asset Accounting project range 7/10/00 7/13/00 0.68 wks Asset Accounting project range
'00 '01 '02 '03 '04 '05 '06 '072000 2001 2002 2003 2004 2005 2006 2007

ID Name Start Finish Duration Deliverable141 Select functions 7/10/00 7/11/00 0.23 wks Select functions
142 Specify areas ofresponsibility
7/11/00 7/12/00 0.23 wks Specify areas of responsibility
143 Specify information flow 7/12/00 7/13/00 0.23 wks Specify information flow
144 Asset Accounting environment 7/13/00 7/18/00 0.68 wks Asset Accounting environment
145 Define authorizations 7/13/00 7/14/00 0.23 wks Define authorizations
146 Index specifications 7/14/00 7/17/00 0.23 wks Index specifications
147 System Administration Guide 7/17/00 7/18/00 0.23 wks System Administration Guide
148 Valuation of fixed assets 7/18/00 8/1/00 2.03 wks Valuation of fixed assets
149 Define chart of depreciation 7/18/00 7/19/00 0.23 wks Define chart of depreciation
150 Define depreciation areas 7/20/00 7/21/00 0.23 wks Define depreciation areas
151 Asset Accounting companycodes
7/21/00 7/24/00 0.23 wks Asset Accounting company codes
152 Valuation key 7/24/00 7/25/00 0.23 wks Valuation key
153 Net Worth Tax 7/25/00 7/26/00 0.23 wks Net Worth Tax
154 Insurance 7/26/00 7/27/00 0.23 wks insurance
155 Investment Support 7/27/00 7/28/00 0.23 wks Investment Support
156 Leasing types 7/28/00 7/31/00 0.23 wks Leasing types
157 Revaluation 7/31/00 8/1/00 0.23 wks Revaluation
158 Activities 8/2/00 8/9/00 1.13 wks Activities
159 Document types for postingin fixed assets
8/2/00 8/3/00 0.23 wks Document types for posting in fixedassets
160 Document number ranges 8/3/00 8/4/00 0.23 wks Document number ranges
'00 '01 '02 '03 '04 '05 '06 '072000 2001 2002 2003 2004 2005 2006 2007

ID Name Start Finish Duration Deliverable161 Transaction types 8/4/00 8/7/00 0.23 wks Transaction types
162 Post depreciation 8/7/00 8/8/00 0.23 wks Post depreciation
163 Settlement of asset underconstruction
8/8/00 8/9/00 0.23 wks Settlement of asset underconstruction
164 Reporting 8/9/00 8/14/00 0.68 wks Reporting
165 Sort criteria for asset reports 8/9/00 8/10/00 0.23 wks criteria for asset reports
166 Asset history sheet 8/10/00 8/11/00 0.23 wks Asset history sheet
167 Call up of reports 8/11/00 8/14/00 0.23 wks Call up of reports
168 Design / prototype Treasury 1/18/00 1/21/00 0.68 wks
169 Finalize Position 1/18/00 1/21/00 0.68 wks Finalize Position
170 Master data 1/18/00 1/19/00 0.23 wks Master data
171 Structure 1/19/00 1/20/00 0.23 wks Structure
172 Tools 1/20/00 1/21/00 0.23 wks Tools
173 Design / prototype Human Resources 1/21/00 2/11/00 2.93 wks
174 Human Resources 1/21/00 2/11/00 2.93 wks Human Resources
175 Master Data 1/21/00 1/31/00 1.13 wks Master Data
176 Basic data 1/21/00 1/24/00 0.23 wks Basic data
177 Personal data 1/24/00 1/25/00 0.23 wks Personal data
178 Data relevant to payment 1/25/00 1/26/00 0.23 wks Data relevant to payment
179 Internal data 1/26/00 1/27/00 0.23 wks Internal data
180 Planning data 1/28/00 1/31/00 0.23 wks Planning data
'00 '01 '02 '03 '04 '05 '06 '072000 2001 2002 2003 2004 2005 2006 2007

ID Name Start Finish Duration Deliverable181 Time Data 1/31/00 2/7/00 1.13 wks Time Data
182 Shift schedule 1/31/00 2/1/00 0.23 wks Shift schedule
183 Negative time rec. 2/1/00 2/2/00 0.23 wks Negative time rec.
184 PDC/positive t.rec. 2/2/00 2/3/00 0.23 wks PDC/positive t.rec.
185 Incentive wages 2/3/00 2/4/00 0.23 wks Incentive wages
186 Other 2/4/00 2/7/00 0.23 wks Other
187 Travel Expenses 2/7/00 2/11/00 0.68 wks Travel Expenses
188 Environment 2/7/00 2/8/00 0.23 wks Environment
189 Options 2/8/00 2/9/00 0.23 wks Options
190 Settings 2/10/00 2/11/00 0.23 wks Settings
191 Consolidate ERP prototyping results 8/15/00 8/16/00 0.23 wks
192 Resolve outstanding policy issues 2/4/02 2/5/02 0.23 wks
193 Final ERP Gap Analysis 2/11/02 2/12/02 0.23 wks
194 Build 8/15/00 9/23/02 109.83 wks
195 Create detailed specifications for non-ERPIT development work
2/18/02 3/28/02 5.63 wks
196 Specify Data Conversion approaches 2/18/02 3/20/02 4.5 wks
197 Specify Data conversionapproaches for Financial
2/18/02 2/25/02 5 days
198 Specify Data conversionapproaches for Asset
2/25/02 3/5/02 5 days
199 Specify Data conversionapproaches for Treasury
3/5/02 3/12/02 5 days
200 Specify Data conversionapproaches for Human Resources
3/13/02 3/20/02 5 days
'00 '01 '02 '03 '04 '05 '06 '072000 2001 2002 2003 2004 2005 2006 2007

ID Name Start Finish Duration Deliverable201 Specify Interface extraction 2/18/02 3/28/02 5.63 wks
202 Specify interface extraction forFinancial accounting
2/18/02 2/25/02 5 days
203 Specify interface extraction forAsset Management
2/25/02 3/5/02 5 days
204 Specify interface extraction forControlling
3/5/02 3/12/02 5 days
205 Specify interface extraction forTreasury
3/13/02 3/20/02 5 days
206 Specify interface extraction forHuman Resources
3/20/02 3/28/02 5 days
207 Finalize interface design 4/1/02 9/23/02 25 wks
208 Finalize interface design Financialaccounting
4/1/02 5/6/02 5 wks
209 Finalize interface design AssetManagement
5/6/02 6/10/02 5 wks
210 Finalize interface design Controlling 6/10/02 7/15/02 5 wks
211 Finalize interface design Treasury 7/15/02 8/19/02 5 wks
212 Finalize interface design HumanResources
8/19/02 9/23/02 5 wks
213 Finalize data conversion design 4/1/02 9/23/02 25 wks
214 Finalize data conversion designFinancial accounting
4/1/02 5/6/02 5 wks
215 Finalize data conversion design AssetManagement
5/6/02 6/10/02 5 wks
216 Finalize data conversion designControlling
6/10/02 7/15/02 5 wks
217 Finalize data conversion designTreasury
7/15/02 8/19/02 5 wks
218 Finalize data conversion design HumanResources
8/19/02 9/23/02 5 wks
219 Configure system parameters, codes,structures, etc
8/15/00 8/16/00 0.23 wks
220 Configure system parameters, codes,structures Financial accounting
8/15/00 8/16/00 0.23 wks
'00 '01 '02 '03 '04 '05 '06 '072000 2001 2002 2003 2004 2005 2006 2007

ID Name Start Finish Duration Deliverable221 Configure system parameters, codes,
structures Asset Management8/15/00 8/16/00 0.23 wks
222 Configure system parameters, codes,structures Controlling
8/15/00 8/16/00 0.23 wks
223 Configure system parameters, codes,structures Treasury
8/15/00 8/16/00 0.23 wks
224 Configure system parameters, codes,structures Human Resources
8/15/00 8/16/00 0.23 wks
225 Set up & test coding structures 8/15/00 9/20/00 5.25 wks
226 Set up & test coding structuresFinancial Accounting
8/15/00 9/20/00 5.25 wks
227 Set up & test coding structures forAsset Management
8/15/00 9/20/00 5.25 wks
228 Set up & test coding structuresControlling
8/15/00 9/20/00 5.25 wks
229 Set up & test coding structuresTreasury
8/15/00 9/20/00 5.25 wks
230 Set up & test coding structures HumanResources
8/15/00 9/20/00 5.25 wks
231 Set up screens, queries & report writer etc 4/1/02 4/2/02 0.23 wks
232 Set-up screens, queries & reportFinancial accounting
4/1/02 4/2/02 0.23 wks
233 Select screen variant for documententry
4/1/02 4/2/02 0.23 wks
234 Define report allocation 4/1/02 4/2/02 0.23 wks
235 Define report variants forpayment notices
4/1/02 4/2/02 0.23 wks
236 Define report variants for accountstatements
4/1/02 4/2/02 0.23 wks
237 Define report variants for b/echarges statement
4/1/02 4/2/02 0.23 wks
238 Define report variants for internaldocuments
4/1/02 4/2/02 0.23 wks
239 Define report variants forindividual letters
4/1/02 4/2/02 0.23 wks
240 Define report variants fordocument statements
4/1/02 4/2/02 0.23 wks
'00 '01 '02 '03 '04 '05 '06 '072000 2001 2002 2003 2004 2005 2006 2007

ID Name Start Finish Duration Deliverable241 General reports 4/1/02 4/2/02 0.23 wks
242 Day end reports 4/1/02 4/2/02 0.23 wks
243 Month end reports 4/1/02 4/2/02 0.23 wks
244 Year end reports 4/1/02 4/2/02 0.23 wks
245 Reporting 4/1/02 4/2/02 0.23 wks
246 Maintain Report WriterLanguages
4/1/02 4/2/02 0.23 wks
247 Display Control Report 4/1/02 4/2/02 0.23 wks
248 Set-up screens, queries & report AssetManagement
4/1/02 4/2/02 0.23 wks
249 Screen layout for the asset masterrecord
4/1/02 4/2/02 0.23 wks
250 Screen layout for the depreciationarea
4/1/02 4/2/02 0.23 wks
251 Reporting 4/1/02 4/2/02 0.23 wks
252 Sort criteria for asset reports 4/1/02 4/2/02 0.23 wks
253 Call up of reports 4/1/02 4/2/02 0.23 wks
254 Set-up screens, queries & reportTreasury
4/1/02 4/2/02 0.23 wks
255 Report und Variantenauswahl 4/1/02 4/2/02 0.23 wks
256 Reporting 4/1/02 4/2/02 0.23 wks
257 Define report headings 4/1/02 4/2/02 0.23 wks
258 Set-up screens, queries & report HumanResources
4/1/02 4/2/02 0.23 wks
259 Screen control 4/1/02 4/2/02 0.23 wks
260 Fast entry screens 4/1/02 4/2/02 0.23 wks
'02 '03 '04 '05 '06 '07 '08 '092002 2003 2004 2005 2006 2007 2008 2009

ID Name Start Finish Duration Deliverable261 Entry screens 4/1/02 4/2/02 0.23 wks
262 Build / modify existing non-ERP applicationsoftware
2/12/02 2/13/02 0.23 wks
'02 '03 '04 '05 '06 '07 '08 '092002 2003 2004 2005 2006 2007 2008 2009

ID Name Start Finish Duration Deliverable263 Readiness & Rollout 6/27/95 6/5/03 414.55 wks
264 Create Production Environment 6/27/95 2/5/01 292.88 wks
265 Review technical environment and planproduction ERP system installation
6/27/95 1/30/01 291.98 wks
266 Review planned technical solution 6/27/95 1/8/01 288.98 wks
267 Investigate technical environment 1/9/01 1/9/01 0.78 days
268 Establish options and recommendations 1/9/01 1/16/01 0.88 wks
269 Revise the approach / Technical Plan 1/16/01 1/17/01 0.88 days
270 Review and agree Technical Plan 1/17/01 1/30/01 1.75 wks Technical Plan
271 Implement 'live' ERP client systems -hardware/software
1/30/01 1/31/01 0.23 wks
272 Implement live communications & network 1/31/01 2/1/01 0.23 wks
273 Implement 'live' ERP server systems -hardware / software / database
2/1/01 2/2/01 0.23 wks
274 Set up, transport and verify liveconfiguration
2/2/01 2/5/01 0.23 wks
275 Set up documentation and procedures 6/29/00 2/11/03 136.7 wks
276 Prepare and instigate operators' instructions,procedures and manual
2/5/01 3/26/01 7 wks
277 Design and agree processing approach 2/5/01 2/22/01 2.63 wks
278 Define Backup, Recovery, Restore,Re-organization procedures
2/5/01 2/16/01 1.75 wks
279 Define archiving and off-site backupprocedures
2/5/01 2/16/01 1.75 wks
280 Review, update and test DisasterRecovery Procedure
2/5/01 2/22/01 2.63 wks
281 Define Report Distribution methodsand procedures
2/5/01 2/16/01 1.75 wks
282 Define security and access controls andprocedures
2/5/01 3/1/01 3.5 wks
'95 '96 '97 '98 '99 '00 '01 '021995 1996 1997 1998 1999 2000 2001 2002

ID Name Start Finish Duration Deliverable283 Document Operators procedures 2/5/01 3/26/01 7 wks Ops Manual / Documentation
284 Prepare and instigate User Procedures andUser Manual / electronic information
3/26/01 5/1/01 5.25 wks
285 System Control 3/26/01 4/6/01 1.75 wks
286 Coding structures 3/26/01 5/1/01 5.25 wks
287 Prepare and instigate User Proceduresand User Manual/Electronic
3/26/01 3/27/01 0.23 wks
288 G/L Accounting 3/26/01 3/27/01 0.23 wks
289 Extended general ledger 3/26/01 3/27/01 0.23 wks
290 Menu-Driven report generator 3/26/01 3/27/01 0.23 wks
291 Accounts receivable 3/26/01 3/27/01 0.23 wks
292 Information system 3/26/01 3/27/01 0.23 wks
293 Accounts payable 3/26/01 3/27/01 0.23 wks
294 Information system 3/26/01 3/27/01 0.23 wks
295 Consolidation functions 3/26/01 3/27/01 0.23 wks
296 PC Data entry 3/26/01 3/27/01 0.23 wks
297 Cash management and forecast 3/26/01 3/27/01 0.23 wks
298 Electronic Banking 3/26/01 3/27/01 0.23 wks
299 Central financial budgeting andfinancial resources management
3/26/01 3/27/01 0.23 wks
300 Inter-company businesstransactions
3/26/01 3/27/01 0.23 wks
301 Business area accounting 3/26/01 3/27/01 0.23 wks
302 Account interest calculation(interest scale)
3/26/01 3/27/01 0.23 wks
'01 '02 '03 '04 '05 '06 '07 '082001 2002 2003 2004 2005 2006 2007 2008

ID Name Start Finish Duration Deliverable303 Prepare and instigate User Procedures
and User Manual/Electronic3/26/01 3/27/01 0.23 wks
304 Management of investmentprojects
3/26/01 3/27/01 0.23 wks
305 Tax depreciation simulation -basic functions
3/26/01 3/27/01 0.23 wks
306 Assets Accounting - basicfunctions
3/26/01 3/27/01 0.23 wks
307 Prepare and instigate User Proceduresand User Manual/Electronic
3/26/01 3/27/01 0.23 wks
308 Cost element accounting 3/26/01 3/27/01 0.23 wks
309 Cost center accounting 3/26/01 3/27/01 0.23 wks
310 Planning of functionaldependencies
3/26/01 3/27/01 0.23 wks
311 Basic functions 3/26/01 3/27/01 0.23 wks
312 Unit costing 3/26/01 3/27/01 0.23 wks
313 Open-item management 3/26/01 3/27/01 0.23 wks
314 Settlement 3/26/01 3/27/01 0.23 wks
315 Information system 3/26/01 3/27/01 0.23 wks
316 Activity and allocation bases 3/26/01 3/27/01 0.23 wks
317 Product Costing 3/26/01 3/27/01 0.23 wks
318 Product costing analysis 3/26/01 3/27/01 0.23 wks
319 Product cost controlling 3/26/01 3/27/01 0.23 wks
320 Executive Information System -Management data base
3/26/01 3/27/01 0.23 wks
321 Executive Information SystemData presentation
3/26/01 3/27/01 0.23 wks
322 Prepare and instigate User Proceduresand User Manual/Electronic
3/26/01 3/27/01 0.23 wks
'01 '02 '03 '04 '05 '06 '07 '082001 2002 2003 2004 2005 2006 2007 2008

ID Name Start Finish Duration Deliverable323 Material master record 3/26/01 3/27/01 0.23 wks
324 Vendor master record(purchasingfunctions)
3/26/01 3/27/01 0.23 wks
325 Classification 3/26/01 3/27/01 0.23 wks
326 Document management 3/26/01 3/27/01 0.23 wks
327 Link to graphic subsystems 3/26/01 3/27/01 0.23 wks
328 Basic Purchasing Functions 3/26/01 3/27/01 0.23 wks
329 Contracts/delivery schedulingagreements
3/26/01 3/27/01 0.23 wks
330 Quota agreements 3/26/01 3/27/01 0.23 wks
331 Subcontract order processing 3/26/01 3/27/01 0.23 wks
332 Vendor evaluation 3/26/01 3/27/01 0.23 wks
333 Purchasing information system 3/26/01 3/27/01 0.23 wks
334 Goods Receipt 3/26/01 3/27/01 0.23 wks
335 Inventory management 3/26/01 3/27/01 0.23 wks
336 Physical inventory 3/26/01 3/27/01 0.23 wks
337 Interface for inventory sampling 3/26/01 3/27/01 0.23 wks
338 Inventory sampling 3/26/01 3/27/01 0.23 wks
339 Inventory controlling 3/26/01 3/27/01 0.23 wks
340 Basic invoice verificationfunctions
3/26/01 3/27/01 0.23 wks
341 Balance sheet valuation procedure 3/26/01 3/27/01 0.23 wks
342 Link to EDI Interface 3/26/01 3/27/01 0.23 wks
'01 '02 '03 '04 '05 '06 '07 '082001 2002 2003 2004 2005 2006 2007 2008

ID Name Start Finish Duration Deliverable343 Prepare and instigate User Procedures
and User Manual/Electronic3/26/01 3/27/01 0.23 wks
344 Basic component for inspectionmanagement
3/26/01 3/27/01 0.23 wks
345 Master data and inspectionplanning
3/26/01 3/27/01 0.23 wks
346 Feature-specific inspection resultsrecording
3/26/01 3/27/01 0.23 wks
347 Prepare and instigate User Proceduresand User Manual/Electronic
3/26/01 3/27/01 0.23 wks
348 Organization and Planning 3/26/01 3/27/01 0.23 wks
349 Elementary job, position andworkplace description
3/26/01 3/27/01 0.23 wks
350 HR Plan connection for ERPstructure graphics
3/26/01 3/27/01 0.23 wks
351 ERP structure Graphics for UNIX 3/26/01 3/27/01 0.23 wks
352 Qualifications/Requirements 3/26/01 3/27/01 0.23 wks
353 External training administration 3/26/01 3/27/01 0.23 wks
354 Education and trainingadministration
3/26/01 3/27/01 0.23 wks
355 Room reservation planning 3/26/01 3/27/01 0.23 wks
356 Career and succession planning 3/26/01 3/27/01 0.23 wks
357 Personnel cost planning 3/26/01 3/27/01 0.23 wks
358 Personnel master dataadministration
3/26/01 3/27/01 0.23 wks
359 Interface for international payrollaccounting
3/26/01 3/27/01 0.23 wks
360 Time data administration 3/26/01 3/27/01 0.23 wks
361 Attendance times 3/26/01 3/27/01 0.23 wks
362 Individual incentive wages (dataentry / calculation)
3/26/01 3/27/01 0.23 wks
'01 '02 '03 '04 '05 '06 '07 '082001 2002 2003 2004 2005 2006 2007 2008

ID Name Start Finish Duration Deliverable363 Group incentive wages (data entry
/ calculation)3/26/01 3/27/01 0.23 wks
364 Travel expenses (basic version) 3/26/01 3/27/01 0.23 wks
365 Travel expense supplements forinternational implementations
3/26/01 3/27/01 0.23 wks
366 Cost distribution for one businesstrip
3/26/01 3/27/01 0.23 wks
367 Common payroll elements 3/26/01 3/27/01 0.23 wks
368 Automatic processing ofgarnishments of wages (Germany)
3/26/01 3/27/01 0.23 wks
369 Calculation of statutory sick payand statutory maternity pay (GB)
3/26/01 3/27/01 0.23 wks
370 Limited master data 3/26/01 3/27/01 0.23 wks
371 Limited payroll basis 3/26/01 3/27/01 0.23 wks
372 Prepare and instigate User Proceduresand User Manual/Electronic
3/26/01 3/27/01 0.23 wks
373 Connection to optical archivingsystem
3/26/01 3/27/01 0.23 wks
374 Message control - extendedfunctions
3/26/01 3/27/01 0.23 wks
375 ERP Office basic functions (ERPmail, ERP file, ERP find)
3/26/01 3/27/01 0.23 wks
376 ERP Office - external sending 3/26/01 3/27/01 0.23 wks
377 ERP access 3/26/01 3/27/01 0.23 wks
378 Basis EDI interface 3/26/01 3/27/01 0.23 wks
379 Prepare and instigate User Proceduresand User Manual/Electronic
3/26/01 3/27/01 0.23 wks
380 ERP printer drivers 3/26/01 3/27/01 0.23 wks
381 Basic communications functions 3/26/01 3/27/01 0.23 wks
382 Communication module forconnection to external systems
3/26/01 3/27/01 0.23 wks
'01 '02 '03 '04 '05 '06 '07 '082001 2002 2003 2004 2005 2006 2007 2008

ID Name Start Finish Duration Deliverable383 Connection of ERP to external
systems3/26/01 3/27/01 0.23 wks
384 ERP comm basic function 3/26/01 3/27/01 0.23 wks
385 Extended function library forapplications
3/26/01 3/27/01 0.23 wks
386 Translation tool,terminology/glossary, database
3/26/01 3/27/01 0.23 wks
387 Function modules for integrationof optical storage and document
3/26/01 3/27/01 0.23 wks
388 ERP-COMM Development library 3/26/01 3/27/01 0.23 wks
389 Development library for TCP/IPtransport protocol for AIX
3/26/01 3/27/01 0.23 wks
390 On-line tool information model 3/26/01 3/27/01 0.23 wks
391 Agree user procedures anddocumentation
3/26/01 4/12/01 2.63 wks Procedures / documentation & signoff
392 Set up / revise and agree communicationsplan
5/1/01 5/14/01 1.75 wks Communications Plan
393 Implement change management program 5/14/01 2/11/03 91.25 wks
394 Define the change managementroll-out organization
5/14/01 6/7/01 3.5 wks
395 Build and maintain sponsorship 6/7/01 5/28/02 50.75 wks
396 Identify, brief and educate full changemanagement roll-out support team
5/28/02 6/11/02 2 wks
397 Project team support for ChangeManagement process
6/11/02 2/11/03 35 wks
398 Prepare & distribute tools and materialsfor supporting the roll-out
5/14/01 12/26/01 32.38 wks
399 Plan, prepare and conduct user andmanagement training and education
6/29/00 11/13/01 71.7 wks
400 Training Needs Analysis 6/29/00 7/24/00 3.5 wks Profile Matrix
401 Training Approach 7/24/00 8/17/00 3.5 wks Training Approach
402 Devise and plan training program 8/17/00 9/5/00 2.63 wks Outline specs
'00 '01 '02 '03 '04 '05 '06 '072000 2001 2002 2003 2004 2005 2006 2007

ID Name Start Finish Duration Deliverable403 Develop training courses and materials 5/1/01 8/7/01 14 wks Courses & materials
404 Mobilize trainers 5/1/01 7/13/01 10.5 wks Schedules
405 Set up training environments 5/1/01 7/13/01 10.5 wks Training Environment
406 Invite and prepare attendees 8/7/01 9/25/01 7 wks Invites / advance prep
407 Deliver training and monitorattendance
9/25/01 11/13/01 7 wks Training + log
408 Devise and handover post-liveeducation and training
8/7/01 8/31/01 3.5 wks Post-live training schedule
409 Plan, prepare and conduct operationstraining
12/25/00 2/23/01 8.75 wks
410 Operations - Training Needs Analysisand Approach
12/25/00 1/5/01 1.75 wks Operations Training Approach
411 Develop operations training programand materials
1/5/01 1/18/01 1.75 wks Ops courses & materials
412 Plan, schedule, invite, conduct andmonitor operations training
1/18/01 2/23/01 5.25 wks Ops training
413 Plan, prepare and conduct support stafftraining
11/13/01 1/28/02 10.83 wks
414 Support staff Training Needs Analysisand approach
11/13/01 11/28/01 9.63 days Support Training Approach IP
415 Develop support staff training programand materials
11/28/01 12/13/01 9.63 days Support training materials
416 Plan, schedule, invite, conduct andmonitor support staff training
12/13/01 1/28/02 28.88 days Support training
417 Verify System 6/23/00 12/18/02 129.6 wks
418 Plan, prepare and conduct User / System /Acceptance and Integration testing
6/23/00 8/14/01 59.31 wks
419 Review needs and requirements fortesting and acceptance
6/23/00 7/6/00 1.75 wks
420 Identify and assess options 6/30/00 7/12/00 1.75 wks
421 Agree approach to testing andacceptance
7/6/00 7/19/00 1.75 wks
422 Detail Testing Approach 7/19/00 7/31/00 1.75 wks Testing Approach
'00 '01 '02 '03 '04 '05 '06 '072000 2001 2002 2003 2004 2005 2006 2007

ID Name Start Finish Duration Deliverable423 Agree Testing Approach 8/14/00 8/21/00 0.88 wks
424 Prepare individual Test Objectives 8/21/00 8/31/00 1.75 wks Test Objectives
425 Prepare test detailed definitions andexpected results
12/12/00 3/30/01 15.75 wks Test Definitions
426 Prepare testing environment 3/30/01 4/25/01 3.5 wks Test Environment
427 Conduct test cycles 4/25/01 5/31/01 5.25 wks Test Log / Incident Reports & log
428 Review results and control remedialactions
5/31/01 7/6/01 5.25 wks Incident control
429 Review and accept results 7/6/01 8/14/01 5.25 wks Sign off
430 Plan, prepare and conduct technical tuningand volume testing
9/23/02 12/4/02 10.5 wks
431 Review requirements for technicaltesting
9/23/02 10/3/02 1.75 wks
432 Assess options for Technical Testing 9/23/02 10/3/02 1.75 wks
433 Agree approach to Technical Testing 9/23/02 10/3/02 1.75 wks
434 Define detail of technical testingapproach
9/23/02 10/3/02 1.75 wks
435 Agree Technical Testing 9/23/02 9/27/02 0.88 wks Technical Tuning & Testing
436 Prepare testing environment(s) 9/23/02 10/3/02 1.75 wks Technical Environment
437 Define tests 9/23/02 12/4/02 10.5 wks Test Objectives
438 Prepare test data 9/23/02 10/29/02 5.25 wks Test Definitions
439 Conduct test runs 9/23/02 11/11/02 7 wks Logs / Incident Reports
440 Tune System 9/23/02 11/11/02 7 wks
441 Review results and accept technicalperformance
9/23/02 11/4/02 6.13 wks Test sign off
442 Evaluate testing and report results 12/4/02 12/18/02 2 wks
'00 '01 '02 '03 '04 '05 '06 '072000 2001 2002 2003 2004 2005 2006 2007

ID Name Start Finish Duration Deliverable443 Rollout 9/23/02 6/5/03 36.75 wks
444 Define, plan and agree handover / cutover 9/23/02 10/10/02 2.63 wks
445 System handover - needs &requirements
9/23/02 10/10/02 2.63 wks
446 System handover options andrecommendations
9/23/02 10/3/02 1.75 wks
447 System handover detailed plan 9/23/02 10/3/02 1.75 wks
448 Review and agree System handover 9/23/02 10/3/02 1.75 wks System handover IP
449 Define and agree terms of reference for liveuser support activity
9/23/02 10/16/02 3.5 wks
450 Requirements for live admin & support 9/23/02 10/3/02 1.75 wks
451 Options and recommendations 9/23/02 10/3/02 1.75 wks
452 Detailed approach, organization andstaffing for live admin & support
9/23/02 10/16/02 3.5 wks
453 Agree System Support andAdministration
9/23/02 10/3/02 1.75 wks System Support & Admin
454 Acquire and start support team staff 9/23/02 10/16/02 3.5 wks
455 Plan and instigate phased transition to liveoperation and support and phasing out of
9/23/02 10/29/02 5.25 wks
456 Devise and agree Transition Plan 9/23/02 10/3/02 1.75 wks Transition Plan
457 Transition / shared support of thesystem
9/23/02 10/29/02 5.25 wks
458 Sign off end of Project Team support 9/23/02 9/24/02 0.88 days Transition sign off
459 Establish conversion environment 9/23/02 9/30/02 1 wk
460 Load start up data 9/23/02 6/5/03 36.75 wks
461 Data validation & purification 9/23/02 6/5/03 36.75 wks Clean data
462 Manual Data Loading 9/23/02 9/27/02 0.88 wks Data Load
'02 '03 '04 '05 '06 '07 '08 '092002 2003 2004 2005 2006 2007 2008 2009

ID Name Start Finish Duration Deliverable463 Automated Data Conversion &
Loading9/23/02 9/27/02 0.88 wks Data Load
464 Acceptance of start up data 9/23/02 10/10/02 2.63 wks
465 Define validation processes, tests andcontrols
9/23/02 10/10/02 2.63 wks Test Definitions
466 Validate data and controls 9/23/02 9/27/02 3.5 days Logs
467 Apply manual corrections / rerun /revalidate as required
9/23/02 9/27/02 0.88 wks
468 Accept start up data 9/23/02 9/24/02 0.88 days Sign off
469 Conduct final operations review 9/23/02 9/24/02 0.23 wks
470 Conduct final production / data controlreview
9/23/02 9/24/02 0.23 wks
471 Conduct final user review 9/23/02 9/24/02 0.23 wks
472 Decision to go live 9/23/02 9/24/02 0.88 days Decision to go live
473 Early care 9/23/02 9/24/02 0.23 wks
'02 '03 '04 '05 '06 '07 '08 '092002 2003 2004 2005 2006 2007 2008 2009

ID Name Start Finish Duration Deliverable474 Quality Audit 6/5/03 6/19/03 1.96 wks
475 Check deliverables against QA checklist 6/5/03 6/12/03 0.88 wks Deliverables checklist / CAR(Corrective Action Requests) & log
476 Check required work against project tracking data 6/12/03 6/18/03 0.88 wks Processes checklist / CAR(Corrective Action Requests) & Log
477 QA signoff 6/18/03 6/19/03 0.88 days QA Sign off
'03 '04 '05 '06 '07 '08 '09 '102003 2004 2005 2006 2007 2008 2009 2010

ID Name Start Finish Duration Deliverable478 Terminate Project 6/19/03 10/2/03 14.88 wks
479 Identify / confirm new roles for all project staff 6/19/03 10/2/03 14.88 wks Appraisals / Organigrammes / Jobs
480 File / archive materials, correspondence etc 6/19/03 7/21/03 4.38 wks Demobilization Plan IP
481 Return / redeploy accommodation and equipmentetc
6/19/03 7/8/03 2.63 wks
482 Prepare Project Completion Report 6/19/03 7/2/03 1.75 wks Project Completion Report / Letter
483 Collate / prepare Work Books and Owner'sManual
6/19/03 7/2/03 1.75 wks Work Book(s) & Owners Manual
'03 '04 '05 '06 '07 '08 '09 '102003 2004 2005 2006 2007 2008 2009 2010


Business Case Study Appendix G—High Level Infrastructure Schematic
Draft Final Report Page G-4 kpmg
DMS SOPHIA
INTERNETCONNECTION
Hub
ComptrollerWeb Server
(existing)
Secure Link
AS/400620
Unisys
Router
Vendor Bid System
Sun E10000(existing)
InternetUUNet
TallahasseeRouted MAN
Router
Hub
Firewall
CMS Web Serverwith built-in
FirewallAS/400730e
Hub
OtherState Servers
DMZRouter
State of Florida Business Case StudyHigh Level Infrastructure
Best of Breed Option
Router
Router
Hub
ExternalWeb Server
E3000(existing)
ExternalDNS
(existing)
Hub
Inside DMZ Traffic
IBM Mainframe
LASIBM 9672-R76
HubCAMRA
Firewall
Proxy Server(existing)
Router
T1
RemoteAccess
(new)
Citrix Server
(new)
Web Server(new Unix)
New ERPApplication Server(s)
(new Unix)
Firewall(new)
Database Server(new Unix)
Hub(new)
Router(new)
Hub(new)
New SUS ERPApplication Server(s)
(new Unix)
SUS Database Server(new Unix)


