Report of Independent Registered Public Accounting Firm The Board of Directors of Massachusetts Mutual Life Insurance Company and Contract Owners of Connecticut Mutual Variable Life Separate Account I: Opinion on the Financial Statements and Financial Highlights We have audited the accompanying statements of assets and liabilities of Connecticut Mutual Variable Life Separate Account I (comprised of the sub-accounts listed in Appendix A to the opinion) (collectively, “the Separate Account”) as of December 31, 2020, the related statements of operations and changes in net assets for each of the years (as described in Appendix A) in the two-year period then ended, and the related notes (collectively, the “financial statements”) and the financial highlights for each of the years in the five-year period then ended. In our opinion, the financial statements and financial highlights present fairly, in all material respects, the financial position of the Separate Account as of December 31, 2020, the results of its operations and changes in its net assets for each of the years in the two-year period then ended, and the financial highlights for each of the years in the five-year period then ended, in conformity with U.S. generally accepted accounting principles. Basis for Opinion These financial statements and financial highlights are the responsibility of the Separate Account’s management. Our responsibility is to express an opinion on these financial statements and financial highlights based on our audits. We are a public accounting firm registered with the Public Company Accounting Oversight Board (United States) (PCAOB) and are required to be independent with respect to the Separate Account in accordance with the U.S. federal securities laws and the applicable rules and regulations of the Securities and Exchange Commission and the PCAOB. We conducted our audits in accordance with the standards of the PCAOB. Those standards require that we plan and perform the audit to obtain reasonable assurance about whether the financial statements and financial highlights are free of material misstatement, whether due to error or fraud. Our audits included performing procedures to assess the risks of material misstatement of the financial statements and financial highlights, whether due to error or fraud, and performing procedures that respond to those risks. Such procedures included examining, on a test basis, evidence regarding the amounts and disclosures in the financial statements and financial highlights. Such procedures also included confirmation of securities owned as of December 31, 2020, by correspondence with the underlying mutual funds or their transfer agent. Our audits also included evaluating the accounting principles used and significant estimates made by management, as well as evaluating the overall presentation of the financial statements and financial highlights. We believe that our audits provide a reasonable basis for our opinion. We have served as the Separate Account’s auditor since 2004. Boston, Massachusetts March 10, 2021 KPMG LLP Two Financial Center 60 South Street Boston, MA 02111 KPMG LLP, a Delaware limited liability partnership and a member firm of the KPMG global organization of independent member firms affiliated with KPMG International Limited, a private English company limited by guarantee. )
Transcript
Report of Independent Registered Public Accounting Firm
The Board of Directors of Massachusetts Mutual Life Insurance Company and Contract Owners of ConnecticutMutual Variable Life Separate Account I:
Opinion on the Financial Statements and Financial Highlights
We have audited the accompanying statements of assets and liabilities of Connecticut Mutual Variable Life Separate Account I (comprised of the sub-accounts listed in Appendix A to the opinion) (collectively, “theSeparate Account”) as of December 31, 2020, the related statements of operations and changes in net assets for each of the years (as described in Appendix A) in the two-year period then ended, and the related notes (collectively, the “financial statements”) and the financial highlights for each of the years in the five-year period then ended. In our opinion, the financial statements and financial highlights present fairly, in all material respects, the financial position of the Separate Account as of December 31, 2020, the results of its operations and changes in its net assets for each of the years in the two-year period then ended, and the financial highlights for each of the years in the five-year period then ended, in conformity with U.S. generally accepted accounting principles.
Basis for Opinion
These financial statements and financial highlights are the responsibility of the Separate Account’smanagement. Our responsibility is to express an opinion on these financial statements and financial highlights based on our audits. We are a public accounting firm registered with the Public Company Accounting Oversight Board (United States) (PCAOB) and are required to be independent with respect to the Separate Account in accordance with the U.S. federal securities laws and the applicable rules and regulations of the Securities and Exchange Commission and the PCAOB.
We conducted our audits in accordance with the standards of the PCAOB. Those standards require that we plan and perform the audit to obtain reasonable assurance about whether the financial statements and financial highlights are free of material misstatement, whether due to error or fraud. Our audits included performing procedures to assess the risks of material misstatement of the financial statements and financial highlights, whether due to error or fraud, and performing procedures that respond to those risks. Such procedures included examining, on a test basis, evidence regarding the amounts and disclosures in the financial statements and financial highlights. Such procedures also included confirmation of securities owned as of December 31, 2020, by correspondence with the underlying mutual funds or their transfer agent. Our audits also included evaluating the accounting principles used and significant estimates made by management, as well as evaluating the overall presentation of the financial statements and financial highlights. We believe that our audits provide a reasonable basis for our opinion.
We have served as the Separate Account’s auditor since 2004.
Boston, MassachusettsMarch 10, 2021
KPMG LLPTwo Financial Center60 South StreetBoston, MA 02111
KPMG LLP, a Delaware limited liability partnership and a member firm of the KPMG global organization of independent member firms affiliated with KPMG International Limited, a private English company limited by guarantee.
2
Appendix A
Connecticut Mutual Variable Life Separate Account I is comprised of the following sub-accounts and the activities of each sub-account have been included within the accompanying statements of assets and liabilities as of December 31, 2020 and the related statements of operations and changes in net assets for each of the years in the two-year period then ended.
Sub-AccountsFidelity® VIP Government Money Market Sub-AccountFidelity® VIP High Income Sub-AccountFidelity® VIP Overseas Sub-AccountInvesco Oppenheimer V.I. Conservative Balanced Sub-Account*Invesco Oppenheimer V.I. Main Street Sub-Account*Invesco Oppenheimer V.I. Total Return Bond Sub-Account*
* See Note 2 to the financial statements for information regarding the merger of this Sub-Account.
Connecticut Mutual Variable Life Separate Account I
See Notes to Financial Statements.
F-3
STATEMENTS OF ASSETS AND LIABILITIESDecember 31, 2020
Government VIP VIP Conservative Oppenheimer V.I. Total ReturnMoney Market High Income Overseas Balanced Main Street BondSub-Account Sub-Account Sub-Account Sub-Account Sub-Account Sub-Account
Net investment income (loss) ................. (294) 9,909 (3,911) 28,351 37,794 2,599
Net realized and unrealized gain (loss)on investments
Realized gain (loss) on sale of fund shares . - (1,384) 14,138 53,516 55,400 889Realized gain distribution .................... - - 3,846 55,723 621,832 -Realized gain (loss)........................... - (1,384) 17,984 109,239 677,232 889
Change in net unrealized appreciation/depreciation of investments..................... - (4,570) 112,827 180,698 92,137 6,773
Net gain (loss) on investments ............... - (5,954) 130,811 289,937 769,369 7,662
Net increase (decrease) in net assetsresulting from operations ..................... (294) 3,955 126,900 318,288 807,163 10,261
Capital transactions:Transfer of net premiums .................... 2,162 11,995 34,705 115,098 271,284 10,537Transfers due to death benefits .............. - (101) - (101) (210) -Transfers due to withdrawal of funds ....... 2 (7,731) (194) (9,421) (83,644) (4,587)Transfers due to administrative charges .... (4,015) (19,892) (43,885) (172,941) (338,642) (15,690)Transfers between divisions and to/fromGuaranteed Principal Account............... - (60) (8,829) (52,402) (54,188) 102
Net increase (decrease) in net assets resulting
from capital transactions .......................... (1,851) (15,789) (18,203) (119,767) (205,400) (9,638)Total increase (decrease) ...................... (2,145) (11,834) 108,697 198,521 601,763 623
NET ASSETS, at beginning of the year..... 51,781 261,987 892,103 2,368,907 6,468,289 119,442
NET ASSETS, at end of the year ............$ 49,636 $ 250,153 $ 1,000,800 $ 2,567,428 $ 7,070,052 $ 120,065
Connecticut Mutual Variable Life Separate Account I
See Notes to Financial Statements.
F-5
STATEMENT OF OPERATIONS AND CHANGES IN NET ASSETS For The Year Ended December 31, 2019
ExpensesMortality and expense risk fees and administrative charges..................... 498 2,301 7,467 20,501 54,384 1,066
Net investment income (loss) ................ 604 10,859 6,847 30,253 9,547 2,865
Net realized and unrealized gain (loss) on investments
Realized gain (loss) on sale of fund shares . - (362) 2,819 32,876 73,531 (72)Realized gain distribution .................... - - 29,223 35,950 962,410 -Realized gain (loss)........................... - (362) 32,042 68,826 1,035,941 (72)
Change in net unrealized appreciation/depreciation of investments.................... - 22,487 153,099 241,160 527,187 6,790
Net gain (loss) on investments .............. - 22,125 185,141 309,986 1,563,128 6,718
Net increase (decrease) in net assets resulting from operations .................... 604 32,984 191,988 340,239 1,572,675 9,583
Capital transactions:Transfer of net premiums .................... 2,162 15,898 38,798 119,195 204,905 11,714Transfers due to death benefits .............. - - - (27) - -Transfers due to withdrawal of funds ....... (2,088) 111 (22,444) (18,222) (149,729) 90Transfers due to administrative charges .... (5,405) (25,402) (46,790) (176,650) (351,930) (15,294)Transfers between divisions and to/from Guaranteed Principal Account............... - (1) (678) 2,640 (13,421) (48)
Net increase (decrease) in net assetsresulting from capital transactions ............ (5,331) (9,394) (31,114) (73,064) (310,175) (3,538)Total increase (decrease) ..................... (4,727) 23,590 160,874 267,175 1,262,500 6,045
NET ASSETS, at beginning of the year.... 56,508 238,397 731,229 2,101,732 5,205,789 113,397
NET ASSETS, at end of the year ...........$ 51,781 $ 261,987 $ 892,103 $ 2,368,907 $ 6,468,289 $ 119,442
Connecticut Mutual Variable Life Separate Account I
Notes To Financial Statements
F-6
1. ORGANIZATION
Connecticut Mutual Variable Life Separate Account I (“the Separate Account”) is a separate investment account of Massachusetts Mutual Life Insurance Company (“MassMutual”). The Separate Account is registered as a unit investment trust under the Investment Company Act of 1940 (“the 1940 Act”). The Separate Account was formerly a separate account of Connecticut Mutual Life Insurance Company (“CML”).
On February 29, 1996, CML merged with and into MassMutual. Upon the merger, CML’s existence ceased and MassMutual became the surviving company under the name Massachusetts Mutual Life Insurance Company. The Separate Account became a separate account of MassMutual.
The Separate Account was established exclusively for the use of The Blue Chip Company’s Variable Universal Life (“BCVUL”) policy and contains one segment.
The assets and liabilities of the Separate Account are clearly identified and distinguished from MassMutual’s other assets and liabilities. The Separate Account assets are not chargeable with liabilities arising from any other MassMutual business.
2. INVESTMENT OF THE SEPARATE ACCOUNT’S ASSETS
As of December 31, 2020, the Separate Account consists of six sub-accounts that invest in the following mutual funds:
The sub-accounts listed in the first columnSub-accounts invests in the fund in this column
Fidelity® VIP Government Money Market Sub-Account Fidelity® VIP Government Money Market Portfolio1
Fidelity® VIP High Income Sub-Account Fidelity® VIP High Income Portfolio1
Invesco Oppenheimer V.I. Main Street Sub-Account Invesco Oppenheimer V.I. Main Street Fund®2,3
Invesco Oppenheimer V.I. Total Return Bond Sub-Account Invesco Oppenheimer V.I. Total Return Bond Fund2,3
In addition to the six sub-accounts, policy owners may also allocate funds to the Fixed Interest Account (“FIA”), which is part of MassMutual's general investment account ("General Account"). Because of exemptive and exclusionary provisions in the securities law, interests in the FIA are not registered under the Securities Act of 1933, and the FIA is not registered as an investment company under the 1940 Act.
1 Fidelity Management & Research Company LLC is the investment adviser to the listed Portfolios. 2Effective after the close of the New York Stock Exchange on May 24, 2019, Invesco Ltd. completed this acquisition of OppenheimerFunds, Inc. The Acquiring Funds/Sub-Accounts assume the accounting and performance history of the corresponding Merging Funds/Sub-Accounts. In connection with that transaction the following Funds/Sub-Accounts merged:
Fund: Oppenheimer Main Street Fund®/VA Fund: Invesco Oppenheimer V.I. Main Street Fund®
Division: Oppenheimer Main Street Sub-Account Division: Invesco Oppenheimer V.I. Main Street Sub-Account
Fund: Oppenheimer Total Return Bond Fund/VA Fund: Invesco Oppenheimer V.I. Total Return Bond Fund
Division: Oppenheimer Total Return Bond Sub-Account Division: Invesco Oppenheimer V.I. Total Return Bond Sub-Account3Invesco Advisers, Inc. is the investment adviser to this Fund.
Notes To Financial Statements (Continued)
F-7
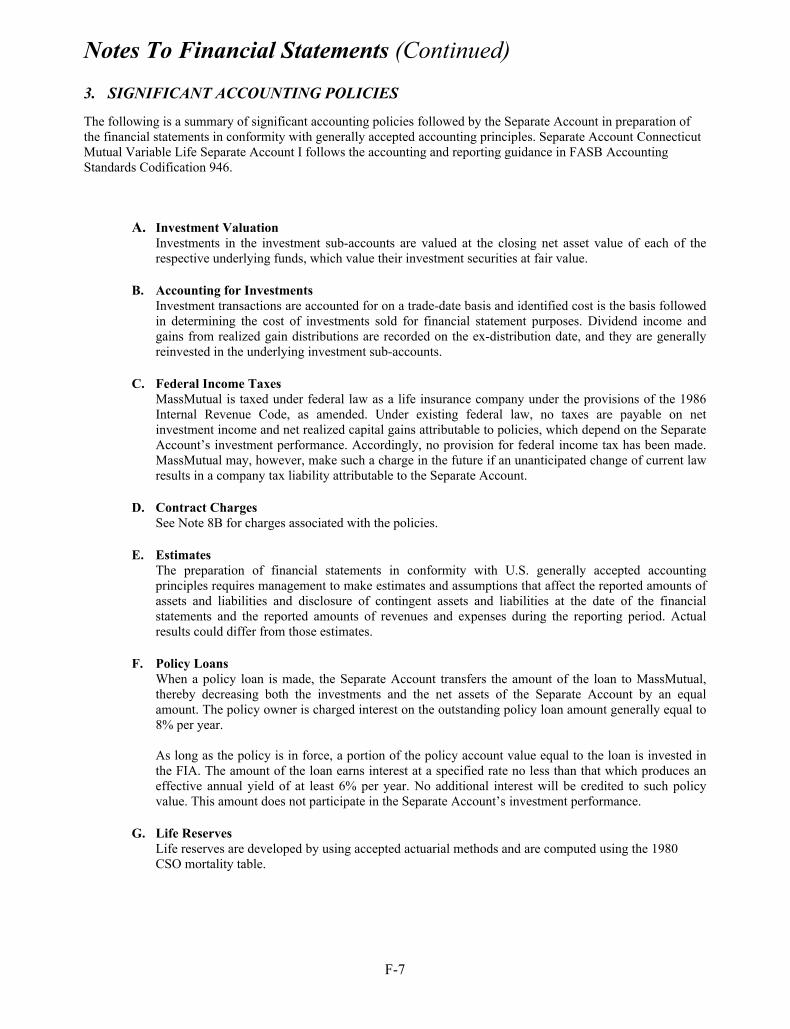
3. SIGNIFICANT ACCOUNTING POLICIES
The following is a summary of significant accounting policies followed by the Separate Account in preparation of the financial statements in conformity with generally accepted accounting principles. Separate Account Connecticut Mutual Variable Life Separate Account I follows the accounting and reporting guidance in FASB Accounting Standards Codification 946.
A. Investment Valuation Investments in the investment sub-accounts are valued at the closing net asset value of each of the respective underlying funds, which value their investment securities at fair value.
B. Accounting for Investments Investment transactions are accounted for on a trade-date basis and identified cost is the basis followed in determining the cost of investments sold for financial statement purposes. Dividend income and gains from realized gain distributions are recorded on the ex-distribution date, and they are generally reinvested in the underlying investment sub-accounts.
C. Federal Income Taxes MassMutual is taxed under federal law as a life insurance company under the provisions of the 1986 Internal Revenue Code, as amended. Under existing federal law, no taxes are payable on net investment income and net realized capital gains attributable to policies, which depend on the Separate Account’s investment performance. Accordingly, no provision for federal income tax has been made. MassMutual may, however, make such a charge in the future if an unanticipated change of current law results in a company tax liability attributable to the Separate Account.
D. Contract Charges See Note 8B for charges associated with the policies.
E. Estimates The preparation of financial statements in conformity with U.S. generally accepted accounting principles requires management to make estimates and assumptions that affect the reported amounts of assets and liabilities and disclosure of contingent assets and liabilities at the date of the financial statements and the reported amounts of revenues and expenses during the reporting period. Actual results could differ from those estimates.
F. Policy LoansWhen a policy loan is made, the Separate Account transfers the amount of the loan to MassMutual, thereby decreasing both the investments and the net assets of the Separate Account by an equal amount. The policy owner is charged interest on the outstanding policy loan amount generally equal to 8% per year.
As long as the policy is in force, a portion of the policy account value equal to the loan is invested in the FIA. The amount of the loan earns interest at a specified rate no less than that which produces an effective annual yield of at least 6% per year. No additional interest will be credited to such policy value. This amount does not participate in the Separate Account’s investment performance.
G. Life ReservesLife reserves are developed by using accepted actuarial methods and are computed using the 1980 CSO mortality table.
Notes To Financial Statements (Continued)
F-8
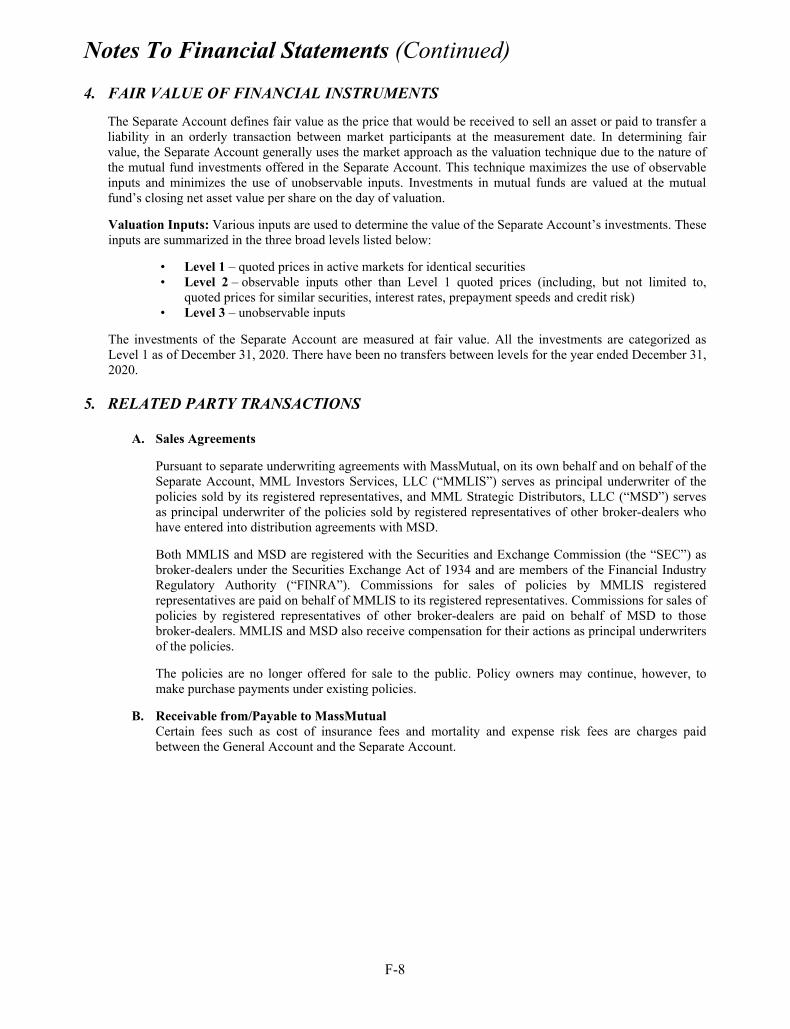
4. FAIR VALUE OF FINANCIAL INSTRUMENTS
The Separate Account defines fair value as the price that would be received to sell an asset or paid to transfer a liability in an orderly transaction between market participants at the measurement date. In determining fair value, the Separate Account generally uses the market approach as the valuation technique due to the nature of the mutual fund investments offered in the Separate Account. This technique maximizes the use of observable inputs and minimizes the use of unobservable inputs. Investments in mutual funds are valued at the mutual fund’s closing net asset value per share on the day of valuation.
Valuation Inputs: Various inputs are used to determine the value of the Separate Account’s investments. These inputs are summarized in the three broad levels listed below:
• Level 1 – quoted prices in active markets for identical securities • Level 2 – observable inputs other than Level 1 quoted prices (including, but not limited to,
quoted prices for similar securities, interest rates, prepayment speeds and credit risk) • Level 3 – unobservable inputs
The investments of the Separate Account are measured at fair value. All the investments are categorized as Level 1 as of December 31, 2020. There have been no transfers between levels for the year ended December 31, 2020.
5. RELATED PARTY TRANSACTIONS
A. Sales Agreements
Pursuant to separate underwriting agreements with MassMutual, on its own behalf and on behalf of the Separate Account, MML Investors Services, LLC (“MMLIS”) serves as principal underwriter of the policies sold by its registered representatives, and MML Strategic Distributors, LLC (“MSD”) serves as principal underwriter of the policies sold by registered representatives of other broker-dealers who have entered into distribution agreements with MSD.
Both MMLIS and MSD are registered with the Securities and Exchange Commission (the “SEC”) as broker-dealers under the Securities Exchange Act of 1934 and are members of the Financial Industry Regulatory Authority (“FINRA”). Commissions for sales of policies by MMLIS registered representatives are paid on behalf of MMLIS to its registered representatives. Commissions for sales of policies by registered representatives of other broker-dealers are paid on behalf of MSD to those broker-dealers. MMLIS and MSD also receive compensation for their actions as principal underwriters of the policies.
The policies are no longer offered for sale to the public. Policy owners may continue, however, to make purchase payments under existing policies.
B. Receivable from/Payable to MassMutualCertain fees such as cost of insurance fees and mortality and expense risk fees are charges paid between the General Account and the Separate Account.
Notes To Financial Statements (Continued)
F-9
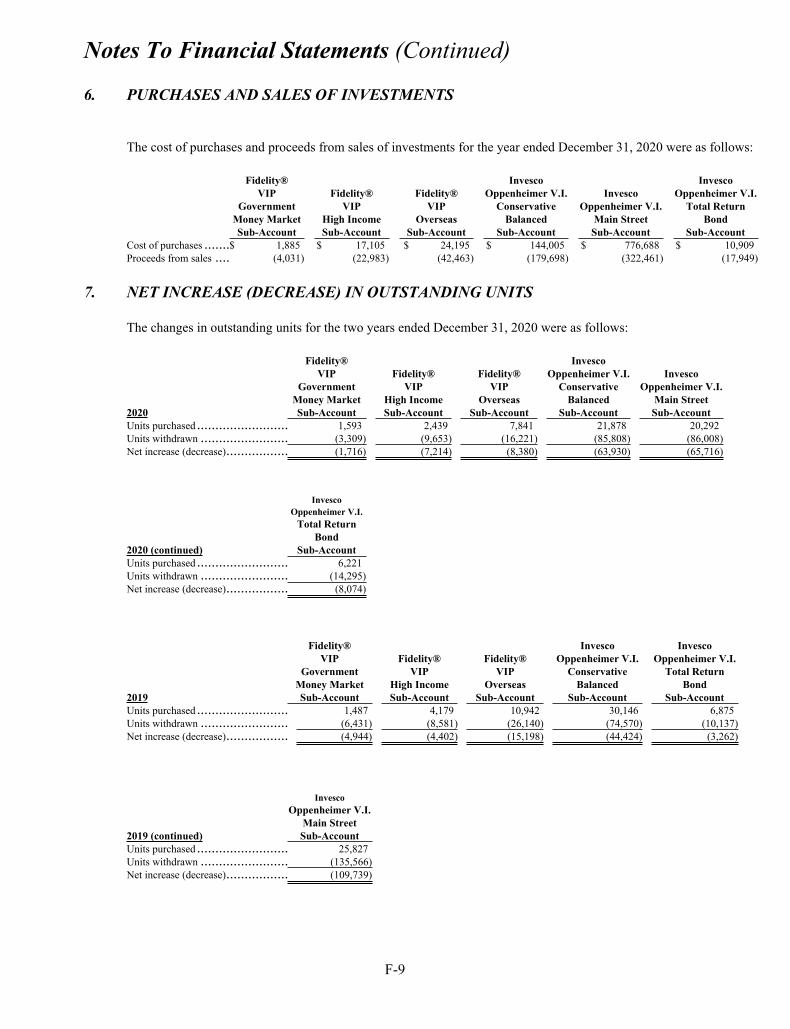
6. PURCHASES AND SALES OF INVESTMENTS
The cost of purchases and proceeds from sales of investments for the year ended December 31, 2020 were as follows:
Government VIP VIP Conservative Oppenheimer V.I. Total ReturnMoney Market High Income Overseas Balanced Main Street BondSub-Account Sub-Account Sub-Account Sub-Account Sub-Account Sub-Account
1The investment income ratios represent the dividends excluding distributions of capital gains, received by the sub-accounts from the underlying mutual fund, net of management fees assessed by the fund manager, divided by the average net assets. These ratios exclude those expenses, such as mortality and expense charges, that are assessed against policy owner accounts either through reductions in the unit values or the redemption of units. The recognition of investment income by the sub-accounts is affected by the timing of the declaration of dividends by the underlying fund in which the sub-account invests.
2The expense ratios represent the annualized policy expenses of the Separate Account, consisting primarily of mortality and expense charges, for each period indicated. The ratios include only those expenses that result in a direct reduction of unit values. Charges made directly to policy owner accounts through the redemption of units and expenses of the underlying fund have been excluded.
Notes To Financial Statements (Continued)
F-11
3The total returns are for the periods indicated, including changes in the value of the underlying fund, and the expenses assessed through the reduction of unit values. These ratios do not include any expenses assessed through the redemption of units. Investment options with a date notation indicate the effective date of that investment option in the variable account. The total return is calculated for each period indicated or from the effective date through the end of the reporting period. As the total return is presented as a range of minimum to maximum values, based on the product grouping representing the minimum and maximum expense ratio amounts.
4 Effective after the close of the New York Stock Exchange on May 24, 2019, Invesco Ltd. completed its acquisition of OppenheimerFunds, Inc. See Note 2 to the financial statements for information regarding the merger of this Sub-Account.
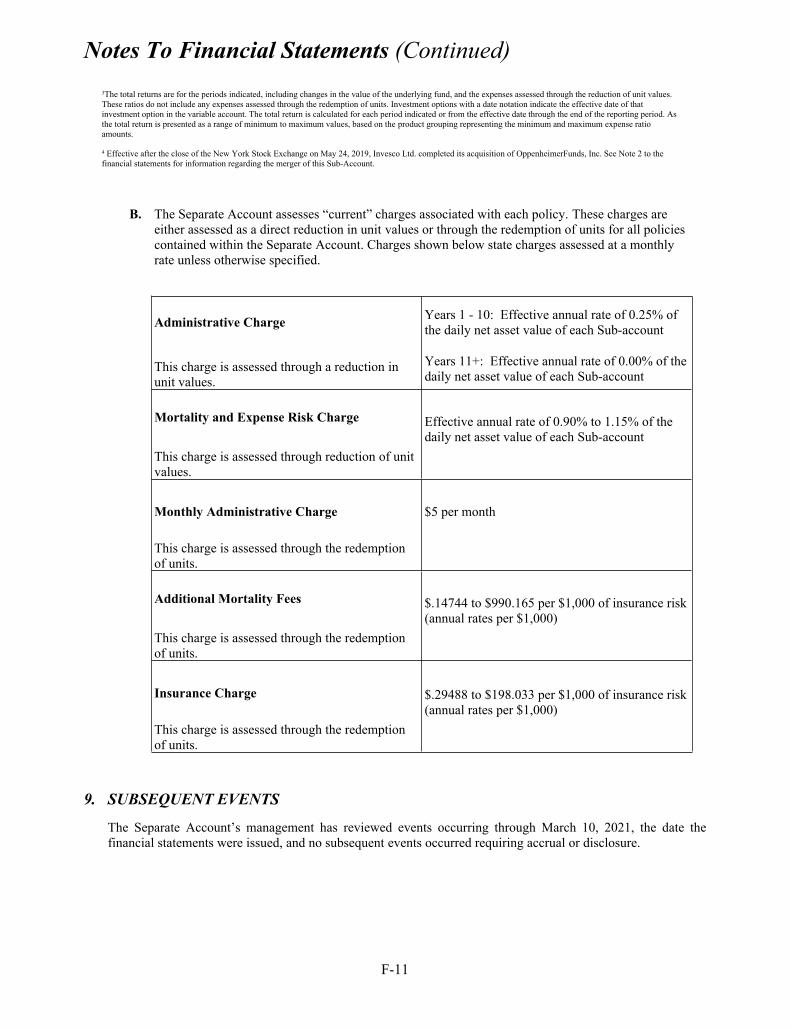
B. The Separate Account assesses “current” charges associated with each policy. These charges are either assessed as a direct reduction in unit values or through the redemption of units for all policies contained within the Separate Account. Charges shown below state charges assessed at a monthly rate unless otherwise specified.
Administrative Charge Years 1 - 10: Effective annual rate of 0.25% of the daily net asset value of each Sub-account
This charge is assessed through a reduction in unit values.
Years 11+: Effective annual rate of 0.00% of the daily net asset value of each Sub-account
Mortality and Expense Risk Charge Effective annual rate of 0.90% to 1.15% of the daily net asset value of each Sub-account
This charge is assessed through reduction of unit values.
Monthly Administrative Charge $5 per month
This charge is assessed through the redemption of units.
Additional Mortality Fees $.14744 to $990.165 per $1,000 of insurance risk (annual rates per $1,000)
This charge is assessed through the redemption of units.
Insurance Charge $.29488 to $198.033 per $1,000 of insurance risk (annual rates per $1,000)
This charge is assessed through the redemption of units.
9. SUBSEQUENT EVENTS
The Separate Account’s management has reviewed events occurring through March 10, 2021, the date the financial statements were issued, and no subsequent events occurred requiring accrual or disclosure.
LA2052
C.M. LIFE INSURANCE COMPANY
STATUTORY FINANCIAL STATEMENTS
As of December 31, 2020 and 2019 and for the years ended December 31, 2020, 2019 and 2018
C.M. LIFE INSURANCE COMPANY STATUTORY FINANCIAL STATEMENTS
Table of Contents
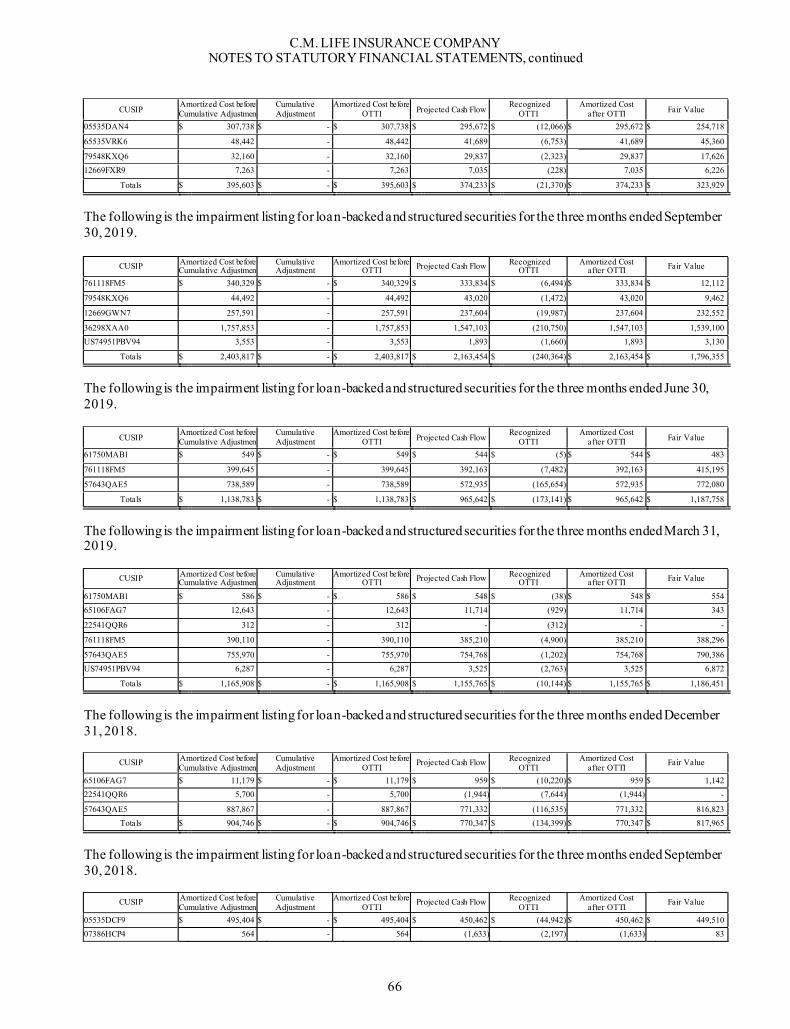
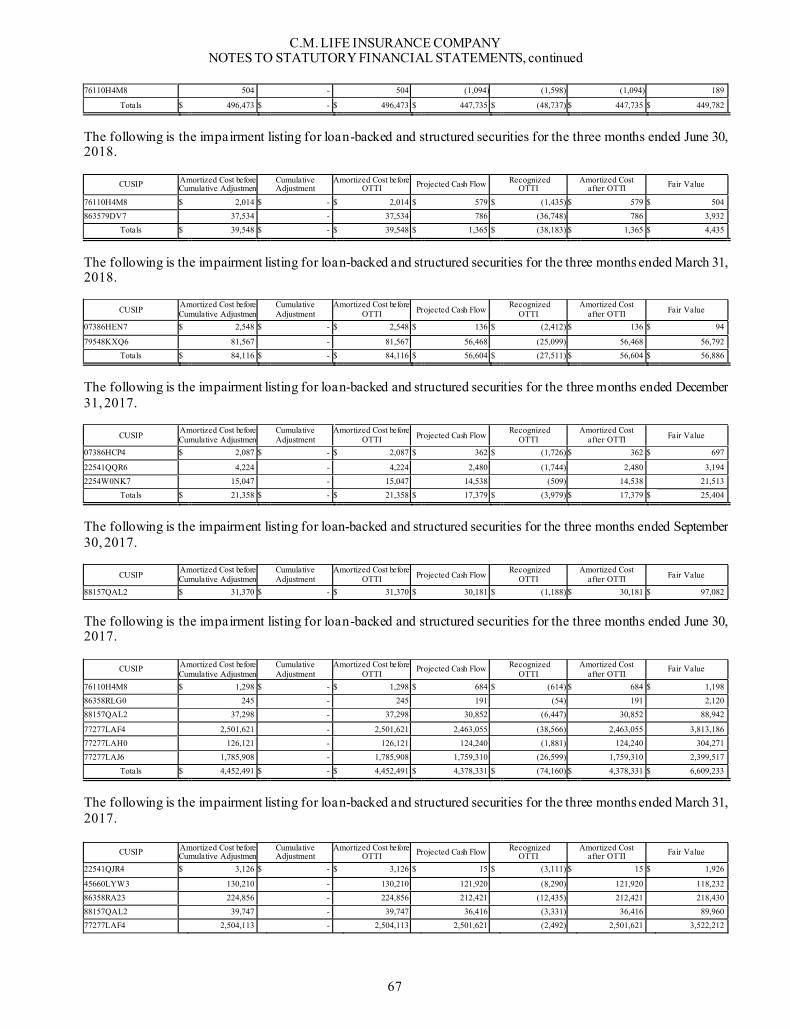
Page Independent Auditors' Report ........................................................................................ 1 Statutory Statements of Financial Position ........................................................................ 3 Statutory Statements of Operations ................................................................................. 4 Statutory Statements of Changes in Capital and surplus ........................................................ 5 Statutory Statements of Cash Flows ................................................................................ 6 Notes to Statutory Financial Statements: 1. Nature of operations .................................................................................... 7 2. Summary of significant accounting policies........................................................ 7 3. New accounting standards ............................................................................. 17 4. Fair value of financial instruments ................................................................... 19 5. Investments a . Bonds ...................................................................................................... 25 b. Preferred stocks .......................................................................................... 30 c. Common stocks - subsidiary and affiliates ......................................................... 30 d. Common stocks - unaffiliated ......................................................................... 31 e. Mortgage loans........................................................................................... 31 f. Partnerships and limited liability companies ....................................................... 36 g. Derivatives................................................................................................ 36 h. Repurchase agreements................................................................................. 40 i. Net investment income ................................................................................. 41 j. Net realized capital (losses) gains .................................................................... 41 6. Federal income taxes.................................................................................... 43 7. Deferred and uncollected life insurance premium ................................................. 49 8. Policyholders’ liabilities ............................................................................... 50 9. Reinsurance............................................................................................... 52 10. Withdrawal characteristics............................................................................. 54 11. Capital and surplus ...................................................................................... 56 12. Presentation of the Statutory Statements of Cash Flows ......................................... 57 13. Business risks, commitments and contingencies .................................................. 57 14. Related party transactions.............................................................................. 60 15. Subsidiaries and affiliated companies ............................................................... 61 16. Subsequent events ....................................................................................... 63 17. Impairment listing for loan-backed and structured securities ................................... 64
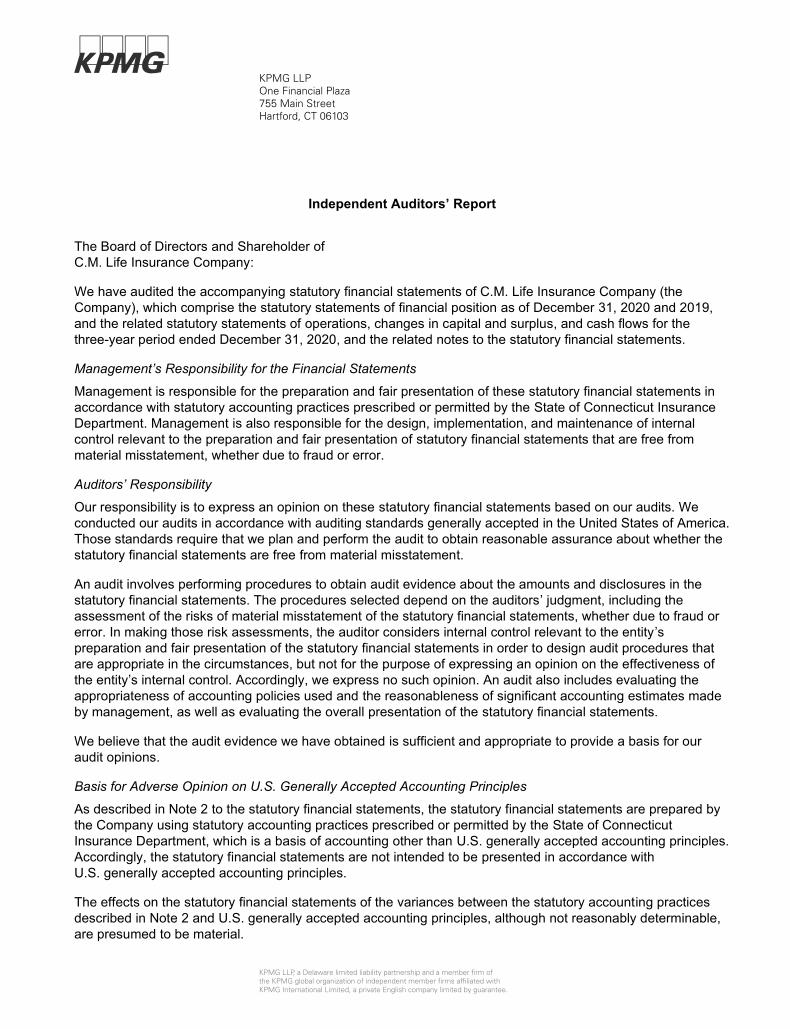
KPMG LLPOne Financial Plaza755 Main StreetHartford, CT 06103
KPMG LLP, a Delaware limited liability partnership and a member firm of the KPMG global organization of independent member firms affiliated with KPMG International Limited, a private English company limited by guarantee.
Independent Auditors’ Report
The Board of Directors and Shareholder of C.M. Life Insurance Company:
We have audited the accompanying statutory financial statements of C.M. Life Insurance Company (the Company), which comprise the statutory statements of financial position as of December 31, 2020 and 2019, and the related statutory statements of operations, changes in capital and surplus, and cash flows for the three-year period ended December 31, 2020, and the related notes to the statutory financial statements.
Management’s Responsibility for the Financial Statements
Management is responsible for the preparation and fair presentation of these statutory financial statements in accordance with statutory accounting practices prescribed or permitted by the State of Connecticut Insurance Department. Management is also responsible for the design, implementation, and maintenance of internal control relevant to the preparation and fair presentation of statutory financial statements that are free from material misstatement, whether due to fraud or error.
Auditors’ Responsibility
Our responsibility is to express an opinion on these statutory financial statements based on our audits. We conducted our audits in accordance with auditing standards generally accepted in the United States of America. Those standards require that we plan and perform the audit to obtain reasonable assurance about whether the statutory financial statements are free from material misstatement.
An audit involves performing procedures to obtain audit evidence about the amounts and disclosures in the statutory financial statements. The procedures selected depend on the auditors’ judgment, including the assessment of the risks of material misstatement of the statutory financial statements, whether due to fraud or error. In making those risk assessments, the auditor considers internal control relevant to the entity’s preparation and fair presentation of the statutory financial statements in order to design audit procedures that are appropriate in the circumstances, but not for the purpose of expressing an opinion on the effectiveness of the entity’s internal control. Accordingly, we express no such opinion. An audit also includes evaluating the appropriateness of accounting policies used and the reasonableness of significant accounting estimates made by management, as well as evaluating the overall presentation of the statutory financial statements.
We believe that the audit evidence we have obtained is sufficient and appropriate to provide a basis for our audit opinions.
Basis for Adverse Opinion on U.S. Generally Accepted Accounting Principles
As described in Note 2 to the statutory financial statements, the statutory financial statements are prepared by the Company using statutory accounting practices prescribed or permitted by the State of Connecticut Insurance Department, which is a basis of accounting other than U.S. generally accepted accounting principles. Accordingly, the statutory financial statements are not intended to be presented in accordance with U.S. generally accepted accounting principles.
The effects on the statutory financial statements of the variances between the statutory accounting practices described in Note 2 and U.S. generally accepted accounting principles, although not reasonably determinable, are presumed to be material.
2
Adverse Opinion on U.S. Generally Accepted Accounting Principles
In our opinion, because of the significance of the variances between statutory accounting practices and U.S. generally accepted accounting principles discussed in the Basis for Adverse Opinion on U.S. Generally Accepted Accounting Principles paragraph, the statutory financial statements referred to above do not present fairly, in accordance with U.S. generally accepted accounting principles, the financial position of the Company as of December 31, 2020 and 2019, or the results of its operations or its cash flows for the three-year period ended December 31, 2020.
Opinion on Statutory Basis of Accounting
In our opinion, the statutory financial statements referred to above present fairly, in all material respects, the financial position of the Company as of December 31, 2020 and 2019, and the results of its operations and its cash flows for the three-year period ended December 31, 2020, in accordance with statutory accounting practices prescribed or permitted by the State of Connecticut Insurance Department described in Note 2.
Hartford, Connecticut February 24, 2021
C.M. LIFE INSURANCE COMPANY STATUTORY STATEMENTS OF FINANCIAL POSITION
See notes to statutory financial statements 3
As of December 31, 2020 2019 ($ In Millions Except for Par Value) Assets: Bonds $ 4,069 $ 3,810 Preferred stocks 5 7 Common stocks – subsidiary and affiliates 294 311 Common stocks – unaffiliated 5 4 Mortgage loans 943 933 Policy loans 153 151 Partnerships and limited liability companies 164 161 Derivatives 960 533 Cash, cash equivalents and short-term investments 335 463 Other invested assets 367 315 Total invested assets 7,295 6,688 Investment income due and accrued 114 93 Federal income taxes 6 2 Net deferred income taxes 4 30 Other than invested assets 20 16 Total assets excluding separate accounts 7,439 6,829 Separate account assets 1,972 1,810 Total assets $ 9,411 $ 8,639 Liabilities: Policyholders' reserves $ 3,900 $ 3,939 Liabilities for deposit-type contracts 69 86 Contract claims and other benefits 24 19 Transfers due from separate accounts (4) (4) Payable to parent 21 33 Asset valuation reserve 103 107 Collateral 249 114 Derivatives 941 593 Other liabilities 397 207 Total liabilities excluding separate accounts 5,700 5,094 Separate account liabilities 1,972 1,810 Total liabilities 7,672 6,904 Capital and surplus: Common stock, $200 par value 50,000 shares authorized, 12,500 shares issued and outstanding 3 3 Paid-in and contributed surplus 450 450 Surplus 1,286 1,282 Total capital and surplus 1,739 1,735 Total capital and surplus $ 9,411 $ 8,639
C.M. LIFE INSURANCE COMPANY STATUTORY STATEMENTS OF OPERATIONS
See notes to statutory financial statements 4
Years Ended December 31, 2020 2019 2018 (In Millions) Revenue: Premium income $ 279 $ 315 $ 332 Net investment income 279 327 296 Fees and other income 99 127 130 Total revenue 657 769 758 Benefits, expenses and other deductions: Policyholders' benefits 575 635 650 Change in policyholders' reserves (159) (186) (167) General insurance expenses 78 114 117 Commissions 41 57 60 State taxes, licenses and fees 10 12 12 Other deductions (4) (6) (7) Total benefits, expenses and other deductions 541 626 665 Net gain from operations before federal income taxes 116 143 93 Federal income tax expense 7 20 7 Net gain from operations 109 123 86 Net realized capital (losses) gains (7) (7) 1
Net income $ 102 $ 116 $ 87
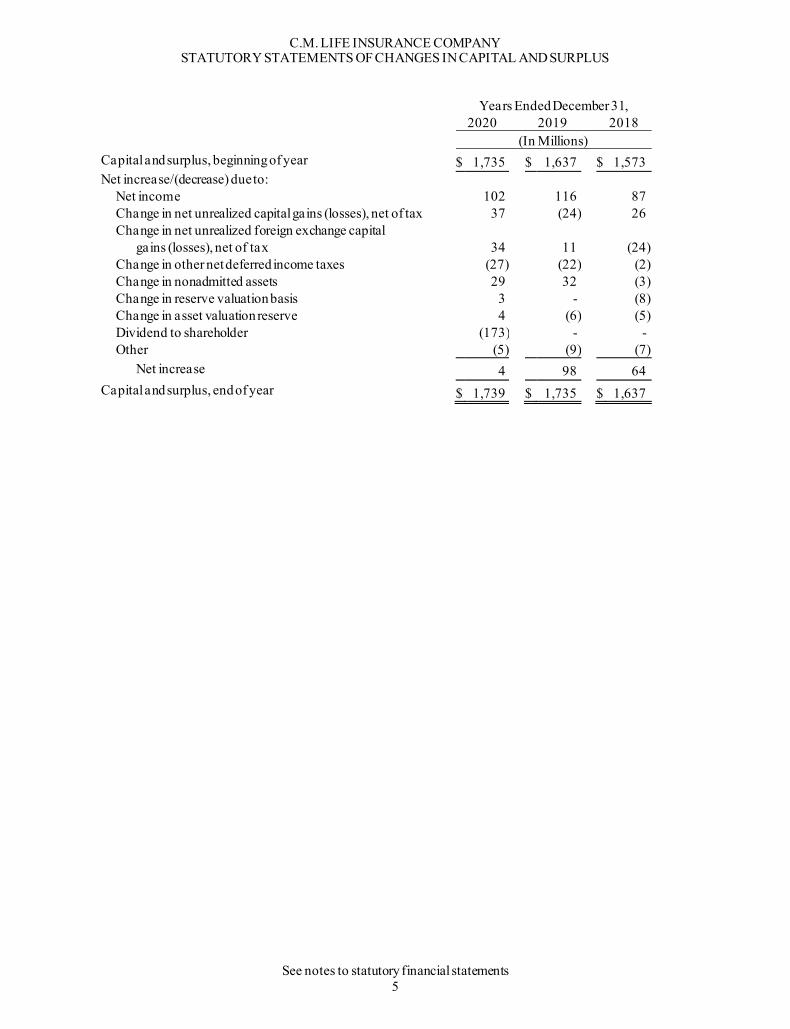
C.M. LIFE INSURANCE COMPANY STATUTORY STATEMENTS OF CHANGES IN CAPITAL AND SURPLUS
See notes to statutory financial statements 5
Years Ended December 31, 2020 2019 2018 (In Millions) Capital and surplus, beginning of year $ 1,735 $ 1,637 $ 1,573 Net increase/(decrease) due to: Net income 102 116 87 Change in net unrealized capital gains (losses), net of tax 37 (24) 26 Change in net unrealized foreign exchange capital gains (losses), net of tax 34 11 (24) Change in other net deferred income taxes (27) (22) (2) Change in nonadmitted assets 29 32 (3) Change in reserve valuation basis 3 - (8) Change in asset valuation reserve 4 (6) (5) Dividend to shareholder (173) - - Other (5) (9) (7) Net increase 4 98 64 Capital and surplus, end of year $ 1,739 $ 1,735 $ 1,637
C.M. LIFE INSURANCE COMPANY STATUTORY STATEMENTS OF CASH FLOWS
See notes to statutory financial statements 6
Years Ended December 31, 2020 2019 2018 (In Millions) Cash from operations: Premium collected net of reinsurance $ 374 $ 426 $ 469 Net investment income 270 336 294 Benefit payments (568) (637) (645) Net transfers from separate accounts 122 154 136 Commissions and other expenses (142) (206) (179) Federal and foreign income taxes paid (15) (12) (31) Net cash from operations 41 61 44 Cash from investments: Proceeds from investments sold, matured or repaid: Bonds 682 910 764 Preferred and common stocks – unaffiliated 5 23 7 Common stocks – affiliated - (4) 6 Mortgage loans 111 89 80 Partnerships and limited liability companies 11 33 71 Derivatives 115 80 (41) Other (54) (92) 39 Total investment proceeds 870 1,039 926 Cost of investments acquired: Bonds (904) (647) (740) Preferred and common stocks – unaffiliated - (3) (4) Common stocks – affiliated (2) - - Mortgage loans (120) (97) (67) Partnerships and limited liability companies (22) (31) (44) Derivatives (5) (7) (4) Other - (14) 15 Total investments acquired (1,053) (799) (844) Net increase in policy loans (2) (2) (1) Net cash from investing activities (185) 238 81 Cash from financing and miscellaneous sources: Net (withdrawals) deposits on deposit-type contracts (18) (14) 3 Change in repurchase and reverse repurchase agreements - (233) 1 Change in collateral 134 74 (29) Other cash used (100) (54) (13) Net cash from financing and miscellaneous sources 16 (227) (38) Net change in cash, cash equivalents and short-term investments (128) 72 87 Cash, cash equivalents and short-term investments, beginning of period 463 391 304 Cash, cash equivalents and short-term investments, end of period $ 335 $ 463 $ 391
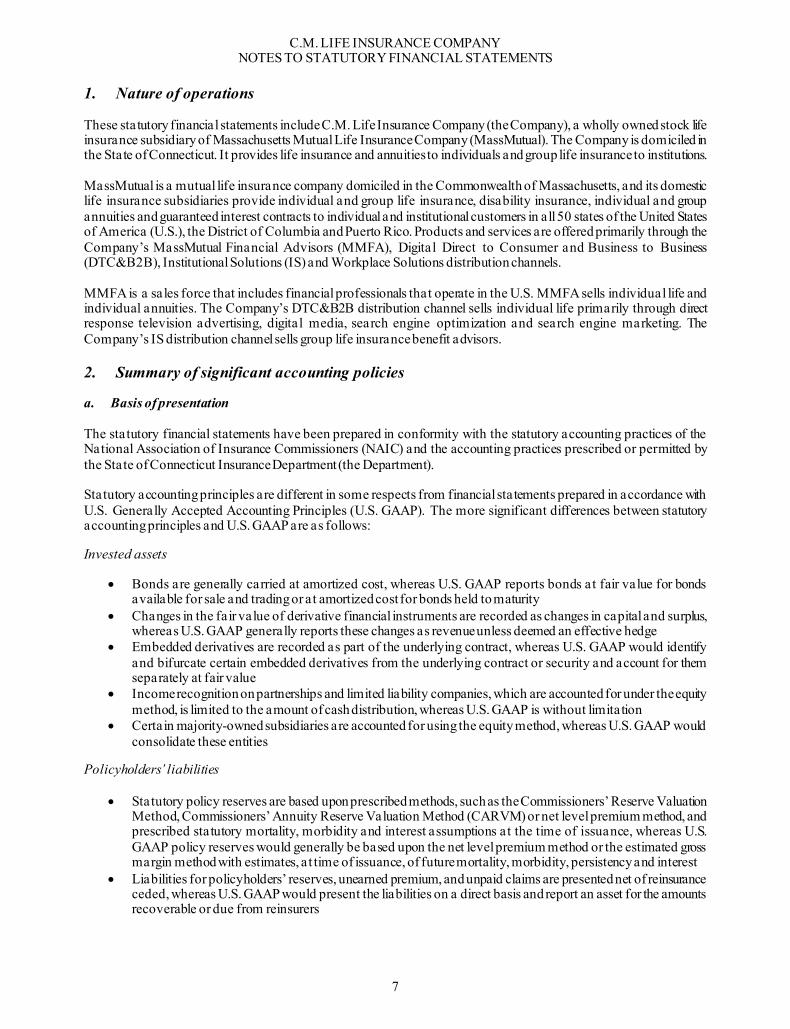
C.M. LIFE INSURANCE COMPANY NOTES TO STATUTORY FINANCIAL STATEMENTS
7
1. Nature of operations These statutory financial statements include C.M. Life Insurance Company (the Company), a wholly owned stock life insurance subsidiary of Massachusetts Mutual Life Insurance Company (MassMutual). The Company is domiciled in the State of Connecticut. It provides life insurance and annuities to individuals and group life insurance to institutions. MassMutual is a mutual life insurance company domiciled in the Commonwealth of Massachusetts, and its domestic life insurance subsidiaries provide individual and group life insurance, disability insurance, individual and group annuities and guaranteed interest contracts to individual and institutional customers in all 50 states of the United States of America (U.S.), the District of Columbia and Puerto Rico. Products and services are offered primarily through the Company’s MassMutual Financial Advisors (MMFA), Digital Direct to Consumer and Business to Business (DTC&B2B), Institutional Solutions (IS) and Workplace Solutions distribution channels. MMFA is a sales force that includes financial professionals that operate in the U.S. MMFA sells individual life and individual annuities. The Company’s DTC&B2B distribution channel sells individual life primarily through direct response television advertising, digital media, search engine optimization and search engine marketing. The Company’s IS distribution channel sells group life insurance benefit advisors. 2. Summary of significant accounting policies a. Basis of presentation The statutory financial statements have been prepared in conformity with the statutory accounting practices of the National Association of Insurance Commissioners (NAIC) and the accounting practices prescribed or permitted by the State of Connecticut Insurance Department (the Department). Statutory accounting principles are different in some respects from financial statements prepared in accordance with U.S. Generally Accepted Accounting Principles (U.S. GAAP). The more significant differences between statutory accounting principles and U.S. GAAP are as follows:
Invested assets
Bonds are generally carried at amortized cost, whereas U.S. GAAP reports bonds at fair value for bonds available for sale and trading or at amortized cost for bonds held to maturity
Changes in the fair value of derivative financial instruments are recorded as changes in capital and surplus, whereas U.S. GAAP generally reports these changes as revenue unless deemed an effective hedge
Embedded derivatives are recorded as part of the underlying contract, whereas U.S. GAAP would identify and bifurcate certain embedded derivatives from the underlying contract or security and account for them separately at fair value
Income recognition on partnerships and limited liability companies, which are accounted for under the equity method, is limited to the amount of cash distribution, whereas U.S. GAAP is without limitation
Certain majority-owned subsidiaries are accounted for using the equity method, whereas U.S. GAAP would consolidate these entities
Policyholders’ liabilities
Statutory policy reserves are based upon prescribed methods, such as the Commissioners’ Reserve Valuation Method, Commissioners’ Annuity Reserve Valuation Method (CARVM) or net level premium method, and prescribed statutory mortality, morbidity and interest assumptions at the time of issuance, whereas U.S. GAAP policy reserves would generally be based upon the net level premium method or the estimated gross margin method with estimates, at time of issuance, of future mortality, morbidity, persistency and interest
Liabilities for policyholders’ reserves, unearned premium, and unpaid claims are presented net of reinsurance ceded, whereas U.S. GAAP would present the liabilities on a direct basis and report an asset for the amounts recoverable or due from reinsurers
C.M. LIFE INSURANCE COMPANY NOTES TO STATUTORY FINANCIAL STATEMENTS, continued
8
Payments received for universal and variable life insurance products, certain variable and fixed deferred annuities and group annuity contracts are reported as premium income and corresponding change in reserves, whereas U.S. GAAP would treat these payments as deposits to policyholders’ account balances
General insurance expenses and commissions
Certain acquisition costs, such as commissions and other variable costs, directly related to successfully acquiring new business are charged to current operations as incurred, whereas U.S. GAAP generally would capitalize these expenses and amortize them based on profit emergence over the expected life of the policies or over the premium payment period
Net realized capital (losses) gains
After-tax realized capital (losses) gains that result from changes in the overall level of interest rates for all types of fixed-income investments and interest-related hedging activities are deferred into the interest maintenance reserve (IMR) and amortized into revenue, whereas U.S. GAAP reports these gains and losses as revenue
Capital and surplus
Changes in the balances of deferred income taxes, which provide for book versus tax temporary differences, are subject to limitation and are recorded in surplus, whereas U.S. GAAP would generally include the change in deferred taxes in net income without limitation
Assets are reported at admitted asset value and assets designated as nonadmitted are excluded through a charge against surplus, whereas U.S. GAAP recognizes all assets, net of any valuation allowances
An asset valuation reserve (AVR) is reported as a contingency reserve to stabilize surplus against fluctuations in the statement value of partnerships and limited liability companies and certain common stocks as well as credit-related changes in the value of bonds, mortgage loans and certain derivatives, whereas U.S. GAAP does not record this reserve
Changes to the mortgage loan valuation allowance are recognized in net unrealized capital gains (losses), net of tax, in the Statutory Statements of Changes in Capital and Surplus, whereas U.S. GAAP reports these changes in net realized capital (losses) gains
Statutory Statements of Changes in Capital and Surplus includes net income, change in net unrealized capital gains (losses), change in net unrealized foreign exchange capital gains (losses), change in other net deferred income taxes, change in nonadmitted assets, change in AVR prior period adjustments, whereas U.S. GAAP presents net income as retained earnings and net unrealized capital gains (losses), change in net unrealized foreign exchange capital gains (losses), change in minimum pension liability as other comprehensive income
The change in the fair value for unaffiliated common stock is recorded in surplus, whereas the change in the fair value for ownership interests in an entity not accounted for under the equity method or consolidated are recorded in revenue for U.S. GAAP
The preparation of financial statements requires management to make estimates and assumptions that impact the reported amounts of assets and liabilities, the disclosure of assets and liabilities as of the date of the statutory financial statements and the reported amounts of revenues and expenses during the reporting periods. The most significant estimates include those used in determining the carrying values of investments including the amount of mortgage loan investment valuation reserves, other-than-temporary impairment(s) (OTTI), the liabilities for policyholders’ reserves, the determination of admissible deferred tax assets (DTA), the liability for taxes and the liability for litigation or other contingencies. Future events including, but not limited to, changes in the level of mortality, morbidity, interest rates, persistency, asset valuations and defaults could cause results to differ from the estimates used in the statutory financial statements. Although some variability is inherent in these estimates, management believes the amounts presented are appropriate. Certain prior year amounts within these financial statements have been reclassified to conform to the current year presentation.
C.M. LIFE INSURANCE COMPANY NOTES TO STATUTORY FINANCIAL STATEMENTS, continued
9
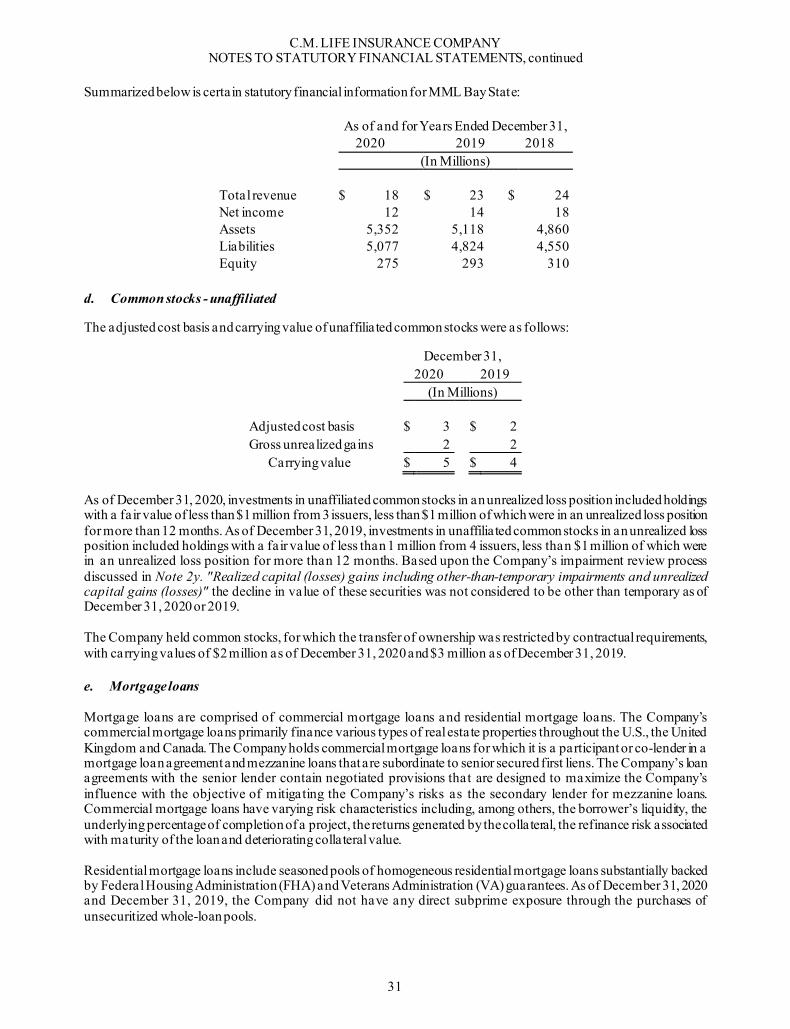
b. Bonds Bonds are generally valued at amortized cost using the constant yield interest method with the exception of NAIC Category 6 bonds, which are in or near default, and certain residential mortgage-backed securities (RMBS) and commercial mortgage-backed securities (CMBS), which are rated by outside modelers, which are carried at the lower of amortized cost or fair value. NAIC ratings are applied to bonds and other investments. Categories 1 and 2 are considered investment grade, while Categories 3 through 6 are considered below investment grade. Bonds are recorded on a trade date basis, except for private placement bonds, which are recorded on the funding date. For loan-backed and structured securities, such as asset-backed securities (ABS), mortgage-backed securities (MBS), including RMBS and CMBS, and structured securities, including collateralized debt obligations (CDOs), amortization or accretion is revalued quarterly based on the current estimated cash flows, using either the prospective or retrospective adjustment methodologies. Fixed income securities, with the highest ratings from a rating agency follow the retrospective method of accounting. All other fixed income securities, such as floating rate bonds and interest only securities, including those that have been impaired, follow the prospective method of accounting. The fair value of bonds is based on quoted market prices when available. If quoted market prices are not available, values provided by other third-party organizations are used. If values provided by other third-party organizations are unavailable, fair value is estimated using internal models by discounting expected future cash flows using observable current market rates applicable to yield, credit quality and maturity of the investment or using quoted market values for comparable investments. Internal inputs used in the determination of fair value include estimated prepayment speeds, default rates, discount rates and collateral values, among others. Structure characteristics and cash flow priority are also considered. Fair values resulting from internal models are those expected to be received in an orderly transaction between willing market participants. Refer to Note 2y. "Realized capital (losses) gains including other-than-temporary impairments and unrealized capital gains (losses)" for information on the Company’s policy for determining OTTI. c. Preferred stocks Preferred stocks in good standing, those that are rated Categories 1 through 3 by the Securities Valuation Office (SVO) of the NAIC, are generally valued at amortized cost. Preferred stocks not in good standing, those that are rated Categories 4 through 6 by the SVO of the NAIC, are valued at the lower of amortized cost or fair value. Fair values are based on quoted market prices, when available. If quoted market prices are not available, values provided by third-party organizations are used. If values provided by third-party organizations are unavailable, fair value is estimated using internal models. These models use inputs not directly observable or correlated with observable market data. Typical inputs integrated into the Company’s internal discounted expected earnings models include, but are not limited to, earnings before interest, taxes, depreciation and amortization estimates. Fair values resulting from internal models are those expected to be received in an orderly transaction between willing market participants. Refer to Note 2y. "Realized capital (losses) gains including other-than-temporary impairments and unrealized capital gains (losses)" for information on the Company’s policy for determining OTTI. d. Common stock - subsidiary and affiliate The Company accounts for the value of its subsidiary and affiliate, primarily, MML Bay State Life Insurance Company (MML Bay State), a wholly owned stock life insurance subsidiary, at their underlying statutory net equity. MML Bay State’s operating results, less dividends declared, are reflected as net unrealized capital gains in the Statutory Statements of Changes in Capital and Surplus. Dividends are recorded in net investment income when declared. The cost basis of common stock – subsidiary and affiliate is adjusted for impairments deemed to be other than temporary consistent with common stocks - unaffiliated.
C.M. LIFE INSURANCE COMPANY NOTES TO STATUTORY FINANCIAL STATEMENTS, continued
10
e. Common stocks - unaffiliated Unaffiliated common stocks are carried at fair value, which is based on quoted market prices when available. If quoted market prices are not available, values provided by third-party organizations are used. If values from third parties are unavailable, fair values are determined by management using estimates based upon internal models. The Company’s internal models include estimates based upon comparable company analysis, review of financial statements, broker quotes and last traded price. Fair values resulting from internal models are those expected to be received in an orderly transaction between willing market participants. Refer to Note 2y. "Realized capital (losses) gains including other-than-temporary impairments and unrealized capital gains (losses)" for information on the Company’s policy for determining OTTI. f. Mortgage loans Mortgage loans are valued at the unpaid principal balance of the loan, net of unamortized premium, discount, mortgage origination fees and valuation allowances. Interest income earned on impaired loans is accrued on the outstanding principal balance of the loan based on the loan’s contractual coupon rate. Interest is not accrued for (a) impaired loans more than 60 days past due, (b) delinquent loans more than 90 days past due, or (c) loans that have interest that is not expected to be collected. The Company continually monitors mortgage loans where the accrual of interest has been discontinued, and will resume the accrual of interest on a mortgage loan when the facts and circumstances of the borrower and property indicate that the payments will continue to be received according to the terms of the original or modified mortgage loan agreement. Refer to Note 2y. "Realized capital (losses) gains including other-than-temporary impairments and unrealized capital gains (losses)" for information on the Company’s policy for determining OTTI. g. Policy loans Policy loans are carried at the outstanding loan balance less amounts unsecured by the cash surrender value of the policy and amounts ceded to reinsurers. h. Partnerships and limited liability companies
Partnerships and limited liability companies, except for partnerships that generate and realize low income housing tax credits (LIHTCs), are accounted for using the equity method with the change in the equity value of the underlying investment recorded in surplus. Distributions received are recognized as net investment income to the extent the distribution does not exceed previously recorded accumulated undistributed earnings.
Investments in partnerships that generate LIHTCs are carried at amortized cost unless considered impaired. Under the amortized cost method, the excess of the carrying value of the investment over its estimated residual value is amortized into net investment income during the period in which tax benefits are recognized.
The equity method is suspended if the carrying value of the investment is reduced to zero due to losses from the investment. Once the equity method is suspended, losses are not recorded until the investment returns to profitability and the equity method is resumed. However, if the Company has guaranteed obligations of the investment or is otherwise committed to provide further financial support for the investment, losses will continue to be reported up to the amount of those guaranteed obligations or commitments.
Refer to Note 2y. "Realized capital (losses) gains including other-than-temporary impairments and unrealized capital gains (losses)" for information on the Company’s policy for determining OTTI. i. Derivatives Derivatives are carried at fair value, which is based primarily upon quotations obtained from counterparties and independent sources. These quotations are compared to internally derived prices and a price challenge is lodged with the counterparties and independent sources when a significant difference cannot be explained by appropriate
C.M. LIFE INSURANCE COMPANY NOTES TO STATUTORY FINANCIAL STATEMENTS, continued
11
adjustments to the internal model. When quoted market values are not reliable or available, the value is based on an internal valuation process using market observable inputs that other market participants would use. Changes in the fair value of these instruments are recorded as unrealized capital gains (losses) in capital and surplus. Gains and losses realized on settlement, termination, closing or assignment of contracts are recorded in net realized capital (losses) gains. Amounts receivable and payable are accrued as net investment income.
j. Cash, cash equivalents and short-term investments
Cash and cash equivalents, which are carried at amortized cost, consist of all highly liquid investments purchased with original maturities of three months or less.
Short-term investments, which are carried at amortized cost, consist of short-term bonds and all highly liquid investments purchased with maturities of greater than three months and less than or equal to 12 months.
The carrying value reported in the Statutory Statements of Financial Position for cash, cash equivalents and short-term investment instruments approximates the fair value.
k. Investment income due and accrued Accrued investment income consists primarily of interest and dividends. Interest is recognized on an accrual basis and dividends are recorded as earned on the ex-dividend date.
l. Other than invested assets
Other than invested assets primarily includes deferred and uncollected life insurance premium, reinsurance recoverables and other receivables.
m. Separate accounts Separate and sub-accounts accounts are segregated funds administered and invested by the Company, the performance of which primarily benefits the policyholders/contract holders with an interest in the separate accounts. Group and individual variable annuity, variable life and other insurance policyholders/contract holders select from among the separate accounts and sub-accounts made available by the Company. The separate accounts and sub-accounts are offered as investment options under certain insurance contracts or policies. The returns produced by separate account assets increase or decrease separate account reserves. Separate account assets consist principally of marketable securities reported at fair value. Separate account assets can only be used to satisfy separate account liabilities and are not available to satisfy the general obligations of the Company. Separate account administrative and investment advisory fees are included in fees and other income. The Company only has separate accounts classified as nonguaranteed for which the policyholder/contract holder assumes the investment risk. Premium income, benefits and expenses of the separate accounts are included in the Statutory Statements of Operations with the offset recorded in the change in policyholders’ reserves. Investment income, realized capital (losses) gains and unrealized capital gains (losses) on the assets of separate accounts accrue to policyholders/contract holders and are not recorded in the Statutory Statements of Operations. n. Nonadmitted assets Assets designated as nonadmitted by the NAIC primarily include the amount of DTAs (subject to certain limitations) that will not be realized by the end of the third calendar year following the current year end, certain investments in partnerships and limited liability companies for which qualifying audits are not performed, advances and prepayments, investment income due and accrued, and certain other receivables. Assets that are designated as nonadmitted are excluded from the Statutory Statements of Financial Position through a charge against capital and surplus.
C.M. LIFE INSURANCE COMPANY NOTES TO STATUTORY FINANCIAL STATEMENTS, continued
12
o. Reinsurance The Company enters into reinsurance agreements with affiliated and unaffiliated insurers in the normal course of business to limit its insurance risk. Premium income, benefits to policyholders (including unpaid claims) and policyholders’ reserves are reported net of reinsurance. Premium, benefits and reserves related to reinsured business are accounted for on bases consistent with those used in accounting for the original policies issued and the terms of the reinsurance contracts. The Company records a receivable for reinsured benefits paid, but not yet reimbursed by the reinsurer and reduces policyholders’ reserves for the portion of insurance liabilities that are reinsured. Commissions and expense allowances on reinsurance ceded are recorded as revenue. p. Policyholders' reserves
Policyholders’ reserves are developed by actuarial methods that will provide for the present value of estimated future obligations in excess of estimated future premium on policies in force and are determined based on either statutory prescribed mortality/morbidity tables using specified interest rates and valuation methods, or principles-based reserving (PBR) under Valuation Manual (VM)-20 which considers a wide range of future economic conditions, computed using justified company experience factors, such as mortality, policyholder behavior and expenses.
On January 1, 2020, the Company transitioned from Actuarial Guideline 43 to VM-21 for valuing guaranteed living benefits on certain annuity products for statutory reserves.
Certain variable universal life and universal life contracts include features such as guaranteed minimum death benefits (GMDB) or other guarantees that ensure continued death benefit coverage when the policy would otherwise lapse. The value of the guarantee is only available to the beneficiary in the form of a death benefit. The liability for variable and universal life GMDBs and other guarantees is included in policyholders’ reserves and the related change in this liability is included in change in policyholders’ reserves in the Statutory Statements of Operations. The fixed index annuity (FIA) product offers guaranteed lifetime withdrawal benefit (GLWB). A GLWB provides the annuity contract holder with a guarantee that a minimum amount will be available for withdrawal annually for life regardless of the contract value. Certain individual variable annuity and fixed annuity products offer GMDBs. The liability for GMDBs is included in policyholders’ reserves and the related change in this liability is included in change in policyholders’ reserves in the Statutory Statement of Operations. Tabular interest, tabular reserves, reserves released, and tabular cost for all life and annuity contracts and supplementary contracts involving life contingencies are determined in accordance with NAIC Annual Statement instructions. For tabular interest, whole life and term products use a formula that applies a weighted average interest rate determined from a seriatim valuation file to the mean average reserves. Universal life, variable life, group life, annuity and supplemental contracts use a formula that applies a weighted average credited rate to the mean account value. For contracts without an account value (e.g., a Single Premium Immediate Annuity) a weighted average statutory valuation rate is applied to the mean statutory reserve or accepted actuarial methods using applicable interest rates are applied. All policyholders’ reserves and accruals are presented net of reinsurance. Management believes that these liabilities and accruals represent management’s best estimate and will be sufficient, in conjunction with future revenues, to meet future anticipated obligations of policies and contracts in force. q. Liabilities for deposit-type contracts Liabilities for investment-type contracts such as supplementary contracts not involving life contingencies are based on account value or accepted actuarial methods using applicable interest rates.
C.M. LIFE INSURANCE COMPANY NOTES TO STATUTORY FINANCIAL STATEMENTS, continued
13
r. Transfers due from separate accounts Transfers due from separate accounts represent a net receivable from the Company’s separate accounts. s. Federal income taxes Total federal income taxes are based upon the Company’s best estimate of its current and DTAs or liabilities. Current tax expense (benefit) is reported in the Statutory Statements of Operations as federal income tax expense (benefit) if resulting from operations and within net realized capital (losses) gains if resulting from invested asset transactions. Changes in the balances of deferred taxes, which provide for book-to-tax temporary differences, are subject to limitations and are reported within various lines within surplus. Accordingly, the reporting of book-to-tax temporary differences, such as reserves and policy acquisition costs, and of book-to-tax permanent differences, such as tax-exempt interest and tax credits, results in effective tax rates in the Statutory Statements of Operations that differ from the federal statutory tax rate. t. Asset valuation reserve The Company maintains an AVR that is a contingency reserve to stabilize capital and surplus against fluctuations in the carrying value of common stocks, real estate, partnerships and limited liability companies as well as credit-related changes in the value of bonds, preferred stocks, mortgage loans, and certain derivatives. The AVR is reported as a liability within the Statutory Statements of Financial Position and the change in AVR, net of tax, is reported within the Statutory Statements of Changes in Capital and Surplus. u. Repurchase agreements Repurchase agreements are contracts under which the Company sells securities and simultaneously agrees to repurchase the same or substantially the same securities. These repurchase agreements are carried at cost and accounted for as collateralized borrowings with the proceeds from the sale of the securities recorded as a liability while the underlying securities continue to be recorded as an investment by the Company. Earnings on these investments are recorded as investment income and the difference between the proceeds and the amount at which the securities will be subsequently reacquired is amortized as interest expense. Repurchase agreements are used as a tool for overall portfolio management to help ensure the Company maintains adequate assets in order to provide yield, spread and duration to support liabilities and other corporate needs. The Company provides collateral, as dictated by the repurchase agreements, to the counterparty in exchange for a loan. If the fair value of the securities sold becomes less than the loan, the counterparty may require additional collateral. The carrying value reported in the Statutory Statements of Financial Position for repurchase agreements approximates the fair value. v. Interest maintenance reserve The Company maintains an IMR that is used to stabilize net income against fluctuations in interest rates. After-tax realized capital (losses) gains, which result from changes in interest rates for all types of fixed-income investments and interest-related derivatives, are deferred into the IMR and amortized into net investment income using the grouped amortization method. In the grouped amortization method, assets are grouped based on years of maturity. IMR is reduced by the amount ceded to reinsurers when entering into in force coinsurance ceding agreements. The IMR is included in other liabilities, or if negative, is recorded as a nonadmitted asset.
C.M. LIFE INSURANCE COMPANY NOTES TO STATUTORY FINANCIAL STATEMENTS, continued
14
w. Other liabilities Other liabilities primarily consist of interest due on derivatives, affiliated payables and remittances and items not allocated.
x. Premium and related expense recognition
Life insurance premium revenue is generally recognized annually on the anniversary date of the policy. However, premium for flexible products, primarily universal life and variable universal life contracts, is recognized as revenue when received. Annuity premium is recognized as revenue when received.
Premium revenue is adjusted by the related deferred premium adjustment. Deferred premium adjusts for the overstatement created in the calculation of reserves as the reserve computation assumes the entire year’s net premium is collected annually at the beginning of the policy year and does not take into account installment or modal payments. Commissions and other costs related to issuance of new policies and policy maintenance and settlement costs are charged to current operations when incurred. Surrender fee charges on certain life and annuity products are recorded as a reduction of benefits and expenses.
y. Realized capital (losses) gains including other-than-temporary impairments and unrealized capital gains (losses) Realized capital (losses) gains, net of taxes, exclude gains (losses) deferred into the IMR and gains (losses) of the separate accounts. Realized capital (losses) gains, including OTTI, are recognized in net income and are determined using the specific identification method.
Bonds - general
The Company employs a systematic methodology to evaluate OTTI by conducting a quarterly analysis of bonds. OTTI is evaluated in a manner consistent with market participant assumptions. The Company considers the following factors, where applicable depending on the type of securities, in the evaluation of whether a decline in value is other than temporary: (a) the likelihood that the Company will be able to collect all amounts due according to the contractual terms of the debt security; (b) the present value of the expected future cash flows of the security; (c) the characteristics, quality and value of the underlying collateral or issuer securing the position; (d) collateral structure; (e) the length of time and extent to which the fair value has been below amortized cost; (f) the financial condition and near-term prospects of the issuer; (g) adverse conditions related to the security or industry; (h) the rating of the security; (i) the Company’s ability and intent to hold the investment for a period of time sufficient to allow for an anticipated recovery to amortized cost; and (j) other qualitative and quantitative factors in determining the existence of OTTI including, but not limited to, unrealized loss trend analysis and significant short-term changes in value.
In addition, if the Company has the intent to sell, or the inability, or lack of intent to retain the investment for a period sufficient to recover the amortized cost basis, an OTTI is recognized as a realized loss equal to the entire difference between the investment’s amortized cost basis and its fair value at the balance sheet date.
When a bond is other-than-temporarily impaired, a new cost basis is established.
Bonds - corporate
For corporate securities, if it is determined that a decline in the fair value of a bond is other than temporary, OTTI is recognized as a realized loss equal to the difference between the investment’s amortized cost basis and, generally, its fair value at the balance sheet date.
C.M. LIFE INSURANCE COMPANY NOTES TO STATUTORY FINANCIAL STATEMENTS, continued
15
Bonds - loan-backed and structured securities
For loan-backed and structured securities, if the present value of cash flows expected to be collected is less than the amortized cost basis of the security, an OTTI is recognized as a realized loss equal to the difference between the investment’s amortized cost basis and the present value of cash flows expected to be collected. The expected cash flows are discounted at the security’s effective interest rate. Internal inputs used in determining the amount of the OTTI on structured securities include collateral performance, prepayment speeds, default rates, and loss severity based on borrower and loan characteristics, as well as deal structure including subordination, over-collateralization and cash flow priority.
ABS and MBS are evaluated for OTTI using scenarios and assumptions based on the specifics of each security including collateral type, loan type, vintage and subordination level in the structure. Cash flow estimates are based on these assumptions and inputs obtained from external industry sources along with internal analysis and actual experience. Where applicable, assumptions include prepayment speeds, default rates and loss severity, weighted average maturity and changes in the underlying collateral values.
The Company has a review process for determining if CDOs are at risk for OTTI. For the senior, mezzanine and junior debt tranches, cash flows are modeled using multiple scenarios based on the current ratings and values of the underlying corporate credit risks and incorporating prepayment and default assumptions that vary according to collateral attributes of each CDO. The prepayment and default assumptions are varied within each model based upon rating (base case), historical expectations (default), rating change improvement (optimistic), rating change downgrade (pessimistic) and fair value (market). The default rates produced by these multiple scenarios are assigned an expectation weight according to current market and economic conditions and fed into a final scenario. OTTI is recorded if this final scenario results in the loss of any principal or interest payments due.
For the most subordinated junior CDO tranches, the present value of the projected cash flows in the final scenario is measured using an effective yield. If the current book value of the security is greater than the present value measured using an effective yield, an OTTI is taken in an amount sufficient to produce its effective yield. Certain CDOs cannot be modeled using all of the scenarios because of limitations on the data needed for all scenarios. The cash flows for these CDOs, including foreign currency denominated CDOs, are projected using a customized scenario management believes is reasonable for the applicable collateral pool.
For loan-backed and structured securities, any difference between the new amortized cost basis and any increased present value of future cash flows expected to be collected is accreted into net investment income over the expected remaining life of the bond.
Common and preferred stock
The cost basis of common and preferred stocks is adjusted for impairments deemed to be other than temporary. The Company considers the following factors in the evaluation of whether a decline in value is other than temporary: (a) the financial condition and near-term prospects of the issuer; (b) the Company’s ability and intent to retain the investment for a period sufficient to allow for a near-term recovery in value; and (c) the period and degree to which the value has been below cost. The Company conducts a quarterly analysis of issuers whose common or preferred stock is not-in-good standing or valued below 80% of cost. The Company also considers other qualitative and quantitative factors in determining the existence of OTTI including, but not limited to, unrealized loss trend analysis and significant short-term changes in value.
Mortgage loans
The Company performs internal reviews at least annually to determine if individual mortgage loans are performing or nonperforming. The fair values of performing mortgage loans are estimated by discounting expected future cash flows using current interest rates for similar loans with similar credit risk. For nonperforming loans, the fair value is the estimated collateral value of the underlying real estate. If foreclosure is probable, the Company will obtain an external appraisal.
C.M. LIFE INSURANCE COMPANY NOTES TO STATUTORY FINANCIAL STATEMENTS, continued
16
Mortgage loans are considered to be impaired when, based upon current available information and events, it is probable that the Company will be unable to collect all amounts of principal and interest due according to the contractual terms of the mortgage loan agreement. A valuation allowance is recorded on a loan-by-loan basis in net unrealized capital losses for the excess of the carrying value of the mortgage loan over the fair value of its underlying collateral. Such information or events could include property performance, capital budgets, future lease roll, a property inspection as well as payment trends. Collectability and estimated decreases in collateral values are also assessed on a loan-by-loan basis considering all events and conditions relevant to the loan. This evaluation is inherently subjective as it requires estimates that are susceptible to significant revisions as more information becomes available, as changes occur in the market or as negotiations with the borrowing entity evolve. If there is a change in the fair value of the underlying collateral or the estimated loss on the loan, the valuation allowance is adjusted accordingly. An OTTI occurs upon the realization of a credit loss, typically through foreclosure or after a decision is made to accept a discounted payoff, and is recognized in realized capital losses. The previously recorded valuation allowance is reversed from unrealized capital losses. When an OTTI is recorded, a new cost basis is established reflecting estimated value of the collateral.
Real estate
For real estate held for the production of income, depreciated cost is adjusted for impairments whenever events or changes in circumstances indicate the carrying amount of the asset may not be recoverable, with the impairment being included in realized capital losses. An impairment is recorded when the property’s estimated future net operating cash flows over ten years, undiscounted and without interest charges, is less than book value.
Adjustments to the carrying value of real estate held for sale are recorded in a valuation reserve as realized capital losses when the fair value less estimated selling costs is less than the carrying value.
Partnerships and limited liability companies
When it is probable that the Company will be unable to recover the outstanding carrying value of an investment based on undiscounted cash flows, or there is evidence indicating an inability of the investee to sustain earnings to justify the carrying value of the investment, OTTI is recognized in realized capital losses reflecting the excess of the carrying value over the estimated fair value of the investment. The estimated fair values of limited partnership interests are generally based on the Company’s share of the net asset value (NAV) as provided in the financial statements of the investees. In certain circumstances, management may adjust the NAV by a premium or discount when it has sufficient evidence to support applying such adjustments.
For determining impairments in partnerships that generate LIHTCs, the Company uses the present value of all future benefits, the majority of which are tax credits, discounted at a risk-free rate for future benefits of ten or more years and compares the results to its current book value. Impairments are recognized in realized capital losses reflecting the excess of the carrying value over the estimated fair value of the investment.
Unrealized capital gains (losses)
Unrealized capital gains (losses) include changes in the fair value of derivatives, excluding interest rate swaps and credit default index swaps associated with replicated assets; currency translation adjustments on foreign-denominated bonds; changes in the fair value of unaffiliated common stocks; changes in the fair value of bonds and preferred stocks that are carried at fair value; and changes in the inflation adjustments on U.S Treasury inflation-indexed securities. Changes in the Company’s equity investments in partnerships and limited liability companies, including the earnings as reported on the financial statements, earnings recorded as accumulated undistributed earnings, foreign exchange asset valuation and mark-to-market on operating assets, and certain subsidiaries and affiliates are also reported as changes in unrealized capital gains (losses). Unrealized capital gains (losses) are recorded as a change in capital and surplus net of tax.
C.M. LIFE INSURANCE COMPANY NOTES TO STATUTORY FINANCIAL STATEMENTS, continued
17
3. New accounting standards a. Adoption of new accounting standards In June 2016, the NAIC adopted modifications to Statements of Statutory Accounting Principles (SSAP) No. 51R, Life Contracts, to incorporate references to the Valuation Manual and to facilitate the implementation of principles-based reserving (PBR), which were effective on January 1, 2017. The adoption of PBR only applies to new life insurance policies issued after January 1, 2017, however the Company adopted these revisions to SSAP No. 51R using the 3-year phased in approach as of January 1, 2020. Prior to adoption, the Company used formulas and assumptions to determine reserves as prescribed by state laws and regulations. Under PBR, the Company is required to hold the higher of (a) the reserve using prescribed factors and (b) the VM-20 reserve which considers a wide range of future economic conditions, computed using justified company experience factors, such as mortality, policyholder behavior and expenses. At the time of adoption, the modifications did not have a material effect on the Company’s total life reserves and surplus in the financial statements.
In August 2019, the NAIC adopted modifications to SSAP No. 51R, Life Contracts, to incorporate references to the Valuation Manual and to facilitate the implementation of PBR. The adoption, effective January 1, 2020, only applies to certain annuity products and includes inforce policies issued after 1980. Prior to adoption, the Company used formulas and assumptions to determine reserves as prescribed by state laws and regulations. Under VM-21, the aggregate reserve for contracts falling within the scope of these requirements shall equal the stochastic reserve plus the additional standard projection amount less the projected IMR included in the starting assets. These requirements constitute the CARVM for all contracts encompassed by the scope. The modifications did not have a material effect on the Company’s total annuity reserves and surplus in the financial statements.
In April 2020, the NAIC adopted modifications to SSAP Nos. 15, 22R and 86. These revisions adopt Financial Accounting Standards Board Accounting Standard Update No. 2020-04 Reference Rate Reform, which applies only to contracts, hedging relationships, and other transactions that reference London Inter-Bank Offered Rate (LIBOR) or another reference rate expected to be discontinued because of reference rate reform. Optional expedients allow entities (under certain circumstances) to avoid having to remeasure contracts or reassess a previous accounting determination for hedged items. The guidance is effective through December 31, 2022. The Company has adopted this guidance and the adoption did not have a material impact on its financial statements.
In April 2020, the NAIC adopted modifications to SSAP Nos. 6, 47, 51R and 65. This guidance extends the 90-Day Rule due to the impacts of COVID-19 and provides exception to the 90-day past due rule for nonadmittance required in SSAP No. 6 for premiums, SSAP No. 47 for uncollected uninsured plan receivables, SSAP No. 51R for life premiums and SSAP No. 65 for high deductible policies. This guidance expired on December 30, 2020. The Company has adopted this guidance and the adoption did not have a material impact on its financial statements.
In April 2020, the NAIC adopted modifications to SSAP No. 36. This guidance notes a mortgage loan or bank loan modification due to the impacts of COVID-19 on the borrower will not automatically be categorized as a troubled debt restructuring (TDR). To qualify for relief, the borrower must have been in good standing as of December 31, 2019 (not more than 30 days past due). This guidance expires on January 1, 2022. The Company has adopted this guidance and the adoption did not have a material impact on its financial statements.
In April 2020, the NAIC adopted modifications to SSAP Nos. 26R, 30R, 37, 43R and 48. This guidance provides limited time exceptions for impairment assessments related to mortgage loans, bank loans and other investments that predominantly invest in mortgage loans and does not require an impairment classification under SSAP No. 37 for mortgage loans or SSAP No. 26R for bank loans that are deferred/modified in response to the impacts of COVID-19. It also provides limited-scope provisions for assessing impairment for other investments (e.g., mutual funds, limited liability companies) that predominantly invest in mortgage loans impacted due to fair value declines if the entity does not intend to sell. This guidance only defers the assessment of impairment due to situations caused by the forbearance or modification of mortgage loan or bank loan payments for borrowers who are or may be unable to meet their contractual payment obligations because they are experiencing short-term financial or operational problems due to the effects of COVID-19. This guidance expired on December 30, 2020. The Company has adopted this guidance and the adoption did not have a material impact on its financial statements.
C.M. LIFE INSURANCE COMPANY NOTES TO STATUTORY FINANCIAL STATEMENTS, continued
18
In May 2020, the NAIC adopted modifications to SSAP No. 34. This guidance notes if investments have been impacted by forbearance or other modification provisions, a reporting entity shall assess whether the investment income has been earned in accordance with the modified terms. This guidance expired on December 30, 2020. The Company has adopted this guidance and the adoption did not have a material impact on its financial statements. In May 2020, the NAIC adopted modifications to SSAP Nos. 26R, 36, 43R and 103R. This guidance clarifies how to determine when restructuring or modification of certain debt investments due to COVID-19 are a TDR. The guidance also clarifies whether a modification that is not a TDR needs to be assessed as an exchange under SSAP No. 103R. This guidance expires on January 1, 2022 and was effective for the specific purpose to provide practical expedients in assessing whether modifications in response to COVID-19 are insignificant under SSAP No. 36 and in assessing whether a change is substantive under SSAP No. 103R. The Company has adopted this guidance and the adoption did not have a material impact on its financial statements. b. Future adoption of new accounting standards
In July 2020, the NAIC adopted modifications to SSAP No. 26R, Accounting for Bond Tender Offers, effective January 1, 2021. The modifications apply similar reporting for gains or losses due to a tender offer as previously adopted for calls. The difference between consideration and par is recognized as net investment income, while any difference between book value and par is recognized as realized gain or loss. The modifications are not expected to have a material effect on the Company’s financial statements.
In July 2020, the NAIC adopted modifications to SSAP No. 32, Preferred Stock, effective January 1, 2021. The modifications define carrying value of redeemable preferred stock as amortized cost for NAIC 1-3 designations, the lower of amortized cost or fair value for NAIC 4-6 designations, and new fair value measurement for perpetual and mandatorily convertible preferred stock. They clarify when failure to meet certain dividends or redemption payments could trigger an impairment assessment, that preferred shares issued by joint ventures are included in the scope of this guidance, and clarifies scope related to sinking fund schedules, mandatory conversions, and various other features. They also clarify fair value would be capped by any currently effective call price. The revisions would impact the Company’s current unaffiliated and affiliated perpetual preferred stock investments. The modifications are not expected to have a material effect on the Company’s financial statements.
C.M. LIFE INSURANCE COMPANY NOTES TO STATUTORY FINANCIAL STATEMENTS, continued
19
4. Fair value of financial instruments The following presents a summary of the carrying values and fair values of the Company's financial instruments: December 31, 2020 Carrying Fair Value Value Level 1 Level 2 Level 3 (In Millions) Financial assets: Bonds: U. S. government and agencies $ 3 $ 3 $ - $ 3 $ - All other governments 1 1 - 1 - States, territories and possessions 21 25 - 25 - Political subdivisions 16 19 - 19 - Special revenue 107 129 - 129 - Industrial and miscellaneous 3,754 4,164 - 2,223 1,941 Parent, subsidiaries and affiliates 167 174 - - 174 Preferred stocks 5 7 - - 7 Common stocks - subsidiaries and affiliates 19 19 18 - 1 Common stocks - unaffiliated 5 5 - - 5 Mortgage loans - commercial 788 827 - - 827 Mortgage loans - residential 155 156 - - 156 Derivatives: Interest rate swaps 902 902 - 902 - Options 39 39 - 39 - Currency swaps 18 18 - 18 - Forward contracts 1 1 - 1 - Cash, cash equivalents and short-term investments 335 335 37 298 - Separate account assets 1,972 1,972 1,972 - - Financial liabilities: Individual annuity contracts 3,004 3,742 - - 3,742 Supplementary contracts 63 63 - - 63 Derivatives: Interest rate swaps 890 890 - 890 - Options 11 11 - 11 - Currency swaps 23 23 - 23 - Forward contracts 7 7 - 7 - Financial futures 10 10 10 - - Common stock – subsidiary and affiliates does not include MML Bay State, which has a statutory carry value of $275 million.
C.M. LIFE INSURANCE COMPANY NOTES TO STATUTORY FINANCIAL STATEMENTS, continued
20
December 31, 2019 Carrying Fair Value Value Level 1 Level 2 Level 3 (In Millions) Financial assets: Bonds: U. S. government and agencies $ 4 $ 4 $ - $ 4 $ - All other governments 1 1 - 1 - States, territories and possessions 29 32 - 32 - Political subdivisions 18 20 - 20 - Special revenue 115 130 - 130 - Industrial and miscellaneous 3,439 3,708 - 1,783 1,925 Parent, subsidiaries and affiliates 204 209 - 7 202 Preferred stocks 7 9 - - 9 Common stocks - subsidiaries and affiliates 18 18 18 - - Common stocks - unaffiliated 4 4 - - 4 Mortgage loans - commercial 831 867 - - 867 Mortgage loans - residential 102 100 - - 100 Derivatives: Interest rate swaps 466 466 - 466 - Options 31 31 - 31 - Currency swaps 36 36 - 36 - Cash, cash equivalents and short-term investments 463 463 54 409 - Separate account assets 1,810 1,810 1,810 - - Financial liabilities: Individual annuity contracts 2,991 3,641 - - 3,641 Supplementary contracts 81 82 - - 82 Derivatives: Interest rate swaps 561 561 - 561 - Options 8 8 - 8 - Currency swaps 4 4 - 4 - Forward contracts 4 4 - 4 - Financial futures 16 16 16 - - Common stock – subsidiary and affiliates does not include MML Bay State, which has a statutory carry value of $293 million.
C.M. LIFE INSURANCE COMPANY NOTES TO STATUTORY FINANCIAL STATEMENTS, continued
21
Fair value is defined as the price that would be received from selling an asset or paid to transfer a liability in an orderly transaction between market participants at the measurement date. The authoritative guidance for fair value establishes a measurement framework that includes a hierarchy used to classify the inputs used in measuring fair value. The hierarchy prioritizes the inputs to valuation techniques into three levels. Each level reflects a unique description of the inputs that are significant to the fair value measurements. The levels of the fair value hierarchy are as follows: Level 1 – Observable inputs in the form of quoted prices for identical instruments in active markets. Level 2 – Observable inputs other than Level 1 prices, such as quoted prices for similar assets or liabilities, quoted prices in markets that are not active or other inputs that are observable or can be derived from observable market data for substantially the full term of the assets or liabilities. Level 3 – One or more unobservable inputs that are supported by little or no market activity and are significant to the fair value of the assets or liabilities. Level 3 assets and liabilities include financial instruments whose value is determined using internal models, as well as instruments for which the determination of fair value requires significant management judgment or estimation. When available, the Company generally uses unadjusted quoted market prices from independent sources to determine the fair value of investments and classifies such items within Level 1 of the fair value hierarchy. If quoted prices are not available, prices are derived from observable market data for similar assets in an active market or obtained directly from brokers for identical assets traded in inactive markets. Investments that are priced using these inputs are classified within Level 2 of the fair value hierarchy. When some of the necessary observable inputs are unavailable, fair value is based upon internally developed models. These models use inputs not directly observable or correlated with observable market data. Typical inputs, which are integrated in the Company’s internal discounted cash flow models and discounted earnings models include, but are not limited to, issuer spreads derived from internal credit ratings and benchmark yields such as LIBOR, cash flow estimates and earnings before interest, taxes, depreciation and amortization estimates. Investments that are priced with such unobservable inputs are classified within Level 3 of the fair value hierarchy. The Company reviews the fair value hierarchy classifications at each reporting period. Overall, reclassifications between levels occur when there are changes in the observability of inputs and market activity used in the valuation of a financial asset or liability. Such reclassifications are reported as transfers between levels at the beginning fair value for the reporting period in which the changes occur. Given the types of assets classified as Level 1 (primarily equity securities including mutual fund investments), transfers between Level 1 and Level 2 measurement categories are expected to be infrequent. Transfers into and out of Level 3 are summarized in the schedule of changes in Level 3 assets and liabilities. The fair value of individual annuity and supplementary contracts is determined using one of several methods based on the specific contract type. For short-term contracts, generally less than 30 days, the fair value is assumed to be the book value. For investment-type contracts, the fair value is determined by calculating the present value of future cash flows discounted at current market interest rates, the risk-free rate or a current pricing yield curve based on pricing assumptions using assets of a comparable corporate bond quality. Annuities are valued using cash flow projections from the Company's asset-liability management analysis.
C.M. LIFE INSURANCE COMPANY NOTES TO STATUTORY FINANCIAL STATEMENTS, continued
22
The following presents the Company's fair value hierarchy for assets and liabilities that are carried at fair value:
December 31, 2020 Level 1 Level 2 Level 3 Total (In Millions) Financial assets: Bonds: Industrial and miscellaneous $ - $ 2 $ 10 $ 12 Common stocks - subsidiaries and affiliates 18 - 1 19 Common stocks - unaffiliated - - 5 5 Derivatives: Interest rate swaps - 902 - 902 Options - 39 - 39 Currency swaps - 18 - 18 Forward contracts - 1 - 1 Separate account assets 1,972 - - 1,972 Total financial assets carried at fair value $ 1,990 $ 962 $ 16 $ 2,968 Financial liabilities: Derivatives: Interest rate swaps $ - $ 890 $ - $ 890 Options - 11 - 11 Currency swaps - 23 - 23 Forward contracts - 7 - 7 Financial futures 10 - - 10 Total financial liabilities carried at fair value $ 10 $ 931 $ - $ 941 For the year ended December 31, 2020, there were no significant transfers between Level 1 and Level 2.
C.M. LIFE INSURANCE COMPANY NOTES TO STATUTORY FINANCIAL STATEMENTS, continued
23
The following presents the Company's fair value hierarchy for assets and liabilities that are carried at fair value: December 31, 2019 Level 1 Level 2 Level 3 Total (In Millions) Financial assets: Bonds: Industrial and miscellaneous $ - $ 4 $ 9 $ 13 Common stocks - subsidiaries and affiliates 18 - - 18 Common stocks - unaffiliated - - 4 4 Derivatives: Interest rate swaps - 466 - 466 Options - 31 - 31 Currency swaps - 36 - 36 Separate account assets 1,810 - - 1,810 Total financial assets carried at fair value $ 1,828 $ 537 $ 13 $ 2,378 Financial liabilities: Derivatives: Interest rate swaps $ - $ 561 $ - $ 561 Options - 8 - 8 Currency swaps - 4 - 4 Forward contracts - 4 - 4 Financial futures 16 - - 16 Total financial liabilities carried at fair value $ 16 $ 577 $ - $ 593 For the year ended December 31, 2019, there were no significant transfers between Level 1 and Level 2.
C.M. LIFE INSURANCE COMPANY NOTES TO STATUTORY FINANCIAL STATEMENTS, continued
24
Valuation Techniques and Inputs The Company determines the fair value of its investments using primarily the market approach or the income approach. The use of quoted prices for identical assets and matrix pricing or other similar techniques are examples of market approaches, while the use of discounted cash flow methodologies is an example of the income approach. The Company attempts to maximize the use of observable inputs and minimize the use of unobservable inputs in selecting whether the market or the income approach is used. A description of the significant valuation techniques and inputs to the determination of estimated fair value for the more significant asset and liability classes measured at fair value on a recurring basis and categorized within Level 2 and Level 3 of the fair value hierarchy is as follows: Derivative assets and liabilities - These financial instruments are primarily valued using the market approach. The estimated fair value of derivatives is based primarily on quotations obtained from counterparties and independent sources, such as quoted market values received from brokers. These quotations are compared to internally derived prices and a price challenge is lodged with the counterparties and an independent source when a significant difference cannot be explained by appropriate adjustments to the internal model. When quoted market values are not reliable or available, the value is based upon an internal valuation process using market observable inputs that other market participants would use. Significant inputs to the valuation of derivative financial instruments include overnight index swaps and LIBOR basis curves, interest rate volatility, swap yield curve, currency spot rates, cross currency basis curves and dividend yields. Due to the observability of the significant inputs to these fair value measurements, they are classified as Level 2. The use of different assumptions or valuation methodologies may have a material impact on the estimated fair value amounts. For the periods presented, there were no significant changes to the Company's valuation techniques. The following presents changes in the Company's Level 3 assets carried at fair value:
C.M. LIFE INSURANCE COMPANY NOTES TO STATUTORY FINANCIAL STATEMENTS, continued
25
Other transfers include assets that are either no longer carried at fair value, or have just begun to be carried at fair value, such as assets with no level changes but a change in the lower of cost or market carrying basis.
Other transfers include assets that are either no longer carried at fair value, or have just begun to be carried at fair value, such as assets with no level changes but a change in the lower of cost or market carrying basis. 5. Investments The Company maintains a diversified investment portfolio. Investment policies limit concentration in any asset class, geographic region, industry group, economic characteristic, investment quality or individual investment. a. Bonds The carrying value and fair value of bonds were as follows: December 31, 2020 Gross Gross Carrying Unrealized Unrealized Fair Value Gains Losses Value (In Millions) U.S. government and agencies $ 3 $ - $ - $ 3 All other governments 1 - - 1 States, territories and possessions 21 4 - 25 Political subdivisions 16 3 - 19 Special revenue 107 22 - 129 Industrial and miscellaneous 3,754 427 17 4,164 Parent, subsidiaries and affiliates 167 7 - 174 Total $ 4,069 $ 463 $ 17 $ 4,515 The December 31, 2020 gross unrealized losses exclude $4 million of losses included in the carrying value. These losses include $3 million from NAIC Class 6 bonds and were primarily included in industrial and miscellaneous or parents, subsidiaries and affiliates.
C.M. LIFE INSURANCE COMPANY NOTES TO STATUTORY FINANCIAL STATEMENTS, continued
26
December 31, 2019 Gross Gross Carrying Unrealized Unrealized Fair Value Gains Losses Value (In Millions) U.S. government and agencies $ 4 $ - $ - $ 4 All other governments 1 - - 1 States, territories and possessions 29 3 - 32 Political subdivisions 18 2 - 20 Special revenue 115 15 - 130 Industrial and miscellaneous 3,439 279 10 3,708 Parent, subsidiaries and affiliates 204 5 - 209 Total $ 3,810 $ 304 $ 10 $ 4,104 The December 31, 2019 gross unrealized losses exclude $1 million of losses included in the carrying value. These losses include $1 million from NAIC Class 6 bonds and were primarily included in industrial and miscellaneous or parents, subsidiaries and affiliates.
The quality of the bond portfolio is determined by the use of SVO ratings and the equivalent rating agency designations, except for RMBS and CMBS that use outside modelers. The following sets forth the NAIC class ratings for the bond portfolio including RMBS and CMBS: December 31, 2020 2019 NAIC Equivalent Rating Carrying % of Carrying % of Class Agency Designation Value Total Value Total ($ In Millions) 1 Aaa/Aa/A $ 1,890 46 % $ 1,743 45 % 2 Baa 1,619 40 1,528 40 3 Ba 325 8 309 8 4 B 99 2 59 2 5 Caa and lower 118 3 142 4 6 In or near default 18 1 29 1 Total $ 4,069 100 % $ 3,810 100 % The following summarizes NAIC ratings for RMBS and CMBS investments subject to NAIC modeling:
C.M. LIFE INSURANCE COMPANY NOTES TO STATUTORY FINANCIAL STATEMENTS, continued
27
December, 31 2020 2019 RMBS CMBS RMBS CMBS NAIC Carrying % of Carrying % of Carrying % of Carrying % of Class Value Total Value Total Value Total Value Total ($ In Millions) 1 $ 25 96 % $ 88 80 % $ 29 100 % $ 104 93 % 2 1 4 2 2 - - 3 3 3 - - 13 12 - - 2 2 4 - - 4 4 - - 1 1 5 - - 2 2 - - 1 1 6 - - - - - - - - $ 26 100 % $ 109 100 % $ 29 100 % $ 111 100 % The following is a summary of the carrying value and fair value of bonds as of December 31, 2020 by contractual maturity. Expected maturities may differ from contractual maturities because issuers may have the right to call or prepay obligations with or without prepayment penalties. Securities with more than one maturity date are included in the table using the final maturity date. Carrying Fair Value Value (In Millions) Due in one year or less $ 99 $ 101 Due after one year through five years 856 897 Due after five years through ten years 994 1,076 Due after ten years 2,120 2,441 Total $ 4,069 $ 4,515 Sales proceeds and related gross realized capital gains (losses) from bonds were as follows: Years Ended December 31, 2020 2019 2018 (In Millions) Proceeds from sales $ 305 $ 318 $ 332 Gross realized capital gains from sales 19 7 8 Gross realized capital losses from sales (6) (5) (6)
C.M. LIFE INSURANCE COMPANY NOTES TO STATUTORY FINANCIAL STATEMENTS, continued
28
The following is a summary of the fair values and gross unrealized losses aggregated by bond category and length of time that the securities were in a continuous unrealized loss position:
December 31, 2020 Less Than 12 Months 12 Months or Longer Number Number Fair Unrealized of Fair Unrealized of Value Losses Issuers Value Losses Issuers ($ In Millions) U.S. government and agencies $ - $ - 1 $ - $ - - Special revenue - - - - - 1 Industrial and miscellaneous 277 15 192 168 6 178 Total $ 277 $ 15 193 $ 168 $ 6 179 The December 31, 2020 gross unrealized losses include $4 million of losses included in the carrying va lue of NAIC Class 6 bonds. These losses were primarily included in the industrial and miscellaneous or parent, subsidiaries and affiliates.
December 31, 2019 Less Than 12 Months 12 Months or Longer Number Number Fair Unrealized of Fair Unrealized of Value Losses Issuers Value Losses Issuers ($ In Millions) U.S. government and agencies $ - $ - - $ 3 $ - 1 States, territories and possessions 2 - 1 - - - Special revenue 5 - 2 - - 1 Industrial and miscellaneous 118 2 151 355 9 233 Total $ 125 $ 2 154 $ 358 $ 9 235 The December 31, 2019 gross unrealized losses include $1 million of losses included in the carrying va lue of NAIC Class 6 bonds. These losses were primarily included in the industrial and miscellaneous or parent, subsidiaries and affiliates.
As of December 31, 2020 and 2019, management has not deemed these unrealized losses to be other than temporary because the investment’s carrying value is expected to be realized and the Company has the ability and intent not to sell these investments until recovery, which may be at maturity. As of December 31, 2020, investments in structured and loan-backed securities that had unrealized losses, which were not recognized in earnings, had a fair value of $265 million. Securities in an unrealized loss position for less than 12 months had a fair value of $150 million and unrealized losses of $5 million. Securities in an unrealized loss position for greater than 12 months had a fair value of $115 million and unrealized losses of $3 million. These securities were primarily categorized as industrial and miscellaneous or parent, subsidiaries and affiliates. As of December 31, 2019, investments in structured and loan-backed securities that had unrealized losses, which were not recognized in earnings, had a fair value of $319 million. Securities in an unrealized loss position for less than 12 months had a fair value of $64 million and unrealized losses of $1 million. Securities in an unrealized loss position for greater than 12 months had a fair value of $255 million and unrealized losses of $4 million. These securities were primarily categorized as industrial and miscellaneous or parent, subsidiaries and affiliates.
C.M. LIFE INSURANCE COMPANY NOTES TO STATUTORY FINANCIAL STATEMENTS, continued
29
In the course of the Company’s investment management activities, securities may be sold and reacquired within 30 days to enhance the Company’s yield on its investment portfolio. The Company did not sell any securities with the NAIC Designation 3 or below for the years ended December 31, 2020 or 2019, that were reacquired within 30 days of the sale date. The Company had assets on deposit with government authorities or trustees, as required by law, in the amount of $4 million as of December 31, 2020 and $4 million as of December 31, 2019. Residential mortgage-backed exposure RMBS are included in the U.S. government and agencies, special revenue, and industrial and miscellaneous bond categories. The Alt-A category includes option adjustable-rate mortgages and the subprime category includes 'scratch and dent' or reperforming pools, high loan-to-value pools and pools where the borrowers have very impaired credit but the average loan-to-value is low, typically 70% or below. In identifying Alt-A and subprime exposure, management used a combination of qualitative and quantitative factors, including FICO scores and loan-to-value ratios. As of December 31, 2020, RMBS had a total carrying value of $37 million and a fair value of $41 million, of which approximately 42%, based on carrying value, was classified as Alt-A. Alt-A and subprime RMBS had a total carrying value of $19 million and a fair value of $21 million. As of December 31, 2019, RMBS had a total carrying value of $41 million and a fair value of $45 million, of which approximately 36%, based on carrying value, was classified as Alt-A. Alt-A and subprime RMBS had a total carrying value of $20 million and a fair value of $22 million. During the year ended December 31, 2020, there were no significant credit downgrades for the securities held by the Company that were backed by residential mortgage pools. Leveraged loan exposure Leveraged loans are loans extended to companies that already have considerable amounts of debt. The Company reports leveraged loans as bonds. These leveraged loans have interest rates higher than typical loans, reflecting the additional risk of default from issuers with high debt-to-equity ratios. As of December 31, 2020, total leveraged loans and leveraged loan CDOs had a carrying value of $792 million and a fair value of $801 million, of which approximately 75%, based on carrying value, were domestic leveraged loans and CDOs. As of December 31, 2019, total leveraged loans and leveraged loan CDOs had a carrying value of $768 million and a fair value of $774 million, of which approximately 76%, based on carrying value, were domestic leveraged loans and CDOs.
C.M. LIFE INSURANCE COMPANY NOTES TO STATUTORY FINANCIAL STATEMENTS, continued
30
Commercial mortgage-backed exposure The Company holds bonds backed by pools of commercial mortgages. The mortgages in these pools have varying risk characteristics related to underlying collateral type, borrower's risk profile and ability to refinance and the return provided to the borrower from the underlying collateral. These investments had a carrying value of $109 million and fair value of $111 million as of December 31, 2020 and a carrying value of $111 million and fair value of $114 million as of December 31, 2019. b. Preferred stocks The carrying value and fair value of preferred stocks were as follows: December 31, 2020 2019 (In Millions) Carrying value $ 5 $ 7 Gross unrealized gains 2 2 Fair value $ 7 $ 9 As of December 31, 2020, there were no investments in preferred stocks in an unrealized loss position. As of December 31, 2019, investments in preferred stocks in an unrealized loss position included holdings with a fair value of $2 million in 2 issuers, $2 million of which were in an unrealized loss position for more than 12 months. Based upon the Company’s impairment review process discussed in Note 2y. "Realized capital (losses) gains including other-than-temporary impairments and unrealized capital gains (losses)" the decline in value of these securities was not considered to be other than temporary as of December 31, 2020 or 2019. The Company held preferred stocks for which the transfer of ownership was restricted by contractual requirements with carrying values of $5 million as of December 31, 2020 and $7 million as of December 31, 2019. c. Common stocks - subsidiary and affiliates MML Bay State primarily provides variable life and bank-owned life insurance business. It declared and paid $29 million in dividends to the Company for the year ended December 31, 2020 and $30 million in 2019. The Company did not receive a dividend from MML Bay State in 2018. A majority of MML Bay State’s capital and surplus is subject to dividend restrictions. Dividend restrictions, imposed by state regulations, limit the payment of dividends to the Company without prior approval from the Department. Under these regulations, $28 million of capital and surplus is available for distribution to the shareholder in 2021 without prior regulatory approval. The Company does not rely on dividends from its subsidiary to meet its operating cash flow requirements.
The Company did not hold any affiliated common stocks for which the transfer of ownership was restricted by contractual requirements as of December 31, 2020 or 2019.
C.M. LIFE INSURANCE COMPANY NOTES TO STATUTORY FINANCIAL STATEMENTS, continued
31
Summarized below is certain statutory financial information for MML Bay State: As of and for Years Ended December 31, 2020 2019 2018 (In Millions) Total revenue $ 18 $ 23 $ 24 Net income 12 14 18 Assets 5,352 5,118 4,860 Liabilities 5,077 4,824 4,550 Equity 275 293 310 d. Common stocks - unaffiliated
The adjusted cost basis and carrying value of unaffiliated common stocks were as follows:
December 31, 2020 2019 (In Millions) Adjusted cost basis $ 3 $ 2 Gross unrealized gains 2 2 Carrying value $ 5 $ 4 As of December 31, 2020, investments in unaffiliated common stocks in an unrealized loss position included holdings with a fair value of less than $1 million from 3 issuers, less than $1 million of which were in an unrealized loss position for more than 12 months. As of December 31, 2019, investments in unaffiliated common stocks in an unrealized loss position included holdings with a fair value of less than 1 million from 4 issuers, less than $1 million of which were in an unrealized loss position for more than 12 months. Based upon the Company’s impairment review process discussed in Note 2y. "Realized capital (losses) gains including other-than-temporary impairments and unrealized capital gains (losses)" the decline in value of these securities was not considered to be other than temporary as of December 31, 2020 or 2019. The Company held common stocks, for which the transfer of ownership was restricted by contractual requirements, with carrying values of $2 million as of December 31, 2020 and $3 million as of December 31, 2019. e. Mortgage loans Mortgage loans are comprised of commercial mortgage loans and residential mortgage loans. The Company’s commercial mortgage loans primarily finance various types of real estate properties throughout the U.S., the United Kingdom and Canada. The Company holds commercial mortgage loans for which it is a participant or co-lender in a mortgage loan agreement and mezzanine loans that are subordinate to senior secured first liens. The Company’s loan agreements with the senior lender contain negotiated provisions that are designed to maximize the Company’s influence with the objective of mitigating the Company’s risks as the secondary lender for mezzanine loans. Commercial mortgage loans have varying risk characteristics including, among others, the borrower’s liquidity, the underlying percentage of completion of a project, the returns generated by the collateral, the refinance risk associated with maturity of the loan and deteriorating collateral value. Residential mortgage loans include seasoned pools of homogeneous residential mortgage loans substantially backed by Federal Housing Administration (FHA) and Veterans Administration (VA) guarantees. As of December 31, 2020 and December 31, 2019, the Company did not have any direct subprime exposure through the purchases of unsecuritized whole-loan pools.
C.M. LIFE INSURANCE COMPANY NOTES TO STATUTORY FINANCIAL STATEMENTS, continued
32
Geographical concentration is considered prior to the purchase of mortgage loans and residential mortgage loan pools. The mortgage loan portfolio is diverse with no significant collateral concentrations in any particular geographic region as of December 31, 2020 or 2019. The carrying value and fair value of the Company's mortgage loans were as follows: December 31, 2020 2019 Carrying Fair Carrying Fair Value Value Value Value (In Millions) Commercial mortgage loans: Primary lender $ 788 $ 827 $ 831 $ 867 Total commercial mortgage loans 788 827 831 867 Residential mortgage loans: FHA insured and VA guaranteed 129 130 91 89 Other residential loans 26 26 11 11 Total residential mortgage loans 155 156 102 100 Total mortgage loans $ 943 $ 983 $ 933 $ 967 The Company uses an internal rating system as its primary method of monitoring credit quality. The following illustrates the Company’s mortgage loan portfolio rating, translated into the equivalent rating agency designation: December 31, 2020 CCC and AAA/AA/A BBB BB B Lower Total (In Millions) Commercial mortgage loans: Primary lender $ 227 $ 424 $ 116 $ 12 $ 9 $ 788 Total commercial mortgage loans 227 424 116 12 9 788 Residential mortgage loans: FHA insured and VA guaranteed 129 - - - - 129 Other residential loans 1 23 2 - - 26 Total residential mortgage loans 130 23 2 - - 155 Total mortgage loans $ 357 $ 447 $ 118 $ 12 $ 9 $ 943
C.M. LIFE INSURANCE COMPANY NOTES TO STATUTORY FINANCIAL STATEMENTS, continued
33
December 31, 2019 CCC and AAA/AA/A BBB BB B Lower Total (In Millions) Commercial mortgage loans: Primary lender $ 407 $ 369 $ 43 $ 9 $ 3 $ 831 Total commercial mortgage loans 407 369 43 9 3 831 Residential mortgage loans: FHA insured and VA guaranteed 91 - - - - 91 Other residential loans 1 10 - - - 11 Total residential mortgage loans 92 10 - - - 102 Total mortgage loans $ 499 $ 379 $ 43 $ 9 $ 3 $ 933 As of December 31, 2020 and 2019, the loan-to-value ratios of more than 99% of the Company’s commercial mortgage loans’ loan-to-value ratios are below 81%. The maximum percentage of any one commercial mortgage loan to the estimated value of secured collateral at the time the loan was originated, exclusive of mezzanine, insured, guaranteed or purchase money mortgages, was 79% as of December 31, 2020 and 2019. The geographic distribution of commercial mortgage loans was as follows: December 31, 2020 Average Carrying Loan-to-Value Value Ratio ($ In Millions) California $ 230 51 % New York 85 53 % Illinois 81 56 % Texas 67 60 % District of Columbia 53 53 % United Kingdom 50 47 % Washington 42 53 % All Other 180 57 % Total commercial mortgage loans $ 788 54 % All other consists of 21 jurisdictions, with no individual exposure exceeding $18 million.
C.M. LIFE INSURANCE COMPANY NOTES TO STATUTORY FINANCIAL STATEMENTS, continued
34
December 31, 2019 Average Carrying Loan-to-Value Value Ratio ($ In Millions) California $ 237 49 % New York 93 50 % Illinois 84 49 % United Kingdom 60 51 % Texas 58 56 % District of Columbia 54 51 % Washington 47 51 % All other 198 54 % Total commercial mortgage loans $ 831 51 % All other consists of 22 jurisdictions, with no individual exposure exceeding $19 million. Interest rates, including fixed and variable, on the Company's portfolio of mortgage loans were: December 31, 2020 2019 Low High Low High Commercial mortgage loans 1.9 % 9.3 % 3.3 % 10.0 % Residential mortgage loans 2.9 % 9.3 % 3.3 % 10.0 %
C.M. LIFE INSURANCE COMPANY NOTES TO STATUTORY FINANCIAL STATEMENTS, continued
35
Interest rates, including fixed and variable, on new mortgage loans were: Years Ended December 31, 2020 2019 Low High Low High Commercial mortgage loans 2.8 % 4.5 % 3.7 % 6.8 % Residential mortgage loans 4.1 % 5.4 % 5.9 % 6.1 % As of December 31, 2020, the Company had impaired mortgage loans with or without a valuation allowance or mortgage loans derecognized as a result of foreclosure, including mortgage loans subject to a participant or co-lender mortgage loan agreement with a unilateral mortgage loan foreclosure restriction or mortgage loan derecognized as a result of a foreclosure. The following presents a summary of the Company's impaired mortgage loans as of December 31, 2020: December 31, 2020 Average Unpaid Carrying Carrying Principal Valuation Interest Value Value Balance Allowance Income (In Millions) With no allowance recorded: Commercial mortgage loans: Primary lender $ 5 $ 6 $ 8 $ - $ - Total 5 6 8 - - Total impaired commercial mortgage loans $ 5 $ 6 $ 8 $ - $ - The Company did not hold any impaired mortgage loans subject to a participant or co-lender mortgage loan agreement with a unilateral mortgage loan foreclosure restriction as of December 31, 2019. The Company did not hold any restructured mortgage loans, mortgage loans with principal or interest past due, or mortgage loans with suspended interest accruals as of December 31, 2020 or 2019. The carrying value of commercial mortgage loans subject to a participant or co-lender mortgage loan agreement was $788 million as of December 31, 2020 and $831 million as of December 31, 2019.
C.M. LIFE INSURANCE COMPANY NOTES TO STATUTORY FINANCIAL STATEMENTS, continued
36
f. Partnerships and limited liability companies The carrying value of partnership and limited liability companies holdings by annual statement category were: December 31, 2020 2019 (In Millions) Joint venture interests: Real estate $ 59 $ 49 Common stocks 74 81 Fixed maturities/preferred stock 4 5 Other 10 10 Surplus notes 17 15 LIHTCs - 1 Total $ 164 $ 161
The Company’s unexpired tax credits expire within a range of less than one year to 13 years.
The Company recorded tax credits on these investments of less than $1 million for 2020 and 2019. The minimum holding period required for the Company’s LIHTC investments extends from one year to 15 years.
For determining impairments for LIHTC investments, the Company uses the present value of all future benefits, the majority of which are tax credits, discounted at a risk-free rate ranging from 0.1% for future benefits of two years to 0.9% for future benefits of ten or more years, and compares the result to its current carry value. The Company recorded less than $1 million impairment to LIHTC investments for the years ended December 31, 2020 and 2019.
There were no write-downs or reclassifications of LIHTC partnerships made during the years ended December 31, 2020 or 2019, due to forfeiture or ineligibility of tax credits or similar issues. In addition, there are no LIHTC properties currently subject to regulatory review for the years ended December 31, 2020 or 2019. g. Derivatives The Company uses derivative financial instruments in the normal course of business to manage risks, primarily to reduce currency, interest rate and duration imbalances determined in asset/liability analyses. The Company’s derivative strategy employs a variety of derivative financial instruments, including: interest rate, currency, equity, bond, and credit default swaps; options; forward contracts and financial futures. Investment risk is assessed on a portfolio basis and individual derivative financial instruments are not generally designated in hedging relationships; therefore, as allowed by statutory accounting practices, the Company intentionally has not applied hedge accounting. Interest rate swaps are primarily used to more closely match the cash flows of assets and liabilities. Interest rate swaps are also used to mitigate changes in the value of assets anticipated to be purchased and other anticipated transactions and commitments. The Company uses currency swaps for the purpose of managing currency exchange risks in its assets and liabilities. The Company does not sell credit default swaps as a participant in the credit insurance market. The Company does, however, use credit default swaps as part of its investment management process. The Company buys credit default swaps as an efficient means to reduce credit exposure to particular issuers or sectors in the Company’s investment portfolio. The Company sells credit default swaps in order to create synthetic investment positions that enhance the return on its investment portfolio by providing comparable exposure to fixed income securities that might not be available in the primary market. Options grant the purchaser the right to buy or sell a security or enter a derivative transaction at a stated price within
C.M. LIFE INSURANCE COMPANY NOTES TO STATUTORY FINANCIAL STATEMENTS, continued
37
a stated period. The Company’s option contracts have terms of up to 15 years. A swaption is an option to enter an interest rate swap to either receive or pay a fixed rate at a future date. The Company purchases these options for the purpose of managing interest rate risks in its assets and liabilities. The Company adopted a clearly defined hedging strategy (CDHS) to enable the Company to incorporate currently held hedges in risk-based capital (RBC) calculations. The CDHS is used to significantly mitigate the impact that movements in capital markets have on the liabilities associated with annuity guarantees. The hedge portfolio consists mainly of interest rate swaps and equity options, and provides protection in the stress scenarios under which RBC is calculated. The hedge portfolio has offsetting impacts relative to the total asset requirement for RBC and surplus for FIA and variable annuity guaranteed living benefits (VAGLB). The Company utilizes certain other agreements including forward contracts and financial futures. Currency forwards are contracts in which the Company agrees with other parties to exchange specified amounts of identified currencies at a specified future date. Typically, the exchange rate is agreed upon at the time of the contract. In addition, the Company also uses “to be announced” forward contracts (TBAs) to hedge interest rate risk and participate in the MBS market in an efficient and cost effective way. Typically, the price is agreed upon at contract inception and payment is made at a specified future date. The Company usually does not purchase TBAs with settlement by the first possible delivery date and thus, accounts for these TBAs as derivatives. TBAs that settle on the first possible delivery date are accounted for as bonds. The Company’s futures contracts are exchange traded and have credit risk. Margin requirements are met with the deposit of securities. Futures contracts are generally settled with offsetting transactions. Forward contracts and financial futures are used by the Company to reduce exposures to various risks including interest rates and currency rates. The Company’s principal derivative exposures to market risk are interest rate risk, which includes inflation and credit risk. Interest rate risk pertains to the change in fair value of the derivative instruments as a result of changes in market interest rates. The Company is exposed to credit-related losses in the event of nonperformance by counterparties to derivative financial instruments. The Company regularly monitors counterparty credit ratings, derivative positions, valuations and the value of collateral posted to ensure counterparties are credit-worthy and the concentration of exposure is minimized, and monitors its derivative credit exposure as part of its overall risk management program. The Company enters derivative transactions through bilateral derivative agreements with counterparties, or through over the counter cleared derivatives with a counterparty and the use of a clearinghouse. To minimize credit risk for bilateral transactions, the Company and its counterparties generally enter into master netting agreements based on agreed upon requirements that outline the framework for how collateral is to be posted in the amount owed under each transaction, subject to certain minimums. For over the counter cleared derivative transactions between the Company and a counterparty, the parties enter into a series of master netting and other agreements that govern, among other things, clearing and collateral requirements. These transactions are cleared through a clearinghouse and each derivative counterparty is only exposed to the default risk of the clearinghouse. Certain interest rate swaps and credit default swaps are considered cleared transactions. These cleared transactions require initial and daily variation margin collateral postings. These agreements allow for contracts in a positive position, in which amounts are due to the Company, to be offset by contracts in a negative position. This right of offset, combined with collateral obtained from counterparties, reduces the Company’s credit exposure. Net collateral pledged to the counterparties was $57 million as of December 31, 2020 and $124 million as of December 31, 2019. In the event of default, the full market value exposure at risk in a net gain position, net of offsets and collateral was $3 million as of December 31, 2020 and $3 million as of December 31, 2019. The statutory net amount at risk, defined as net collateral pledged and statement values excluding accrued interest, was $34 million as of December 31, 2020 and $9 million as of December 31, 2019.
C.M. LIFE INSURANCE COMPANY NOTES TO STATUTORY FINANCIAL STATEMENTS, continued
38
The following summarizes the carrying values and notional amounts of the Company’s derivative financial instruments: December 31, 2020 Assets Liabilities Carrying Notional Carrying Notional Value Amount Value Amount (In Millions) Interest rate swaps $ 902 $ 6,488 $ 890 $ 4,986 Options 39 381 11 253 Currency swaps 18 205 23 308 Forward contracts 1 75 7 205 Financial futures - - 10 450 Total $ 960 $ 7,149 $ 941 $ 6,202 December 31, 2019 Assets Liabilities Carrying Notional Carrying Notional Value Amount Value Amount (In Millions) Interest rate swaps $ 466 $ 6,105 $ 561 $ 5,903 Options 31 350 8 269 Currency swaps 36 397 4 123 Forward contracts - 69 4 248 Financial futures - - 16 450 Total $ 533 $ 6,921 $ 593 $ 6,993 The average fair value of outstanding derivative assets was $1,129 million for the year ended December 31, 2020 and $531 million for the year ended December 31, 2019. The average fair value of outstanding derivative liabilities was $1,026 million for the year ended December 31, 2020 and $554 million for the year ended December 31, 2019. The company did not have notional due after one year through five years for the years ended December 31, 2020 and December 31, 2019. The following presents the Company’s gross notional interest rate swap positions: December 31, 2020 2019 (In Millions) Open interest rate swaps in a fixed pay position $ 5,273 $ 5,565 Open interest rate swaps in a fixed receive position 6,202 6,443 Total interest rate swaps $ 11,475 $ 12,008
C.M. LIFE INSURANCE COMPANY NOTES TO STATUTORY FINANCIAL STATEMENTS, continued
39
The following summarizes the Company’s net realized gains (losses) on closed contracts and change in net unrealized gains (losses) related to market fluctuations on open contracts by derivative type: Year Ended December 31, 2020 Net Realized Change In Net Gains (Losses) Unrealized Gains on Closed (Losses) on Contracts Open Contracts (In Millions) Interest rate swaps $ - $ 107 Currency swaps 11 (36) Options (1) 6 Forward contracts (5) (3) Financial futures 98 6 Total $ 103 $ 80 Year Ended December 31, 2019 Net Realized Change In Net Gains (Losses) Unrealized Gains on Closed (Losses) on Contracts Open Contracts (In Millions) Interest rate swaps $ (2) $ 30 Currency swaps 1 4 Options 1 8 Forward contracts 10 (7) Financial futures 113 (47) Total $ 123 $ (12)
C.M. LIFE INSURANCE COMPANY NOTES TO STATUTORY FINANCIAL STATEMENTS, continued
40
Year Ended December 31, 2018 Net Realized Change In Net Gains (Losses) Unrealized Gains on Closed (Losses) on Contracts Open Contracts (In Millions) Interest rate swaps $ (1) $ (42) Currency swaps 3 30 Options (3) (6) Forward contracts 9 6 Financial futures (53) 32 Total $ (45) $ 20 The following summarizes gross and net information of derivative assets and liabilities, along with collateral posted in connection with master netting agreements: December 31, 2020 December 31, 2019 Derivative Derivative Derivative Derivative Assets Liabilities Net Assets Liabilities Net (In Millions) Gross $ 960 $ 941 $ 19 $ 533 $ 593 $ (60) Due and accrued 47 126 (79) 37 108 (71) Gross amounts offset (816) (816) - (525) (525) - Net asset 191 251 (60) 45 176 (131) Collateral posted (249) (305) 56 (124) (248) 124 Net $ (58) $ (54) $ (4) $ (79) $ (72) $ (7) h. Repurchase agreements The Company had no repurchase agreements as of December 31, 2020 and December 31, 2019.
C.M. LIFE INSURANCE COMPANY NOTES TO STATUTORY FINANCIAL STATEMENTS, continued
41
i. Net investment income Net investment income, including IMR amortization, comprised the following: Years Ended December 31, 2020 2019 2018 (In Millions) Bonds $ 171 $ 196 $ 196 Preferred stocks - 1 2 Common stocks - affiliates 29 30 - Mortgage loans 40 40 41 Policy loans 7 7 7 Partnerships and limited liability companies 8 40 33 Derivatives 33 14 21 Cash, cash equivalents and short-term investments 5 7 4 Other (3) 9 3 Subtotal investment income 290 344 307 Amortization of the IMR 3 1 7 Investment expenses (14) (18) (18)
Net investment income $ 279 $ 327 $ 296 j. Net realized capital (losses) gains Net realized capital (losses) gains, which include OTTI and are net of deferral to the IMR, comprised the following: Years Ended December 31, 2020 2019 2018 (In Millions)
Bonds $ 7 $ (11) $ (4) Preferred stocks - 1 - Common stocks - subsidiaries and affiliates - (1) - Common stocks - unaffiliated 1 1 1 Mortgage loans (7) - (1) Partnerships and limited liability companies (1) (3) (1) Derivatives 103 123 (45) Other 1 (2) 2 Net realized capital gains (losses) before federal and state taxes and deferral to the IMR 104 108 (48) Net federal and state tax expense (3) (2) (5) Net realized capital gains (losses) before deferral to the IMR 101 106 (53) Net after tax (gains) losses deferred to the IMR (108) (113) 54 Net realized capital (losses) gains $ (7) $ (7) $ 1 The IMR liability balance was $213 million as of December 31, 2020 and $108 million as of December 31, 2019. Refer to Note 2v. “Interest maintenance reserve” for information on the Company’s policy for IMR.
C.M. LIFE INSURANCE COMPANY NOTES TO STATUTORY FINANCIAL STATEMENTS, continued
42
OTTI, included in the realized capital losses, consisted of the following: Years Ended December 31, 2020 2019 2018 (In Millions) Bonds $ (6) $ (12) $ (6) Common stocks (2) - - Mortgage loans (3) - - Partnerships and LLCs (2) (3) (1) Total OTTI $ (13) $ (15) $ (7) The Company recognized OTTI of less than $1 million for the year ended December 31, 2020 and 2019, and $1 million for the year ended December 31, 2018, on structured and loan backed securities, which are included in bonds, primarily due to the present value of expected cash flows being less than the amortized cost. The Company utilized internally-developed models to determine less than 1% of the $6 million of bond OTTI for the year ended December 31, 2020, less than 1% of the $12 million of bond OTTI for the year ended December 31, 2019, and less than 1% of the $6 million of bond OTTI for the year ended December 31, 2018. The remaining OTTI amounts were determined using external inputs such as publicly observable fair values and credit ratings. Refer to Note 2y. "Realized capital (losses) gains including other-than-temporary impairments and unrealized capital gains (losses)" for more information on assumptions and inputs used in the Company’s OTTI models.
C.M. LIFE INSURANCE COMPANY NOTES TO STATUTORY FINANCIAL STATEMENTS, continued
43
6. Federal income taxes In response to the COVID-19 pandemic, the Coronavirus Aid, Relief, and Economic Security (CARES) Act was signed into law on March 27, 2020 and the Consolidated Appropriations Act (CAA), 2021 was signed into law on December 27, 2020. The CARES Act, among other things, permits net operating loss (NOL) carryovers and carrybacks to offset 100% of taxable income for taxable years beginning before 2021. In addition, the CARES Act allows NOLs incurred in 2018, 2019, and 2020 to be carried back to each of the five preceding taxable years to generate a refund of previously paid income taxes. The CAA extends and expands certain tax provisions of the CARES Act. The CARES Act as well as the CAA did not have a material effect on the financial statements. The Company is currently evaluating modifications extending into 2021, however these modifications are not expected to have a material effect on the Company’s financial statements. The Company provides for DTAs in accordance with statutory accounting practices and has met the required threshold to use the three-year reversal period and 15% of surplus limitation. The net DTA or deferred tax liability (DTL) recognized in the Company’s assets, lia bilities and surplus is as follows: December 31, 2020 Ordinary Capital Total (In Millions) Gross DTAs $ 65 $ 26 $ 91 Statutory valuation allowance adjustment - - - Adjusted gross DTAs 65 26 91 DTAs nonadmitted - (18) (18) Subtotal net admitted DTA 65 8 73 Total gross DTLs (65) (4) (69) Net admitted DTA(L) $ - $ 4 $ 4 December 31, 2019 Ordinary Capital Total (In Millions) Gross DTAs $ 88 $ 30 $ 118 Statutory valuation allowance adjustment - - - Adjusted gross DTAs 88 30 118 DTAs nonadmitted (24) (19) (43) Subtotal net admitted DTA 64 11 75 Total gross DTLs (37) (8) (45) Net admitted DTA(L) $ 27 $ 3 $ 30 Change Ordinary Capital Total (In Millions) Gross DTAs $ (23) $ (4) $ (27) Statutory valuation allowance adjustment - - - Adjusted gross DTAs (23) (4) (27) DTAs nonadmitted 24 1 25 Subtotal net admitted DTA 1 (3) (2) Total gross DTLs (28) 4 (24) Net admitted DTA(L) $ (27) $ 1 $ (26)
C.M. LIFE INSURANCE COMPANY NOTES TO STATUTORY FINANCIAL STATEMENTS, continued
44
The amount of adjusted gross DTA admitted under each component of the guidance and the resulting change by tax character are as follows: December 31, 2020 Ordinary Capital Total (In Millions) Admitted DTA 3 years: Federal income taxes that can be recovered $ - $ 4 $ 4 Remaining adjusted gross DTAs expected to be realized within 3 years: 1. Adjusted gross DTA to be realized 27 - 27 2. Adjusted gross DTA allowed per limitation threshold 260 - 260 Lesser of lines 1 or 2 27 - 27 Adjusted gross DTAs offset by existing DTLs 38 4 42 Total admitted DTA realized within 3 years $ 65 $ 8 $ 73 December 31, 2019 Ordinary Capital Total (In Millions) Admitted DTA 3 years: Federal income taxes that can be recovered $ - $ 3 $ 3 Remaining adjusted gross DTAs expected to be realized within 3 years 1. Adjusted gross DTA to be realized 27 - 27 2. Adjusted gross DTA allowed per limitation threshold 254 - 254 Lesser of lines 1 or 2 27 - 27 Adjusted gross DTAs offset by existing DTLs 37 8 45 Total admitted DTA realized within 3 years $ 64 $ 11 $ 75 Change Ordinary Capital Total (In Millions) Admitted DTA 3 years: Federal income taxes that can be recovered $ - $ 1 $ 1 Remaining adjusted gross DTAs expected to be realized within 3 years 1. Adjusted gross DTA to be realized - - - 2. Adjusted gross DTA allowed per limitation threshold 6 - 6 Lesser of lines 1 or 2 - - - Adjusted gross DTAs offset by existing DTLs 1 (4) (3) Total admitted DTA realized within 3 years $ 1 $ (3) $ (2)
C.M. LIFE INSURANCE COMPANY NOTES TO STATUTORY FINANCIAL STATEMENTS, continued
45
The Company's total realization threshold limitations are as follows: December 31, 2020 2019 ($ In Millions) Ratio percentage used to determine recovery period and threshold limitation 1,471% 1,415% Amount of adjusted capital and surplus used to determine recovery period and threshold limitation above $ 1,732 $ 1,691
C.M. LIFE INSURANCE COMPANY NOTES TO STATUTORY FINANCIAL STATEMENTS, continued
46
The ultimate realization of DTAs depends on the generation of future taxable income during the periods in which the temporary differences are deductible. Management considers the scheduled reversal of DTLs, including the impact of available carryback and carryforward periods, projected taxable income and tax-planning strategies in making this assessment. The impact of tax-planning strategies is as follows: December 31, 2020 Ordinary Capital Total (Percent) Impact of tax planning strategies: Adjusted gross DTAs (% of total adjusted gross DTAs) - % - % - % Net admitted adjusted gross DTAs (% of total net admitted adjusted gross DTAs) - % 100 % 92 % December 31, 2019 Ordinary Capital Total (Percent) Impact of tax planning strategies: Adjusted gross DTAs (% of total adjusted gross DTAs) - % - % - % Net admitted adjusted gross DTAs (% of total net admitted adjusted gross DTAs) - % 100 % 11 % Change Ordinary Capital Total (Percent) Impact of tax planning strategies: Adjusted gross DTAs (% of total adjusted gross DTAs) - % - % - % Net admitted adjusted gross DTAs (% of total net admitted adjusted gross DTAs) - % - % 81 % There are no reinsurance strategies included in the Company's tax-planning strategies. The provision for current tax expense on earnings is as follows: Years Ended December 31, 2020 2019 2018 (In Millions) Federal income tax expense on operating earnings $ 7 $ 20 $ 7 Total federal and foreign income tax expense on operating earnings 7 20 7 Federal income tax expense on net realized capital gains (losses) 3 2 5 Total federal and foreign income tax expense $ 10 $ 22 $ 12
C.M. LIFE INSURANCE COMPANY NOTES TO STATUTORY FINANCIAL STATEMENTS, continued
47
The tax effects of temporary differences that give rise to significant portions of the DTAs and DTLs are as follows:
Capital Unrealized investment gains 5 8 (3) Total capital DTLs 5 8 (3) Total DTLs 69 45 24 Net admitted DTA $ 4 $ 30 $ (26)
C.M. LIFE INSURANCE COMPANY NOTES TO STATUTORY FINANCIAL STATEMENTS, continued
48
The change in net deferred income taxes comprised the following: Years Ended December 31, 2020 2019 2018 (In Millions) Net DTA(L) $ (51) $ (22) $ (2) Less: Items not recorded in the change in net deferred income taxes: Tax-effect of unrealized gains/(losses) 24 - - Change in net deferred income taxes $ (27) $ (22) $ (2) As of December 31, 2020, the Company had no net operating or capital loss carryforwards to include in deferred income taxes. The Company has no tax credit carryforwards included in deferred taxes. The components of federal and foreign income tax are recorded in the Statutory Statements of Operations and the Statutory Statements of Changes in Capital and Surplus and are different from those which would be obtained by applying the prevailing federal income tax rate to net gain from operations before federal income taxes. The significant items causing this difference are as follows: Years Ended December 31, 2020 2019 2018 (In Millions) 21% 21% 21% Provision computed at statutory rate $ 46 $ 52 $ 9 Investment items (10) (9) (9) Change in reserve valuation basis 1 - (2) Nonadmitted assets 1 - - Change in tax treatment of a prior year reinsurance transaction - - 16 Total statutory income tax expense $ 38 $ 43 $ 14 Federal and foreign income tax expense $ 11 $ 21 $ 12 Change in net deferred income taxes 27 22 2 Total statutory income tax expense $ 38 $ 43 $ 14 The Company paid federal income taxes of $15 million in 2020, $12 million in 2019 and $31 million in 2018. The total income taxes incurred in the current and prior years that will be available for recoupment in the event of future net capital losses totaled $2 million related to 2020, $3 million related to 2019, and $3 million related to 2018.
The Company is included in a consolidated U.S. federal income tax return with its parent, MassMutual, a mutual life insurance company domiciled in the Commonwealth of Massachusetts, and MassMutual’s eligible U.S. subsidiaries. The Company also files income tax returns in various states and foreign jurisdictions. The Company, MassMutual, and MassMutual’s eligible subsidiaries and certain affiliates (the Parties) have executed and are subject to a written tax allocation agreement (the Agreement). The Agreement sets forth the manner in which the total combined federal income tax is allocated among the Parties. The Agreement provides the Company with the enforceable right to recoup federal income taxes paid in prior years in the event of future net capital losses, which it may incur. Further, the Agreement provides the Company with the enforceable right to utilize its net losses carried forward as an offset to future net income subject to federal income taxes.
C.M. LIFE INSURANCE COMPANY NOTES TO STATUTORY FINANCIAL STATEMENTS, continued
49
Companies are generally required to disclose unrecognized tax benefits, which are the tax effect of positions taken on their tax returns that may be challenged by various taxing authorities, in order to provide users of financial statements more information regarding potential liabilities. The Company recognizes tax benefits and related reserves in accordance with existing statutory accounting practices for liabilities, contingencies and impairments of assets. The following is a reconciliation of the beginning and ending liability for unrecognized tax benefits (in millions): Balance, January 1, 2020 $ 6 Gross change related to positions taken in current year 1 Balance, December 31, 2020 $ 7 Included in the liability for unrecognized tax benefits as of December 31, 2020 are $7 million of tax positions for which the ultimate deductibility is highly certain but for which there is uncertainty about the timing of such deductibility. The liability for the unrecognized tax benefits as of December 31, 2020 includes no unrecognized tax benefits that, if recognized, would impact the Company’s effective tax rate. The Company recognizes accrued interest and penalties related to the liability for unrecognized tax benefits as a component of the provision for income taxes. The amount of net interest recognized was immaterial as of December 31, 2020 and 2019. The Company has no accrued penalties related to the liability for unrecognized tax benefits. In the next year, the Company does not anticipate the total amount of uncertain tax positions to significantly increase or decrease. The Internal Revenue Service (IRS) has completed its examination of MassMutual and its subsidiaries for the 2011-2016 tax years which are currently at IRS Appeals. The IRS commenced its examination of years 2017-2018 in October 2020. The adjustments resulting from these examinations are not expected to materially affect the position or liquidity of the Company. As of December 31, 2020 and 2019, the Company did not recognize any protective deposits as admitted assets. 7. Deferred and uncollected life insurance premium Deferred and uncollected life insurance premium, net of loading and reinsurance, are included in other than invested assets in the Company’s Statutory Statements of Financial Position. The following summarizes the deferred and uncollected life insurance premium on a gross basis, as well as net of loading and reinsurance: December 31, 2020 2019 Gross Net Gross Net (In Millions) Ordinary renewal $ (12) $ (14) $ (13) $ (16) Total $ (12) $ (14) $ (13) $ (16) Deferred premium is the portion of the annual premium not earned at the reporting date. Loading on deferred premium is an amount obtained by subtracting the valuation net deferred premium from the gross deferred premium and generally includes allowances for acquisition costs and other expenses. Refer to Note 2p. "Policyholders' reserves" for information on the Company’s accounting policies regarding gross premium and net premium. Uncollected premium is gross premium net of reinsurance that is due and unpaid as of the reporting date, net of loading. Net premium is the amount used in the calculation of reserves. The change in deferred and uncollected life insurance premium is included in premium income. The change in loading is included as an expense and is not shown as a reduction to premium income.
C.M. LIFE INSURANCE COMPANY NOTES TO STATUTORY FINANCIAL STATEMENTS, continued
50
Ordinary new business and ordinary renewal business consist of the basic amount of premium required on the underlying life insurance policies.
In certain instances, gross premium is less than net premium according to the standard valuation set by the Division and the Department. The gross premium is less than the net premium needed to establish the reserves because the statutory reserves must use standard conservative valuation mortality tables, while the gross premium calculated in pricing uses mortality tables that reflect both the Company’s experience and the transfer of mortality risk to reinsurers. The Company had life insurance in force of $381 million as of December 31, 2020 and $380 million as of December 31, 2019 for which gross premium was less than net premium.
8. Policyholders’ liabilities a. Policyholders’ reserves
The Company had life insurance in force of $16,500 million as of December 31, 2020 and $18,940 million as of December 31, 2019. The following summarizes policyholders' reserves, net of reinsurance, and the range of interest rates by type of product: December 31, 2020 2019 Amount Interest Rates Amount Interest Rates ($ In Millions) Individual annuities $ 3,013 3.3% - 9.0% $ 2,999 3.5% - 9.0% Individual universal and variable life 793 4.0% - 4.5% 848 4.0% - 4.5% Individual life 94 3.5% - 4.5% 92 3.5% - 4.5% Total $ 3,900 $ 3,939 Individual life includes whole life and term insurance. b. Liabilities for deposit-type contracts Supplementary contracts not involving life contingencies of $69 million as of December 31, 2020 and $86 million as of December 31, 2019 were included in liabilities for deposit-type contracts. The interest rate range on supplementary contracts was 2.5% to 3.0% as of December 31, 2020 and 0.3% to 4.0% as of December 31, 2019. c. Additional liability for annuity contracts Certain variable annuity contracts include additional death benefit features. Election of these benefits is generally only available at contract issue. The following shows the liabilities for GMDBs (in millions): Liability as of January 1, 2019 $ 3 Incurred guarantee benefits 1 Paid guarantee benefits (1) Liability as of December 31, 2019 3 Incurred guarantee benefits (1) Paid guarantee benefits (1) Liability as of December 31, 2020 $ 1
C.M. LIFE INSURANCE COMPANY NOTES TO STATUTORY FINANCIAL STATEMENTS, continued
51
The Company held deterministic reserves as of December 31, 2020 and reserves in accordance with the stochastic scenarios as of December 31, 2019. The following summarizes the account values, net amount at risk and weighted average attained age for variable annuity contracts with GMDBs classified as policyholders’ reserves and separate account liabilities. The net amount at risk is defined as the minimum guarantee less the account value calculated on a policy-by-policy basis, but not less than zero.
December 31, 2020 2019 Net Weighted Net Weighted Account Amount Average Account Amount Average Value at Risk Attained Age Value at Risk Attained Age ($ In Millions) GMDB $ 1,656 $ 17 66 $ 1,596 $ 19 66 Account values of variable annuity contracts with GMDBs are summarized below: December 31, 2020 2019 (In Millions) Separate account $ 1,301 $ 1,237 General account 355 359 Total $ 1,656 $ 1,596 d. Additional liability for individual life contracts Certain universal life and variable universal life contracts include features such as GMDBs or other guarantees that ensure continued death benefit coverage when the policy would otherwise lapse. The value of the guarantee is only available to the beneficiary in the form of a death benefit. The following presents the changes in the liability, net of reinsurance, for guarantees on universal life and variable universal life type contracts was as follows: December 31, 2020 2019 (In Millions) Beginning balance $ (122) $ 160 Net liability increase (decrease) 102 (282) Ending balance $ (20) $ (122)
C.M. LIFE INSURANCE COMPANY NOTES TO STATUTORY FINANCIAL STATEMENTS, continued
52
9. Reinsurance
The Company enters into reinsurance agreements with affiliated and unaffiliated insurers in the normal course of business in order to mitigate the impact of underwriting mortality and morbidity risks. Such transfers do not relieve the Company of its primary liability to its customers and, as such, failure of reinsurers to honor their obligations could result in credit losses that could arise if a reinsurer defaults. The Company reduces reinsurance default risk by evaluating the financial condition of reinsurers and monitoring for possible concentrations within the Company’s reinsurers and using trust structures, when appropriate. The Company reinsures a portion of its mortality risk in its life business under either a first dollar quota-share arrangement or an in excess of the retention limit arrangement with reinsurers. The amounts reinsured are on a yearly renewable term or coinsurance basis. The Company’s highest retention limit for new issues of life policies ranges from $15 million to $25 million.
Refer to Note14. "Related party transactions" for information about the Company’s affiliated ceded reinsurance transactions. The Company did not reinsure any policies with a company chartered in a country other than the U.S., excluding U.S. branches of these companies, which was owned in excess of 10% or controlled directly or indirectly by an insured, a beneficiary, a creditor or any other person not primarily engaged in the insurance business. There are no reinsurance agreements in effect under which the reinsurer may unilaterally cancel any reinsurance for reasons other than for nonpayment of premium or other similar credits. The Company has no reinsurance agreements in effect such that the amount of losses paid or accrued through the statement date may result in a payment to the reinsurer of amounts which, in aggregate and allowing for offset of mutual credits from other reinsurance agreements with the same reinsurer, exceed the total direct premium collected under the reinsured policies. If all reinsurance agreements were terminated by either party as of December 31, 2020, the resulting reduction in surplus due to loss of reinsurance reserve credits, net of unearned premium, would be approximately $504 million assuming no return of the assets, excluding assets in trust, backing these reserves from the reinsurer to the Company. Reinsurance amounts included in the Statutory Statements of Operations were as follows: Years Ended December 31, 2020 2019 2018 (In Millions)
Reinsurance reserves ceded to affiliated and unaffiliated reinsurers as of December 31, 2020 include $1,501 million associated with life insurance policies and $2,970 million for annuity. Reinsurance reserves ceded to affiliated and unaffiliated reinsurers as of December 31, 2019 include $1,649 million associated with life insurance policies and $2,440 million for annuity.
In 2020, a $3 million net loss was recorded for the termination of certain yearly renewable term life insurance treaties, representing the write-off of net receivables. $3 million increase in surplus was realized for termination of unauthorized reinsurance. As of December 31, 2020, one reinsurer accounted for 30% of the outstanding balance of the unaffiliated reinsurance recoverables and the next largest reinsurer had 21%. Overall, the Company believes that each of these exposures to a single reinsurer does not create an undue concentration of risk and the Company’s business is not substantially dependent upon any single reinsurer. In 2018, a $14 million net loss was recorded for the recapture of certain yearly renewable term life insurance treaties, with $6 million recorded in premium income and $20 million recorded in change in policyholder reserves.
C.M. LIFE INSURANCE COMPANY NOTES TO STATUTORY FINANCIAL STATEMENTS, continued
54
10. Withdrawal characteristics a. Annuity actuarial reserves and liabilities for deposit-type contracts The withdrawal characteristics of the Company’s annuity actuarial reserves and deposit-type contracts as of December 31, 2020 are illustrated below:
Individual annuities
General Account
Separate Account
with Guarantees
Separate Account
Non- Guaranteed Total
% of Total
(In Millions) Subject to discretionary withdrawal: With market value adjustment $ 14 $ - $ - $ 14 - % At book value less current charge of 5% or more 3,302 - - 3,302 45 At fair value - - 1,304 1,304 19 Total with market value adjustment at fair value 3,316 - 1,304 4,620 64 At book value without adjustment (minimal or no charge or
dj ) 2,645 - - 2,645 36
Not subject to discretionary i hd l
22 - - 22 - Total $ 5,983 $ - $ 1,304 $ 7,287 100 % Reinsurance ceded 2,971 - - 2,971 Total, net of reinsurance $ 3,012 $ - $ 1,304 $ 4,316 Amount included in book value without adjustment after statement
d 1 - - 1
Deposit-type contracts
General Account
Separate Account
with Guarantees
Separate Account
Non- Guaranteed Total
% of Total
(In Millions) At book value without adjustment (minimal or no charge or
dj )$ 56 $ - $ - $ 56 81
Not subject to discretionary i hd l
13 - - 13 19 Total $ 69 $ - $ - $ 69 100 % Total, net of reinsurance $ 69 $ - $ - $ 69
C.M. LIFE INSURANCE COMPANY NOTES TO STATUTORY FINANCIAL STATEMENTS, continued
55
The following is a summary of total annuity actuarial reserves and liabilities for deposit-type contracts as of December 31, 2020 (in millions): Statutory Statements of Financial Position: Policyholders’ reserves – individual annuities $ 3,012 Liabilities for deposit-type contracts 69 Subtotal 3,081 Separate Account Annual Statement: Annuities 1,304 Total $ 4,385 b. Analysis of Life Actuarial Reserves by Withdrawal Characteristics The withdrawal characteristics of the Company's life actuarial reserves as of December 31, 2020 are illustrated below: General Account Account Cash Value Value Reserve (In Millions) Subject to discretionary withdrawal, surrender values, or policy
loans loans: Universal Life 225 225 227 Universal Life with Secondary Guarantees 907 881 1,806 Other Permanent Cash Value Life Insurance 65 76 90 Variable Universal Life 72 72 85 Not subject to discretionary withdrawal or no cash values Term Policies without Cash Value - - 2 Disability - Active Lives - - 1 Disability - Disabled Lives - - 19 Miscellaneous Reserves - - 158 Total (gross: direct + assumed) 1,269 1,254 2,388 Reinsurance Ceded 682 663 1,501 Total (net) $ 587 $ 591 $ 887 Separate Account Nonguaranteed Account Cash Value Value Reserve (In Millions) Subject to discretionary withdrawal, surrender values, or policy
loans loans: Variable Universal Life 664 664 664 Not subject to discretionary withdrawal or no cash values Total (gross: direct + assumed) 664 664 664 Total (net) $ 664 $ 664 $ 664
C.M. LIFE INSURANCE COMPANY NOTES TO STATUTORY FINANCIAL STATEMENTS, continued
56
c. Separate accounts The Company has nonguaranteed separate accounts which are variable accounts where the benefit is determined by the performance and/or market value of the investments held in the separate account with incidental risk, notional expense and minimum death benefit guarantees. Information regarding the separate accounts of the Company as of and for the year ended December 31, 2020 is as follows: Non Guaranteed (In Millions) Net premium, considerations or deposits for the year ended December 31, 2020 $ 40 Reserves at December 31, 2020: For accounts with assets at: Fair value $ 1,969 Nonpolicy liabilities 3 Total $ 1,972 Reserves by withdrawal characteristics: Subject to discretionary withdrawal: At fair value $ 1,969 Nonpolicy liabilities 3 Total $ 1,972 The Company does not have any reserves in separate accounts for asset default risk in lieu of AVR. The following is a reconciliation of amounts reported as transfers (from) to separate accounts in the Summary of Operations of the Company’s NAIC Separate Account Annual Statement to the amounts reported as net transfers (from) to separate accounts in change in policyholders’ reserves in the accompanying Statutory Statements of Operations: Years Ended December 31, 2020 2019 2018 (In Millions) From the Separate Account Annual Statement: Transfers to separate accounts $ 40 $ 44 $ 53 Transfers from separate accounts (162) (197) (187) Net transfers from separate accounts $ (122) $ (153) $ (134) 11. Capital and surplus
MassMutual has authorized the contribution of funds to the Company sufficient to meet the capital requirements of each state in the U.S. in which the Company is licensed to do business. Substantially all of the statutory capital and surplus is subject to dividend restrictions. Dividend restrictions, imposed by state regulations, limit the payment of dividends to the shareholder without prior approval from the Department. Under these regulations, $174 million of capital and surplus is available for distribution to the shareholder in 2021 without prior regulatory approval. The Company declared and paid $173 million in dividends to MassMutual in 2020, and did not pay a dividend to MassMutual in 2019 or 2018.
C.M. LIFE INSURANCE COMPANY NOTES TO STATUTORY FINANCIAL STATEMENTS, continued
57
12. Presentation of the Statutory Statements of Cash Flows
The following table presents those transactions that have affected the Company's recognized assets or liabilities but have not resulted in cash receipts or payments during the years ended December 31, 2020, 2019 and 2018. Accordingly, the Company has excluded these non-cash activities below from the Statutory Statement of Cash Flows for the years ended December 31, 2020, 2019 and 2018.
Years Ended December 31, 2020 2019 2018 (In Millions) Bond conversions and refinancing $ 187 $ 57 $ 35 Assets received in-kind for bond maturity 6 - - Stock conversion 3 - - Net investment income payment in-kind bonds 1 1 - Other - 1 2
13. Business risks, commitments and contingencies
a. Risks and uncertainties
The Company operates in a business environment subject to various risks and uncertainties. The principal risks include insurance and underwriting risks, investment and interest rate risks, currency exchange risk and credit risk. The combined impact of these risks could have a material, adverse effect on the Company’s financial statements or result in operating losses in future periods. The Company employs the use of reinsurance, portfolio diversification, asset/liability management processes and other risk management techniques to mitigate the impact of these risks.
Insurance and underwriting risks
The Company prices its products based on estimated benefit payments reflecting assumptions with respect to mortality, longevity, persistency, interest rates and other factors. If actual policy experience emerges that is significantly and adversely different from assumptions used in product pricing, the effect could be material to the profitability of the Company.
Investment and interest rate risks
The fair value, cash flows and earnings of investments can be influenced by a variety of factors including changes in interest rates, credit spreads, equity markets, portfolio asset allocation and general economic conditions. The Company employs a rigorous asset/liability management process to help mitigate the economic impacts of various investment risks, in particular interest rate risk. By effectively matching the market sensitivity of assets with the liabilities they support, the impact of interest rate changes is addressed, on an economic basis, as the change in the value of the asset is offset by a corresponding change in the value of the supported liability. The Company uses derivatives, such as interest rate swaps and swaptions, as well as synthetic assets to reduce interest rate and duration imbalances determined in asset/liability analyses.
The levels of U.S. interest rates are influenced by U.S. monetary policies and by the relative attractiveness of U.S. markets to investors versus other global markets. As interest rates increase, certain debt securities may experience amortization or prepayment speeds that are slower than those assumed at purchase, impacting the expected maturity of these securities and the ability to reinvest the proceeds at the higher yields. Rising interest rates may also result in a decrease in the fair value of the investment portfolio. As interest rates decline, certain debt securities may experience accelerated amortization and prepayment speeds than what was assumed at purchase. During such periods, the Company is at risk of lower net investment income as it may not be able to reinvest the proceeds at comparable yields. Declining interest rates may also increase the fair value of the investment portfolio.
C.M. LIFE INSURANCE COMPANY NOTES TO STATUTORY FINANCIAL STATEMENTS, continued
58
Interest rates also have an impact on the Company’s products with guaranteed minimum payouts and on interest credited to account holders. As interest rates decrease, investment spreads may contract as crediting rates approach minimum guarantees, resulting in an increased liability.
In periods of increasing interest rates, policy loans, surrenders and withdrawals may increase as policyholders seek investments with higher perceived returns. This could result in cash outflows requiring the Company to sell invested assets at a time when the prices of those assets are adversely affected by the increase in market interest rates, which could cause the Company to realize investment losses.
Currency exchange risk
The Company has currency risk due to its non-U.S. dollar investments. The Company mitigates currency risk through the use of cross-currency swaps and forward contracts. Cross-currency swaps are used to minimize currency risk for certain non-U.S. dollar assets through a pre-specified exchange of interest and principal. Forward contracts are used to hedge movements in exchange rates.
Credit and other market risks
The Company manages its investments to limit credit and other market risks by diversifying its portfolio among various security types and industry sectors as well as purchasing credit default swaps to transfer some of the risk.
Stressed conditions, volatility and disruptions in global capital markets or in particular markets or financial asset classes can have an adverse effect on the Company, in part because the Company has a large investment portfolio and assets supporting the Company’s insurance liabilities are sensitive to changing market factors. Global market factors, including interest rates, credit spread, equity prices, real estate markets, foreign currency exchange rates, consumer spending, business investment, government spending, the volatility and strength of the capital markets, deflation and inflation, all affect the business and economic environment and, ultimately, the profitability of the Company’s business. Disruptions in one market or asset class can also spread to other markets or asset classes. Upheavals in the financial markets can also affect the Company’s business through their effects on general levels of economic activity, employment and customer behavior.
The CMBS, RMBS and leveraged loan sectors are sensitive to evolving conditions that can impair the cash flows realized by investors and is subject to uncertainty. Management’s judgment regarding OTTI and estimated fair value depends upon the evolving investment sector and economic conditions. It can also be affected by the market liquidity, a lack of which can make it difficult to obtain accurate market prices for RMBS and other investments, including CMBS and leveraged loans. Any deterioration in economic fundamentals, especially related to the housing sector could affect management’s judgment regarding OTTI.
The Company has investments in structured products exposed primarily to the credit risk of corporate bank loans, corporate bonds or credit default swap contracts referencing corporate credit risk. Most of these structured investments are backed by corporate loans and are commonly known as collateralized loan obligations that are classified as CDO. The portfolios backing these investments are actively managed and diversified by industry and individual issuer concentrations. Due to the complex nature of CDO and the reduced level of transparency to the underlying collateral pools for many market participants, the recovery in CDO valuations generally lags the overall recovery in the underlying assets. Management believes its scenario analysis approach, based primarily on actual collateral data and forward looking assumptions, does capture the credit and most other risks in each pool. However, in a rapidly changing economic environment, the credit and other risks in each collateral pool will be more volatile and actual credit performance of CDO may differ from the Company’s assumptions.
The Company continuously monitors its investments and assesses their liquidity and financial viability; however, the existence of the factors described above, as well as other market factors, could negatively impact the market value of the Company's investments. If the Company sells its investments prior to maturity or market recovery, these investments may yield a return that is less than the Company otherwise would have been able to realize.
Asset-based fees calculated as a percentage of the separate account assets are a source of revenue to the Company. Gains and losses in the investment markets may result in corresponding increases and decreases in the Company’s separate account assets and related revenue.
C.M. LIFE INSURANCE COMPANY NOTES TO STATUTORY FINANCIAL STATEMENTS, continued
59
The spread of the coronavirus, causing increased cases of COVID-19, around the world in 2020 has caused significant volatility in U.S. and international markets. There is significant uncertainty around the breadth and duration of business disruptions related to COVID-19, as well as its impact on the U.S. and international economies. At this time, the Company is not able to reliably estimate the length and severity of the COVID-19 public health crises and, as such, cannot quantify its impact on the financial results, liquidity and capital resources and its operations in future periods.
Political Uncertainties
Political events, domestically or internationally, may directly or indirectly trigger or exacerbate risks related to product offerings, profitability, or any of the risk factors described above. Whether those underlying risk factors are driven by politics or not, the Company’s dynamic approach to managing risks enables management to identify risks, internally and externally, develop mitigation plans, and respond to risks in an attempt to proactively reduce the potential impact of each underlying risk factor on the Company.
b. Guaranty funds The Company is subject to state insurance guaranty fund laws. These laws assess insurance companies’ amounts to be used to pay benefits to policyholders and policy claimants of insolvent insurance companies. Many states allow these assessments to be credited against future premium taxes. The Company believes such assessments in excess of amounts accrued will not materially impact its financial position, results of operations or liquidity. c. Litigation and regulatory matters
In the normal course of business, the Company is involved in disputes, litigation and governmental or regulatory inquiries, administrative proceedings, examinations and investigations, both pending and threatened. These matters, if resolved adversely against the Company or settled, may result in monetary damages, fines and penalties or require changes in the Company’s business practices. The resolution or settlement of these matters is inherently difficult to predict. Based upon the Company’s assessment of these pending matters, the Company does not believe that the amount of any judgment, settlement or other action arising from any pending matter is likely to have a material adverse effect on the statement of financial position. However, an adverse outcome in certain matters could have a material adverse effect on the results of operations for the period in which such matter is resolved, or an accrual is determined to be required, on the financial statement financial position, or on our reputation. The Company evaluates the need for accruals of loss contingencies for each matter. When a liability for a matter is probable and can be estimated, the Company accrues an estimate of the loss offset by related insurance recoveries or other contributions, if any. An accrual may be subject to subsequent adjustment as a result of additional information and other developments. The resolution of matters are inherently difficult to predict, especially in the early stages of matter. Even if a loss is probable, due to many complex factors, such as speed of discovery and the timing of court decisions or rulings, a loss or range of loss may not be reasonably estimated until the later stages of the matter. For matters where a loss is material and it is either probable or reasonably possible then it is disclosed. For matters where a loss may be reasonably possible, but not probable, or is probable but not reasonably estimated, no accrual is established, but the matter, if material, is disclosed.
C.M. LIFE INSURANCE COMPANY NOTES TO STATUTORY FINANCIAL STATEMENTS, continued
60
d. Commitments
In the normal course of business, the Company enters into commitments to purchase certain investments. The majority of these commitments have funding periods that extend between one and five years. The Company is not required to fund commitments once the commitment period expires. As of December 31, 2020, the Company had the following outstanding commitments: 2021 2022 2023 2024 2025 Thereafter Total (In Millions) Private placements $ 32 $ 84 $ - $ - $ - $ 1 $ 117 Mortgage loans 6 9 2 3 1 4 25 Partnerships and LLCs 4 1 1 5 14 38 63 Total $ 43 $ 94 $ 3 $ 7 $ 15 $ 43 $ 205 14. Related party transactions Pursuant to a management agreement, MassMutual, for a fee, furnishes the Company, as required, operating facilities, human resources, computer software development and managerial services. Investment and administrative services are also provided to the Company pursuant to a management services agreement with MassMutual. While management believes that these fees are calculated on a reasonable basis, these fees may not necessarily be indicative of the costs that would have been incurred on a stand-alone basis. The following table summarizes the transactions between the Company and the related parties: Years Ended December 31, 2020 2019 2018 (In Millions) Fee income: Recordkeeping and other services $ 1 $ 1 $ 2 Fee expense: Management and service contracts and cost-sharing arrangements 96 134 136 The Company reported less than $1 million as amounts due from affiliates as of December 31, 2020 and 2019. The Company reported $21 million as amounts due to subsidiaries and affiliates as of December 31, 2020 and $33 million as of December 31, 2019. Terms generally require settlement of these amounts within 30 to 90 days.
As of December 31, 2020, MMIH and C.M. Life, together, provided financing of $5,500 million, $5,253 million and $247 million respectively, for MassMutual Asset Finance, LLC (MMAF) that can be used to finance ongoing asset purchases. The Company provided financing of $247 million as of December 31, 2020 and $246 million as of December 31, 2019. During 2020, MMAF borrowed $94 million and repaid $88 million under the MMAF credit facility. During 2019, MMAF borrowed $114 million and repaid $120 million under the MMAF credit facility. Outstanding borrowings under the facility with the Company were $167 million as of December 31, 2020 and $196 million as of December 31, 2019. Interest for these borrowings was $4 million for the year ended December 31, 2020 and $5 million for the year ended December 31, 2019. The floating rate borrowings bear interest at a spread over the 30 day LIBOR. The fixed rate borrowings bear an interest at a spread over average life Treasuries.
Together, MassMutual and C.M. Life, provide a credit facility to Jefferies Finance, LLC whereby Jefferies Finance, LLC (Jefferies) borrows cash through short-term approved financings to fund the purchase of loans for securitization. During 2020, Jefferies borrowed $94 million and repaid $99 million under the credit facility. During 2019, Jefferies borrowed $45 million and repaid $40 million under the credit facility. As of December 31, 2020 there were no outstanding borrowings under this facility. All outstanding interest due under the facility, as of December 31, 2020
C.M. LIFE INSURANCE COMPANY NOTES TO STATUTORY FINANCIAL STATEMENTS, continued
61
had been paid. The interest of this facility is calculated based on a full pass through of interest accrued on the underlying loans purchased.
In 2020, C.M. Life declared and paid $173 million in dividends to MassMutual.
The Company has a stop-loss agreement for life products with MassMutual under which the Company cedes claims which, in aggregate, exceed 2.05% of the covered volume for any year, with maximum coverage of $25 million above the aggregate limit. The aggregate limit was $83 million in 2020, $66 million in 2019 and $86 million in 2018 and it was not exceeded in any of the years. Effective December 31, 2020, the Company entered into a stop-loss agreement to transfer interest rate risk for annuity products with MassMutual. MassMutual provides maximum coverage of $100 million over the five year duration of this contract. The Company has coinsurance agreements with MassMutual where the Company cedes substantially all of the premium on certain universal life policies. In return, MassMutual pays to the Company a stipulated expense allowance and death and surrender benefits. MassMutual holds the assets and related reserves for payment of future benefits on the ceded policies. As of December 31, 2020, the net amounts due from MassMutual for the various reinsurance agreements were $27 million and as of December 31, 2019, the net amounts due from MassMutual were $19 million. These outstanding balances are due and payable with terms ranging from quarterly to annually, depending on the agreement in effect. The following summarizes the related party reinsurance transactions between the Company and MassMutual: Years Ended December 31, 2020 2019 2018 (In Millions) Premium ceded, related to: Stop-loss agreements $ (1) $ - $ - Coinsurance agreements (40) (39) (43) Expense allowances on reinsurance ceded, included in fees and other income, related to: Coinsurance agreements 8 8 14 Policyholder benefits ceded, related to: Coinsurance agreements 74 91 128 15. Subsidiaries and affiliated companies
A summary of ownership and relationship of MassMutual and its subsidiaries and affiliated companies as of December 31, 2020 is illustrated below. Subsidiaries are wholly owned, except as noted.
Subsidiaries of MassMutual C.M. Life Berkshire Way LLC MML Special Situations Investor LLC Timberland Forest Holding LLC – 37% (remaining 63% owned by MassMutual Trad Private Equity LLC) WP – SC, LLC – 81% (remaining 19% owned by C.M. Life) MSP – SC, LLC Insurance Road LLC MM Copper Hill Road LLC Jefferies Finance LLC– 50% (remaining 50% owned by Jefferies Group, Inc.) MML Distributors LLC – 99% (remaining 1% owned by MassMutual Holding LLC) MML Investment Advisers, LLC
C.M. LIFE INSURANCE COMPANY NOTES TO STATUTORY FINANCIAL STATEMENTS, continued
62
Pioneers Gate LLC MML Strategic Distributors, LLC The MassMutual Trust Company, FSB MassMutual Mortgage Lending LLC MML Private Placement Investment Company I, LLC MML Private Equity Fund Investor LLC MM Private Equity Intercontinental LLC MassMutual Holding LLC MassMutual Investment Holding MassMutual International, LLC MML Mezzanine Investor II, LLC MML Mezzanine Investor III, LLC MassMutual External Benefits Group LLC EM Opportunities LLC MassMutual MCAM Insurance Company, Inc. MassMutual Global Business Services India LLP CML Global Capabilities MM Global Capabilities I LLC MM Global Capabilities II LLC MM Global Capabilities III LLC Barings Ascend LLC MML CM LLC Subsidiaries of C.M. Life Insurance Company MML Bay State Life Insurance Company CML Mezzanine Investor III, LLC CML Special Situations Investor LLC Subsidiaries of MML Bay State Life Insurance Company (No subsidiaries) Subsidiaries of MassMutual Investment Holding MML Management Corporation MassMutual Asset Finance LLC Subsidiaries of MassMutual Asset Finance LLC (a subsidiary of MMC Equipment Finance LLC) MMAF Equipment Finance LLC 2013-A MMAF Equipment Finance LLC 2014-A MMAF Equipment Finance LLC 2015-A MMAF Equipment Finance LLC 2016-A MMAF Equipment Finance LLC 2017-A MMAF Equipment Finance LLC 2017-B MMAF Equipment Finance LLC 2018-A MMAF Equipment Finance LLC 2019-A MMAF Equipment Finance LLC 2019-B Rozier LLC Jefferies Finance LLC – 50% (remaining 50% owned by Jefferies Group, Inc.) (No subsidiaries)
C.M. LIFE INSURANCE COMPANY NOTES TO STATUTORY FINANCIAL STATEMENTS, continued
63
16. Subsequent events
Management of the Company has evaluated subsequent events through February 24, 2021, the date the financial statements were available to be issued to state regulators and subsequently on the Company’s website. No events have occurred subsequent to the date of the Statements of Financial Position.
C.M. LIFE INSURANCE COMPANY NOTES TO STATUTORY FINANCIAL STATEMENTS, continued
64
17. Impairment listing for loan-backed and structured securities The following are the total cumulative adjustments and impairments for loan-backed and structured securities since July 1, 2009:
Period Ended Amortized Cost before Cumulative Adjustment
Cumulative Adjustment
Amortized Cost before OTTI Projected Cash Flow Recognized