16
TRAVEL, LEISURE & TOURISM KPMG’s 2014 Caribbean Hotel Benchmarking Survey kpmg.com
TRAVEL, LEISURE & TOURISM
KPMG’s 2014 Caribbean Hotel Benchmarking
Survey
kpmg.com
1 | KPMG’s 2014 Caribbean Hotel Benchmarking Survey

KPMG’s 2014 Caribbean Hotel Benchmarking Survey | 2
Dear Reader:
KPMG’s Caribbean Travel, Leisure and Tourism group is pleased to present the results of KPMG’s 2014 Caribbean Hotel Benchmarking Survey (“the Survey”), which has been designed to provide owners, operators, lenders and investors with a better understanding of the profile and performance of hotels in the Caribbean.
The Survey results corroborate the findings of our 2013 Caribbean Hotel Benchmarking Survey which identified encouraging signs of growth returning to our regional hotels. The key performance indicators of occupancy, ADR and Rev PAR are all up this year and hoteliers are more confident about the future than at any time since 2010 when we first started this initiative. Nearly half of respondents believe 2014’s operational performance will be better than 2013 and most expect meaningful growth to return in 2015 or 2016. Furthermore, taken as a whole, the number of Caribbean stop-over arrivals has increased, although admittedly not in every Caribbean country. Cost saving measures, hard won during the downturn, appear to now be embedded as both departmental and undistributed costs have increased by less than revenue, leading to welcome increases in gross operating profit. So overall there is a lot of positive news to report.
Almost 75% of survey respondents have expansion plans for the next 18 months, with over half indicating energy efficiency is high on their list of priorities. That said the ability to raise financing for new projects and operations remains difficult with twice as many respondents finding it “very difficult” to raise funding compared to those who found it “very easy” to do so. Concerns about the stability of the global economic recovery, together with increasing local costs, feature highly on the list of challenges for the industry over the next year.
We take this opportunity to say a special thank you to our Survey participants (who will also receive a more detailed analysis of the financial results separately). We welcome participation from additional properties for future surveys.
If you have any questions concerning the Survey please contact us or your local KPMG office listed on the back page.
Sincerely,
Stephen Woodward Charlene Lewis-Small Gary Brough Managing Director Director Managing Director KPMG in Bermuda KPMG in The Bahamas KPMG in The Turks and Caicos Islands
KPMG’s 2014 Caribbean Hotel Benchmarking Survey

3 | KPMG’s 2014 Caribbean Hotel Benchmarking Survey
Overview Methodology
KPMG’s Travel, Leisure & Tourism practice in the Caribbean conducted benchmark surveys into the region’s hospitality industry. Financial information for 2012 and 2013 was collected from hotel properties in various Caribbean jurisdictions.
This Survey is based on the survey data collected. Financial information was analysed on a consolidated basis and is based on a non-weighted average (mean) of the number of properties.
Each line is calculated independently. The average amount and percentage shown for each revenue and expense line item will only represent the average amount and percentage for those hotels that contributed data for that line item. For example, for those hotels which did not make contributions to replacement reserves, the percentage of total revenue of all other line items will be impacted to the extent there has been a percentage of total revenue allocated to a line item that they did not incur, in this example an allocation to replacement reserves. This impact is inevitable as revenue and expense categories vary across the Survey population but, as far as possible, responses were reclassified according to the tenth edition of the Uniform System of Accounts for the Lodging Industry (USALI) where necessary. Financial information from the Survey is presented in accordance with USALI.
Where there is a discrepancy between the key performance indicators (KPIs) provided by a participating hotel and the underlying data provided by that hotel, the underlying data has been assumed to be correct and the KPI has been recalculated based on that underlying data.
The KPIs shown are based on the simple average of responses from Survey respondents. Accordingly, such simple average KPIs may not necessarily appear to reconcile to certain source data. For example the impact on survey results of the occupancy of a hotel with a very large number of available rooms is quite different if a simple average approach is taken rather than a weighted average approach, particularly if that hotel’s occupancy is unusually high or low.
Where a participating hotel’s calculation of a KPI does not agree to the standard industry norm of calculating that KPI (for example RevPAR = ADR* occupancy rate), the standard industry norm has been used.
Percentages of Total Revenue have been based on Total Departmental Revenue except for Departmental Expenses which are shown as a percentage of the associated Departmental Revenues.
Comparative data reflects last year’s performance for this year’s respondents and thus will differ from the results reported in last year’s survey which had a different set of respondents.
The Survey responses were not audited.
Differences between the Survey and other reports may result from differences in the profiles of respondents.

KPMG’s 2014 Caribbean Hotel Benchmarking Survey | 4
The state of Caribbean tourism
The number of Caribbean stop-over visitors grew by 1.26% in 2013, building on solid growth since 2010. Between 2008 and 2013, significant compound annual growth in tourist stop-over arrivals was experienced by Cuba (4.0%), Puerto Rico (3.8%), Aruba (3.4%) and the Dominican Republic (3.3%). Decreases were seen in some of the more established destinations including Barbados (-2.2%), Bermuda (-2.2%) and The Bahamas (-1.4%). An exception to this trend was Jamaica, where tourist arrivals increased by 2.6% in the period on a compound annual basis.
Source: Caribbean Tourism Organisation, KPMG analysis. Note: Numbers exclude some jurisdictions canvassed by the CTO in order to present a consistent sample across the time period.
KPMG has identified the following emerging global tourism trends which impact the industry in the region:
Expanding global middle class and the growth of affluent travellers
According to the World Economic Forum, the global middle class will expand by three billion people in the next 15 years. As a result, spending by this newly affluent demographic is expected to more than double by 2030, jumping from US$21 trillion today to US$56 trillion by 2030. Mega developments such as Baha Mar in The Bahamas are expected to have a dramatic effect on travel to the Caribbean over the next decade by a newly wealthy Chinese middle class. Analysis by the UNWTO concludes that
China became the largest outbound tourism market in 2012 with an expenditure of US$102 billion increasing to US$129 billion in 2013.
Closer to home, the U.S. continues to be the major feeder market for our region responsible for 49.3% of the total Caribbean guest market according to the CTO. The top 9% of U.S. households account for 29% of all spending on lodging and air travel. This demographic is expected to grow in number from 10.5 million in 2011 to 20.5 million by 2020 and their total wealth is expected to grow from US$39 trillion to US$87 trillion. These households have a high level of participation in hotel loyalty programmes with 77% of affluent travellers belonging to such programmes, considerably more than business travellers (68%) and the wider leisure traveller demographic (42%). On average they make use of 3.9 hotel loyalty programmes and use 2.5 of them at least once per year.
Energy efficiency
Energy efficiency is a pressing issue for the hospitality industry in general. Reducing operational energy costs and improving the hotel’s image are of primary concern to hoteliers as customers demand ‘greener’ practices, actively commenting in social media on hotel efforts to become environmentally friendly and on examples of bad practice. As we point out in our social media commentary below, adverse comments on social media can have a material impact on the KPI’s that a hotel can achieve.
In terms of the overall cost of energy and utilities, our Survey shows that, on average, our respondents’ utility expense was 6.5% of total revenue in 2013, while in the U.S., according to STR, utility costs were 3.7% of revenue on average.
Chain and brand affiliated hotels are frequently ahead of the curve on energy efficiency issues, having the corporate guidelines and policies which dictate where the investment is best placed and having the ability to invest.
Social media
By Q1 2014, TripAdvisor had recorded 170 million reviews generated by some 128 million users, covering 850,000 hotels, together with some 23 million guest photos. In addition, 90% of questions posted to TripAdvisor’s English-speaking forums are responded to by other travellers within 24 hours.
A recent Cornell University study asserted that transactional data from Travelocity illustrated that if a hotel can increase its review score by 1 point on a 5-point scale (e.g. from 3.3 to 4.3), the hotel can increase its ADR by 11.2% and still maintain the same occupancy.
19.00
18.50
18.00
17.50
17.00
16.50
16.00
15.50
15.00
2008 2009 2010 2011 2012 2013
1.18%
1.95%
3.86%
3.90%
4.60%
1.26%
Mill
ion
s
Growth in Caribbean tourist stop-over arrivals 2008-2013

5 | KPMG’s 2014 Caribbean Hotel Benchmarking Survey
These brief facts demonstrate both the enormous scale of social media and the broadening extent of traveller interactivity that can impact a hotel’s business significantly. The effectiveness of a hotel’s social media strategy is therefore potentially critical to profitability.
The question is, how can the Caribbean best capitalise on these emerging trends to help diversify, stabilise and strengthen our tourism market?
Sources: Resonance Report – 2013; “The Impact of Social Media on Lodging Performance”, Chris Anderson: Cornell University; GBTA Report – U.S. Travel Outlook (July 2014), U.S. Travel Association; UN World Travel Organisation, World Economic Forum: The Travel & Tourism Competitiveness Report 2013; STR U.S. HOST Almanac 2014, KPMG research.
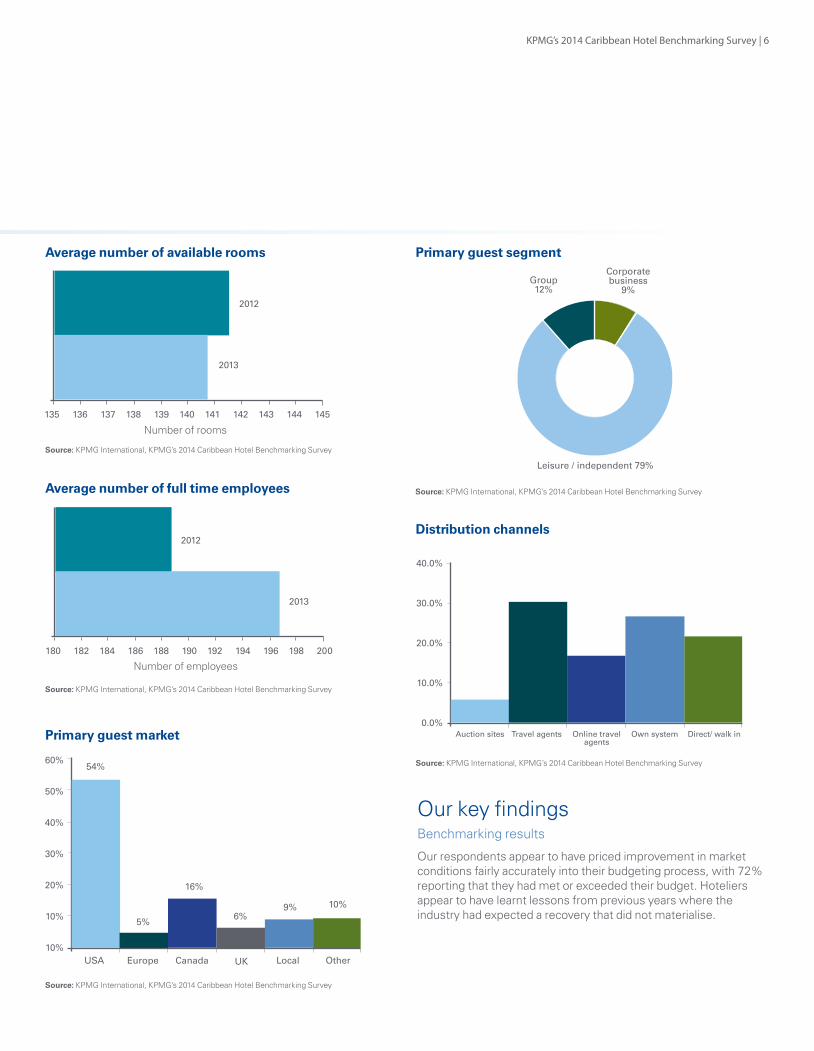
Profile of Survey respondentsThe typical profile of our Survey respondents is that of a full service resort with less than 100 rooms in an English speaking jurisdiction. Respondents overwhelmingly cater to the leisure sector and North America remains by far the largest guest market. The number of available rooms decreased slightly by 0.5% in 2013 and the number of full-time employees increased by 4.3%. In terms of distribution channels, our respondents sourced 48.4% of their business via their own system or direct / walk in, with a further 46.9% being sourced via travel agents, 16.8% of these being through online travel agencies.
Dutch-speaking
6%
English-speaking
85%
French-speaking
6%
Spanish-speaking
3%
Caribbean location
Below 50 rooms21%
50 - 99 rooms36%
100 - 200 rooms18%
Above 200 rooms25%
Hotel size
Property type
Caribbean location
Hotel size
Source: KPMG International, KPMG’s 2014 Caribbean Hotel Benchmarking Survey
Source: KPMG International, KPMG’s 2014 Caribbean Hotel Benchmarking Survey
Source: KPMG International, KPMG’s 2014 Caribbean Hotel Benchmarking Survey
100 - 200rooms 18%
Above 200 rooms25%
Below 50rooms21%
50 - 99rooms 36%
All inclusive13%
Full service77%
Select service
7%
Limited service
3%
Property type
Limited service
3%All inclusive
13%Select service
7%
Full service 77%
Spanish speaking
3%French speaking
6%
Engish speaking85%
Dutch speaking
6%
Corporate / business
9%
Leisure / independent
79%
Group12%
Primary guest segment
Our key findingsBenchmarking results
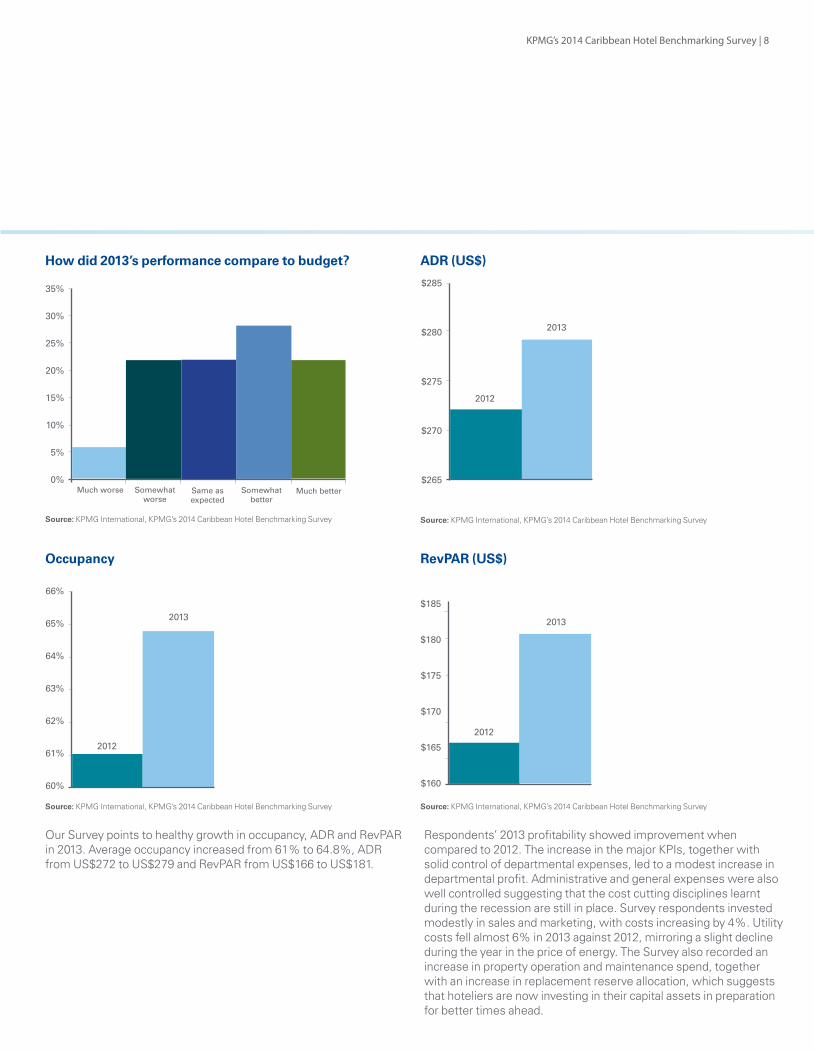
Our respondents appear to have priced improvement in market conditions fairly accurately into their budgeting process, with 72% reporting that they had met or exceeded their budget. Hoteliers appear to have learnt lessons from previous years where the industry had expected a recovery that did not materialise.
KPMG’s 2014 Caribbean Hotel Benchmarking Survey | 6
Average number of available rooms
Primary guest market
Primary guest segment
180 182 184 186 188 190 192 194 196 198 200
2012
2013
Average number of full time employees
60%
50%
40%
30%
20%
10%
10%USA Europe Canada UK Local Other
54%
5%
16%
6%9% 10%
40.0%
30.0%
20.0%
10.0%
0.0%Auction sites Travel agents Online travel
agentsOwn system Direct/ walk in
Distribution channels
Source: KPMG International, KPMG’s 2014 Caribbean Hotel Benchmarking Survey
Source: KPMG International, KPMG’s 2014 Caribbean Hotel Benchmarking Survey
Source: KPMG International, KPMG’s 2014 Caribbean Hotel Benchmarking Survey
Source: KPMG International, KPMG’s 2014 Caribbean Hotel Benchmarking Survey
Source: KPMG International, KPMG’s 2014 Caribbean Hotel Benchmarking Survey
Group12%
Corporate business
9%
Leisure / independent 79%
135 136 137 138 139 140 141 142 143 144 145
2012
2013
Number of rooms
Number of employees
7 | KPMG’s 2014 Caribbean Hotel Benchmarking SurveyKPMG’s 2014 Caribbean Hotel Benchmarking Survey | 7
KPMG’s 2014 Caribbean Hotel Benchmarking Survey | 8
Our Survey points to healthy growth in occupancy, ADR and RevPAR in 2013. Average occupancy increased from 61% to 64.8%, ADR from US$272 to US$279 and RevPAR from US$166 to US$181.
Respondents’ 2013 profitability showed improvement when compared to 2012. The increase in the major KPIs, together with solid control of departmental expenses, led to a modest increase in departmental profit. Administrative and general expenses were also well controlled suggesting that the cost cutting disciplines learnt during the recession are still in place. Survey respondents invested modestly in sales and marketing, with costs increasing by 4%. Utility costs fell almost 6% in 2013 against 2012, mirroring a slight decline during the year in the price of energy. The Survey also recorded an increase in property operation and maintenance spend, together with an increase in replacement reserve allocation, which suggests that hoteliers are now investing in their capital assets in preparation for better times ahead.
Occupancy
ADR (US$)
RevPAR (US$)
35%
30%
25%
20%
15%
10%
5%
0%Much worse Somewhat
worseSame as expected
Somewhat better
Much better
66%
65%
64%
63%
62%
61%
60%
2012
2013
Source: KPMG International, KPMG’s 2014 Caribbean Hotel Benchmarking Survey
How did 2013’s performance compare to budget?
$285
$280
$275
$270
$265
2012
2013
Source: KPMG International, KPMG’s 2014 Caribbean Hotel Benchmarking Survey
$185
$180
$175
$170
$165
$160
2012
2013
Source: KPMG International, KPMG’s 2014 Caribbean Hotel Benchmarking Survey Source: KPMG International, KPMG’s 2014 Caribbean Hotel Benchmarking Survey

9 | KPMG’s 2014 Caribbean Hotel Benchmarking Survey
KPMG’s 2014 Caribbean Hotel Benchmarking Survey | 10
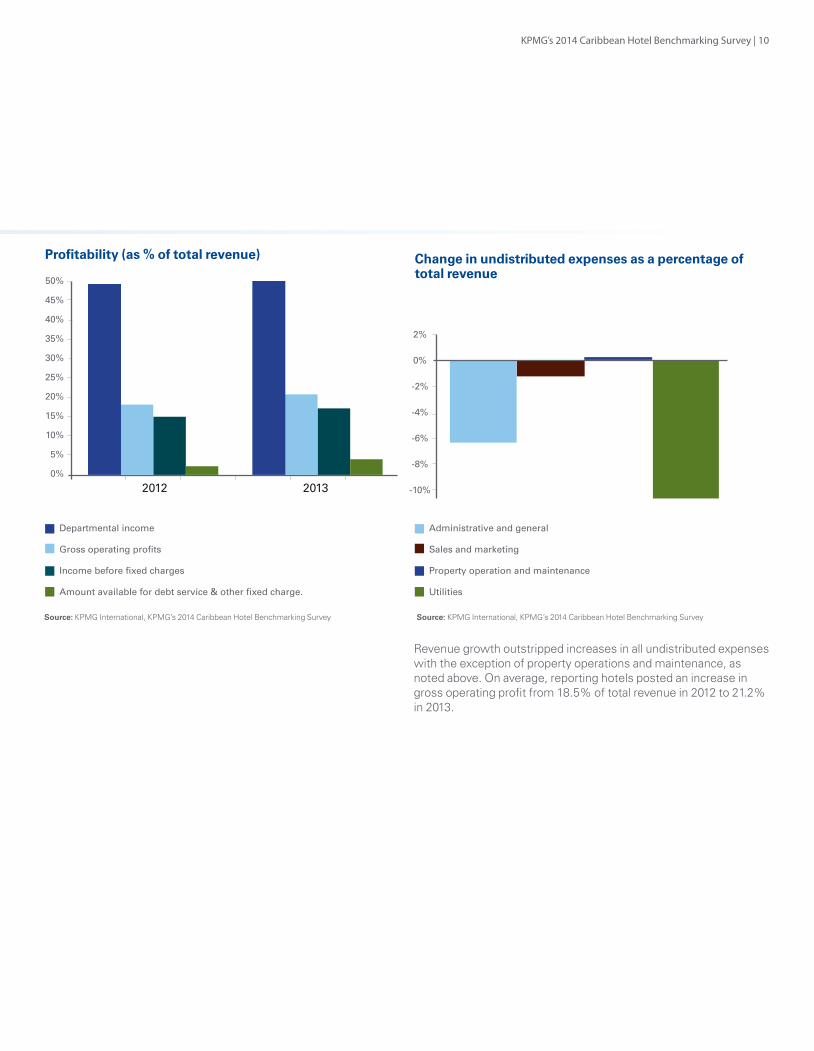
Revenue growth outstripped increases in all undistributed expenses with the exception of property operations and maintenance, as noted above. On average, reporting hotels posted an increase in gross operating profit from 18.5% of total revenue in 2012 to 21.2% in 2013.
Profitability (as % of total revenue) Change in undistributed expenses as a percentage of total revenue
50%
45%
40%
35%
30%
25%
20%
15%
10%
5%
0%
2012 2013
Departmental income
Gross operating profits
Income before fixed charges
Amount available for debt service & other fixed charge.
Administrative and general
Sales and marketing
Property operation and maintenance
Utilities
Source: KPMG International, KPMG’s 2014 Caribbean Hotel Benchmarking SurveySource: KPMG International, KPMG’s 2014 Caribbean Hotel Benchmarking Survey
2%
0%
-2%
-4%
-6%
-8%
-10%
11 | KPMG’s 2014 Caribbean Hotel Benchmarking Survey
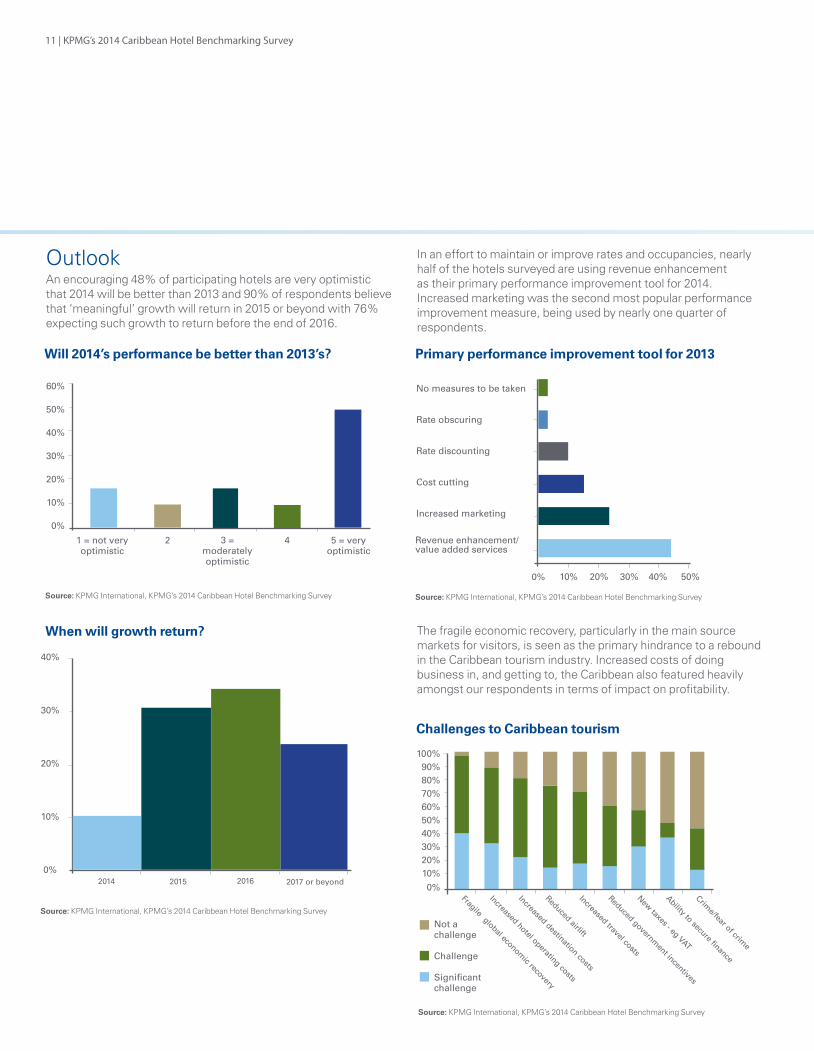
OutlookAn encouraging 48% of participating hotels are very optimistic that 2014 will be better than 2013 and 90% of respondents believe that ‘meaningful’ growth will return in 2015 or beyond with 76% expecting such growth to return before the end of 2016.
In an effort to maintain or improve rates and occupancies, nearly half of the hotels surveyed are using revenue enhancement as their primary performance improvement tool for 2014. Increased marketing was the second most popular performance improvement measure, being used by nearly one quarter of respondents.
The fragile economic recovery, particularly in the main source markets for visitors, is seen as the primary hindrance to a rebound in the Caribbean tourism industry. Increased costs of doing business in, and getting to, the Caribbean also featured heavily amongst our respondents in terms of impact on profitability.
Will 2014’s performance be better than 2013’s?
When will growth return?
Primary performance improvement tool for 2013
Challenges to Caribbean tourism
Source: KPMG International, KPMG’s 2014 Caribbean Hotel Benchmarking Survey
Source: KPMG International, KPMG’s 2014 Caribbean Hotel Benchmarking Survey
Source: KPMG International, KPMG’s 2014 Caribbean Hotel Benchmarking Survey
Source: KPMG International, KPMG’s 2014 Caribbean Hotel Benchmarking Survey
60%
50%
40%
30%
20%
10%
0%
1 = not very optimistic
3 = moderately optimistic
2 5 = veryoptimistic
4
40%
30%
20%
10%
0%2014 2015 2016 2017 or beyond
No measures to be taken
Rate obscuring
Rate discounting
Cost cutting
Increased marketing
0% 10% 20% 30% 40% 50%
Revenue enhancement/value added services
Fragile global economic recovery
100%90%80%70%60%50%40%30%20% 10%0%
Increased hotel operating costs
Increased destination costs
Reduced airlift
Increased travel costs
Reduced government incentives
Ability to secure finance
New taxes - eg VAT
Crime/fear of crim
e
Not a challenge
Challenge
Significant challenge

KPMG’s 2014 Caribbean Hotel Benchmarking Survey | 12
Respondents have identified energy efficiency as a pressing concern for the hospitality industry in the region, given the energy prices and constraints that most hoteliers operate under in the Caribbean region. 48% of respondents indicated that they were considering plans which included energy efficiency, with another 16% investing but with no energy efficient component.
Source: KPMG International, KPMG’s 2013 Caribbean Hotel Benchmarking Survey
Source: KPMG International, KPMG’s 2013 Caribbean Hotel Benchmarking Survey
The ability to raise financing for new projects and operations remains difficult with twice as many respondents finding it “very difficult” to raise funding compared to those who found it “very easy” to do so. More KPMG commentary on hospitality financing can be found in our 2014 Caribbean Hospitality Financing Survey.
Alternatively, please contact one of the KPMG offiback of this report.
The ability to raise financing for new projects and operations remains difficult with twice as many respondents finding it “very difficult” to raise funding compared to those who found it “very easy” to do so. More KPMG commentary on hospitality financing can be found in our 2014 Caribbean Hospitality Financing Survey at:
http://www.kpmg.com/BM/en/IssuesAndInsights/ArticlesPublications/Pages/2014CaribbeanHospitalityFinancingSurvey.aspx
Alternatively, please contact one of the KPMG offices listed at the back of this report.
Yes -investment
but no energy
efficiency investment
16%
Yes -including energy
efficiency investment
48%
No23%
Unsure13%
Do you have any expansion plans?
1 = very difficult
27%
213%3 =
moderately easy47%
40%
5 = very easy13%
Funding of expansion plans
Do you have any expansion plans?
Funding of expansion plans
Source: KPMG International, KPMG’s 2014 Caribbean Hotel Benchmarking Survey
Source: KPMG International, KPMG’s 2014 Caribbean Hotel Benchmarking Survey
Somewhat difficult 13%Neither easy nor
difficult47%
Unsure13%
Very easy 13%
Yes - investment but no energy efficiency
investment 16%
Yes - including energy efficiency investment 48%
No 23%
Very difficult 27%
13 | KPMG’s 2014 Caribbean Hotel Benchmarking Survey
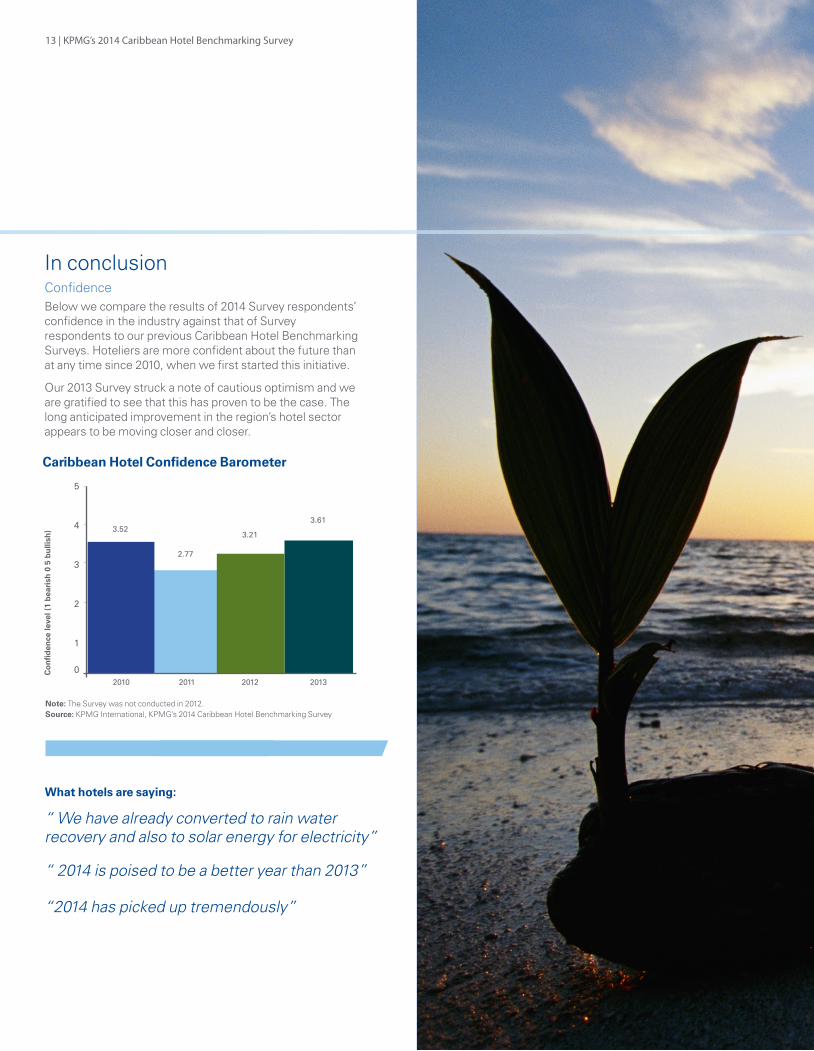
In conclusionConfidence Below we compare the results of 2014 Survey respondents’ confidence in the industry against that of Survey respondents to our previous Caribbean Hotel Benchmarking Surveys. Hoteliers are more confident about the future than at any time since 2010, when we first started this initiative.
Our 2013 Survey struck a note of cautious optimism and we are gratified to see that this has proven to be the case. The long anticipated improvement in the region’s hotel sector appears to be moving closer and closer.
What hotels are saying:
Caribbean Hotel Confidence Barometer
5
4
3
2
1
0
3.52
2.77
3.21
3.61
Co
nfi
den
ce le
vel (
1 b
eari
sh 0
5 b
ulli
sh)
Note: The Survey was not conducted in 2012. Source: KPMG International, KPMG’s 2014 Caribbean Hotel Benchmarking Survey
2010 2011 2012 2013
“ We have already converted to rain water recovery and also to solar energy for electricity”
“ 2014 is poised to be a better year than 2013”
“2014 has picked up tremendously”

KPMG’s 2014 Caribbean Hotel Benchmarking Survey | 14
At the conclusion of our 2013 Survey, we stated
that, while there were certainly some positive
and encouraging signs of a return to growth, “the
jury was still out”. This 2014 Survey appears to
demonstrate that the hotel industry is starting to
emerge from the downturn with some vigor and
has its eyes set firmly on 2015 and 2016 as the years
where the industry returns to robust and meaningful
growth. Given the critical importance of tourism to
our region, we certainly hope this is the case. Our
next Caribbean Hotel Benchmarking Survey will
continue to monitor this theme of opportunity and
growth. Stay tuned!
TRAVEL, LEISURE & TOURISM
KPMG’s 2014 Caribbean Hotel Benchmarking
Survey
kpmg.com
The information contained herein is of general nature and is not intended to address the circumstances of any particular individual or entity. Although we endeavour to provide accurate and timely information, there can be no guarantee that such information is accurate as of the date it is received or that it will continue to be accurate in the future. No one should act on such information without appropriate professional advice after a thorough examination of the particular situation.
Corporate Finance services, including Financing, Debt Advisory and Valuation Services, are not performed by all KPMG member firms and are not offered by member firms in certain jurisdictions due to legal or regulatory constraints. Forensic advisory and expert witness services may be subject to legal and regulatory restrictions.
© 2014 KPMG International Cooperative (“KPMG International”), a Swiss entity. Member firms of the KPMG network of independent firms are affiliated with KPMG International. KPMG International provides no client services. No member firm has any authority to obligate or bind KPMG International or any other member firm vis-à-vis third parties, nor does KPMG International have any such authority to obligate or bind any member firm. All rights reserved.
The KPMG name, logo and “cutting through complexity” are registered trademarks or trademarks of KPMG International.
KPMG’s Caribbean Travel, Leisure and Tourism ContactsPlease contact the KPMG firm represented in your country if you have any questions. KPMG firms are represented in more than 20 countries in the Caribbean region, and have a specific knowledge and understanding of the business, cultural, economic and political facets of conducting business in each country.
Anguilla, AntiguaCleveland Seaforth
T: 1 268 462 8868E: [email protected]
BahamasCharlene Lewis-Small
T: 1 242 393 2007E: [email protected]
BarbadosLisa Taylor
T: 1 246 434 3900E: [email protected]
BermudaStephen Woodward
T: 1 441 294 2675E: [email protected]
British Virgin Islands Russell Crumpler
T: 1 284 494 1134 E: [email protected]
Cayman Islands Kris Beighton
T: 1 345 914 4392E: [email protected]
Dominican RepublicFrancisco Gonzalez
T: 1 809 566 9161E: [email protected]
Dutch Caribbean, Cuba & Surinam Henk de Zeeuw
T: 599 9 7325156E: [email protected]
JamaicaPatricia Dailey-Smith
T: 1 876 922 6640 E: [email protected]
Mexico (Cancun, Cozumel, Maya Riviera)Luis Carrero
T: 525 5 5246 8914E: [email protected]
Puerto Rico, U.S.Virgin IslandsRosana Lopez
T: 1 787 622 6185E: [email protected]
St. LuciaFrank Myers
T: 1 758 453 1471E: [email protected]
St. Vincent & the Grenadines, GrenadaBrian Glasgow
T: 1 784 456 2669E: [email protected]
Trinidad & TobagoStacy-Ann Golding
T: 1 868 623 1081 E: [email protected]
Turks and CaicosGary Brough
T: 1 649 946 4613E: [email protected]


