Page 1
1
Exhibit 99.1
Contacts: Alex Abraham (media) Christopher Jakubik, CFA (investors) [email protected] [email protected]
KRAFT HEINZ REPORTS THIRD QUARTER 2021 RESULTS
Delivers results ahead of expectations
Gaining traction to address inflation, advance strategy
Raises full year outlook
PITTSBURGH & CHICAGO - October 27, 2021 - The Kraft Heinz Company (Nasdaq: KHC) (“Kraft Heinz”
or the “Company”) today reported financial results for the third quarter of 2021, which reflected gains in
Organic Net Sales on top of exceptionally strong growth in 2020. The Company also reported better-than-
expected results, enabled by improvements in its operating model and an agile approach to managing
supply and services through volatile markets.
"I am incredibly proud of our Kraft Heinz team for delivering another quarter of results that exceed our
expectations, even as we face the ongoing challenges of the pandemic and, now, escalating inflation,”
said Kraft Heinz CEO, Miguel Patricio. “We are effectively adapting to near-term challenges while
transforming our business and rejuvenating our iconic brands to better serve consumers for the long
term. We still have much to do, but our momentum is strong and our strategy to bring agility to our scale
is working, which is why we are increasing full-year expectations."
Net Sales
In millions
Net Sales Organic Net Sales(1) Growth
September 25,
2021 September 26,
2020 % Chg vs PY YoY Growth
Rate Price Volume/Mix
For the Three Months Ended
United States $ 4,521 $ 4,710 (4.0) % 1.3 % 1.4 pp (0.1) pp
International 1,383 1,325 4.4 % 2.2 % 2.2 pp 0.0 pp
Canada 420 406 3.4 % (1.9) % 0.2 pp (2.1) pp
Kraft Heinz $ 6,324 $ 6,441 (1.8) % 1.3 % 1.5 pp (0.2) pp
For the Nine Months Ended
United States $ 13,867 $ 14,122 (1.8) % 0.3 % 1.3 pp (1.0) pp
International 4,190 3,931 6.6 % 1.8 % 2.1 pp (0.3) pp
Canada 1,276 1,193 7.0 % (1.2) % 2.2 pp (3.4) pp
Kraft Heinz $ 19,333 $ 19,246 0.5 % 0.5 % 1.5 pp (1.0) pp
Page 2
2
Net Income/(Loss) and Diluted EPS
In millions, except per share data
For the Three Months Ended For the Nine Months Ended
September 25,
2021 September 26,
2020 % Chg vs
PY September 25,
2021 September 26,
2020 % Chg vs
PY
Gross profit $ 2,028 $ 2,344 (13.5) % $ 6,520 $ 6,654 (2.0) %
Operating income/(loss) 1,156 1,147 0.8 % 3,480 578 502.3 %
Net income/(loss) 736 598 23.2 % 1,279 (673) 289.9 %
Net income/(loss) attributable to common shareholders 733 597 23.0 % 1,269 (676) 287.6 %
Diluted EPS $ 0.59 $ 0.49 20.4 % $ 1.03 $ (0.55) 287.3 %
Adjusted EPS(1) 0.65 0.70 (7.1) % 2.15 2.09 2.9 %
Adjusted EBITDA(1) $ 1,479 $ 1,667 (11.3) % $ 4,765 $ 4,881 (2.4) %
Q3 2021 Financial Summary
• Net sales decreased 1.8 percent versus the year-ago period to $6.3 billion, including a negative 4.0
percentage point impact from the divestiture of the Company's nuts business, which closed in the
second quarter of 2021, and a favorable 0.9 percentage point impact from currency. Net sales versus
the comparable 2019 period increased 4.1 percent, including a favorable 0.8 percentage point impact
from currency and despite a negative 4.3 percentage point impact from divestitures. Organic Net
Sales(1) increased 1.3 percent versus the prior year period and 7.6 percent versus the comparable
2019 period, with growth versus 2019 negatively impacted by 1.4 percentage points from exiting the
McCafé licensing agreement. Pricing was up 1.5 percentage points versus the prior year period with
growth across each reporting segment that primarily reflected inflation-justified price increases in
foodservice and retail channels across all geographies. These gains came despite more normalized
promotional activities with retailers versus the year-ago period, especially in the United States.
Volume/mix declined 0.2 percentage points versus the year-ago period reflecting declines versus
extraordinary COVID-19-related retail demand in 2020, that were partially offset by a recovery in
foodservice channels.
• Net income/(loss) increased 23.2 percent to $736 million primarily driven by a $300 million non-cash
goodwill impairment loss in the prior year period related to the Cheese Transaction, a lower effective
tax rate versus the prior year period, and favorable changes in other expense/(income). These factors
were partially offset by lower Adjusted EBITDA, higher interest expense due to debt extinguishment
costs, as well as unrealized losses on commodity hedges in the current year period compared to
unrealized gains on commodity hedges in the prior year period. Net income/(loss) decreased 18.1
percent versus the comparable 2019 period. Adjusted EBITDA(1) decreased 11.3 percent versus the
year-ago period to $1.5 billion and increased 0.7 percent versus the comparable 2019 period, with
performance against each period including an unfavorable impact from divestitures of approximately
3 percentage points. Excluding a favorable 0.6 percentage point impact from currency, year-over-year
Adjusted EBITDA benefited from efficiency gains, higher Organic Net Sales, and lower general
corporate expenses. These increases were more than offset by unfavorable supply chain, key
commodity(2), and packaging costs.
Page 3
3
• Diluted EPS increased to $0.59, up 20.4 percent versus the prior year, driven by the net
income/(loss) factors discussed above. Adjusted EPS(1) decreased to $0.65, down 7.1 percent
versus the prior year, primarily driven by lower Adjusted EBITDA, higher equity award compensation
expense, and unfavorable changes in other expense/(income) that more than offset lower taxes on
adjusted earnings and lower interest expense versus the prior year period.
• Year-to-date net cash provided by operating activities was $2.4 billion, down 26.4 percent versus
the year-ago period, primarily driven by higher cash tax payments on divestitures in 2021 related to
the divestiture of the Company's nuts business, higher cash outflows for variable compensation in
2021 compared to 2020, higher cash outflows from increased promotional activity versus the prior
year period, and lower Adjusted EBITDA. These impacts were partially offset by lower cash outflows
for inventories and favorable changes in accounts payable compared to the prior year, largely due to
the timing of purchases and favorable payment terms. Free Cash Flow(1) in the first nine months of
2021 was $1.8 billion, down 38.8 percent versus the comparable prior year period due to lower net
cash provided by operating activities and higher capital expenditures versus the prior year period.
Outlook
Based on strong performance to date, the Company expects Organic Net Sales(3) growth in 2021 to be
flat compared to an exceptionally strong 2020 period. In addition, the Company has increased its
expectations for 2021 Adjusted EBITDA(3) from at least $6.1 billion to more than $6.2 billion. This reflects
a combination of greater-than-expected Organic Net Sales as well as the Company's ongoing efforts to
manage inflationary pressures as it continues to invest in long-term growth. This outlook includes the
impact of the sale of the Company’s nuts business completed in June, but does not include an impact
from the pending sale of its natural cheese business.
End Notes
(1) Organic Net Sales, Adjusted EBITDA, Adjusted EPS, Constant Currency Adjusted EBITDA, and Free Cash Flow are non-
GAAP financial measures. Please see discussion of non-GAAP financial measures and the reconciliations at the end of this
press release for more information.
(2) The Company's key commodities in the United States and Canada are dairy, meat, and coffee.
(3) Full year 2021 guidance for Organic Net Sales and Adjusted EBITDA is provided on a non-GAAP basis only because certain
information necessary to calculate the most comparable GAAP measure is unavailable due to the uncertainty and inherent
difficulty of predicting the occurrence and the future financial statement impact of such items impacting comparability,
including, but not limited to, the impact of currency, acquisitions and divestitures, restructuring expenses, deal costs,
unrealized losses/(gains) on commodity hedges, impairment losses, certain non-ordinary course legal and regulatory
matters, and equity award compensation expense, among other items. Therefore, as a result of the uncertainty and
variability of the nature and amount of future adjustments, which could be significant, the Company is unable to provide a
reconciliation of these measures without unreasonable effort.
Page 4
4
Earnings Discussion and Webcast Information
A pre-recorded management discussion of The Kraft Heinz Company's third quarter 2021 earnings is
available at ir.kraftheinzcompany.com. The Company will host a live question and answer session
beginning today at 9:00 a.m. Eastern Daylight Time. A webcast of the session will also be accessible at
ir.kraftheinzcompany.com.
ABOUT THE KRAFT HEINZ COMPANY
We are driving transformation at The Kraft Heinz Company (Nasdaq: KHC), inspired by our Purpose,
Let’s Make Life Delicious. Consumers are at the center of everything we do. With 2020 net sales of
approximately $26 billion, we are committed to growing our iconic and emerging food and beverage
brands on a global scale. We leverage our scale and agility to unleash the full power of Kraft Heinz
across a portfolio of six consumer-driven product platforms. As global citizens, we’re dedicated to making
a sustainable, ethical impact while helping feed the world in healthy, responsible ways. Learn more about
our journey by visiting www.kraftheinzcompany.com or following us on LinkedIn and Twitter.
Page 5
5
Forward-Looking Statements
This press release contains a number of forward-looking statements. Words such as “plan,” "believe,"
"anticipate," "reflect," "invest," "see," "make," "expect," "deliver," "drive," “improve,” “intend,” "assess,"
"remain," "evaluate," “establish,” “focus,” “build,” “turn,” “expand,” “leverage,” "grow," "will," "maintain,"
"manage," and variations of such words and similar future or conditional expressions are intended to
identify forward-looking statements. Examples of forward-looking statements include, but are not limited
to, statements regarding the Company's plans, impacts of accounting standards and guidance, growth,
legal matters, taxes, costs and cost savings, impairments, dividends, expectations, investments,
innovations, opportunities, capabilities, execution, initiatives, and pipeline. These forward-looking
statements reflect management's current expectations and are not guarantees of future performance and
are subject to a number of risks and uncertainties, many of which are difficult to predict and beyond the
Company's control.
Important factors that may affect the Company's business and operations and that may cause actual
results to differ materially from those in the forward-looking statements include, but are not limited to, the
impacts of COVID-19 and government and consumer responses; operating in a highly competitive
industry; the Company’s ability to correctly predict, identify, and interpret changes in consumer
preferences and demand, to offer new products to meet those changes, and to respond to competitive
innovation; changes in the retail landscape or the loss of key retail customers; changes in the Company's
relationships with significant customers or suppliers, or in other business relationships; the Company’s
ability to maintain, extend, and expand its reputation and brand image; the Company’s ability to leverage
its brand value to compete against private label products; the Company’s ability to drive revenue growth
in its key product categories or platforms, increase its market share, or add products that are in faster-
growing and more profitable categories; product recalls or other product liability claims; the Company’s
ability to identify, complete, or realize the benefits from strategic acquisitions, alliances, divestitures, joint
ventures, or other investments; the Company's ability to successfully execute its strategic initiatives; the
impacts of the Company's international operations; the Company's ability to protect intellectual property
rights; the Company's ownership structure; the Company’s ability to realize the anticipated benefits from
prior or future streamlining actions to reduce fixed costs, simplify or improve processes, and improve its
competitiveness; the Company's level of indebtedness, as well as our ability to comply with covenants
under our debt instruments; additional impairments of the carrying amounts of goodwill or other indefinite-
lived intangible assets; foreign exchange rate fluctuations; volatility in commodity, energy, and other input
costs; volatility in the market value of all or a portion of the commodity derivatives we use; compliance
with laws and regulations and related legal claims or regulatory enforcement actions; failure to maintain
an effective system of internal controls; a downgrade in the Company's credit rating; the impact of future
sales of the Company's common stock in the public market; the Company’s ability to continue to pay a
regular dividend and the amounts of any such dividends; unanticipated business disruptions and natural
events in the locations in which the Company or the Company's customers, suppliers, distributors, or
regulators operate; economic and political conditions in the United States and in various other nations
Page 6
6
where the Company does business; changes in the Company's management team or other key
personnel and the Company's ability to hire or retain key personnel or a highly skilled and diverse global
workforce; risks associated with information technology and systems, including service interruptions,
misappropriation of data, or breaches of security; increased pension, labor, and people-related expenses;
changes in tax laws and interpretations; volatility of capital markets and other macroeconomic factors;
and other factors. For additional information on these and other factors that could affect the Company's
forward-looking statements, see the Company's risk factors, as they may be amended from time to time,
set forth in its filings with the SEC. The Company disclaims and does not undertake any obligation to
update, revise, or withdraw any forward-looking statement in this press release, except as required by
applicable law or regulation.
Page 7
7
Non-GAAP Financial Measures
The non-GAAP financial measures provided should be viewed in addition to, and not as an alternative for,
results prepared in accordance with accounting principles generally accepted in the United States of
America (“GAAP”) that are presented in this press release.
To supplement the financial information provided, the Company has presented Organic Net Sales,
Adjusted EBITDA, Constant Currency Adjusted EBITDA, Adjusted EPS, and Free Cash Flow, which are
considered non-GAAP financial measures. The non-GAAP financial measures presented may differ from
similarly titled non-GAAP financial measures presented by other companies, and other companies may
not define these non-GAAP financial measures in the same way. These measures are not substitutes for
their comparable GAAP financial measures, such as net sales, net income/(loss), diluted earnings per
share ("EPS"), net cash provided by/(used for) operating activities, or other measures prescribed by
GAAP, and there are limitations to using non-GAAP financial measures.
Management uses these non-GAAP financial measures to assist in comparing the Company's
performance on a consistent basis for purposes of business decision making by removing the impact of
certain items that management believes do not directly reflect the Company's underlying operations.
Management believes that presenting the Company's non-GAAP financial measures (i.e., Organic Net
Sales, Adjusted EBITDA, Constant Currency Adjusted EBITDA, Adjusted EPS, and Free Cash Flow) is
useful to investors because it (i) provides investors with meaningful supplemental information regarding
financial performance by excluding certain items, (ii) permits investors to view performance using the
same tools that management uses to budget, make operating and strategic decisions, and evaluate
historical performance, and (iii) otherwise provides supplemental information that may be useful to
investors in evaluating the Company's results. The Company believes that the presentation of these non-
GAAP financial measures, when considered together with the corresponding GAAP financial measures
and the reconciliations to those measures, provides investors with additional understanding of the factors
and trends affecting the Company's business than could be obtained absent these disclosures.
Organic Net Sales is defined as net sales excluding, when they occur, the impact of currency,
acquisitions and divestitures, and a 53rd week of shipments. The Company calculates the impact of
currency on net sales by holding exchange rates constant at the previous year's exchange rate, with the
exception of highly inflationary subsidiaries, for which the Company calculates the previous year's results
using the current year's exchange rate. Organic Net Sales is a tool that can assist management and
investors in comparing the Company's performance on a consistent basis by removing the impact of
certain items that management believes do not directly reflect the Company's underlying operations.
Page 8
8
Adjusted EBITDA is defined as net income/(loss) from continuing operations before interest expense,
other expense/(income), provision for/(benefit from) income taxes, and depreciation and amortization
(excluding restructuring activities); in addition to these adjustments, the Company excludes, when they
occur, the impacts of restructuring activities, deal costs, unrealized losses/(gains) on commodity hedges,
impairment losses, certain non-ordinary course legal and regulatory matters, and equity award
compensation expense (excluding restructuring activities). The Company also presents Adjusted EBITDA
on a constant currency basis. The Company calculates the impact of currency on Adjusted EBITDA by
holding exchange rates constant at the previous year's exchange rate, with the exception of highly
inflationary subsidiaries, for which it calculates the previous year's results using the current year's
exchange rate. Adjusted EBITDA and Constant Currency Adjusted EBITDA are tools that can assist
management and investors in comparing the Company's performance on a consistent basis by removing
the impact of certain items that management believes do not directly reflect the Company's underlying
operations. In the second quarter of 2021, the Company revised the definition of Adjusted EBITDA to
adjust for the impact of certain legal and regulatory matters arising outside the ordinary course of its
business, as management believes such matters, when they occur, do not directly reflect the Company's
underlying operations.
Adjusted EPS is defined as diluted earnings per share excluding, when they occur, the impacts of
restructuring activities, deal costs, unrealized losses/(gains) on commodity hedges, impairment losses,
certain non-ordinary course legal and regulatory matters, losses/(gains) on the sale of a business, other
losses/(gains) related to acquisitions and divestitures (e.g., tax and hedging impacts), nonmonetary
currency devaluation (e.g., remeasurement gains and losses), debt prepayment and extinguishment
costs, and certain significant discrete income tax items (e.g., U.S. and non-U.S. tax reform), and including
when they occur, adjustments to reflect preferred stock dividend payments on an accrual basis. The
Company believes Adjusted EPS provides important comparability of underlying operating results,
allowing investors and management to assess operating performance on a consistent basis. In the
second quarter of 2021, the Company revised the definition of Adjusted EPS to adjust for the impact of
certain legal and regulatory matters arising outside the ordinary course of its business and certain
significant discrete income tax items beyond U.S. tax reform, as management believes such matters,
when they occur, do not directly reflect the Company's underlying operations.
Free Cash Flow is defined as net cash provided by/(used for) operating activities less capital
expenditures. The Company believes Free Cash Flow provides a measure of the Company's core
operating performance, the cash-generating capabilities of the Company's business operations, and is
one factor used in determining the amount of cash available for debt repayments, dividends, acquisitions,
share repurchases, and other corporate purposes. The use of this non-GAAP measure does not imply or
represent the residual cash flow for discretionary expenditures since the Company has certain non-
discretionary obligations such as debt service that are not deducted from the measure.
Page 9
9
See the attached schedules for supplemental financial data, which includes the financial information, the
non-GAAP financial measures and corresponding reconciliations to the comparable GAAP financial
measures for the relevant periods.
Page 10
10
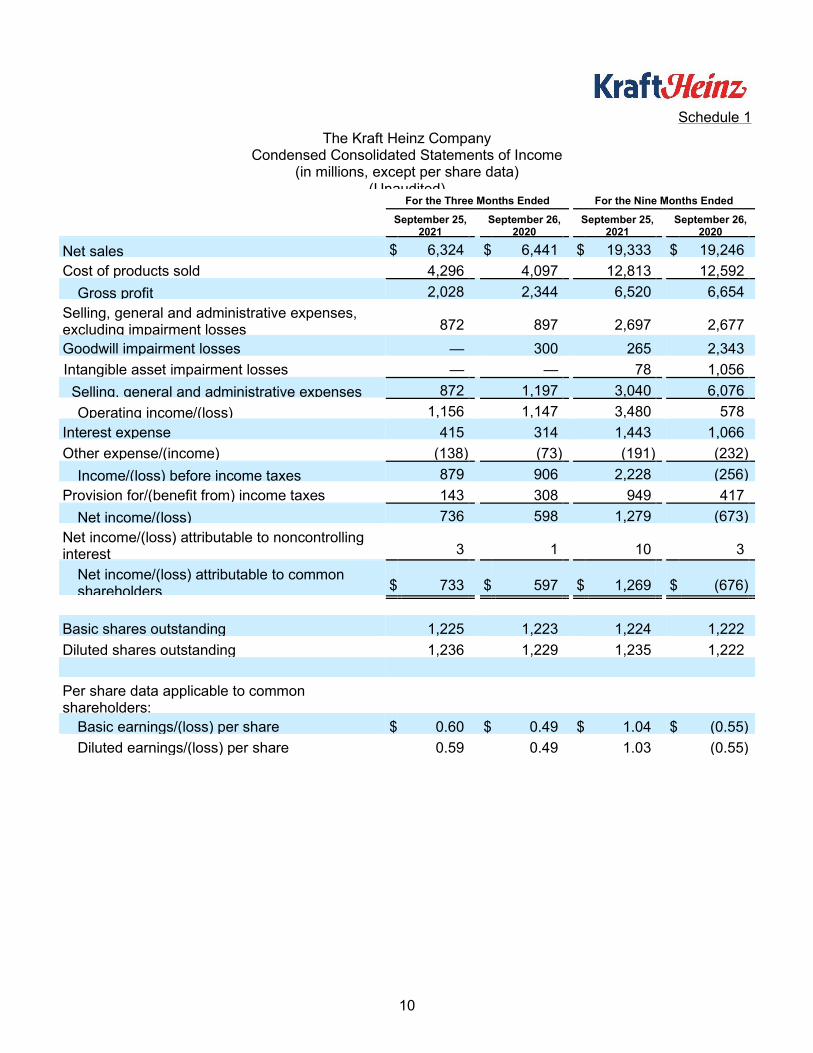
Schedule 1
The Kraft Heinz Company Condensed Consolidated Statements of Income
(in millions, except per share data) (Unaudited)
For the Three Months Ended For the Nine Months Ended
September 25,
2021 September 26,
2020 September 25,
2021 September 26,
2020
Net sales $ 6,324 $ 6,441 $ 19,333 $ 19,246
Cost of products sold 4,296 4,097 12,813 12,592
Gross profit 2,028 2,344 6,520 6,654
Selling, general and administrative expenses, excluding impairment losses 872 897 2,697 2,677
Goodwill impairment losses — 300 265 2,343
Intangible asset impairment losses — — 78 1,056
Selling, general and administrative expenses 872 1,197 3,040 6,076
Operating income/(loss) 1,156 1,147 3,480 578
Interest expense 415 314 1,443 1,066
Other expense/(income) (138) (73) (191) (232)
Income/(loss) before income taxes 879 906 2,228 (256)
Provision for/(benefit from) income taxes 143 308 949 417
Net income/(loss) 736 598 1,279 (673)
Net income/(loss) attributable to noncontrolling interest 3 1 10 3
Net income/(loss) attributable to common shareholders $ 733 $ 597 $ 1,269 $ (676)
Basic shares outstanding 1,225 1,223 1,224 1,222
Diluted shares outstanding 1,236 1,229 1,235 1,222
Per share data applicable to common shareholders:
Basic earnings/(loss) per share $ 0.60 $ 0.49 $ 1.04 $ (0.55)
Diluted earnings/(loss) per share 0.59 0.49 1.03 (0.55)
Page 11
11
Schedule 2
The Kraft Heinz Company Reconciliation of Net Sales to Organic Net Sales
For the Three Months Ended (dollars in millions)
(Unaudited)
Net Sales Currency
Acquisitions and
Divestitures Organic Net
Sales Price Volume/Mix
September 25, 2021
United States $ 4,521 $ — $ — $ 4,521
International 1,383 39 — 1,344
Canada 420 25 — 395
Kraft Heinz $ 6,324 $ 64 $ — $ 6,260
September 26, 2020
United States $ 4,710 $ — $ 246 $ 4,464
International 1,325 6 5 1,314
Canada 406 — 2 404
Kraft Heinz $ 6,441 $ 6 $ 253 $ 6,182
Year-over-year growth rates
United States (4.0) % 0.0 pp (5.3) pp 1.3 % 1.4 pp (0.1) pp
International 4.4 % 2.6 pp (0.4) pp 2.2 % 2.2 pp 0.0 pp
Canada 3.4 % 5.7 pp (0.4) pp (1.9) % 0.2 pp (2.1) pp
Kraft Heinz (1.8) % 0.9 pp (4.0) pp 1.3 % 1.5 pp (0.2) pp
Page 12
12
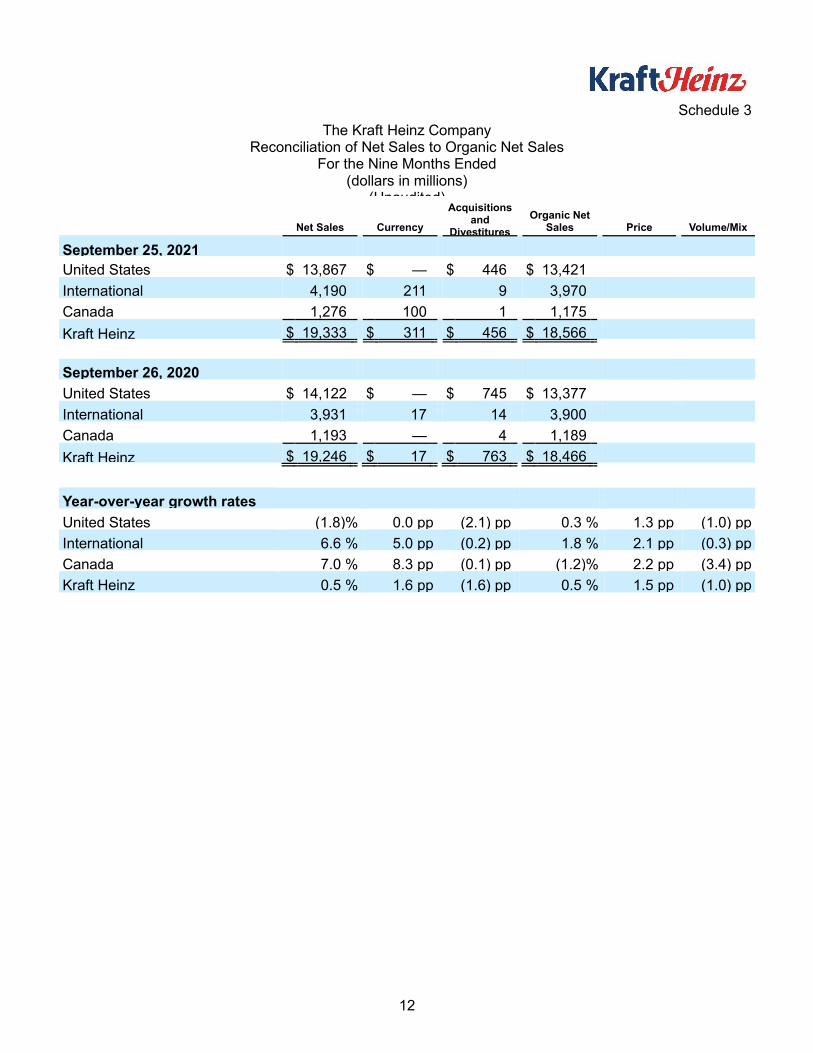
Schedule 3
The Kraft Heinz Company Reconciliation of Net Sales to Organic Net Sales
For the Nine Months Ended (dollars in millions)
(Unaudited)
Net Sales Currency
Acquisitions and
Divestitures Organic Net
Sales Price Volume/Mix
September 25, 2021
United States $ 13,867 $ — $ 446 $ 13,421
International 4,190 211 9 3,970
Canada 1,276 100 1 1,175
Kraft Heinz $ 19,333 $ 311 $ 456 $ 18,566
September 26, 2020
United States $ 14,122 $ — $ 745 $ 13,377
International 3,931 17 14 3,900
Canada 1,193 — 4 1,189
Kraft Heinz $ 19,246 $ 17 $ 763 $ 18,466
Year-over-year growth rates
United States (1.8) % 0.0 pp (2.1) pp 0.3 % 1.3 pp (1.0) pp
International 6.6 % 5.0 pp (0.2) pp 1.8 % 2.1 pp (0.3) pp
Canada 7.0 % 8.3 pp (0.1) pp (1.2) % 2.2 pp (3.4) pp
Kraft Heinz 0.5 % 1.6 pp (1.6) pp 0.5 % 1.5 pp (1.0) pp
Page 13
13
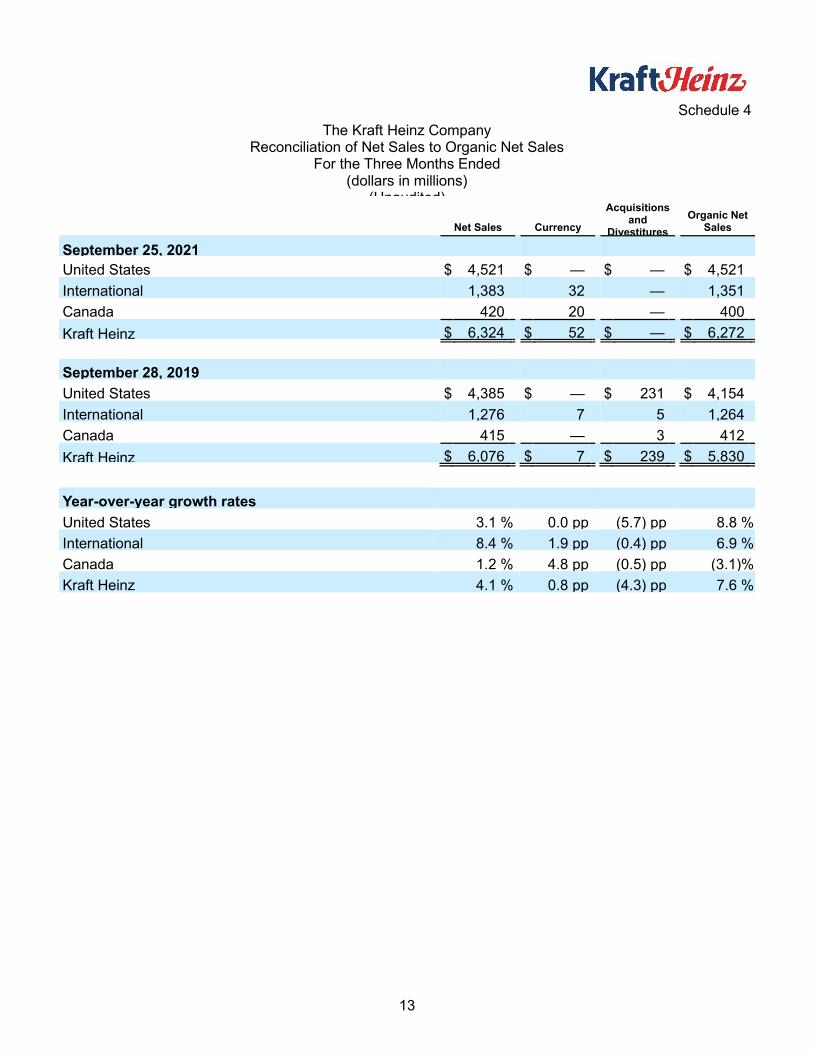
Schedule 4
The Kraft Heinz Company Reconciliation of Net Sales to Organic Net Sales
For the Three Months Ended (dollars in millions)
(Unaudited)
Net Sales Currency
Acquisitions and
Divestitures Organic Net
Sales
September 25, 2021
United States $ 4,521 $ — $ — $ 4,521
International 1,383 32 — 1,351
Canada 420 20 — 400
Kraft Heinz $ 6,324 $ 52 $ — $ 6,272
September 28, 2019
United States $ 4,385 $ — $ 231 $ 4,154
International 1,276 7 5 1,264
Canada 415 — 3 412
Kraft Heinz $ 6,076 $ 7 $ 239 $ 5,830
Year-over-year growth rates
United States 3.1 % 0.0 pp (5.7) pp 8.8 %
International 8.4 % 1.9 pp (0.4) pp 6.9 %
Canada 1.2 % 4.8 pp (0.5) pp (3.1) %
Kraft Heinz 4.1 % 0.8 pp (4.3) pp 7.6 %
Page 14
14
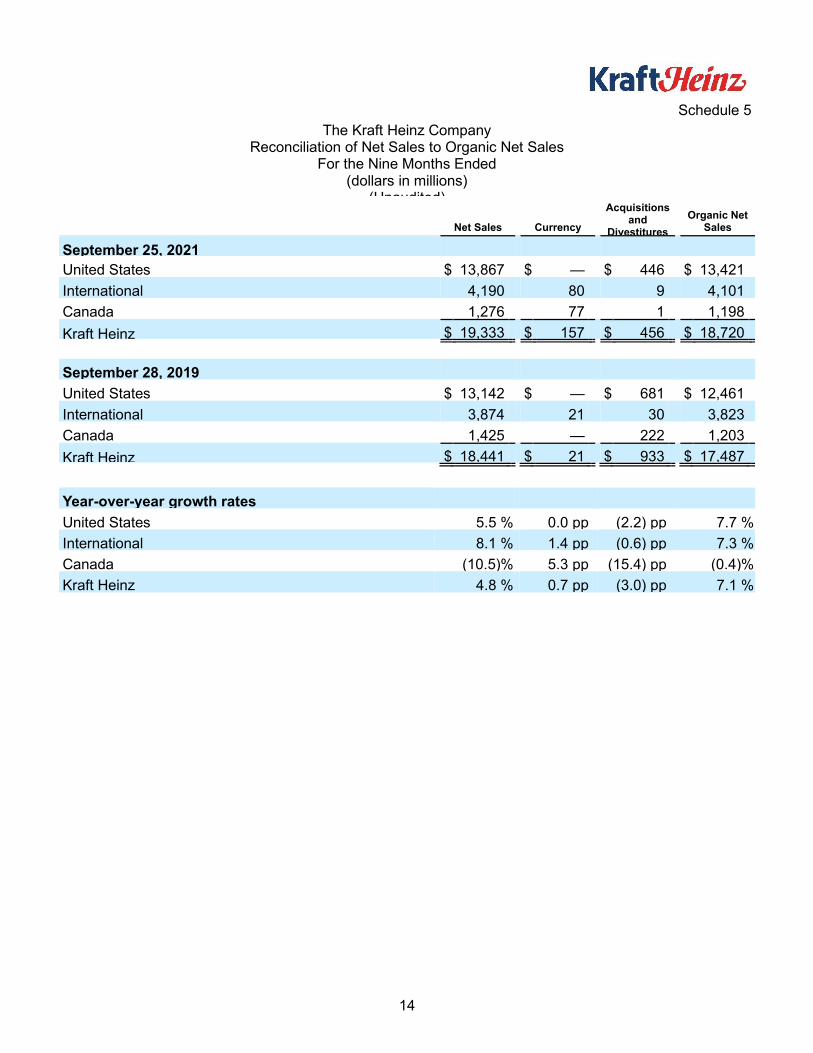
Schedule 5
The Kraft Heinz Company Reconciliation of Net Sales to Organic Net Sales
For the Nine Months Ended (dollars in millions)
(Unaudited)
Net Sales Currency
Acquisitions and
Divestitures Organic Net
Sales
September 25, 2021
United States $ 13,867 $ — $ 446 $ 13,421
International 4,190 80 9 4,101
Canada 1,276 77 1 1,198
Kraft Heinz $ 19,333 $ 157 $ 456 $ 18,720
September 28, 2019
United States $ 13,142 $ — $ 681 $ 12,461
International 3,874 21 30 3,823
Canada 1,425 — 222 1,203
Kraft Heinz $ 18,441 $ 21 $ 933 $ 17,487
Year-over-year growth rates
United States 5.5 % 0.0 pp (2.2) pp 7.7 %
International 8.1 % 1.4 pp (0.6) pp 7.3 %
Canada (10.5) % 5.3 pp (15.4) pp (0.4) %
Kraft Heinz 4.8 % 0.7 pp (3.0) pp 7.1 %
Page 15
15
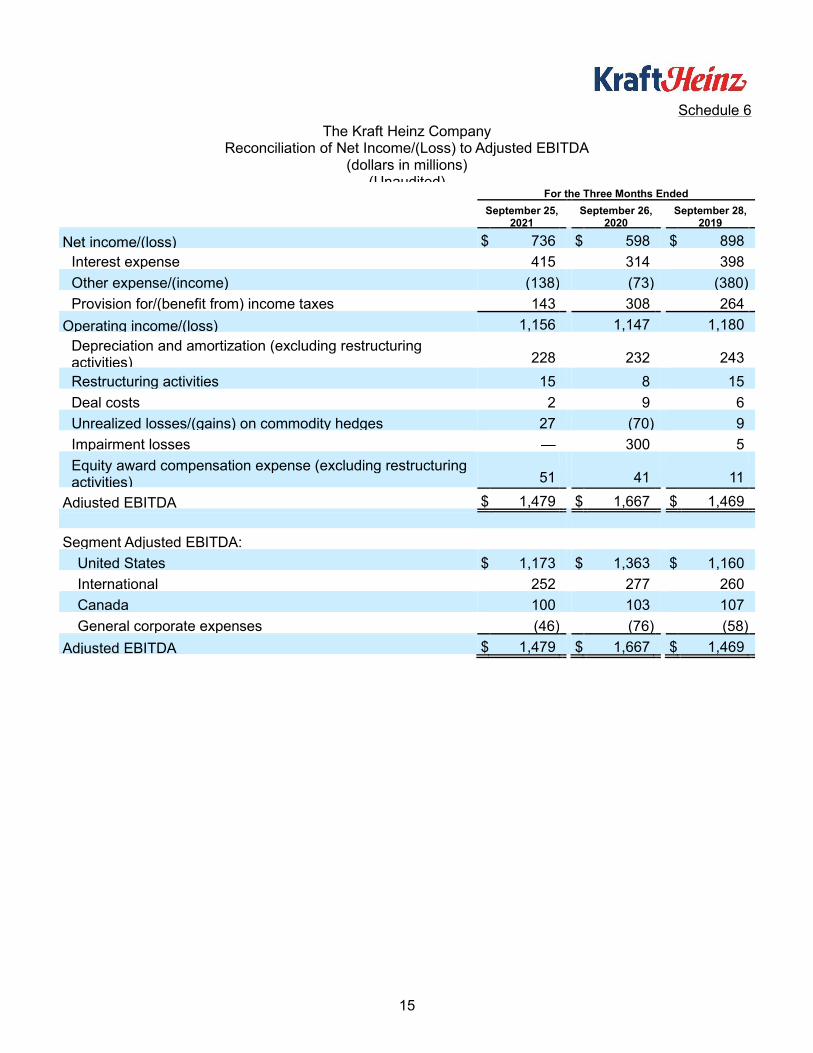
Schedule 6
The Kraft Heinz Company Reconciliation of Net Income/(Loss) to Adjusted EBITDA
(dollars in millions) (Unaudited)
For the Three Months Ended
September 25,
2021 September 26,
2020 September 28,
2019
Net income/(loss) $ 736 $ 598 $ 898
Interest expense 415 314 398
Other expense/(income) (138) (73) (380)
Provision for/(benefit from) income taxes 143 308 264
Operating income/(loss) 1,156 1,147 1,180
Depreciation and amortization (excluding restructuring activities) 228 232 243
Restructuring activities 15 8 15
Deal costs 2 9 6
Unrealized losses/(gains) on commodity hedges 27 (70) 9
Impairment losses — 300 5
Equity award compensation expense (excluding restructuring activities) 51 41 11
Adjusted EBITDA $ 1,479 $ 1,667 $ 1,469
Segment Adjusted EBITDA:
United States $ 1,173 $ 1,363 $ 1,160
International 252 277 260
Canada 100 103 107
General corporate expenses (46) (76) (58)
Adjusted EBITDA $ 1,479 $ 1,667 $ 1,469
Page 16
16
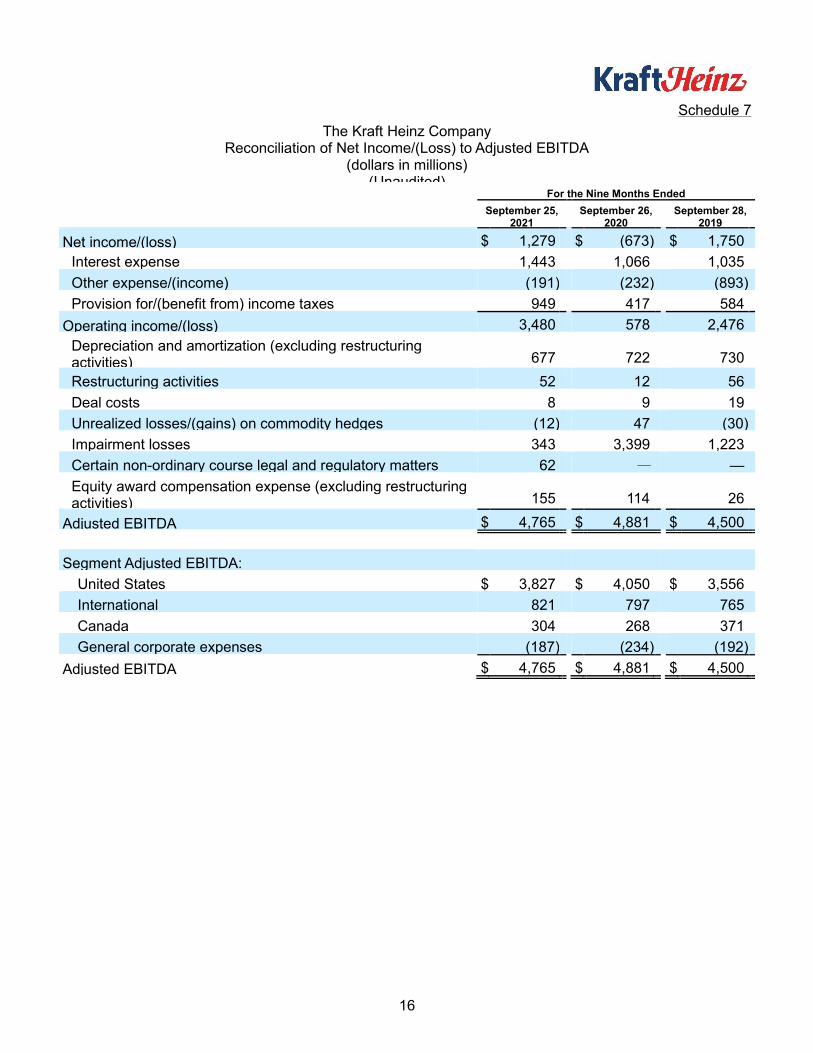
Schedule 7
The Kraft Heinz Company Reconciliation of Net Income/(Loss) to Adjusted EBITDA
(dollars in millions) (Unaudited)
For the Nine Months Ended
September 25,
2021 September 26,
2020 September 28,
2019
Net income/(loss) $ 1,279 $ (673) $ 1,750
Interest expense 1,443 1,066 1,035
Other expense/(income) (191) (232) (893)
Provision for/(benefit from) income taxes 949 417 584
Operating income/(loss) 3,480 578 2,476
Depreciation and amortization (excluding restructuring activities) 677 722 730
Restructuring activities 52 12 56
Deal costs 8 9 19
Unrealized losses/(gains) on commodity hedges (12) 47 (30)
Impairment losses 343 3,399 1,223
Certain non-ordinary course legal and regulatory matters 62 — —
Equity award compensation expense (excluding restructuring activities) 155 114 26
Adjusted EBITDA $ 4,765 $ 4,881 $ 4,500
Segment Adjusted EBITDA:
United States $ 3,827 $ 4,050 $ 3,556
International 821 797 765
Canada 304 268 371
General corporate expenses (187) (234) (192)
Adjusted EBITDA $ 4,765 $ 4,881 $ 4,500
Page 17
17
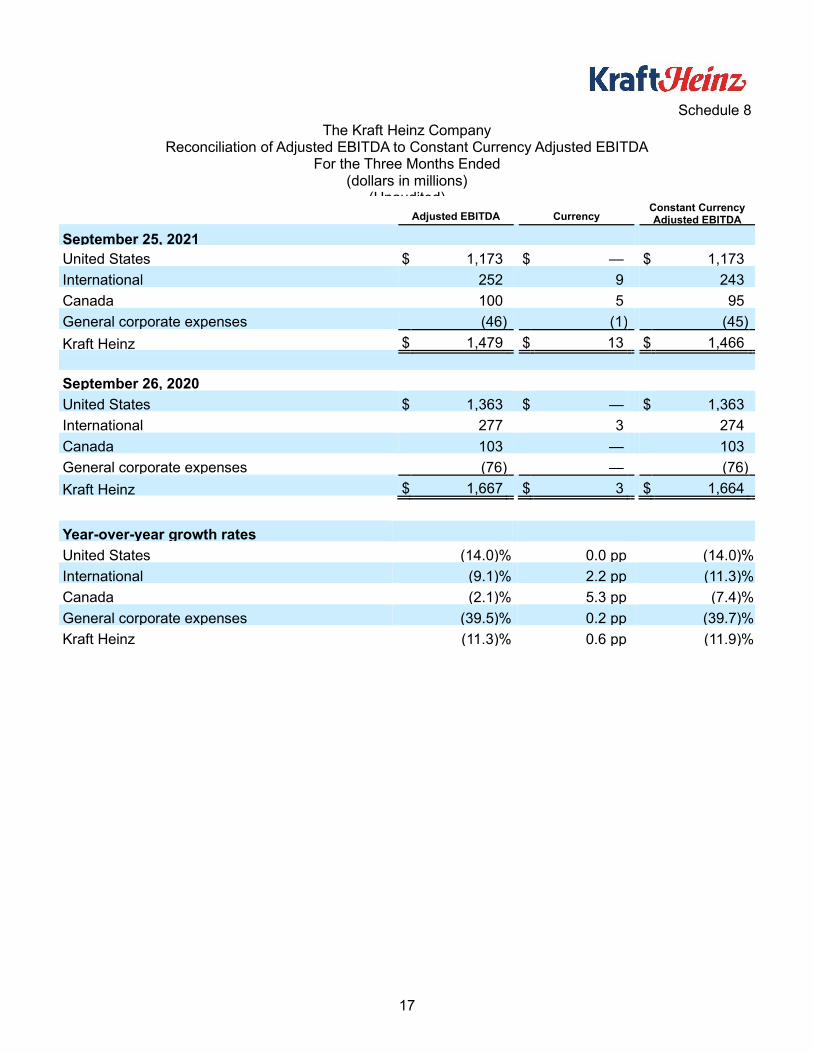
Schedule 8
The Kraft Heinz Company Reconciliation of Adjusted EBITDA to Constant Currency Adjusted EBITDA
For the Three Months Ended (dollars in millions)
(Unaudited)
Adjusted EBITDA Currency Constant Currency Adjusted EBITDA
September 25, 2021
United States $ 1,173 $ — $ 1,173
International 252 9 243
Canada 100 5 95
General corporate expenses (46) (1) (45)
Kraft Heinz $ 1,479 $ 13 $ 1,466
September 26, 2020
United States $ 1,363 $ — $ 1,363
International 277 3 274
Canada 103 — 103
General corporate expenses (76) — (76)
Kraft Heinz $ 1,667 $ 3 $ 1,664
Year-over-year growth rates
United States (14.0) % 0.0 pp (14.0) %
International (9.1) % 2.2 pp (11.3) %
Canada (2.1) % 5.3 pp (7.4) %
General corporate expenses (39.5) % 0.2 pp (39.7) %
Kraft Heinz (11.3) % 0.6 pp (11.9) %
Page 18
18
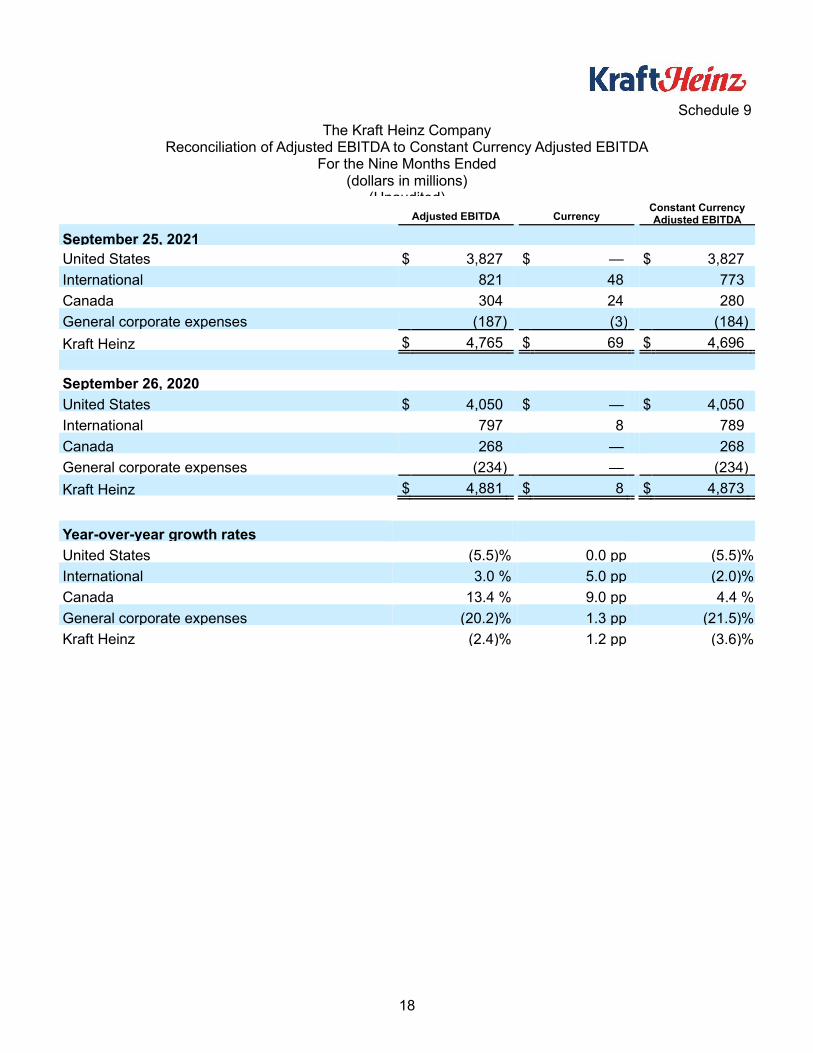
Schedule 9
The Kraft Heinz Company Reconciliation of Adjusted EBITDA to Constant Currency Adjusted EBITDA
For the Nine Months Ended (dollars in millions)
(Unaudited)
Adjusted EBITDA Currency Constant Currency Adjusted EBITDA
September 25, 2021
United States $ 3,827 $ — $ 3,827
International 821 48 773
Canada 304 24 280
General corporate expenses (187) (3) (184)
Kraft Heinz $ 4,765 $ 69 $ 4,696
September 26, 2020
United States $ 4,050 $ — $ 4,050
International 797 8 789
Canada 268 — 268
General corporate expenses (234) — (234)
Kraft Heinz $ 4,881 $ 8 $ 4,873
Year-over-year growth rates
United States (5.5) % 0.0 pp (5.5) %
International 3.0 % 5.0 pp (2.0) %
Canada 13.4 % 9.0 pp 4.4 %
General corporate expenses (20.2) % 1.3 pp (21.5) %
Kraft Heinz (2.4) % 1.2 pp (3.6) %
Page 19
19
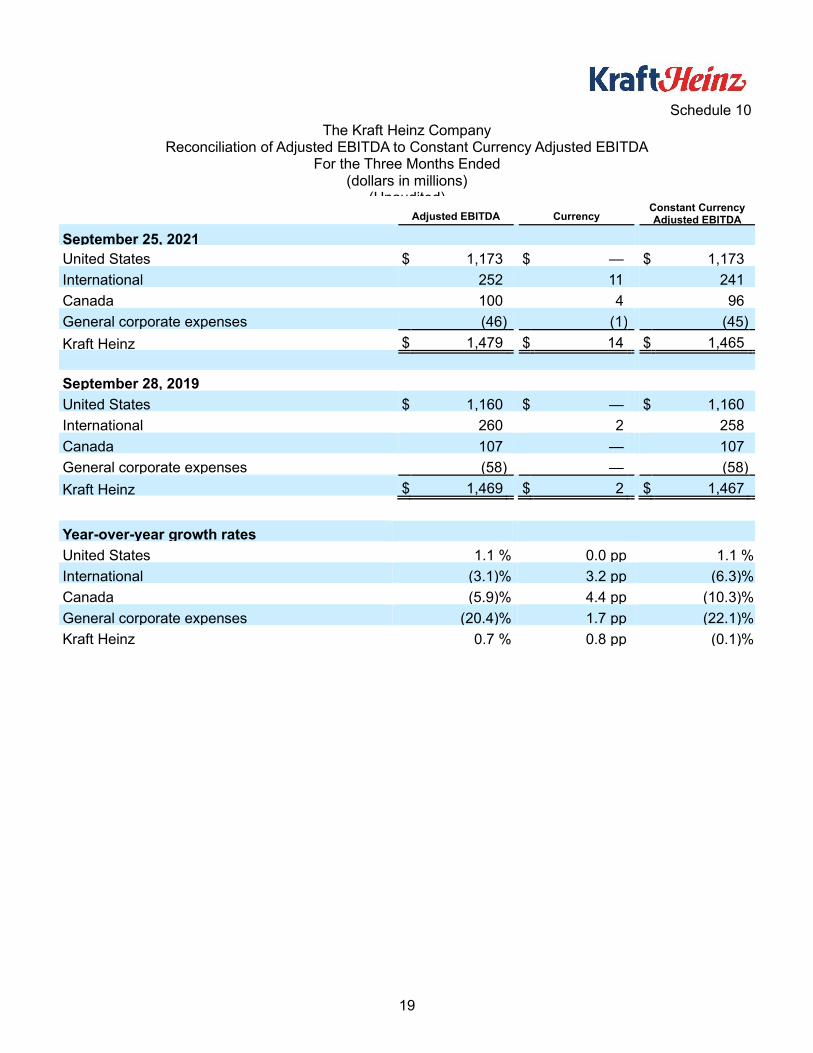
Schedule 10
The Kraft Heinz Company Reconciliation of Adjusted EBITDA to Constant Currency Adjusted EBITDA
For the Three Months Ended (dollars in millions)
(Unaudited)
Adjusted EBITDA Currency Constant Currency Adjusted EBITDA
September 25, 2021
United States $ 1,173 $ — $ 1,173
International 252 11 241
Canada 100 4 96
General corporate expenses (46) (1) (45)
Kraft Heinz $ 1,479 $ 14 $ 1,465
September 28, 2019
United States $ 1,160 $ — $ 1,160
International 260 2 258
Canada 107 — 107
General corporate expenses (58) — (58)
Kraft Heinz $ 1,469 $ 2 $ 1,467
Year-over-year growth rates
United States 1.1 % 0.0 pp 1.1 %
International (3.1) % 3.2 pp (6.3) %
Canada (5.9) % 4.4 pp (10.3) %
General corporate expenses (20.4) % 1.7 pp (22.1) %
Kraft Heinz 0.7 % 0.8 pp (0.1) %
Page 20
20
Schedule 11
The Kraft Heinz Company Reconciliation of Adjusted EBITDA to Constant Currency Adjusted EBITDA
For the Nine Months Ended (dollars in millions)
(Unaudited)
Adjusted EBITDA Currency Constant Currency Adjusted EBITDA
September 25, 2021
United States $ 3,827 $ — $ 3,827
International 821 33 788
Canada 304 18 286
General corporate expenses (187) (2) (185)
Kraft Heinz $ 4,765 $ 49 $ 4,716
September 28, 2019
United States $ 3,556 $ — $ 3,556
International 765 9 756
Canada 371 — 371
General corporate expenses (192) — (192)
Kraft Heinz $ 4,500 $ 9 $ 4,491
Year-over-year growth rates
United States 7.6 % 0.0 pp 7.6 %
International 7.2 % 3.0 pp 4.2 %
Canada (18.0) % 5.0 pp (23.0) %
General corporate expenses (2.7) % 1.3 pp (4.0) %
Kraft Heinz 5.9 % 0.9 pp 5.0 %
Page 21
21
Schedule 12
The Kraft Heinz Company Reconciliation of Diluted EPS to Adjusted EPS
(Unaudited) For the Three Months Ended For the Nine Months Ended
September 25,
2021 September 26,
2020 September 25,
2021 September 26,
2020
Diluted EPS $ 0.59 $ 0.49 $ 1.03 $ (0.55)
Restructuring activities(a) 0.01 0.01 0.03 0.01
Unrealized losses/(gains) on commodity hedges(b) 0.02 (0.04) (0.01) 0.03
Impairment losses(c) — 0.24 0.26 2.60
Certain non-ordinary course legal and regulatory matters(d) — — 0.05 —
Losses/(gains) on sale of business(e) (0.06) — 0.23 —
Debt prepayment and extinguishment costs(f) 0.09 — 0.37 0.07
Certain significant discrete income tax items(g) — — 0.19 (0.07)
Adjusted EPS $ 0.65 $ 0.70 $ 2.15 $ 2.09
(a) Gross expenses included in restructuring activities were $15 million ($12 million after-tax) for the three months and $52 million
($40 million after-tax) for the nine months ended September 25, 2021 and $9 million ($7 million after tax) for the three months and $13
million ($10 million after-tax) for the nine months ended September 26, 2020 and were recorded in the following income statement line
items:
• Cost of products sold included expenses of $4 million for the nine months ended September 25, 2021 and income of $3 million for
the three months and $4 million for the nine months ended September 26, 2020; and
• SG&A included expenses of $15 million for the three months and $48 million for the nine months ended September 25, 2021 and
$11 million for the three months and $16 million for the nine months ended September 26, 2020.
• Other expense/(income) included expenses of $1 million for the three and nine months ended September 26, 2020.
(b) Gross expenses/(income) included in unrealized losses/(gains) on commodity hedges were expenses of $27 million ($20 million after-
tax) for the three months and income of $12 million ($9 million after-tax) for the nine months ended September 25, 2021 and income
of $70 million ($54 million after-tax) for the three months and expenses of $47 million ($35 million after-tax) for the nine months ended
September 26, 2020 and were recorded in cost of products sold.
(c) Gross impairment losses, which were recorded in SG&A, included the following:
Page 22
22
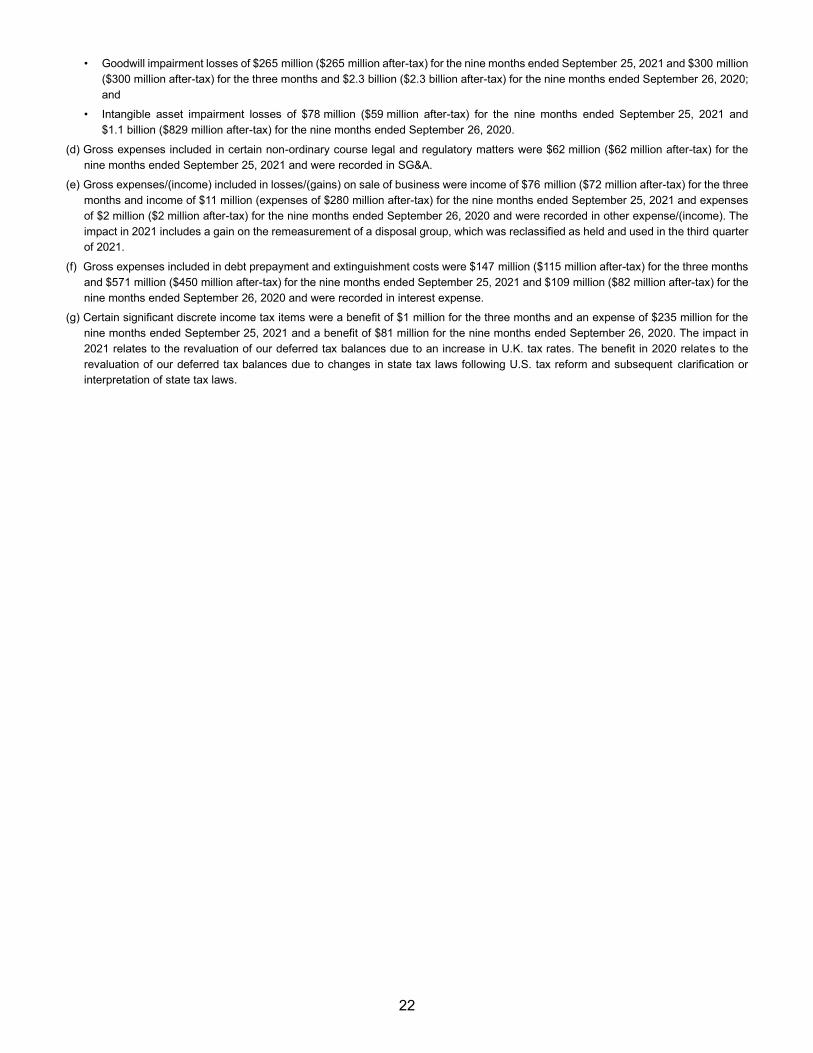
• Goodwill impairment losses of $265 million ($265 million after-tax) for the nine months ended September 25, 2021 and $300 million
($300 million after-tax) for the three months and $2.3 billion ($2.3 billion after-tax) for the nine months ended September 26, 2020;
and
• Intangible asset impairment losses of $78 million ($59 million after-tax) for the nine months ended September 25, 2021 and
$1.1 billion ($829 million after-tax) for the nine months ended September 26, 2020.
(d) Gross expenses included in certain non-ordinary course legal and regulatory matters were $62 million ($62 million after-tax) for the
nine months ended September 25, 2021 and were recorded in SG&A.
(e) Gross expenses/(income) included in losses/(gains) on sale of business were income of $76 million ($72 million after-tax) for the three
months and income of $11 million (expenses of $280 million after-tax) for the nine months ended September 25, 2021 and expenses
of $2 million ($2 million after-tax) for the nine months ended September 26, 2020 and were recorded in other expense/(income). The
impact in 2021 includes a gain on the remeasurement of a disposal group, which was reclassified as held and used in the third quarter
of 2021.
(f) Gross expenses included in debt prepayment and extinguishment costs were $147 million ($115 million after-tax) for the three months
and $571 million ($450 million after-tax) for the nine months ended September 25, 2021 and $109 million ($82 million after-tax) for the
nine months ended September 26, 2020 and were recorded in interest expense.
(g) Certain significant discrete income tax items were a benefit of $1 million for the three months and an expense of $235 million for the
nine months ended September 25, 2021 and a benefit of $81 million for the nine months ended September 26, 2020. The impact in
2021 relates to the revaluation of our deferred tax balances due to an increase in U.K. tax rates. The benefit in 2020 relates to the
revaluation of our deferred tax balances due to changes in state tax laws following U.S. tax reform and subsequent clarification or
interpretation of state tax laws.
Page 23
23
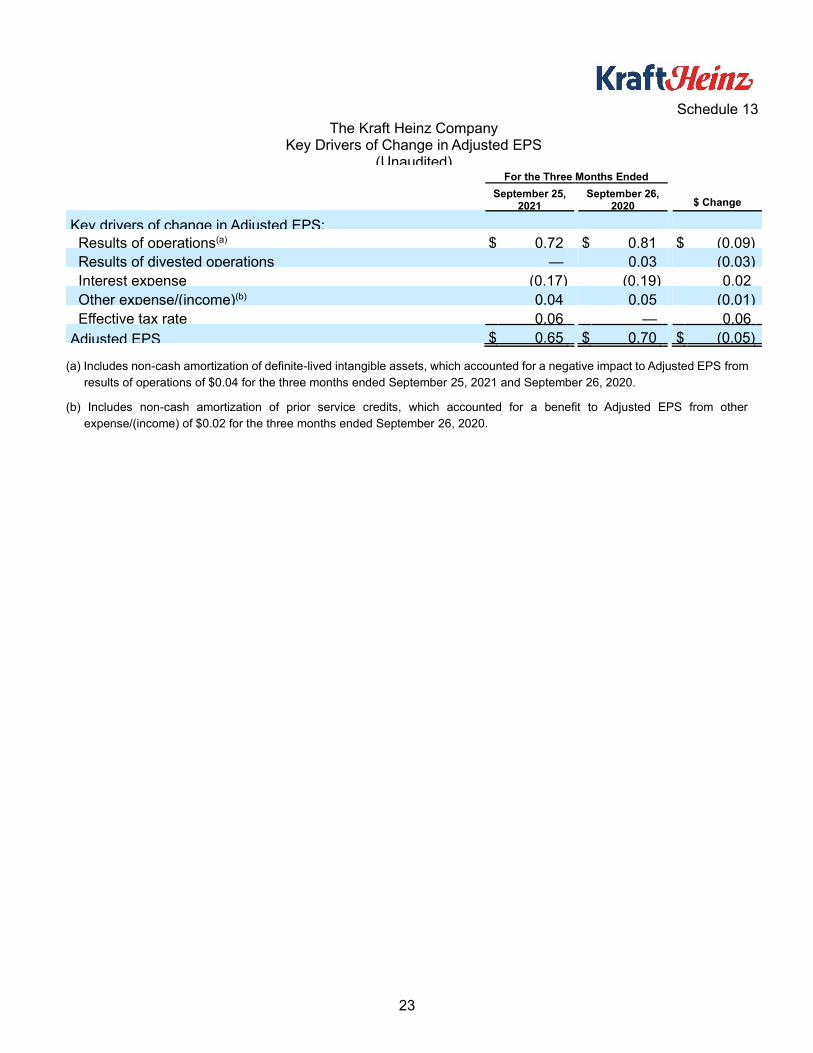
Schedule 13
The Kraft Heinz Company Key Drivers of Change in Adjusted EPS
(Unaudited) For the Three Months Ended
September 25,
2021 September 26,
2020 $ Change
Key drivers of change in Adjusted EPS:
Results of operations(a) $ 0.72 $ 0.81 $ (0.09)
Results of divested operations — 0.03 (0.03)
Interest expense (0.17) (0.19) 0.02
Other expense/(income)(b) 0.04 0.05 (0.01)
Effective tax rate 0.06 — 0.06
Adjusted EPS $ 0.65 $ 0.70 $ (0.05)
(a) Includes non-cash amortization of definite-lived intangible assets, which accounted for a negative impact to Adjusted EPS from
results of operations of $0.04 for the three months ended September 25, 2021 and September 26, 2020.
(b) Includes non-cash amortization of prior service credits, which accounted for a benefit to Adjusted EPS from other
expense/(income) of $0.02 for the three months ended September 26, 2020.
Page 24
24
Schedule 14
The Kraft Heinz Company Key Drivers of Change in Adjusted EPS
(Unaudited) For the Nine Months Ended
September 25,
2021 September 26,
2020 $ Change
Key drivers of change in Adjusted EPS:
Results of operations(a) $ 2.41 $ 2.44 $ (0.03)
Results of divested operations 0.06 0.10 (0.04)
Interest expense (0.55) (0.60) 0.05
Other expense/(income)(b) 0.11 0.15 (0.04)
Effective tax rate 0.14 — 0.14
Effect of dilutive equity awards(c) (0.02) — (0.02)
Adjusted EPS $ 2.15 $ 2.09 $ 0.06
(a) Includes non-cash amortization of definite-lived intangible assets, which accounted for a negative impact to Adjusted EPS from
results of operations of $0.11 for the nine months ended September 25, 2021 and $0.13 for the nine months ended
September 26, 2020.
(b) Includes non-cash amortization of prior service credits, which accounted for a benefit to Adjusted EPS from other
expense/(income) of $0.06 for the nine months ended September 26, 2020.
(c) Represents the impact of excluding the dilutive effects of equity awards for the nine months ended September 26, 2020 as their
inclusion would have had an anti-dilutive effect on EPS due to net losses attributable to common shareholders for the same
period.
Page 25
25
Schedule 15
The Kraft Heinz Company Condensed Consolidated Balance Sheets
(in millions, except per share data) (Unaudited)
September 25, 2021 December 26, 2020
ASSETS
Cash and cash equivalents $ 2,273 $ 3,417
Trade receivables, net 1,958 2,063
Inventories 2,839 2,773
Prepaid expenses 158 132
Other current assets 603 574
Assets held for sale 1,726 1,863
Total current assets 9,557 10,822
Property, plant and equipment, net 6,588 6,876
Goodwill 31,386 33,089
Intangible assets, net 44,803 46,667
Other non-current assets 2,563 2,376
TOTAL ASSETS $ 94,897 $ 99,830
LIABILITIES AND EQUITY
Commercial paper and other short-term debt $ 1 $ 6
Current portion of long-term debt 1,034 230
Trade payables 4,380 4,304
Accrued marketing 908 946
Interest payable 285 358
Other current liabilities 1,841 2,200
Liabilities held for sale 6 17
Total current liabilities 8,455 8,061
Long-term debt 22,937 28,070
Deferred income taxes 11,389 11,462
Accrued postemployment costs 240 243
Other non-current liabilities 1,638 1,751
TOTAL LIABILITIES 44,659 49,587
Equity:
Common stock, $0.01 par value 12 12
Additional paid-in capital 53,823 55,096
Retained earnings/(deficit) (1,425) (2,694)
Accumulated other comprehensive income/(losses) (1,858) (1,967)
Treasury stock, at cost (463) (344)
Total shareholders' equity 50,089 50,103
Noncontrolling interest 149 140
TOTAL EQUITY 50,238 50,243
TOTAL LIABILITIES AND EQUITY $ 94,897 $ 99,830
Page 26
26
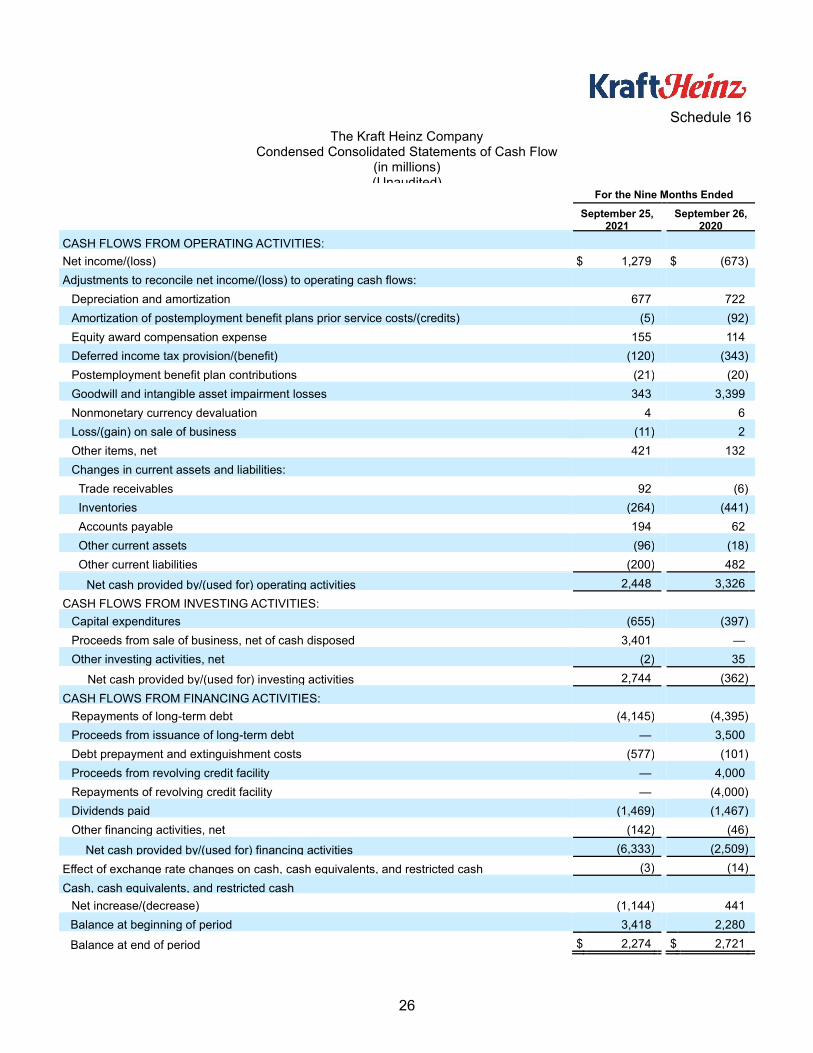
Schedule 16
The Kraft Heinz Company Condensed Consolidated Statements of Cash Flow
(in millions) (Unaudited)
For the Nine Months Ended
September 25,
2021 September 26,
2020 CASH FLOWS FROM OPERATING ACTIVITIES:
Net income/(loss) $ 1,279 $ (673)
Adjustments to reconcile net income/(loss) to operating cash flows:
Depreciation and amortization 677 722
Amortization of postemployment benefit plans prior service costs/(credits) (5) (92)
Equity award compensation expense 155 114
Deferred income tax provision/(benefit) (120) (343)
Postemployment benefit plan contributions (21) (20)
Goodwill and intangible asset impairment losses 343 3,399
Nonmonetary currency devaluation 4 6
Loss/(gain) on sale of business (11) 2
Other items, net 421 132
Changes in current assets and liabilities:
Trade receivables 92 (6)
Inventories (264) (441)
Accounts payable 194 62
Other current assets (96) (18)
Other current liabilities (200) 482
Net cash provided by/(used for) operating activities 2,448 3,326
CASH FLOWS FROM INVESTING ACTIVITIES:
Capital expenditures (655) (397)
Proceeds from sale of business, net of cash disposed 3,401 —
Other investing activities, net (2) 35
Net cash provided by/(used for) investing activities 2,744 (362)
CASH FLOWS FROM FINANCING ACTIVITIES:
Repayments of long-term debt (4,145) (4,395)
Proceeds from issuance of long-term debt — 3,500
Debt prepayment and extinguishment costs (577) (101)
Proceeds from revolving credit facility — 4,000
Repayments of revolving credit facility — (4,000)
Dividends paid (1,469) (1,467)
Other financing activities, net (142) (46)
Net cash provided by/(used for) financing activities (6,333) (2,509)
Effect of exchange rate changes on cash, cash equivalents, and restricted cash (3) (14)
Cash, cash equivalents, and restricted cash
Net increase/(decrease) (1,144) 441
Balance at beginning of period 3,418 2,280
Balance at end of period $ 2,274 $ 2,721
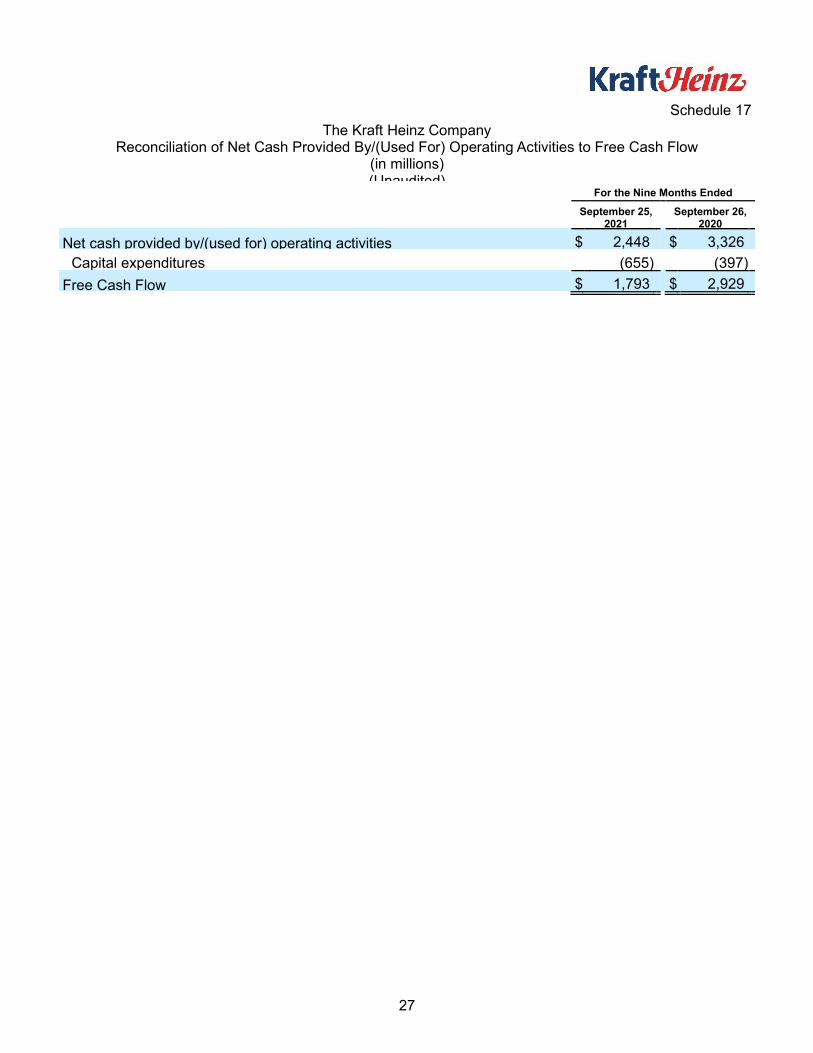
Page 27
27
Schedule 17
The Kraft Heinz Company Reconciliation of Net Cash Provided By/(Used For) Operating Activities to Free Cash Flow
(in millions) (Unaudited)
For the Nine Months Ended
September 25,
2021 September 26,
2020
Net cash provided by/(used for) operating activities $ 2,448 $ 3,326
Capital expenditures (655) (397)
Free Cash Flow $ 1,793 $ 2,929