36
KROON & ECONOMY 3/2007 Eesti Pank Bank of Estonia

KROON &ECONOMY
3/2007
Eesti PankBank of Estonia

SUBSCRIPTION
The quarterly Kroon & Economy can be subscribed by
fax: +372 6680 954
e-mail: [email protected]
mail: Eesti Pank
Publications Group
Estonia pst 13
15095 Tallinn
Estonia
The quarterly is free of charge to subscribers.
Information about publications of Eesti Pank by phone +372 6680 998.
The views expressed in the articles are those of the authors and do not necessarily
represent the official views of Eesti Pank.
Publications of the Estonian central bank are available at:
http://www.bankofestonia.info
ISSN 1406-829X
KROON & ECONOMY
Eesti Pank quarterly
Executive editor: Kadri Põdra
Cover design & design: Vincent OÜ
Layout: Urmas Raidma
Printed in Auratrükk

Kroon & Economy3/2007
3
CONTENTS
Foreword ......................................................................................................................................5
Meeting the Maastricht criteria for exhange rates and inflation during a period of nominal
convergence (J. Lewis) .................................................................................................................6
Baltic economies through the eyes of rating agencies (E. Tamla, K. Moor) ..................................14
Financial standing of Estonian and Polish companies – a comparative study (G. Golebiowski) ....22
APPENDIX
Have you noticed these materials? .............................................................................................33
Main quartely indicators of the Estonian economy as at 1 October 2007 ....................................34

�
AUTHORS OF THIS ISSUE
JOHN LEWIS, PhD
Economic and Research Division, De Nederlandsche Bank
KÄDLI MOOR
International and Public Relations Department of Eesti Pank
EVELIN TAMLA
International and Public Relations Department of Eesti Pank (on maternity leave)
GRZEGORZ GOLEBIOWSKI, PhD
Warsaw School of Economics

Kroon & Economy3/2007
�
FOREWORD
Recently, the price rise in Estonia has been relatively rapid. Naturally, the media are primarily
interested in the negative effects of the inflation on consumers’ wallets. Surprisingly, however,
wider economic implications of the price rise are also frequently discussed – for the first time in
several years. The awareness that the high inflation rate is Estonia’s main obstacle to adopting the
euro has set in. Meanwhile, the fear remains that introducing the euro will only entail an even faster
price growth. Many have also started to realise that the postponement of the adoption of the euro
may bring serious consequences to borrowers. In light of all this the central bank repeats time and
again that in order to hedge economic risks it is essential to retain a conservative fiscal policy. In
this issue of Kroon & Economy we are primarily trying to feature articles that might help to put all
this into a broader context and thus hopefully make it easier to understand.
The fresh issue presents a slightly wider analysis related to meeting the Maastricht exchange rate
criterion and the inflation criterion, which has attracted much attention in Estonia – in comparison
with various Central and Eastern European countries. In addition, the issue encompasses an
observation of the Baltic economies through the eyes of rating agencies, revealing what factors
have probably influenced the countries’ ratings.
Owing to the increasing interest of Estonian businesses in comparing themselves to their
neighbours, a comparison of various aspects concerning the financial situation of Estonian and
Polish enterprises is included in this issue. This type of material has not been published in Kroon
& Economy before. For those who have greater interest in comparing the economic processes of
countries bordered by the Baltic Sea, the issue offers some references to Internet sources and
analytical articles.

�
The nine new Central and Eastern European countries (CEECs) that have joined the European
Union but have yet to adopt the euro all obliged to join the euro area at some point in the future.
Their status as member states with a derogation implies that they do not have an explicit opt-out
of the single currency but, equally, they are free to make their own decisions about the timing and
strategy of their entry.
Admittance to the Eurozone is based on the fulfilment of the five Maastricht criteria. In addition to
nominal interest rate convergence and the fiscal criteria, candidate countries are also required to
demonstrate exchange rate stability (defined as two years membership in ERM II without severe
tensions) and low inflation (defined as inflation of no more than 1.5% above the average of the
lowest three (positive) rates in all EU Member States).
This paper analyses the problem of meeting the exchange rate and inflation criteria simultaneously
during a period in which their price levels are converging to the EU15 level. Relative price levels
for CEECs are shown below:
MEETING THE MAASTRICHT CRITERIA FOR EXCHANGE RATES AND INFLATION DURING A PERIOD OF NOMINAL CONVERGENCE*
John Lewis1
Table 1. Relative price index in 2005 (EU15 = 100)
Source: Eurostat
* The following article is a condensed version of Working Paper No. 130 of the Dutch central bank (De Nederlandsche Bank), Hitting and Hoping? Meeting the Exchange Rate and Inflation Criteria During a Period of Nominal Convergence, which was presented at the Eesti Pank Economists’ Winter Seminar in Pühajärve. The author thanks Marloes Foudraine for research assistance and is grateful to Peter Vlaar and Maria Demertzis for helpful comments.1 The views expressed are those of the author and not necessarily those of the Dutch central bank.
Country GDP deflator Household consumption
2004 intake:
Czech Republic 54.0 56.4
Estonia 55.8 62.7
Latvia 48.4 55.4
Lithuania 47.4 53.3
Hungary 58.6 62.1
Poland 52.4 58.2
Slovakia 52.6 56.2
2007 intake:
Bulgaria 35.3 42.2
Romania 43.2 51.8
Lowest 3 Eurozone:
Portugal 80.1 82.2
Greece 81.5 84.7
Spain 86.5 86.8

Kroon & Economy3/2007
�
Table 1 makes it clear that price levels in CEECs are substantially lower than in the Eurozone, and
significantly lower than the 3 lowest Eurozone members’ price levels. On the basis of the GDP
deflator, it can be seen that CEECs typically have price levels of 45–60% of the EU15, with lower
figures for the 2007 intake. Since the inflation criterion is assessed on the basis of the rate of
change in consumer prices (the HICP), the relative price of household consumption goods is also
shown. Prices are slightly higher, but still only around 50–60% of the EU15 level.
The ongoing convergence in the price levels between the current EMU candidates and the
Eurozone – also known as nominal convergence – requires either a sustained inflation differential,
a nominal exchange rate adjustment or a combination of the two. This creates a natural tension
between the process of nominal convergence and the simultaneous fulfilment of the exchange
rate and inflation criteria. The authorities can use monetary policy to hit one of the criteria –
either to target inflation, or to fix the exchange rate – but must then sit back and simply hope
to hit the other criterion. Whether or not this tension seriously hinders a CEEC’s ability to hit the
convergence criteria depends on how big these convergence effects are, and for how long they
persist.
In what follows three key questions are analysed. First, how big the tension posed by nominal
convergence is. Second, for how long this is likely to be a problem for CEECs. Third, how the
choice of exchange rate regime affects a country’s ability to simultaneously fulfil the exchange
rate and inflation criteria.
MODELLING THE CONVERGENCE PROCESS
Nominal convergence to the Eurozone implies that the price level in a CEEC will rise relative to the
Eurozone over time. This further implies that the amount of euros needed to purchase a basket of
consumer goods in a CEEC will rise over time, and that this “euro-denominated inflation rate” will
be higher in the CEEC than in the Eurozone.
For countries who fix their exchange rate to the euro, this euro-denominated inflation rate is simply
equal to the country’s (own-currency) inflation rate. Such countries will thus, on average, have
higher inflation than the Eurozone, which may make it harder to meet the inflation criterion. For
countries who float their exchange rate, and target inflation at the same 2% that the ECB does,
their (own-currency) inflation rate will be no higher, on average, than that of the Eurozone. Instead,
nominal convergence will show up as an appreciation of the nominal exchange rate, which makes
it harder for the country to stay within the ERM II bands.
The possibilities of meeting the Maastricht criteria for exchange rates and inflation during a period
of nominal convergence have been analysed using the convergence model developed by Kattai
(2006), which is graphically presented in Figure 1.

�
The key feature of this model is that price level convergence P and convergence in euro-
denominated inflation γ happen at the same time. This model can then be used to generate four
different convergence scenarios. Using data on price levels and euro-denominated inflation from
1995–2005, we can estimate the trend values of P and γ in the year 2000 (the black dots in the
figure). If we impose the requirement that P and γ converge at the same point in time, then we
can solve for the unique point in time T, at which convergence is reached. Given this start and end
point of the convergence process, we can then generate the trend paths of P and γ (the dotted
lines in the figure). Alternatively, one can estimate the trend value of P in the year 2000, fix T, and
then solve for the trend γ.
We use this approach to generate four possible convergence scenarios. These are shown below;
question marks denote that the value is obtained taking the other variables as given, and then
solving for the “missing” variable.
Figure 1. Projection of nominal convergence
ln P
t
20051995 T
Eurozone
CEEC
t
20051995 T
Eurozone
CEEC
20002000
ScenarioPrice end-point: CEEC price
level relative to EurozoneTime taken Initial γ Initial P
Full convergence 100% ? Av. 1995–2005 Av. 1995–2005
Partial convergence 80% ? Av. 1995–2005 Av. 1995–2005
Fast convergence 100% 25 ? Av. 1995–2005
Slow convergence 100% 50 ? Av. 1995–2005
Table 2. Scenarios

Kroon & Economy3/2007
�
Most estimates of likely convergence times tend to report figures of between 25 and 50 years.
Thus these two figures are taken as likely upper and lower bounds of convergence times. The
partial convergence scenario captures the idea that prices may not fully converge. For this
scenario an endpoint of 80% was chosen, based on the current price level in the Portugal, the
Eurozone member with the lowest price level.
NOMINAL CONVERGENCE AND THE MAASTRICHT CRITERIA
The next step is to evaluate how these convergence scenarios affect the ability of a CEEC to meet
the exchange rate and inflation criteria. This is done for two possible entry strategies: inflation
targeting (with a target of 2%) and exchange rate fixing
In the case of an exchange rate fixer, inflation will be higher than the Eurozone until time T. From
the point of view of CEECs the key question is when trend inflation is lower than the reference
value, Tc (see Figure 2). For as long as trend inflation in country j, �j is above the reference value,
the CEEC must rely on “good luck”, i.e. inflation below trend, to meet the criterion. Once trend
inflation is below the reference value, the CEEC would only fail to meet the reference value if
inflation happened to be temporarily above trend. On average, the reference value of the inflation
criterion has been 0.6% above Eurozone inflation, combining this with the ECB’s 2% inflation
target gives a stylised value of 2.6% for the reference value. Therefore roughly speaking, the point
TC, after which trend inflation is less than 2.6%, can be considered as the point beyond which
convergence factors alone are not strong enough to mean a country cannot meet the inflation
criterion. This is shown in Figure 2.
EZ
tT0
j
T C
2,6%
Figure 2. Trend inflation below reference value

10
Analysis shows that the convergence effects on inflation are large and long lasting. Under the full
convergence scenario, Estonia has the earliest TC of 2023, followed by the other Baltic nations,
the larger central European countries, and lastly the 2007 intake. Under the partial convergence
scenario the times are brought forward, but convergence effects are still significant for at least
a decade in most cases. More generally we may say that TC is generally very close to time T,
implying that convergence effects are significant until the very end of the convergence process.
For an inflation targeter (with an inflation target of 2%), the convergence effect shows up via
a nominal exchange rate appreciation. According to recent convergence reports, (ECB, 2006;
European Commission, 2006) appreciations of up to 15% from their central parity could be
consistent with fulfilling the exchange rate stability criterion.
The nominal exchange rate appreciations implied by convergence effects over a hypothetical two
year stay in ERM II are shown below:
Table 3 shows that the time of joining ERM II makes a difference for the size of the appreciation.
The reason for this is that nominal appreciations are higher in the earlier part of the convergence
process, because γ is higher. However, in each case, for all countries, under all convergence
scenarios, the appreciation over two years is less than the 15%. In other words, the convergence
effect on the exchange rate is never big enough to (on its own) take the currency outside the
bands of ERM II and imply automatic failure of the exchange rate criterion.
It can be concluded that countries that target inflation face much less of a problem from
convergence factors, than countries who choose to fix their exchange rate. This highlights an
100% convergence (estimated T)
80% convergence (estimated T)
100% convergence (25 y)
100% convergence (50 y)
2005 2010 2015 2005 2010 2015 2005 2010 2015 2005 2010 2015
CZ 6.84 5.85 4.87 6.29 4.90 3.51 6.31 5.11 3.92 5.17 4.57 3.97
EE 7.58 5.73 3.91 6.17 3.27 0.41 5.47 4.51 3.54 4.15 3.67 3.19
HU 7.74 6.28 4.82 6.85 4.71 2.59 6.03 4.91 3.79 4.83 4.27 3.71
LV 10.36 7.63 4.94 8.96 5.19 1.50 6.56 5.29 4.02 5.47 4.83 4.20
LT 7.18 5.92 4.67 6.41 4.58 2.76 6.03 4.91 3.79 4.83 4.27 3.71
PL 5.88 5.17 4.46 5.40 4.31 3.23 5.74 4.70 3.66 4.48 3.96 3.44
SK 7.57 6.48 5.40 7.04 5.56 4.08 6.75 5.43 4.11 5.71 5.04 4.38
BU 7.11 6.51 5.92 6.89 6.13 5.37 7.85 6.22 4.60 7.04 6.22 5.40
RO 6.66 5.93 5.20 6.33 5.35 4.37 7.01 5.62 4.23 6.02 5.32 4.62
Table 3. Forecast 2 year appreciations within ERM II under inflation targeting
(by date of joining)
Kroon & Economy3/2007
11
important feature of the Maastricht criteria – namely the different amount of room they give for the
accommodation of nominal convergence. To see this point, consider the following equation:
γj = �j + Δs,
This says that euro-denominated inflation equals own currency inflation plus the change in the
nominal exchange rate. For a country with a fixed exchange rate, Δs = 0 and thus γj = �j. If the
maximum permitted inflation is assumed to be 2.6% (as before), then country j can have a γ of no
more than 2.6% per annum, without breaching one of the Maastricht criteria.
For a country that targets inflation, �j = 2% and the exchange rate may appreciate by up to 15%
over two years, which corresponds to a yearly Δs of just over 7%. In such case, the maximum
permitted γ is just over 9%. This means that countries that target inflation get around four times
as much room to accommodate nominal appreciation than exchange rate fixers.
PRICE LEVELS AND INFLATION: AN EMPIRICAL ANALYSIS
The previous section considered convergence effects in isolation. In reality, inflation can and does
diverge from its trend value. For example, both Estonia and Lithuania have, at certain times, had
inflation below the reference value for sustained periods in recent years, despite the ongoing
nominal convergence effects. On other side, some Eurozone countries have had inflation higher
than the reference value, even though their price levels surpass the Eurozone average.
This raises the question of how big the convergence effects are in reality. This can be investigated
using price level and inflation data that exists for the original 12 Eurozone countries since the
start of EMU, and aspiring members: Estonia, Latvia, Lithuania and Slovenia, during the times for
which their exchange rates were tightly fixed to the euro.2
In any given month, a country can either comply with reference value or not. A variable Ck is
constructed which measures the proportion of the past k months for which a country has so
complied. In the empirical analysis, this was done for k = 1, 3 ,6…12.
Using the data of these 16 countries an ordered probit model was estimated to calculate the
implied probability of inflation being below the reference value for k consecutive months. These
probabilities are shown below:
2 A corresponding analysis cannot be done for inflation targeters because the number of observations for CEECs who have an inflation target of 2% would be much smaller.

12
Table 4 shows that for any given price level the probability of holding inflation below the reference
value is bigger, the greater the number of consecutive months (the bigger k) is. Second, the
higher the relative price level, the bigger the probability of meeting the reference value for a given
number of months. This is in line with the theoretical analysis of the previous section, because the
higher is the price level, the lower is trend inflation, and hence the more likely a country is to have
inflation below the reference value. In other words, the price level does not matter so much for
the probability of 1 month compliance with the reference value, but it matters a lot for 12 months
compliance. Third, the fall in the probability associated with increasing k is bigger, the lower the
price level. Fourth, the table shows that even if an economy is fully converged in terms of price
level, it is by no means a foregone conclusion that they will be able to meet the inflation criterion
for a sustained period of time. The loss of an independent monetary policy means that country
specific shocks can still push inflation above the reference value. This implies that luck, as well as
relative prices, has as an important role to play.
CONCLUSION
When choosing its monetary policy framework, a country has one instrument with which to meet
two criteria. In choosing between an inflation target and a fixed exchange rate, the authorities
effectively choose which criterion they will use their monetary policy to “hit”, and which one
they will hope for. Thus the Baltic States meet the exchange rate criterion but must simply hope
that inflation falls below the reference value. By contrast, inflation targeters, such as the Czech
Republic and Slovakia, can use monetary policy to meet the inflation criterion but most hope that
the floating exchange rate does not appreciate too much.
A key result of this article is that inflation targeting gives more room to accommodate nomi-
nal convergence. Matching this up with the currently observed policy regimes implies that the
Baltic States may have more trouble accommodating nominal convergence than larger central
European states, simply by virtue of their choice of exchange rate regime.
Relative price level k = 1 k = 3 k = 6 k = 12
50% 0.434 0.064 0.053 0.035
60% 0.482 0.122 0.103 0.070
70% 0.529 0.209 0.178 0.128
80% 0.577 0.324 0.282 0.213
90% 0.623 0.460 0.409 0.323
100% 0.668 0.600 0.546 0.452
Table 4. Probability of inflation below the reference value under a fixed exchange rate

Kroon & Economy3/2007
13
What the article does not address is whether it would be better for countries with fixed exchange
rates to move to a regime of inflation targeting. A key part of the rationale for the existing fixed
exchange rate regime is that the Baltics are very small and very open economies and are hence
vulnerable to large swings in the exchange rates, which mean that inflation targeting may be far
harder to implement than in larger more closed economies.
In the absence of an independent monetary policy, one option is to try to use other instruments
to control inflation. Fiscal policy could be tightened to reduce aggregate demand and induce a
temporary slowdown in inflation and growth. However, this would involve a cost to the real econ-
omy. Moreover, the inflation criterion also includes the requirement that price performance be
sustainable, and hence a temporary fall in inflation below the reference value may not be enough
to pass the inflation criterion. If neither fiscal nor monetary policy is used to affect inflation, then it
is essentially a variable which the government does not control. They must simply wait and hope
that inflation falls sufficiently. However, given the size of convergence effects, this wait could be
quite long.
Pinpointing the effects of convergence on inflation in any particular year is difficult. In recent years
the Baltic States have converged far more rapidly in real terms than they have in nominal terms.
As the empirical analysis showed, it is still possible for a country with a large price level differential
to meet the inflation reference value under a fixed exchange rate. However, the robustness of the
results to different convergence scenarios suggest that over the longer term, regardless of what
scenario is chosen for convergence – full, fast, slow or incomplete –, almost any plausible conver-
gence process requires a differential in long-run inflation rates for many years to come.
REFERENCES
European Central Bank, (2006). Convergence Report, European Central Bank, Frankfurt am Main.
European Commission, (2006). Convergence Report, European Commission, Brussels.
Kattai, R. (2006). How Could we Forget the Convergence?, mimeo, Estonian Economics Association Annual
Conference.
Lewis, J. (2006). Hitting and Hoping? Meeting the Exchange Rate and Inflation Criterion During a Period
of Nominal Convergence, DNB Working Paper No. 130, De Nederlandsche Bank, Amsterdam.

1�
INTRODUCTION
Recently, the rating agencies’ assessments to the economies of the Baltic States have attracted
more attention than usual. In May this year, Standard&Poor’s lowered Latvia’s sovereign rating1 and
Fitch Ratings did the same in August. In July, Standard&Poor’s reduced the outlook of Estonia’s
sovereign rating2 from stabile to negative, which in Lithuania’s case was done already in May.
According to both Standard&Poor’s and Fitch Ratings, the sovereign rating of Latvia is lower than
the Estonian and Lithuanian ratings. Standard&Poor’s has given negative assessments to the rating
outlooks of all Baltic States, considering the probability of lowering ratings greater than Fitch Ratings
who regards the outlooks as stable. In September, the third major rating agency Moody’s Investors
Service lowered the Estonian and Latvian ratings from positive to stable. However, the rating policy
of Moody’s Investors Service clearly differs from the other two, focusing strongly on public finance
and the long-term developments of the economies. This is reflected in a more positive sovereign
rating compared to the other agencies (see Table 1).
FACTORS AFFECTING THE RATINGS OF BALTIC STATES
Rating agencies assess a country’s ability and will to earn foreign currency in order to meet their
long-term liabilities. The most direct determinant of a country’s solvency is its debt burden and the
annual state budget balance shaping the debt. In addition, the sovereign rating is affected by several
BALTIC ECONOMIES THROUGH THE EYES OF RATING AGENCIES
Evelin Tamla, Kädli Moor
Standard&Poor's FitchRatings Moody's
Estonia A/negative A/stable A1/stable
Latvia BBB+/negative BBB+/stable A2/stable
Lithuania A/negative A/stable A2/stable
Hungary BBB+/stable BBB+/negative A2/stable
Slovenia AA/stable AA/stable Aa2/positive
Italy A+/stable AA-/stable Aa2/stable
Greece A/stable A/positive A1/positive
Spain AAA/stable AAA/stable Aaa/stable
Portugal AA-/stable AA/stable Aa2/stable
Icelan A+/stable A+/stable Aaa/stable
Table 1. Sovereign ratings of Estonia, Latvia, Lithuania and other selected countries*
* As at 12 September 2007.
1 A sovereign rating is an assessment of the government’s ability and will to repay long-term foreign liabilities in a timely manner by international agencies specialised on the analysis of countries’ loan servicing abilities. The sov-ereign rating largely determines the interest rates on the loans the public as well as the private sector can obtain from foreign markets.2 A rating outlook indicates the expected direction of the change in the rating in the near future. The outlook may be stable, positive or negative.

Kroon & Economy3/2007
1�
indirect factors related to the situation of public finance and the vulnerability of the economy as a
whole. When assessing the rating level, analysts consider the country’s total economic situation,
expected developments and structural foundations, political stability and institutional capacities.
Rating agencies highly value the harmony of the whole economic policy.
The strengths and weaknesses of the Estonian, Latvian and Lithuanian sovereign ratings are very
similar. The situation of the Baltic public finances has always strongly supported their sovereign
ratings. The most remarkable example of strong public finance is Estonia, which ranks at the top not
only in comparison with countries with similar rating levels, but also in terms of lowest public debt in
Europe after Liechtenstein and Luxembourg. Contrary to many other countries, the indirect liabilities
of the general governments in the Baltic States that derive from guarantees granted to the private
sector and the potential liabilities related to public enterprises are nearly non-existent. Besides, the
rating agency Standard&Poor’s has assessed the flexibility of the Estonian and Lithuanian state
budgets very highly and that of Latvia highly, reflecting the ability of the general government to adapt
to unexpected external shocks3.
The public finance of the Baltic States is supported by rapid economic growth, which is facilitated
by exports based on economic flexibility and competitiveness. Estonia’s economic efficiency is also
boosted by the strong banking sector, even excluding the potential external support according to
Fitch Ratings4. The assets of the Lithuanian banking sector are also nearly completely in foreign
ownership and in the case of Latvia this figure stands at about 60%, which is an important risk-
hedging factor. The banking sector owners of the Baltic States are strategic investors and there is
no reason to believe that they would suddenly cease to finance their subsidiaries. The ratings of
the Baltic States have long been supported by the European Union accession, intense economic
integration and the membership of ERM II, among other things. In addition to enjoying the economic
benefits of the common market, EU membership gives a clear quality label to the institutional
development of the Baltic States. All this fosters Estonia’s convergence towards the living standards
of the old EU Member States.
In recent years, the perspectives of joining the euro area have played an increasing role in the ratings
of the Baltic States. The fixed exchange rate systems based on the currency board in Estonia and
Lithuania as well as the Latvian monetary system similar to the principles of the currency board
system are regarded as the cornerstones of the countries’ rapid economic expansion after regaining
independence. The rating agencies agree that the currency board system is very strong and has
several advantages over the customary fixed exchange rate system. However, if the national currency
remains, there is a risk that the exchange rate and/or its system would have to be changed. This
may be brought about by the staggering confidence in the national currency and the subsequent
3 Research by Standard&Poor’s, “The 2007 Fiscal Flexibility Index: Continental Sovereigns Still Lagging Behind”, 31 May 2007.4 Special report by Fitch Ratings, “Bank Systemic Risk Report”, 22 March 2007.

1�
abrupt interest rate rise or a discernible deterioration in the competitiveness of the exporting sector.
To a monetary system that has operated only for a dozen or so years, this change would have
serious consequences in view of the expectations of economic agents – entrepreneurs, individuals,
investors and the financial sector.
By adopting the euro this serious, although highly improbable threat would disappear. Moreover,
the accession of the Baltic States to the euro area is supported by the optimum currency area
arguments5, which form the theoretical basis for the single currency principle. The most important
of them is the fact that Baltic economies are small and open and that they have close economic
relations with the European Union.
Against this background, the postponement of the accession to the euro area has been one of the
primary reasons for the lowering of Baltic ratings. The perspective of joining the euro area should
be viewed in direct relation to the key weakness of the Estonian, Latvian and Lithuanian economies:
the large and long-term current account deficit in international comparison. On the one hand, active
borrowing has increased private sector debt burden. Owing to the high degree of foreign ownership
in the financial sector and other enterprises, this is reflected in external debt, which is considerably
higher than the median average of other countries with comparable ratings. As in the Baltic States
external liabilities and issued loans are mainly in euros but the incomes of borrowers generally
in national currencies, the materialisation of the abovementioned threat of exchange rate change
would create problems. However, for a euro area country the euro is its national currency and the
country itself lacks the opportunity to change the exchange rate. Thus, by adopting the euro the
external economic imbalance indicators would have nearly no bearing on the sovereign rating,
which would considerably decrease the potential vulnerability of the Baltic States in the eyes of
rating agencies.
Accompanied by very high domestic demand, constraints on production factors and strengthening
inflationary pressures, the increasingly growing current account deficit of the Baltic States has raised
concerns among the rating agencies that the risk of a sudden slowdown in GDP growth is increasing.
Due to this – but also regardless – the probability of declining competitiveness and its long and
painful recovery has risen. The economic indicators reflecting the aforementioned risks point to the
fact that the resistance of the Baltic States to factors detrimental to their economic situation has
weakened. A considerable slowdown in GDP growth, i.e. an abrupt adjustment of the economy,
may be triggered by the deterioration of the external environment, for instance. Speaking of threats
to Latvia, at the beginning of this year Standard&Poor’s described the so-called real adjustment,
where GDP growth would suddenly drop below the current potential level and remain there for a
5 According to the theory of the optimum currency area formulated by Robert A. Mundell in the 1960s, it might be economically more effective for a country to forsake independent monetary policy. The theory discusses the criteria that serve as the basis for analysing the effectiveness of the currency area. Its goal is to assess the vulner-ability of countries in the selected area to asymmetric economic shocks.

Kroon & Economy3/2007
1�
long while6. GDP growth would remain slower over a longer period of time if both competitiveness
and private consumption, which has so far grown vigorously, dropped suddenly. Competitive
abilities would be difficult to restore with the help of lower wages or higher productivity, because
slow economic growth would entail greater emigration of employees. Declining employment and
slow productivity growth would decrease the investment attraction. All this would affect the state
budget, its deficit potentially exceeding even the Maastricht criteria. This, in turn, would postpone
the adoption of the euro even further. The restoration of lost competitiveness requires time and
effort, still being experienced by euro area member Portugal, for instance. In fact, the rating agency
Moody’s Investors Service believes that the main threat to the Baltic economies is the so-called
Portugal syndrome, i.e. the painful economic standstill resulting from the excessive loan burden of
the private sector, rather than an abrupt adjustment.
WHAT MIGHT CHANGES IN THE ASSESSMENTS OF RATING AGENCIES ENTAIL?
Despite similar development factors and the fact that many foreign investors regard the Baltic States
as a single (economic) region, rating agencies tend to disagree as to the importance of these factors
and risks to economies. Nobody doubts that convergence plays an enormous role in the Baltic
economies. This mitigates the threat signals that similar economic indicators would convey in case
of advanced economies. At the same time, it is impossible to estimate the role of convergence
unambiguously due to its complex nature. Thus, rating agencies have become more cautious owing
to the deterioration of indicators reflecting economic vulnerability.
The lower sovereign ratings of Latvia were caused by its economic indicators referring to a greater
vulnerability compared to other Baltic States. For instance, in 2006 the current account deficit
of Latvia amounted to 22% of GDP and the consumer price index exceeded 10% at the end of
summer 2007. From among the Baltic States, Latvia’s outlook of joining the euro area has shifted
the most to the future. Fitch Ratings has given the most recent evaluation, according to which Latvia
will not adopt the euro before 2013. Fitch Ratings considers Lithuania the strongest of the Baltic
States7, its economy being the least vulnerable to sudden changes in capital flows and slowdown
of economic growth. Thus, the deterioration of the outlook for joining the euro area in Lithuania has
not raised such concerns as in Latvia’s case. In terms of vulnerability, Estonia remains somewhere
in between Latvia and Lithuania. Similar to other Baltic States, the assessments of rating agencies
have become more cautious also with regard to the Estonian economy, because its internal and
external imbalances have been gradually deepening according to economic indicators.
6 Research by Standard&Poor’s, “Latvia: A Baltic Boom-Bust?”, 19 February 2007.7 Special report of Fitch Ratings, “Risks Rising in the Baltic States”, 6 March 2007.

1�
Until the beginning of this year, the Baltic States have been witnessing only increasing ratings. Thus,
lowering Latvia’s sovereign rating by Standard&Poor’s and Fitch Ratings, and downgrading various
rating outlooks is a new experience. So far, this has not brought along significant reactions from the
markets. Rating changes have generally been reflected most directly in the cost of the country’s loan
money and the interest spread of local markets8. True, the higher the rating, the less the margins
have changed. Furthermore, changes in sovereign ratings influence the volume and direction of
capital flows9. However, Baltic markets are small and trading opportunities scarce, which is why the
share of portfolio investment is low. In addition, the base money has been fully covered by external
reserves owing to the monetary system. In light of these circumstances the impact of changes in
sovereign ratings is weak and the possibility of an extreme speculative currency attack marginal. As
for Latvia, the first negative outlook in February this year was followed by a slight increase in interest
rates and the interest spread has remained unchanged until today. Nevertheless, it is difficult to say
whether the interest rate increase was caused by the negative outlook, because immediately before
that a panic of the devaluation of the Latvian lat broke out, which was not related to the decision of
the rating agency in any way.
Sovereign ratings may implicitly be regarded as the yardstick of the economy and economic policy
of the Baltic States and, thus, also as a confidence shaper. For the Baltics, this is even more
important than the influence of sovereign ratings on the markets. The worsening assessments of
rating agencies may considerably harm the confidence of consumers and entrepreneurs. This, in
turn, may trigger an abrupt economic adjustment. If the ratings decrease too much and for too
long, long-term (foreign) investors may become more cautious about the economic climate of the
Baltic States. This would entail less investment and potentially lower economic growth. In case of
a negative scenario, also the current cheap loan money from the parent banks of the Baltic States
may become scarce and/or loan margins may rise owing to the increased risk. Thus, changes in
sovereign ratings may bring about long-term consequences, but their scope and impact is very
difficult to assess.
THE NEAR FUTURE OF THE BALTIC STATES’ SOVEREIGN RATINGS
The assessments of rating agencies indicate that at the moment the sovereign ratings of the Baltic
States tend to drop rather than rise. Reducing Latvia’s rating by Standard&Poor’s and also by
Fitch Ratings demonstrates that downward corrections are triggered when the external balance
deteriorates so much as to cross the „pain threshold” of rating agencies. Especially so in combi-
nation with strong domestic demand as well as price and wage growth pressures that refer to
overheating. An inflation rate that considerably exceeds the Maastricht criterion postpones the
8 E.g. the differences in TALIBOR and EURIBOR rates should generally also reflect differences in risk levels.9 E.g. Gande and Parsley have discovered that lowering sovereign ratings will entail capital outflow (A. Gande, D. Parsley (2004), “Sovereign Credit Ratings and International Portfolio Flows”, http://www.internationalmonetaryfund.com/external/np/seminars/eng/2004/ecbimf/pdf/parsle.pdf).

Kroon & Economy3/2007
1�
possibility of joining the euro area. The postponement of the adoption of the euro for several years
compared to the initial goals of the Baltic States has not provoked negative reactions from rating
agencies per se. However, together with problematic economic indicators this factor remains
significant. Rating agencies find it important that Estonia, Latvia and Lithuania use the government’s
measures to manage the risks of overheating. This is especially topical in the case of Latvia, the
most worrisome of the three countries, regarding whom both Fitch Ratings and Standard&Poor’s
have noted that the government’s plan for combating inflation may not suffice for balancing the
economy and may entail a (new) rating drop.
The comparison of the Baltic States’ ratings with those of other countries enables to assess the
importance of the strengths and weaknesses listed by the rating agencies. From among older euro
area member states, the ratings of the Baltic States remain closest to those of Greece, Italy and
Portugal. The living standards of Estonia, Latvia and Lithuania are similar to Portugal and Greece. As
for countries outside the European Union and the euro area, comparison with the wealthy Iceland is
the most noteworthy (see Table 1). Table 2 presents a summary of the strengths and weaknesses of
those countries’ ratings based on the latest reports by Fitch Ratings. The key conclusion is that euro
area membership is crucial in affecting the sovereign rating, to a great extent outweighing any other
weaknesses of an economy. Thus, the sovereign ratings of the Baltic States should rise upon the
adoption of the euro. According to Fitch Ratings they may increase by one or two levels. Moreover,
Standard&Poor’s has concluded based on a mechanical analysis that should Greece, Italy, Portugal
and Spain, current members of the euro area, decide to abandon the euro, this might lower their
sovereign ratings by one to four levels10. A comparison with Iceland who is not a member of the EU
or the euro area but whose external balance indicators are also weak, confirms that another way
to increase the sovereign rating is the rise in living standards. A higher level of income per resident
is indicative of the prosperity, versatility and flexibility of an economy necessary for withstanding
unfavourable economic situations.
10 Report by Standard&Poor’s „Breaking Up Is Hard To Do: Rating Implications of EU States Abandoning The Euro”, 24 November 2005.

20
Estonia Latvia Lithuania
Sovereign rating A/stable BBB+/stable A/stable
GDP per person based on purchasing power parity, 2007 (forecast), EU-25 = 100
68.8 57.0 57.3
Supporting factors
Balanced state budget and very low public debt Fast GDP growth; income convergence towards EU levels High-quality banking system in foreign ownership Free market economy which may significantly foster direct foreign investment inflow
Strong public finance, low government debt, public sector external assets Income convergence towards EU levels
Constant real GDP growth and income convergence towards EU levels Strong public finance, low government debt Banking system in foreign ownership
Weakening factors
Accession to the euro area postponed at least until 2012 because of high inflation Great current account deficit Large and increasing private sector external debt
Great current account deficit Great banking sector and private sector external debt High inflation which postpones euro area accession Low external liquidity, great short-term debt burden
Inflationary pressures which postpone accession to the euro area Large current account deficit, growing private sector external debt Weak external liquidity
Italy Greece Portugal
Sovereign rating AA-/stable A/positive AA/stable
GDP per person based on purchasing power parity, 2007 (forecast), EU-25 = 100
98.2 85.5 69.3
Supporting factors
Wealthy, broad-based economy Low inflation, euro area member Debt management, access to the euro area capital market
Fast GDP and income growth per capita EU and euro area member Majority government with strong economic control Successful privatisation and product market reforms Successful investments, growth of productivity, immigration
Member of EU and euro area Pro-reform majority government Strong banking system
Table 2. Factors supporting and weakening the sovereign ratings of selected countries

Kroon & Economy3/2007
21
Weakening factors
High public debt Deteriorating competitiveness Inflexible product market Political resistance to the public sector's cost refom
Government debt over 100% of GDP (according to the old calculation system), but budget deficit now below 3% Weak public administration, deficient labour market refom, problems with the reliability of statistical data Active borrowing in the private sector, great private consumption, fast wage growth, appreciating real exchange rate Corruption and black economy
Weak public finance, budget deficit exceeds the EU 3% reference value Ineffective public sector Low GDP per capita compared to Western Europe Low productivity
Hungary Iceland
Sovereign rating BBB+/negative A+/stable
GDP per person based on purchasing power parity, 2007 (forecast), EU-25 = 100
63.1 123.0
Supporting factors
High GDP ratio per person in view of the rating level Versatile economy, integrated with the EU High level of direct investment Impeccable public debt servicing
Sustainable public finance Floating exchange rate Effective institutions Great growth potential for energy-consuming industry
Weakening factors
Weak public finance Large current account deficit, external debt, need for external financing Low external liquidity, great sensitivity to confidence changes Bank loans mainly in foreign currencies
Banks' great dependance on market financing Unsustainable current account deficit High net external debt
Italy Greece Portugal
Sources: Fitch Ratings, Eurostat.

22
INTRODUCTION
In any economy, enterprises are the mainstay of prosperity. Unsurprisingly, an economy derives
its health from the well-being of its companies. In fact, this phenomenon is of a reciprocal natu-
re, i.e. a more functional and competitive economy will foster the effectiveness of its corporate
network.
The financial standing of a business can be assessed in a variety of fashions. The limited volume
of this study – as well as restricted access to quantitative data adequately comparable for both
corporate systems under analysis – does not permit of an exhaustive recourse to relevant met-
hodology. A fairly reliable perspective can, however, be formulated through a classical set of fi-
nancial ratios. They tend to shed light on such variables as financial liquidity, management skills
or profitability: a yardstick of economic effectiveness.
Comparative analysis of Estonian and Polish companies
Liquidity stands out as the most critical area in assessing the financial fitness of a corporate entity.
The relevant analysis has been performed from the standpoint of payment liquidity.
Liquidity ratio performance does not differ substantially on a cross-country basis. Nevertheless,
the trend has been upward, which is – unquestionably – good news. Taking into account aggre-
FINANCIAL STANDING OF ESTONIAN AND POLISH COMPANIES – A COMPARATIVE STUDY
Grzegorz Golebiowski
ItemPoland2002
Estonia2002
Poland2003
Estonia2003
Poland2004
Estonia2004
Poland2005
Estonia 2005
Current liquidity ratio (Level 3)
Average 1.07 1.3 1.12 1.33 1.25 1.36 1.34 1.42
<49 1.05 1.30 1.01 1.35 1.15 1.39 1.33 1.43
50–249 1.15 1.30 1.19 1.31 1.3 1.36 1.32 1.31
>250 1 1.3 1.17 1.3 1.3 1.31 1.38 1.45
High liquidity ratio (Level 2)
Average 0.77 0.9 0.83 0.94 0.91 0.95 1 1.04
<49 0.76 0.87 0.75 0.92 0.83 0.96 0.97 1.03
50–249 0.82 0.85 0.86 0.87 0.94 0.89 0.98 0.89
>249 0.73 1 0.88 0.99 0.96 1.01 1.05 1.15
Cash ratio (Level 1)
Average 0.2 0.3 0.2 0.27 0.3 0.28 0.3 0.34
<49 0.22 n/a 0.21 n/a 0.25 n/a 0.31 n/a
50–249 0.2 n/a 0.23 n/a 0.27 n/a 0.28 n/a
>249 0.18 n/a 0.25 n/a 0.33 n/a 0.36 n/a
Table 1. Corporate liquidity ratios in Poland and Estonia in 2002–2005 (by personnel
headcount)
Source: independent calculations based on corporate balance sheet data from 2002–2005 (available from the Polish and Estonian Statistical Offices)

Kroon & Economy3/2007
23
gate data for companies in both countries, the higher-level liquidity ratios reported for Poland have
trailed behind their peers in Estonia. In 2005, this gap amounted to 0.08 and had been contracting
slightly on a year-on-year basis. High-level liquidity ratios also tend to be lower in Poland. In as-
sessing corporate liquidity, the gap between both ratio types is oftentimes highly indicative. Such
a gap is relatively wide for Polish enterprises. This stems from a larger proportion of inventories in
their working capital. In Poland, the largest inventory counts are reported by farming, fishery and
industrial processing, while in Estonia: trade, industrial processing, mining and fishery. Level 1
liquidity for companies in both countries has performed similarly along the analyzed time series. In
both countries large companies tend to display superior liquidity versus small businesses.
Seamless inventory use has direct impact on liquidity on the one hand, and on overall manage-
ment effectiveness, on the other. The most general ratio summarily attesting to this aspect of cor-
porate activity is the asset turnover/efficiency/productivity ratio.
Lower inventory counts or better inventory management might be a function of superior manage-
ment practices per se or of disparities in corporate structures in both countries and/or shorter in-
ventory turnover cycles1. No matter their true cause, the fluctuations can be monitored via varying
asset turnover ratio results for companies from both surveyed countries.
The improved liquidity reported within the data set (capability of timely, i.e. prior to maturity, ser-
vicing of liabilities) is not owed to higher asset productivity. Asset productivity reported by Estonian
companies fell during 2000–2004. In fact, 2005 initiated a reversal of this unfavourable trend. The
Polish situation is none the better: in 2004–2005 asset turnover ratios stood at 1.25 and 1.21,
respectively, meaning that towards the end of the surveyed period asset productivity declined.
Enterprises will better their economic standing as their productivity ratios improve. They are also
able to operate with similar success when a relatively fixed pattern of turnover ratios is accompa-
nied by rising turnover volumes. Consequently, the favorable operational development generates
surplus cash flows.
Item 2000 2001 2002 2003 2004 2005
Asset turnover ratio
Average 1.51 1.51 1.48 1.36 1.27 1.29
<49 1.96 1.81 1.72 1.55 1.45 1.55
50–249 1.88 1.84 1.81 1.75 1.65 1.55
>250 0.88 0.93 0.99 0.96 0.95 0.95
Table 2. Asset turnover ratios for Estonian enterprises in 2000–2005
Source: independent research based on the data of Statistics Estonia
1 The assessment of financial standings is far from being exhaustive and its aim is to identify overall trends and tendencies.
2�
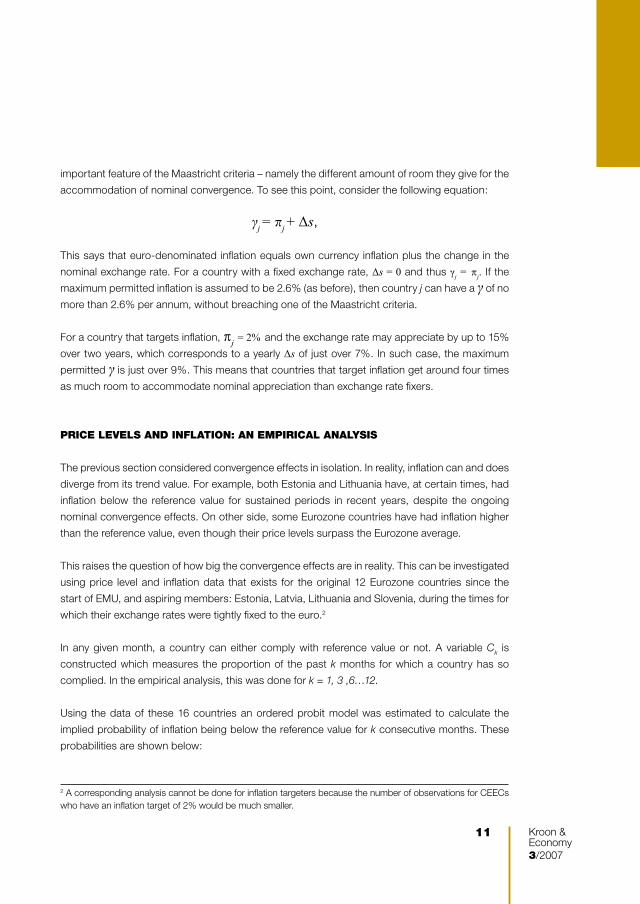
The comparison demonstrates superior performance on the part of Estonian businesses. The sa-
les growth of Estonian companies outpaced that of Polish enterprises virtually throughout the sur-
veyed period. The sole exception was 2003 when Polish companies showed more vigorous sales
growth than their Estonian peers. Nevertheless, the trend initiated in 2003 proved all but sustain-
able. In 2005, the growth slowed down. Conversely, the Estonian growth trend powered ahead
since 2003. The driving force behind this unabated expansion is not clearly identifiable, yet large
entities (employing over 250 staff) appear to have the dominant effect on soaring revenues.
Table 3. Revenue dynamics reported by Estonian companies during 2001–2005 (%)
Source: independent research based on the data of Statistics Estonia
Table 4. Revenue dynamics reported by Polish companies during 2000–2005 (%)
Source: independent research based on the data of the Polish Central Statistical Office
Item 2001 2002 2003 2004 2005
Revenue dynamics
Average 114.4 112.5 108.1 117.7 118.5
<49 116.7 113.9 104.1 116.8 122.1
50–249 115.9 108.7 111.3 120.1 112.3
>250 106.3 114.1 115.4 116.8 118.2
Item 2001 2002 2003 2004 2005
Revenue dynamics 100.7 102.4 112.7 116.4 105.5
Table 5. Net profitability of sales in respect of enterprises in Estonia and Poland during
2002–2005 (according to NACE; %)
Sources: independent research based on financial reporting contained in publications by the Polish Central Statistical Office and Statistics Estonia for 2002–2005.
Estonia
2002Poland 2002
Estonia 2003
Poland 2003
Estonia 2004
Poland 2004
Estonia 2005
Poland 2005
Average 6.00 -0.30 7.08 2.00 7.49 4.80 8.07 4.00
Farming 6.91 -2.80 4.83 -3.90 9.01 5.00 8.90 2.00
Fishery 1.78 -5.30 4.14 5.50 -0.46 2.60 4.32 10.10
Mining 1.87 -1.30 4.55 28.50 6.35 13.80 8.90 12.30
Industrial processing 5.72 0.70 5.79 2.20 5.32 6.00 6.03 4.70
Energy generation & distribution
-2.35 0.30 9.04 1.50 7.14 3.60 10.72 4.10
Construction 5.19 -2.00 5.11 -0.50 5.33 2.10 6.72 2.50
Trade & repair 3.65 0.00 3.44 0.50 4.15 2.30 3.95 2.00
Hotels & restaurants 6.35 -1.60 7.41 -0.20 5.48 7.40 10.57 6.40
Transport, storage and communications
n/a -6.60 n/a 1.50 n/a 7.80 n/a 5.40
Financial intermediation n/a 3.30 n/a 3.40 n/a 8.70 n/a 1.10
Real estate services 19.63 -0.30 28.94 5.00 35.99 7.10 40.01 6.80

Kroon & Economy3/2007
2�
With slower revenue dynamics and inferior revenue margins, Polish enterprises are ill-poised to
generate free cash flows.
In 2005 alone, sales margins posted by Estonian enterprises averaged 8% and were twofold high-
er than the Polish peer group. In 2003, the Estonian ROS topped threefold its Polish benchmark
– where only starting 2003 cumulative ROS tested positive territory. The rift may be caused by
the high proportion of costs borne by an average Polish enterprise – with particular encumbrance
due to payroll taxes. In Estonia, such taxes are limited to a single transfer, which is subsequently
redistributed among various government agencies. Poland has a complicated system of a myriad
of payroll-related levies; furthermore, their overall scale is significantly higher than in Estonia.
The Estonian ROS peaks at 40% for real estate services, whereas in Poland the best performance
was in 2005 posted by the mining industry – at a comparatively lacklustre 12%. The highest costs
in Poland were paid by the financial intermediation sector – its ROS was a meagre 1.1% –, while
in Estonia highest costs were witnessed in trade – slightly over 3%.
Corporate economic potential (gauged via ROA) tends to be higher among Estonian companies.
Additionally, they have access to more “spare capacity”, as their ROA has, throughout the sur-
veyed period, been higher than average and this ratio has consistently improved. In such circum-
stances, enterprises can rely harder on external funding (leverage), thereby enhancing ROE.
Figure 1. Asset profitability posted by Estonian enterprises during 2001–2005 (against
average cost of credit)
6.03%8.92%
9.67% 9.57%
10.48%
6.12% 5.53% 5.05% 5.12% 4.87%
0%
2.0%
4.0%
6.0%
8.0%
10.0%
12.0%
2001 2002 2003 2004 2005
ROA average loan interest
Source: Independent research based on reports submitted to Statistics Estonia

2�
The profitability of assets, as other ratios expressing the financial standing of Polish and Estonian
companies, differs significantly between both countries. The proportion of aggregate operating
profits to total corporate assets in Poland equalled a paltry 5% in 2005, while the same relation-
ship with regard to Estonian companies was twofold higher. ROA across most economic sectors
in Poland happened to be negative in 2001–2002, whereas in Estonia such results were noted
solely by the infrastructural sector in 2002–2003. While Estonian companies’ assets are gaining in
profitability, their Polish peers have been displaying an opposite trend. In both countries, mining
companies seem to have fared the best, while improvement was discernible in construction and
industrial processing. It is noteworthy that construction recorded a ROA of 17%, the maximum for
this ratio in Estonia across the analysed data set; the Polish ROA maximized at 10% (the mining
industry), with a clear downward trend.
Efficiency measured through ROE ratios is also superior for Estonian businesses, which comes
as no particular surprise taking into account the previous ROA results. While the average Estonian
ROE posted in 2005 exceeded 20%, in Poland it was twice lower, or (in 2001–2003) downright
negative. During the equivalent period, the ratio for Estonian companies topped 12%. Given the
large exposure of the Estonian corporate universe to foreign capital, the reason behind this phe-
nomenon is easily explainable. The role of a foreign investor usually goes beyond passive funding
and usually involves hands-on restructuring, which, in turn, has a beneficial impact on the opera-
tional side and financial profitability.
2 The cost of credit has been estimated using a 3M Warsaw Inter Bank Offered Rate (WIBOR) adjusted by a 0.5% fee for each year of the surveyed period and by appropriate Corporate Income Tax Rate rates.
Figure 2. Asset profitability posted by Polish enterprises in 2001–2005 (against average
cost of credit)2
-0.30%
2.30%
6.60%
12.00%
6.80%
4.50%5.40%
4.90%
4.70%
-0.02
0
0.02
0.04
0.06
0.08
0.1
0.12
0.14
2001 2002 2003 2004 2005
ROA average loan interest

Kroon & Economy3/2007
2�
Insight into key drivers affecting ROE can be gained while analyzing the DuPont model to disagg-
regate the ROE ratio3 (shown below):
Net profit
=
Net profit
x
Sales
x
Total assets
Equity (average) Sales Total assets Equity (average)
The equation demonstrates an evident link between ROE and ROA. The sole difference between
both ratios is limited to the way in which assets are financed, represented by the quotient of as-
sets over equity. The equity coefficient rises proportionately to the share of leverage in the asset
financing structure.
In other words, the formula helps display reciprocal relationships between equity and sales pro-
fitabilities as well as operational efficiency (the financing structure). Interestingly enough, a given
profitability (i.e. rate of return) can be achieved by a company through various combinations of
profit margins, asset turnovers and capital structures.
Table 6. Average return on equity reported by Estonian and Polish enterprises in 2002–
2005 (according to NACE; %)
ItemEstonia
2002Poland 2002
Estonia2003
Poland 2003
Estonia 2004
Poland 2004
Estonia 2005
Poland 2005
Average 18.81 -0.90 19.38 -0.80 19.06 12 20.94 9.50
Farming 18.83 1.70 10.88 -1.50 19.54 3 17.18 1.40
Fishery 10.33 0.40 15.56 -11.80 -1.41 3.10 12.64 10.30
Mining 4.90 -3.90 12.38 -22.30 15.69 31.90 19.57 24.40
Industrial processing 20.42 -1.40 18.71 2.40 16.40 19.40 18.30 13.50
Energy generation & distribution
-1.67 0 7.04 0.50 5.75 4.40 7.84 5.10
Construction 35.57 -4.90 29.26 -9.90 27.37 10.90 34.98 12.30
Trade & repair 28.53 2.40 23.70 0.30 27.61 16.80 27.37 13.50
Hotels & restaurants 17.63 1 18.79 -1.90 18.12 9.20 28.83 7.60
Transport, storage & communications
n/a -6.60 n/a -11.40 n/a 15.30 n/a 8.80
Financial intermediation n/a -9.40 n/a 5.10 n/a 16.20 n/a 14.50
Real estate services 19.79 0.40 19.91 -0.20 20.97 3.40 25.75 3.40
Source: author’s own calculations based on financial reporting by businesses surveyed in 2002–2005 by the Statistical Offices of Poland and Estonia
3 Cf. e.g. G. Golebiowski, P. Szczepankowski, Analiza wartosci przedsiebiorstwa, Warsaw, Difin 2007.

2�
As at 2004 in Poland:
72,2004
=72,200
x1,513,807
x1,214,520
601,5005 1,513,807 1,214,520 601,500
i.e. 12% (ROE) = 4.77% x 1.25 x 2.02.
As at 2005:
63,823=
63,823x
1,598,878x
1,318,404
674,822 1,598,878 1,318,404 674,822
i.e. 9.46% (ROE) = 3.99% x 1.21 x 1.95.
A multiplication formulated as Z = a x b x c permits a causal analysis of Z deviations e.g. using
logarithms, wherein:
; , .
Using the aforementioned elements of the DuPont equation for Polish companies, an aggregate
deviation of equity can be calculated for the surveyed period. It thus amounts to:
= ROE2005 - ROE2004 = 9.46% - 12.0% = -2.55%.
Partial deviations are as follows6:
Effect of change in sales profitability (factor a):
= -0.01901
Effect of change in asset turnover (factor b):
= -0.00293
Effect of change in capital coefficient (factor c):
= -0.00352
4 Figures in millions of Polish zlotys (PLN).5 Owing to data constraints, the ROE formula based for Poland been calculated using end-of-period values (as opposed to averaging).6 The calculations have been performed using spreadsheet software.

Kroon & Economy3/2007
2�
Consequently, the fall in equity profitability has been primarily owed to eroding sales profitability,
followed by drops in the capital coefficient and slower asset turnover.
The respective calculations of equivalent relationships concerning Estonia are as follows:
Item ROE ROS Turnover Coefficient
2004 19.06% 7.49% 1.28 1.99
2005 20.94% 8.07% 1.30 2.00
= ROE2005 - ROE2004 = 20.94% - 19.06% = 1.88%.
Partial deviations are as follows:
Effect of change in sales profitability (factor a):
= 0.014891
Effect of change in asset turnover (factor b):
= 0.003287
Effect of change in the capital coefficient (factor c):
= 0.000575
Equity profitability growth has been primarily fuelled by increasing sales profitability, followed by
rising asset turnover and – in the least – a growing capital coefficient.
The capital coefficient, mirroring corporate asset structure, is, on average, similar for Polish and
Estonian companies. The present research indicates, however, that it is the Estonian corporate
network that is better equipped to upgrade its future effectiveness inter alia thanks to available
recourse to financial leverage, which has been tapped on a moderate scale there. Polish enterp-
rises ought to seek opportunities for bolstering their sales margins and operating skills, which is
likely to translate into gains in overall efficiency.
CONCLUSION
The comparative study demonstrates relative superiority on the part of the Estonian corporate
sector; not only does it deliver better financial results, but it is more likely to finance research and
development (R&D), which has a favourable impact on long-term profitability, operating flexibility
and efficiency. On average, Polish enterprises have only in the past 3-4 years operated at a profit.
The driving force behind the Polish profitability rally has clearly been European Union accession;
in the Estonian case the proximity and commitment of Nordic investment appears to have played
an important role. Basic ratio analysis performed for both countries accentuates the significance

30
of overall “friendliness” of a country’s business climate and, hence, its attractiveness to foreign
investment; such factors (to a considerable extent) tend to determine corporate turnovers and
capital structures. Technological backup to domestic enterprises, promotion of industrial and
services sectors pursuing state-of-the-art technology, along with regulatory and administrative
flexibility and support to innovative start-ups (usually inexperienced and lacking access to tra-
ditional financing sources) all represent key determinants of competitiveness – both at sectoral
and pan-economic levels. In analysing the competitive positions of both countries, one must not
abstract from their broader socio-cultural settings. Corporate governance, judiciary and business
ethics standards are, beyond doubt, responsible for day-to-day corporate practice at decision-
making (i.e. human) level. By various measures in this respect7, Estonia has consistently ranked
far above Poland.
Corporate development in Estonian and Poland is, to a substantial degree, a function of key mac-
roeconomic variables. Polish companies operate in a low-inflation environment (moderate infla-
tionary pressures are currently afoot), while in Estonia inflation control has remained a paramount
and lasting challenge. A currency board (the Estonian case) eliminates the leeway for “hands-on”
monetary policy – a resource still being available to Poland. Nonetheless, Estonia has a history of
low public indebtedness and comfortable budgetary surpluses, which is a proxy for limited go-
vernment involvement in free-market activity. The Polish market for corporate debt instruments is
disproportionately (to the needs of Polish companies) underdeveloped, chiefly due to the soaring
public debt and, consequently, large issuance of high-yield short-term government bonds (the-
reby stifling growth of corresponding instruments on the corporate side). The classical “crowding-
out effect” is likely to persist in Poland (taking into account government ambitions as to nationwi-
de investment and social spending). The most likely loser in this game will be the Polish small and
medium enterprise segment. The current attempts at a more flexible labour market (and lower
wage costs) might also prove harder to accomplish. This is despite the generally high level of
labour-related spending, which does not appear to be easily controllable – primarily on account of
wage pressures, thereby prices, which might ultimately uncoil an “inflationary spiral”.
Furthermore, erecting a knowledge-based economy implies ongoing commitments to education,
research and the personal development of an individual employee. Estonia is far ahead Poland in
this race. Estonia has put together a consistent scheme designed to promote entrepreneurship
– specifically oriented toward job creation. Poland also lags behind in cooperation between com-
panies and research centres. Many international firms have moved to set up their R&D facilities
in Poland regarding it an optimal value-for-money location from the workforce quality viewpoint.
Similarly to Estonia – the picture of falling unemployment is marred by a massive exodus of highly
qualified employees in the wake of EU enlargement. Both labour markets are beginning to suffer
7 For further information, please refer to indices developed and published by Transparency International www. transparency.org.

Kroon & Economy3/2007
31
shortages of specialists, an unwieldy legacy of obsolete high school and tertiary education cur-
ricula, especially in engineering.
Corporate activity is frequently also affected by a wider institutional and regulatory framework,
its functionality and continuity. Estonian enterprises enjoy, with the exception of inflationary pres-
sures, the comfort of a predictable political and regulatory environment, something strongly en-
vied by their Polish peers. Last but not least, corporate existence (let alone development) is by
definition vulnerable to excessive political and bureaucratic interference, which invariably consu-
mes the time and effort of entrepreneurs. Both countries have a long way to go towards the “Old
European” (EU 15) standards in the aforementioned context, yet the comparisons unequivocally
place Estonia further down this road.
Source: independent research inspired by B. Snowdon’s interview with X. Sala-i-Martin, The Enduring Elixir of Economic Growth, World Economics Vol. 7, No. 1, January-March 2006.
The growth of individual businesses can foster nationwide economic expansion solely in propi-
tious institutional and legal circumstances. Therefore, the competitiveness of individual business
units has to fall back on functional administration at government level, where the authoritative
ambits of free-market competition and basic economic efficiency tend to be delineated. In the
Polish case, this top-level decision making process appears to be insufficient in coherence and
completely lacking in long-term vision. Conversely to Estonia, whose economic roadmap drawn
back in the 1990s has been consistently implemented – resulting in admirable macroeconomic
prosperity and corporate robustness.
Figure 3. Economic development stages according to the Global Competitiveness Index
(GCI) as at 2006
Stage 3Stage 2Stage 1
Armenia, Azerbaijan,
China, Egypt, India,
Kenya, Moldova,
Mongolia, Pakistan,
Ukraine, Vietnam
Argentina, Brazil, Bulgaria, Chile,
Croatia, Lithuania, Mexico, Poland,
Romania, Slovakia, Turkey
USA, Finland, Denmark,
Singapore, Germany, Sweden,
UK, Japan, France
Czech Republic, Estonia,
Hungary, Korea, TaiwanAlbania, Colombia,
Macedonia, Peru, Thailand

32
APPENDIX

Kroon & Economy3/2007
33
HAVE YOU NOTICED THESE MATERIALS?
Below you can find a few links to additional reading for those interested in regular monitoring
of economic processes in Poland and the Baltic States. We also recommend visiting the
section on Baltic economies on the central bank’s web site (http://www.eestipank.
info/pub/et/dokumendid/virtuaalraamatukogubm/BaltimaadeMajandus/).
The central bank also provides a virtual library (http://www.eestipank.info/pub/et/
dokumendid/virtuaalraamatukogu/, only in Estonian).
World Bank EU8+2 regular economic report
[http://www.worldbank.org/eu8-report]
Published: four times a year
Notes: until 2007 titled “World Bank EU8 quarterly economic report”
Summary: World Bank new series aimed at monitoring economic and reform developments
in the eight Central European and Baltic EU accession countries (the Czech Republic,
Estonia, Hungary, Latvia, Lithuania, Poland, the Slovak Republic, and Slovenia). The report
is prepared by a team of Bank economists in the region.
Baltic Rim Economies: Estonia – Latvia – Lithuania – Poland – Baltic Russia / Turku
School of Economics and Business Administration [http://www.tukkk.fi/pei/bre/]
Published: bimonthly
Summary: The Baltic Rim Economies - bimonthly Review consists of concise information
on recent macroeconomic development, and the reasons behind important movements and
expectations concerning the near future. In addition, we inform our readers of interesting
news concerning the business climate, legislation, corporate acquisitions and major foreign
direct investments in the three Baltic States and Poland. Each bimonthly report includes
2-3 expert articles on current topics. The bimonthly Review is published regularly on the last
weekday of every even month. The report is freely available on the Internet.

3�
Unit Period Indicator
Change compared
to the previous
period (%)
Change compared
to the same period last year (%)
Source
Gross domestic product
Current prices EEK m Q2 07 60,873.8 ESA
Constant prices EEK m Q2 07 43,232.7 8.7 6.7 ESA
Production
Volume index of industrial production (at constant prices (2000 = 100)
% Q2 07 6.7 7.2 ESA
Investments in fixed assets (at current prices)
EEK m Q2 07 9,827.5 12.8 6.2 ESA
Construction
Construction activities of construction enterprises (at current prices)
EEK m Q2 07 15,039 41.9 28.9 ESA
Usable floor area of completed dwellings
thousand m2
Q2 07 164.7 35.2 100.4 ESA
Usable floor area of non-residential buildings
thousand m2
Q2 07 271.2 18.5 16.9 ESA
Consumption
Retail sales volume index (at constant prices, 2000 = 100)
% Q2 07 12 17 ESA
New registration of passenger cars pieces Q2 07 21,864.0 21.8 3.2 ARK
Prices
Consumer price index % Q2 07 1.9 5.7 ESA
Producer price index % Q2 07 2.4 8.5 ESA
Export price index % Q2 07 2.5 7.5 ESA
Import price index % Q2 07 1.6 3.2 ESA
Construction price index % Q2 07 2.1 15.2 ESA
Real effective exchange rate (REER) of the Estonian kroon
% Q2 07 0.8 2.2 EP
Labour market and wages
Employment rate (based on the Labour Force Survey)*
% Q2 07 62.9 61.8 62 ESA
Unemployment rate (based on the Labour Force Survey)*
% Q2 07 5 5.3 6.2 ESA
Registered unemployed (according to the Labour Market Board)
persons per month
Q2 07 13,133 -5.1 -17.5 TTA
% of population between 16 years old and pension age*
% Q2 07 2 2 1.9 TTA
Average monthly gross wages and salaries (health insurance benefits excluded)
EEK Q2 07 11,549 11.9 21.2 ESA
* Indicators of the period, not changes
MAIN qUARTELY INDICATORS OF THE ESTONIAN ECONOMY as at 1 October 200�

Kroon & Economy3/2007
3�
Unit Period Indicator
Change compared
to the previous
period (%)
Change compared
to the same period last year (%)
Source
General government budget (net borrowing not included here)
Revenue EEK m Q1 07 19,336.5 -8.7 24.6 RM
Expenditure EEK m Q1 07 18,610.8 -19 20.6 RM
Balance (+/-)* EEK m Q1 07 725.7 -1,804.7 87 RM
Period's revenue to the planned annual revenue*
% Q1 07 27 29.5 21.6 RM
Transport
Carriage of passengers thousand Q2 07 50,883 -5.2 -2.2 ESA
Carriage of goods thousand
tonsQ2 07 27,964 -3.4 23.7 ESA
Tourism, accommodation
Visitors from foreign countries received by Estonian travel agencies
thousand Q2 07 491.4 16.3 19.6 ESA
Visitors sent to foreign tours by Estonian travel agencies
thousand Q2 07 134.7 5.1 14.4 ESA
Accommodated visitors thousand Q2 07 626.2 58.5 3.1 ESA
o/w foreign visitors thousand Q2 07 397.8 99.3 -4.1 ESA
Foreign trade (special trade system)
Exports EEK m Q2 07 32,859.6 10.4 6.7 ESA
Imports EEK m Q2 07 45,653.9 9.4 7.1 ESA
Balance* EEK m Q2 07 -12,794.3 -11,973.8 -11,855.8 ESA
Foreign trade balance/exports* % Q2 07 -38.9 -40.2 -38.5 ESA
Balance of payments*
Current account balance EEK m Q2 07 -8,548.7 -12,027.8 -7,847.9 EP
Current account balance to GDP % Q2 07 -14 -21.9 -15.2 EP
Foreign direct investment inflow EEK m Q2 07 7,650.9 8,779.4 3,374.4 EP
Foreign direct investment outflow EEK m Q2 07 -6,776.0 -3,488.6 -3,982.1 EP
International investment position
Net international investment position EEK m 30/06/07 -168,582.9 5.7 18.6 EP
Direct investment in Estonia EEK m 30/06/07 162,995.2 5.9 9.3 EP
Net external debt EEK m 30/06/07 235,230.8 9.5 35.2 EP
o/w government EEK m 30/06/07 3,139.5 -34.2 -36.6 EP
EEK/USD average quarterly exchange rate
EEK Q3 07 11.4 -1.9 -7.2 EP
ESA – Statistical Office of EstoniaARK – Motor Vehicle Registration CentreEP – Eesti Pank /Bank of EstoniaTTA – Labour Market BoardRM – Ministry of Finance

3�


![[XLS] · Web viewmogA Molybdenum_cofactor_biosynthesis SO_0131 ubiC Ubiquinone_Biosynthesis SO_0137 moeB SO_0138 moeA SO_0215 panK Coenzyme_A_Biosynthesis SO_0349 yifB Experimental_tye](https://static.documents.pub/doc/80x56/5b1d62977f8b9acc488b5c73/xls-web-viewmoga-molybdenumcofactorbiosynthesis-so0131-ubic-ubiquinonebiosynthesis.jpg)


