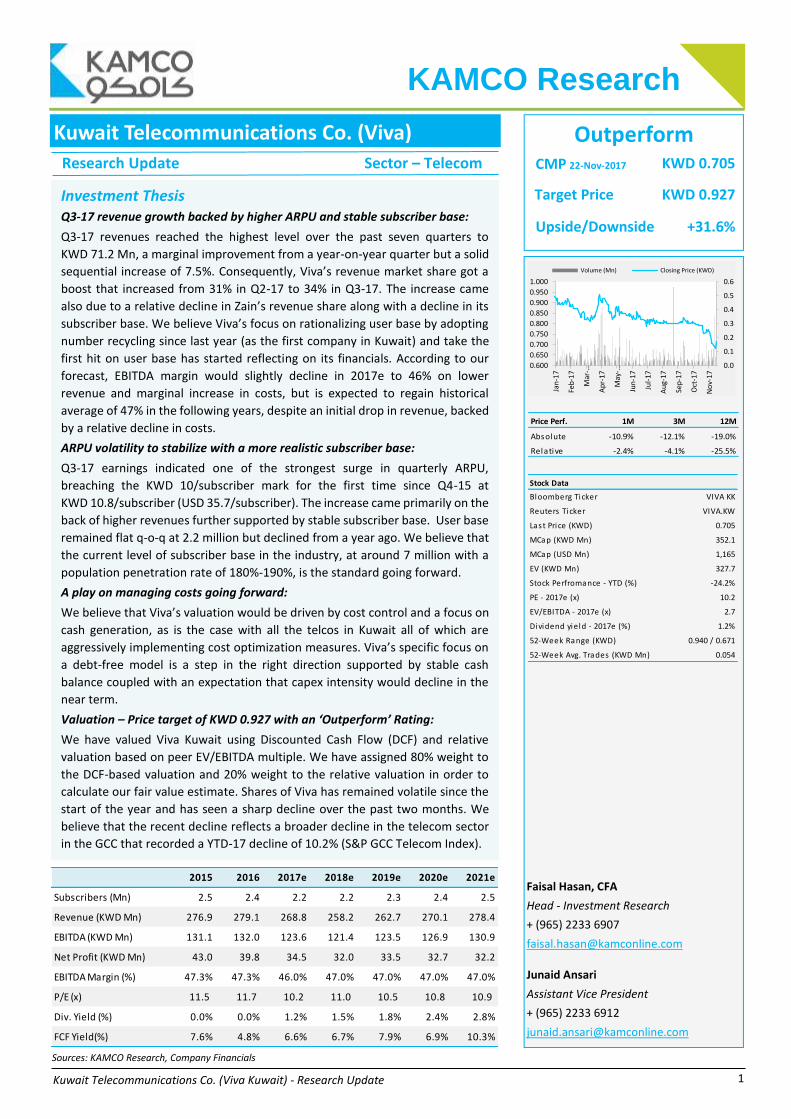
1 Kuwait Telecommunications Co. (Viva Kuwait) - Research Update 0.0 0.1 0.2 0.3 0.4 0.5 0.6 0.600 0.650 0.700 0.750 0.800 0.850 0.900 0.950 1.000 Jan-17 Feb-17 Mar-… Apr-17 May-… Jun-17 Jul-17 Aug-17 Sep-17 Oct-17 Nov-17 Volume (Mn) Closing Price (KWD) Price Perf. 1M 3M 12M Absolute -10.9% -12.1% -19.0% Relative -2.4% -4.1% -25.5% Stock Data Bloomberg Ticker VIVA KK Reuters Ticker VIVA.KW Last Price (KWD) 0.705 MCap (KWD Mn) 352.1 MCap (USD Mn) 1,165 EV (KWD Mn) 327.7 Stock Perfromance - YTD (%) -24.2% PE - 2017e (x) 10.2 EV/EBITDA - 2017e (x) 2.7 Dividend yield - 2017e (%) 1.2% 52-Week Range (KWD) 0.940 / 0.671 52-Week Avg. Trades (KWD Mn) 0.054 Kuwait Telecommunications Co. (Viva) Faisal Hasan, CFA Head - Investment Research + (965) 2233 6907 [email protected]Junaid Ansari Assistant Vice President + (965) 2233 6912 [email protected]KAMCO Research Research Update Sector – Telecom Sources: KAMCO Research, Company Financials Outperform CMP 22-Nov-2017 KWD 0.705 Target Price KWD 0.927 Upside/Downside +31.6% Investment Thesis Q3-17 revenue growth backed by higher ARPU and stable subscriber base: Q3-17 revenues reached the highest level over the past seven quarters to KWD 71.2 Mn, a marginal improvement from a year-on-year quarter but a solid sequential increase of 7.5%. Consequently, Viva’s revenue market share got a boost that increased from 31% in Q2-17 to 34% in Q3-17. The increase came also due to a relative decline in Zain’s revenue share along with a decline in its subscriber base. We believe Viva’s focus on rationalizing user base by adopting number recycling since last year (as the first company in Kuwait) and take the first hit on user base has started reflecting on its financials. According to our forecast, EBITDA margin would slightly decline in 2017e to 46% on lower revenue and marginal increase in costs, but is expected to regain historical average of 47% in the following years, despite an initial drop in revenue, backed by a relative decline in costs. ARPU volatility to stabilize with a more realistic subscriber base: Q3-17 earnings indicated one of the strongest surge in quarterly ARPU, breaching the KWD 10/subscriber mark for the first time since Q4-15 at KWD 10.8/subscriber (USD 35.7/subscriber). The increase came primarily on the back of higher revenues further supported by stable subscriber base. User base remained flat q-o-q at 2.2 million but declined from a year ago. We believe that the current level of subscriber base in the industry, at around 7 million with a population penetration rate of 180%-190%, is the standard going forward. A play on managing costs going forward: We believe that Viva’s valuation would be driven by cost control and a focus on cash generation, as is the case with all the telcos in Kuwait all of which are aggressively implementing cost optimization measures. Viva’s specific focus on a debt-free model is a step in the right direction supported by stable cash balance coupled with an expectation that capex intensity would decline in the near term. Valuation – Price target of KWD 0.927 with an ‘Outperform’ Rating: We have valued Viva Kuwait using Discounted Cash Flow (DCF) and relative valuation based on peer EV/EBITDA multiple. We have assigned 80% weight to the DCF-based valuation and 20% weight to the relative valuation in order to calculate our fair value estimate. Shares of Viva has remained volatile since the start of the year and has seen a sharp decline over the past two months. We believe that the recent decline reflects a broader decline in the telecom sector in the GCC that recorded a YTD-17 decline of 10.2% (S&P GCC Telecom Index). 2015 2016 2017e 2018e 2019e 2020e 2021e Subscribers (Mn) 2.5 2.4 2.2 2.2 2.3 2.4 2.5 Revenue (KWD Mn) 276.9 279.1 268.8 258.2 262.7 270.1 278.4 EBITDA (KWD Mn) 131.1 132.0 123.6 121.4 123.5 126.9 130.9 Net Profit (KWD Mn) 43.0 39.8 34.5 32.0 33.5 32.7 32.2 EBITDA Margin (%) 47.3% 47.3% 46.0% 47.0% 47.0% 47.0% 47.0% P/E (x) 11.5 11.7 10.2 11.0 10.5 10.8 10.9 Div. Yield (%) 0.0% 0.0% 1.2% 1.5% 1.8% 2.4% 2.8% FCF Yield(%) 7.6% 4.8% 6.6% 6.7% 7.9% 6.9% 10.3%
Transcript
1
Kuwait Telecommunications Co. (Viva Kuwait) - Research Update
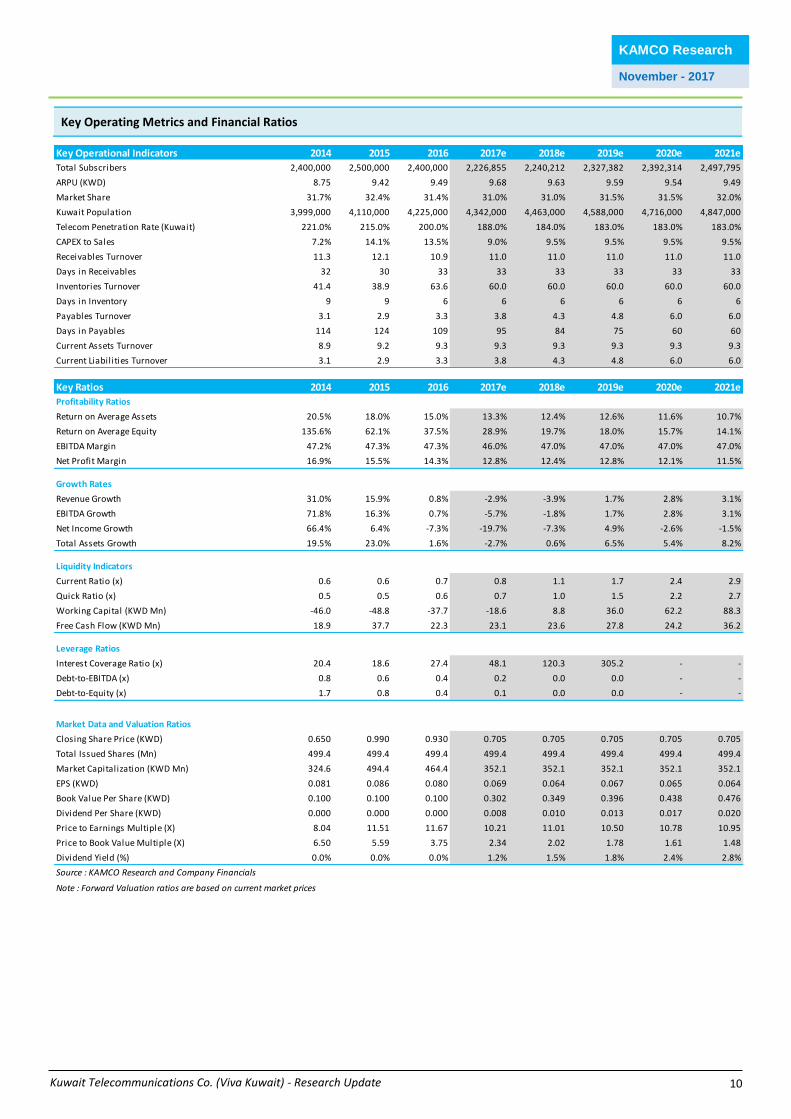
Note : Forward Valuation ratios are based on current market prices
Source : KAMCO Research and Company Financials
KAMCO Investment Company
Disclaimer & Important Disclosures KAMCO is authorized and fully regulated by the Capital Markets Authority ("CMA, Kuwait") and partially regulated by the Central Bank of Kuwait (“CBK”).
This document is provided for informational purposes only. Nothing contained in this document constitutes investment, an offer to invest , legal, tax or other advice or
guidance and should be disregarded when considering or making investment decisions. In preparing this document, KAMCO did not take into account the investment
objectives, financial situation and particular needs of any particular person. Accordingly, before acting on this document, investors should independently evaluate the
investments and strategies referred to herein and make their own determination of whether it is appropriate in light of their own financial circumstances and objectives.
The entire content of this document is subject to copyright with all rights reserved. This research and the information contained herein may not be reproduced, distributed
or transmitted in Kuwait or in any other jurisdiction to any other person or incorporated in any way into another document or other material without our prior written
consent.
Analyst Certification
Each of the analysts identified in this report certifies, with respect to the sector, companies or securities that the individual analyses, that (1) the views expressed in this
report reflect his or her personal views about all of the subject companies and securities and (2) no part of his or her compensation was, is or will be directly or indirectly
dependent on the specific recommendations or views expressed in this report.
KAMCO Ratings
KAMCO investment research is based on the analysis of regional and country economics, industries and company fundamentals. KAMCO company research reflects a long-
term (12-month) target price for a company or stock. The ratings bands are:
Outperform: Target Price represents expected returns >= 10% in the next 12 months
Neutral: Target Price represents expected returns between -10% and +10% in the next 12 months
Underperform: Target Price represents an expected return of <-10% in the next 12 months
In certain circumstances, ratings may differ from those implied by a fair value target using the criteria above. KAMCO policy is to maintain up-to-date fair value targets on
the companies under its coverage, reflecting any material changes to the analyst’s outlook on a company. Share price volatility may cause a stock to move outside the rating
range implied by KAMCO’s fair value target. Analysts may not necessarily change their ratings if this happens, but are expected to disclose the rationale behind their view
to KAMCO clients.
Any terms and conditions proposed by you which are in addition to or which conflict with this Disclaimer are expressly rejected by KAMCO and shall be of no force or effect.
The information contained in this document is based on current trade, statistical and other public information we consider reliable. We do not represent or warrant that
such information is fair, accurate or complete and it should not be relied upon as such. KAMCO has no obligation to update, modify or amend this document or to otherwise
notify a recipient thereof in the event that any opinion, forecast or estimate set forth herein, changes or subsequently becomes inaccurate. The publication is provided for
informational uses only and is not intended for trading purposes. The information on publications does not give rise to any legally binding obligation and/or agreement,
including without limitation any obligation to update such information. You shall be responsible for conducting your own investigation and analysis of the information
contained or referred to in this document and of evaluating the merits and risks involved in the securities forming the subject matter of this or other such document.
Moreover, the provision of certain data/information in the publication may be subject to the terms and conditions of other agreements to which KAMCO is a party.
Nothing in this document should be construed as a solicitation or offer, or recommendation, to acquire or dispose of any investment or to engage in any other transaction,
or to provide any investment advice or service. This document is directed at Professional Clients and not Retail Clients within the meaning of CMA rules. Any other persons
in receipt of this document must not rely upon or otherwise act upon it. Entities and individuals into whose possession this document comes are required to inform themselves
about, and observe such restrictions and should not rely upon or otherwise act upon this document where it is unlawful to make to such person such an offer or invitation
or recommendation without compliance with any authorization, registration or other legal requirements.
KAMCO Investment Company (DIFC) Limited (“KAMCO DIFC”) is regulated by the Dubai Financial Services Authority (DFSA). KAMCO DIFC may only undertake the financial
services activities that fall within the scope of its existing DFSA licence. This document is intended for Professional Clients or Market Counterparties only as defined by the
DFSA, and no other person should act upon it.’
Risk Warnings
Any prices, valuations or forecasts are indicative and are not intended to predict actual results, which may differ substantially from those reflected. The value of an investment
may go up as well as down. The value of and income from any investment may fluctuate from day to day as a result of changes in relevant economic markets (including,
without limitation, foreseeable or unforeseeable changes in interest rates, foreign exchange rates, default rates, prepayment rates, political or financial conditions, etc.).
Past performance is not indicative of future results. Any opinions, estimates, valuations or projections (target prices and ratings in particular) are inherently imprecise and
a matter of judgment. They are statements of opinion and not of fact, based on current expectations, estimates and projections, and rely on beliefs and assumptions. Actual
outcomes and returns may differ materially from what is expressed or forecasted. There are no guarantees of future performance. Certain transactions, including those
involving futures, options, and other derivatives, give rise to substantial risk and are not suitable for all investors. This document does not propose to identify or to suggest
all of the risks (direct or indirect) which may be associated with the investments and strategies referred to herein.
Conflict of Interest
KAMCO and its affiliates provide full investment banking services, and they and their directors, officers and employees, may take positions which conflict with the views
expressed in this document. Salespeople, traders, and other professionals of KAMCO may provide oral or written market commentary or trading strategies to our clients
and our proprietary trading desks that reflect opinions that are contrary to the opinions expressed in this document. Our asset management area, our proprietary trading
desks and investing businesses may make investment decisions that are inconsistent with the recommendations or views expressed in this document. KAMCO may have or
seek investment banking or other business relationships for which it will receive compensation from the companies that are the subject of this document. Facts and views
presented in this document have not been reviewed by, and may not reflect information known to, professionals in other KAMCO business areas, including investment
banking personnel. United Gulf Bank, Bahrain owns majority of KAMCO’s shareholding and this ownership may create, or may create the appearance of, conflicts of interest.
No Liability & Warranty
KAMCO makes neither implied nor expressed representations or warranties and, to the fullest extent permitted by applicable law, we hereby expressly disclaim any and all
express, implied and statutory representations and warranties of any kind, including, without limitation, any warranty as to accuracy, timeliness, completeness, and fitness
for a particular purpose and/or non-infringement. KAMCO will accept no liability in any event including (without limitation) your reliance on the information contained in
this document, any negligence for any damages or loss of any kind, including (without limitation) direct, indirect, incidental, special or consequential damages, expenses or
losses arising out of, or in connection with your use or inability to use this document, or in connection with any error, omission, defect, computer virus or system failure, or
loss of any profit, goodwill or reputation, even if expressly advised of the possibility of such loss or damages, arising out of or in connection with your use of this document.
We do not exclude our duties or liabilities under binding applicable law.
KAMCO Investment Company
KAMCO Investment Company - K.S.C. (Public) Al-Shaheed Tower, Khalid Bin Al-Waleed Street- Sharq P.O. BOX : 28873, Safat 13149, State of Kuwait Tel: (+965) 1852626 Fax: (+965) 22492395 Email : [email protected] Website : http://www.kamconline.com