22
CAUSATION AN AND ASSOCIATION AND CONFOUNDING DR DINESH KUMAR WALIA ASSTT PROFESSOR DEPARTMENT OF COMMUNITY MEDICINE GOVERNMENT MEDICAL COLLEGE CHANDIGARH

CAUSATION AN AND ASSOCIATION AND CONFOUNDING
DR DINESH KUMAR WALIAASSTT PROFESSOR
DEPARTMENT OF COMMUNITY MEDICINEGOVERNMENT MEDICAL COLLEGE
CHANDIGARH
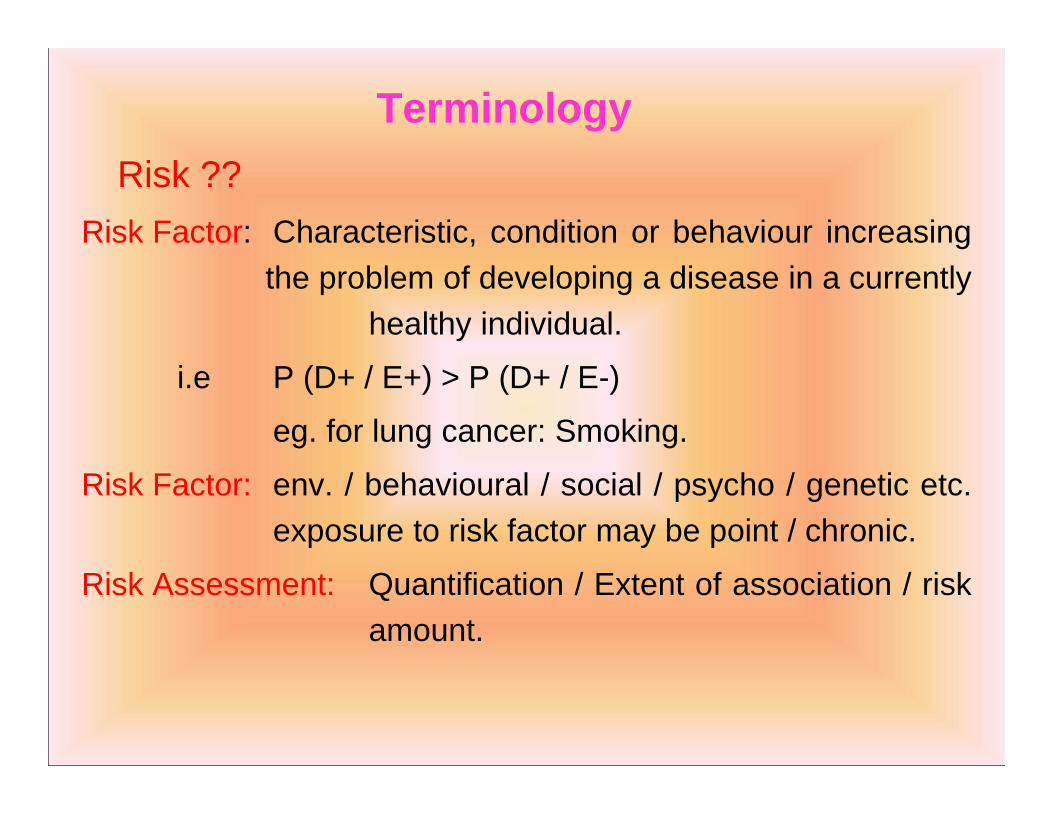
TerminologyRisk ??
Risk Factor: Characteristic, condition or behaviour increasingthe problem of developing a disease in a currently
healthy individual.
i.e P (D+ / E+) > P (D+ / E-)
eg. for lung cancer: Smoking.
Risk Factor: env. / behavioural / social / psycho / genetic etc.exposure to risk factor may be point / chronic.
Risk Assessment: Quantification / Extent of association / riskamount.

Risk Markers: Factors indirectly associated with the outcome.
eg. Neonatal Mortality:
Risk factors : Poor pre‐natal care, ………….
Casual factors : LBW …………
Marker : Low SES
Synergy : LBW & other complications.
Characteristics of Casual Factors:
• Consistency
• Strength
• Specificity
• Temporality
• Coherence

RISK FACTOR Vs CASUAL FACTORCasual Factor A risk factor which causes disease
Risk factor casual factor (may be vice versa)
Why? The observed association between risk factor & disease
may also be due to confounders / markers and synergistic
factors.
Confounders?? Synergistic Factors? Markers??

CONFOUNDING FACTORS• Factor associated with exposure whichindependently of any such association is alsorisk factor for the disease.
• Factors distorting association between risk
factor & disease by creating artificial
relationships. A confounder is associated with
both expo. and outcome, but unequally.
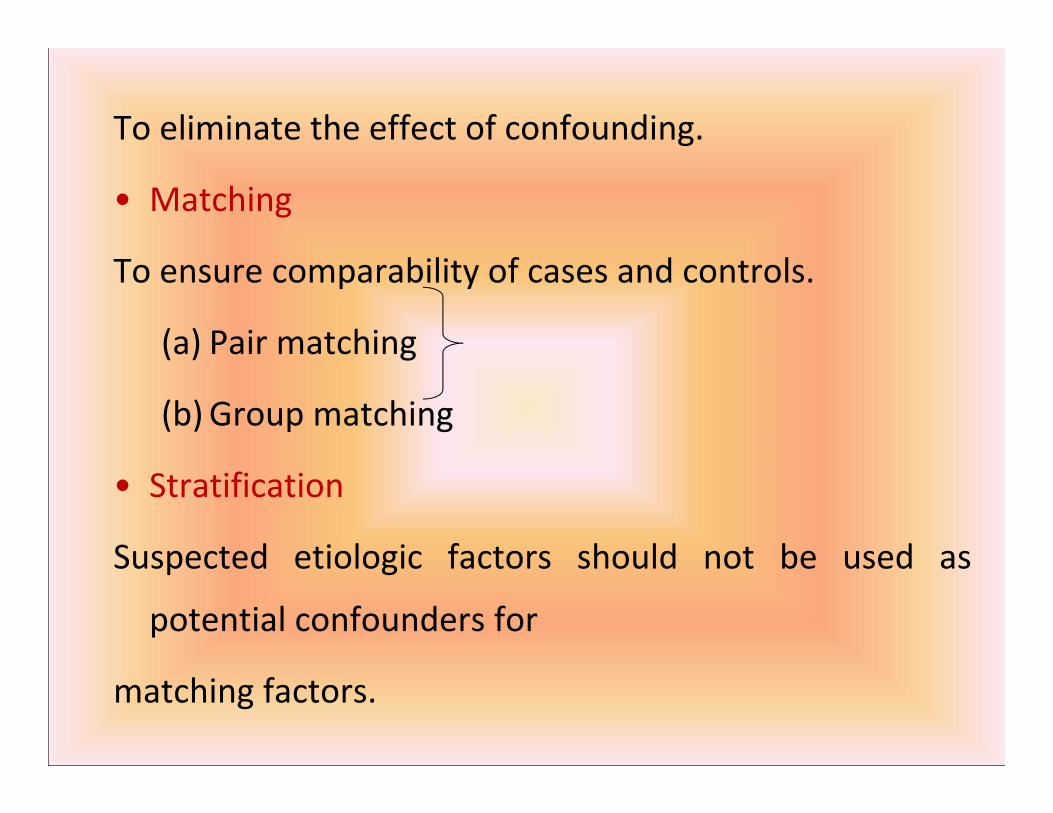
To eliminate the effect of confounding.
• Matching
To ensure comparability of cases and controls.
(a) Pair matching
(b) Group matching
• Stratification
Suspected etiologic factors should not be used as
potential confounders for
matching factors.

Examples of Confounding Factors
(1) Smoking & Lung cancer (age is confounder)
(2) Contra use (IUD) - Cervical cancer
(age & marital status)
(3) OC - BC (age)

Synergistic Factors: Synergy means magnification of effects
arising from different exposures / risk factors s.t. effect of
exposures working together is greater than the sum of their
individual effects. ie. P (AB) > P (A) + P (B).
eg. (1) Lung cancer and smoking
Drinking
R [Smoke & Drink] > R (Smoke) + R (Drink)
(2) MI and OC use
Smoking

Difference between confounding and synergy:
• In synergy, we are interested in joint effect or
effect modification. A effect modifier (syn.
Factor) relates essentially to differences between
the measures of associate at different levels of
modifier.
• In confounding, crude measure of associated does
not reflect in each category necessarily, but the
association is consistent.

ASSOCIATION AND CAUSATION
Types of Association:- Spurious / unreal- Indirect- Direct / casual
Types of Causation- One – to – One- Multi-factorial

Criterion for judging Causality of Association- Temporality
Whether suspected cause precede the observed effect.
- Strength of association(RR or dose-response or duration response relationship)
- Specificity (One-One association, but a single cause may result in several outcomes)?
- Consistency- Biological plausibility- Coherence

Risk: Prob. / Prop. Of individuals suffering from particular
disease out of total individuals.
No. of diseased individuals
Risk: P (D+) = ---------------------------------
Total no. of individuals
in cross sec. study, Risk = Prev. rate
Note: In case of cohort study (fixed follow-up)
Risk IR
No. of persons developing diseases during follow-up
= ---------------------------------------------------------------
No. of persons disease free at start of study

13
Probability and odds• Probability• Odds =No of times the event occurs/ No of times
the event doesn’t occur
=Probability that the event will occur divided by the Probability that the event will not occur.
P (Occurrence of event) = ---------------------------------------
P (No. occurrence of the event)

Odds of an event (say disease) is defined as the ratio:P (D+) P (D+)
---------- or -------------P (D-) 1 – P (D+)
a/N a No. of occurrences= ------ = -- = --------------------------
b/N b No. of non-occurrence
• Probability can be expressed as odds and odds can be expressed as probability.
• Odds = probability/1-probability= P/1-P
• P = odds/1 + odds

Odds Ratio (OR) or Relative Odds (RO): OR is used to compare absolute risks in two categories maybe E+ and E- or D+ and D-
(Odds) expoOR = -------------------
(Odds) unexpoIn case of low risk / rare disease, OR gives an excellent approximation of relative risk (RR).
OR RR Estimated RR
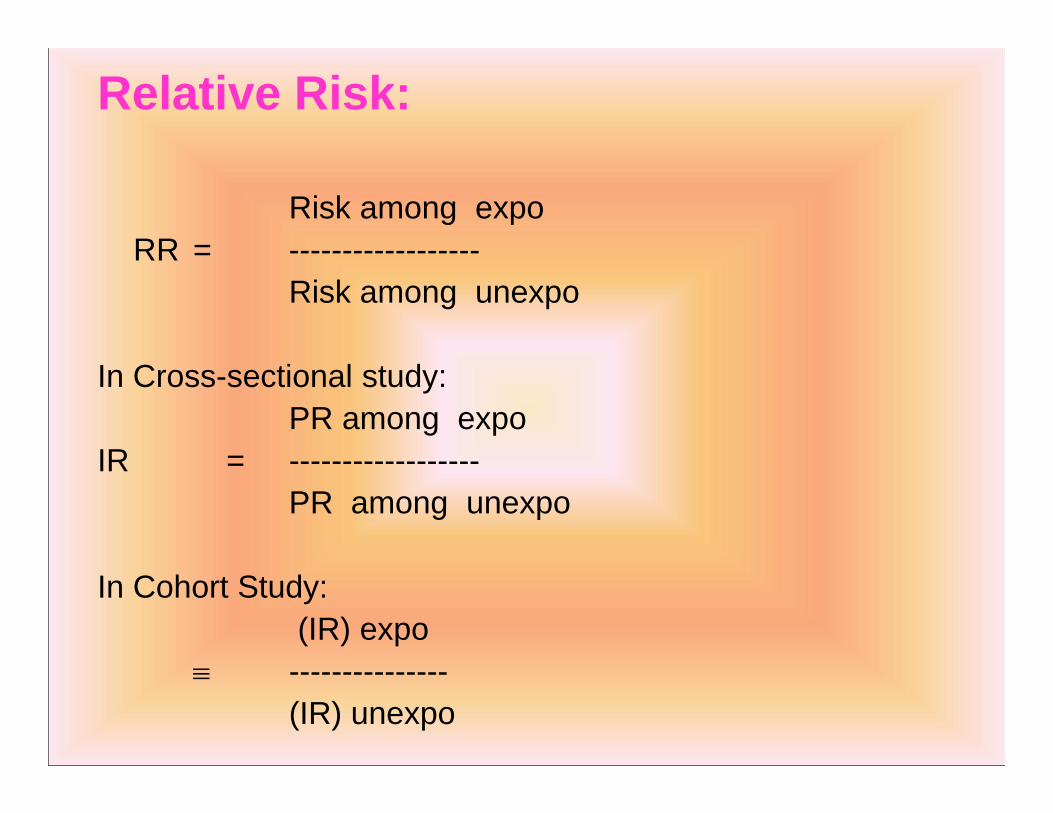
Relative Risk:
Risk among expoRR = ------------------
Risk among unexpo
In Cross-sectional study: PR among expo
IR = ------------------PR among unexpo
In Cohort Study:(IR) expo
---------------(IR) unexpo

ATTRIBUTABLE RISK (AR)
Prop of diseased individuals attributable to a particular expovariable ie The amount of risk which can be attributed to aparticular risk factor:
AR (1)= P(D+/E+) – P (D+/E-)____________________
P (D+ / E+)= (IR) expo – (IR) unexpo
______________________(IR)
(for follow-up studies)= I - I = RR – I
-------- -----------RR RR

AR (2) = P (E+/D+). AR (I)
= (Expo rate among diseased). AR (I)
AR (3) = P (D+) - P (D+ / E-)
______________________
P (D+)
= I - P (D+ / E-)
____________
P (D+)
where P (D+) = Disease rate in the population ie PR.
Another form:
AR (3) = P (E+) (RR-I)
___________________
I + P (E+) (RR – I)

• AR guides us in management of individual patients.
• AR gives the amount of risk that can be attributed to expo to a particular risk factor.
eg. Epilepsy & Delivery type
AR gives us the risk of epilepsy developing as a consequence of forceps delivery.
• Other syno terms of AR:
Risk difference = P(D+/E+) – P(D+/E-)
= (Risk) expo – (Risk) unexpo.
Excess Risk Rate Difference give crude expressions of AR.

POPULATION ATTRIBUTABLE RISK (PAR)
PAR is a measure of excess amount of risk of a particular
disease in the population that can be solely attributed to the
risk factor.
PAR = AR P(E+) (in population)
If an independent estimate P (E+) ie proportion of people
exposed in the population is available, then PAR can be
obtained.

TYPES OF BIASES / ERRORS IN EPIDEMIOLOGICAL STUDIES
Sampling
-Selection Bias Referral / Berksonian
Diag. Bias
Interviewer Bias
- Info. Bias Recall Bias
Social Desirable Bias


