38
LABOR MARKET CHALLENGES: AND HOW TERTIARY EDUCATION SYSTEMS CAN RESPOND Claudia Costin Senior Director Education Global Practice 14 May 2015
| Date post: | 21-Dec-2015 |
| Category: |
Documents |
| Upload: | beatrix-cain |
| View: | 212 times |
| Download: | 0 times |

LABOR MARKET CHALLENGES:AND HOW TERTIARY EDUCATION SYSTEMS CAN RESPOND
Claudia CostinSenior Director
Education Global Practice
14 May 2015

Structure of the Presentation
1. Economic Developments: ECA and Globally
2. Changes in Skills Demand and Supply
3. How can Tertiary Education and Institutions respond?a. The Wider Reform Agendab. Supporting Employability and Labor Market Transition

3
Strong GDP and productivity growth in early 2000sDevelopmentsDemand-sideSupply-sideUniversities
Real GDP growth and labor productivity (2000-2007)
ECA LAC EAP OECD (Europe) OECD (Non Europe)
0
1
2
3
4
5
6
7
8
0
5,000
10,000
15,000
20,000
25,000
30,000
35,000
40,000
45,000
50,000
Real GDP growth (annual average, percent) Real GDP per capita growth (annual average, percent)
GDP per person employed (US$ at PPP, 1990)
Percent (annual average) Percent (annual average)
Source: World Development Indicators (WDI);World Bank (2014), Back To Work: Growing with Jobs in Europe and Central Asia
4
ECA LAC EAP OECD (Europe) OECD (Non Europe)
-2
-1
0
1
2
3
4
5
6
7
8
0
5,000
10,000
15,000
20,000
25,000
30,000
35,000
40,000
45,000
50,000
Real GDP growth (annual average, percent) Real GDP per capita growth (annual average, percent)GDP per person employed (US$ at PPP, 1990)
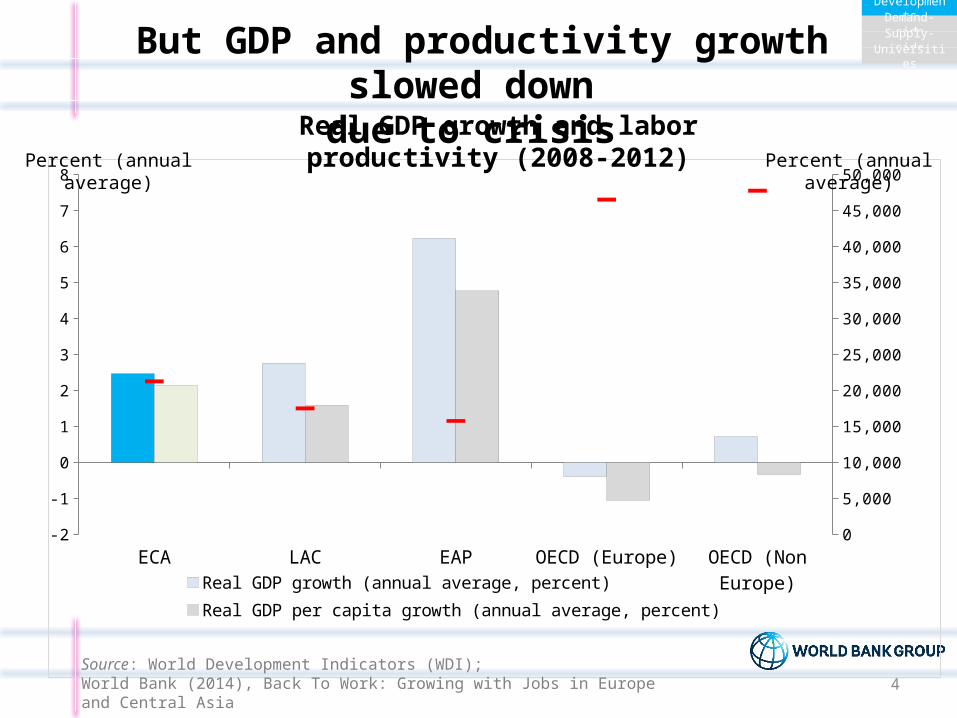
Real GDP growth and labor productivity (2008-2012)Percent (annual average) Percent (annual average)
But GDP and productivity growth slowed downdue to crisis
Source: World Development Indicators (WDI);World Bank (2014), Back To Work: Growing with Jobs in Europe and Central Asia
DevelopmentsDemand-sideSupply-sideUniversities

Limited employment creation in ECA pre-crisis……due to weak relationship between economic and employment growth
Source: Authors’ calculations based on ILO and WDI.
Employment growth, 2000=100 (2000-2012)
2000 2001 2002 2003 2004 2005 2006 2007 2008 2009 2010 2011 201290
95
100
105
110
115
120
125
130
135
140
ECA LAC EAPOECD (Europe) OECD (Non Europe)
Notes: ECA = Europe and Central Asia (Transition economies , and Turkey) ; LAC = Latin America and the Caribbean; EAP = East Asia and Pacific.
DevelopmentsDemand-sideSupply-sideUniversities

6
Average years of lost employment for an individual, circa 2010Ka
zakh
stan
Azer
baija
n
OEC
D
ASIA
Czec
h Re
publ
ic
Slov
enia EU
Russ
ia
Kyrg
yzst
an
Esto
nia
LAC
Bulg
aria
Lith
uani
a
Ukr
aine
Latv
ia
Geo
rgia
Slov
akia
Pola
nd
Rom
ania
ECA
Croa
tia
Arm
enia
Hun
gary
Serb
ia
Tajik
istan
Mol
dova
Mac
edon
ia
Turk
ey
0
5
10
15
20
25
30
35
54 3 4 5 7 5 4 5 5 4 6 5 6 5
36 7 6 6 6
47
6
6 6 7 7
25-34 35-44 45-54 55-64 Female total
As a result, the region is missing out on its human capital potential to spur growth and welfare
DevelopmentsDemand-sideSupply-sideUniversities
Source: World Bank (2014), Back To Work: Growing with Jobs in Europe and Central Asia

7
Demographic trends put added pressures on productivity and growth
Source: World Bank (2014), Back To Work: Growing with Jobs in Europe and Central Asia
ECA Countries: Change in 15+ Population 2010 - 2030 (%)
“Younger” countries also face demographic pressures: Out-migration, youth bulge, and long-run aging
Older workers will outnumber youth due to: Aging, Low Fertility, and Out-migration
DevelopmentsDemand-sideSupply-sideUniversities

Structure of the Presentation
1. Economic Developments: ECA and Globally
2. Changes in Skills Demand and Supply
3. How can Tertiary Education and Institutions respond?a. The Wider Reform Agendab. Supporting Employability and Labor Market Transition

9
Globally, skills demand is shifting towards “New Economy Skills”
(non-routine cognitive and interpersonal skills)
Employment Composition (simple cross country average by type of occupation; 2000-2012)
2000 2001 2002 2003 2004 2005 2006 2007 2008 2009 2010 2011 20120
10
20
30
40
50
60
OECD countries
Non-routine cognitive or inter-personal
Routine cognitive or manual
Non-routine manual
Shar
e in
tota
l em
ploy
men
t (%
)
2000 2001 2002 2003 2004 2005 2006 2007 2008 2009 2010 20110
10
20
30
40
50
60Developing countries
Non-routine cognitive or inter-personal
Routine cognitive or manual
Non-routine manual
Shar
e in
tota
l em
ploy
men
t (%
)
Source: WDR 2016 team, based on ILO KILM data. Skills classification follows Autor (2014).
DevelopmentsDemand-sideSupply-sideUniversities

10
Youth are, overall, adjusting better to the shift in skills demand
Source: World Bank 2014 “Back to Work”, based on LFS.
2002 2003 2004 2005 2006 2007 2008 2009 201030
40
50
60
70
New Economy Skills
Routine cognitive
Manual Skills
Czech Republic, Cohort born 1975-1984
Mea
n Sk
ill Pe
rcen
til o
f 200
2 S
kills
Dist
ributi
on
2002 2003 2004 2005 2006 2007 2008 2009 201030
40
50
60
70
New Economy Skills
Routine cognitive
Manual Skills
Czech Republic, Cohort born before 1955
Mea
n Sk
ill Pe
rcen
til o
f 200
2 S
kills
Dist
ributi
on
DevelopmentsDemand-sideSupply-sideUniversities

11
Kaza
khst
anA
lban
iaM
onte
negr
oBu
lgar
iaRo
man
iaSe
rbia
Cypr
usSl
ovak
Rep
ublic
Russ
ian
Fede
ratio
nLi
thua
nia
Slov
enia
Hun
gary
Croa
tiaLa
tvia
Czec
h Re
publ
icPo
land
Esto
nia
Mex
ico
Chile
Isra
elSw
eden
Gre
ece
Luxe
mbo
urg
Turk
eyIc
elan
dIt
aly
Aus
tria
Fran
cePo
rtug
alSp
ain
Uni
ted
King
dom
Uni
ted
Stat
esN
ew Z
eala
ndN
orw
ayBe
lgiu
mD
enm
ark
Ger
man
yA
ustr
alia
Net
herla
nds
Switz
erla
ndFi
nlan
dCa
nada
Japa
nIr
elan
dKo
rea
ECA OECD, non-ECA
0.0
10.0
20.0
30.0
40.0
50.0
60.0
OECD Average = 18 percent
But not all education systems prepare youth adequately
Source: WB Staff calculations using OECD PISA 2012.
Too many youth fall behind in basic cognitive skills% of 15-year olds who are functionally illiterate, scoring “below level 2”
on PISA Reading Test 2012
DevelopmentsDemand-sideSupply-sideUniversities

12
Relative to other obstacles, skills have become a more severe constraint to business
Source: World Development Report 2013
DevelopmentsDemand-sideSupply-sideUniversities

13
And the demand for skills may be changing even more: Skills for which jobs?
Probability that occupation will disappear:
HIGH: Tax Preparers, Watch Repairers, Insurance Underwriters, Telemarketers
MODERATE: Shoe and Leather Workers and Repairers, Massage Therapists, Commercial Pilots, Teacher Assistants
LOW: Mathematicians, Floral Designers, Emergency Medical Technicians and Paramedics, Editors
By 2030, 2 billion jobs will be automated…Source: Frey and Osborne 2013
DevelopmentsDemand-sideSupply-sideUniversities

Structure of the Presentation
1. Economic Developments: ECA and Globally
2. Changes in Skills Demand and Supply
3. How can Tertiary Education and Institutions respond?a. The Wider Reform Agendab. Supporting Employability and Labor Market Transition
15
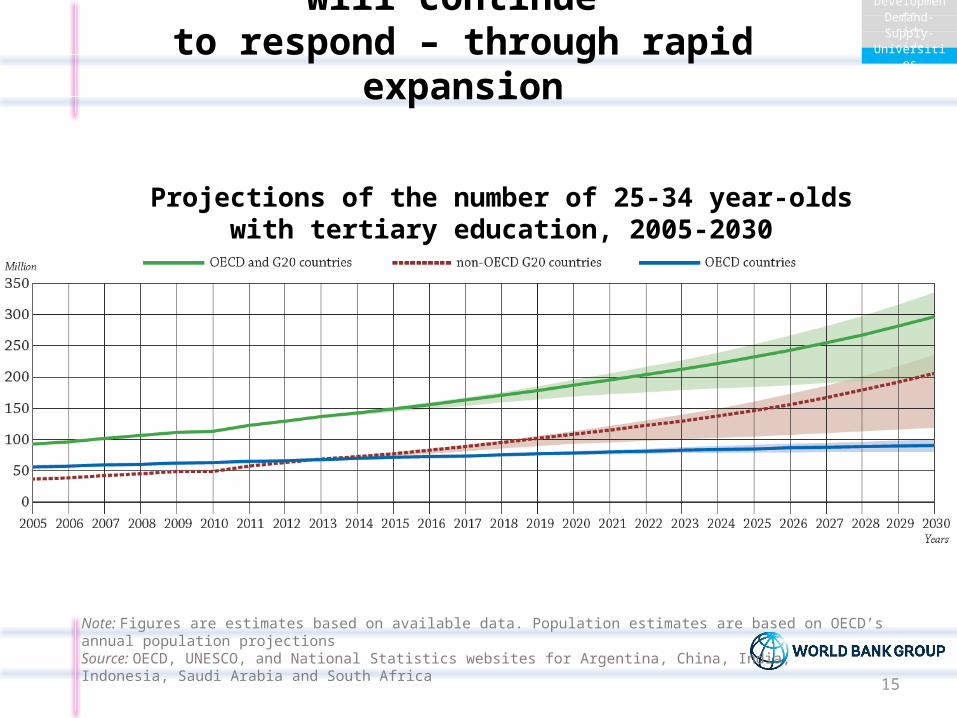
Tertiary education responded – and will continue to respond – through rapid expansion
Projections of the number of 25-34 year-olds with tertiary education, 2005-2030
Note: Figures are estimates based on available data. Population estimates are based on OECD’s annual population projectionsSource: OECD, UNESCO, and National Statistics websites for Argentina, China, India, Indonesia, Saudi Arabia and South Africa
DevelopmentsDemand-sideSupply-sideUniversities
16
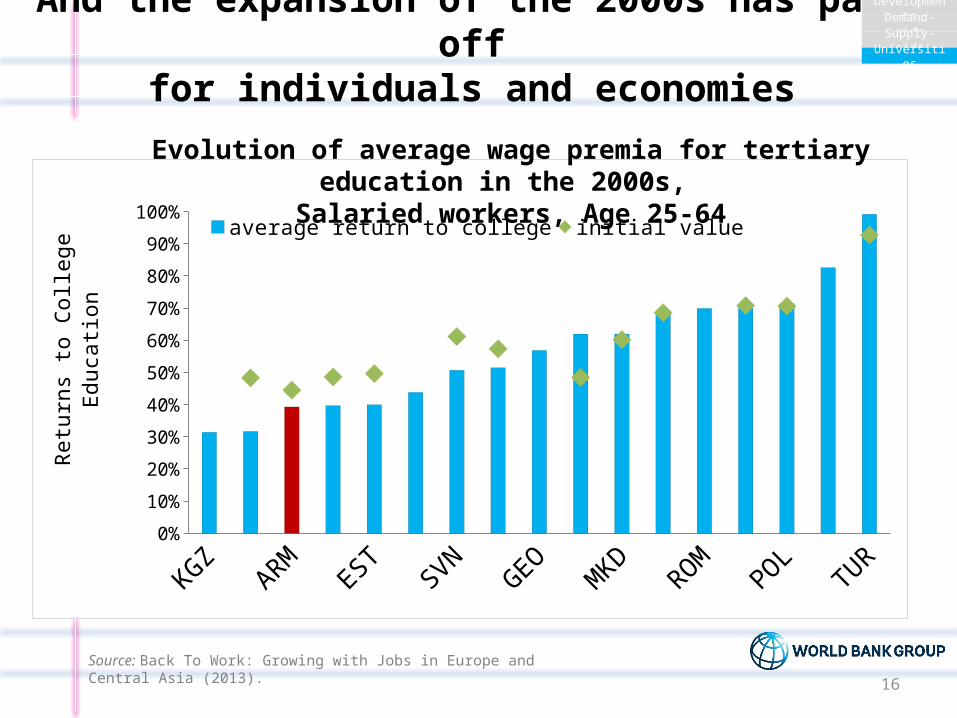
And the expansion of the 2000s has paid offfor individuals and economies
KGZ TJKARM CZE
EST BGRSV
NRUS
GEOALB
MKDLV
AROM LT
UPOL
HUNTUR
0%
10%
20%
30%
40%
50%
60%
70%
80%
90%
100%average return to college initial value
Retu
rns t
o Co
llege
Edu
catio
n
Evolution of average wage premia for tertiary education in the 2000s, Salaried workers, Age 25-64
Source: Back To Work: Growing with Jobs in Europe and Central Asia (2013).
DevelopmentsDemand-sideSupply-sideUniversities

17
Tertiary education can be a powerful engine of productivity and growth
Highly Proficient Graduates
Skills for
Innovation
Basic and Applied
Research
Technology Transfer
KnowledgeSkills
Competences
DevelopmentsDemand-sideSupply-sideUniversities
“Third Mission”
Tertiary Education
Institutions
Research
Productivity and
Growth

Economic growth is important – but so are social benefits
DevelopmentsDemand-sideSupply-sideUniversities
Citizens’ AwarenessToleranceHealth/Longer lifeEnvironmental Consciousness
Higher education attainmentCitizenship building

19
But tertiary education does not always work as a system of connected actors
Employers(skill users)
Earlier education
ResearchInstitutions
Companies(research
users)
HEIs and Training
providers
DevelopmentsDemand-sideSupply-sideUniversities
Tertiary Education
Institutions

20
DevelopmentsDemand-sideSupply-sideUniversities

21
STRONGERINCENTIVES
HIGHERCAPACITY
BETTERINFORMATIO
N
Financing
Management
Stewardship
HEIs & Training
providers
Earlier education
ResearchInstitutions
Companies(research
users)
Employers(skill users)
POLICY PILLARS DISCONNECTSTO ADDRESS
Making connections through policiesDevelopmentsDemand-sideSupply-sideUniversities

22
How can financing policy improve incentives and capacity?
DevelopmentsDemand-sideSupply-sideUniversities
Identify priority activities for public spending Employability, research, STEM, equity, internationalization…
Fund effectively Increase public resources Improve efficiency of public funding (selectivity, incentive) Complement with private funds (transparent, fair and
equitable system of fees and loans; matching grants) Develop appropriate mechanisms (performance-based
financing, performance contracts)

23
Tertiary education financing remains inequitableIn many ECA countries less well off students pay
DevelopmentsDemand-sideSupply-sideUniversities
Note: Public expenditure only (for Switzerland, in tertiary education only; for Norway, in primary, secondary, and post-secondary non-tertiary education only)Source: OECD, Education at a Glance 2014, Table B2.3
Expenditure on educational institutions as a percentage of GDP (2011)Public and Private Sources

24
How can institutions be improvedthrough incentives and information?
Support more autonomous and accountable institutions: Align academic, managerial and financial autonomy Strengthen governing bodies
Functions, representativeness In particular more voice to employers
Improve internal quality assurance and flow of information Agreed performance indicators Tracking graduates
Nurture linkages to environment (industry and other employers, community…) Provide incentives for collaboration
DevelopmentsDemand-sideSupply-sideUniversities

25
Better governance on system level: Aligning regulations, information, financing, and QA
Clear and efficient regulation (be aware of excessive and undifferentiated regulation)
Agreed learning outcomes laid down in National Qualifications Framework
Information to include indicators of academic, research and labor market performance and to be available to all stakeholders
Financing policy to reward performance and efficiency Effective external and internal quality assurance Strengthen coordination within and across ministries and
with stakeholders
DevelopmentsDemand-sideSupply-sideUniversities
26
Structure of the Presentation
1. Economic Developments: ECA and Globally
2. Changes in Skills Demand and Supply
3. How can Tertiary Education and Institutions respond?a. The Wider Reform Agendab. Supporting Employability and Labor Market Transition

How can tertiary education support employability and labor market transition?
DevelopmentsDemand-sideSupply-sideUniversities
Universities (and countries) can improve employability and labor market transition, for example, through:
1. Stronger focus on employability and entrepreneurship in curricula and institutional set-up
2. Bridging Programs
3. Collect information (e.g. tracking graduates) and use for steering
Countries can support these structures and activities at the national level and support a more diversified institutional landscape.

28
No matter what type of institution: Employability of students is key
It can be ensured through: Clearly established learning outcomes (National Qualifications
Frameworks – NQF; Tuning Project, etc.) Involvement of employers and other stakeholders (NQF, curricula
development, practical aspects of studies, teaching) Curricula need to fit envisaged generic and technical learning
outcomes “Skills not just diplomas” - in addition to generic and
technical/professional skills, development of competences/“attitudes”
Practical placements, internships Career guidance Information on labor markets and career perspective before, during,
at the end of tertiary education
DevelopmentsDemand-sideSupply-sideUniversities

29
Focus on employability example: University of Aberdeen
“Our promiseWhat we provide: Support and guidance with planning your future.Attractive and relevant courses with a focus in building attributes sought by employers.Advice on finding work experience.A wide selection of volunteering opportunities.Help with CV building and making effective job applications.The possibility to study abroad as part of your degree.A record of your achievements in your enhanced student transcript when you graduate.”
Source: http://www.abdn.ac.uk/study/about/career-prospects-142.php
DevelopmentsDemand-sideSupply-sideUniversities

30
Bridging programsDevelopmentsDemand-sideSupply-sideUniversities
Bridging Programs provide accelerated, focused learning opportunities to help relatively less prepared students acquire knowledge and skills needed for tertiary education success.
Often provided in the summer months (but can be longer) Intended to build skills and competences May be general (e.g. programs about studying at university) or
specific (e.g. math and science bridge program)
Source: Based on National Center for Postsecondary Research, NCPR Brief, July 2012
31
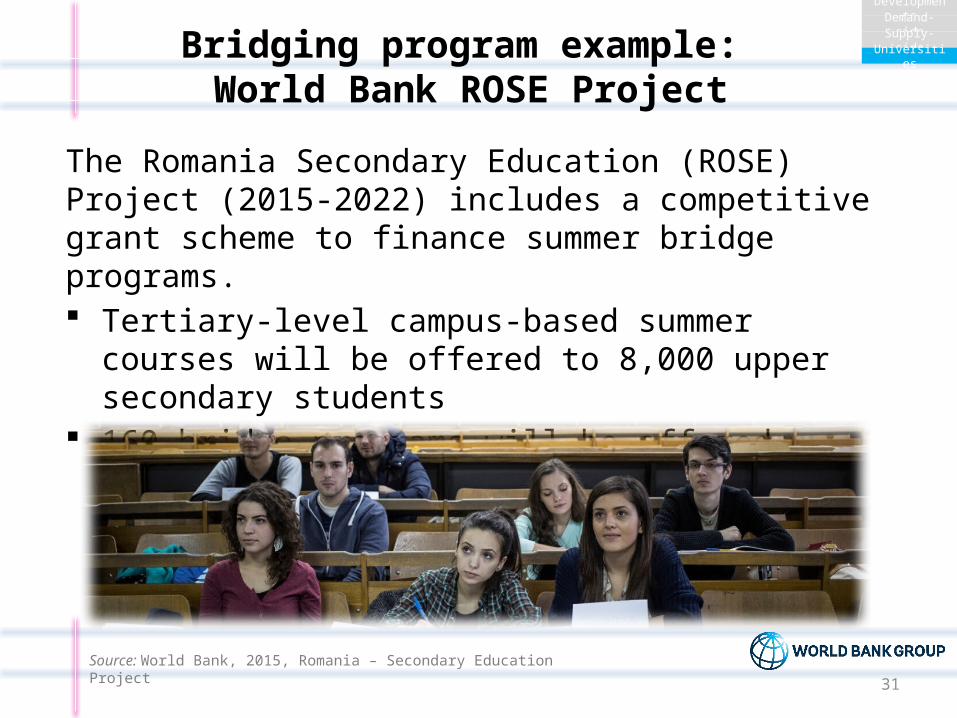
Bridging program example: World Bank ROSE Project
DevelopmentsDemand-sideSupply-sideUniversities
The Romania Secondary Education (ROSE) Project (2015-2022) includes a competitive grant scheme to finance summer bridge programs. Tertiary-level campus-based summer courses will be offered
to 8,000 upper secondary students 160 bridge programs will be offered
Source: World Bank, 2015, Romania – Secondary Education Project
32
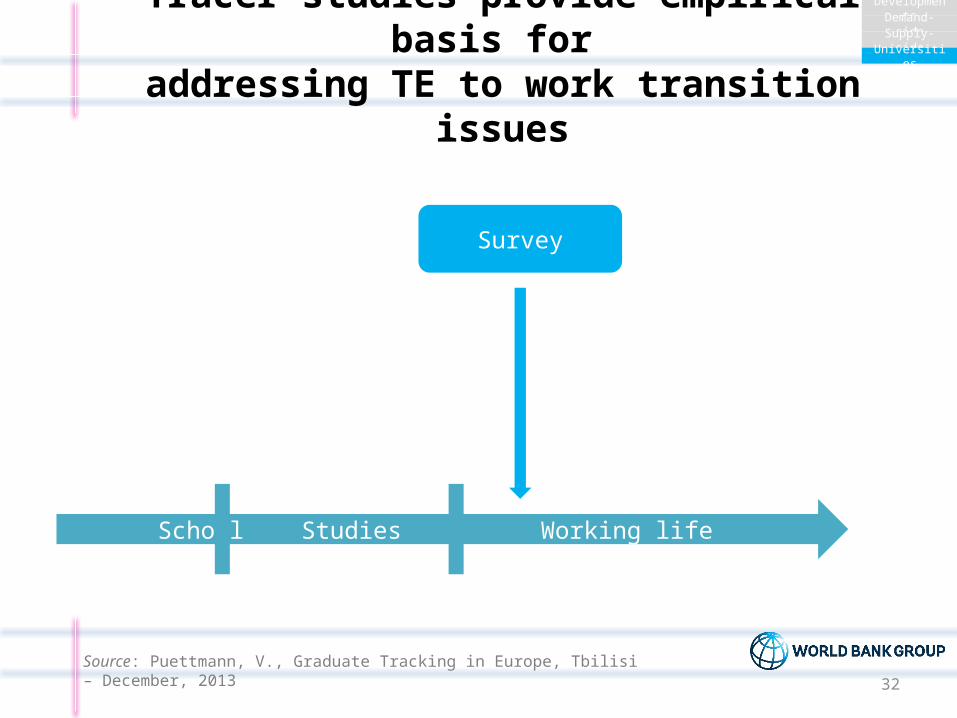
Tracer studies provide empirical basis for addressing TE to work transition issues
School Studies Working life
Survey
DevelopmentsDemand-sideSupply-sideUniversities
Source: Puettmann, V., Graduate Tracking in Europe, Tbilisi – December, 2013
33
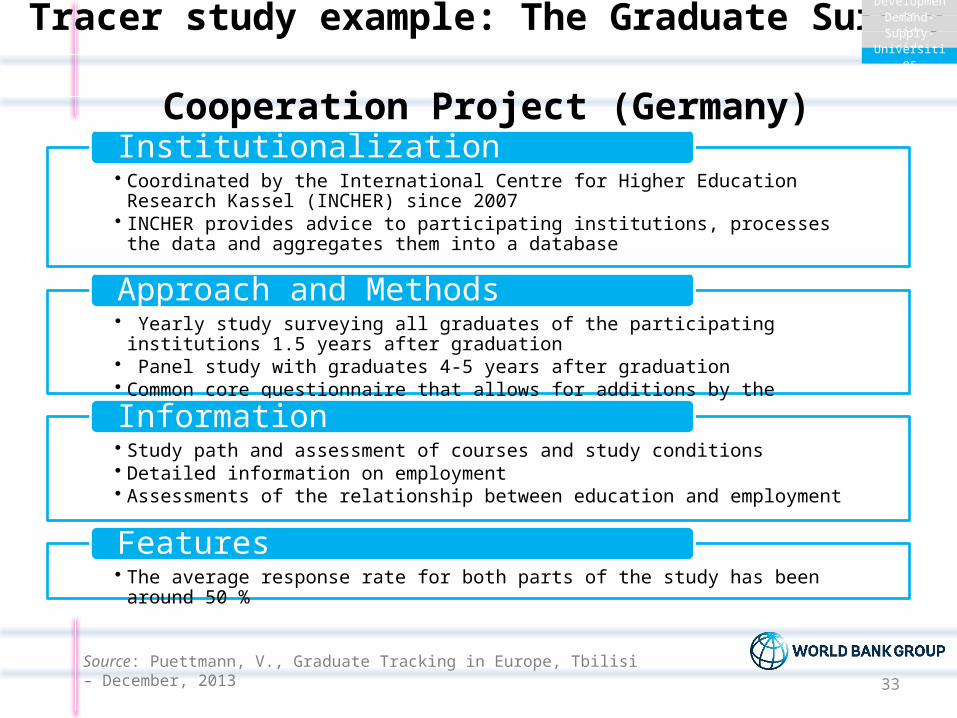
Tracer study example: The Graduate Survey Cooperation Project (Germany)
• Coordinated by the International Centre for Higher Education Research Kassel (INCHER) since 2007
• INCHER provides advice to participating institutions, processes the data and aggregates them into a database
Institutionalization
• Yearly study surveying all graduates of the participating institutions 1.5 years after graduation• Panel study with graduates 4-5 years after graduation• Common core questionnaire that allows for additions by the participating institutions
Approach and Methods
• Study path and assessment of courses and study conditions• Detailed information on employment• Assessments of the relationship between education and employment
Information
• The average response rate for both parts of the study has been around 50 %
Features
DevelopmentsDemand-sideSupply-sideUniversities
Source: Puettmann, V., Graduate Tracking in Europe, Tbilisi – December, 2013

34
How tracer studies inform tertiary education policies
To decide which programs to offer; and how many graduates
to enroll to fill available jobs related to the program.
To assess program effectiveness—whether programs provide relevant skills for students to succeed after they graduate.
To help students make informed choices about which
programs to enter.
To contribute to the program/institutional quality
assurance process.
Data from Graduates
DevelopmentsDemand-sideSupply-sideUniversities
Source: Puettmann, V., Graduate Tracking in Europe, Tbilisi – December, 2013

35
Some countries use tax data as a basis for tracking: “Mi Futuro” – My future (Chile)
DevelopmentsDemand-sideSupply-sideUniversities
Informs about 700 professional and technical programs from almost 180 institutions, accounting for more than 90 percent of the current graduates (there are over 12,000 programs):
Income and income dispersion at 4 years after graduation
Likelihood of employment during first year after graduation
Information about the careers: enrollment, graduation rate, drop out rates, duration of the studies, fee ranges and accreditation status of the institutions and its programs

36
Combining information and placements: AlmaLaurea (Italy)
For further review: visit http://www.almalaurea.it
DevelopmentsDemand-sideSupply-sideUniversities
Founded in 1994, Alma Laurea is a university-based consortium, supported by the Ministry of Education in Italy.
Graduates are monitored for five years, beginning just before graduation
Goals:
1. Assessment of Tertiary Education system
2. Labor market insertion
Graduates are encouraged to update their information for future job prospects

37
Summary
Tertiary education is an important driver of productivity and growth; however on the system and institutional level, more can be done to ensure a better labor market connect.
There are numerous disconnects in the tertiary education system that constrain its potential.
Improving finance, management, governance can help strengthen connections.
This needs to be coupled with specific measures targeted at better employability (tracer studies, observatories, etc.).
This could become an important policy area for the next phase of the Bologna Process.


